Impact of Deforestation on Agro-Environmental Variables in Cropland, North Korea


1
Department of Environmental Science and Ecological Engineering, Korea University, Seoul 02481, Korea
2
Ecosystem Services and Management Program, International Institute for Applied Systems Analysis (IIASA), Schlossplatz 1, A-2361 Laxenburg, Austria
*
Author to whom correspondence should be addressed.
Sustainability 2017, 9(8), 1354; https://doi.org/10.3390/su9081354
Submission received: 17 May 2017
/
Revised: 26 July 2017
/
Accepted: 28 July 2017
/
Published: 1 August 2017
(This article belongs to the Special Issue Sustainability Assessment of Land Use and Land Cover)
Abstract
:Deforestation in North Korea is becoming the epitome of the environmental change occurring in the Korean Peninsula. This study estimates the agro-environmental variables of North Korea’s croplands and analyzes the impact of deforestation using the GEPIC (GIS-based EPIC (Environmental Policy Integrated Climate)) model and time-series land cover maps. To identify the changes in agricultural quality under deforestation, wind erosion, water erosion, organic carbon loss, and runoff were selected as the agro-environmental variables having an impact on cropland stability and productivity. Land cover maps spanning the past three decades showed that 75% of the forests were converted to croplands and that 69% of all converted croplands were originally forests, confirming the significant correlation between deforestation and cropland expansion in North Korea. Despite limitations in the verification data, we conducted qualitative and quantitative validation of the estimated variables and confirmed that our results were reasonable. Over the past 30 years, agro-environmental variables showed no clear time-series changes resulting from climate change, but changes due to spatial differences were seen. Negative changes in organic carbon loss, water erosion, and runoff were observed, regardless of the crop type. On newly-converted agricultural lands, runoff is 1.5 times higher and water-driven erosion and soil organic loss are more than twice as high compared to older croplands. The results showed that the agro-environment affected by deforestation had an impact on cropland stability and productivity.
1. Introduction
Deforestation in North Korea is garnering attention as being representative of the environmental change occurring in the Korean Peninsula and is causing concern at the international level [1]. Deforestation in North Korea has environmentally negative impacts similar to the cases of expansion of areas subject to desertification or reduction of water in the Aral Sea. Recently, the issue of deforestation has brought into focus the decrease in carbon sinks, which is symptomatic of a system affected by climate change [2,3,4].
To date, deforestation research in North Korea has focused on forest-related changes, i.e., on decreasing forests [3,5,6]. The phenomenon has become a contentious issue due to the noticeable decrease in forest areas. North Korean deforestation is a cause for concern because it has not only resulted in a large ecosystem change, but also a decrease in carbon absorption [3,7]. North Korean forests have mostly been converted to croplands. To understand this process and its outcomes, research on deforestation, with a focus on croplands, is needed.
Famine began in North Korea during the period called “The Arduous March” in the 1990s and continues to the present day along with political and economic trajectory. During this time, North Korean croplands have been expanding, mostly as a result of deforestation [8]. However, food shortages in North Korea have not improved despite this expansion [9].
Deforestation in North Korea is triggered by famine and food shortages. Thus, it needs to be studied from an agricultural perspective. The conversion of forests to croplands without adequate planning can have negative impacts on agricultural activity [10]. Using agro-environmental variables related to cropland stability and crop productivity, it is possible to evaluate the direct and indirect impacts of cropland expansion by deforestation [11,12]. The agro-environmental variables related to cropland stability include runoff and soil erosion by water and wind. Other variables associated with crop productivity are cropland nitrogen, organic carbon, and soil water [13]. These agro-environmental variables are based on topography and soil properties, but changes in these variables can be attributable to the land cover and climate change [14].
It is difficult to directly observe or collect agro-environmental variables over long time frames and large spatial scales; therefore, they should be estimated using specialized agro-ecosystem models [15]. This study employed the Environmental Policy Integrated Climate (EPIC) model, which has been widely applied to the agricultural sector, in conjunction with the GEPIC (GIS based EPIC) model, which is a Geographic Information System (GIS) combined with the EPIC model [16,17]. The EPIC model provides the most effective approach for this research and is also applicable to changes in climate and cropland areas. This model enables the estimation of more than 50 types of agro-environmental variables, while most other models estimate only a fraction of those variables or only plot-based variables [18,19].
This research aims at identifying the impacts of deforestation through the expansion of croplands in North Korea and how deforestation can influence cropland stability and productivity, using representative agro-environmental variables. For this study, three types of land cover maps of the past 30 years were used to identify deforestation in North Korea, while simultaneously considering climate change during the same period. Using the GEPIC model, this research simulates the agro-environmental variables for the entire area used as cropland in North Korea. By applying a grid system, it was possible to estimate the nation’s output of presumed staple foods (i.e., rice and maize). This study intends to explore the implications of deforestation on the agricultural sector, by comparing the agro-environmental variables of newly converted croplands through deforestation and existing croplands (existing prior to the 1980s).
2. Data and Methods
2.1. Deforestation in North Korea
Three types of land cover maps spanning three decades (the 1980s, 1990s, and 2000s) were used to determine the status of North Korea’s deforestation and estimate the agro-environmental variables targeting the changing croplands. This research uses land cover maps with major classifications, developed by the Ministry of Environment of South Korea (ROK) and targets the croplands in the land cover maps for each decade (Figure 1).
The UNFCCC (United Nations Framework Convention on Climate Change) defines deforestation as “the direct human-induced conversion of forested land to non-forested land”, while the UNFAO (United Nations Food and Agricultural Organization) defines deforestation as “the conversion of forest to another land use or the long-term reduction of the tree canopy cover below the minimum 10% threshold” [20,21]. Based on these definitions, this research explored the consequences of cropland expansion through deforestation and their effect on converted croplands over the past 30 years.
North Korea accounts for approximately 55% of the total area of the Korean Peninsula, equivalent to 123,138 km2. It is located between 37.41 and 43.01° N latitude, and 124.18 and 130.41° E longitude. About 80% of North Korea comprises mountainous and hilly areas; particularly, the hilly Gaema Heights and Baekdu-Daegan in the northeast typify the general topography of the eastern highlands and western lowlands [22]. According to the climate classification of Köppen, North Korea is in a humid continental climate zone with cool summers and dry winters (Dwb), with some regional variations. The annual average temperature and precipitation are 10 °C and 1000 mm, respectively [23].
The area occupied by agricultural land in North Korea has shown an increasing trend—from 22,000 km2 in the 1980s, to 25,000 km2 in the 1990s, and to 31,000 km2 in the 2000s. In the latter period, 25% of the entire North Korean territory was occupied by agricultural land. Rice accounted for approximately 45% and maize for 35% of the total agricultural production. These two crops are becoming the country’s most important food crops. After North Korea suffered a serious food shortage in the late 1990s, the food production began to gradually recover, the output surpassing 4.5 million t as of 2005. However, agricultural output has still failed to meet absolute requirements. Given that international support is uncertain due to current political conflicts and tensions, this trend of insufficiency will most likely continue [9].
2.2. Agro-Environmental Variables in Croplands
The agro-environment of croplands can be defined as the environment having an impact on agricultural activity. Agro-environmental variables are the individual variables used to describe the agricultural environment [24,25]. The variables related to the organic matter have a direct impact on crop productivity and on the process of fertilization during agricultural activity [26]. Variables related to soil loss or runoff play a significant role in cropland stability [27]. Changes in agro-environmental variables can lead to changes in production capacity and the ability of croplands to provide a stable supply of crops.
Furthermore, with such variables, it is possible to identify the changes in the quality of agriculture directly and indirectly by selecting wind erosion, water erosion, runoff, and organic carbon loss as the agro-environmental variables having an impact on cropland stability and productivity [5,13,28]. Soil erosion by wind and water is highly related to cropland stability, and runoff and organic carbon loss are strongly associated with cropland productivity in regard to the retention of soil organic matter.
The factors forming the agro-environmental variables are found in the relationships among soil, topography, vegetation, human activity, and climate; thus, when the other factors are fixed, changes in agro-environmental variables can be attributed to climate change [29]. However, if an area that was not previously a cropland is newly converted to cropland due to the change in land cover, a completely new agro-environmental variable will be formed.
2.3. Model Simulation
EPIC (Erosion Productivity Impact Calculator) was developed in the United States to calculate the relationship between erosion and soil productivity and was subsequently enhanced by the further addition of modules to improve the simulation of plant growth [16]. The model was further extended to include the environmental assessment of pesticides and water quality and then renamed the Environmental Policy Integrated Climate Model [30]. The model integrates 20 of the major processes that occur in soil–crop–atmosphere-management systems, using a daily time-step to simulate weather, hydrology, soil erosion, nutrient cycling, tillage, crop management, and field-scale costs and returns [31].
For this study, agro-environmental variables of rice paddies and maize croplands were estimated with an extended version of the GEPIC model [17,32]. The EPIC model is able to estimate over 50 types of agro-environmental variables including all four types of agro-environmental variables required for this study. The wind and water erosion in the EPIC model are estimated based on the Revised Universal Soil Loss Equation (RUSLE), which was developed by the United States Department of Agriculture (USDA)-Agricultural Research Service for conservation planning and assessment. The RUSLE is a revised and updated version of the widely used Universal Soil Loss Equation (USLE) [33,34]. To estimate more accurate long-term soil loss than USLE, the RUSLE uses four independent variables: rainfall erosivity, topography, soil erodibility, and vegetation [35].
This study estimates the average value of annual erosion at 1-km spatial resolution by multiplying the average area of erosion factors in each grid. Using the RUSLE, the soil erosion of a grid located at (i,j) is calculated as:
where A is the average annual soil erosion (ton ha−1 year−1) of the grid located at (i, j), R is the average rainfall erosivity factor (MJ mm ha−1 h−1 year−1), LS is the average topographical parameter, K is the average soil erodibility factor (ton ha h ha−1 MJ−1 mm−1), C is the average land cover and management factor, and P is the average conservation practice factor. The K factor is an indicator for the topsoil layer permeability using soil texture (sand, silt, and clay), soil structure, and organic matter [36]. The C factor is a quantitative indicator of the extent to which vegetation prevents erosion, which has different values for each land cover type. In this study, we only used the C value of cropland and forest. The P factor is the ratio of soil loss with a given surface condition to the corresponding loss with upslope and downslope tillage [34].
While runoff and sediment (organic carbon) loss are estimated based on the GLEAMS (Groundwater Loading Effects of Agricultural Management System) model equation [31,37], the soil organic carbon is calculated using the Century model equation included in the EPIC model. In this study, we identified the amount of runoff and organic carbon loss according to runoff rather than the exact amount of soil carbon. Therefore, we focus more on runoff equations than on the soil carbon estimation. The GLEAMS model is a physically-based mathematical model developed for evaluating the effects of agricultural management systems on field-size areas within and throughout the plant root zone. It is composed of four sub-modules for hydrology, erosion/sediment yield, pesticides, and plant nutrients. For our purposes, only the modules that consider the hydrology and processes of sediment yield were used. The hydrologic soil groups and runoff curve numbers are applied differently depending on the soil characteristics of the region but they have a D group and a runoff curve number of 89.0 in most of North Korea.
Runoff calculation by GLEAMS uses a modified soil conservation service curve number procedure [38]. Sediment yield and the associated sediment enrichment ratio (the ratio of the specific surface area of the eroded soil particles to the specific surface area of the original soil) are calculated at the end of each flow element and the outlet (edge) of the field. A more detailed description of the model can be found in the GLEAMS manual [39].
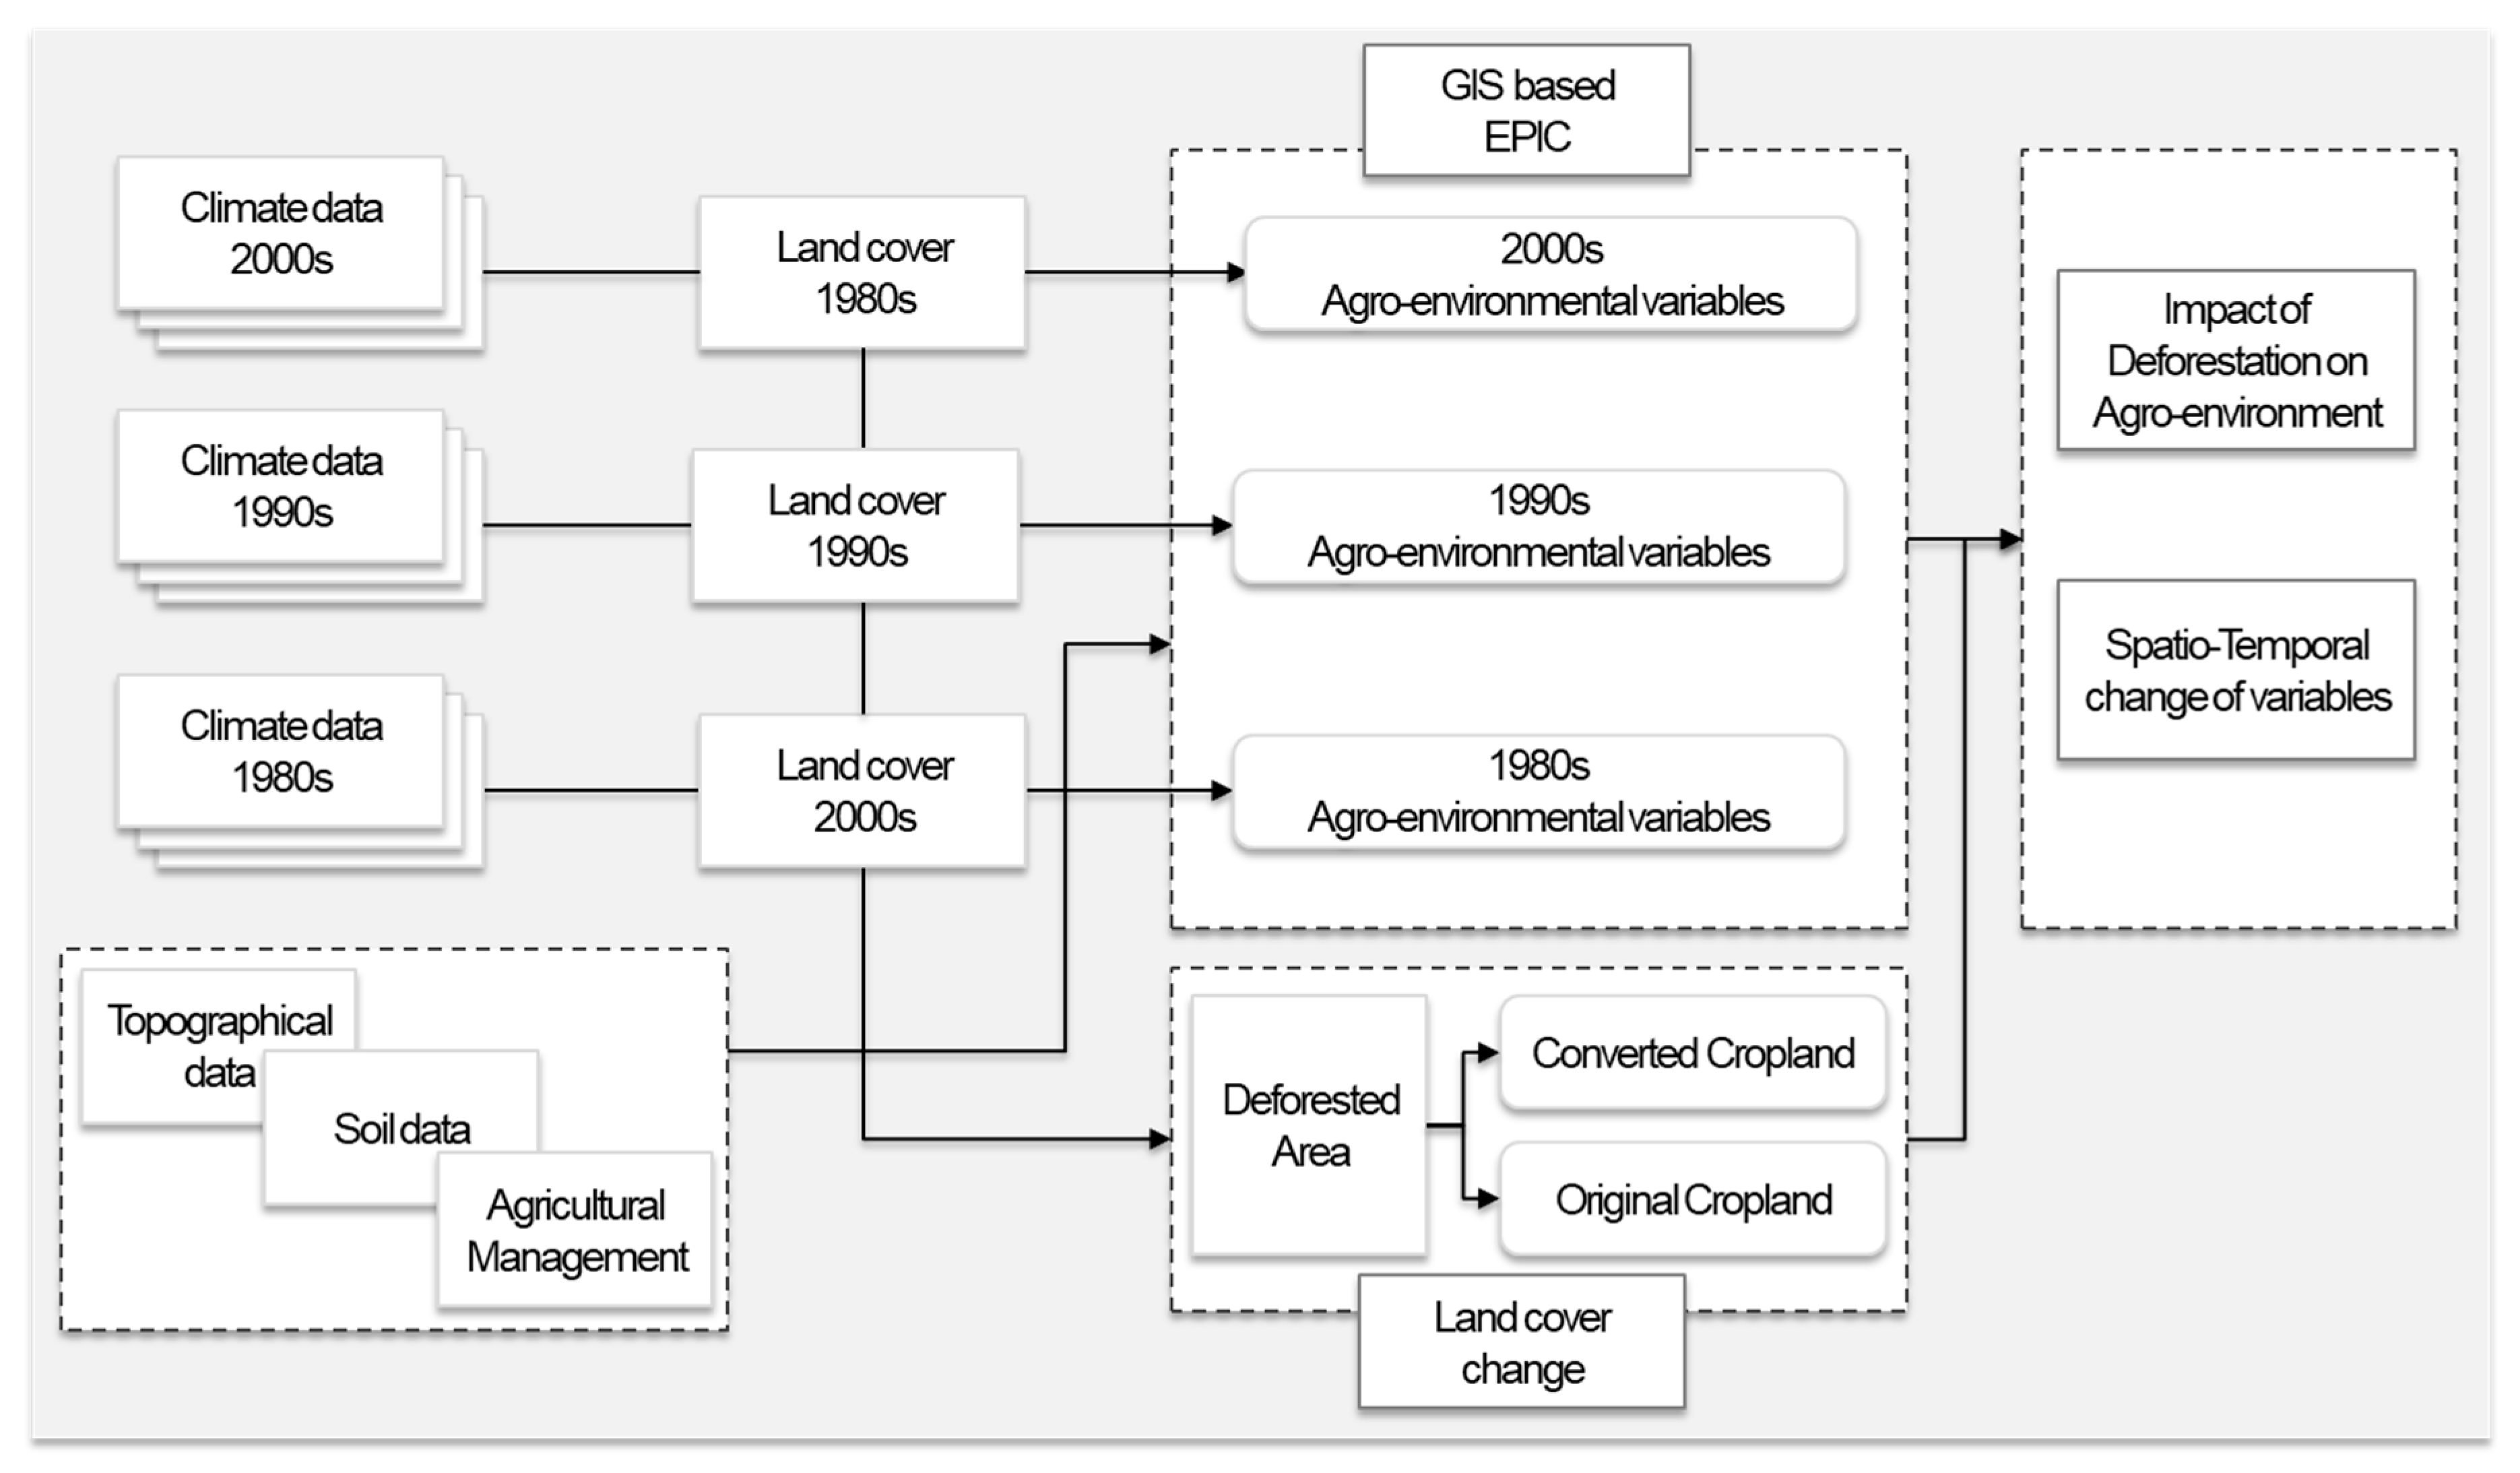
Previous research related to soil degradation, cropland organic matter, and agro-hydrological cycles using EPIC-, RUSLE-, and GLEAMS-based agro-environmental variables has produced numerous cases for various time periods [39,40,41,42,43]. Figure 2 is a schematic representation of the research methodology, which allows a clearer understanding of the research process.
2.4. Data Preparation
The input data for the GEPIC model include: daily weather data, monthly weather data, potential heat unit (PHU) data, soil data, land use data of agricultural areas, fertilizer application rates, irrigation use, digital elevation model (DEM) data, terrain slopes, crop planting dates, and crop parameters. Since all input spatial data have different grid sizes, we set the resolution to 1 km × 1 km as the median spatial resolution of these data.
In the GEPIC model, both daily and monthly weather data are required as input. For these two sets of weather data, three parameters are necessary: minimum temperature (Tmin), maximum temperature (Tmax), and precipitation. Other required physical variables include solar radiation, wind speed, and relative humidity. We estimated each variable for the past 30 years using observed climate data. The climate data were acquired from 27 North Korean weather stations provided by KMA (Korea Meteorological Administration). Data for non-observed locations were created using two approaches: the Kriging and the inverse distance weighted (IDW) interpolation methods. The Kriging method was used for interpolating temperature and the IDW method was applied to other missing data [44,45]. To interpolate the whole region of North Korea with 1-km2 spatial resolution, more weather stations or forecasting data are needed. However, since it is difficult to acquire data from North Korea, we used the highest resolution data available from limited observations and forecasts. Despite the low spatial resolution of these meteorological data, the weather data were interpolated at 1-km2 spatial resolution to verify the uniformity of data and the effects of deforestation.
The PHU data, which refer to the cumulative heat required by a plant until maturity, were estimated for each grid cell using the PHU calculator from the Blackland Research Center [46]. The PHU was calculated by adding up the differences between the average temperature and a crop-specific base temperature for all days of the growing season [47].
National datasets for soil parameters (OC (%), pH, cation exchange capacity (cmol kg−1), sand (%), silt (%), bulk density (t m−3), layer depth (m), and electrical conductivity (mmho cm−1)) were obtained from the ISRIC-WISE database [48] and spatially linked to the Digital Soil Map of the World [49].
Land use data for the agricultural area were extracted from three types of land cover maps of North Korea created between the 1980s and 2000s. These maps classify land cover into seven classes: forest, cropland, urban, grassland, wetland, bare land, and water. The results explain the variables estimated on both rice paddy and maize fields. However, since the field boundaries are unrecognizable in the land cover maps, we simulated each case on the cropland of North Korea. Due to the lack of detailed land cover data, it was impossible to estimate each case reflecting the spatial characteristics of the two crops. These maps were produced using Landsat satellite imagery for 1987–1989 (Landsat 5), 1997–1999 (Landsat 5), and 2008–2010 (Landsat 7). Considering the time points of actual Landsat imagery of the relevant land cover maps, three time points were used for this study by setting up the meteorological data between 1984 and 1993 for the 1980s; between 1994 and 2003 for the 1990s; and between 2004 and 2013 for the 2000s.
The EPIC model has 56 types of crop parameters but the main adjusted parameters are the maximum leaf area index, biomass-energy ratios, and the harvest index. This study does not focus on crop productivity; thus, it uses the default values of crop parameters in the EPIC0509 version (maximum leaf area index: 6 (rice and maize); biomass-energy ratios: 25 (rice) and 40 (maize); and harvest index: 0.25 (rice) and 0.5 (maize)).
For the other data, fertilizer application rates for N and P on rice and maize cultivation areas treated with fertilizer were obtained from the FertiStat database [50]. For irrigation, the IFPRI-SPAM database was used, defining high-input irrigated, high-input rain-fed, and low-input rain-fed areas [51]. The DEM and slope data were provided at 10-m resolution by the Ministry of Environment in South Korea and then resampled to 1 km for the integration of spatial resolution.
Since the GEPIC model can use an automatic calendar approach, the gridded planting date was calculated according to the crop phenology of rice and maize.
2.5. Validation
For assessing the impact of deforestation, the validation of four estimated agro-environmental variables was performed. Since organic carbon loss was estimated by the same algorithm as runoff, validation of the organic carbon loss was not performed. In addition, since data related to soil erosion in North Korea cannot be obtained from field surveys or satellite images, soil erosion was only verified by qualitative methods. The quantitative validation process was only conducted for runoff.
The field survey data of soil erosion by wind and water are very scarce and have time gaps. Satellite data are difficult to use for estimating the soil erosion value as well; thus, qualitative comparison is the best way to validate the estimated results. We conducted qualitative verification using related studies and confirmed the approximate amounts. Specifically, we referred to the results of the soil erosion estimations in South Korea and the United States using the RUSLE, which is widely used for studying soil erosion [34,52,53] in cropland soil as well as forest soil [53,54]. In addition, soil erosion results from the field surveys conducted in South Korea, which has a similar environment as North Korea, were used as a reference.
The validation of the values related to runoff was conducted in a two-step process. First, we followed the calibration process of the EPIC0509 manual described in the section “How to validate runoff and sediment losses”. The process consists of twelve steps for adjusting component values, parameters, and operation setting, and for selecting the equations. The second step of validation is the quantitative statistical evaluation using the runoff data from remote sensing. In the case of runoff, because large-scale observations are not available in North Korea, verification was conducted using the estimated runoff data based on the reanalysis with remote sensing and field measurements between 2001 and 2013 during which high-quality GLDAS (Global Land Data Assimilation System) data were available.
GLDAS runoff data were acquired as part of the mission of NASA’s Earth Science Division and archived and distributed by the Goddard Earth Sciences (GES) Data and Information Services Center (DISC). A total of three statistical indicators were used to validate the model performance: (i) Root Mean Square Error (RMSE); (ii) Nash–Sutcliffe efficiency Coefficient (NSEC); and (iii) Relative Error (RE) [55,56]. These are widely used as validation indicators and described in detail in the literature [43,57].
3. Results
3.1. Cropland Expansion and Deforestation in North Korea
Since the 1980s, approximately 8% of the forested land was converted to other categories of land cover as a result of deforestation in North Korea. Approximately 4% of forests were converted between the 1980s and the 1990s and another 4% were deforested between the 1990s and the 2000s. Even though the Landsat imagery revealed the rapid disappearance of the country’s forests, the devastation ratio was confirmed to be low on the integrated land cover map. This was because the ratio was affected not only by forests converted to other land cover types (i.e., not to cropland) but also by croplands or grasslands converted to forests.
Ultimately, croplands were found to increase by 31% overall, showing a 12% increase between the 1980s and the 1990s and another 19% increase between the 1990s and the 2000s. In terms of the area by land-cover category (during the study interval), forest areas decreased by 7696 km2 and cropland areas increased by 9661 km2 (Figure 3). With regard to the areas of the land cover categories into which forests were converted, cropland was found to be the most extensive (~5800 km2), followed by grassland (~1400 km2). This means that 75% of the converted forest area was used for croplands, proving that croplands expanded considerably during the past 30 years of deforestation (Table 1).
Roughly 6700 km2 of croplands were converted from forests while 1700 km2 were converted from grasslands. With respect to absolute quantities, land converted to croplands was found to be larger than land converted from forests. In summary, 75% of the area converted from forests became croplands and 69% of land converted to croplands came from forests. The results confirmed the significant correlation between deforestation and cropland expansion (Table 2). Table 1 and Table 2 show the average area changing from original forests and croplands to other land cover types.
Although there have been several studies on the deforested areas in North Korea during the same period, each study revealed a different result. According to the report by the Korea Forest Service [58], 18% (16,320 km2) of the total forest area was deforested, while Park and Yoo [59], who classified the land cover based on satellite images, stated that it was 13,910 km2. According to Yu and Kim [60], forest area was reduced from 91,679 to 73,291 km2 during 1989–2008, which indicates that 18,388 km2 of the forest areas were converted to other land-cover categories. Cui et al. [3] and Kang and Choi [8] used the same land cover map and showed that 5674 km2 and 15,820 km2 were deforested, respectively. These differences in the results can be explained by differences in classification techniques, time scales, spatial resolutions, and types of satellite images used in the respective studies [61].
Even though this study underestimated the deforested areas in comparison with the previous studies, it is clear that deforestation has continued in North Korea according to the time-series of the land cover. The underestimation of deforested areas did not have a large effect on the results because the final outcome was simulated only for the croplands.
3.2. Validation of the GEPIC Result Using Previous Studies and Land Assimilation Data
To verify the soil erosion value, existing research was reviewed. Meusburger et al. [53] estimated the soil erosion in the northern part of South Korea, adjacent to North Korea, using the 137CS method and the RUSLE. The soil erosion values of 0.9–7 t ha−1 year−1 were calculated by the 137CS method and of 0.02–5.1 t ha−1 year−1 were calculated by the RUSLE. Woo [62] estimated soil erosion of South Korea by field experiments and obtained values of 0.3–3.4 t ha−1 year−1. In this research, average estimated soil erosion of rice paddies for 30 years was 4.67 t ha−1 year−1 and that of maize croplands was 6.15 t ha−1 year−1. Considering the more complex topographical features and time series changes of land cover in North Korea compared to South Korea, the results of this research are reasonable in comparison to previous studies. Given the expectation of an increase in soil erosion caused by deforestation in North Korea, a slight overestimation is rational. Fu et al. [52] estimated that the soil erosion of agricultural fields in Washington, United States was 11.09 t ha−1 year−1. Turnage et al. [63] estimated the soil erosion of East Tennessee croplands at 2.6 t ha−1 year−1 using the RUSLE. The estimated soil erosion values in this study sound reasonable relative to other regions. Although the soil erosion amount was not directly comparable or verifiable for North Korea, the reliability of the results presented in this study was evaluated by comparing them with the findings of studies in South Korea (a neighboring country) and the United States, where the RUSLE was developed.
For the validation of runoff related results, we checked and adjusted the twelve steps for the validation process following the EPIC0509 manual. We checked all variables and adjusted the land use number and the saturated conductivity value. We then calculated the annual runoff volume using the GLDAS data and conducted a statistical evaluation. Annual mean runoff values of GLDAS ranged between 18.17 mm and 103.66 mm during the verification period. The runoff values estimated using the GEPIC model were 18.95 mm–160.83 mm (Table 3). Thus, the GEPIC model tends to overestimate the values compared to GLDAS. The standard deviation of GEPIC in the focus area was twice that of GLDAS.
The average value of RMSE was 24.51 (lower value indicating higher accuracy) during that period, and the result was close to the GLDAS data and estimated values. The value of NSEC (0 indicating 100% accuracy) was within the accepted range and it was greater than −1 for half of the period, which indicated similar tendencies for both values. The value of RE showed a greater error than the other indicators. In some years, the error was over 30%, which was caused by the following two factors. The GLDAS runoff was low in the croplands adjacent to the urban area, even though only the cropland data were extracted. Notwithstanding the similarities in the overall volume, differences appeared in the two values owing to the differences in the resolution between the GLDAS data and the results of this study (Table 3).
Since both runoff values are estimates, their comparison can only serve as an approximation of the model performance. Small errors and good performance indicators allowed us to conclude that the GEPIC estimates are adequate for agro-environment studies in this region.
3.3. Agro-Environmental Variables over the Past 30 Years
The GEPIC model estimated six types of agro-environmental variables pertinent to the changes in the past 30 years. These variables also reflect the changes in land cover and climate in each period. The quantitative change in the agro-environmental variables over the past 30 years is a consequence of climate change and the spatial change is a consequence of land cover.
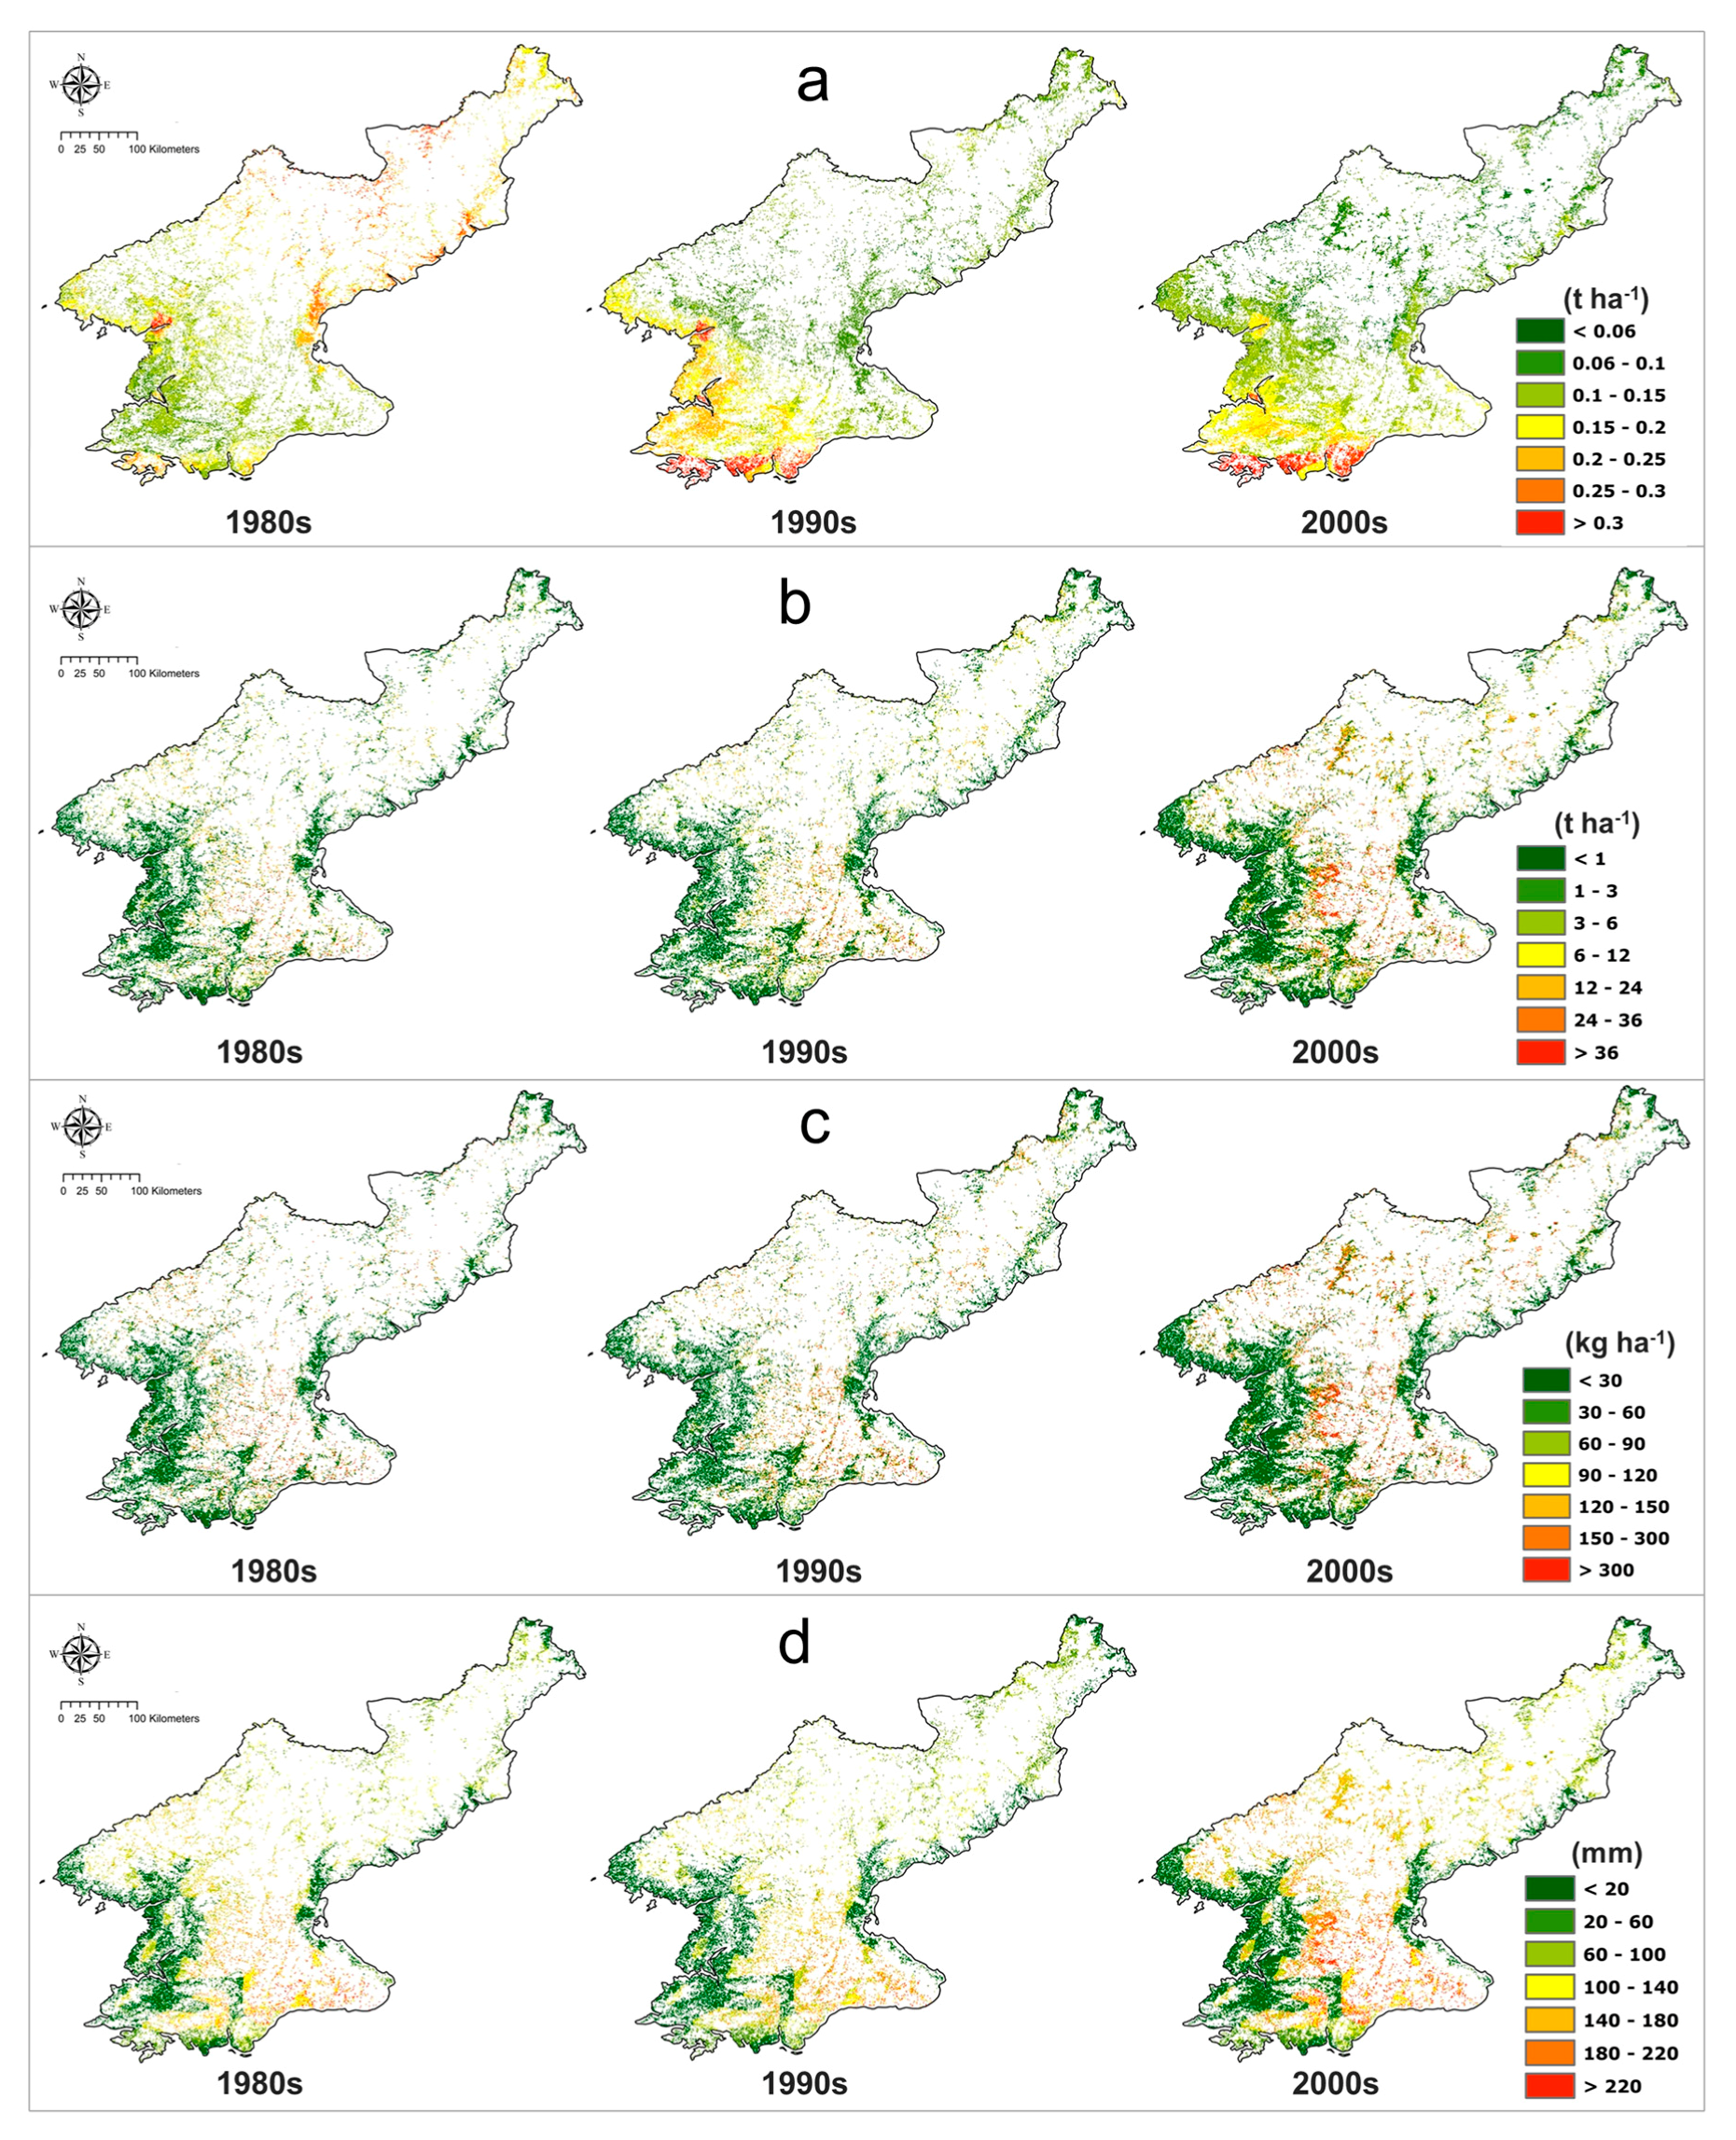
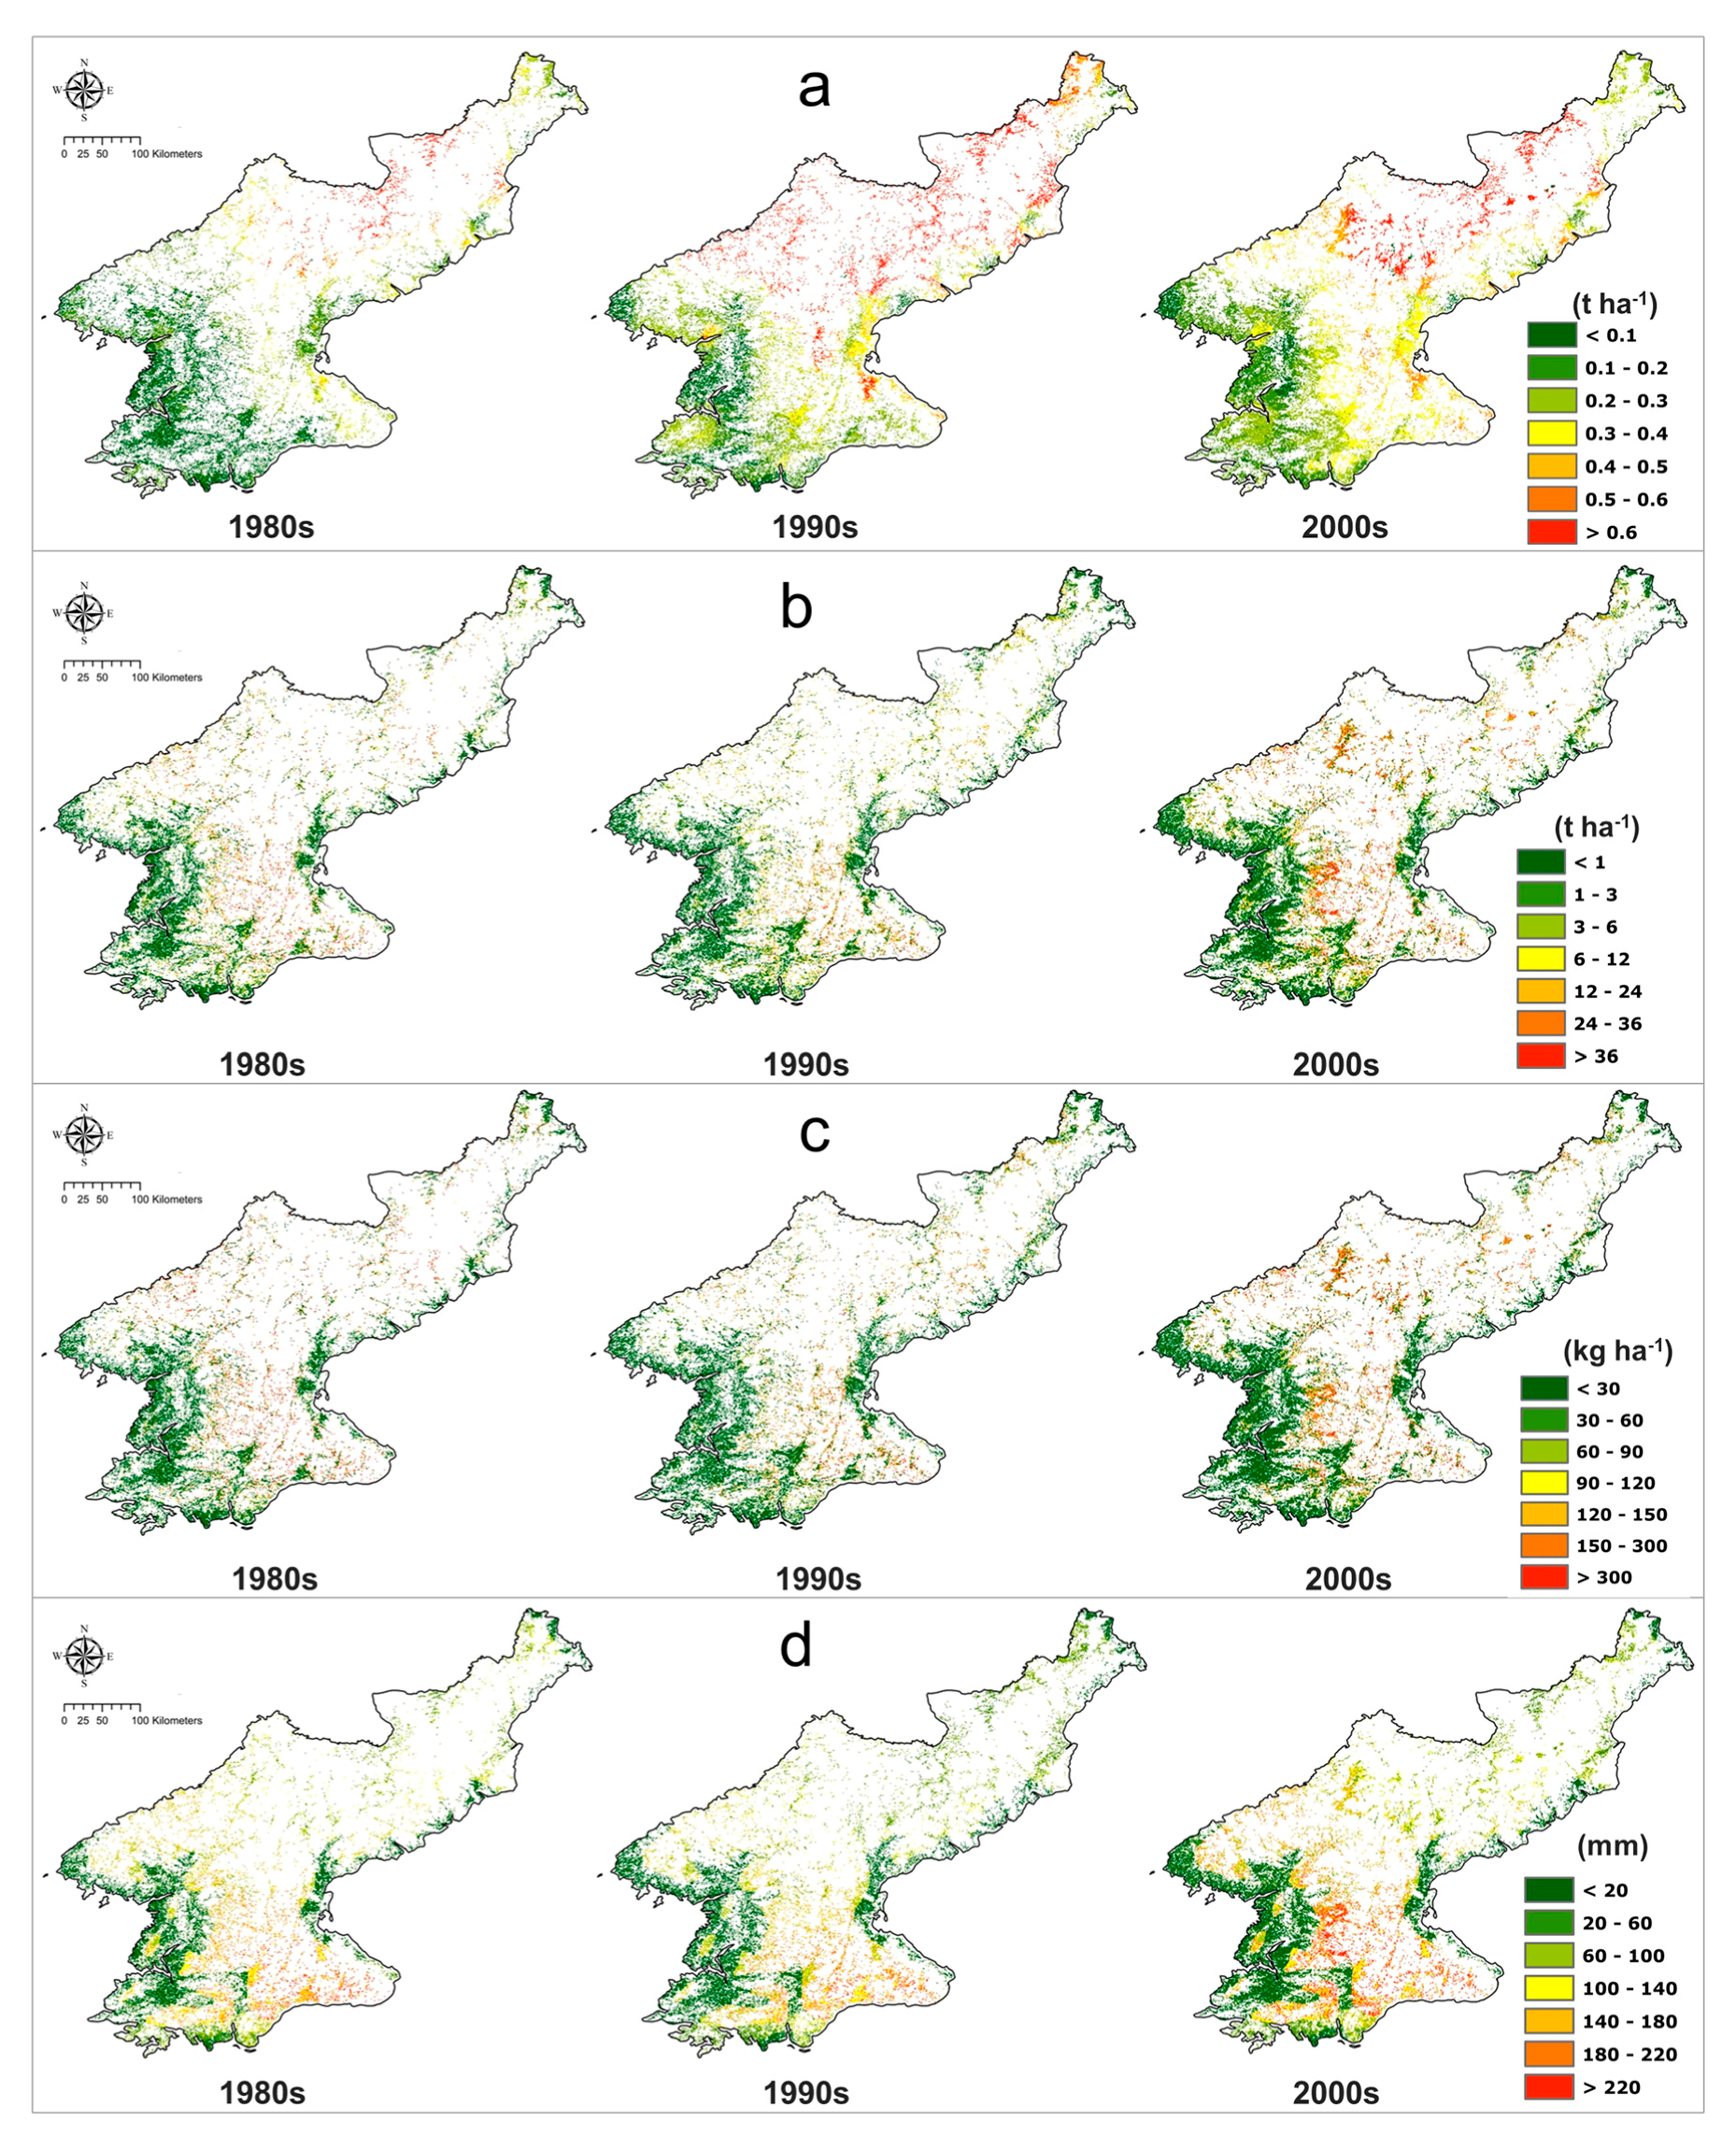
In the case of wind erosion, there was a noticeable difference between rice paddies and maize croplands. The rice paddies maintained the conditions similar to those in the 1980s, whereas the maize croplands showed a considerable increase in wind erosion (Figure 4). Spatial perspectives also revealed the wind erosion of rice paddies to be greater in the low-lying western coast, whereas wind erosion of maize croplands was found to be greater in mountainous areas (Figure 5 and Figure 6).
The time series change of water erosion was not clear but the erosion of maize croplands was slightly greater than that of rice paddies. Regarding both types of croplands, higher altitudes commonly had higher erosion rates (Figure 4, Figure 5 and Figure 6).
The time series change of organic carbon loss showed a tendency similar to that of water erosion, although the difference between the two crops was smaller (Figure 4). The results confirmed that the higher the altitude of the cropland, the higher the loss rate (Figure 5 and Figure 6).
Similarly, the time series change of runoff estimation was not large, and maize cropland showed a slightly higher amount of runoff than rice paddies (Figure 4). Spatially, the higher the altitude was, the more the amount of runoff increased. The central mountainous areas displayed a higher runoff rate than the northeastern mountainous areas despite the higher altitude of the latter (Figure 5 and Figure 6).
The estimated values of the agro-environmental variables for the past 30 years do not clearly show the time-series changes. Differences between the two crops were clearly demonstrated in wind erosion. The other variables were explained by the spatial differences or by the choice of crop, rather than the passage of time.
The agro-environmental variables slightly changed across the three time periods, implying that spatial changes related to the land cover had a greater impact on the change of agro-environmental variables than the climate change.
3.4. Changes in a Agro-Environmental Variables Due to Deforestation
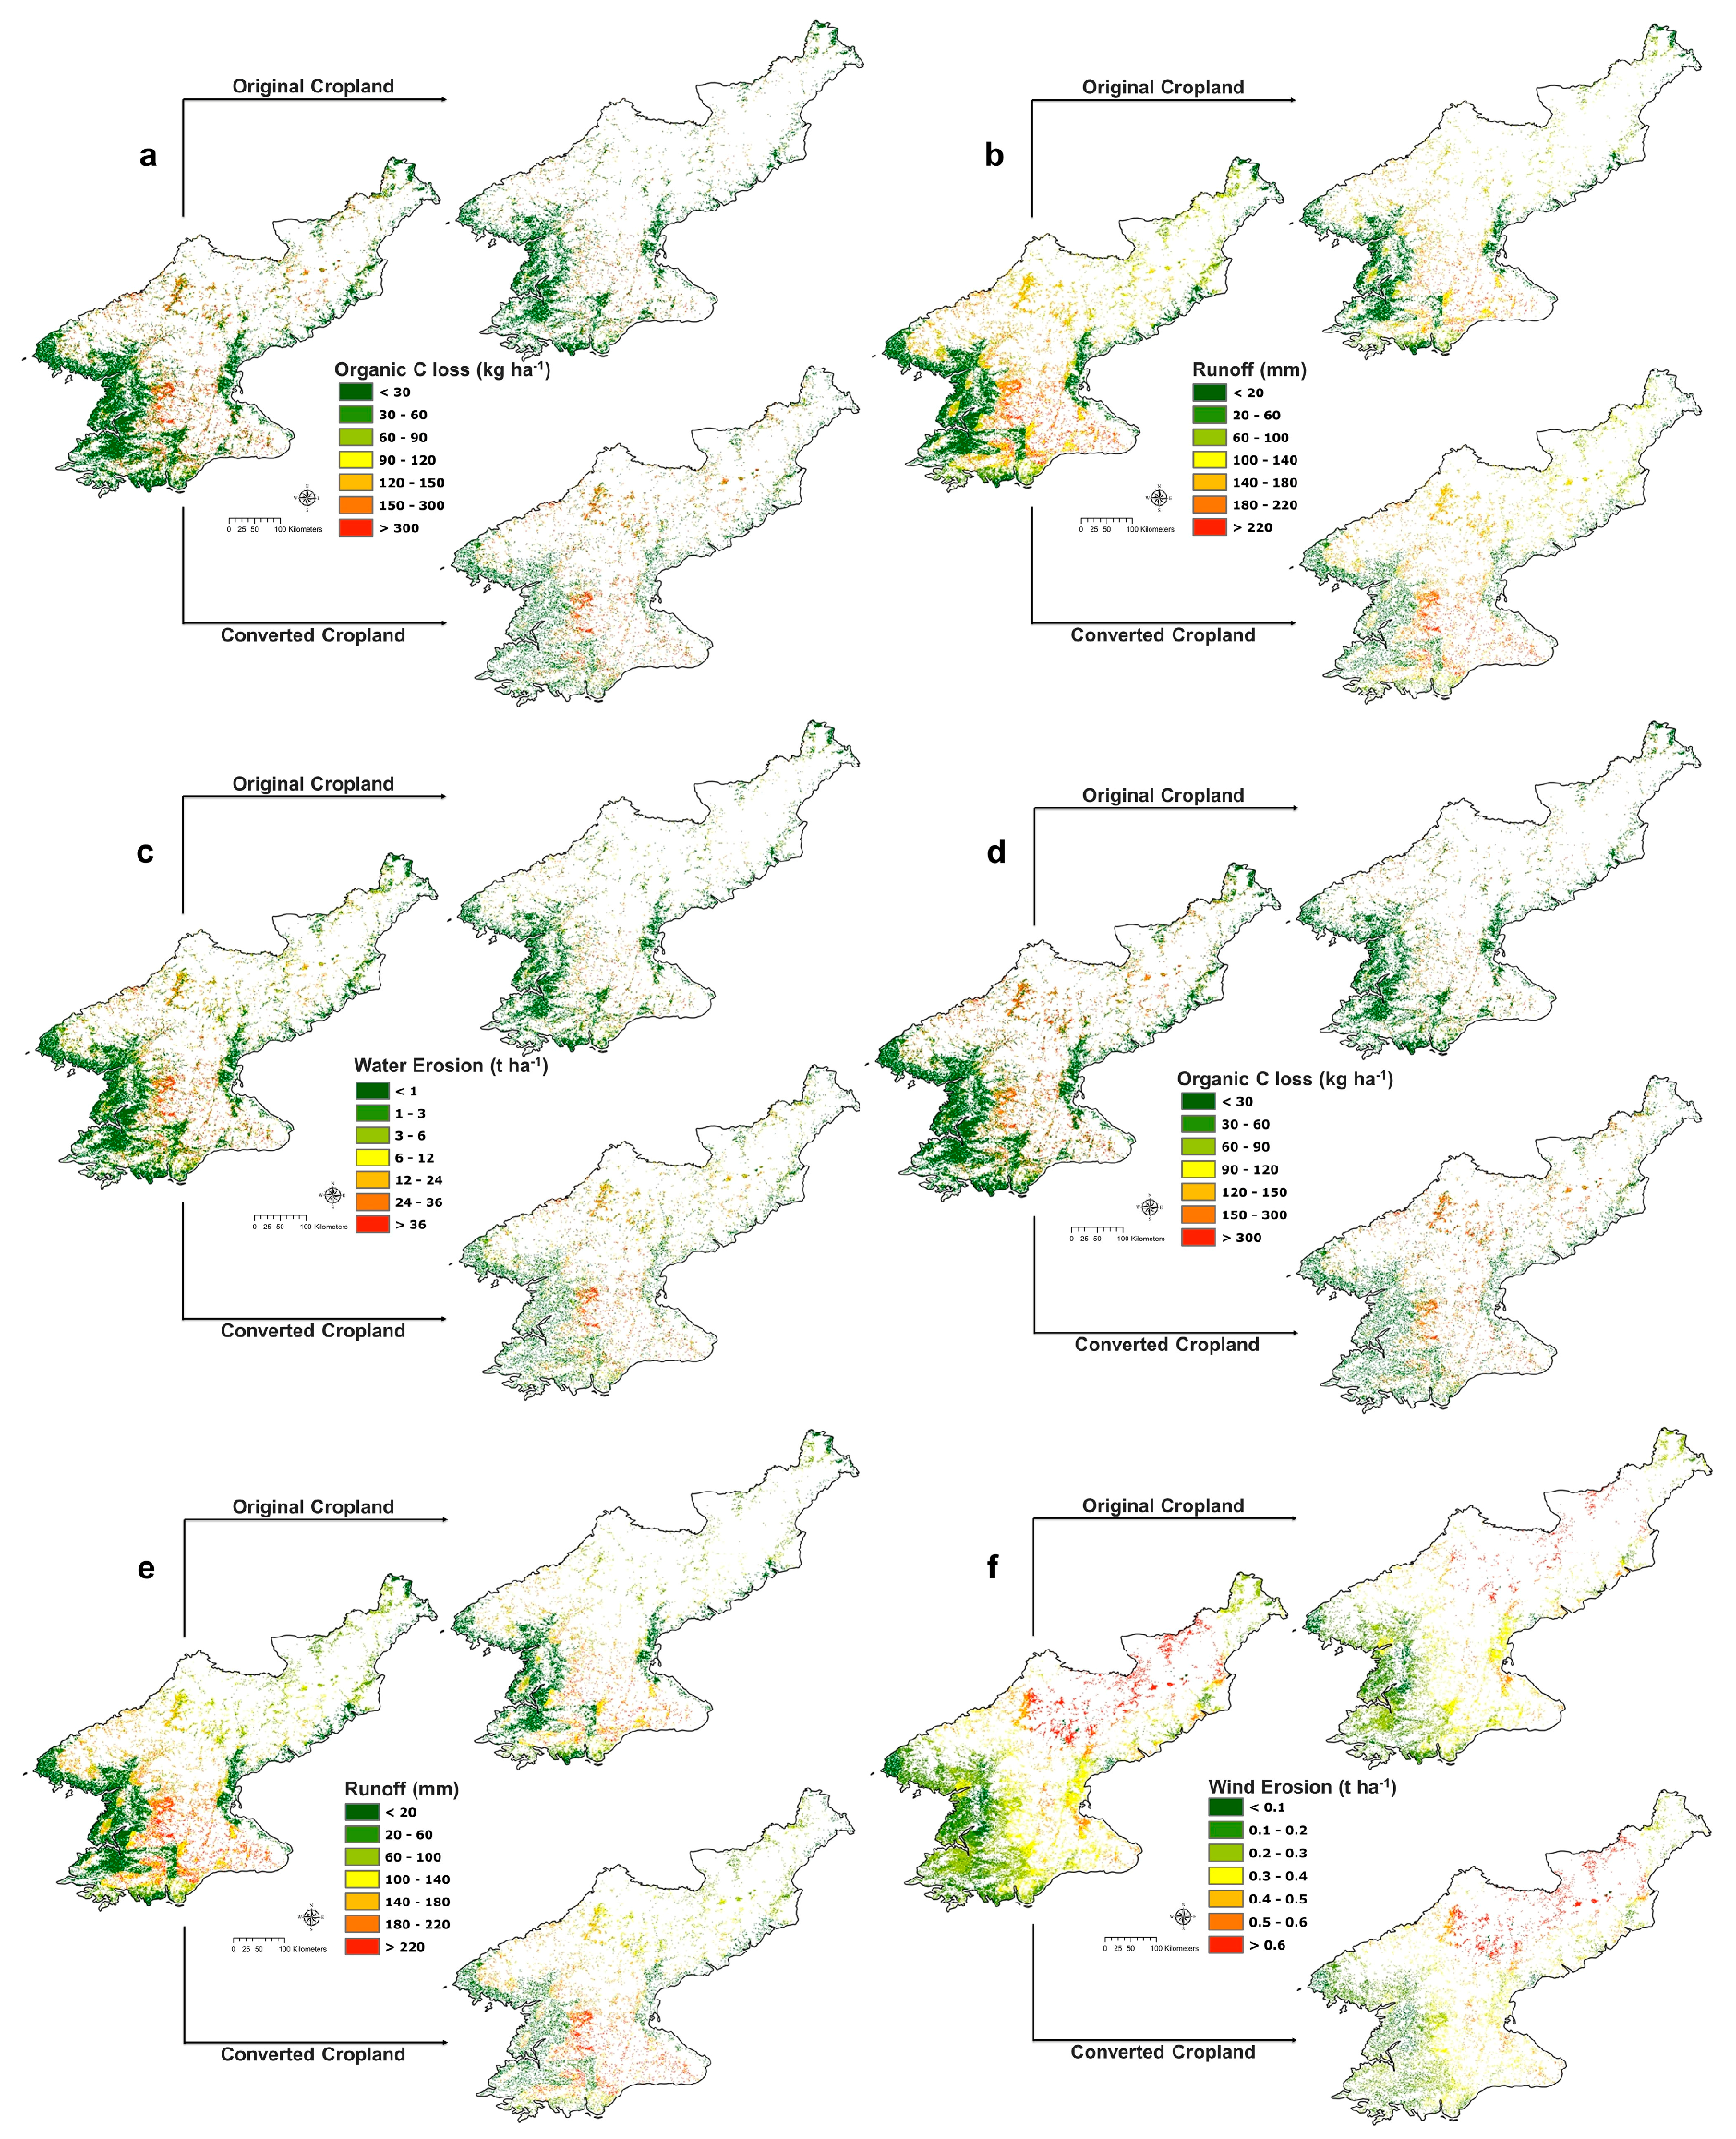
To thoroughly confirm the impact of deforestation on agro-environmental variables, the differences in the variables were compared by dividing the estimated results of agro-environmental variables in the 2000s into the original cropland area. These original croplands remained as croplands in the 1980s and the converted croplands were newly expanded after the 1980s until the 2000s (as defined).
The comparison of the original croplands using the four agro-environmental variables confirmed that after conversion from forests to croplands, three variables were negative and one variable appeared to differ by crop.
Water erosion largely increased in converted croplands, although the difference between the crops was not significant. The average water erosion amount of original cropland was 4.03 t ha−1 (rice paddies) and 4.72 t ha−1 (maize cropland). The water erosion of converted cropland was 9.3 t ha−1 (rice paddies) and 10.94 t ha−1 (maize cropland), more than twice the values of original cropland. The value of water erosion was higher in maize croplands and the difference was greater in converted croplands (Figure 7 and Figure 8). Furthermore, the deviation was also higher in maize croplands and largely increased in converted croplands.
Organic carbon loss showed a similar pattern as the water erosion and no significant differences between crops were observed. The average organic carbon loss amount in converted cropland was more than twice that in original cropland: 40.65 kg ha−1 (rice paddies) and 40.87 kg ha−1 (maize) in original cropland, and 98.23 kg ha−1 (rice paddies) and 101.2 kg ha−1 (maize) in converted cropland. The organic carbon loss of converted croplands also confirmed the drastic increase in deviation compared to the original croplands (Figure 7 and Figure 8).
Both crops showed high average runoff, with values three times higher in converted croplands (Figure 7 and Figure 8). The average values in original cropland were 62.89 mm (rice paddies) and 65.37 mm (maize) and in converted cropland were 94.75 mm (rice paddies) and 93.6 mm (maize). Therefore, regardless of the crop type, the loss of soil, organic matter, and water resources remarkably increased in converted croplands, implying the impacts of deforestation on agriculture.
Regarding wind erosion, the results for rice paddies and maize croplands were found to be uniquely contrary (Figure 7 and Figure 8). For example, the erosion of forests converted to rice paddies was much lower (original cropland: 0.14 t ha−1, converted cropland: 0.12 t ha−1), whereas the erosion rates of forests converted to maize croplands were considerably higher (original cropland: 0.28 t ha−1, converted cropland: 0.36 t ha−1) (Figure 7 and Figure 8), caused by the changes in wind erosion according to the cropland type.
The topographical elements were the cause of such changes to the converted croplands. The average altitude of converted croplands was about three times higher than of the original croplands and the average slope was about five times steeper than of the original croplands (Figure 7). In short, the majority of croplands converted from forests are in high-elevation, steep-slope areas, resulting in negative changes to the agro-environmental variables.
3.5. Implications for Crop Growth, Cropland Stability, and Food Security
This study confirmed that cropland expansion at the expense of deforestation causes changes to several agro-environmental variables, among which soil erosion, organic carbon loss, and runoff were found to have changed for the worse. The converted cropland soil is vulnerable to meteorological events, the decrease in the amount of organic matter, and the ability to utilize water resources.
Deforestation has several impacts on crop growth including the sharp increase in organic carbon loss in forests converted to croplands. It is highly likely that any nitrogen and organic matter would be lost by soil erosion and runoff [64,65]. Variables related to cropland organic matter are the most important indicators influencing soil quality and productivity, and any change has a direct influence on crop productivity. Thus, changes are reflected in continuous adjustments of fertilizer applications [11,28]. It is necessary to introduce management approaches if the actual food production is to increase in accordance with the increased cropland area in North Korea [57].
The runoff of converted croplands shows an increase of more than 1.5 times. This not only reduces water resources in the soil but also has a negative influence on croplands through its role in effusing organic matter [64]. The increase in cropland runoff augments the flood damage during localized torrential downpours and becomes a contributor to the aggravation of vulnerability to climate change, such as the reduction in the flow rate during periods without precipitation [66].
Agro-environmental variables affected by deforestation have a more direct impact on cropland stability. While variables for wind erosion tend to show some differences by the crop type, generally, soil erosion of forests converted to croplands showed a considerable difference by the crop type. Water erosion caused by deforestation will increase by 9300 t annually for recently converted rice paddies and by 10,900 t annually for recently converted maize croplands. In the future, when climate variability will be more severe than now, it is possible to project that water erosion will continuously increase [12,67,68].
North Korea is a country with high food self-sufficiency rates but has received long-term food aid owing to supply shortage [69,70]. In recent years especially, the food security issue has worsened because of the political isolation that led to limited accessibility of imported goods and aid [9,69]. One of the reasons for low food security is the change in the agro-environment as a result of deforestation. North Korea’s cropland, which is a third of the converted land, has been negatively impacted by deteriorating land quality, which has adversely affected food security.
4. Conclusions
This research estimated the representative agro-environmental variables using the GEPIC model to confirm that cropland expansion at the expense of deforestation has had impacts on crop productivity and cropland stability in North Korea. In the initial phase, land cover maps from the 1980s to the 2000s showed that 75% of converted forests became cropland and 69% of converted cropland came from forests. This confirmed the significant correlation between deforestation and cropland expansion.
The estimated values of four agro-environmental variables for the past 30 years showed no clear time-series changes. There was a clear difference in wind erosion between crops; however, the other variables were better explained by spatial differences rather than climate change or differences by crops.
The quantitative comparison of the croplands expanded through deforestation with the original croplands showed definite negative changes in cropland stability and productivity as a result of organic carbon loss and increased water erosion and runoff, regardless of crop type. Such changes might be attributable to the topographical characteristics of the croplands converted from forests. Generally, converted croplands increased the vulnerability to climate change effects, such as torrential rains or strong winds, resulting in potential decreases in productivity and cropland stability.
The results confirm the effects of deforestation on cropland stability and productivity by the changes in several variables. However, the study has limitations, as it cannot assess the quantitative impact on productivity. Some of the results cannot be directly used to validate the model simulation. However, they provide a means of validating the estimation of the variables at the national scale. Although there is a limit to the verification data because of spatial restrictions, we conducted a qualitative verification using related studies. Therefore, the estimated agro-environmental variables in this study are the potential indicators of the deforestation impact. Because of the limitations in observations or field data for model validation, the present research focuses on changes in deforestation and other factors rather than absolute values.
Acknowledgments
This study was supported by the Korea Forest Service (Project Number: 2017044B10-1719-BB01), Korean Ministry of Environment as “Public Technology Development Project based on Environmental Policy” (Project Number: 2016000210001), and Korea University Special Research Grant (K1608501). We also thank Yookyung Kim (Yale University) and Soo Jeong Lee (Korea University) for English editing.
Author Contributions
Chul-Hee Lim designed this research, analyzed the results, and wrote the manuscript. Yuyoung Choi and Moonil Kim participated in the data analysis. All authors, including Seon Woo Jeon and Woo-kyun Lee, provided comments and approved the final manuscript.
Conflicts of Interest
The authors declare no conflict of interest.
References
- Kim, S.; Kang, M. Comparison of experts’ opinions on international organizations’ and two Koreas’ roles for reforestation in North Korea. Forest Sci. Technol. 2015, 11, 133–138. [Google Scholar] [CrossRef]
- Adachi, M.; Ito, A.; Ishida, A.; Kadir, W.R.; Ladpala, P.; Yamagata, Y. Carbon budget of tropical forests in Southeast Asia and the effects of deforestation: An approach using a process-based model and field measurements. Biogeosciences 2011, 8, 2635–2647. [Google Scholar] [CrossRef] [Green Version]
- Cui, G.; Lee, W.K.; Kim, D.; Lee, E.J.; Kwak, H.; Choi, H.A.; Kwak, D.A.; Jeon, S.; Zhu, W. Estimation of forest carbon budget from land cover change in South and North Korea between 1981 and 2010. J. Plant Biol. 2014, 57, 225–238. [Google Scholar] [CrossRef]
- Intergovernmental Panel on Climate Change. Climate Change 2014: Impacts, Adaptation, and Vulnerability. Part A: Global and Sectoral Aspects, Contribution of Working Group II to the Fifth Assessment Report of the Intergovernmental Panel on Climate Change; Cambridge University Press: Cambridge, UK, 2014. [Google Scholar]
- Engler, R.; Teplyakov, V.; Adams, J.M. An Assessment of forest cover trends in South and North Korea, from 1980 to 2010. Environ. Manag. 2014, 53, 194–201. [Google Scholar] [CrossRef] [PubMed]
- Salazar, A.; Katzfey, J.; Thatcher, M.; Syktus, J.; Wong, K.; McAlpine, C. Deforestation changes land–atmosphere interactions across South American biomes. Glob. Planet. Chang. 2016, 139, 97–108. [Google Scholar] [CrossRef]
- Pang, C.; Yu, H.; He, J.; Xu, J. Deforestation and changes in landscape patterns from 1979 to 2006 in Suan County, DPR Korea. Forests 2013, 4, 968–983. [Google Scholar] [CrossRef]
- Kang, S.; Choi, W. Forest cover changes in North Korea since the 1980s. Reg. Environ. Chang. 2014, 14, 347–354. [Google Scholar] [CrossRef]
- Korea Rural Economic Institute. KREI Quarterly Agriculture Trends in North Korea; Korea Rural Economic Institute: Naju, Korea, 2014. [Google Scholar]
- Kraemer, R.; Prishchepov, A.V.; Müller, D.; Kuemmerle, T.; Radeloff, V.C.; Dara, A.; Terekhov, A.; Frühauf, M. Long-term agricultural land-cover change and potential for cropland expansion in the former Virgin Lands area of Kazakhstan. Environ. Res. Lett. 2015, 10, 054012. [Google Scholar] [CrossRef]
- Kocyigit, R.; Demirci, S. Long-term changes of aggregate-associated and labile soil organic carbon and nitrogen after conversion from forest to grassland and cropland in northern Turkey. Land Degrad. Dev. 2012, 23, 475–482. [Google Scholar] [CrossRef]
- Simonneaux, V.; Cheggour, A.; Deschamps, C.; Mouillot, F.; Cerdan, O.; Le Bissonnais, Y. Land use and climate change effects on soil erosion in a semi-arid mountainous watershed (High Atlas, Morocco). J. Arid Environ. 2015, 122, 64–75. [Google Scholar] [CrossRef] [Green Version]
- Folberth, C.; Yang, H.; Gaiser, T.; Liu, J.; Wang, X.; Williams, J.; Schulin, R. Effects of ecological and conventional agricultural intensification practices on maize yields in sub-Saharan Africa under potential climate change. Environ. Res. Lett. 2014, 9, 044004. [Google Scholar] [CrossRef]
- Li, T.; Huang, Y.; Zhang, W.; Yu, Y.Q. Methane emissions associated with the conversion of marshland to cropland and climate change on the Sanjiang Plain of northeast China from 1950 to 2100. Biogeosciences 2012, 9, 5199–5215. [Google Scholar] [CrossRef] [Green Version]
- Feddema, J.J.; Freire, S.C. Soil degradation, global warming and climate impacts. Clim. Res. 2001, 17, 209–216. [Google Scholar] [CrossRef]
- Williams, J.R.; Jones, C.A.; Kiniry, J.R.; Spanel, D.A. The EPIC crop growth model. Trans. ASAE 1989, 32, 497–511. [Google Scholar] [CrossRef]
- Liu, J.; Williams, J.R.; Zehnder, A.J.; Yang, H. GEPIC—Modelling wheat yield and crop water productivity with high resolution on a global scale. Agric. Syst. 2007, 94, 478–493. [Google Scholar] [CrossRef]
- Song, Y.; Lim, C.H.; Lee, W.K.; Eom, K.C.; Choi, S.E.; Lee, E.J.; Kim, E. Applicability analysis of major crop models on Korea for the adaptation to climate change. J. Clim. Chang. Res. 2014, 5, 109–125. [Google Scholar] [CrossRef]
- Lim, C.H.; Lee, W.K.; Song, Y.; Eom, K.C. Assessing the EPIC model for estimation of future crops yield in South Korea. J. Clim. Chang. Res. 2015, 6, 21–31. [Google Scholar] [CrossRef]
- United Nations Framework Convention on Climate Change (UNFCCC). Modalities and Procedures for Afforestation and Reforestation Activities under the Clean Development Mechanism in the First Commitment Period of the Kyoto Protocol; Decision 19/CP.9, draft decision CMP1 (Land Use, Land-Use Change and Forestry) UNFCCC/SBSTA; UNFCCC: New York, NY, USA, 2003; 19p. [Google Scholar]
- Food Agriculture Organization. Global Forest Resources Assessment 2005; FAO: Rome, Italy, 2006. [Google Scholar]
- Palka, E.J.; Galgano, F.A. North Korea, a Geographical Analysis; Military Academy; West Point: New York, NY, USA, 2003. [Google Scholar]
- Choi, I.H.; Woo, J.C. Developmental process of forest policy direction in Korea and present status of forest desolation in North Korea. J. For. Sci. 2007, 23, 14. [Google Scholar]
- Makowski, D.; Tichit, M.; Guichard, L.; Van Keulen, H.; Beaudoin, N. Measuring the accuracy of agro-environmental indicators. J. Environ. Manag. 2009, 90, S139–S146. [Google Scholar] [CrossRef] [PubMed]
- Castillejo-González, I.L.; López-Granados, F.; García-Ferrer, A.; Peña-Barragán, J.M.; Jurado-Expósito, M.; de la Orden, M.S.; González-Audicana, M. Object-and pixel-based analysis for mapping crops and their agro-environmental associated measures using QuickBird imagery. Comput. Electr. Agric. 2009, 68, 207–215. [Google Scholar] [CrossRef]
- Houlès, V.; Mary, B.; Guérif, M.; Makowski, D.; Justes, E. Evaluation of the ability of the crop model STICS to recommend nitrogen fertilisation rates according to agro-environmental criteria. Agronomie 2004, 24, 339–349. [Google Scholar] [CrossRef]
- Gobin, A.; Jones, R.; Kirkby, M.; Campling, P.; Govers, G.; Kosmas, C.; Gentile, A.R. Indicators for pan-European assessment and monitoring of soil erosion by water. Environ. Sci. Policy 2004, 7, 25–38. [Google Scholar] [CrossRef]
- Yao, Y.; Ye, L.; Tang, H.; Tang, P.; Wang, D.; Si, H.; Hu, W.; Van Ranst, E. Cropland soil organic matter content change in Northeast China, 1985–2005. Open Geosci. 2015, 7, 234–243. [Google Scholar] [CrossRef] [Green Version]
- Centofanti, T.; Hollis, J.M.; Blenkinsop, S.; Fowler, H.J.; Truckell, I.; Dubus, I.G.; Reichenberger, S. Development of agro-environmental scenarios to support pesticide risk assessment in Europe. Sci. Total Environ. 2008, 407, 574–588. [Google Scholar] [CrossRef] [PubMed]
- Rinaldi, M. Application of EPIC model for irrigation scheduling of sunflower in Southern Italy. Agric. Water Manag. 2001, 49, 185–196. [Google Scholar] [CrossRef]
- Williams, J.R. The EPIC Model, Computer Models of Watershed Hydrology; VP Singh; Water Resources Publications: Highlands Ranch, CO, USA, 1995; pp. 909–1000. [Google Scholar]
- Liu, J. A GIS based tool for modelling large scale crop water relations. Environ. Model. Softw. 2009, 24, 411–422. [Google Scholar] [CrossRef]
- Renard, K.G.; Foster, G.R.; Weesies, G.A.; Porter, J.P. RUSLE: Revised Universal Soil Loss Equation. J. Soil Water Conserv. 1991, 46, 30–33. [Google Scholar]
- Renard, K.G.; Foster, G.R.; Weesies, G.A.; McCool, D.K.; Yoder, D.C. Predicting Soil Erosion by Water: A Guide to Conservation Planning with the Revised Universal Soil Loss Equation (RUSLE); Government Printing Office: Washington, DC, USA, 1997; Volume 703.
- Yang, D.; Kanae, S.; Oki, T.; Koike, T.; Musiake, K. Global potential soil erosion with reference to land use and climate changes. Hydrol. Process. 2003, 17, 2913–2928. [Google Scholar] [CrossRef]
- Park, S.; Oh, C.; Jeon, S.; Jung, H.; Choi, C. Soil erosion risk in Korean watersheds, assessed using the revised universal soil loss equation. J. Hydrol. 2011, 399, 263–273. [Google Scholar] [CrossRef]
- Leonard, R.A.; Knisel, W.G.; Still, D.A. GLEAMS: Groundwater loading effects of agricultural management systems. Trans. ASAE 1987, 30, 1403–1418. [Google Scholar] [CrossRef]
- Williams, J.R.; LaSeur, W.V. Water yield model using SCS curve numbers. J. Hydraul. Div. 1976, 102, 1241–1253. [Google Scholar]
- Knisel, W.G. GLEAMS: Groundwater Loading Effects of Agricultural Management Systems: Version 2.10 (No. 5); University of Georgia Coastal Plain Experiment Station, Department of Biological & Agriculture Engineering: Tifton, GA, USA, 1993. [Google Scholar]
- Williams, J.; Nearing, M.; Nicks, A.; Skidmore, E.; Valentin, C.; King, K.; Savabi, R. Using soil erosion models for global change studies. J. Soil Water Conserv. 1996, 51, 381–385. [Google Scholar]
- Knisel, W.G.; Turtola, E. GLEAMS model application on a heavy clay soil in Finland. Agric. Water Manag. 2000, 43, 285–309. [Google Scholar] [CrossRef]
- Izaurralde, R.C.; Williams, J.R.; McGill, W.B.; Rosenberg, N.J.; Jakas, M.Q. Simulating soil C dynamics with EPIC: Model description and testing against long-term data. Ecol. Model. 2006, 192, 362–384. [Google Scholar] [CrossRef]
- Lim, C.H.; Kim, D.; Shin, Y.; Lee, W.K. Assessment of drought severity on cropland in Korea Peninsula using normalized precipitation evapotranspiration index (NPEI). J. Clim. Chang. Res. 2015, 6, 223–231. [Google Scholar] [CrossRef]
- Kim, S.N.; Lee, W.K.; Shin, K.I.; Kafatos, M.; Seo, D.J.; Kwak, H. Comparison of spatial interpolation techniques for predicting climate factors in Korea. Forest Sci. Technol. 2010, 6, 97–109. [Google Scholar] [CrossRef]
- Yoo, S.; Kwak, D.A.; Cui, G.; Lee, W.K.; Kwak, H.; Ito, A.; Son, Y.; Jeon, S. Estimation of the ecosystem carbon budget in South Korea between 1999 and 2008. Ecol. Res. 2013, 28, 1045–1059. [Google Scholar] [CrossRef]
- Blackland Research Center: Potential Heat Unit Program 2010. Available online: http://swatmodel.tamu.edu/software/potential-heat-unit-program (accessed on 14 July 2014).
- Folberth, C.; Yang, H.; Gaiser, T.; Abbaspour, K.C.; Schulin, R. Modeling maize yield responses to improvement in nutrient, water and cultivar inputs in SubSaharan Africa. Agric. Syst. 2013, 119, 22–34. [Google Scholar] [CrossRef]
- Batjes, N.H. ISRIC-WISE Derived Soil Properties on a 5 by 5 Arc-Minutes Global Grid; ISRIC—World Soil Information: Wageningen, The Netherlands, 2006. [Google Scholar]
- Food Agriculture Organization. FAO Digital Soil Map of the World; FAO: Rome, Italy, 1995. [Google Scholar]
- Food Agriculture Organization. FertiSTAT—Fertilizer Use Statistics. FAO: Rome, Italy, 2007. Available online: http://www.fao.org/ag/agl/fertistat/index_en.htm (accessed on 11 December 2014).
- You, L.; Crespo, S.; Guo, Z.; Koo, J.; Ojo, W.; Sebastian, K.; Tenorio, M.T.; Wood, S.; Wood-Sichra, U. Spatial Production Allocation Model (SPAM) 2000 Version 3 Release 2; Harvest Choice: Washington, DC, USA, 2010. [Google Scholar]
- Fu, G.; Chen, S.; McCool, D.K. Modeling the impacts of no-till practice on soil erosion and sediment yield with RUSLE, SEDD, and ArcView GIS. Soil Tillage Res. 2006, 85, 38–49. [Google Scholar] [CrossRef]
- Meusburger, K.; Mabit, L.; Park, J.H.; Sandor, T.; Alewell, C. Combined use of stable isotopes and fallout radionuclides as soil erosion indicators in a forested mountain site, South Korea. Biogeosciences 2013, 10, 5627–5638. [Google Scholar] [CrossRef] [Green Version]
- Park, S.D.; Lee, K.S.; Shin, S.S. Statistical soil erosion model for burnt mountain areas in Korea—RUSLE Approach. J. Hydrol. Eng. 2012, 17, 292–304. [Google Scholar] [CrossRef]
- Nash, J.E.; Sutcliffe, J.V. River flow forecasting through conceptual models: Part I—A discussion of principles. J. Hydrol. 1970, 10, 282–290. [Google Scholar] [CrossRef]
- Niu, X.; Easterling, W.; Hays, C.J.; Jacobs, A.; Mearns, L. Reliability and input-data induced uncertainty of the EPIC model to estimate climate change impact on sorghum yields in the US Great Plains. Agric. Ecosyst. Environ. 2009, 129, 268–276. [Google Scholar] [CrossRef]
- Balkovič, J.; van der Velde, M.; Skalský, R.; Xiong, W.; Folberth, C.; Khabarov, N.; Smirnov, A.; Mueller, N.D.; Obersteiner, M. Global wheat production potentials and management flexibility under the representative concentration pathways. Glob. Planet. Chang. 2014, 122, 107–121. [Google Scholar] [CrossRef]
- Korea Forest Service. Annual Report of Forest and Forestry Trend; KFS: Daejeon, Korea, 2009.
- Park, J.H.; Yoo, J. Survey on deforestation of North Korea using remote sensing. J. Environ. Stud. 2009, 48, 3–24. [Google Scholar]
- Yu, J.; Kim, K. Spatio-temporal changes and drivers of deforestation and forest degradation in North Korea. J. Korean Environ. Restor. Technol. 2015, 18, 73–83. [Google Scholar] [CrossRef]
- Kim, E.S.; Lee, S.H.; Cho, H.K. Segment-based Land Cover Classification using Texture Information in Degraded Forest Land of North Korea. Korean J. Remote Sens. 2010, 26, 477–487. [Google Scholar]
- Woo, B.M. Integrated Analytical Study of Runoff Rate and Soil Loss Measurement in Experiments from Forest Lands in Korea; Agricultural Research; Seoul National University: Seoul, Korea, 1984; Volume 9, pp. 11–18. [Google Scholar]
- Turnage, K.M.; Lee, S.Y.; Foss, J.E.; Kim, K.H.; Larsen, I.L. Comparison of soil erosion and deposition rates using radiocesium, RUSLE, and buried soils in dolines in East Tennessee. Environ. Geol. 1997, 29, 1–10. [Google Scholar] [CrossRef]
- Bormann, N.B.; Baxter, C.A.; Andraski, T.W.; Good, L.W.; Bundy, L.G. Scale-of-measurement effects on phosphorus in runoff from cropland. J. Soil Water Conserv. 2012, 67, 122–133. [Google Scholar] [CrossRef]
- VandenBygaart, A.J.; Gregorich, E.G.; Helgason, B.L. Cropland C erosion and burial: Is buried soil organic matter biodegradable? Geoderma 2015, 239, 240–249. [Google Scholar] [CrossRef]
- Olichwer, T.; Tarka, R. Impact of climate change on the groundwater run-off in south-west Poland. Open Geosci. 2015, 7, 1–14. [Google Scholar] [CrossRef]
- Mullan, D.; Favis-Mortlock, D.; Fealy, R. Addressing key limitations associated with modelling soil erosion under the impacts of future climate change. Agric. For. Meteorol. 2012, 156, 18–30. [Google Scholar] [CrossRef]
- Bhattacharyya, R.; Ghosh, B.N.; Mishra, P.K.; Mandal, B.; Rao, C.S.; Sarkar, D.; Das, L.; Anil, K.S.; Lalitha, M.; Hati, K.M.; et al. Soil degradation in India: Challenges and potential solutions. Sustainability 2015, 7, 3528–3570. [Google Scholar] [CrossRef]
- Ireson, R. Food Security in North Korea: Designing Realistic Possibilities; Walter H. Shorenstein Asia-Pacific Research Center: Satanford, CA, USA, 2006. [Google Scholar]
- Lim, C.-H.; Kim, S.H.; Choi, Y.; Kafatos, M.C.; Lee, W.-K. Estimation of the Virtual Water Content of Main Crops on the Korean Peninsula Using Multiple Regional Climate Models and Evapotranspiration Methods. Sustainability 2017, 9, 1172. [Google Scholar] [CrossRef]
Figure 1.
Land cover in the 1980s and 2000s.
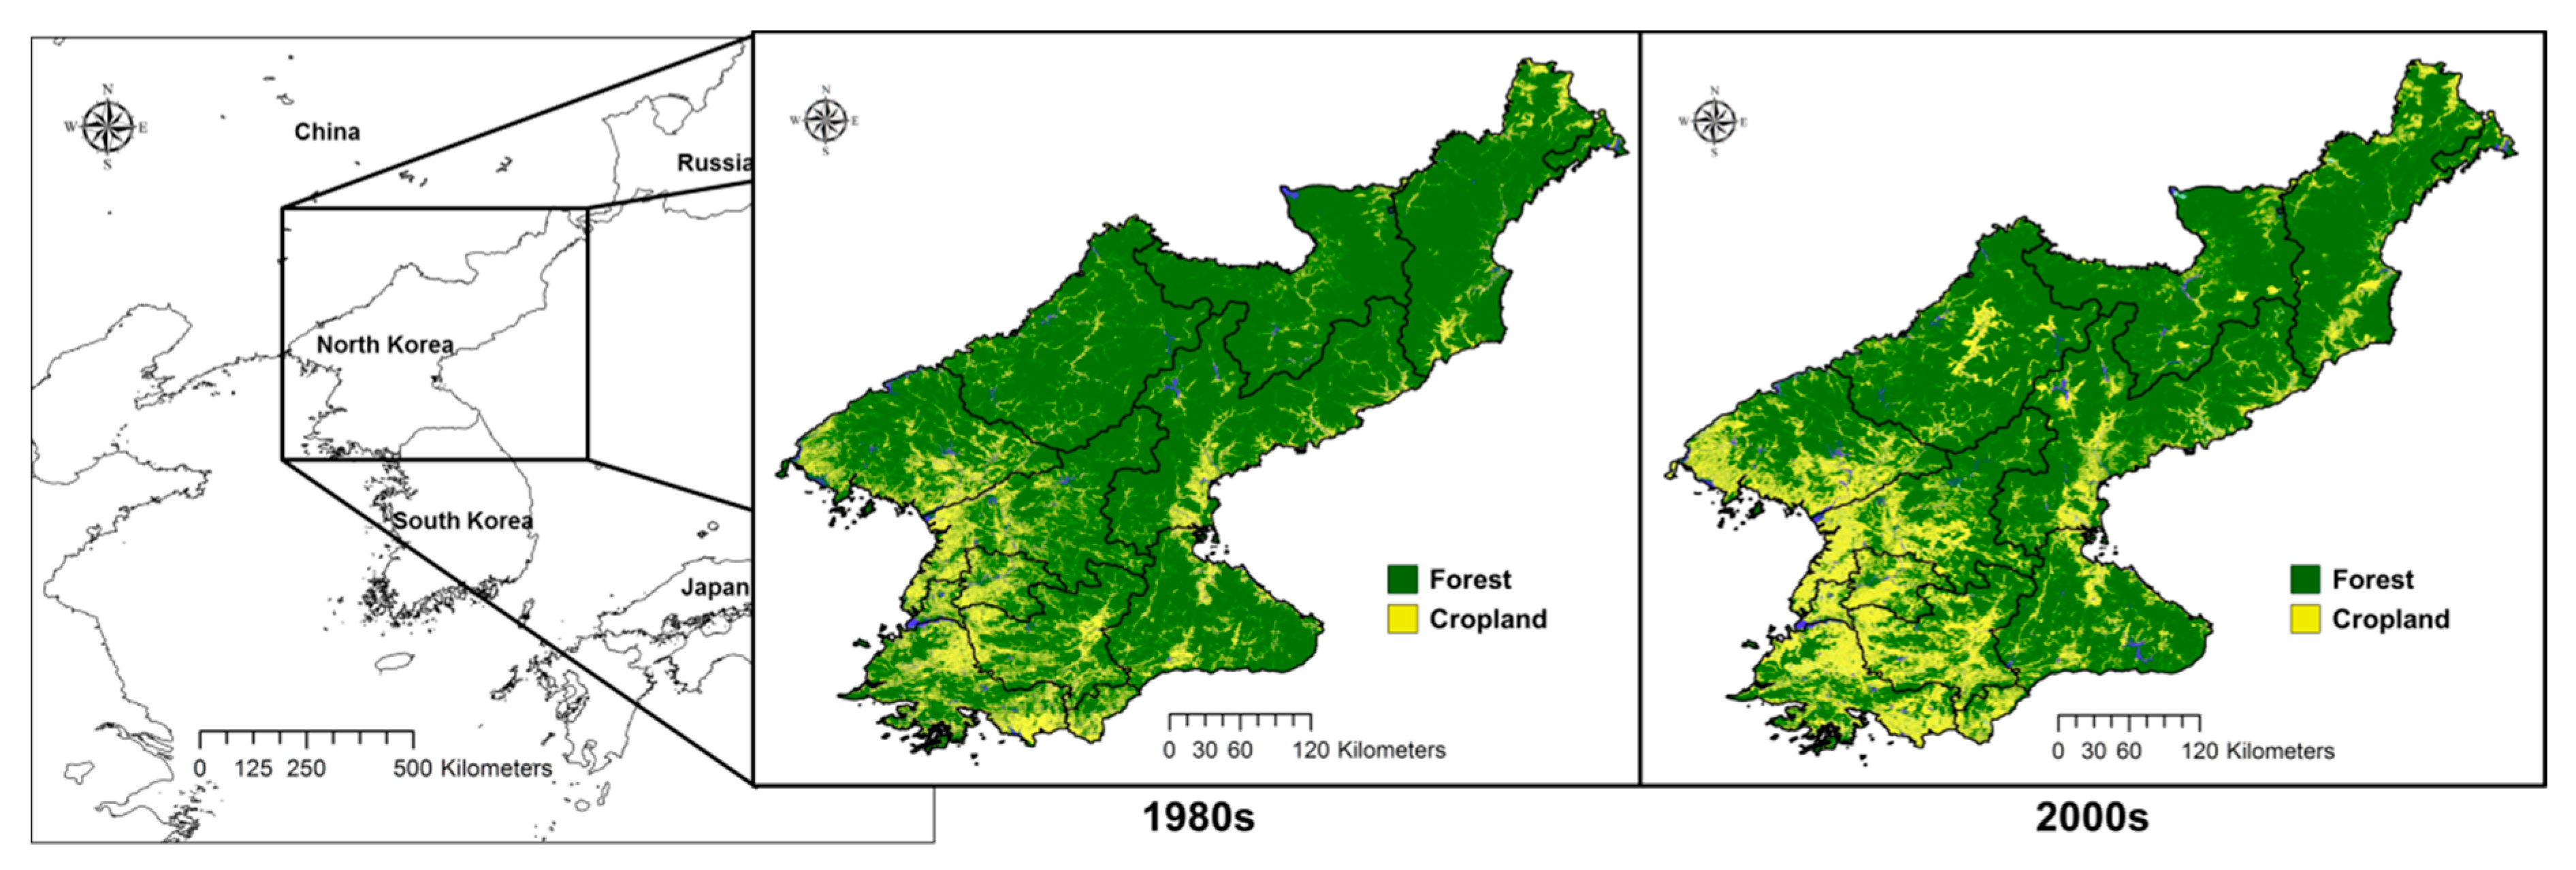
Figure 2.
Schematic diagram of this study.

Figure 3.
Changes in forest and cropland area in the past 30 years.
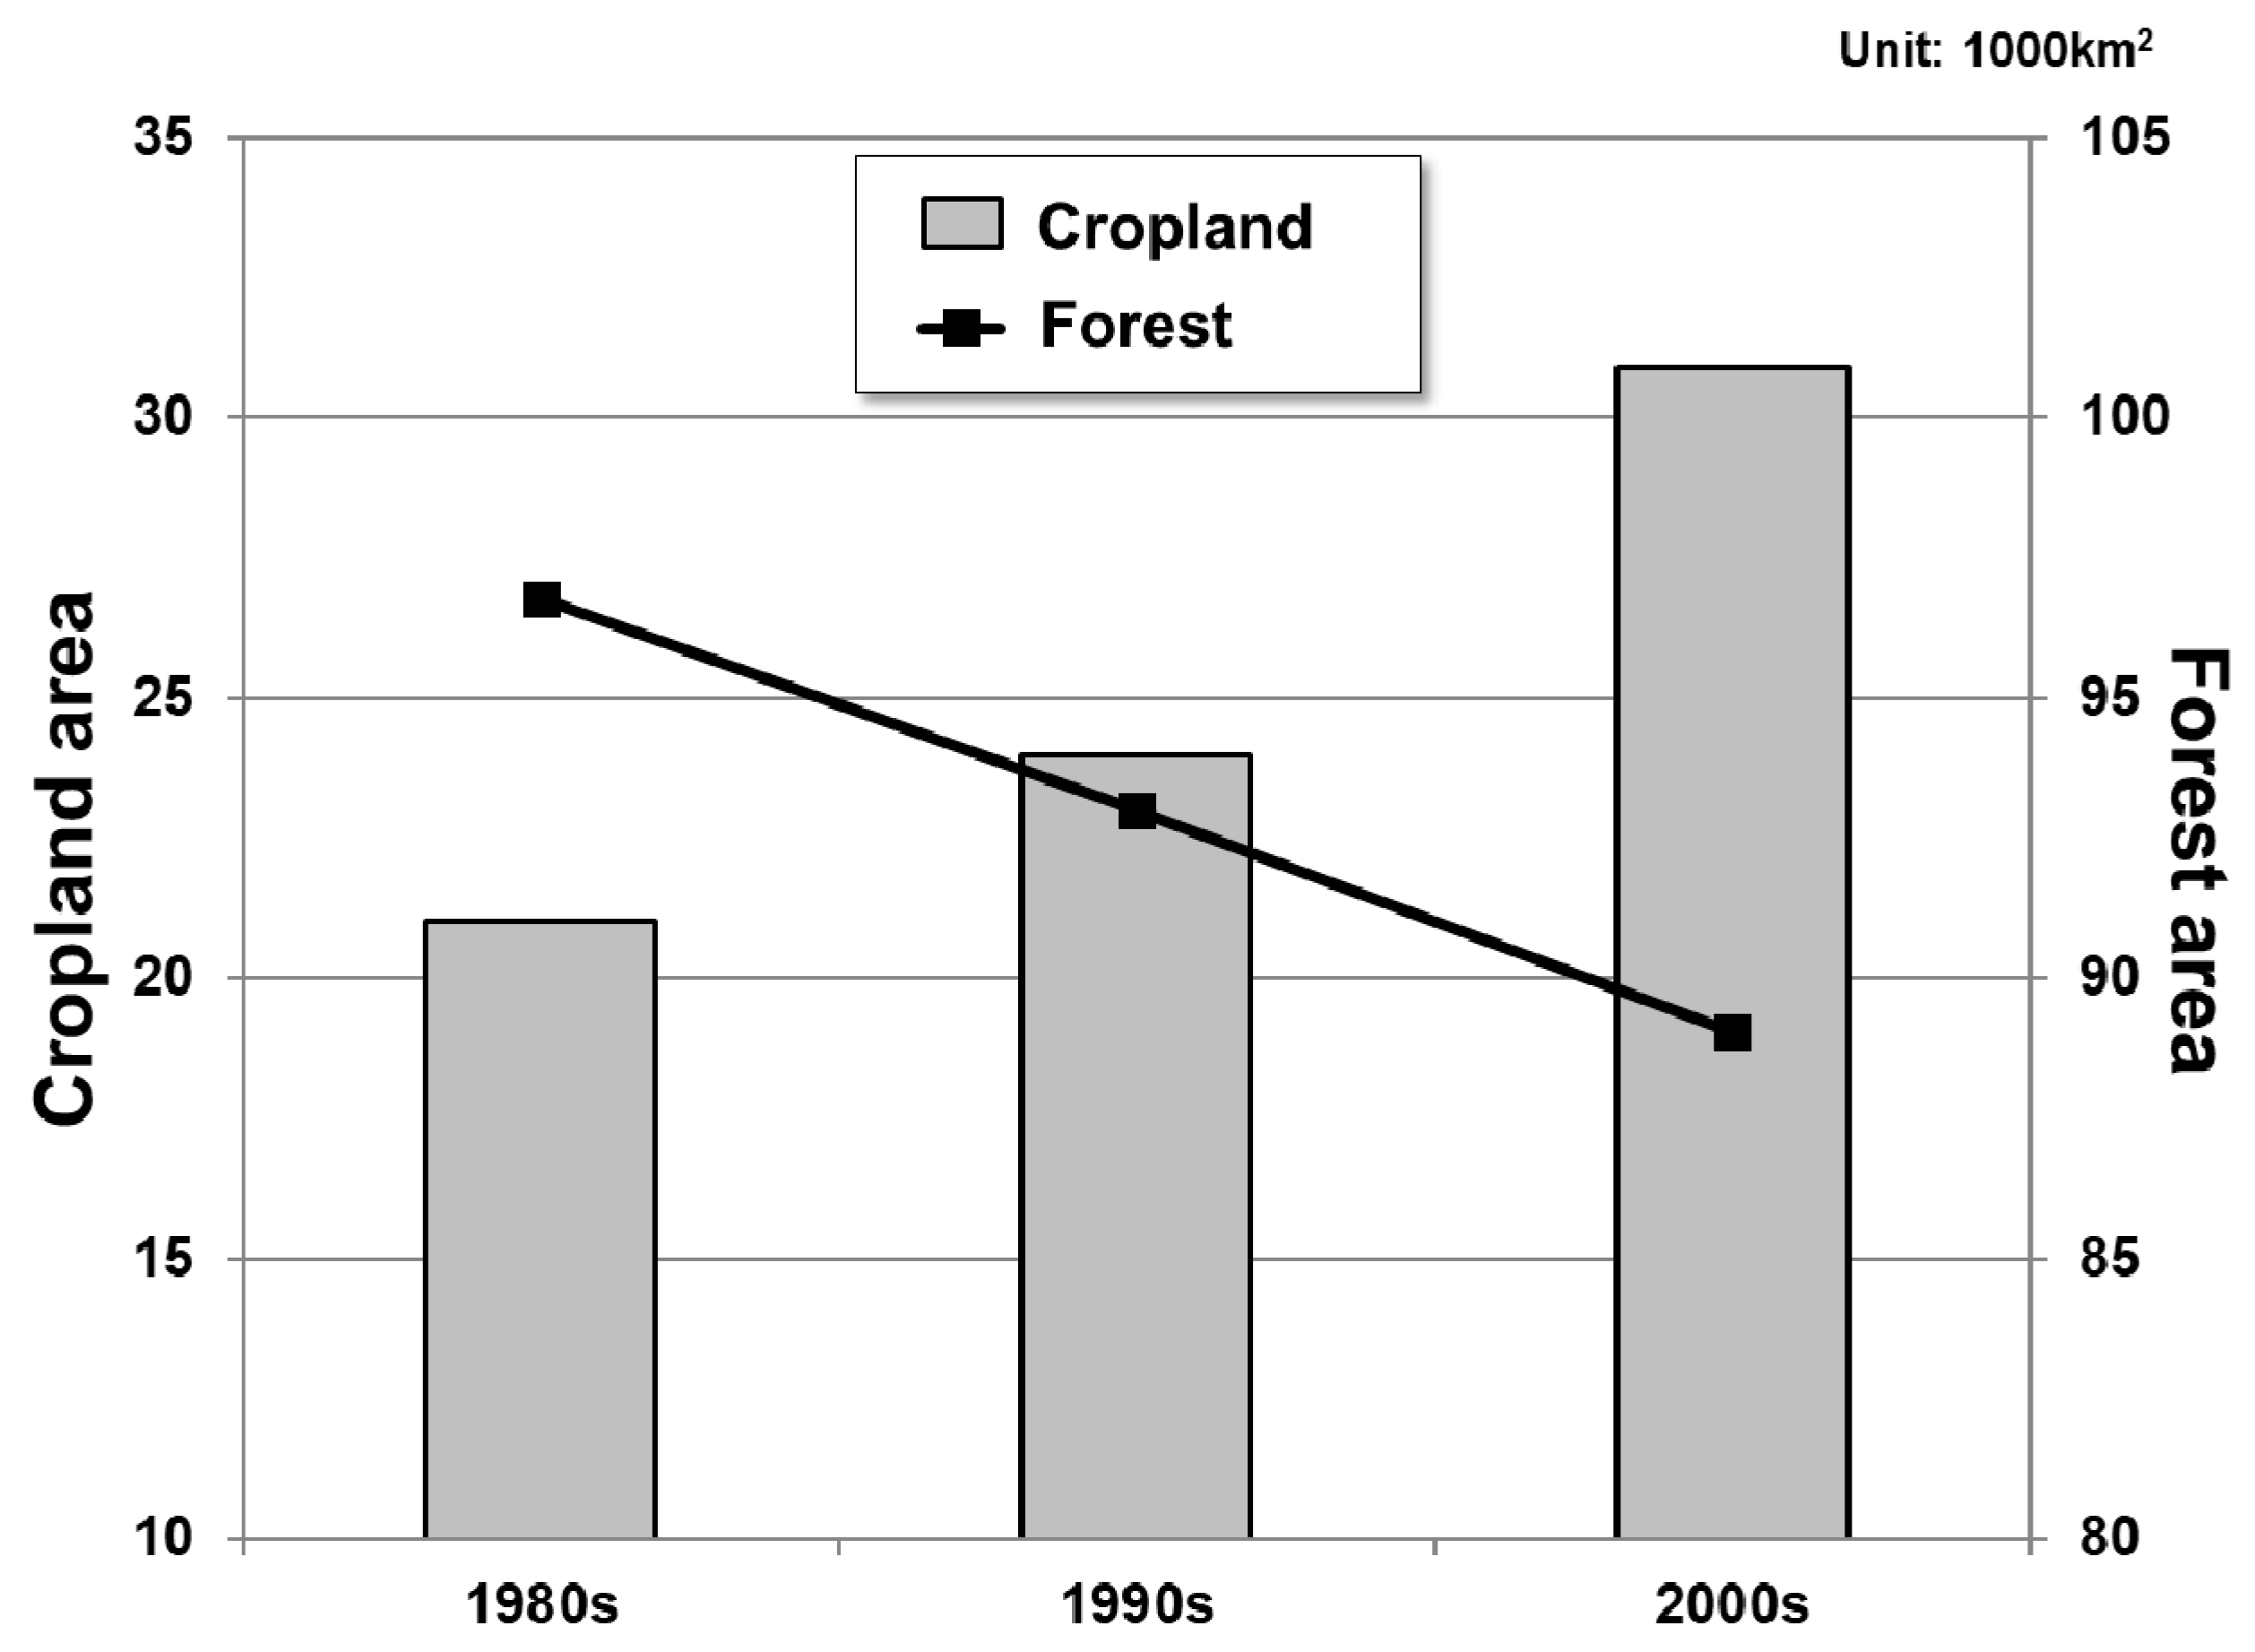
Figure 4.
Decadal time change of agro-environmental variables for each cropland: (a) Wind erosion; (b) Water erosion; (c) Organic carbon loss; and (d) Runoff.
Figure 4.
Decadal time change of agro-environmental variables for each cropland: (a) Wind erosion; (b) Water erosion; (c) Organic carbon loss; and (d) Runoff.
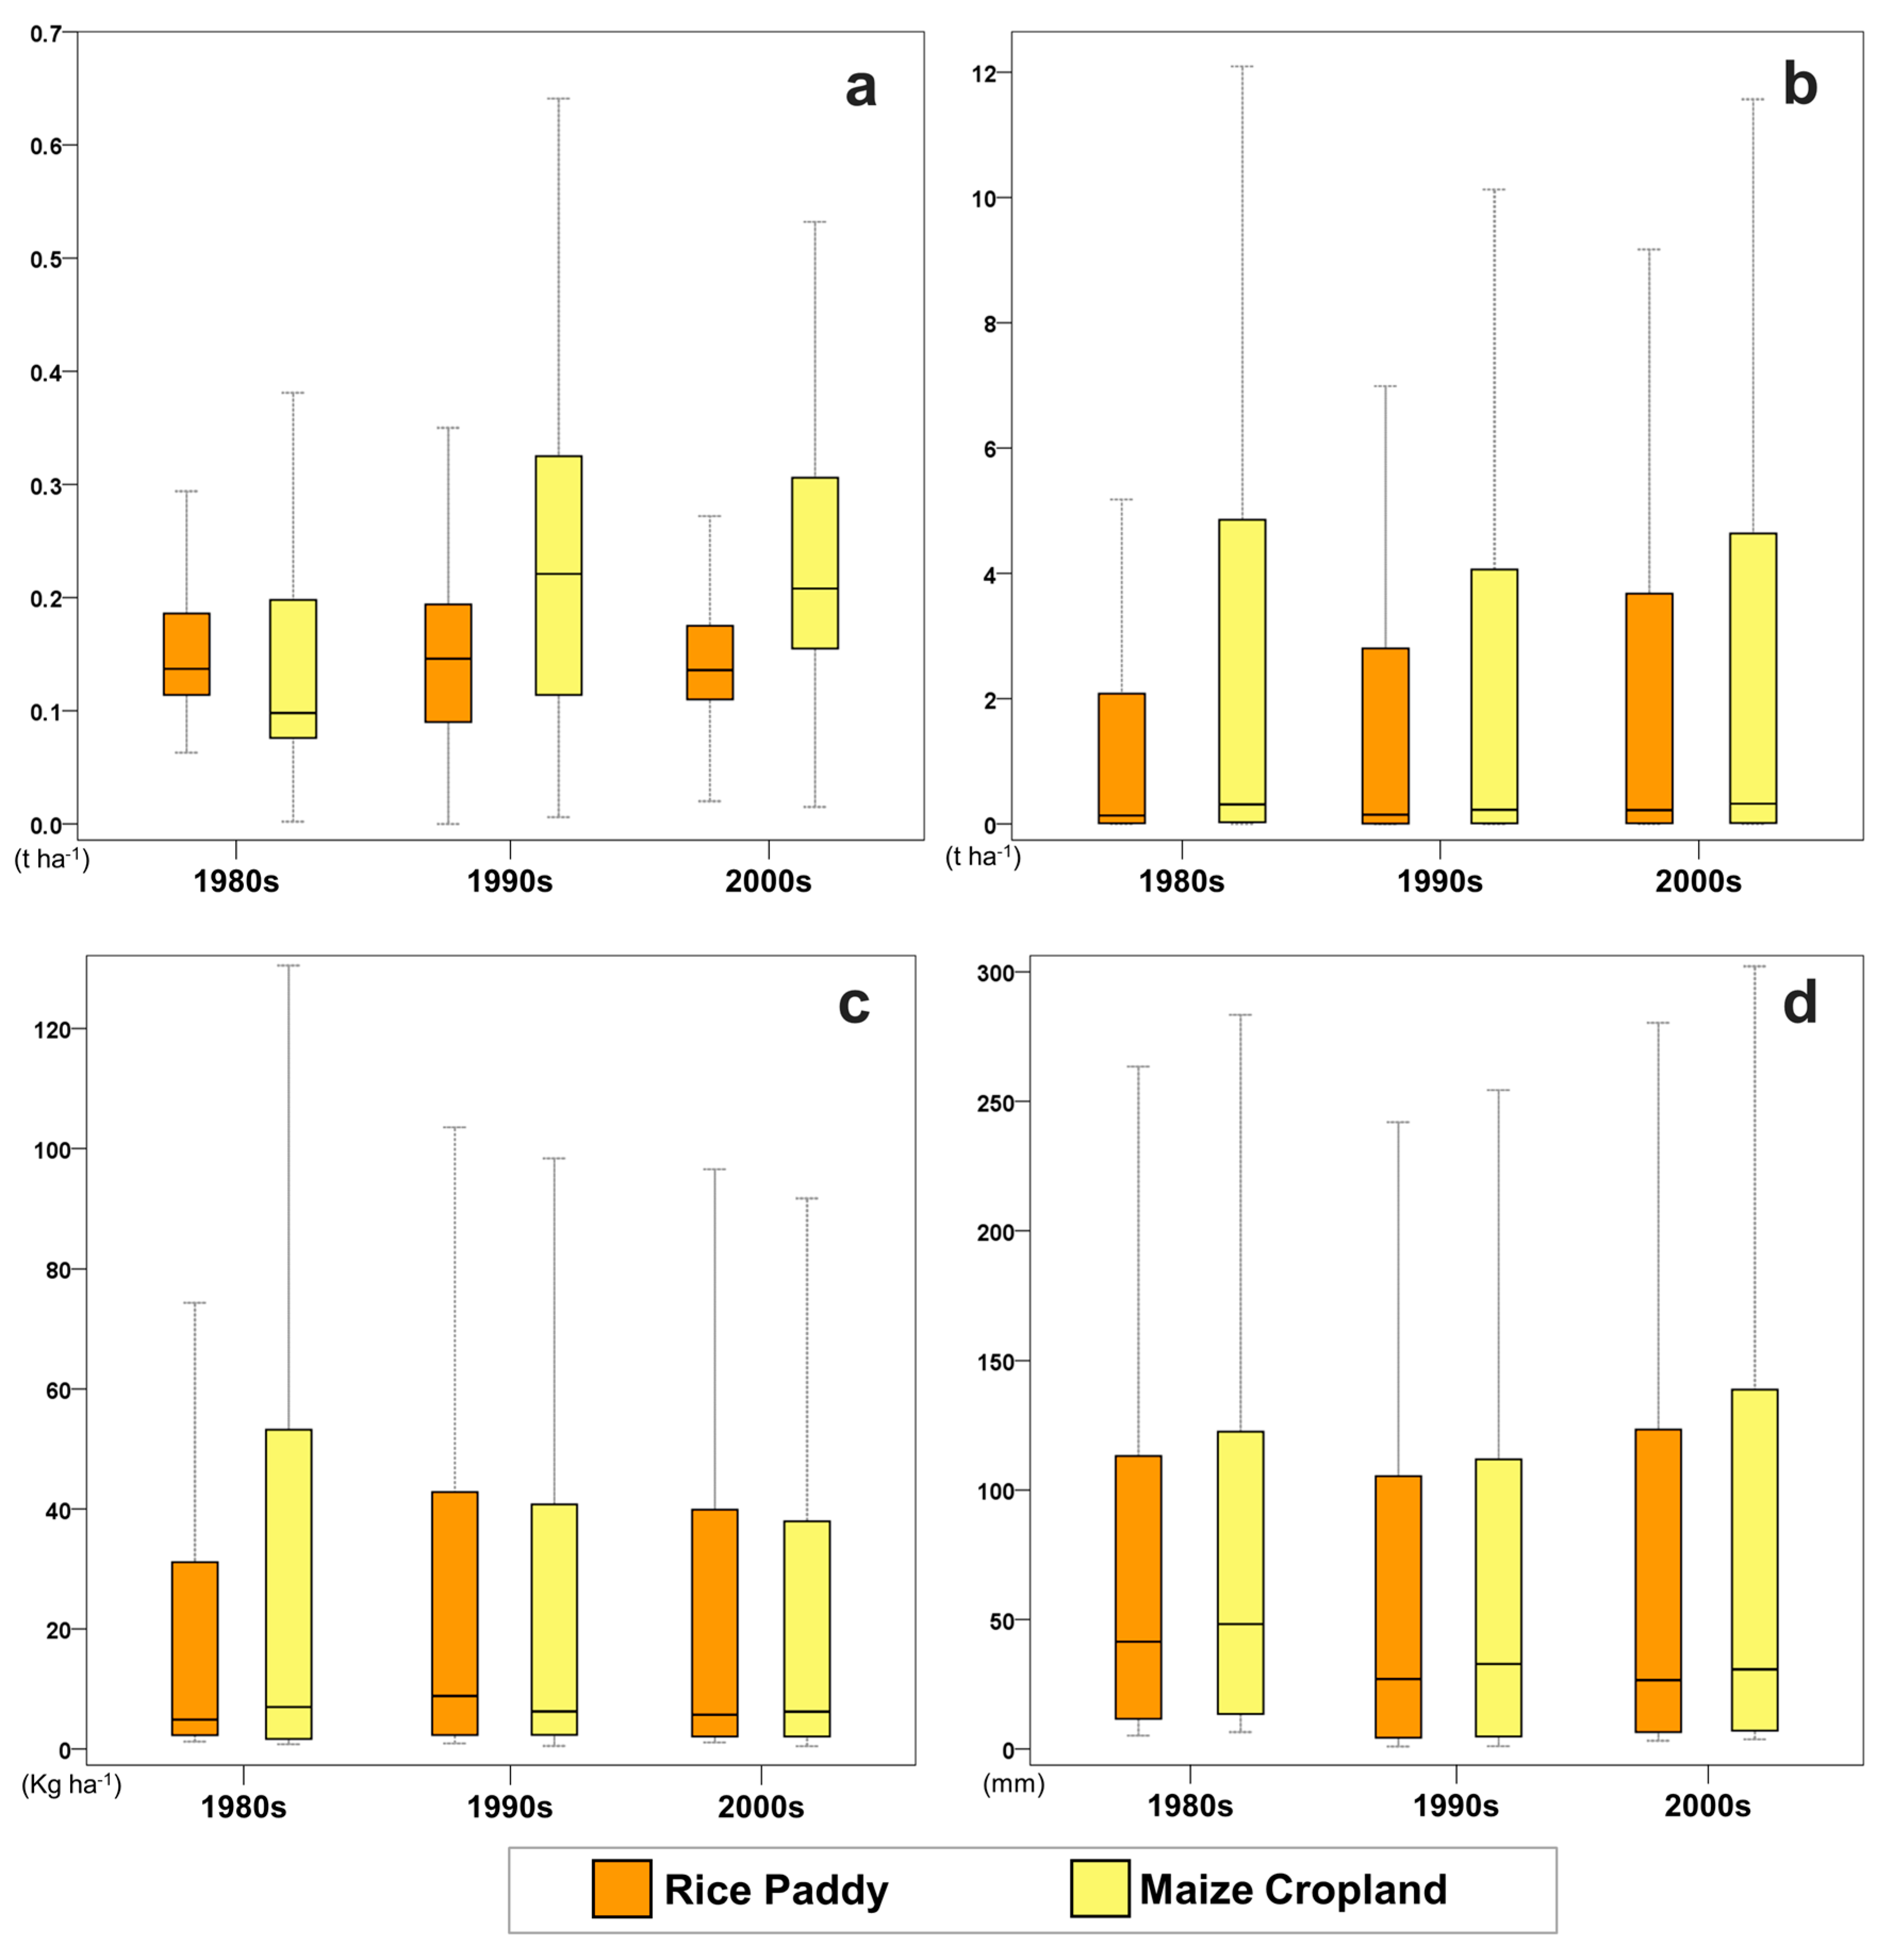
Figure 5.
Spatial change of agro-environmental variables in rice paddies: (a) Wind erosion; (b) Water erosion; (c) Organic carbon loss; and (d) Runoff.
Figure 5.
Spatial change of agro-environmental variables in rice paddies: (a) Wind erosion; (b) Water erosion; (c) Organic carbon loss; and (d) Runoff.

Figure 6.
Spatial change of agro-environmental variables in maize croplands: (a) Wind erosion; (b) Water erosion; (c) Organic carbon loss; and (d) Runoff.
Figure 6.
Spatial change of agro-environmental variables in maize croplands: (a) Wind erosion; (b) Water erosion; (c) Organic carbon loss; and (d) Runoff.

Figure 7.
Comparison of agro-environmental variables with original cropland and converted cropland in each crop: (a) Wind erosion; (b) Water erosion; (c) Organic carbon loss; (d) Runoff; (e) DEM; and (f) Slope.
Figure 7.
Comparison of agro-environmental variables with original cropland and converted cropland in each crop: (a) Wind erosion; (b) Water erosion; (c) Organic carbon loss; (d) Runoff; (e) DEM; and (f) Slope.
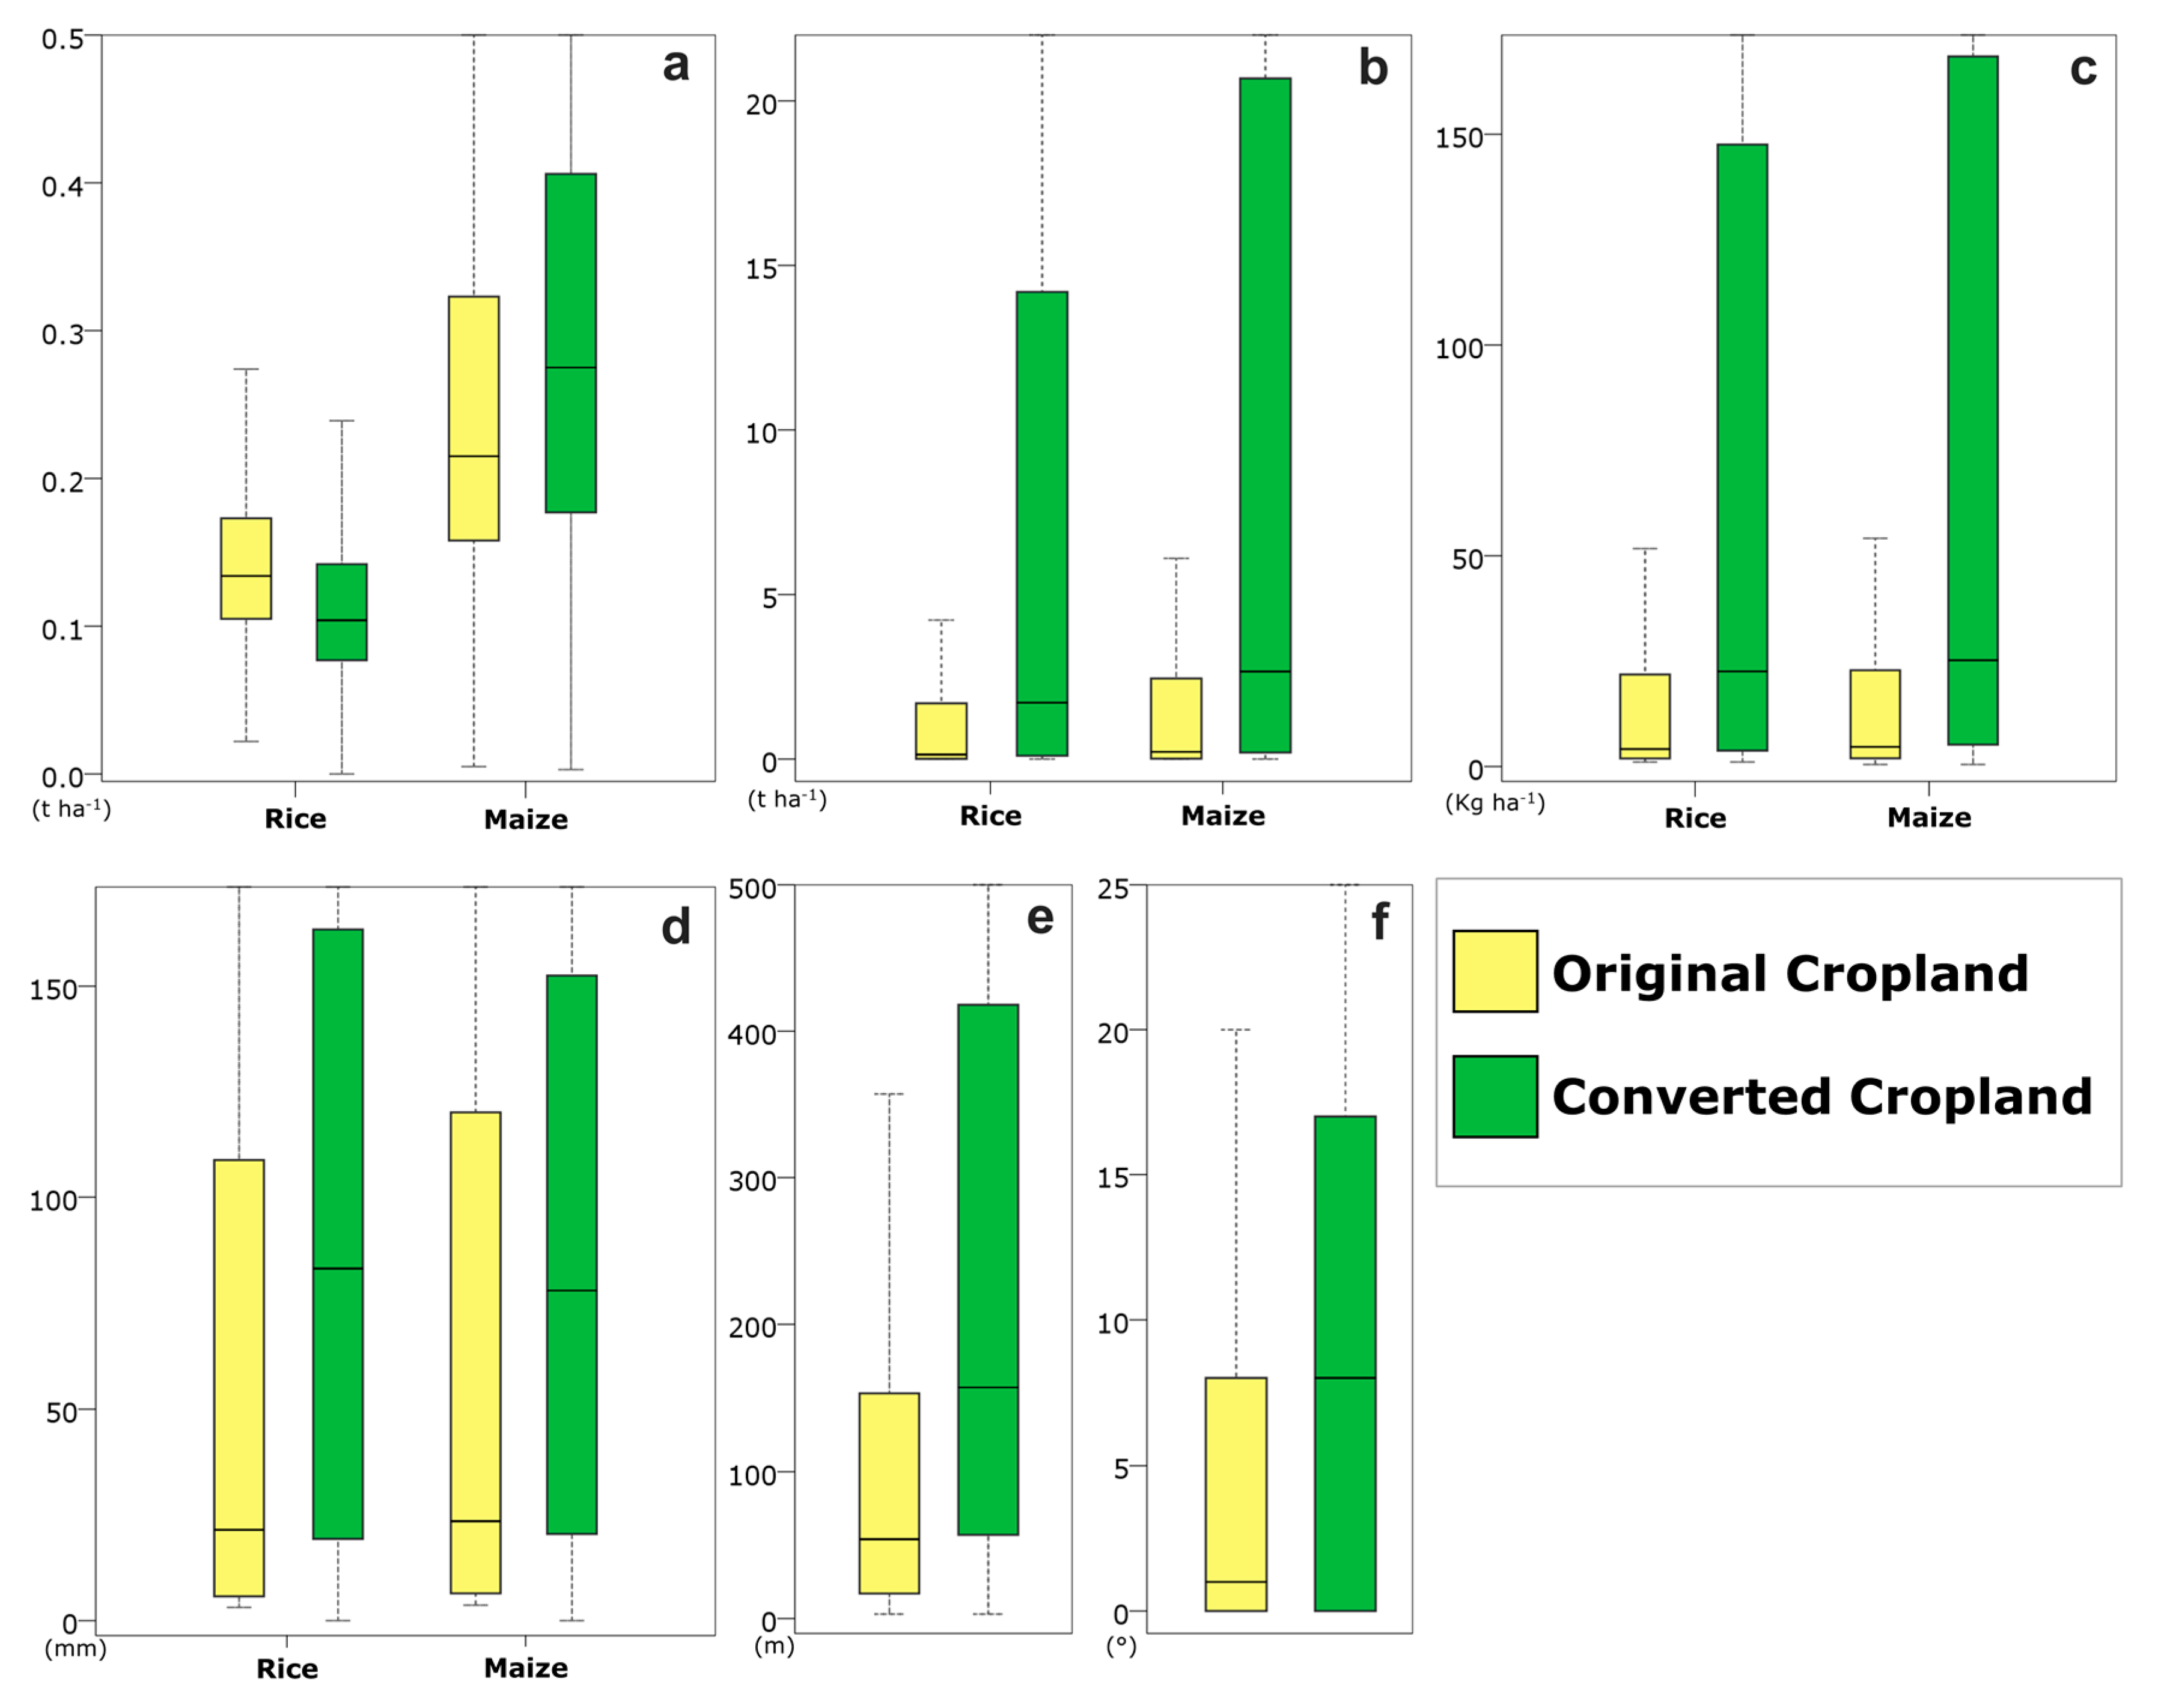
Figure 8.
Spatial extraction with original croplands and converted croplands using the main variables: (a) Organic carbon loss of rice paddies; (b) Runoff of rice paddies; (c) Water erosion of rice paddies; (d) Organic carbon loss of maize croplands; (e) Runoff of maize croplands; and (f) Wind erosion of maize croplands.

Table 1.
Deforestation matrix of North Korea.
| Deforestation Period | Changes from Forest to Other Land Cover (km2) | |||||
|---|---|---|---|---|---|---|
| Cropland | Grassland | Urban | Barren | Water | Total | |
| 1980s to 1990s | 2203 | 1319 | 65 | 124 | 22 | 3733 |
| 1990s to 2000s | 3569 | 67 | 89 | 107 | 131 | 3963 |
| Total | 5772 (75%) | 1386 (18%) | 154 (2%) | 231 (3%) | 153 (2%) | 7696 (100%) |
Table 2.
Cropland expansion matrix of North Korea.
| Expansion Period | Changes from Other Land Cover to Cropland (km2) | |||||
|---|---|---|---|---|---|---|
| Forest | Grassland | Urban | Barren | Water | Total | |
| 1980s to 1990s | 1848 | 595 | 62 | 130 | 23 | 2658 |
| 1990s to 2000s | 4845 | 1127 | 421 | 449 | 161 | 7003 |
| Total | 6693 (69%) | 1722 (18%) | 483 (5%) | 579 (6%) | 184 (2%) | 9661 (100%) |
Table 3.
Validation of the GEPIC results of runoff with GLDAS data.
| Year | GLDAS Runoff (mm) | GEPIC Runoff (mm) | RMSE | NSEC | RE (%) | ||
|---|---|---|---|---|---|---|---|
| Mean | SD | Mean | SD | ||||
| 2001 | 39.64 | 15.81 | 39.51 | 40.04 | 14.26 | −0.10 | 5.54 |
| 2002 | 18.17 | 17.39 | 56.25 | 53.59 | 32.95 | −3.99 | 53.74 |
| 2003 | 47.31 | 38.01 | 48.96 | 53.46 | 21.24 | −0.21 | 9.50 |
| 2004 | 49.73 | 25.57 | 18.95 | 20.82 | 18.29 | −0.69 | −14.94 |
| 2005 | 47.52 | 22.82 | 54.66 | 56.17 | 23.08 | −2.40 | 11.88 |
| 2006 | 47.40 | 42.51 | 47.20 | 54.01 | 8.10 | 0.18 | 4.57 |
| 2007 | 78.44 | 58.50 | 146.59 | 131.95 | 33.26 | −5.79 | 44.28 |
| 2008 | 37.62 | 19.65 | 61.46 | 60.77 | 16.23 | −2.70 | 28.91 |
| 2009 | 63.68 | 41.06 | 84.18 | 72.15 | 20.80 | −0.42 | 14.27 |
| 2010 | 82.47 | 45.96 | 160.83 | 145.10 | 46.89 | −2.53 | 32.09 |
| 2011 | 47.35 | 28.33 | 67.23 | 72.71 | 19.97 | −1.37 | 18.51 |
| 2012 | 75.02 | 39.10 | 128.33 | 115.98 | 38.86 | −4.85 | 37.80 |
| 2013 | 103.66 | 54.41 | 63.50 | 56.75 | 24.76 | −0.33 | −14.73 |
© 2017 by the authors. Licensee MDPI, Basel, Switzerland. This article is an open access article distributed under the terms and conditions of the Creative Commons Attribution (CC BY) license (http://creativecommons.org/licenses/by/4.0/).
Share and Cite
MDPI and ACS Style
Lim, C.-H.; Choi, Y.; Kim, M.; Jeon, S.W.; Lee, W.-K. Impact of Deforestation on Agro-Environmental Variables in Cropland, North Korea. Sustainability 2017, 9, 1354. https://doi.org/10.3390/su9081354
AMA Style
Lim C-H, Choi Y, Kim M, Jeon SW, Lee W-K. Impact of Deforestation on Agro-Environmental Variables in Cropland, North Korea. Sustainability. 2017; 9(8):1354. https://doi.org/10.3390/su9081354
Chicago/Turabian StyleLim, Chul-Hee, Yuyoung Choi, Moonil Kim, Seong Woo Jeon, and Woo-Kyun Lee. 2017. "Impact of Deforestation on Agro-Environmental Variables in Cropland, North Korea" Sustainability 9, no. 8: 1354. https://doi.org/10.3390/su9081354
Note that from the first issue of 2016, this journal uses article numbers instead of page numbers. See further details here.