Responses of Agroecosystems to Climate Change: Specifics of Resilience in the Mid-Latitude Region


1
Center of Excellence in Earth Systems Modeling and Observations, Chapman University, Orange, CA 92866, USA
2
Department of Environmental Science and Ecological Engineering, Korea University, Seoul 02841, Korea
3
Department of Atmospheric and Oceanic Sciences, University of California, Los Angeles, CA 90095, USA
*
Author to whom correspondence should be addressed.
Sustainability 2017, 9(8), 1361; https://doi.org/10.3390/su9081361
Submission received: 30 April 2017
/
Revised: 17 July 2017
/
Accepted: 28 July 2017
/
Published: 2 August 2017
(This article belongs to the Special Issue Regional Sustainability Research Network: Selected Papers from the Expert Group Meeting on Achieving the Sustainable Development Goals with Water–Food–Ecosystem Resilience in the Mid-Latitude Region)
Abstract
:This study examines the productivity and resilience of agroecosystems in the Korean Peninsula. Having learned valuable lessons from a Chapman University project funded by the United States Department of Agriculture which concentrated on the semi-arid region of southwestern United States, our joint Korea—Chapman University team has applied similar methodologies to the Korean Peninsula, which is itself an interesting study case in the mid-latitude region. In particular, the Korean Peninsula has unique agricultural environments due to differences in political and socioeconomic systems between South Korea and North Korea. Specifically, North Korea has been suffering from food shortages due to natural disasters, land degradation and political failure. The neighboring developed country, South Korea, has a better agricultural system but a low food self-sufficiency rate. Therefore, assessing crop yield potential (Yp) in the two distinct regions will reveal vulnerability and risks of agroecosystems in the mid-latitude region under climate change and variability and for different conditions.
1. Introduction
The mid-latitude region (MLR), broadly defined as the region between the 30- and 60-degree parallels, about 6700 km wide, is of critical concern for many socioeconomic and Earth system science reasons as it contains much of world’s population and industrial activities. In climate studies, scientists examine coupled Earth systems, how they affect changing global climate and how in turn they are affected by the global climate. However, when we examine socioeconomic aspects of the Earth and human societies, relevant coupling mechanisms, etc., then local conditions become necessary in order to extract meaningful results. The issue then becomes, what fine scales should we use to study such coupled systems? Clearly, continental scales are too coarse. We also have latitudinal variations, even for the same country, which cannot be summarized together in a meaningful way. As such, the MLR presents great opportunities to study a large swath of the Earth, without getting overwhelmed by either fine processes or broad categorization. The MLR provides a reasonable way to examine the Earth at intermediate scales and obtain quick outlook of similarities and differences between different regions. As such, the MLR involves different countries but with certain broad similarities and considerations involving global carbon budget, climate change adaptation/mitigation, and sustainable development in terms of food, water, and ecosystems [1,2].
Studying resilience in the MLR can allow us to identify primary factors of stress as well as resilience. Often, climate change resilience in agriculture sector is challenged by low precipitation, low cropland productivity, desertification, loss of biodiversity, different political and economic systems with associated conflicts that can lead to long-lasting conflicts at regional and even global levels.
Resilience of ecosystems involves understanding the effects of severe weather, long-term droughts and hazards such as fires. Desertification is a particular important driver of vulnerability of ecosystems and human societies in the MLR, in addition to the growth of megacities and associated pollution affecting pristine ecosystem areas, loss of forested areas and degradation of agricultural productivity. MLR is particularly important in agriculture since principal agriculture-producing countries, including the United States, China, and Russia, are in the MLR. Thus, climate change in the MLR will result in substantial impact not only for agricultural systems in MLR but also for food security worldwide.
The MLR includes a temperate climate zone and divided diverse climate regions as well as diverse land cover types depending on the climate classifications (such as deserts, semi-arid regions, Mediterranean climate, large forested areas, coastal regions, agricultural regions, etc.). The MLR has one unifying social characteristic: it contains many urban centers and most of the megacities of the world. Roughly half of the population of the Earth lives in the MLR, with a combined GDP being a large fraction of the global value [3,4]. Despite the socioeconomic and cultural diversity, the MLR shares some common elements and often similar climate characteristics. Regions within the MLR are facing similar challenges such as increased water and food stress, as well as land degradation and desertification [5,6,7]. We note that there is another MLR, namely the one located in the Southern Hemisphere. Given though that the Southern Hemisphere contains percentage-wise more ocean bodies, it is natural to first concentrate on the (northern) MLR.
In this study, we examine agricultural productivity, resilience and changing climate conditions for two different countries within the MLR: The Republic of Korea (or South Korea, SK thereafter) and the Democratic Peoples’ Republic of Korea (or North Korea, NK thereafter). The size of the Korean Peninsula is relatively small (221,000 km2) but it contains most of the climate types in the MLR, namely continental, subtropical and subarctic climate. Considering the agricultural productivities of different climate zones in the MLR is beyond this study. However, the results applied to the Korean Peninsula will represent most of the climate types found in the MLR. In addition to the diverse local climate in the Korean Peninsula, the socioeconomic factors of the two countries are as diverse as it can be for adjacent countries which are similar in terms of language, racial characteristics and history. Therefore, understanding resilience in the Korean Peninsula can provide useful insights and lessons learned for other regions in the MLR.
Resilience in the MLR applied to the Korean Peninsula involves several considerations for agricultural system responses to future climate variability. There are several modeling and data tools that can be brought into such considerations, including global models, downscaling to regional levels, statistical analyses, current observations and past satellite observations. Challenges facing the Korean Peninsula include degradation of forests (mainly in NK) [8], growth of megacities (mainly in SK), droughts, famines (in NK) [9], severe weather and hazards such as fires and floods. Global atmospheric phenomena can affect the weather in the Korean Peninsula.
The Korean Peninsula has unique agricultural environment due to the differences of political and socioeconomical system between SK and NK. The northern populations have been suffering from lack of food supplies caused by natural disasters, land degradation and political failure. The neighboring developed country SK has a much better agricultural system but very low food self-sufficiency rate (around 1% of maize). Maize is an important crop in both countries since it is staple food for NK, and SK is the number-two maize importing country in the world after Japan.
Policy makers in SK have maintained their food self-security goal [10,11]. Food self-sufficiency is a politically important objective related to national security by reducing vulnerability from international supply disruptions and excessive reliance of food supplies from other countries [12]. However, agroeconomists have criticized the food self-sufficiency policy due to the inefficiency, distortion of the market and the possible detriment to the consumer [13]. Assessing the SK’s potential crop production under climate change will provide crucial information for maximizing benefit from food self-sufficiency policy and minimizing risks from over-reliance on trade [14].
Although maize is an important crop in both SK and NK, few studies have been done on maize compared to rice in Korean Peninsula. In this study, we select maize for future agricultural productivity for the above reasons. First, we validate crop models and estimate the yield change under future climate change scenarios. We then examine possible adaptation strategies. Finally, we discuss resilience and sustainability in these two countries having distinct socioeconomic conditions and examine the implication for other countries in the MLR.
2. Methodology
In this study, we have employed the concept of “yield gap” to assess climate change impacts on the crop productivity in the Korean Peninsula. Yield gap is defined as the difference between the actual yield (Ya) and Yp [15]. Yp is the maximum yield that can be achieved in current technology and optimal management practices and determined only by climate variables with nonlimiting nutrients, water, and controlled biotic stresses. We utilize multiple process-based crop models for regional scale assessments to evaluate maize Yp and assess the model uncertainties, models which include the Environmental Policy Integrated Climate (EPIC) model, the GIS-based EPIC model (GEPIC), and the Agricultural Production Systems sIMulator (APSIM) model that has capability of regional scale expansion (ApsimRegions). First, we evaluated each crop model for three years from 2012 to 2014 using reanalysis weather data (RDAPS; Regional Data Assimilation and Prediction System produced by Korea Meteorological Agency) and observed yields. Each model’s performances were compared over the different regions in the Korean Peninsula having different local climate characteristics. We have conducted assessment of future changes of climate variables in the Korean Peninsula and their impact on maize productivity using a multi-crop model multi-Regional Climate Model (RCM) super ensemble method. Lastly, we evaluated effects of the shifting planting date as one of the adaptation strategies to increase climate change resilience in the future.
2.1. Climate Data
Two types of meteorological data were employed in this study. RDAPS reanalysis data, produced by the Korean Meteorological Administration (KMA), are utilized to validate the crop models for three years from 2012 to 2014. The data are of 12 km and 6 h resolutions in space and time, respectively. For the climate change impact assessment, we used three RCM products (HadGEM3-RA, RegCM4 and YSU-RSM) from CORDEX (COordinated Regional Downscaling Experiment) East Asia (https://cordex-ea.climate.go.kr) (Table 1). The domain areas are defined in an equidistant longitude/latitude projection with 0.5-degree resolution in regular coordinates. Twenty years of a historical period was selected (from 1981 to 2000), as well as a period in the future (from 2031 to 2050). Note that only the RCP 8.5 scenario is selected among the RCP scenarios since the differences between scenarios are not significant in mid-century.
2.2. Observational Data
The observed maize yield data are used for crop model validation for three years in the period 2012 to 2014. The information applied to the SK is well-documented in the Korean Statistical Information Service (KOSIS; http://kosis.kr). Any statistical data from the North Korean government had limited availability. For the two years from 2012 to 2013, there are special reports by the Food and Agriculture Organization of the United Nations/World Food Programme (FAO/WFP) Crop and Food Security Assessment Mission to the Democratic People’s Republic of Korea [19,20]. During this period, the observed yield data are available at the province level of NK. For the validation procedure for year 2014, we employed FAO Global Information and Early Warning System (GIEWS) Update [21], but this data has only national-level data.
The selecting agricultural area in the Korean Peninsula used data of GlobeLand30 produced by National Geomatics Center of China (NGCC) (http://www.globallandcover.com). Based on the land cover data, a grid of regularly spaced 2716 points were used to cover the study area.
2.3. Crop Model Description
Process-based crop models have been widely used in a number of recent climate change impact studies (e.g., [22]). However, model uncertainties exist at every stage of crop model simulation like other numerical models, and it is critical to quantify them for applications by end-users and stakeholders. Recent studies attempted to evaluate such uncertainties by using multiple models and/or statistical methods [23,24,25]. Multi-model ensemble approaches have been widely used to assess model uncertainties in climate modeling community but only a few studies have been performed in crop modeling studies, such as the Global Gridded Crop Model Intercomparison (GGCMI) project [24,26]. Multi-model ensemble methods show clear advantages over single-model approaches with smaller uncertainties and explicit estimates of the range of uncertainties [24]. With above reasons, we employed three process-based crop models (ApsimRegions, EPIC and GEPIC) were used in this study (Table 2).
The Agricultural Production Systems sIMulator (APSIM) model (http://www.apsim.info) simulates specific crop yields by calculating interactions among plants, animals, soil, climate, and management practices [27,28,29]. APSIM has been widely used for various regions of a wide range of environmental characteristics with multiple field experiments [30,31,32,33,34]. The model has been used to study the potential impact of climate change on crop productivity [35,36,37,38,39]. APSIM is well documented, open source, scriptable, and modular structure masks makes it possible for scaling up to regional domains. In this study we utilized ApsimRegions, which has extended the point-specific APSIM model to regional spatial scales (http://www.apsimregions.org) [40].
The EPIC model was developed to assess soil erosion and soil productivity, followed by a module on plant growth and hydrological parameters [41,42]. The model has been renamed the Environmental Policy Integrated Climate model (EPIC) with the addition of environmental assessment functions such as pesticides and water quality.
The EPIC model simulates crop growth using energy and biomass on a daily basis [41]. The potential biomass accumulation is calculated using climate variables such as solar radiation and crop-specific biomass–energy conversion rates. Plant stress variables (water, nutrient, temperature, aeration, and salinity) influence the decrease of the potential biomass. Crop yields are estimated based on crop harvest index and actual biomass accumulation [43].
The EPIC model has been successfully applied on crop productivity in East Asia [44]. In this study, the model was calibrated for the Korean Peninsula. Some of key maize parameters were modified setting through calibration; the biomass–energy ratio was set at 30 kg MJ−1, the harvest index at 0.55 mg mg−1, the optimum temperature at 25 °C, 10 °C, and the potential heat unit (PHU) range from 1300 to 1500 °C, depending on the grid cell specific climate.
We used the modified GEPIC model, which incorporates a Geographical Information System (GIS) with the EPIC version 0509 for spatially explicit simulations [45,46]. The GEPIC (GIS-based EPIC) framework integrates and connects the EPIC model with GIS through data exchange, and enables GEPIC to use all the functions of the EPIC model. GEPIC was widely used for modeling crop growth, crop water use, and agroenvironmental externalities over large areas in the last decade [44,45,47].
2.4. Experimental Design
A number of previous climate impact studies have used fixed sowing date for the entire analysis period because of the lack of relevant data. The actual sowing dates not only change every year but are also highly dependent on geographical locations. Maize productivity is highly sensitive to the planting dates but the historical planting data are not available in the study domain. Recently, Myoung et al. has pointed out the importance of the proper sowing date in climate change impact studies [38]. In this study, we have calculated the optimal planting dates at each point using Monte Carlo simulations for maximum Yp to estimate future planting date changes. This was done by simulating yields at each grid point with 10 different dates in one-week intervals from 22 March to 1 June, resulting in 10 separate runs for every year over the 21-year period. The planting dates that generated the maximum Yp were then identified as an optimal planting date for each grid point and for each year. More detailed information on the optimal planting date can be found in [39].
The HC27 generic soil profiles database was used for soil type data at each grid point [48,49]. HC 27 soil profiles have been widely used in regional and global crop modeling studies [39,50,51,52].
In addition to the soil type, management decisions such as cultivar, irrigation, and planting practices play an important role in crop yields [53]. Optimal management practice setups were applied in this study to minimize crop stress through management practices and follow the definition of Yp. The cultivar coefficients in the crop models were calibrated using year 2010 data of popular waxy corn cultivar Mibaek No.2 from Maze Experiment Station of Gangwon-do Agricultural Research & Extensions Services in South Korea (http://www.ares.gangwon.kr/hb/en).
Irrigation was applied to maintain the 95% water-holding soil capacity following previous studies (e.g., [54]). Unlimited use of nitrogen fertilizer was also assumed. Other management practices in the region were obtained from Experiment Station of Gangwon-do Agricultural Research & Extensions Services in South Korea, including specific row spacing, planting depth, and crop density.
3. Results
3.1. Crop Model Validation
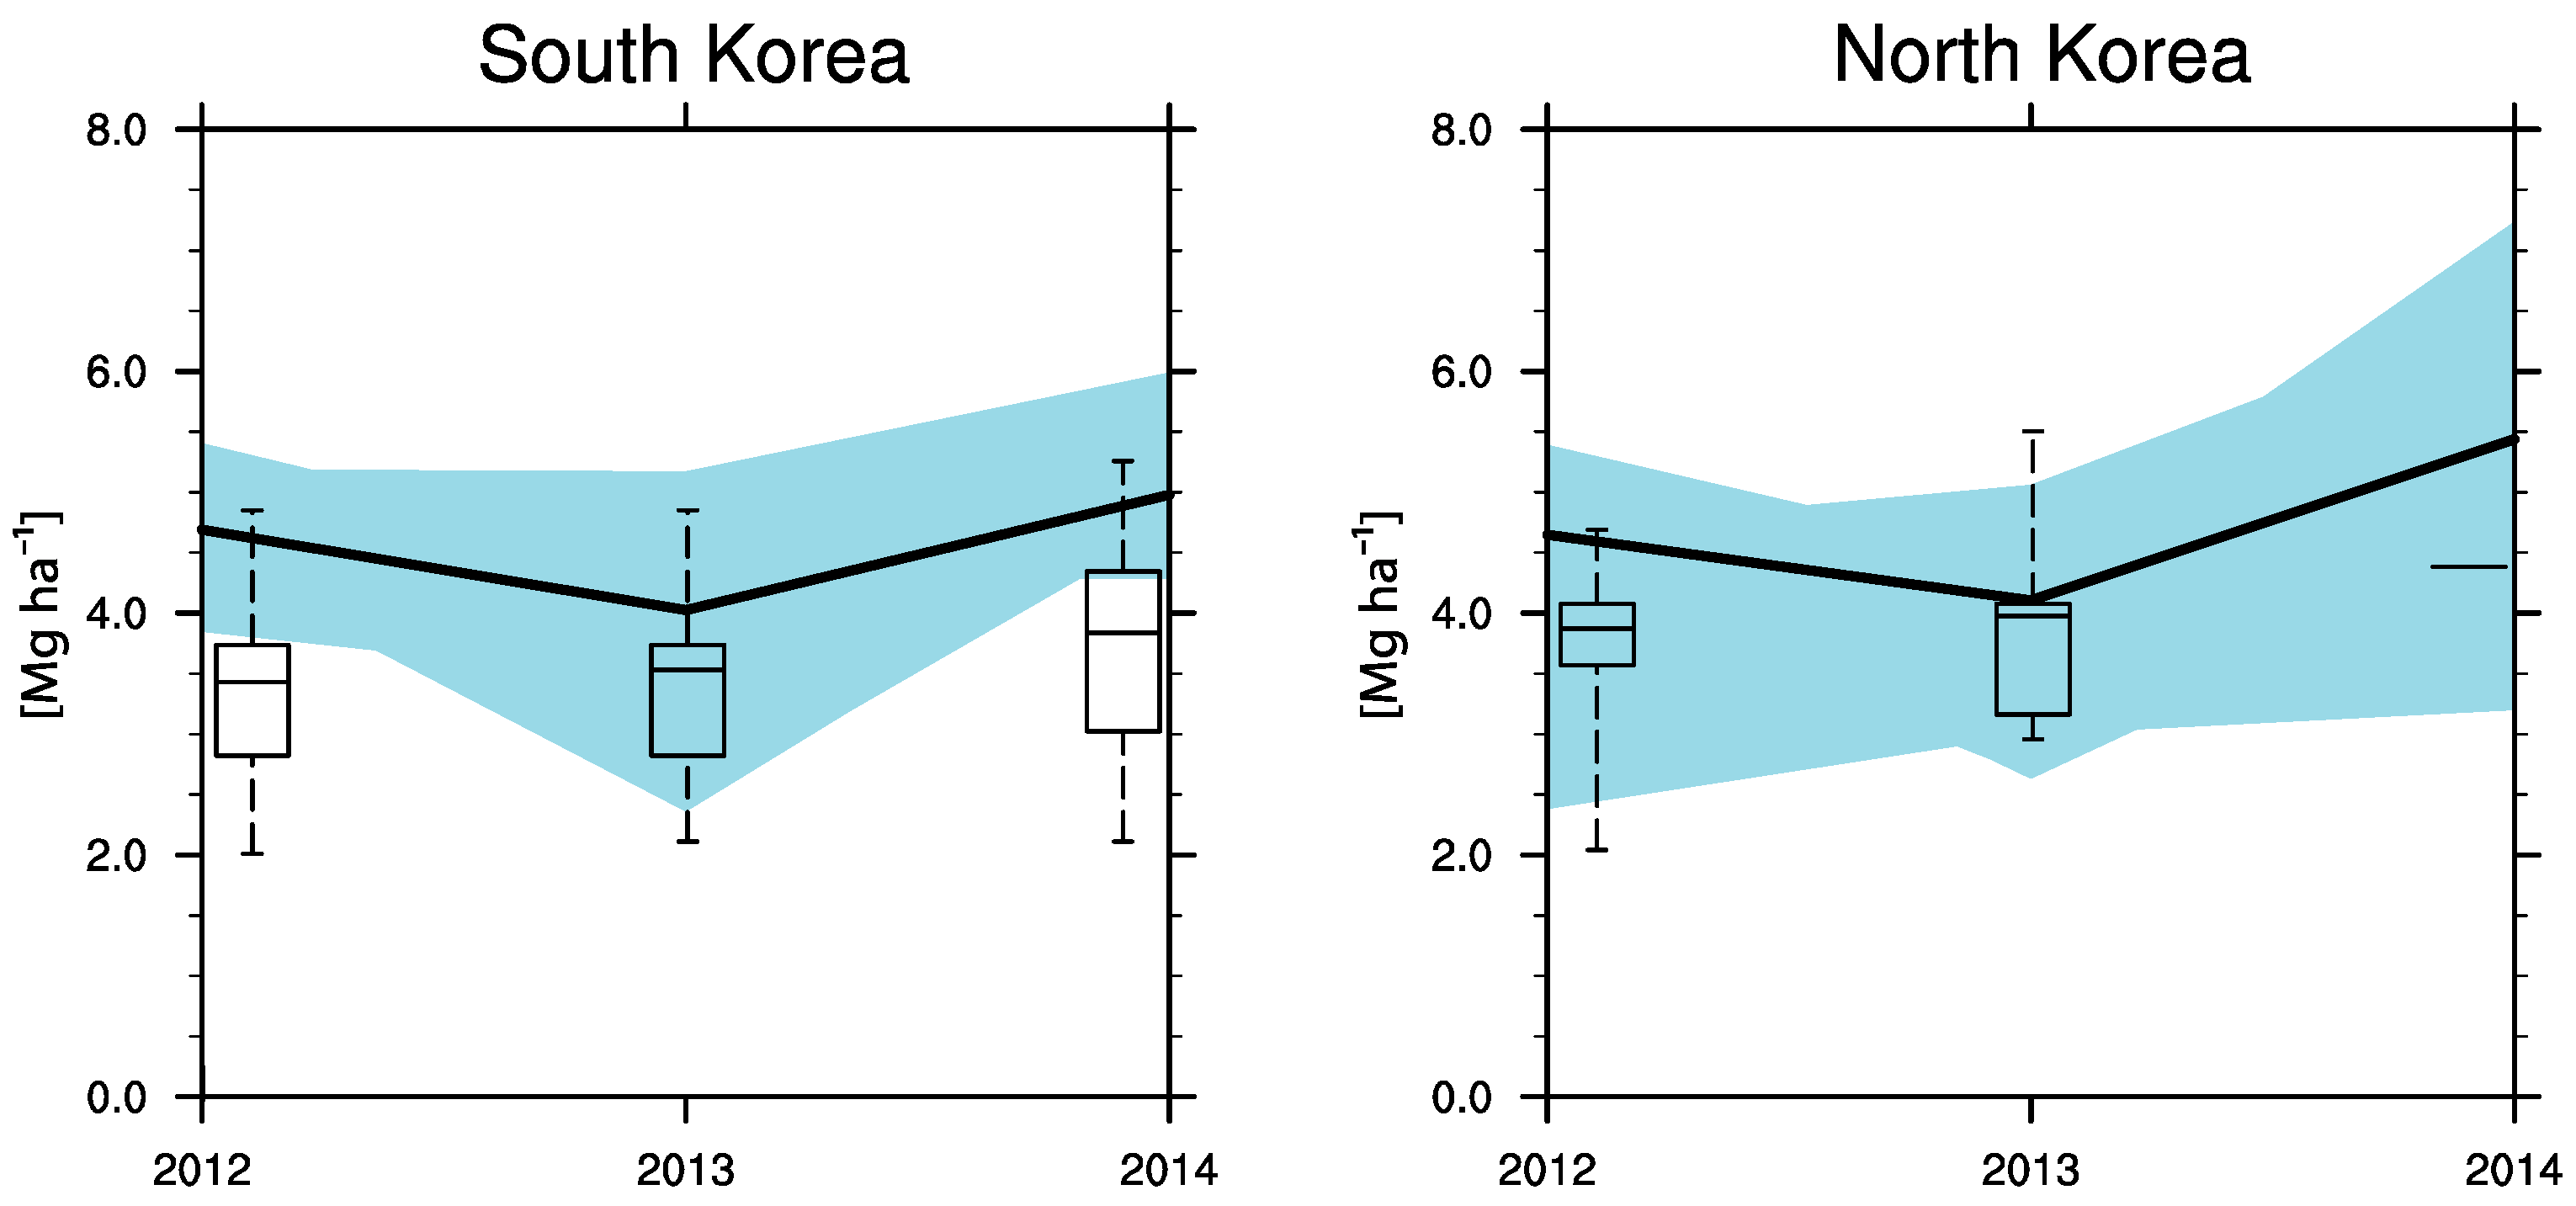
The calibrated crop models were validated using RDAPS weather data and observed yields for three years (2012–2014) in the entire Korean Peninsula (Figure 1). The simulated Yp was evaluated using the province-level Ya records from KOSIS for SK and FAO/WFP for NK. Figure 1 shows that the averaged Ya was about 75.5% for SK and 84.6% for NK of the averaged Yp. Overall, the average ratio was 80% and matched the results in a previous study of Lobell et al. (2009) which concluded that 80% is a typical value under irrigated systems in a developed country [55]. The results suggest that the crop models were estimated Yp reasonably well for the study region.
3.2. Future Climate Change in the Korean Peninsula
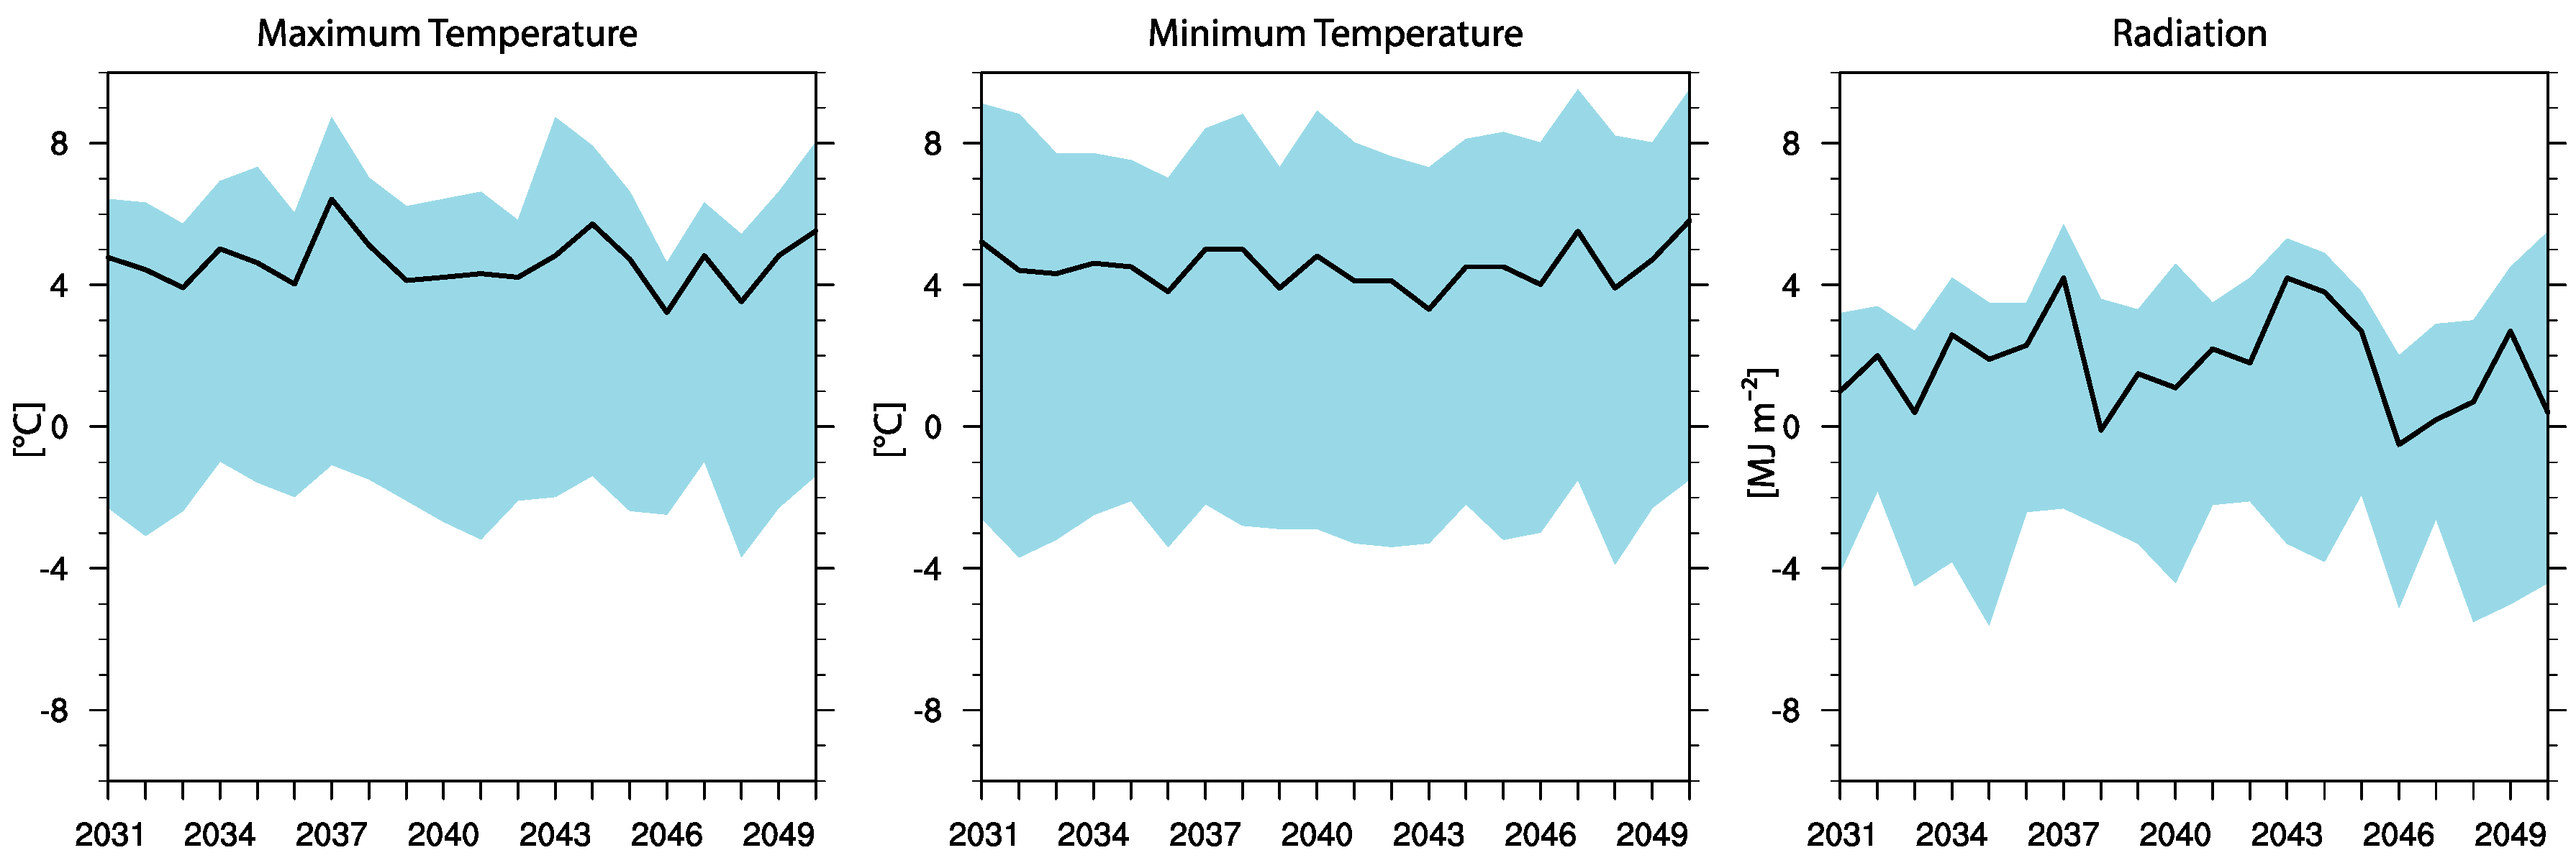
All three RCM results consistently show about 4 °C increases in both daily maximum temperature (Tmax) and minimum temperature (Tmin) in the Korean Peninsula during the growing season (April to July) in the future period (2031–2050) relative to the historical period (1981–2000) (Figure 2). Incoming solar radiation (Rad) is projected to slightly increase for the future period, but shows strong interannual variations because of the changes in cloud cover.
The temperature increases in the mid-century period are consistent with numerous previous climate change studies (Figure 2). The changes of the climate variables show a heterogeneous horizontal distribution (Figure 3). The projected temperature increases are slightly larger for NK than for SK. The east coast of NK shows the highest temperature increase in the Korean Peninsula. Incoming solar radiation is increased over most of the southern and eastern coastal region in the Korean peninsula. This is related with the amount of cloud cover change in the future and looks like related with the temperature increase in the southern and eastern coastal region. The similar pattern between radiation and temperature change imply that the cloud cover is affected on horizontal distribution of the temperature change.
3.3. Projected Yield Potential (Yp) Changes
Climate variables are one of the most important factors on agricultural productivity [56]. The previous section indicates that climate variables will significantly change in the next 50 years in the Korean Peninsula. To evaluate the future changes of the climate variables on the Yp, we have employed process-based crop models.
A numerical model has its own characteristics such as systematic model bias. That does not necessary mean that the model is not correctly representing the physical phenomena. In climate studies, significant efforts have been devoted to estimate model uncertainties to deliver the information to the stakeholders with greater confidence [57]. Studies on climate change impact assessments for the agricultural sector have used widely adopted ensemble methods to reduce model uncertainties [24,26].
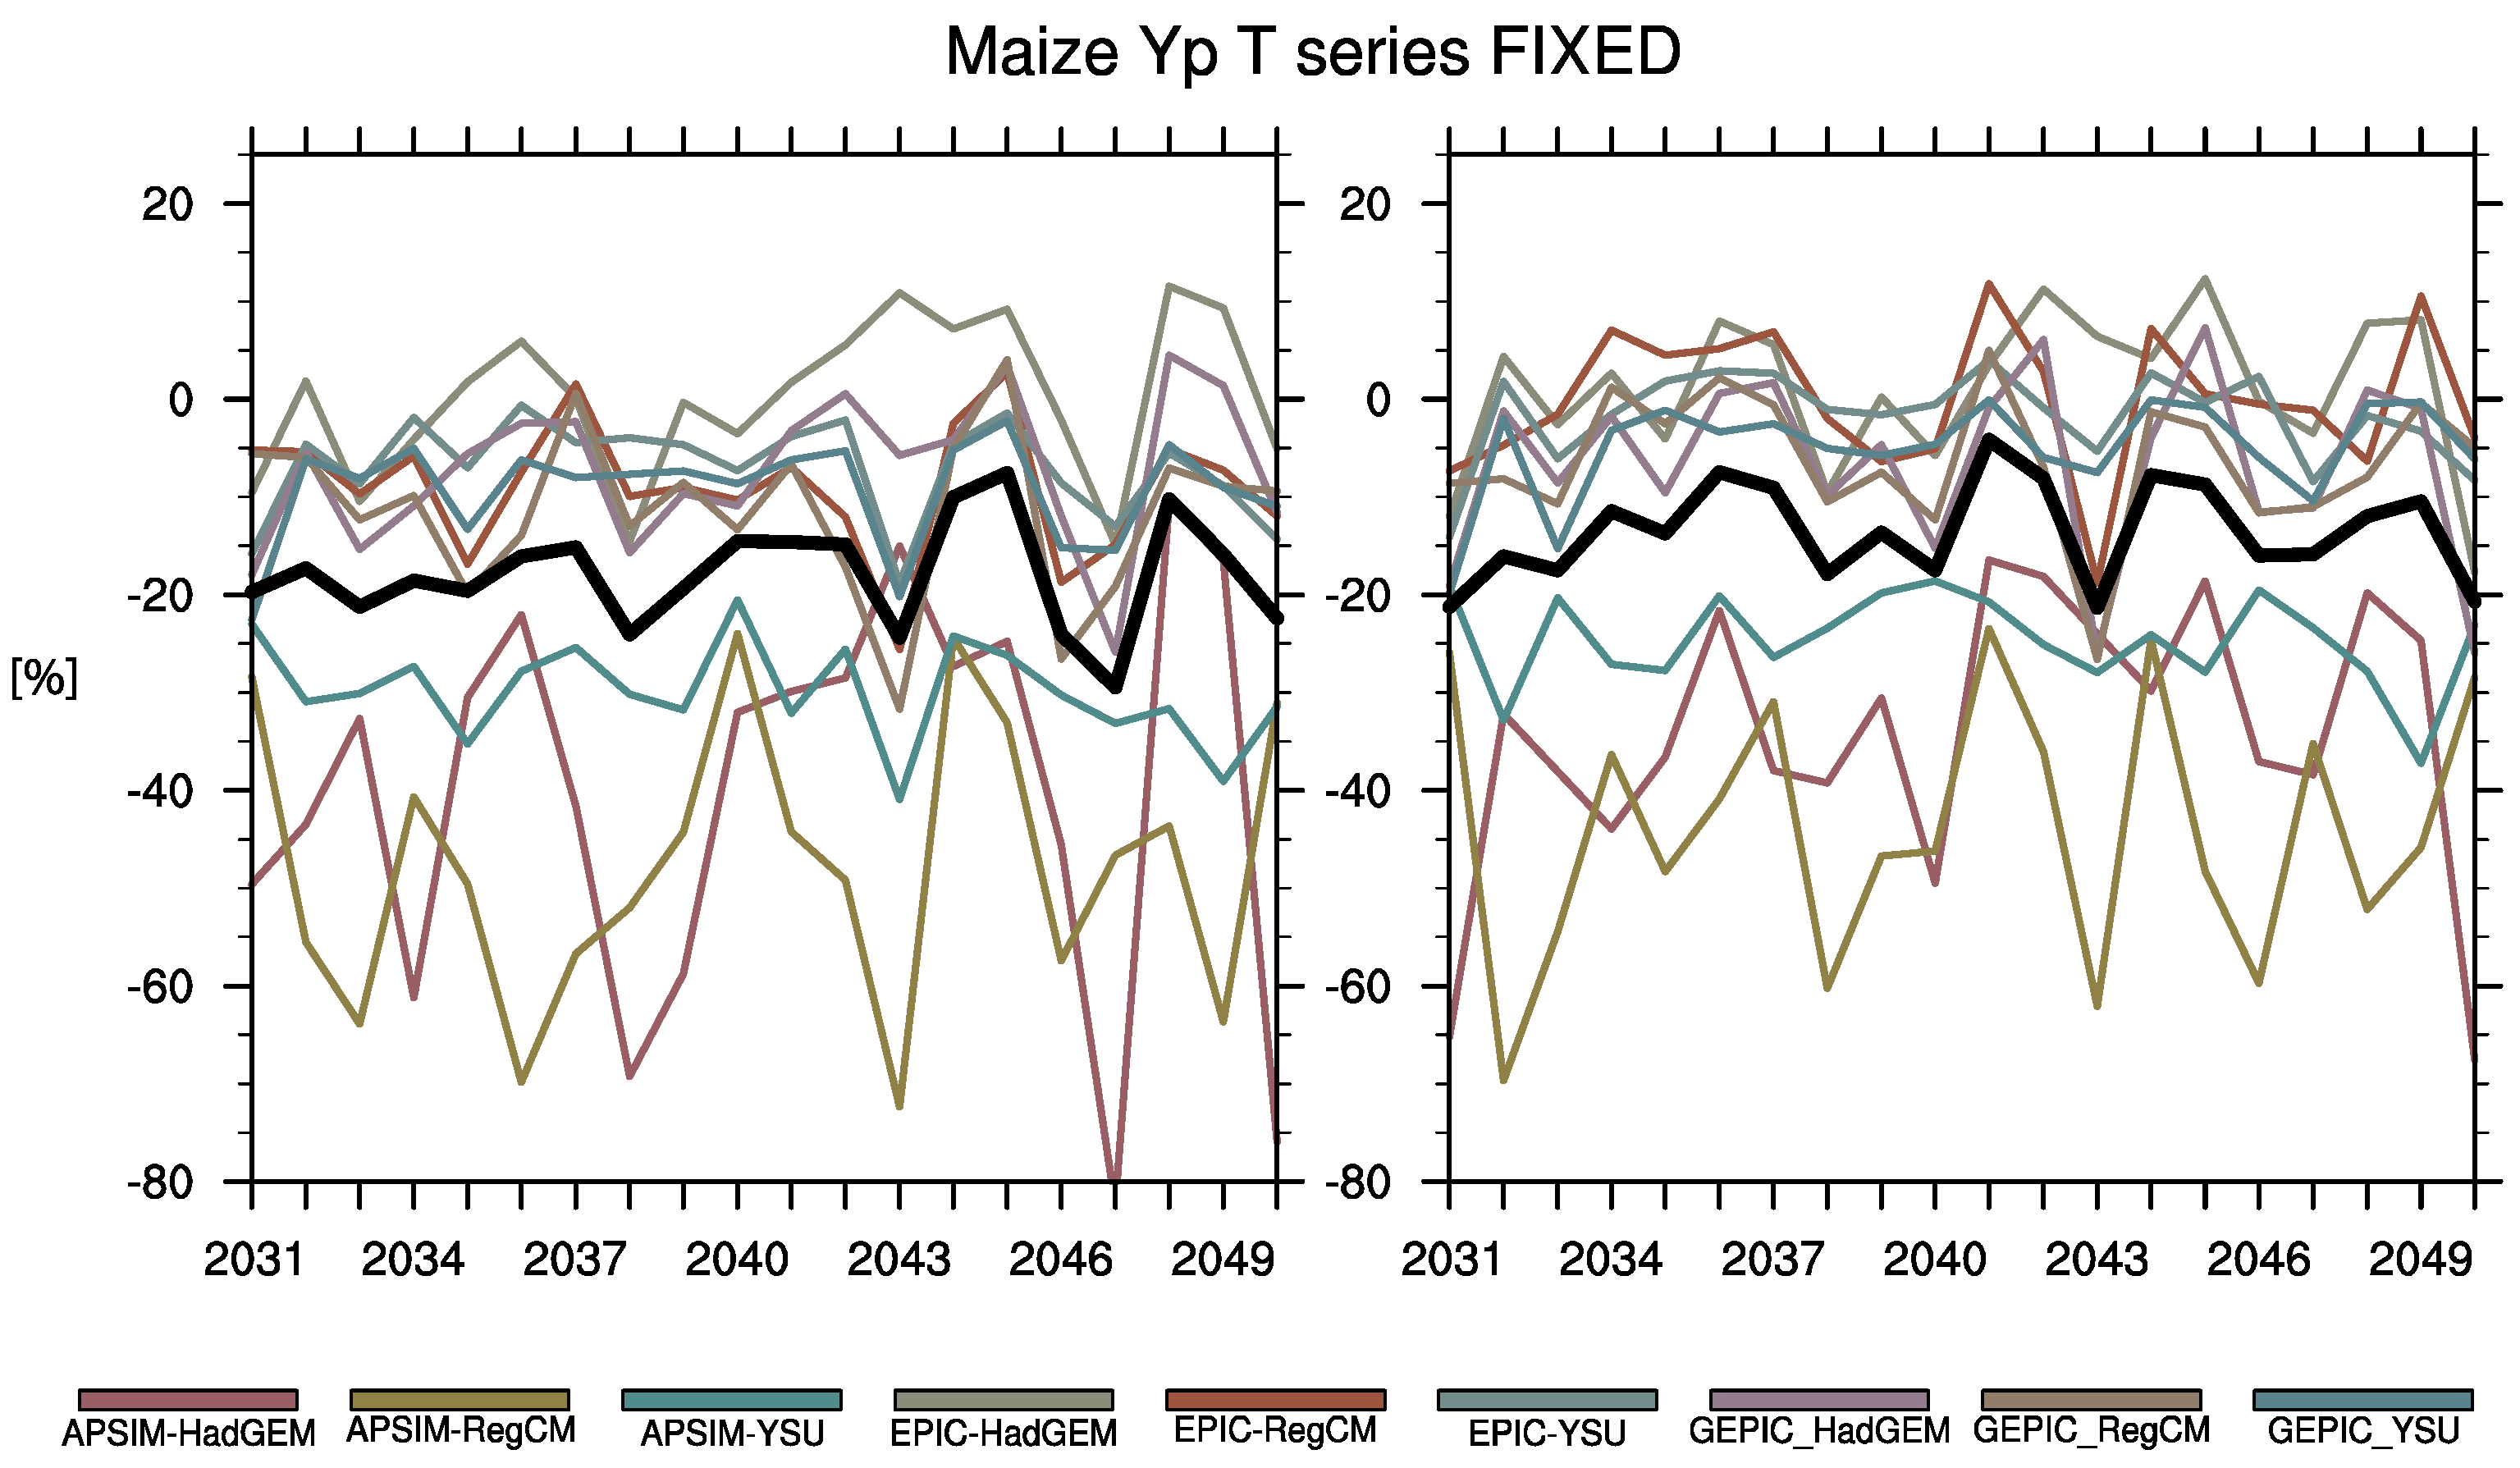
Multi-RCM and multi-crop model ensemble results indicate about 17.6% and 13.11% decrease of maize Yp in SK and NK, respectively, compared to the future projection based on RCP8.5 scenario (Figure 4). The significant lower Yp in the future is mainly due to the higher Tmax and Tmin over the Korean peninsula under future climate. Maize is highly sensitive to maximum temperatures and does better in cooler climates (e.g., optimal temperature in phenological phases is about 30 °C) [58]; thus increased temperature adversely affects the yield potential. Yp changes in SK is higher than NK. The NK has lower averaged temperature due to the higher latitude and mountainous terrain characteristics. The increased temperatures in the future will be more beneficial especially in places where there will be lower yields due to the lower temperature. The high elevation region in the northeastern region of NK shows increase of Yp (not show here). This is not only averaged temperature but also more frequent extreme events can contribute to the lower yield with higher chance of above lethal temperature of the maize [39].
3.4. Sensitivity Test
The future Yp change in Figure 4 shows strong interannual variation in some of the ensemble members. To identify the cause of the spread, we have tested interannual variability using standard deviation (STD) (Figure 5). In the future period, the interannual variation has been reduced significantly; thus, the strong interannual variation stems from variation in historical period.
In the RCM perspective, Yp shows relatively larger variation when crop models use climate variables of RegCM model. STD of climate variables of each RCM has similar value thus the interannual variation of climate model is not the main cause. The major reason is that cold biases in the RegCM data during the growing season (not shown). The temperature is near the lower limit of the optimal temperature for the maize growth. When the year is below the optimal temperature, the Yp decrease significantly. It causes strong interannual variations in Yp. The reduced variation in the future period also supports that the RCM bias is the reason of the variation. The projected warmer climate in the future relives the cold bias and the temperature stresses, thus the variation has been reduced. The interannual variability is higher in NK than SK in the historical period. It is projected to be reduced significantly in the future, thus supporting the above argument (not shown).
In both the historical and future periods, the APSIM crop model show larger variability. As APSIM involves more complex processes, it may have responded to the climate model more sensitively than EPIC or GEPIC models. Finding the cause of the sensitivity in the model is beyond the subject of this study.
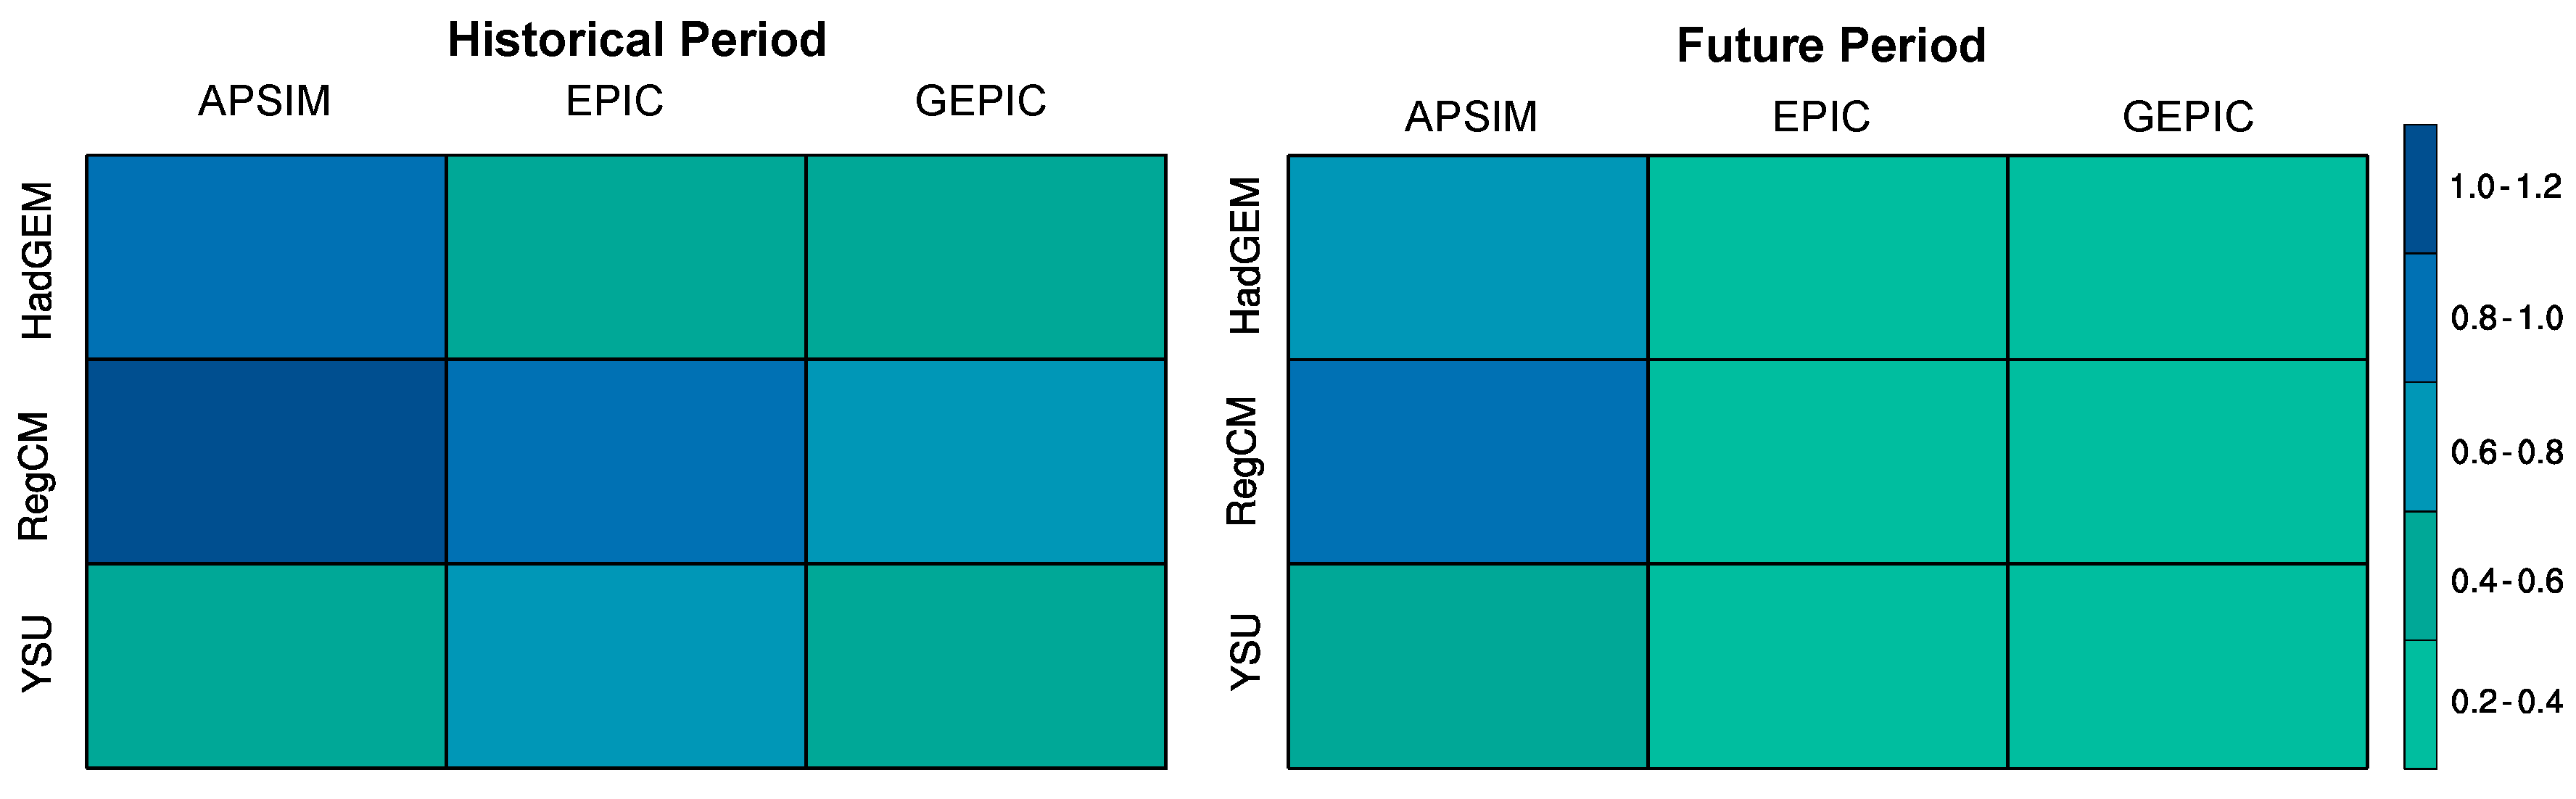
The interannual variability and inter-model variability is examined using coefficients of variation (CV) is defined as the ratio between standard deviation and mean (Figure 6). The interannual variability of simulated Yp is 14.6% and 9.1% on average across all models for historic and future period, respectively.
Compared to STD, the CV shows similar pattern but less distinctive between ensemble members. The interannual variability is reduced in the future period as shown in the STD plot in the previous section. The inter-model variability also reduced in the future period.
3.5. Adaptation Strategies
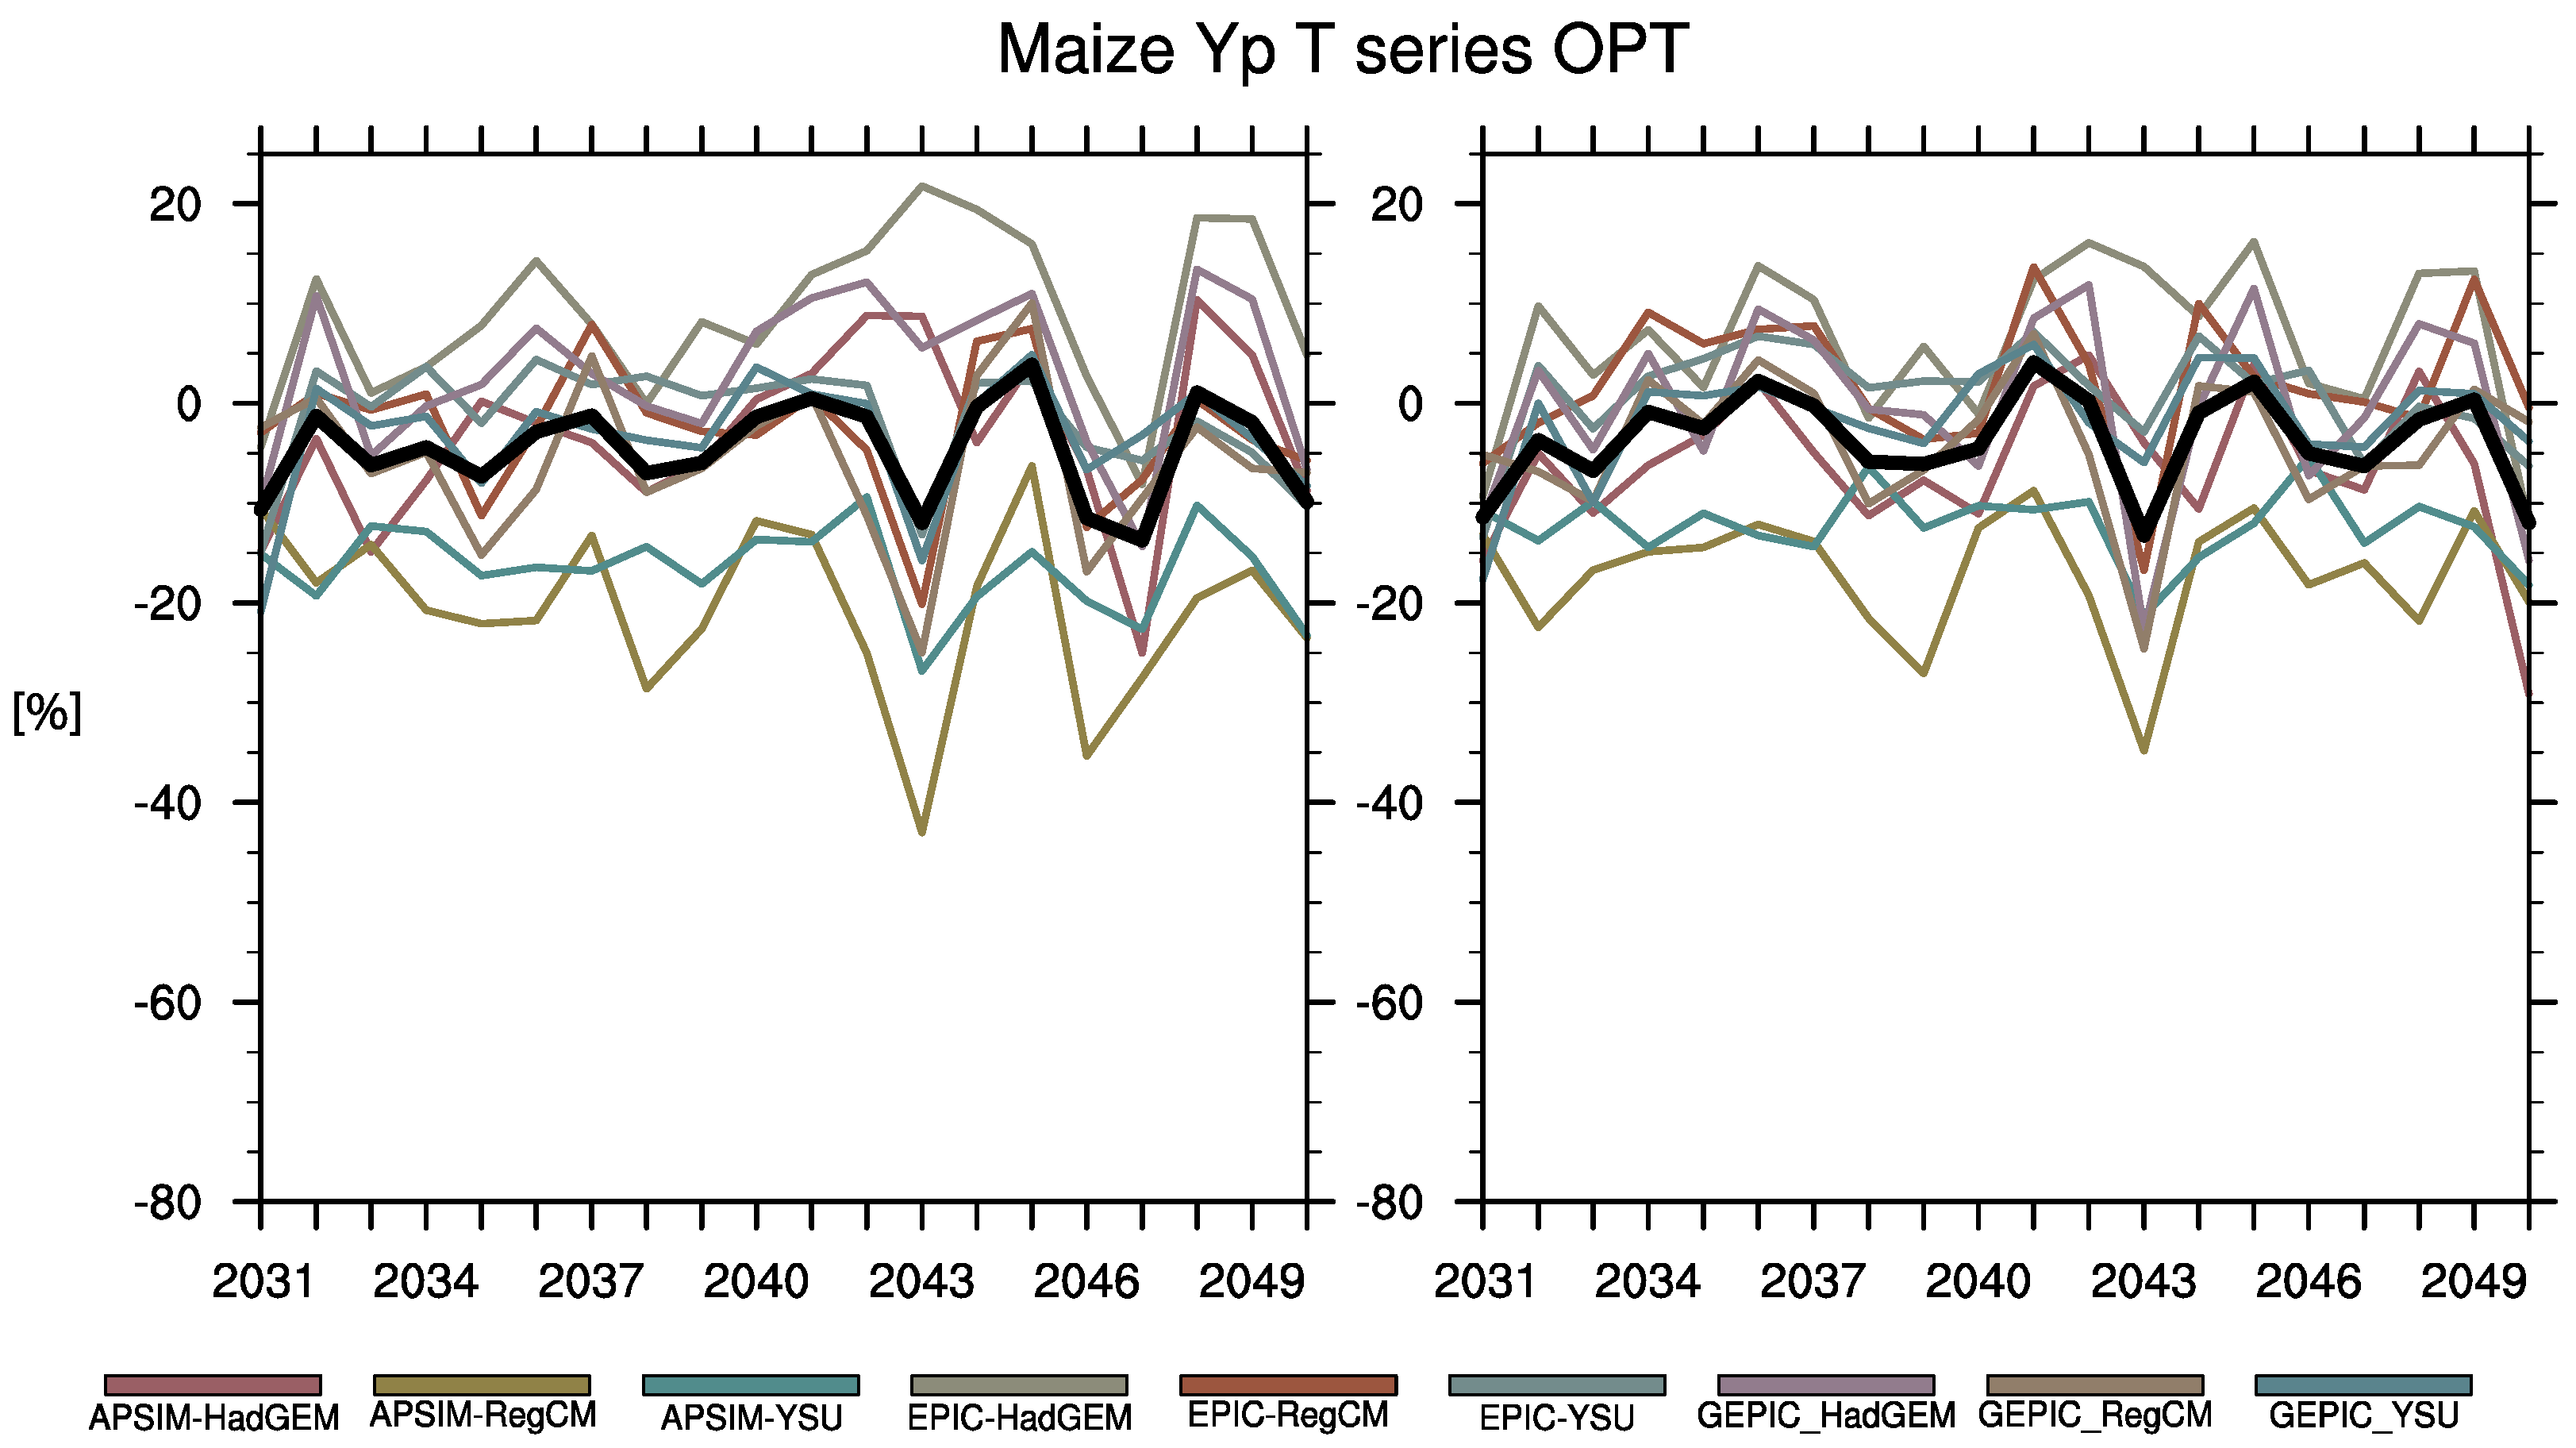
It is necessary for maintaining maximum yields to continue to adjust the management practices according to values of climate variables. There are several ways to adapt to climate change for sustaining crop yields. A previous sensitivity study has shown that changing planting date is the most effective way among the adaptation strategies [39]. Averaged optimal planting date in present day is 30 April in Korean Peninsula and used the date both in historical and future period in previous sections. We have estimated the optimal planting date in the future using Monte Carlo simulations and applied the dates for simulation in future period. Yp changes between historical and future period is −4.4% and −3.1% in SK and NK, respectively (Figure 7). The Yp changes are significantly reduced with the optimal planting dates comparing to the fixed planting dates having over −17% and −13% in SK and NK respectively. With proper adaptation strategies (e.g., changing planting dates), the maize Yp stays at a similar level in the historical period.
The CV is 12.2% and 6.6% in historical and future period, respectively and about 2.5% lower than when the results used fixed planting dates (Figure 8). The adaptation strategy using optimal planting date does help to relieve the decreasing rate of Yp, but also supports to increase the stability. The change is distinct in APSIM crop model results. The CV is reduced in both historical and future period and CV across the ensemble members has similar values in the future. The result implies that APSIM is relatively sensitive to the planting dates.
One important concept in assessing the performance of agricultural system under climate change is stability. Stability in agricultural system is defined as the constancy of agricultural production over extended periods of time across various environments [59]. The concept is especially useful when one evaluates impacts of individual component on the agricultural system. The decreased values of CV over Korean Peninsula in the future (e.g., Figure 6) suggest that maize yield will become more consistent under climate change. However the simulated yields shows significantly reduced amount of yield. This implies that the maize growing regions having inconsistent yield over NK in historical period will be decrease in the future thus it provides stable agricultural output.
3.6. Planting Dates
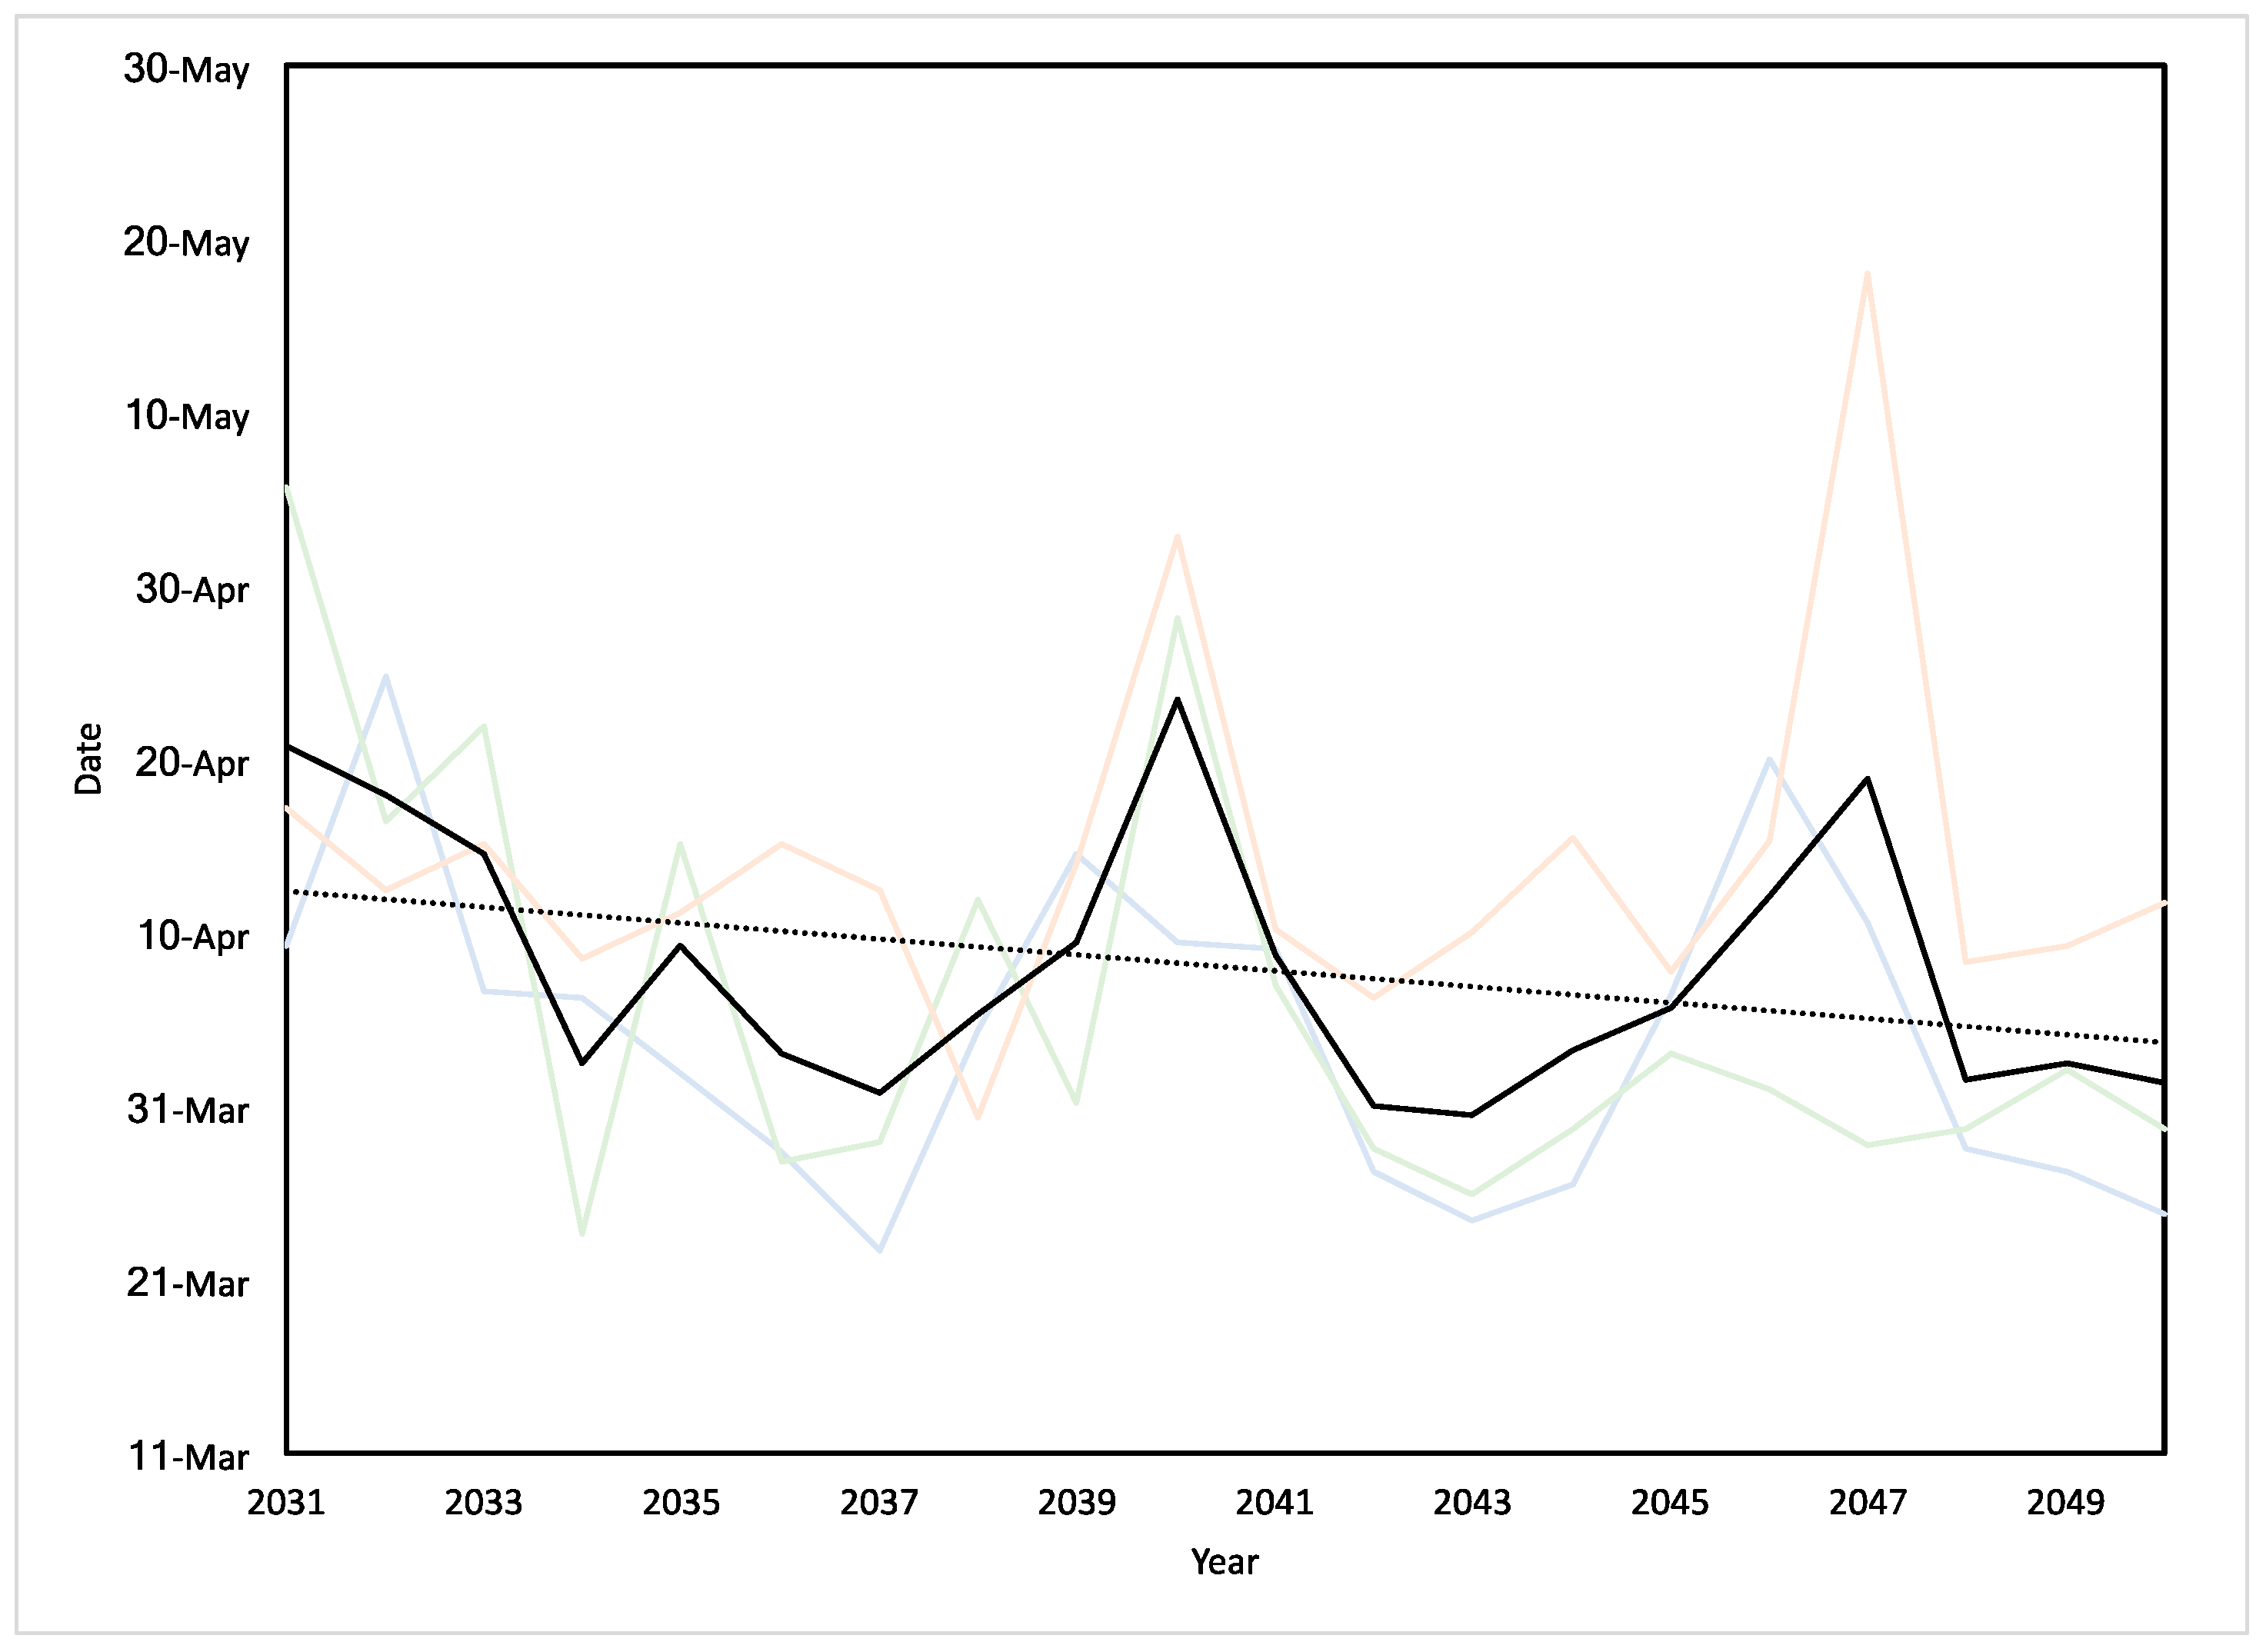
The optimal planting dates appear very important for adaptions to warmer climate in the future. Figure 9 shows that the date is shifted about 20 days earlier in the mid-century period comparing to the averaged optimal planting date in the historical period (30 April). The shift in planting dates is a compromise between avoiding frost damages in spring and damages by extreme heat in summer under a warmer future climate [38]. It can also provide longer growing season that is usually favorable for higher yields. The projected 20 years of trend (e.g., dotted line in Figure 9) suggests that the optimal planting date becomes one-half of a day earlier every year. It is hard to find one-to-one correlation between climate variables and optimal planting dates changes because climate variables are nonlinearly affected on the Yp and need to consider season and extreme climate variables simultaneously. A possible reason is the increasing trend in the Tmin during spring time and in the frequency of extreme Tmax events in the future (not shown).
4. Conclusions
The present study examines the simulated maize productivity, Yp, using three crop models in conjunction with climate forcing from three regional climate models and assessed for the Korean Peninsula at regional scales. The multi-model ensemble projection results show that this approach has the ability to provide better assessment of agricultural systems to respond to climate change. In this study, the modeling framework successfully assesses the consequences of several temporal and spatial perturbations in the climate variables affecting agricultural systems. The results indicate that the projected Yp in the Korean Peninsula will significantly change compared to the historical period and that proper adaptation strategies such as optimized planting dates can considerably alleviate issues associated with Yp decrease. Using the optimal planting date will not only lower the decreasing trend of Yp in the future but will also help to increase stability in agroecosystems under climate change.
To build resilience for adaptation to climate change, the agriculture sector is required to reduce vulnerabilities and increase adaptive capacity [60]. This can be achieved by reducing the sensitivity of the crop systems from unexpected shocks and modifying the system to increase the adaptive capacity. Our results show that reducing the maize yield sensitivity under a future warmer climate in both NK and SK can be achieved by shifting planting dates. Undesirable impact on crop production due to climate change can be minimized even more with other adaptation strategies such as avoiding monoculture, locally adapted cultivar selection, and crop rotation. These strategies will increase the productivity, sustainability, and resilience of agricultural production.
Our results imply that proper management practices can minimize the climate change impacts and maintain the crop yield potential at current levels until mid-century. Developed countries like SK in the MLR need to find ways to transition from intensive high-yield agriculture to sustainable agriculture like organic farming, precision farming, and renewable energy production. Appropriate intensive efforts and educating of farmers will be essential for a successful transition. Like other poor, developing countries, NK is vulnerable to extreme climate events due to lack of infrastructure and land degradation. Any disruption to agricultural production will have a significant impact on the food security and its impacts will spread throughout other sectors. Capacity-building is required through increasing water use efficiency, building soil fertility and reforestation to help increase the productive capacity and enhance its resilience against future climate change.
The present work indicates that the study of similar geographic and climate regions, but with very different socio-economic conditions in the MLR, can yield important clues to resilience in a changing climate, when subject to uncertain conditions of socioeconomic evolution. In this study, we selected a single crop type and two countries in MLR. The climate resilience evaluation on agricultural system can be examined for other perturbations and expanded to other regions in the MLR. Recent study has shown that understanding of local culture is important to assess the climate change adaptation [61]. In future study, we need to consider the cultural knowledge on adaptation and investigate how it influences on agricultural systems in the MLR under climate change. Also, we need to expand our approach with other types of crops, cultivars, and crop cycle to different countries in the MLR.
Acknowledgments
This study was supported by the Korean Ministry of Environment as part of the “Climate Change Correspondence Program” (Project Number: 2014001310008).
Author Contributions
Menas C. Kafatos and Seung Hee Kim wrote the paper. Seung Hee Kim analyzed the results. Chul-Hee Lim contributed in data processing. Jinwon Kim and Woo-kyun Lee gave advice and overall comments.
Conflicts of Interest
The authors declare no conflicts of interest.
References
- Ahlström, A.; Raupach, M.R.; Schurgers, G.; Smith, B.; Arneth, A.; Jung, M.; Reichstein, M.; Canadell, J.G.; Friedlingstein, P.; Jaik, A.N.; et al. The dominant role of semi-arid ecosystems in the trend and variability of the land CO2 sink. Science 2015, 348, 895–899. [Google Scholar] [CrossRef] [PubMed]
- Sachs, J.; Schmidt-Traub, G.; Kroll, C.; Durand-Delacre, D.; Teksoz, K. SDG Index and Dashboards Report 2017; Bertelsmann Stiftung and Sustainable Development Solutions Network (SDSN): New York, NY, USA, 2017. [Google Scholar]
- Bloom, D.E.; Sachs, J.D.; Collier, P.; Udry, C. Geography, Demography, and Economic Growth in Africa. Brook. Pap. Econ. Act. 1998, 1998, 207–295. [Google Scholar]
- Kummu, M.; Varis, O. The world by latitudes: A global analysis of human population, development level and environment across the north-south axis over the past half century. Appl. Geogr. 2011, 31, 495–507. [Google Scholar]
- Norris, J.R.; Allen, R.J.; Evan, A.T.; Zelinka, M.D.; O’Dell, C.W. Evidence for climate change in the satellite cloud record. Nature 2016, 536, 72–75. [Google Scholar] [CrossRef] [PubMed]
- Meersmans, J.; Arrouays, D.; Van Rompaey, A.J.J.; Pagé, C.; de Baets, S.; Quine, T.A. Future C loss in mid-latitude mineral soils: Climate change exceeds land use mitigation potential in France. Sci. Rep. 2016, 6, 35798. [Google Scholar] [CrossRef] [PubMed]
- Chen, Y.; Tang, H. Desertification in north China: Background, anthropogenic impacts and failures in combating it. Land Degrad. Dev. 2005, 16, 367–376. [Google Scholar] [CrossRef]
- UNEP. DPR KOREA: State of the Environment 2003; United Nations Environment Programme: Pathumthani, Thailand, 2003. [Google Scholar]
- Howard-Hassmann, R.E. State-Induced Famine and Penal Starvation in North Korea. Genocide Stud. Prev. 2012, 7, 3. [Google Scholar] [CrossRef]
- Martin, V.M.; McDonald, J.A. Food Grain Policy in the Republic of Korea: The Economic Costs of Self-Sufficiency. Econ. Dev. Cult. Chang. 1986, 34, 315–331. [Google Scholar]
- Yonhap News (3 October 2013) Korea Plans to Boost Food Self-Sufficiency. The Korea Herald. Available online: http://www.koreaherald.com/view.php?ud=20131003000209 (accessed on 10 July 2017).
- FAO (Food and Agriculture Organization of the United Nations). Food and International Trade Technical Background Document. 1996. Available online: http://www.fao.org/docrep/003/w2612e/w2612e12.htm (accessed on 10 July 2017).
- Beghin, J.C.; Bureau, J. The Cost of Food Self-Sufficiency and Agricultural Protection in South Korea. Iowa Ag Rev. 2015, 8. Article 2. Available online: http://lib.dr.iastate.edu/iowaagreview/vol8/iss1/2 (accessed on 31 July 2017).
- Clapp, J. Food Self-Sufficiency: Making Sense of It, and When It Makes Sense. Food Policy 2017, 66, 88–96. [Google Scholar]
- Van Ittersum, M.K.; Cassman, K.G. Yield gap analysis: Rationale, methods, and applications: Introduction to the special issue. Field Crops Res. 2013, 143, 1–3. [Google Scholar] [CrossRef]
- Davies, T.; Cullen, M.J.P.; Malcolm, A.J.; Mawson, M.H.; Staniforth, A.; White, A.A.; Wood, N. A new dynamical core for the Met Office’s global and regional modeling of the atmosphere. Q. J. R. Meteorol. Soc. 2005, 131, 1759–1782. [Google Scholar] [CrossRef]
- Giorgi, F.; Coppola, E.; Solomon, F.; Mariotti, L.; Sylla, M.B.; Bi, X.; Elguindi, N.; Diro, G.T.; Nair, V.; Giuliani, G. RegCM4: Model description and preliminary test over multi CORDEX domain. Clim. Res. 2012, 52, 7–29. [Google Scholar] [CrossRef]
- Hong, S.-Y.; Park, H.; Cheong, H.-B.; Kim, J.-E.E.; Koo, M.-S.; Jang, J.; Ham, S.; Hwang, S.-O.; Park, B.-K.; Chang, E.-C. The Global/Regional Integrated Model System (GRIMs). Asia-Pac. J. Atmos. Sci. 2013, 49, 219–243. [Google Scholar] [CrossRef]
- FAO/WFP (Food and Agriculture Organization of the United Nations/World Food Programme). FAO/WFP Crop and Food Security Assessment Mission to the Democratic People’s Republic of Korea; Special Report; FAO: Rome, Italy; WFP: Rome, Italy, 2012. [Google Scholar]
- FAO/WFP (Food and Agriculture Organization of the United Nations/World Food Programme). FAO/WFP Crop and Food Security Assessment Mission to the Democratic People’s Republic of Korea; Special Report; FAO: Rome, Italy; WFP: Rome, Italy, 2013. [Google Scholar]
- FAO (Food and Agriculture Organization of the United Nations). Global Information and Early Warning System (GIEWS); Update Outlook for Food Supply and Demand; FAO: Rome, Italy, 2014. [Google Scholar]
- Rötter, R.P.; Carter, T.R.; Olesen, J.E.; Porter, J.R. Crop-climate models need an overhaul. Nat. Clim. Chang. 2011, 1, 175–177. [Google Scholar] [CrossRef]
- Tao, F.; Zhang, Z.; Liu, J.; Yokozawa, M. Modelling the impacts of weather and climate variability on crop productivity over a large area: A new super-ensemble-based probabilistic projection. Agric. For. Meteorol. 2009, 149, 1266–1278. [Google Scholar] [CrossRef]
- Bassu, S.; Brisson, N.; Durand, J.L.; Boote, K.J.; Lizaso, J.; Jones, J.W.; Rosenzweig, C.; Adam, M.; Basso, B.; Baron, C.; et al. How do various maize crop models vary in their responses to climate change factors? Glob. Chang. Biol. 2014, 20, 2301–2320. [Google Scholar] [CrossRef] [PubMed]
- Araya, A.; Hoogenboom, G.; Luedeling, E.; Hadgu, K.M.; Kisekka, I.; Martorano, L.G. Assessment of maize growth and yield using crop models under present and future climate in southwestern Ethiopia. Agric. For. Meteorol. 2015, 214–215, 252–265. [Google Scholar] [CrossRef]
- Rosenzweig, C.; Elliott, J.; Deryng, D.; Ruane, A.C.; Muller, C.; Arneth, A.; Yang, H.; Schmid, E.; Pionteke, F.; Jones, J.W.; et al. Assessing agricultural risks of climate change in the 21st century in a global gridded crop model intercomparison. Proc. Natl. Acad. Sci. USA 2014, 111, 3268–3273. [Google Scholar] [CrossRef] [PubMed]
- McCown, R.L.; Hammer, G.L.; Hargreaves, J.N.; Holzworth, D.P.; Freebairn, D.M. APSIM: A novel software system for model development, model testing and simulation in agricultural systems research. Agric. Syst. 1996, 50, 255–271. [Google Scholar] [CrossRef]
- Keating, B.A.; Carberry, P.S.; Hammer, G.L.; Probert, M.E.; Robertson, M.J.; Holzworth, D.; Bristow, K.; Asseng, S.; Chapman, S.; Smith, C.J.; et al. An overview of APSIM: A model designed for farming systems simulation. Eur. J. Agron. 2003, 18, 267–288. [Google Scholar] [CrossRef]
- Holzworth, D.; Meinke, H.; DeVoil, P.; Wegener, M.; Huth, N.; Hammer, G.; Robertson, M.; Carberry, P.; Freebairn, D.; Murphy, C.; et al. The development of a farming systems model (APSIM): A disciplined approach. In Proceedings of the iEMSs Third Biennial Meeting, Burlington, VT, USA, 9–13 July 2006; International Environmental Modelling and Software Society: Manno, Switzerland, 2006. [Google Scholar]
- Liu, Z.; Hubbard, K.G.; Lin, X.; Yang, X. Negative effects of climate warming on maize yield are reversed by the changing of sowing date and cultivar selection in northeast China. Glob. Chang. Biol. 2013, 19, 3481–3492. [Google Scholar] [CrossRef] [PubMed]
- Archontoulis, S.V.; Miguez, F.E.; Moore, K.J. Evaluating APSIM maize, soil water, soil nitrogen, manure, and soil temperature modules in the midwestern United States. Agron. J. 2014, 106, 1025–1040. [Google Scholar] [CrossRef]
- Harrison, M.T.; Tardieu, F.; Dong, Z.; Messina, C.D.; Hammer, G.L. Characterizing drought stress and trait influence on maize yield under current and future conditions. Glob. Chang. Biol. 2014, 20, 867–878. [Google Scholar] [CrossRef] [PubMed]
- Chauhan, Y.S.; Solomon, K.F.; Rodriguez, D. Characterization of northeastern Australian environments using APSIM for increasing rainfed maize production. Field Crops Res. 2013, 144, 245–255. [Google Scholar] [CrossRef]
- Dixit, P.N.; Cooper, P.J.M.; Dimes, J.; Rao, K.P. Adding value to field-based agronomic research through climate risk assessment: A case study of maize production in Kitale, Kenya. Exp. Agric. 2011, 47, 317–338. [Google Scholar] [CrossRef]
- Asseng, S.; Ewert, F.; Rosenzweig, C.; Jones, J.W.; Hatfield, J.L.; Ruane, A.C.; Heng, L.; Hooker, J.; Hunt, L.A.; Wolf, J.; et al. Uncertainty in simulating wheat yields under climate change. Nat. Clim. Chang. 2013, 3, 827–832. [Google Scholar] [CrossRef]
- Liu, Y.; Yang, X.; Wang, E.; Xue, C. 2014 Climate and crop yields impacted by ENSO episodes on the North China Plain: 1956–2006. Reg. Environ. Chang. 2014, 14, 49–59. [Google Scholar] [CrossRef]
- Liu, Z.; Yang, X.; Hubbard, K.G.; Lin, X. Maize potential yields and yield gaps in the changing climate of northeast China. Glob. Chang. Biol. 2012, 18, 3441–3454. [Google Scholar] [CrossRef]
- Myoung, B.; Kim, S.H.; Kim, J.; Kafatos, M.C. Regional Variations of Optimal Sowing Dates for the Southwestern US. Trans. ASABE 2017, 59, 1759–1769. [Google Scholar]
- Kim, S.H.; Myoung, B.; Stack, D.H.; Kim, J.; Kafatos, M.C. Sensitivity of simulated maize crop yields to regional climate in the Southwestern United States. Trans. ASABE 2017, 59, 1745–1757. [Google Scholar]
- Stack, D.H.; Kafatos, M. ApsimRegions: A gridded modeling framework for the APSIM crop model. Presented at PyCon 2013, Santa Clara, CA, USA, 13–21 March 2013; Python Software Foundation: Beaverton, OR, USA, 2013. [Google Scholar]
- Williams, J.R.; Jones, C.A.; Kiniry, J.R.; Spanel, D.A. The EPIC crop growth model. Trans. ASAE 1989, 32, 497–511. [Google Scholar] [CrossRef]
- Williams, J.R.; Jones, C.A.; Dyke, P.T. A modeling approach to determining the relationship between erosion and soil productivity. Trans. ASABE 1984, 27, 129–144. [Google Scholar] [CrossRef]
- Williams, J.R. The EPIC model. In Computer Models of Watershed Hydrology; Singh, V.P., Ed.; Water Resources Publications: Highlands Ranch, CO, USA, 1995. [Google Scholar]
- Lim, C.H.; Lee, W.K.; Song, Y.; Eom, K.C. Assessing the EPIC model for estimation of future crops yield in South Korea. J. Clim. Chang. Res. 2015, 6, 21–31. [Google Scholar] [CrossRef]
- Liu, J.; Williams, J.R.; Zehnder, A.J.; Yang, H. GEPIC-modelling wheat yield and crop water productivity with high resolution on a global scale. Agric. Sys. 2007, 94, 478–493. [Google Scholar] [CrossRef]
- Liu, J.; Zehnder, A.J.; Yang, H. Global consumptive water use for crop production: The importance of green water and virtual water. Water Resour. Res. 2009, 45. [Google Scholar] [CrossRef]
- Zhao, Q.; Liu, J.; Khabarov, N.; Obersteiner, M.; Westphal, M. Impacts of climate change on virtual water content of crops in China. Ecol. Inform. 2014, 19, 26–34. [Google Scholar] [CrossRef]
- HarvestChoice. HC27: Generic/Prototypical Soil Profiles; International Food Policy Research Institute: Washington, DC, USA, 2010; Available online: http://harvestchoice.org/node/2239 (accessed on 31 July 2017).
- Koo, J.; Dimes, J. HC27 Generic Soil Profile Database. Harvard Dataverse Ver. 4; International Food Policy Research Institute: Washington, DC, USA, 2013; Available online: http://hdl.handle.net/1902.1/20299 (accessed on 31 July 2017).
- Dourte, D.R.; Fraisse, C.W.; Uryasev, O. WaterFootprint on AgroClimate: A dynamic, web-based tool for comparing agricultural systems. Agric. Syst. 2014, 125, 33–41. [Google Scholar] [CrossRef]
- Müller, C.; Robertson, R.D. Projecting future crop productivity for global economic modeling. Agric. Econ. 2014, 45, 37–50. [Google Scholar] [CrossRef]
- Nelson, G.C.; Rosegrant, M.W.; Koo, J.; Robertson, R.; Sulser, T.; Zhu, T.; Mandy, E.; Marilia, M.; Miroslav, B.; Batka, M.; et al. Climate Change: Impact on Agriculture and Costs of Adaptation; International Food Policy Research Institute: Washington, DC, USA, 2009. [Google Scholar]
- Moen, T.N.; Kaiser, H.M.; Riha, S.J. Regional yield estimation using a crop simulation model: Concepts, methods, and validation. Agric. Syst. 1994, 46, 79–92. [Google Scholar] [CrossRef]
- Lee, J.; De Gryze, S.; Six, J. Effect of Climate Change on Field Crop Production in the Central Valley of California; California Climate Change Research Center: Sacramento, CA, USA, 2009. [Google Scholar]
- Lobell, D.B.; Cassman, K.G.; Field, C.B. Crop yield gaps: Their importance, magnitudes, and causes. Annu. Rev. Environ. Resour. 2009, 34, 179–204. [Google Scholar] [CrossRef]
- Fageria, N.K. Maximizing Crop Yields; Marcel Dekker: New York, NY, USA, 1992. [Google Scholar]
- Knutti, R.; Sedlacek, J. Robustness and uncertainties in the new CMIP5 climate model projections. Nat. Clim. Chang. 2013, 3, 369–373. [Google Scholar] [CrossRef]
- Sánchez, B.; Rasmussen, A.; Porter, J.R. Temperatures and the growth and development of maize and rice: A review. Glob. Chang. Biol. 2014, 20, 408–417. [Google Scholar] [CrossRef] [PubMed]
- Urruty, N.; Tailliez-Lefebvre, D.; Huyghe, C. Stability, robustness, vulnerability and resilience of agricultural systems. A review. Agron. Sustain. Dev. 2016, 36, 15. [Google Scholar] [CrossRef]
- Gitz, V.; Meybeck, A. Risks, vulnerabilities and resilience in a context of climate change: Building Resilience for Adaptation to Climate Change in the Agriculture Sector. In Proceedings of the Joint FAO/OECD Workshop, Rome, Italy, 23–24 April 2012; Meybeck, A., Lankoski, J., Redfern, S., Azzu, N., Gitz, V., Eds.; The Food and Agriculture Organization of the United Nations (FAO): Rome, Italy; The Organisation for Economic Cooperation and Development (OECD): Paris, France, 2012. [Google Scholar]
- Heimann, T.; Mallick, B. Understanding Climate Adaptation Cultures in Global Context: Proposal for an Explanatory Framework. Climate 2016, 4, 59. [Google Scholar] [CrossRef]
Figure 1.
Evaluation of the crop models for the South Korea (SK) and North Korea (NK) regions. The blue shaded region is simulated Yp at each region and black solid line shows median of the Yp. Box plot shows observed yields. Note that there are no NK regional yields reports on 2014, thus marked averaged value of entire country.

Figure 2.
Future changes in growing season (April to July) mean of Maximum temperature, Minimum temperature, and incoming solar radiation (2031–2050) relative to historical period (1981–2000). Black solid line shows ensemble average of three RCM results. Blue shaded region indicates maximum and minimum of each ensemble members.

Figure 3.
Same as Figure 2 except horizontal distribution of the averaged differences between historical and future period.
Figure 3.
Same as Figure 2 except horizontal distribution of the averaged differences between historical and future period.
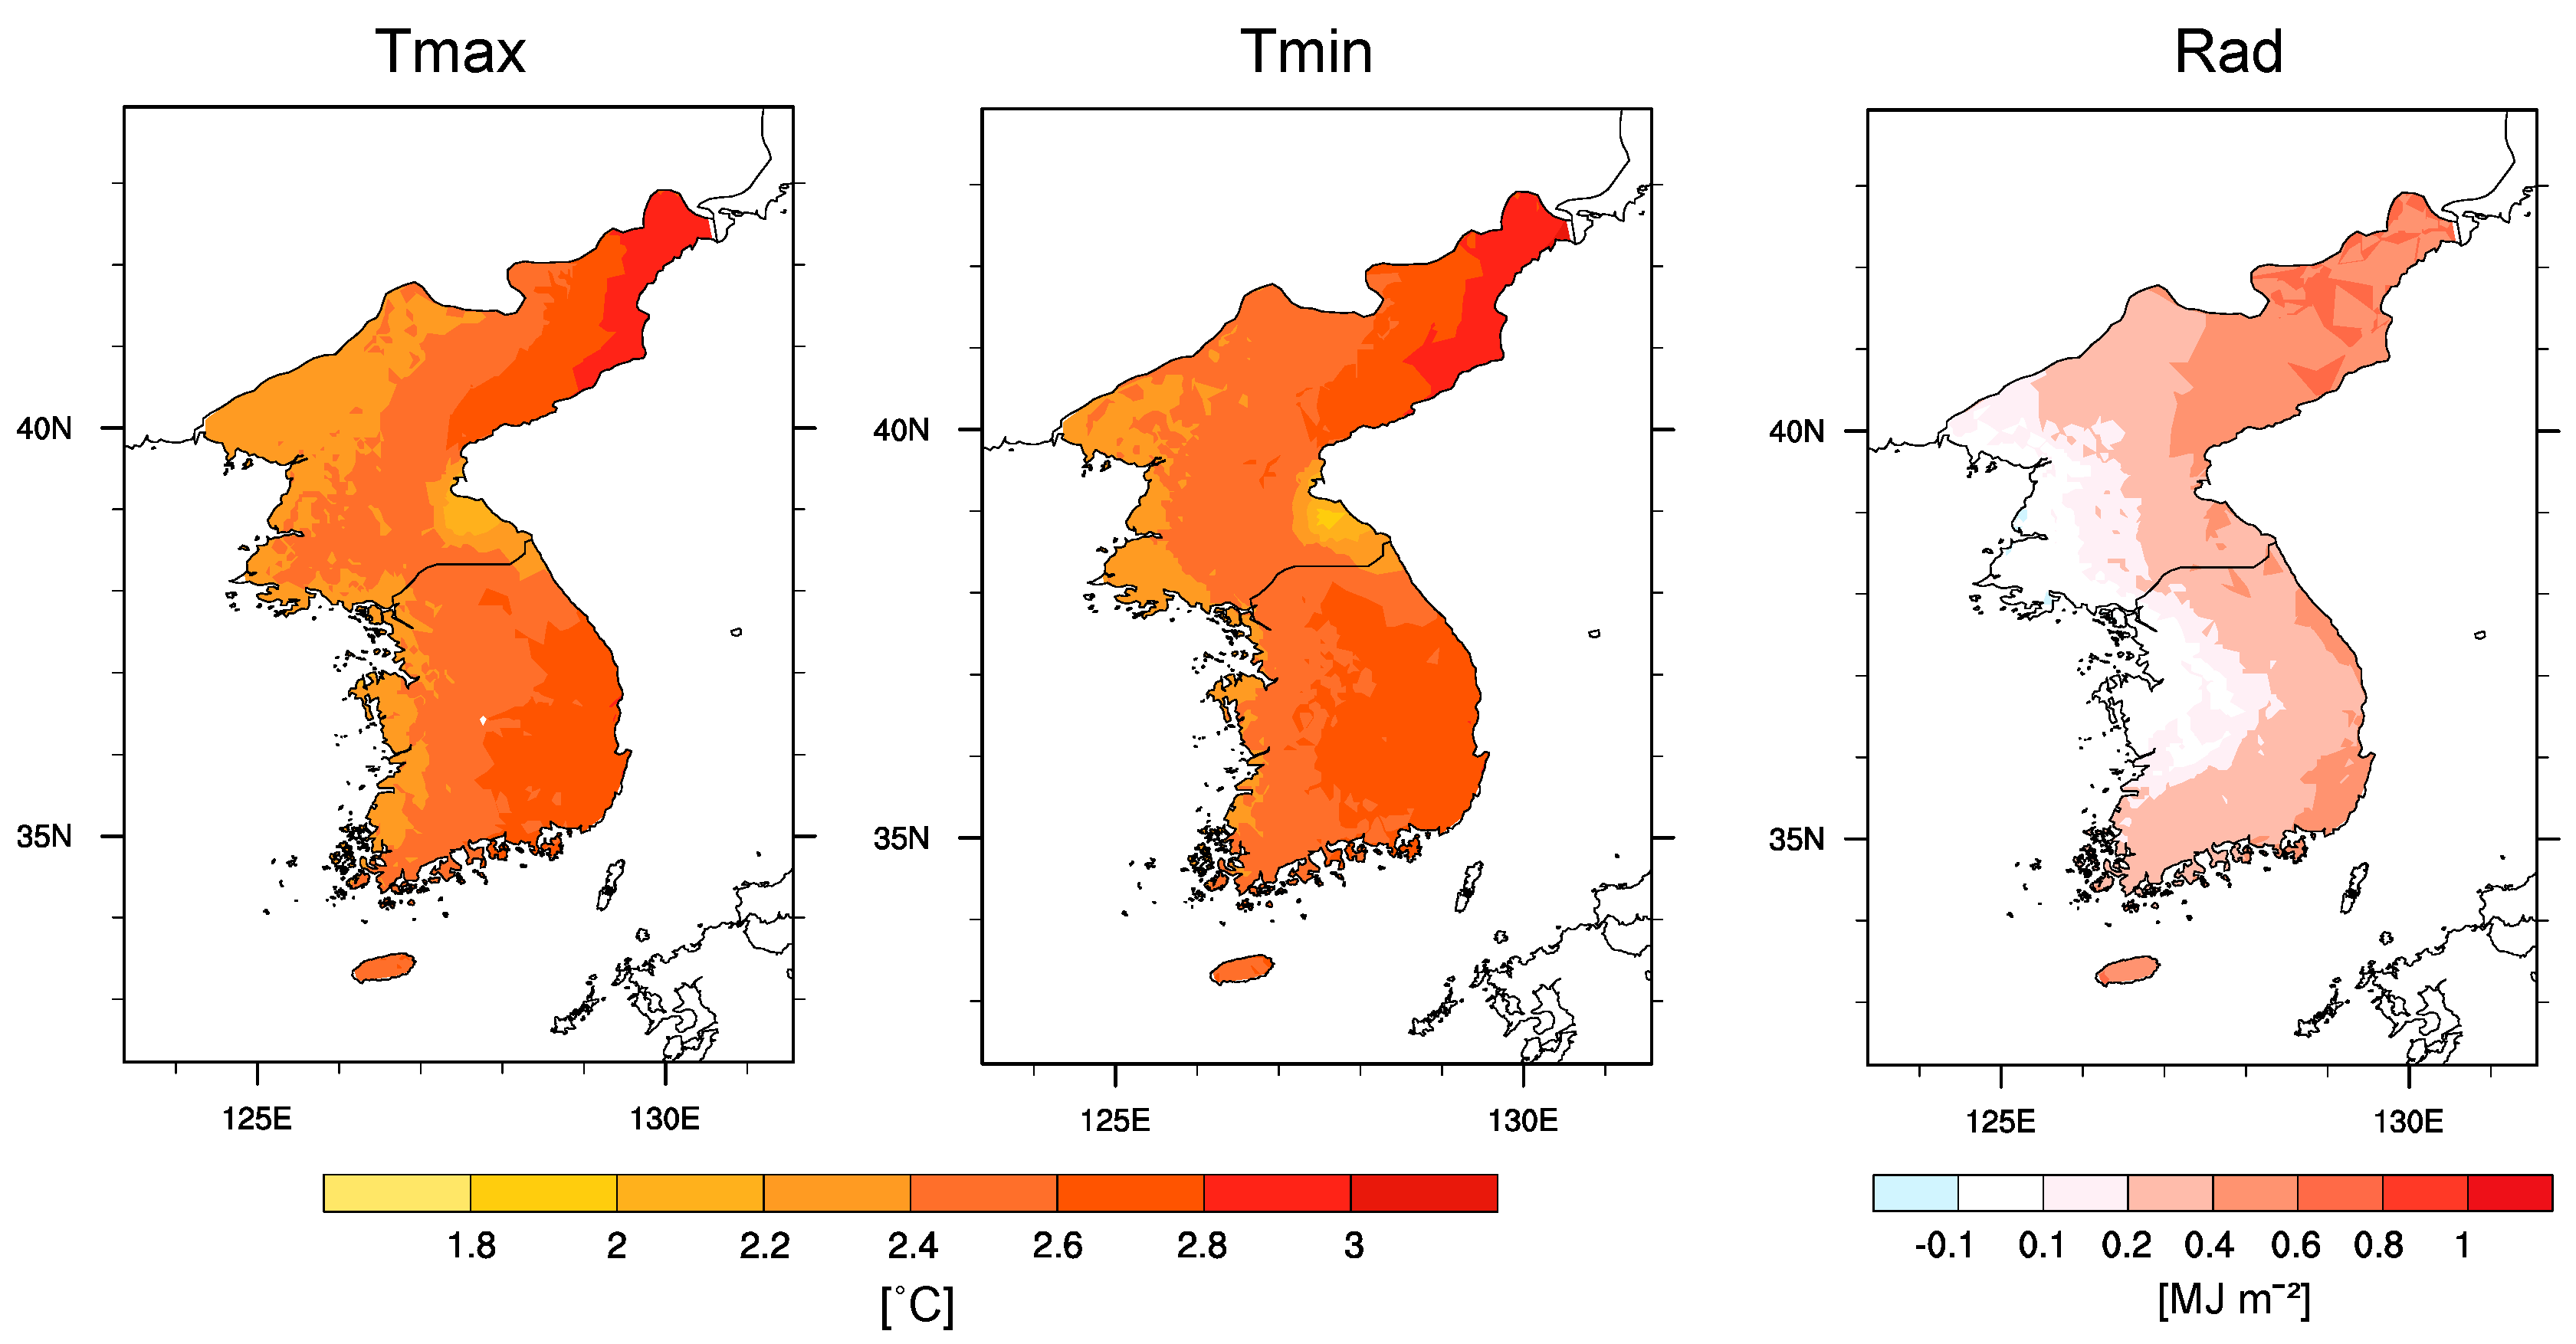
Figure 4.
Black solid line shows the ensemble averaged yield potential changes [%] in the future. Colored lines represent yield potential of each ensemble members. Note that left-hand (right-hand) side figure shows result for South Korea (North Korea).
Figure 4.
Black solid line shows the ensemble averaged yield potential changes [%] in the future. Colored lines represent yield potential of each ensemble members. Note that left-hand (right-hand) side figure shows result for South Korea (North Korea).

Figure 5.
The portrait table indicates that standard deviation of yield potential for each ensemble members. Left-hand (right-hand) side table shows averaged standard deviation for the historical (future) period.
Figure 5.
The portrait table indicates that standard deviation of yield potential for each ensemble members. Left-hand (right-hand) side table shows averaged standard deviation for the historical (future) period.

Figure 6.
Same as Figure 5 but coefficients of variation (%).
Figure 6.
Same as Figure 5 but coefficients of variation (%).
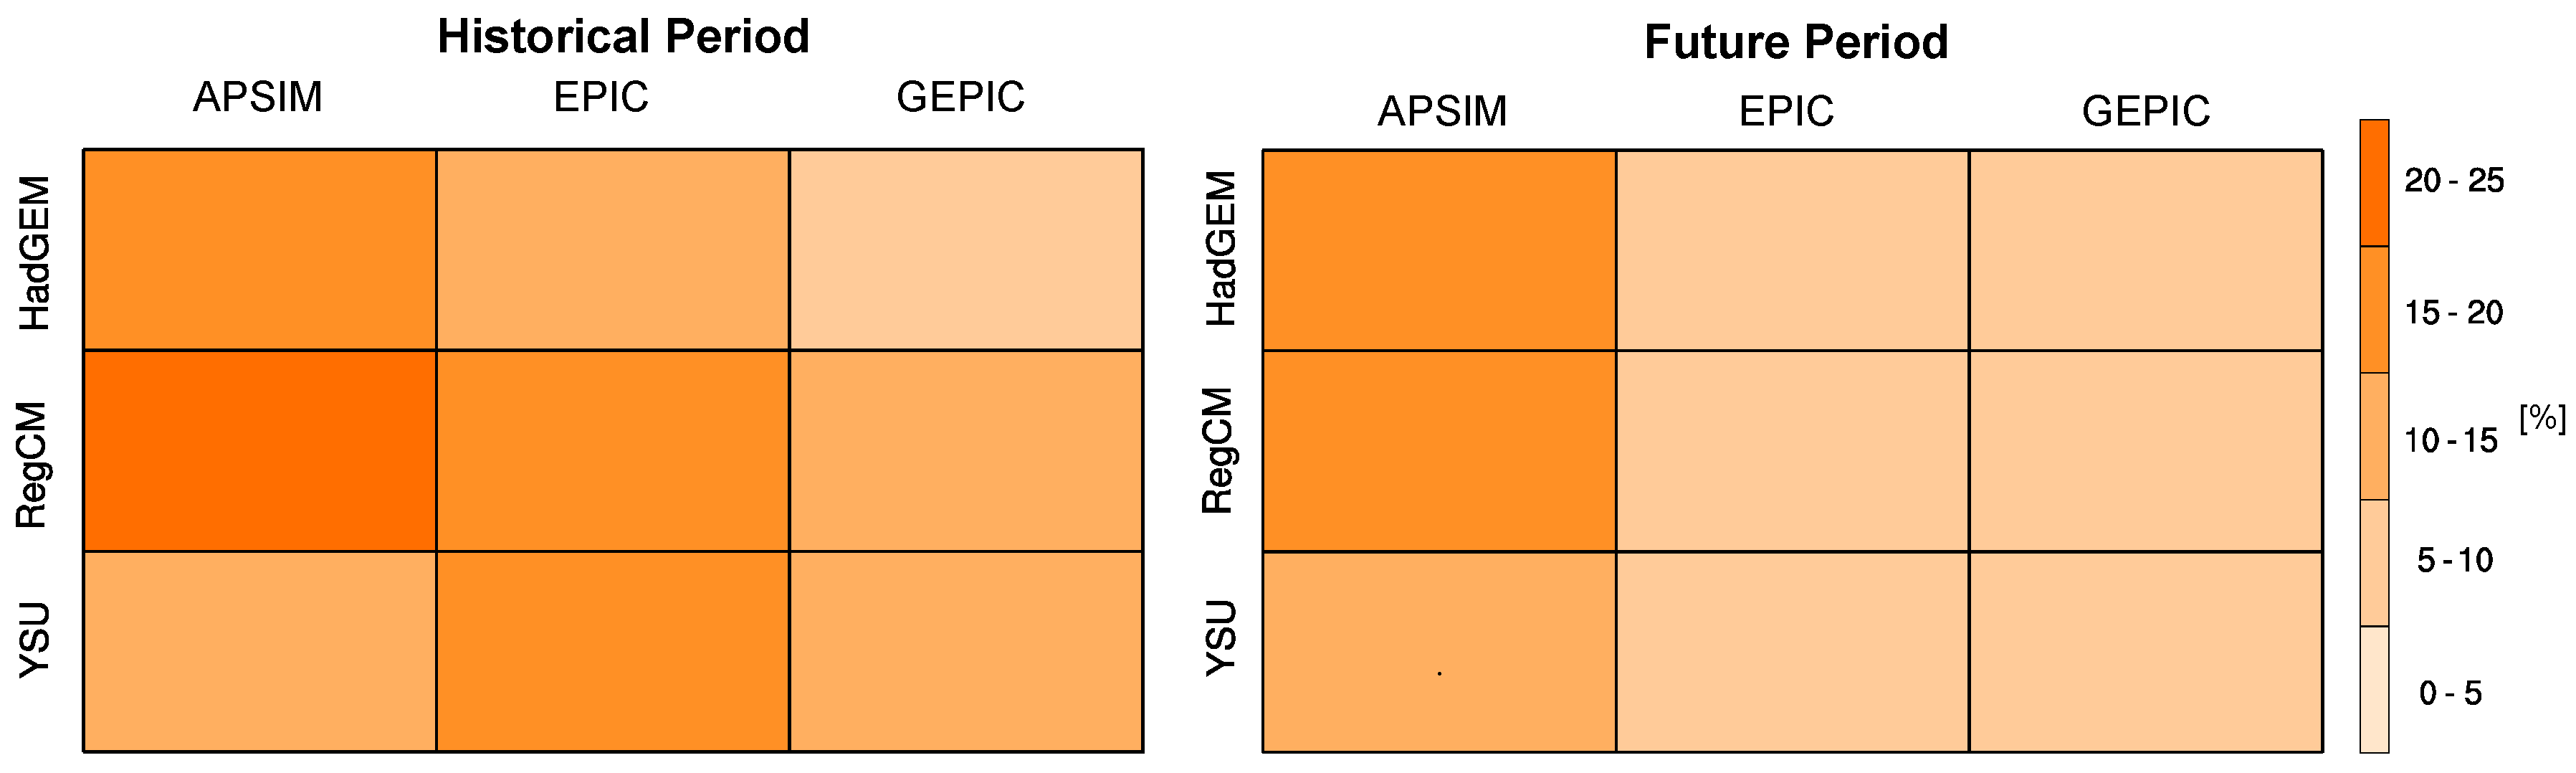
Figure 7.
Same as Figure 4 except optimal planting date.
Figure 7.
Same as Figure 4 except optimal planting date.

Figure 8.
Same as Figure 6 except optimal planting dates in Yp simulation.
Figure 8.
Same as Figure 6 except optimal planting dates in Yp simulation.
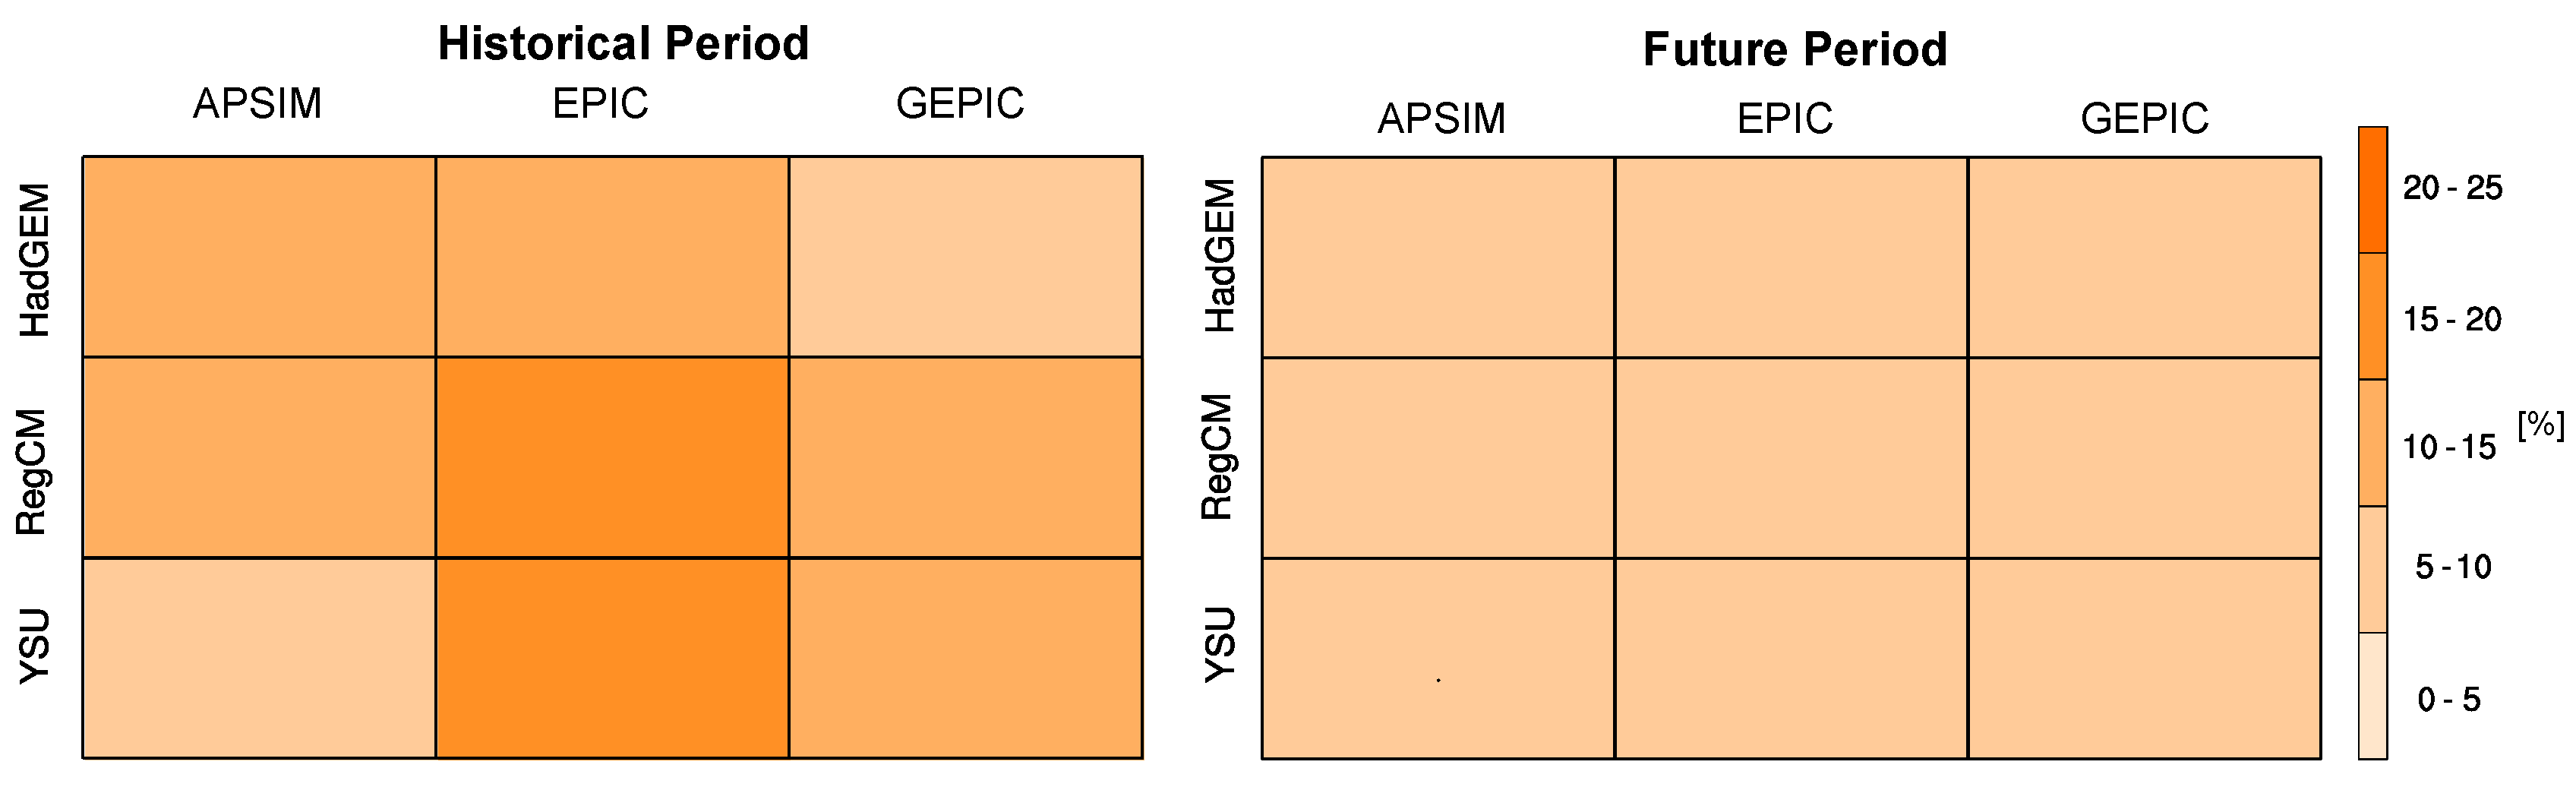
Figure 9.
Time series of optimal plant dates from 2031 to 2050. Color shaded lines ensemble member and black solid line are averaged value. Dotted line shows the trend of the date.
Figure 9.
Time series of optimal plant dates from 2031 to 2050. Color shaded lines ensemble member and black solid line are averaged value. Dotted line shows the trend of the date.


Table 1.
Regional Climate Model description and its operating institute.
| Model | Institute | Description |
|---|---|---|
| HadGEM3-RA | National Institute of Meteorological Research (NIMR), South Korea | HadGEM3-RA is based on the global atmospheric Hadley Center Global Environmental Model version 3 (HadGEM3) of the Met Office Hadley Centre (MOHC) [16]. |
| RegCM4 | Kongju National University, South Korea | The Regional Climate Model version 4 (RegCM4), developed by the International Centre for Theoretical Physics (ICTP) with some noteworthy improvements, such as the coupling of a sophisticated land surface model, community land model 3 [17]. |
| YSU-RSM | Yonsei University, South Korea | Regional Spectral Model (RSM), which is also known as Regional Model Program (RMP) of the Global/Regional Integrated Model System (GRIMs) [18]. The dynamic frame of RMP is rooted in the National Center for Environmental Prediction (NCEP) RSM and most of physical parameterizations are newly developed and adapted to the RMP. |
Table 2.
Description of crop models.
| Model | Description | Daily Climate Input Data |
|---|---|---|
| ApsimRegions | Extended the point-specific Agricultural Production Systems sIMulator (APSIM) crop model to regional spatial scales (http://www.apsimregions.org) | Maximum Temperature, |
| Maximum Temperature, | ||
| Radiation, Precipitation | ||
| EPIC | Environmental Policy Integrated Climate (EPIC, v. 0810) | Maximum Temperature, |
| Maximum Temperature, | ||
| Radiation, Precipitation | ||
| GEPIC | GIS-based Environmental Policy Integrated Climate (EPIC) model v. 0509. The EPIC model us integrated with a GIS by a loose coupling approach | Maximum Temperature, |
| Maximum Temperature, | ||
| Radiation, Precipitation |
© 2017 by the authors. Licensee MDPI, Basel, Switzerland. This article is an open access article distributed under the terms and conditions of the Creative Commons Attribution (CC BY) license (http://creativecommons.org/licenses/by/4.0/).
Share and Cite
MDPI and ACS Style
Kafatos, M.C.; Kim, S.H.; Lim, C.-H.; Kim, J.; Lee, W.-K. Responses of Agroecosystems to Climate Change: Specifics of Resilience in the Mid-Latitude Region. Sustainability 2017, 9, 1361. https://doi.org/10.3390/su9081361
AMA Style
Kafatos MC, Kim SH, Lim C-H, Kim J, Lee W-K. Responses of Agroecosystems to Climate Change: Specifics of Resilience in the Mid-Latitude Region. Sustainability. 2017; 9(8):1361. https://doi.org/10.3390/su9081361
Chicago/Turabian StyleKafatos, Menas C., Seung Hee Kim, Chul-Hee Lim, Jinwon Kim, and Woo-Kyun Lee. 2017. "Responses of Agroecosystems to Climate Change: Specifics of Resilience in the Mid-Latitude Region" Sustainability 9, no. 8: 1361. https://doi.org/10.3390/su9081361
Note that from the first issue of 2016, this journal uses article numbers instead of page numbers. See further details here.