Article

Projecting the CO2 and Climatic Change Effects on the Net Primary Productivity of the Urban Ecosystems in Phoenix, AZ in the 21st Century under Multiple RCP (Representative Concentration Pathway) Scenarios

1
State Key Laboratory of Desert and Oasis Ecology, Xinjiang Institute of Ecology and Geography, Chinese Academy of Sciences, Urumqi 830011, China
2
University of Chinese Academy of Sciences, Beijing 100049, China
3
School of Resources Environment Science and Engineering, Hubei University of Science and Technology, Xianning 437100, China
*
Author to whom correspondence should be addressed.
Sustainability 2017, 9(8), 1366; https://doi.org/10.3390/su9081366
Submission received: 5 May 2017 / Revised: 28 July 2017 / Accepted: 29 July 2017 / Published: 3 August 2017

Abstract

:
Urban vegetation provides ecological services that promote both the ecosystem integrity and human well-being of urban areas, and thus is critical to urban sustainability. As a key indicator of ecological health, net primary productivity (NPP) provides valuable information about the performance of urban ecosystem in response to the changes in urban climate and atmosphere in the 21st century. In this study, a process-based urban ecosystem model, HPM-UEM (Hierarchical Patch Mosaic-Urban Ecosystem Model), was used to investigate spatiotemporal dynamics of urban ecosystem NPP in the Phoenix city, AZ under three representative concentration pathway (RCP2.6, RCP4.5 and RCP8.5) during the 21st century. The results indicated that, by the end of the 21st century, the urban ecosystem’s NPP would increase by 14% (in RCP2.6), 51% (in RCP4.5) and 99% (in RCP8.5) relative to that in the late 2000s, respectively. Factorial analysis indicated that CO2 fertilization effect would be the major driver of NPP change, accounting for 56–61% of the NPP increase under the scenarios. Under the RCP2.6 scenario, the strongest NPP increase would be found in the agricultural lands located in the west and southeast of the city. Under the RCP4.5 and RCP8.5 scenarios, the strongest NPP increase would be found in the mesic residential areas that mainly located to the eastern, southern, and southwestern of the Phoenix Mountains Preserve. Although higher ecosystem NPP in the future implies improved ecosystem services that may help to alleviate the heat stress (by providing more shading) and air pollution in the city, this will be at the cost of higher irrigation water usage, probably leading to water shortage in the natural ecosystems in this arid region. Furthermore, this study indicated the rich (such as in mesic residential area) would enjoy more benefits from the improved urban ecosystem services than the poor (such as in xeric residential area).

1. Introduction

Since the industrial revolution, the earth has entered an era in which human impacts on the fluxes of radiative energy through the earth system have demonstrable effects on climate (Intergovernmental Panel on Climate Change (IPCC) 2007). Net primary productivity (NPP), or the rate of assimilation of carbon dioxide (CO2) through photosynthesis, is the fundamental link between the atmosphere and the biosphere [1]. NPP contributes to human survival because it is not only the basis for food, fiber and wood production, but also affects composition of the atmosphere, the availability of fresh water, biodiversity, and the adjusting mechanisms of energy supply and distribution [2]. NPP is a sensitive indicator of climatic and other forms of environmental change [3], and is increasingly pertinent to land-use management [2,4]. Vackar et al. found that the human appropriation of NPP (HANPP, which is an important indicator of environmental sustainability) amounted to 56% of the annual potential natural NPP in the territory of the Czech Republic [5]. In particular, urban ecosystem NPP is a key indicator of vegetation health in urban ecosystems, which provide critical services to urban residents, including the “regulating services” (e.g., purification of air and water, and regulation of climate and floods), “cultural services” (e.g., recreational, spiritual, religious and other nonmaterial benefits), and “supporting services” (e.g., nutrient cycling) [6]. For example, Lazzarini et al. found the observed diurnal cool island effect in hot desert cities could be largely explained by relative vegetation abundance [7]. Since human well-being in urban areas depends on the ecosystem services provided by urban vegetation, urban sustainability depends on the sustainability of urban ecosystems [8].
The ecosystem health of urban vegetation and the ecosystem services provided by them may be vulnerable because of the intensified environmental stresses (e.g., heat and drought) due to future climate change [9]. Multiple lines of evidence indicated that urban ecosystem NPP is sensitive to environmental changes at various spatiotemporal scales. Previous studies have investigated inter-annual variability of NPP in response to climate change [10,11,12,13], the contributions of urbanization and climate change to NPP variations [14,15,16,17], and the effect of urban land transformation on NPP [18]. Most research has been focused on the effect of land use/land cover change and historical climate change; however, the dynamic of NPP in response to future climate/CO2 change effects are still unclear. To predict and manage urban ecosystem sustainability in the 21st century, it is important to estimate the changes of urban ecosystem NPP in response to various future trajectories of climate and CO2. Ecosystem process-based modeling is a powerful tool to quantitatively estimate and predict dynamics in terrestrial biogeochemical cycles and isolate/analyze associated control mechanisms in the context of global change [19,20].
In this study, an urban ecosystem model, the Hierarchical Patch Mosaic-Urban Ecosystem Model (HPM-UEM), was used to predict the responses of the NPP of the Phoenix city, AZ, USA to climate and CO2 changes in the 21st century. The model simulations were conducted in 500-m spatial resolution, and the NPP changes under three representative concentration pathways—RCP2.6, RCP4.5 and RCP8.5—were compared. Numeric experiments and factorial analyses were designed to isolate and quantify the individual effects of temperature, precipitation, and CO2 changes, and their interactive effects on NPP. The research objectives are: (1) projecting the trends of urban ecosystem NPP so as to evaluate the performance (growth, coverage, health, etc.) of the urban vegetation in the Phoenix city in the 21st century under different future RCP scenarios; (2) identify the major environmental controls (climate factors or CO2) over the NPP dynamic in the 21st century; and (3) identify the land-use hotspots and sensitive ecosystems in the city, whose NPP may change dramatically in the 21st century. The major purpose is to subsequently understand NPP changes in response to environmental variability and explore urban ecosystem services and urban ecosystem sustainability.

2. Materials and Methods
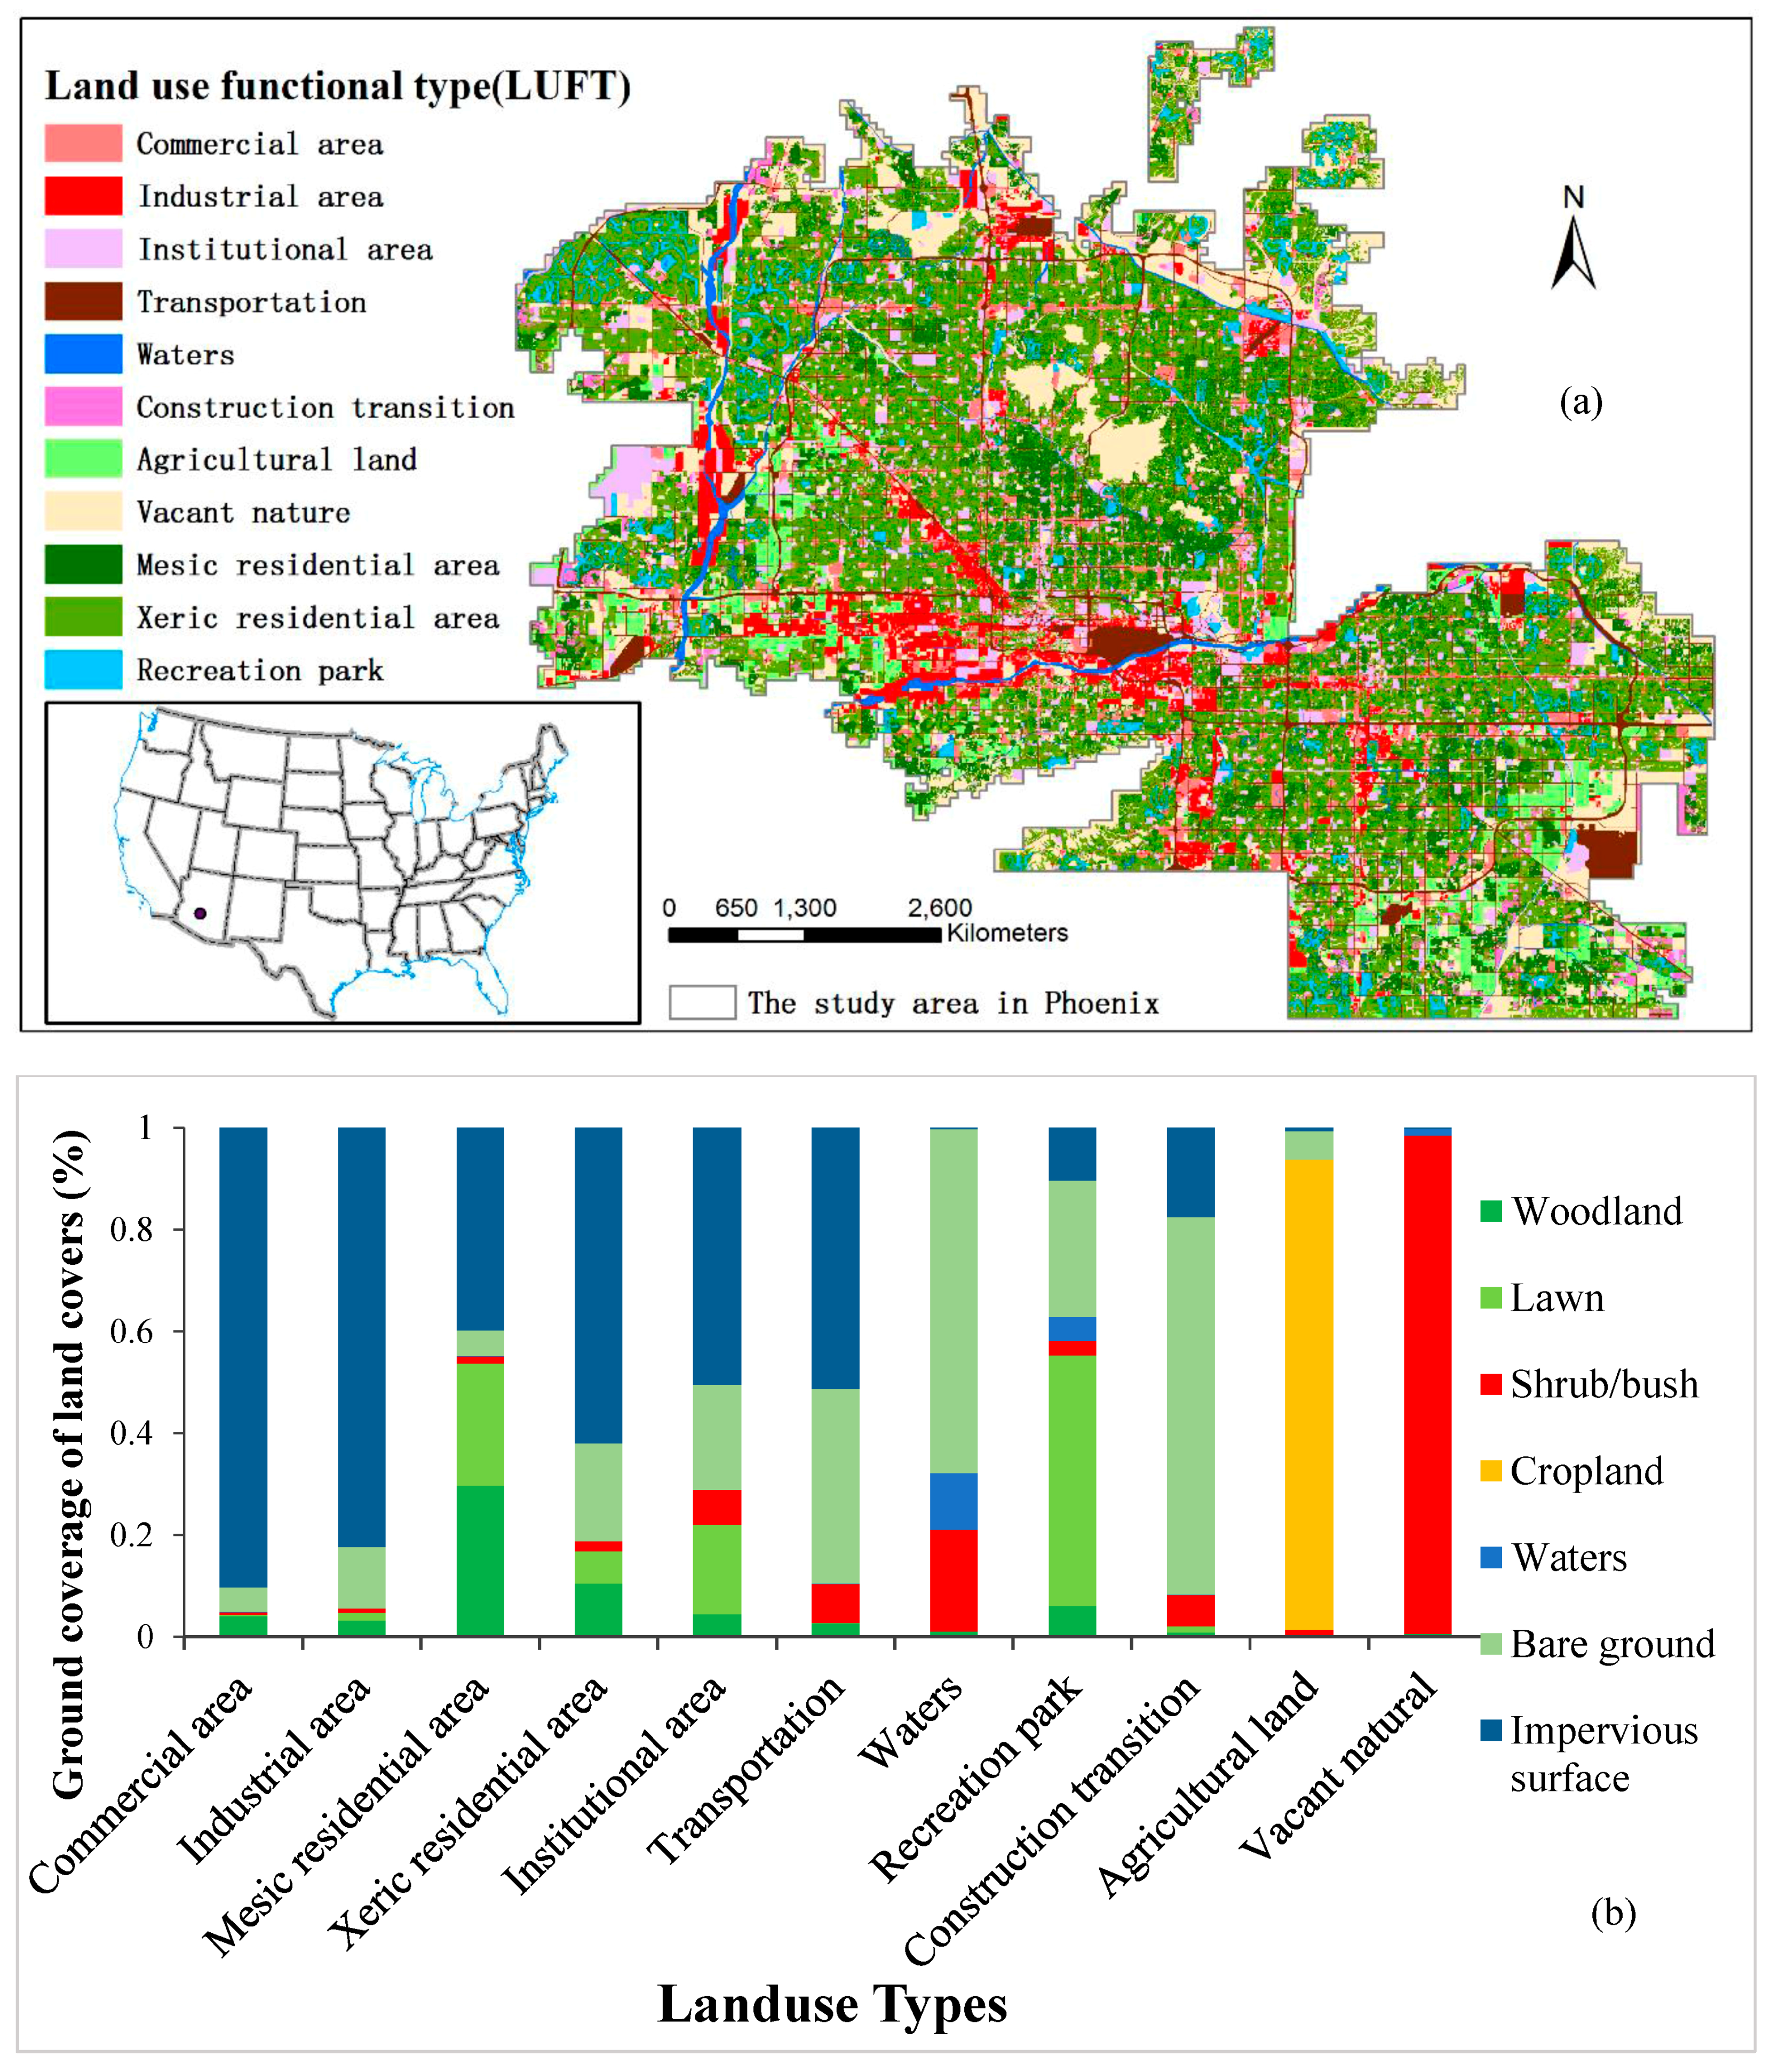
2.1. Study Area

The study area (~2902 km2 made up of 11,608 grids points at 500-m resolution) included Phoenix, Arizona and portions of surrounding agricultural land and desert (central latitude/longitude: 33.52°/−12.08°; average elevation: 340 m) (Figure 1). The city has a population of more than 4 million people (US Census Bureau, 2010). The mean annual precipitation is 180–210 mm, about 65% of which occurs in the winter from November to April and the remaining ~35% occurs as monsoonal thunderstorms from June to August. Mean annual temperature is 22 °C, with hot summers and mild winters. Native vegetation is desert shrub/scrub communities. Urbanized area is occupied by large areas of either cultivated grass and broadleaf trees or desert-like landscaping with drought-tolerant shrub species and gravel ground cover [21] (Table 1).

2.2. Model Description

The HPM-UEM (Hierarchical Patch Mosaic-Urban Ecosystem Model) is a multi-scaled and process-based terrestrial ecosystem model, which explicitly treats spatial pattern and hierarchical structure of urban landscape by incorporating both top-down controls and bottom-up mechanisms in urban environment [21]. Based on the conceptual model of Hierarchical Patch Dynamics [22,23,24], the HPM-UEM includes six nested hierarchical levels: region → landscape → land-use → land-cover (or local ecosystem) → plant population → individual plant. The biophysical and ecophysiological processes at and below local ecosystem scale are simulated at daily time-step based on knowledge from natural ecosystems, with carbon and water cycles coupled [25,26]. At higher levels, factors associated with landscape patterns, land management, and multiple environmental changes (e.g., climatic conditions, CO2) were explicitly incorporated into the spatially nested land hierarchy. To address the spatial heterogeneity in the landscape and environments, urban lands are treated as spatially nested patch mosaics in the HPM-UEM. By addressing the six hierarchical levels from individual plant to urbanized region, the model provides a “hierarchical ladder” to scale up local ecosystem functions across the nested urban land hierarchies and facilitate linking ecosystem processes and socioeconomic drivers. The model has been extensively evaluated against observed NPP and carbon pools in our study area in a previous study [21]. This research was based on the model parameters developed in the previous study [21], with updated land-use map and land-use/land-cover parameters for the Phoenix city, and extended climate and CO2 data from 2006 to 2099.
In HPM-UEM, NPP (g C/(plant·year)) of individual plant is calculated as
NPP = GPP R a
where GPP is the gross primary productivity (g C/(plant·year)), and R a is the autotrophic respiration rate (g C/(plant·year)).
The model estimates the photosynthesis rate of a plant (A) following a biochemical model of leaf photosynthesis originally developed by Farquhar et al. (1980) [27] and subsequently expanded by Collatz et al. (1992) [28] and other researchers (Sellers et al., 1996; Bonan, 1996) [29,30]. Unlike empirical models, HPM-UEM does not directly simulate the correlation between environmental factors (CO2, temperature, precipitation, etc.) on photosynthesis. Instead, photosynthesis is explicitly connected to stomatal conductance (i.e., gs) and controlled by multiple environmental factors. The photosynthesis rate is initially calculated on the leaf level.
A = min(wc, wj, we)
w c = {   ( c i Γ * ) × V max c i + K c × ( 1 + o i K o )   ( C 3   PFT ) V max   ( C 4   PFT ) w j = {   ( c i Γ * ) × 4.6 × α × Rad abs , PAR c i + 2 × Γ *   ( C 3   PFT ) 4.6 × α × Rad abs , PAR   ( C 4   PFT ) w e = {   0.5 × V max   ( C 3   PFT ) 4000 × V max c i Pressure   ( C 4   PFT )
where c i and o i are the partial pressure of internal leaf CO2 and O2, respectively (Pa); P r e s s u r e is the atmospheric pressure (Pa); Γ * is the CO2 compensation point (Pa); Kc and Ko are the Michaelis–Menten constants for CO2 and O2; absorbed PAR ( R a d a b s , P A R ; W/m2) is converted to photosynthetic photon flux by assuming 4.6 µmol photons per Joule; α is the quantum efficiency; and Vmax is the maximum rate of carboxylation varied with temperature (T, °C), and the water potential of the crown ( ψ c r n , kPa):
V max = V max 25 × α vmax T 25 10 × f ( T ) × f ( ψ c r n )
where V max 25 is the maximum carboxylation rate at 25 °C; αvmax is a temperature sensitivity parameter, indicating the magnitude of change in Vmax with temperature altering every 10 °C away from the reference temperature (25 °C); f(T) is an empirical function that delineates the response of leaf carboxylation to temperature; and f ( ψ c r n ) is an empirical function that that delineates the response of leaf carboxylation to the leaf water potential.
f ( T ) = ( T T m i n ) × ( T T m a x ) ( T T m i n ) × ( T T m a x ) ( T T o p t ) 2
f ( ψ c r n ) = min { 1 , max [ 0 ,   ( ψ c r n ψ c l o s e ) ( ψ o p e n ψ c l o s e ) ] }
where T m i n , T m a x and T o p t are minimum, maximum, and optimum temperature (°C) for photosynthesis, respectively; ψ c l o s e and ψ o p e n are thresholds of crown water potential (kPa) at which stomata of leaf begin to fully close and fully open, respectively; and ψ c r n is calculated as
ψ c r n = n = 1 N ( R o o t f r a c t n   ×   ψ n   ) + 15 × H
where n denotes the nth soil layer; ψ n (kPa) denotes the water potential in soil layer n; R o o t f r a c t n denotes the fraction of root biomass in soil layer n; and H (m) is the height of plant. H = 0 for non-woody plants. Following Friends et al. (1997) [31], HPM-UEM assumes that the effective water potential decreases by 15 kPa /meter from soil surface to the top of crown.
The assimilation rates (GPP; g C/(s m2 LA)) on a unit-projected leaf area basis for both C3 and C4 plants are estimated independently for the sunlit and shaded canopy fractions. The GPP of a plant is then calculated by multiplying A with the leaf area of the plant:
GPP = d a y l × f G P P , S W × ( L A s u n l i t × A s u n l i t + L A s h a d e d × A s h a d e d )
where dayl (s) is the length of day and f G P P , S W is the effect of soil water deficiency on productivity.
f GPP , SW = tran Ptran
where tran (mm/s) and Ptran (mm/s) are actual and potential transpiration rate of the plant. The details of the water-uptake and transpiration module has been described by Zhang et al. [21].
R a = R m + R g
where R m (g C/(plant day)) is the daily maintenance respiration calculated as a function of the ambient temperature [21]. After maintenance respiration is subtracted from the GPP, 25% of the remainder is taken as growth respiration, which is the cost of producing new tissues [32].

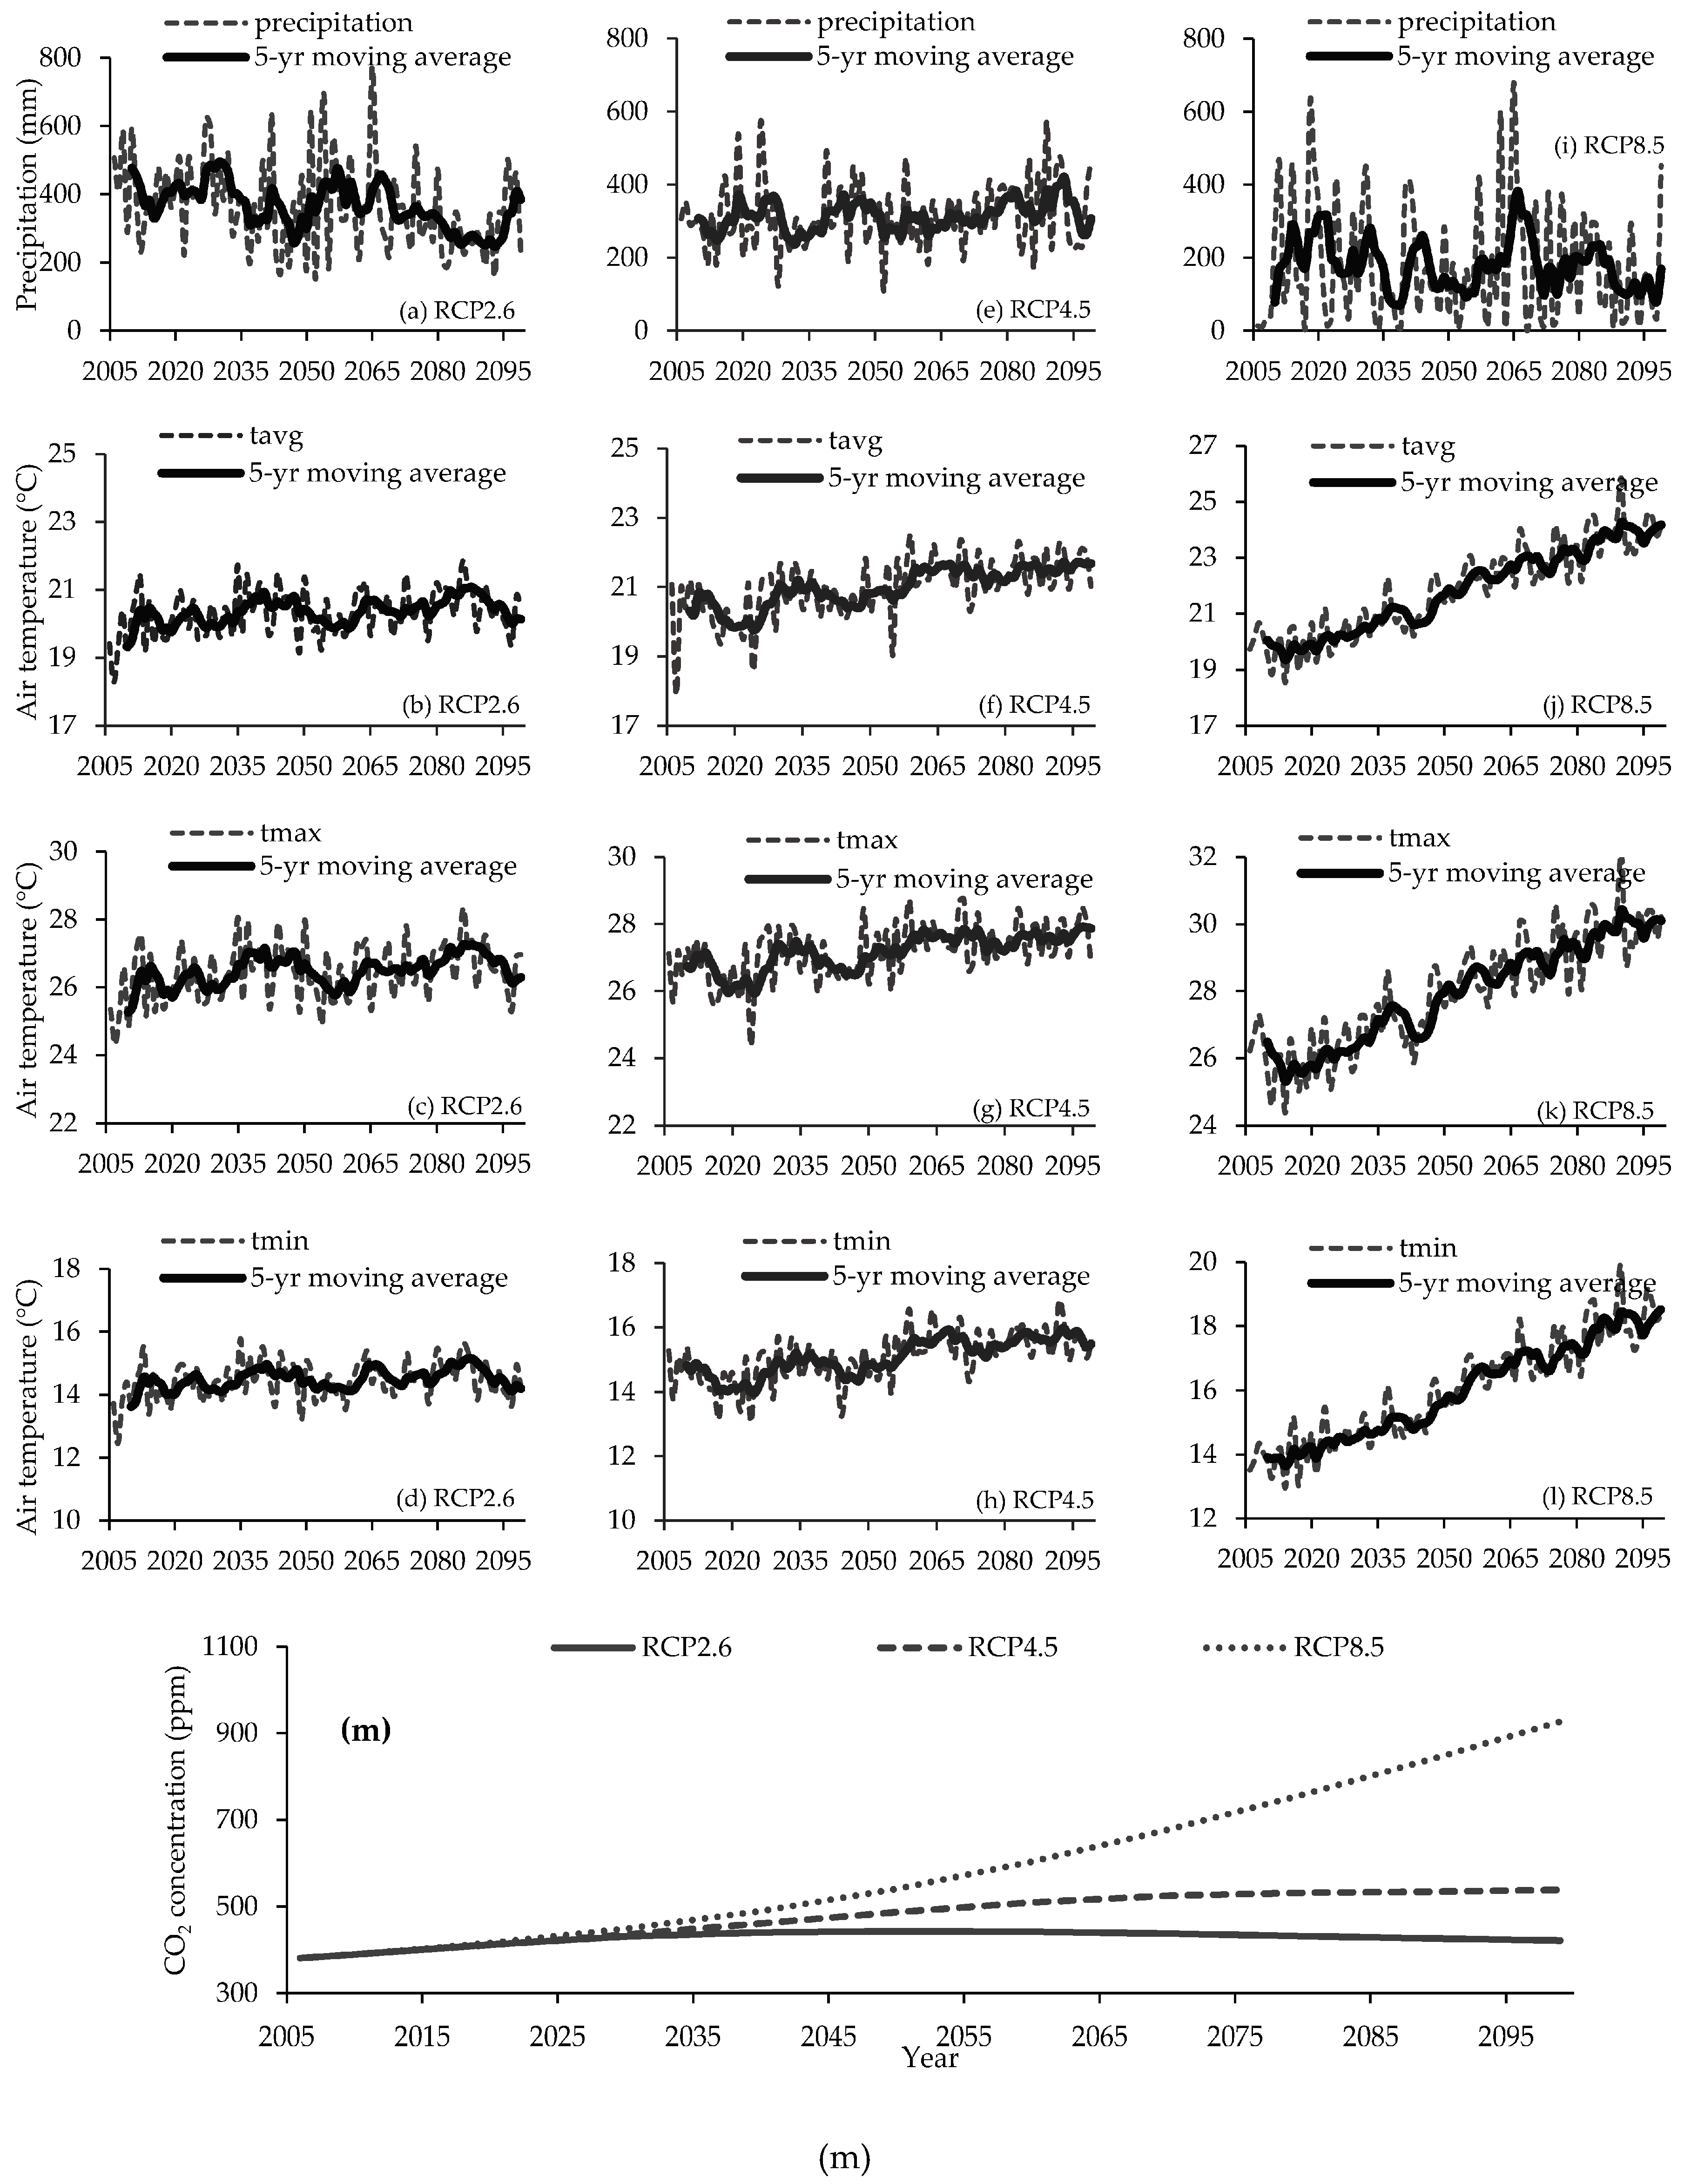
2.3. Input Data Description

The model inputs include 500-m resolution spatial datasets of climate, atmospheric CO2, land-use and land-cover, and base maps for the study area. The base map datasets contain: (a) the topographic maps (elevation, slope, and aspects) derived from the 7.5-min US Geological Survey (USGS) National Elevation Dataset (NED); (b) the soil maps contain bulk density (g/cm3), volumetric content of sand and clay (%), depth (m), and acidity (pH), which are generated from 1-km resolution digital general soil association map; and (c) spatial map of nitrogen deposition based on the study of Grossman-Clarke et al. (2005), Baker et al. (2001), and Lohse et al. (2008) [33,34,35]. A detailed description of sources and the development of the base map datasets are found in Zhang et al. [21].
Future climate trends were based on the fifth phase of the Coupled Model Intercomparison Project (CMIP5) projections [36] (https://esgf-data.dkrz.de/search/esgf-dkrz/). The CMIP5 strategy includes several types of long-term climate change modeling experiments. The core simulations within the suite of CMIP5 long-term experiments include future projection simulation forced with specified concentrations [referred to as “representative concentration pathways” (RCPs)]. The labels for the RCPs provide a rough estimate of the radiative forcing in the year 2100 (relative to preindustrial conditions). For example, the radiative forcing in RCP8.5 increases throughout the twenty-first century before reaching a level of about 8.5 W m−2 at the end of the century. In addition to this “high” scenario, RCP4.5 is intermediate, and there is a low, so-called peak-and-decay, scenario, RCP2.6, in which radiative forcing reaches a maximum near the middle of the twenty-first century before decreasing to an eventual nominal level of 2.6 W m−2 [36,37]. The future climate projections from different general circulation model (GCM) models could be very different. Because of the large number of simulation unit (over 11 thousand grid pixels) and long simulation time-period (100 years with a daily time-step) in this study, it was practically impossible to conduct multiple simulations for each RCP scenario (currently, each round of simulation takes more than one month, not including the additional time for data processing). Therefore, different GCM model products were evaluated using historical (2000–2005) climate datasets developed based on observational climate records from local meteorological stations [21] (Table 1). Then, based on the evaluation result, the best GCM product was selected to develop the high-resolution future climate dataset to drive the model simulation. In total, there are only eight GCM model products meet the data requirement of this study (Table 1). Our evaluation indicated the MPI-ESM-MR model products have the best performance in the study area, with highest correlation (R2 = 0.85) and least bias of −81. Therefore, the future climate and CO2 datasets for the Phoenix (2006–2099) were developed based on the MPI-ESM-MR model products and the RCP protocol, which were statistically downscaled to 500-m resolution based on a high-resolution historical (2000–2005) climate and CO2 dataset of the Phoenix city [21] using the Localized Constructed Analogs (LOCA) method [38,39]. The LOCA spatial downscaling procedure includes four steps: (a) develop analog pool points and spatial masks; (b) select analog days at the regional scale; (c) find the one best matching analog day at the local scale; and (d) construct final downscaled field using scale factors. Another detailed description of the LOCA methodology can be found in Pierce et al. [40].
The land-use map used in this study was based on the 2012 Maricopa land-use map developed by the Maricopa Association of Governments (MAG) (http://geo.azmag.gov/maps/landuse). In total, 11 land-use types were identified in the Phoenix city including commercial area, industrial area, mesic residential area, xeric residential area, institutional area, transportation, waters, recreation park, construction transition, agricultural land, and vacant nature, respectively (Figure 1a). To define the land-cover composition of the land-use types, 50 sampling plots (each with 100 m × 100 m size) for each of the 11 land-use types were selected randomly. Then, by visual classification based on a 0.25-m remote sensing images from Google-Earth (Spot5, Phoenix, AZ, USA), we estimated the land fraction of seven land-cover types (woodland, lawn, shrub/bush (shrubland), cropland, waters, bare soil, and impervious surface area) in each land-use sampling plot, and calculated the mean land-cover composition in each of the 11 land-use type in the Phoenix city (Table 2; Figure 1b).

2.4. Experimental Design and Factorial Analysis

The implementation of HPM-UEM simulation includes three steps: (a) equilibrium run; (b) spin-up; and (c) transient run. The main purpose of equilibrium run was to establish a baseline for the biomass, soil carbon and water pools. The model was driven by the initial climate datasets and CO2 concentration in the year of 2000 at the equilibrium step. Then, a spin-up run of 1000 (200 spins × 5 years/spin), driven by random data sequence of de-trend climate data of 2000–2005 was conducted to reduce biases in the transient simulations. Finally, the time series data for climate and CO2 was applied to simulate the NPP dynamics in the 21st century (2006–2099) under different RCP scenarios.
To identify the magnitude and relative contribution of various environmental factors (temperature, precipitation, and CO2 concentration), four numeric experiments were designed. The OVERALL experiment (multifactor) was set up to simulate the combined effect of climate and CO2 change on NPP during the entire study period. The other experiments—CO2, TMP, and PPT—were set up to project the relative devotion of CO2 change (or CO2 fertilization effect), temperature change, and precipitation change on NPP during the entire period, respectively. In the multifactor experiment (i.e., OVERALL), all environmental factors were allowed to change from day by day. In the three other factorial experiments, one factor was changed while the others were kept unchanged (to the level of equilibrium year); taking the CO2 experiment for example, CO2 concentration was transient during 2000–2099 while climate data (temperature and precipitation) were kept at the equilibrium level. Based on the simulation results, a serial of factorial experiments were conducted to quantify the individual effects of CO2/climate factors:
E f f e c t f a c t o r = N P P f a c t o r ,   e n d     N P P f a c t o r ,   s t a r t ( where   factor   ϵ   [ C O 2 ,   T M P ,   P P T ] )
where E f f e c t f a c t o r is the magnitude of NPP change during a certain time period as defined by the subscriptions of “start” to “end” in response to the changes in climate/CO2 factors (including CO2, temperature, precipitation). Following previous studies [41,42], the NPP dynamics during the first-half, second-half, and the whole 21st century were estimated by comparing the five-year averaged NPP of the early-21st century (2006–2010), mid-21st century (2048–2052), and late-21st century (2059–2099). For example, the “start” was set to the 2006–2010 period, and “end” was set to “2048–2052”, when estimating the NPP change during the first-half of the 21st century.
In order to compare our simulated CO2 fertilization effect with other studies, we calculated its growth factor (or beta factor) based on Keeling’s formula [43]:
β = ( N P P E N P P B 1 ) /   L N ( C O 2 E C O 2 B )
where β is the normalized CO2 effect; and E and B denote experiments under elevated CO2 and baseline CO2, respectively.

3. Results

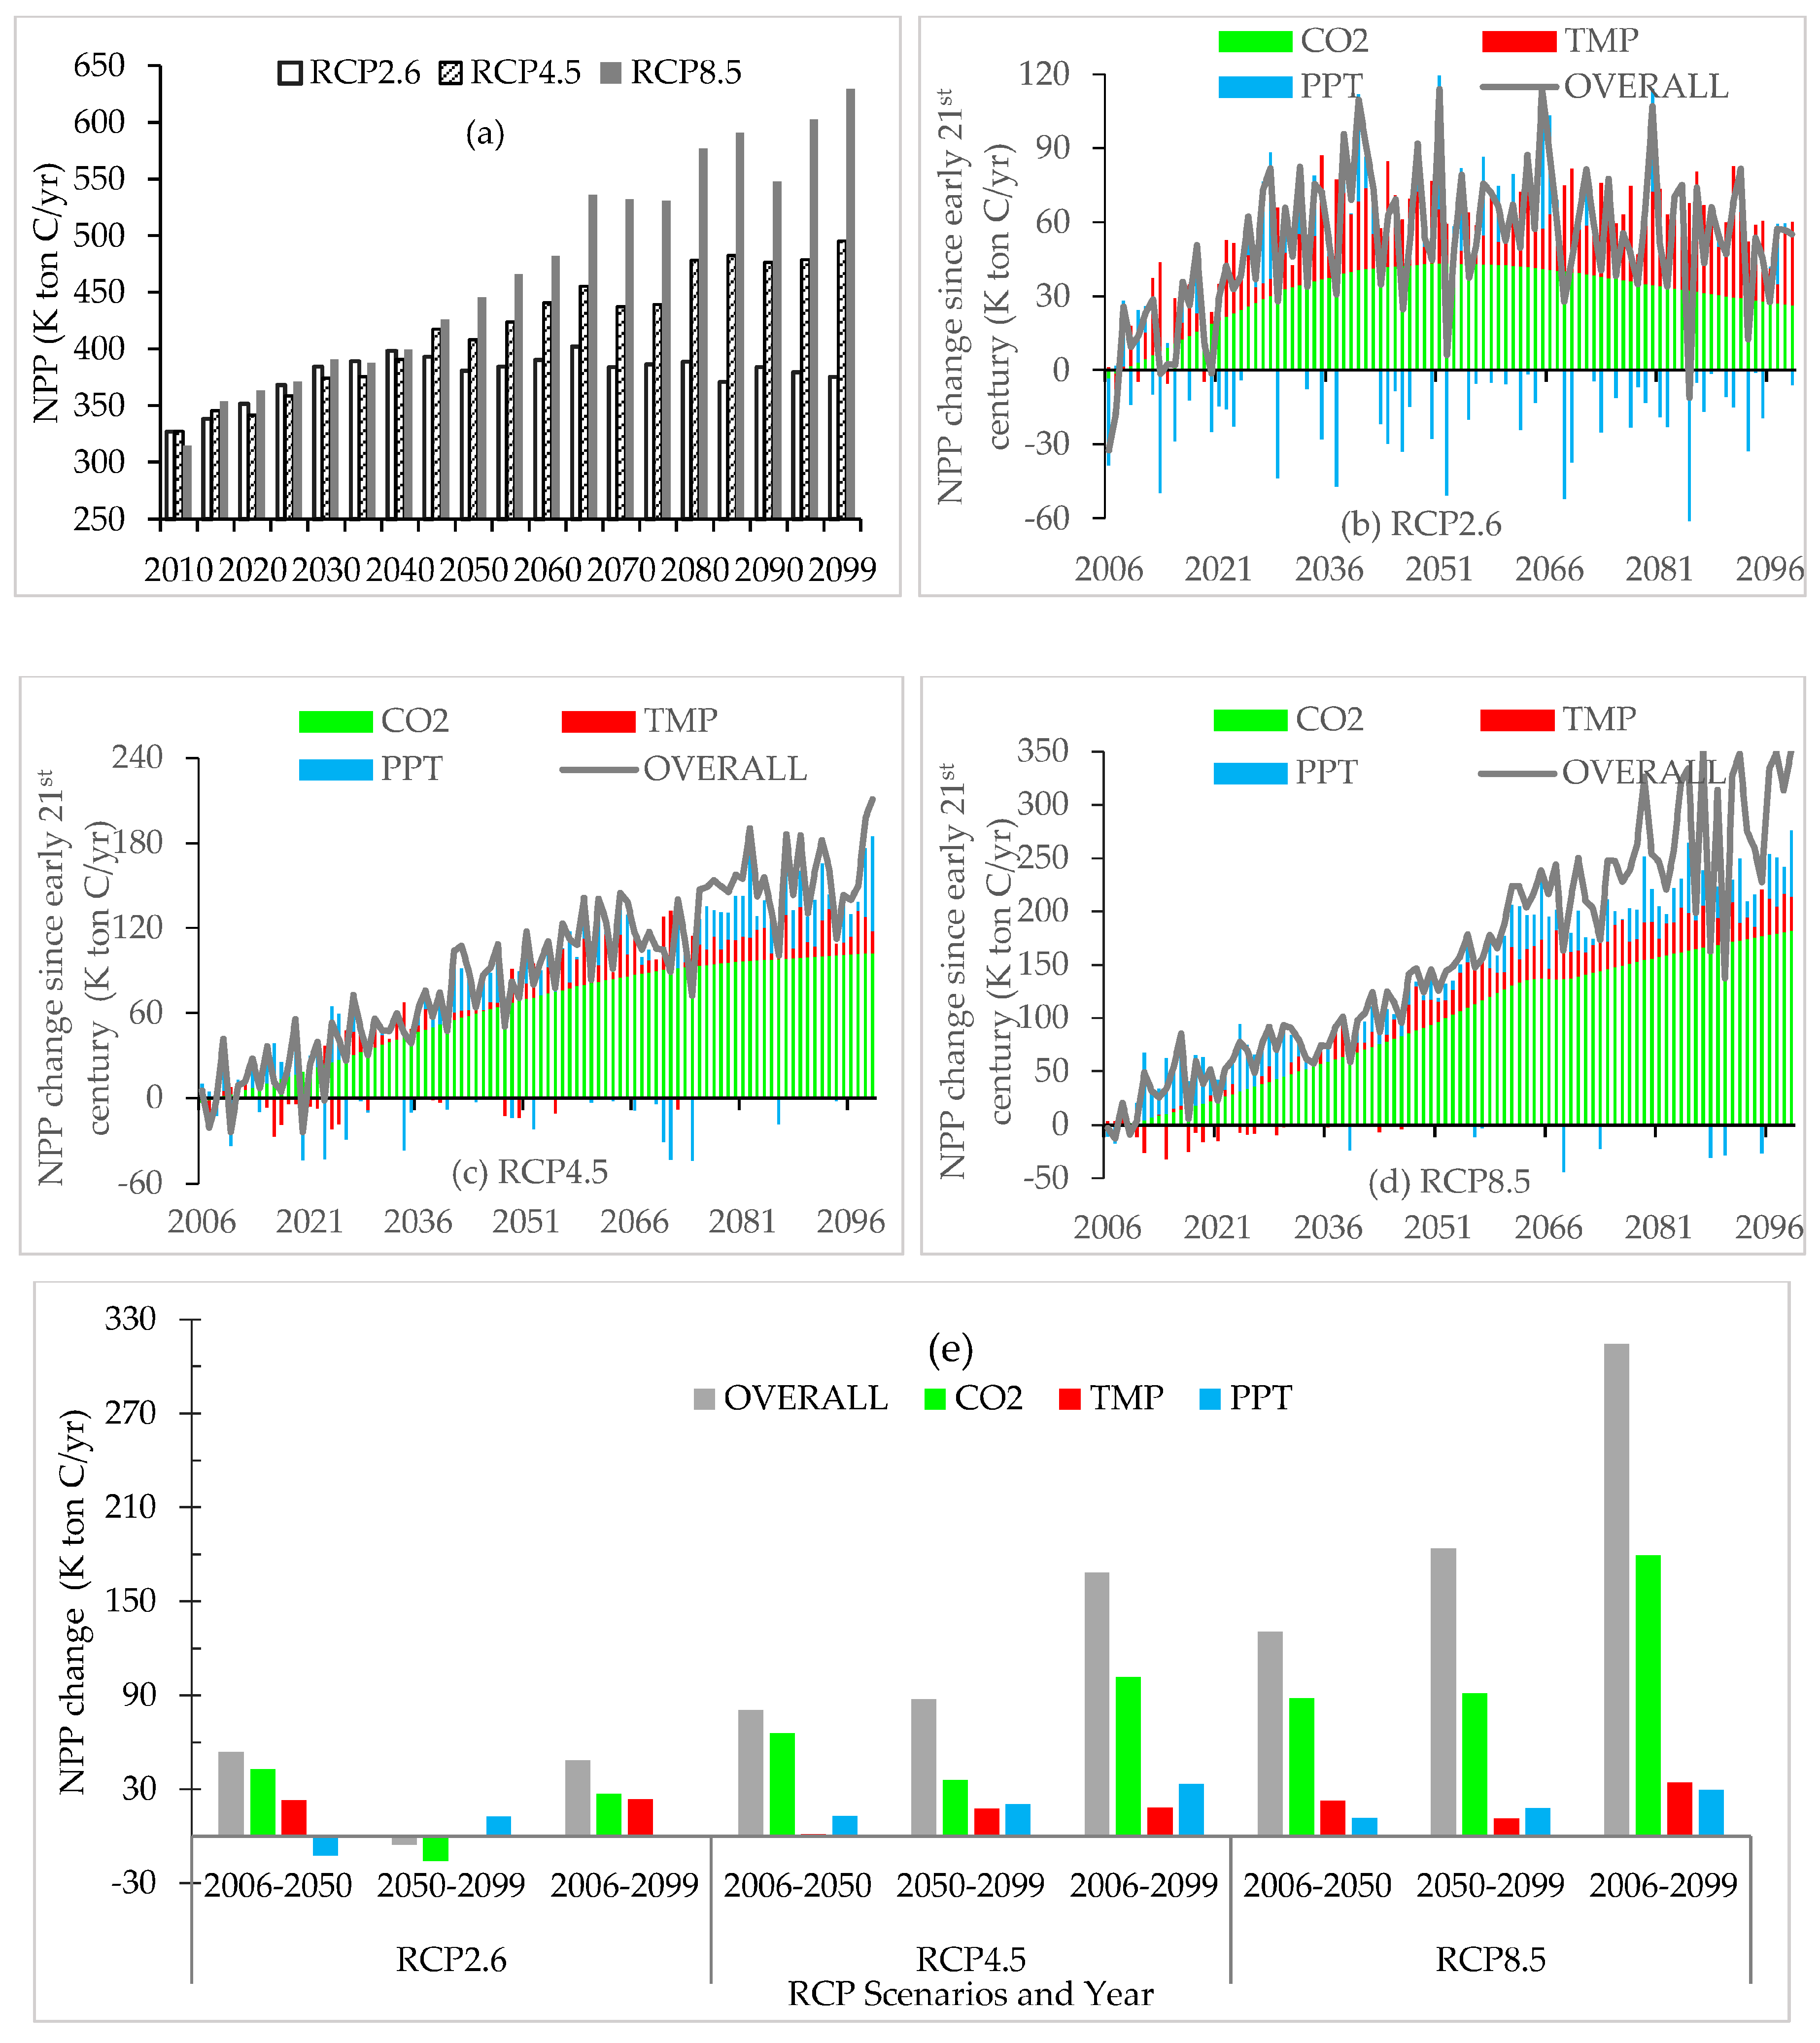
3.1. Temporal Change Pattern of NPP

During the 21st century (comparing the early-21st century (2006–2010) with the late-21st century (2095–2099)), the regional averaged air temperature in Phoenix city would increase by 0.80 °C, 0.69 °C, and 4.45 °C under RCP2.6, RCP4.5, and RCP8.5 scenarios, respectively; the precipitation would increase 114.3% under RCP8.5 scenario but decrease by 1.9% and 0.2% under RCP2.6 and RCP4.5 scenarios, respectively. The atmospheric CO2 concentration increased by 40.5 ppm, 156.99 ppm, and 545.85 ppm under RCP2.6, RCP4.5, and RCP8.5 scenarios, respectively, as shown in Figure 2. The simulation indicated the climate changes and elevated CO2 concentration would result in a net increase of urban ecosystem NPP in the Phoenix city (from 2006–2099), as shown in Table 3 and Figure 3a. The increase rates of NPP would differ strongly under the different future climate scenarios, ranging from 15% under the RCP2.6 scenario to 100% under the RCP8.5 scenario. During the 21st century, the NPP would increase steadily under both the RCP4.5 and RCP8.5 scenarios, although the NPP increase rate of the later would be twice higher than the former. Under the RCP8.5 scenario, the NPP would increase 41% in both the 1st half and the 2nd half of the 21st century. Under the RCP4.5 scenario, the increase rate of NPP would slow down slightly from 25% during the 1st half of the century to 21% during the second half of the century, possibly related to the declined precipitation. In contrast, the NPP would first increase 16%, reaching peak by the mid of the 2040s, after which the growing trend would disappear under RCP2.6, possible related to the declined precipitation and the atmospheric CO2 concentration.

3.2. Relative Contributions of Environmental Factors to NPP Changes

The results showed that relative contribution of environmental factors on urban ecosystem NPP would vary significantly in Phoenix (Table 4). The overall trends of the urban NPP would apparently be dominated by the CO2 fertilization effects, which would account for 56–61% of the NPP increase during the 21st century (Table 4). The dominant role of the CO2 effect on future NPP would be particularly obvious under the RCP4.5 and RCP8.5 scenarios (Figure 3c,d). The air temperature and precipitation would influence the inter-annual fluctuation of the NPP (Figure 3b–d). The temperature change would contribute to 49% of the NPP increase under the RCP2.6 scenario (Table 4). The precipitation change would contribute to 20% of the NPP increase under the RCP4.5 scenario (Table 4). It is noteworthy that the reduced precipitation (19%) would result in a 4% loss in NPP during the first half of the 21st century, and the declined CO2 concentration would lead to a 4% loss in NPP during the 2nd half of the 21st century, under the RCP2.6 scenario (Table 4; Figure 3e).

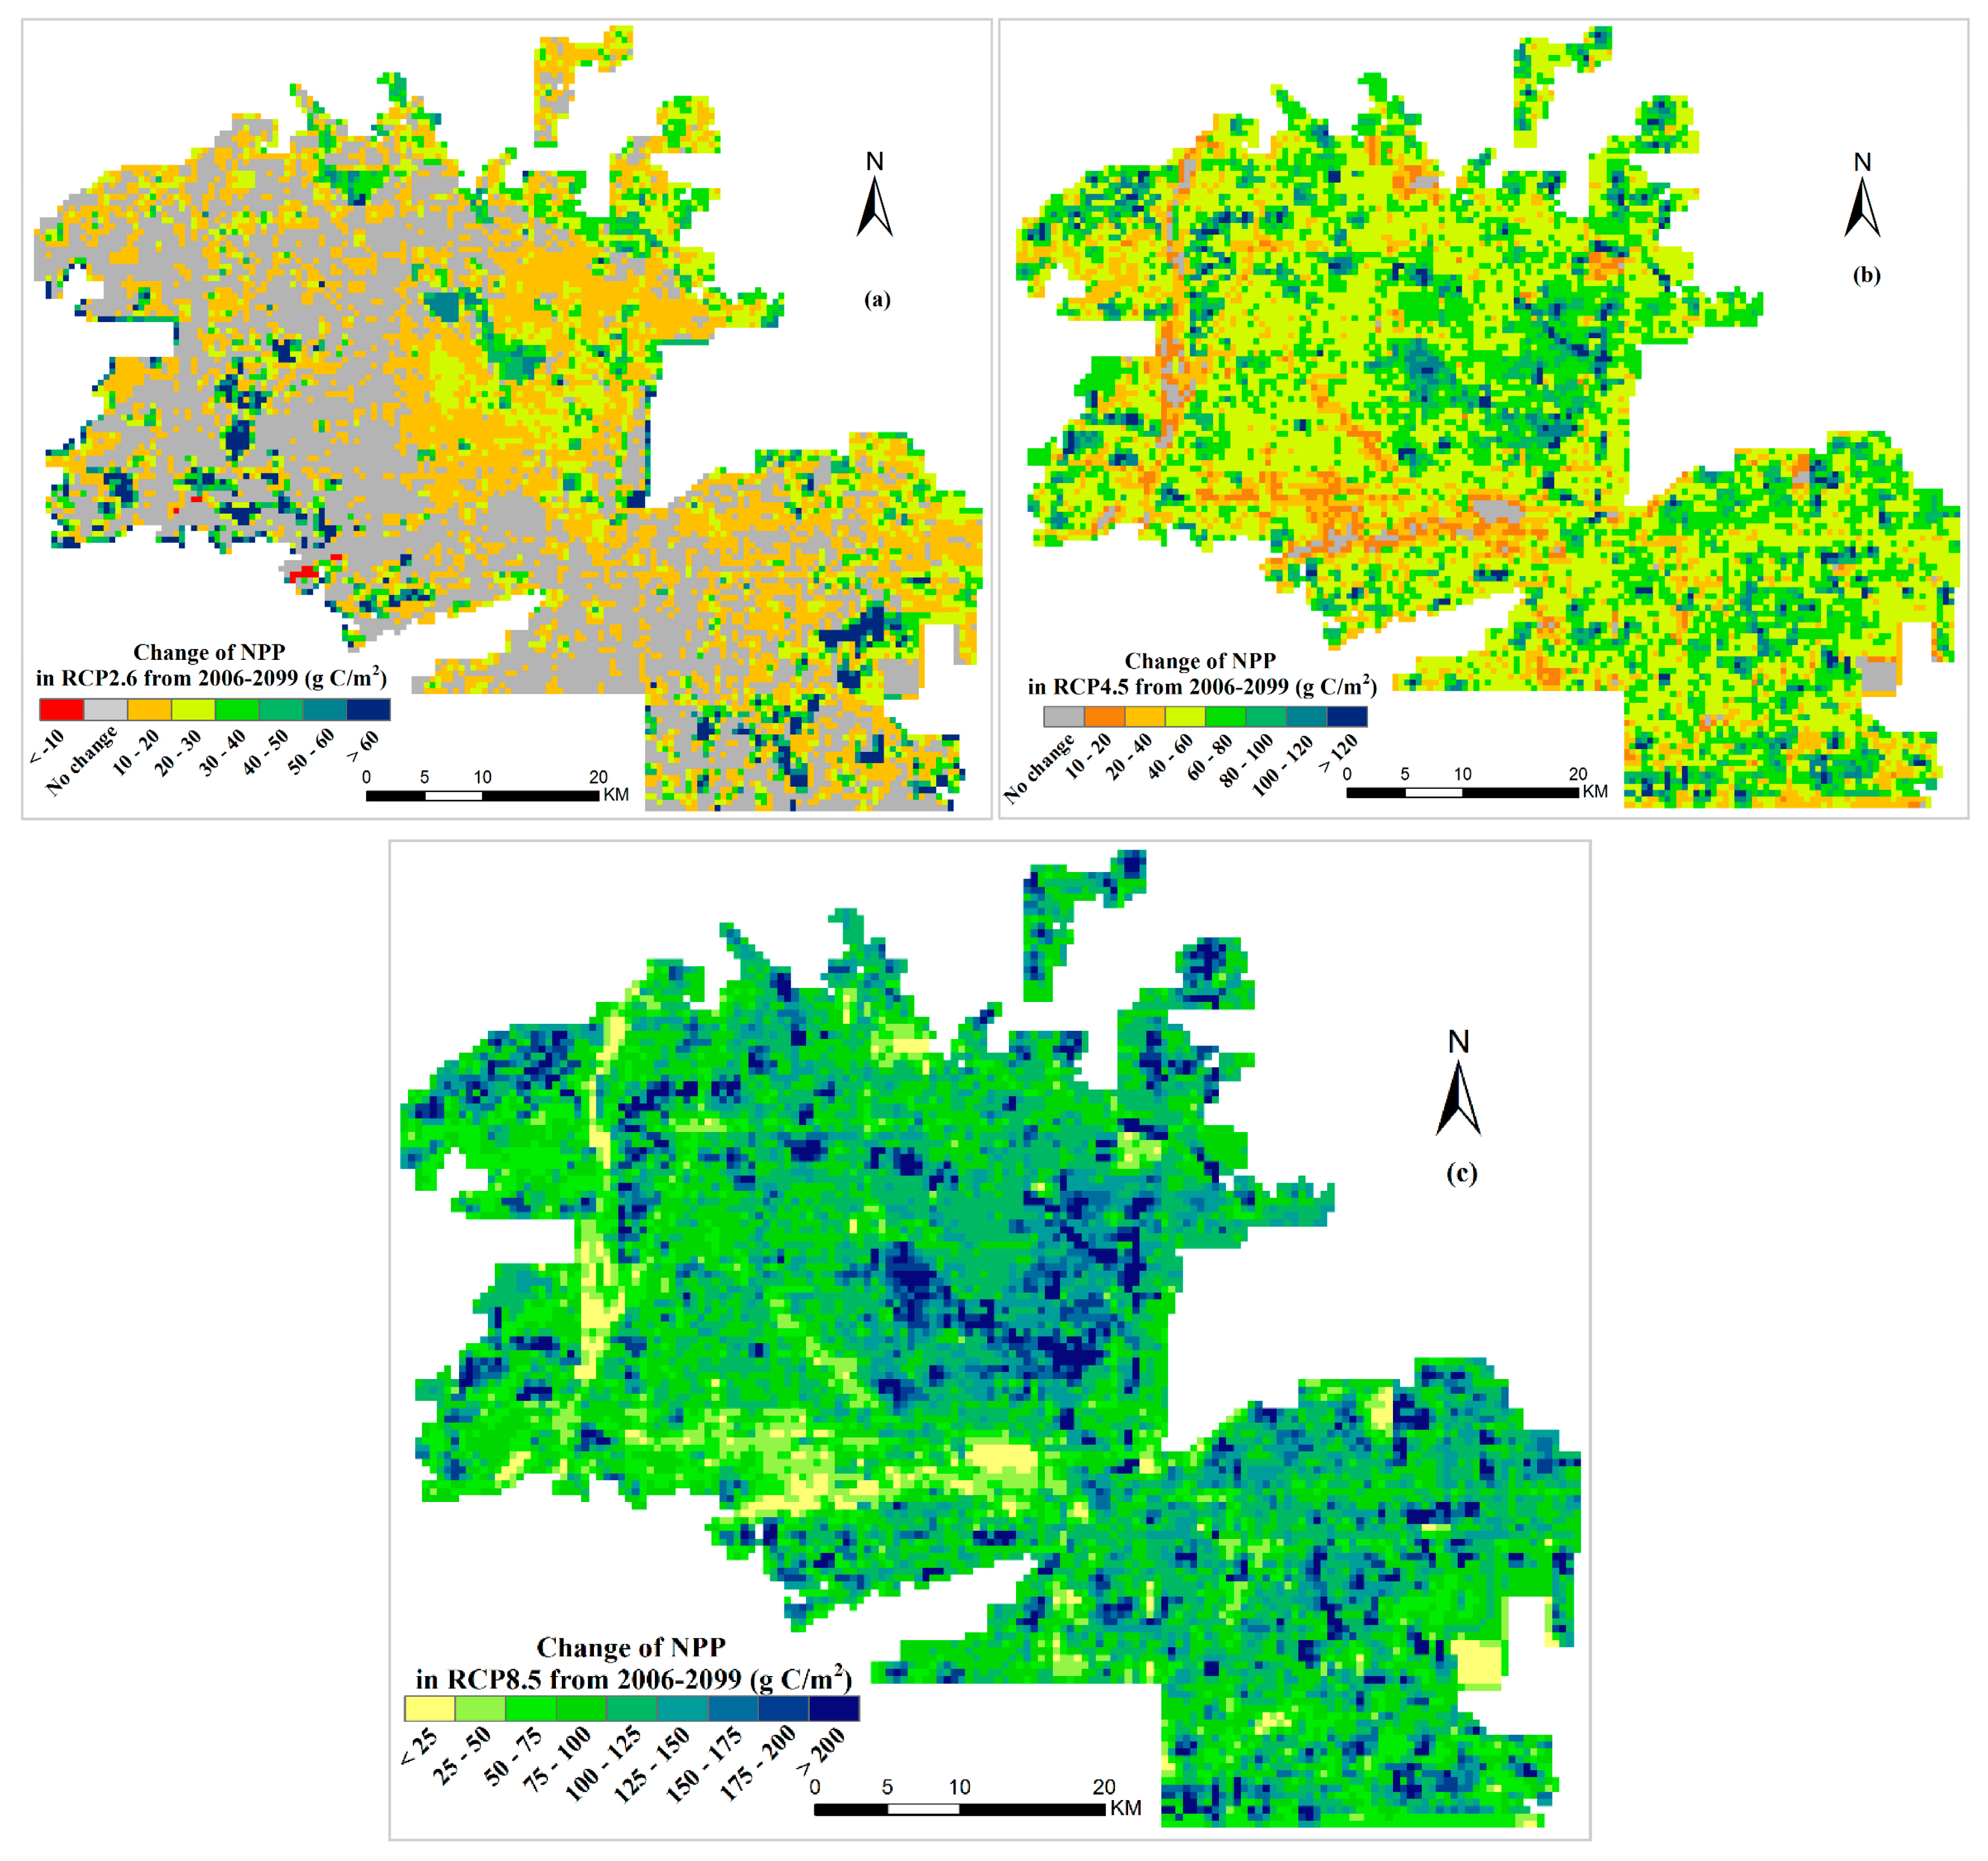
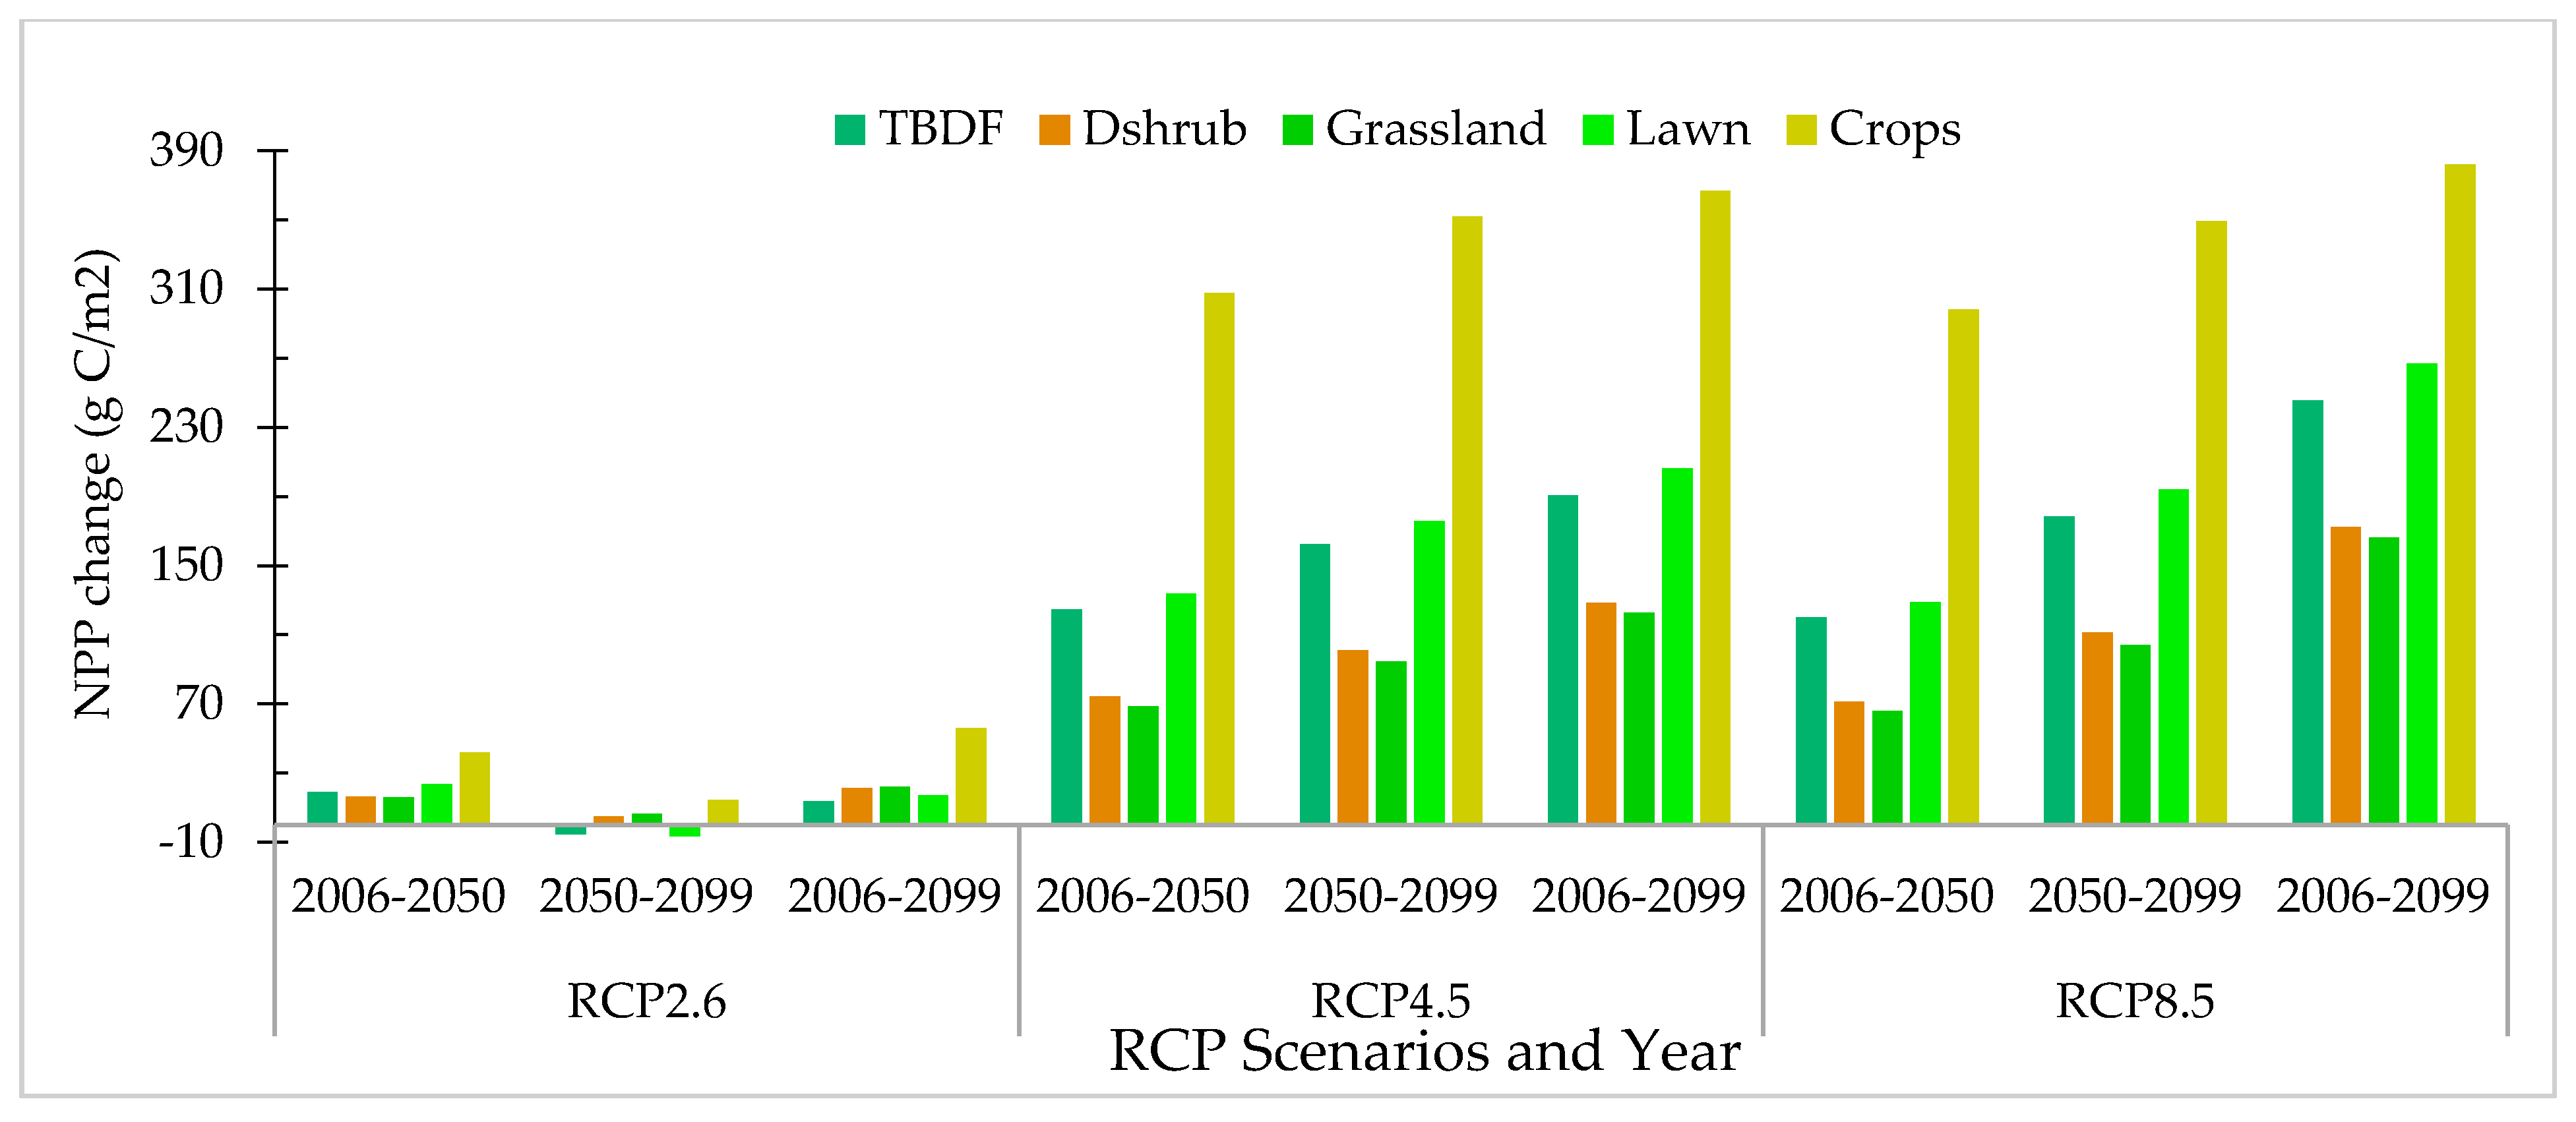
3.3. Spatial Variation in NPP and the Responses from Different Ecosystem Types

Under the RCP2.6 scenario, the NPP of about 39.38% of the urban ecosystem, mostly located in the western and southern Phoenix, would not change much (the grey areas in Figure 4a) during the 21st century, while the strongest NPP increase (generally >60 g C/m2) would be found in the agricultural lands located in western and southeastern Phoenix. Under the RCP4.5 and RCP8.5 scenarios, most of the urban ecosystems, except for the industrial and transportation lands that mainly locate to the north of Salado River, would see a significant increase of NPP (>40 g C/m2 under the RCP4.5 scenario, and >75 g C/m2 under the RCP8.5 scenario) during the 21st century, with the strongest NPP increase (>200 g C/m2 under the RCP8.5 scenario) found in the mesic residential areas that mainly locate in the east, south, and southwest of the Phoenix Mountains Preserve (including Moon Hill, Shaw Butte, North Mountain, Stoney Mountain, Dreamy Draw, Squaw Peak, and the informally named Quartzite Ridge [44]) (Figure 4b,c).
Among the different ecosystem types (or land-cover type), the crop ecosystems would have the strongest NPP increase (at least 43% stronger than any other ecosystem type), followed by the urban lawn and forests, while the remnant dryland including shrubland and grassland would have the weakest NPP increase, under the RCP4.5 and RCP8.5 scenarios (Figure 5). Under the RCP2.6 scenario, the situation will be more complicated. The NPPs of all ecosystem types were projected to increase during the 1st half of the 21st century. Then, as the CO2 concentration declining in the 2nd half of the century under the RCP2.6 scenario, the increase trend of NPP would disappear (in the natural dryland ecosystems) or even reverse (in the urban forest and lawn that would have accumulated large biomass during the first half of the century).

4. Discussion

During the 21st century, the urban ecosystem NPP would universally increase in Phoenix city, whereas the magnitude of NPP trend was different under RCP2.6, RCP4.5, and RCP8.5 scenarios. It is noteworthy that the NPP growth rate exhibited significant variability (i.e., NPPRCP8.5 > NPPRCP4.5 > NPPRCP2.6) with an increase in radiative forcing, as shown in Figure 4. Recent research shows that different radiative forcings have markedly contrasting physiological effects on terrestrial ecosystems [45,46]. Another land surface model, JULE (The Joint UK Land Environment Simulator), has shown that a rise in atmospheric CO2 concentration ([CO2]) from 354 to 426 ppm corresponds to an increase in radiative forcing of +1 W/m2, which generated a higher NPP trajectory [47]. Our simulation also indicates that the effect of CO2 fertilization on NPP outcompetes that of other environmental factors (such as temperature and precipitation) in the 21st century. Zhao et al. found that higher CO2 concentration would strongly enhance terrestrial NPP during the growing season, based on 10 Earth system models participating in the CMIP5 Project (i.e., fifth phase of the Coupled Model Intercomparison) [48]. This is broadly consistent with experimental evidence of CO2 fertilization of photosynthesis [49] and an increase in water use efficiency under elevated CO2 concentration [50]. While the HPM-UEM-simulated β-factor (i.e., the normalized CO2 fertilization effects) fell within the ranges of field observations for grassland and forest, the model underestimated the CO2 fertilization effect on shrubland/desert by 40% to 53%, similar to another model study [51] (Table 5). In addition, our study predicted a 2–4% increase in crop NPP in response to each 100 ppmv [CO2] increase, matching well with the estimates (2.4–4.2%) of Fischer (2009) [52] but lower than the estimates (5–17%) of McGrath and Lobell (2013) [53]. Therefore, the model simulations might have underestimated the impacts of CO2 elevation on the NPP of the remnant shrubland/desert in the Phoenix city.
As a key indicator of ecosystem function, NPP has been shown to correlate with the overall value of ecosystem services [67]. According to Costanza et al. (2007), a 1% increase in NPP corresponding to 2.6% increase in ecosystem value [68]. The significant increases of the NPP under the RCP4.5 and RCP8.5 scenarios imply the climate and CO2 changes may enhance the urban ecosystem services in the 21st century. In particular, the simulated results indicate the cropland yield may increase rapidly in the 21st century (Figure 4). Other studies also showed future climate change may benefit food provision [69,70]. Improved plant growth and leaf area will also enhance other urban ecosystem services such as heat regulation [71], buffering capacity or the absorption capacity for wastes and emissions [72,73], and carbon sequestration [74]. These ecosystem services would partially moderate the worsen heat stress and air pollution in urban areas under the future scenarios [75,76,77,78,79]. It is noteworthy that the wealthy population living in the mesic residential areas may enjoy more benefit from the enhanced ecosystem services than the poorer population living in the xeric residential areas, because the NPP of the mesic ecosystems (lawns and urban forests) would increase much more quickly than the xeric ecosystems (dry shrubs and grassland) (Figure 4 and Figure 5).
Although our model projections indicate that higher atmospheric CO2 may stimulate ecosystem NPP in the urban area, it does not mean that a high CO2 emission scenario is preferable, nor does it imply that the enhanced ecosystem productivity could offset the elevated urban CO2 emission. Even if not taking into account the higher soil CO2 emission due to enhanced heterotrophic respiration under a warmer climate [80], the magnitude of ecosystem NPP in the Phoenix city (629 k ton C/year by the late-21st century, under the RCP8.5 scenario) is too small compared with the anthropogenic CO2 emission (71,356 K ton C/year according to Koerner and Klopatek, 2002) [81]. In fact, the 20 largest U.S. cities each year contribute more CO2 to the global atmosphere than the total land area of the continental United States can absorb [82].
It also should be aware that NPP is only one of the many indicators of ecosystem health. Increased NPP would not necessarily means improved ecosystem sustainability. Rapid climate changes may benefit some plant species more than others (Figure 4) and trigger ecosystem succession [83,84,85]. Since the desert cities like Phoenix are hotspot of climate changes, it is possible that some native species will be at a disadvantage in face of the competition from alien species which can take full advantage of the elevated CO2 in the future [86,87,88,89,90]. The impacts of future climate change on the ecosystem diversity and native ecosystem conservation in the Phoenix metropolitan area are still unclear.
The enhanced vegetation growth in Phoenix may partially alleviate the increased heat stress and pollution under future climate change scenarios. Because of intensive human managements, urban ecosystems may perform better than the natural ecosystems in response to climate stresses [91]. The enhanced NPP of the desert urban ecosystem will cost large amount of irrigation water. As more water resources will be used in urban irrigation, the natural desert ecosystems around the city might suffer water shortage in the future [92,93,94]. In other words, we may expect an improved ecosystem NPP in Phoenix at the cost of serious natural ecosystem degradation in this arid region in the future.
Our study may also underestimate the negative effects of future climate change on ecosystem NPP. A recent study found that climate extremes may reduce the CO2 fertilization effect [95]. Because the HPM-UEM model, like most general ecosystem models, was designed and parameterized to simulate the ecological processes under ordinary climate condition, its performance under climate extremes are questionable. It is possible that the model may underestimated the negative effects of future climate change on NPP. Moreover, the model does not consider the effects of climate change on tropospheric ozone concentration, diseases and disturbances (e.g., increasing wild-fire events), which may threaten the ecosystem sustainability under the future scenarios [53,95,96,97,98,99,100,101]. An ecosystem with higher NPP is not necessarily more resistant to the increased disturbances (drought and flood) in the future. Higher vegetation density plus higher temperature and moisture in urban area may stimulate disperse of pests and infectious diseases [102]. Our study indicates that the rich (those live in mesic residential area) would enjoy more benefits from the improved urban ecosystem services (e.g., better tree shading and a greener landscape) than the poor (those live in xeric residential area and work in open areas such as transportation, construction areas, etc.). However, the underprivileged population is more vulnerable to pests and infectious diseases. Therefore, it is necessary to allocate more resources to the underprivileged population to help them cope with the heat stress (will rise 4.5 °C by the end of the century) and threats from pests and infectious diseases due to the rapid climate change.
Finally, because of the limitation in time and resources (see Section 2.3), this study only used one model driven by one suite of future climate dataset. Although the climate dataset matches well with the historical climate records (Table 1), it does not necessarily mean it can predict future climate change accurately. Multiple ecosystem models with multiple climate datasets approach could reduce the uncertainties in future projections (Wallach et al., 2016) [103]. Meanwhile, uncertainties may exist in our estimated NPP dynamics, which were calculated by comparing the five-year mean NPPs of the beginning and ending years of the study periods. Although this is a common practice in previous studies [41,42], climate anomalies in these years may lead to miscalculations of NPP change trends.

5. Conclusions

Urban vegetation provides ecological services that promote both the ecosystem integrity and human well-being of urban area, and thus is critical to urban sustainability. Using NPP as an indicator, this study investigated the impacts of future climate change on the health of urban vegetation and urban sustainability. A process-based urban ecosystem model, HPM-UEM, was introduced to explore spatiotemporal dynamic of urban ecosystem NPP in the Phoenix city (AZ, USA) under RCP2.6, RCP4.5, and RCP8.5 scenarios during the 21st century. The simulated results found that urban ecosystem’s NPP would increase from 2006 to 2099, whereas NPP variations exhibited obvious differences in the amounts and spatial distributions under different RCP scenarios. The magnitude of NPP increase by 14% (RCP2.6), 51% (RCP4.5), and 99% (RCP8.5) compared to that in the late 2000s. According to factorial analysis, CO2 fertilization effect on NPP variation (accounting for 56–61%) outcompetes that of climate change in the 21st century. NPP trend in Agricultural land and mesic residential area would increase considerably under three scenarios, primarily owing to elevated CO2 concentration and increase in water use efficiency. Although higher ecosystem NPP in the future implies improved ecosystem services that may help to alleviate the heat stress (by providing more shading) and air pollution in the city, this will be at the cost of higher irrigation water usage, probably leading to water shortage in the natural ecosystems in this arid region. Our study indicated the rich (such as in mesic residential area) would enjoy more benefit from the improved urban ecosystem services than the poor (such as in xeric residential area).

Acknowledgments

This study was supported by the National Basic Research Program of China (973) (No. 2014CB954204), and the National Natural Science Foundation of China (No. 413111058). We want to thank the editor and reviewers for their valuable advices and suggestions that helped us improve this manuscript.

Author Contributions

Chi Zhang conceived and designed this study; Chunbo Chen conducted data assimilation, and ran the model; Chunbo Chen and Chi Zhang did resultant analysis and wrote the manuscript.

Conflicts of Interest

The authors declare no conflict of interest.

References

  1. Reeves, M.C.; Moreno, A.L.; Bagne, K.E.; Running, S.W. Estimating climate change effects on net primary production of rangelands in the United States. Clim. Chang. 2014, 126, 429–442. [Google Scholar] [CrossRef]
  2. Xu, X.; Tan, Y.; Yang, G.; Li, H.; Su, W. Impacts of China’s Three Gorges Dam Project on net primary productivity in the reservoir area. Sci. Total Environ. 2011, 409, 4656–4662. [Google Scholar] [CrossRef] [PubMed]
  3. Beer, C.; Reichstein, M.; Tomelleri, E.; Ciais, P.; Jung, M.; Carvalhais, N.; Rödenbeck, C.; Arain, M.A.; Baldocchi, D.; Bonan, G.B.; et al. Terrestrial Gross Carbon Dioxide Uptake: Global Distribution and Covariation with Climate. Science 2010, 329, 834–838. [Google Scholar] [CrossRef] [PubMed]
  4. Feng, X.; Liu, G.; Chen, J.M.; Chen, M.; Liu, J.; Ju, W.M.; Sun, R.; Zhou, W. Net primary productivity of China’s terrestrial ecosystems from a process model driven by remote sensing. J. Environ. Manag. 2007, 85, 563–573. [Google Scholar] [CrossRef] [PubMed]
  5. Vackar, D.; Orlitova, E. Human appropriation of aboveground photosynthetic production in the Czech Republic. Reg. Environ. Chang. 2011, 11, 519–529. [Google Scholar] [CrossRef]
  6. Wu, J. Urban ecology and sustainability: The state-of-the-science and future directions. Landsc. Urban Plan. 2014, 125, 209–221. [Google Scholar] [CrossRef]
  7. Lazzarini, M.; Molini, A.; Marpu, P.R.; Ouarda, T.B.M.J.; Ghedira, H. Urban climate modifications in hot desert cities: The role of land cover, local climate, and seasonality. Geophys. Res. Lett. 2015, 42, 9980–9989. [Google Scholar] [CrossRef]
  8. Wu, J. Landscape sustainability science: Ecosystem services and human well-being in changing landscapes. Landsc. Ecol. 2013, 28, 999–1023. [Google Scholar] [CrossRef]
  9. Shen, W.; Wu, J.; Grimm, N.B.; Hope, D. Effects of Urbanization-Induced Environmental Changes on Ecosystem Functioning in the Phoenix Metropolitan Region, USA. Ecosystems 2008, 11, 138–155. [Google Scholar] [CrossRef]
  10. Hua, L.Z.; Liu, H.; Zhang, X.L.; Zheng, Y.; Man, W.; Yin, K. Estimation Terrestrial Net Primary Productivity Based on CASA Model: A Case Study in Minnan Urban Agglomeration, China. In IOP Conference Series: Earth and Environmental Science; IOP Publishing: Bristol, UK, 2014; Volume 17. [Google Scholar]
  11. Shields, C.; Tague, C. Ecohydrology in semiarid urban ecosystems: Modeling the relationship between connected impervious area and ecosystem productivity. Water Resour. Res. 2015, 51, 302–319. [Google Scholar] [CrossRef]
  12. Yu, D.; Shao, H.B.; Shi, P.J.; Zhu, W.Q.; Pan, Y.Z. How does the conversion of land cover to urban use affect net primary productivity? A case study in Shenzhen city, China. Agric. For. Meteorol. 2009, 149, 2054–2060. [Google Scholar]
  13. Elmore, A.J.; Shi, X.; Gorence, N.J.; Li, X.; Jin, H.; Wang, F.; Zhang, X. Spatial distribution of agricultural residue from rice for potential biofuel production in China. Biomass Bioenergy 2008, 32, 22–27. [Google Scholar] [CrossRef]
  14. Schneider, A.; Logan, K.E.; Kucharik, C.J. Impacts of urbanization on ecosystem goods and services in the u.s. corn belt. Ecosystems 2012, 15, 519–541. [Google Scholar] [CrossRef]
  15. Zhao, S.Q.; Liu, S.G.; Zhou, D.C. Prevalent vegetation growth enhancement in urban environment. Proc. Natl. Acad. Sci. USA 2016, 113, 6313–6318. [Google Scholar] [CrossRef] [PubMed]
  16. Fu, Y.C.; Lu, X.Y.; Zhao, Y.L.; Zeng, X.T.; Xia, L.L. Assessment impacts of weather and land use/land cover (lulc) change on urban vegetation net primary productivity (npp): A case study in Guangzhou, China. Remote Sens. 2013, 5, 4125–4144. [Google Scholar] [CrossRef]
  17. Pei, F.S.; Li, X.; Liu, X.P.; Lao, C.H.; Xia, G.R. Exploring the response of net primary productivity variations to urban expansion and climate change: A scenario analysis for Guangdong Province in China. J. Environ. Manag. 2015, 150, 92–102. [Google Scholar] [CrossRef] [PubMed]
  18. Imhoff, M.L.; Bounoua, L.; DeFries, R.; Lawrence, W.T.; Stutzer, D.; Tucker, C.J.; Ricketts, T. The consequences of urban land transformation on net primary productivity in the United States. Remote Sens. Environ. 2004, 89, 434–443. [Google Scholar] [CrossRef]
  19. Arneth, A.; Harrison, S.P.; Zaehle, S.; Tsigaridis, K.; Menon, S.; Bartlein, P.J.; Feichter, J.; Korhola, A.; Kulmala, M.; O’Donnell, D.; et al. Terrestrial biogeochemical feedbacks in the climate system. Nat. Geosci. 2010, 3, 525–532. [Google Scholar] [CrossRef]
  20. Morales, P.; Sykes, M.T.; Prentice, I.C.; Smith, P.; Smith, B.; Bugmann, H.; Zierl, B.; Friedlingstein, P.; Viovy, N.; Sabate, S.; et al. Comparing and evaluating process-based ecosystem model predictions of carbon and water fluxes in major European forest biomes. Glob. Chang. Biol. 2005, 11, 2211–2233. [Google Scholar] [CrossRef]
  21. Zhang, C.; Wu, J.; Grimm, N.B.; McHale, M.; Buyantuyev, A. A hierarchical patch mosaic ecosystem model for urban landscapes: Model development and evaluation. Ecol. Model. 2013, 250, 81–100. [Google Scholar] [CrossRef]
  22. Wu, J.; Jenerette, G.D.; David, J.L. Linking Land-use Change with Ecosystem Processes: A Hierarchical Patch Dynamic Model. In Integrated Land Use and Environmental Models; Springer: Berlin/Heidelberg, Germany, 2003; pp. 99–119. [Google Scholar]
  23. Wu, J. Hierarchy and scaling: Extrapolating information along a scaling ladder. Can. J. Remote Sens. 1999, 25, 367–380. [Google Scholar] [CrossRef]
  24. Wu, J.; David, J.L. A spatially explicit hierarchical approach to modeling complex ecological systems: Theory and applications. Ecol. Model. 2002, 153, 7–26. [Google Scholar] [CrossRef]
  25. Groffman, P.M.; Pouyat, R.V.; Cadenasso, M.L.; Zipperer, W.C.; Szlavecz, K.; Yesilonis, I.D.; Band, L.E.; Brush, G.S. Land use context and natural soil controls on plant community composition and soil nitrogen and carbon dynamics in urban and rural forests. For. Ecol. Manag. 2006, 236, 177–192. [Google Scholar] [CrossRef]
  26. Niemelä, J. Is there a need for a theory of urban ecology? Urban Ecosyst. 1999, 3, 57–65. [Google Scholar] [CrossRef]
  27. Farquhar, G.; Caemmerer, S.; Berry, J. A biochemical model of photosynthetic CO2 assimilation in leaves of C 3 species. Planta 1980, 149, 78–90. [Google Scholar] [CrossRef] [PubMed]
  28. Collatz, G.; Ribas-Carbo, M.; Berry, J. Coupled photosynthesis-stomatal conductance model for leaves of C4 plants. Aust. J. Plant Physiol. 1992, 19, 519. [Google Scholar] [CrossRef]
  29. Bonan, G.B. A Land Surface Model (LSM Version 1.0) for Ecological, Hydrological, and Atmospheric Studies: Technical Description and User’s Guide; National Center for Atmospheric Research: Boulder, CO, USA, 1996. [Google Scholar]
  30. Sellers, P.; Bounoua, L.; Collatz, G. Comparison of radiative and physiological effects of doubled atmospheric CO2 on climate. Science 1996, 271, 1402–1405. [Google Scholar] [CrossRef]
  31. Friend, A.; Stevens, A.; Knox, R.; Cannell, M. A Process-Based, Terrestrial biosphere model of ecosystem dynamics (Hybrid v3. 0). Ecol. Modell. 1997, 95, 249–287. [Google Scholar] [CrossRef]
  32. Ryan, M. Effects of climate change on plant respiration. Ecol. Appl. 1991, 1, 157–167. [Google Scholar] [CrossRef] [PubMed]
  33. Baker, L.A.; Hope, D.; Xu, Y.; Edmonds, J.; Lauver, L. Nitrogen balance for the central arizona-phoenix (cap) ecosystem. Ecosystems 2001, 4, 582–602. [Google Scholar] [CrossRef]
  34. Lohse, K.A.; Hope, D.; Sponseller, R.; Allen, J.O.; Grimm, N.B. Atmospheric deposition of carbon and nutrients across an arid metropolitan area. Sci. Total Environ. 2008, 402, 95–105. [Google Scholar] [CrossRef] [PubMed]
  35. Grimm, N.; Earl, S.; Anderson, J.; Fernando, H.; Grossman-Clarke, S.; Stefanov, W.; Hope, D.; Zehnder, J.; Hyde, P. Long-Term Monitoring of Atmospheric Deposition in Central Arizona-Phoenix, Ongoing Since 1999. Available online: https://sustainability.asu.edu/caplter/data/data-catalog/view/knb-lter-cap.23.12/ (accessed on 23 June 2017).
  36. Taylor, K.E.; Stouffer, R.J.; Meehl, G.A.; Taylor, K.E.; Stouffer, R.J.; Meehl, G.A. An overview of cmip5 and the experiment design. Bull. Am. Meteorol. Soc. 2012, 93, 485–498. [Google Scholar] [CrossRef]
  37. Rogelj, J.; Meinshausen, M.; Knutti, R. Global warming under old and new scenarios using ipcc climate sensitivity range estimates. Nat. Clim. Chang. 2012, 2, 248–253. [Google Scholar] [CrossRef]
  38. Pourmokhtarian, A.; Driscoll, C.T.; Campbell, J.L.; Hayhoe, K.; Stoner, A.M.K. The effects of climate downscaling technique and observational data set on modeled ecological responses. Ecol. Appl. 2016, 26, 1321–1337. [Google Scholar] [CrossRef] [PubMed]
  39. Brekke, L.; Thrasher, B.L.; Maurer, E.P.; Pruitt, T. Downscaled CMIP3 and CMIP5 Climate Projections: Release of Downscaled CMIP5 Climate Projections (LOCA) and Comparison with Preceding Information, and Summary of User Needs; US Department of the Interior, Bureau of Reclamation, Technical Service Center: Denver, CO, USA, 2013; pp. 1–47.
  40. Pierce, D.W.; Cayan, D.R.; Thrasher, B.L.; Pierce, D.W.; Cayan, D.R.; Thrasher, B.L. Statistical downscaling using localized constructed analogs (LOCA). J. Hydrometeorol. 2014, 15, 2558–2585. [Google Scholar] [CrossRef]
  41. Pan, S.; Tian, H.; Dangal, S.R.S.; Zhang, C.; Yang, J.; Tao, B.; Ouyang, Z.; Wang, X.; Lu, C.; Ren, W.; et al. Complex spatiotemporal responses of global terrestrial primary production to climate change and increasing atmospheric CO2 in the 21st century. PLoS ONE 2014, 9, e112810. [Google Scholar] [CrossRef] [PubMed]
  42. Banger, K.; Tian, H.; Tao, B.; Ren, W.; Pan, S.; Dangal, S.; Yang, J. Terrestrial net primary productivity in india during 1901–2010: Contributions from multiple environmental changes. Clim. Chang. 2015, 132, 575–588. [Google Scholar] [CrossRef]
  43. Bacastow, R.; Keeling, C.; Woodwell, G.; Pecan, E. Atmospheric Carbon Dioxide and Radiocarbon in the Natural Carbon Cycle. II. Changes from ad 1700 to 2070 as Deduced from a Geochemical Model; No. CONF-720510; University of California: San Diego, CA, USA; Brookhaven National Lab.: Upton, NY, USA, 1973. [Google Scholar]
  44. Johnson, J.K.; Reynolds, S.J.; Jones, D.A. Geologic Map of the Phoenix Mountains, Central Arizona; Arizona Geological Survey: Tucson, AZ, USA, 2003. [Google Scholar]
  45. Zhu, P.; Zhuang, Q.; Ciais, P.; Welp, L.; Li, W.; Xin, Q. Elevated Atmospheric CO2 Negatively impacts photosynthesis through radiative forcing and physiology-mediated climate feedback. Geophys. Res. Lett. 2017, 44, 1956–1963. [Google Scholar] [CrossRef]
  46. Mercado, L.M.; Bellouin, N.; Sitch, S.; Boucher, O.; Huntingford, C.; Wild, M.; Cox, P.M. Impact of changes in diffuse radiation on the global land carbon sink. Nature 2009, 458, 1014–1017. [Google Scholar] [CrossRef] [PubMed] [Green Version]
  47. Huntingford, C.; Cox, P.M.; Mercado, L.M.; Sitch, S.; Bellouin, N.; Boucher, O.; Gedney, N. Highly contrasting effects of different climate forcing agents on terrestrial ecosystem services. Philos. Trans. R. Soc. Lond. A Math. Phys. Eng. Sci. 2011, 369, 2026–2037. [Google Scholar] [CrossRef] [PubMed] [Green Version]
  48. Zhao, F.; Zeng, N. Continued increase in atmospheric CO2 seasonal amplitude in the 21st century projected by the cmip5 earth system models. Earth Syst. Dyn. 2014, 5, 423–439. [Google Scholar] [CrossRef]
  49. Norby, R.J.; Delucia, E.H.; Gielen, B.; Calfapietra, C.; Giardina, C.P.; King, J.S.; Ledford, J.; McCarthy, H.R.; Moore, D.J.P.; Ceulemans, R.; et al. Forest response to elevated CO2 is conserved across a broad range of productivity. Proc. Natl. Acad. Sci. USA 2005, 102, 18052–18056. [Google Scholar] [CrossRef] [PubMed]
  50. Field, C.B.; Jackson, R.B.; Mooney, H.A. Stomatal responses to increased CO2: Implications from the plant to the global scale. Plant Cell Environ. 1995, 18, 1214–1225. [Google Scholar] [CrossRef]
  51. Alexandrov, G.A.; Oikawa, T.; Yamagata, Y. Climate dependence of the CO2 fertilization effect on terrestrial net primary production. Tellus Ser. B Chem. Phys. Meteorol. 2003, 55, 669–675. [Google Scholar] [CrossRef]
  52. Fisher, G. How do climate change and bioenergy alter the long-term outlook for food, agricultre and resource availability. In Proceedings of the Expert Meeting on How to Feed the World in 2050, Rome, Italy, 24–26 June 2009. [Google Scholar]
  53. McGrath, J.M.; Lobell, D.B. Regional disparities in the CO2 fertilization effect and implications for crop yields. Environ. Res. Lett. 2013, 8, 14054. [Google Scholar] [CrossRef]
  54. Milchunas, D.G.; Mosier, A.R.; Morgan, J.A.; LeCain, D.R.; King, J.Y.; Nelson, J.A. Root production and tissue quality in a shortgrass steppe exposed to elevated CO2: Using a new ingrowth method. Plant Soil 2005, 268, 111–122. [Google Scholar] [CrossRef]
  55. Niklaus, P.A.; Wohlfender, M.; Siegwolf, R.; Körner, C. Effects of six years atmospheric CO2 enrichment on plant, soil, and soil microbial C of a calcareous grassland. Plant Soil 2001, 233, 189–202. [Google Scholar] [CrossRef]
  56. Reich, P.B.; Knops, J.; Tilman, D.; Craine, J.; Ellsworth, D.; Tjoelker, M.; Lee, T.; Wedin, D.; Naeem, S.; Bahauddin, D.; et al. Plant diversity enhances ecosystem responses to elevated CO2 and nitrogen deposition. Nature 2001, 410, 809–813. [Google Scholar] [CrossRef] [PubMed]
  57. Zavalloni, C.; Vicca, S.; Büscher, M.; de la Providencia, I.E.; de Boulois, H.D.; Declerck, S.; Nijs, I.; Ceulemans, R. Exposure to warming and CO2 enrichment promotes greater above-ground biomass, nitrogen, phosphorus and arbuscular mycorrhizal colonization in newly established grasslands. Plant Soil 2012, 359, 121–136. [Google Scholar] [CrossRef]
  58. Housman, D.C.; Naumburg, E.; Huxman, T.E.; Charlet, T.N.; Nowak, R.S.; Smith, S.D. Increases in desert shrub productivity under elevated carbon dioxide vary with water availability. Ecosystems 2006, 9, 374–385. [Google Scholar] [CrossRef]
  59. Smith, S.D.; Huxman, T.E.; Zitzer, S.F.; Charlet, T.N.; Housman, D.C.; Coleman, J.S.; Fenstermaker, L.K.; Seemann, J.R.; Nowak, R.S. Elevated CO2 increases productivity and invasive species success in an arid ecosystem. Nature 2000, 408, 79–82. [Google Scholar] [CrossRef] [PubMed]
  60. Dijkstra, P.; Hymus, G.; Colavito, D.; Vieglais, D.A.; Cundari, C.M.; Johnson, D.P.; Hungate, B.A.; Hinkle, C.R.; Drake, B.G. Elevated atmospheric CO2 stimulates aboveground biomass in a fire-regenerated scrub-oak ecosystem. Glob. Chang. Biol. 2002, 8, 90–103. [Google Scholar] [CrossRef]
  61. Tognetti, R.; Johnson, J.D. Responses of growth, nitrogen and carbon partitioning to elevated atmospheric CO2 concentration in live oak in relation to nutrient supply. Ann. For. Sci. 1999, 56, 91–105. [Google Scholar] [CrossRef]
  62. Jach, M.E.; Laureysens, I.; Ceulemans, R. Above- and below-ground production of young Scots pine (Pinus sylvestris L.) trees after three years of growth in the field under elevated CO2. Ann. Bot. 2000, 85, 789–798. [Google Scholar] [CrossRef]
  63. Rey, A.; Jarvis, P.G. Growth Response of Young Birch Trees (Betula pendulaRoth.) After Four and a Half Years of CO2 Exposure. Ann. Bot. 1997, 80, 809–816. [Google Scholar] [CrossRef]
  64. Dijkstra, P.; Schapendonk, A.D.H.M.C.; Groenwold, K.O. Seasonal changes in the response of winter wheat to elevated atmospheric CO2 concentration grown in Open-Top Chambers and field tracking enclosures. Glob. Chang. Biol. 1999, 5, 563–576. [Google Scholar] [CrossRef]
  65. Hebeisen, T.; Luscher, A.; Zanetti, S.; Fischer, B.; Hartwig, U.; Frehner, M.; Hendrey, G.; Blum, H.; Nosberger, J. Growth response of Trifolium repens L. and Lolium perenne L. as monocultures and bi-species mixture to free air CO2 enrichment and management. Glob. Chang. Biol. 1997, 3, 149–160. [Google Scholar] [CrossRef]
  66. Högy, P.; Keck, M.; Niehaus, K.; Franzaring, J.; Fangmeier, A. Effects of atmospheric CO2 enrichment on biomass, yield and low molecular weight metabolites in wheat grain. J. Cereal Sci. 2010, 52, 215–220. [Google Scholar] [CrossRef]
  67. Costanza, R.; d’Arge, R.; de Groot, R.; Farber, S.; Grasso, M.; Hannon, B.; Limburg, K.; Naeem, S.; O’Neill, R.V.; Paruelo, J.; et al. The value of ecosystem services: Putting the issues in perspective. Ecol. Econ. 1998, 25, 67–72. [Google Scholar] [CrossRef]
  68. Costanza, R.; Fisher, B.; Mulder, K.; Liu, S.; Christopher, T. Biodiversity and ecosystem services: A multi-scale empirical study of the relationship between species richness and net primary production. Ecol. Econ. 2007, 61, 478–491. [Google Scholar] [CrossRef]
  69. Parry, M.; Rosenzweig, C.; Iglesias, A.; Livermore, M.; Fischer, G. Effects of climate change on global food production under SRES emissions and socio-economic scenarios. Glob. Environ. Chang. 2004, 14, 53–67. [Google Scholar] [CrossRef]
  70. Smith, P.; Gregory, P. Climate change and sustainable food production. Proc. Nutr. Soc. 2013, 72, 21–28. [Google Scholar] [CrossRef] [PubMed]
  71. Jenerette, G.D.; Harlan, S.L.; Stefanov, W.L.; Martin, C.A. Ecosystem services and urban heat riskscape moderation: Water, green spaces, and social inequality in Phoenix, USA. Ecol. Appl. 2011, 21, 2637–2651. [Google Scholar] [CrossRef] [PubMed]
  72. Duraiappah, A.K.; Naeem, S.; Agardy, T.; Ash, N.J.; Cooper, H.D.; Díaz, S.; Faith, D.P.; Mace, G.; McNeely, J.A.; Mooney, H.A.; et al. Ecosystems and Human Well-Being; Island Press: Washington, DC, USA, 2005; Volume 5. [Google Scholar]
  73. Grimm, N.B.; Redman, C.L.; Boone, C.G.; Childers, D.L.; Harlan, S.L.; Turner, B.L. Viewing the Urban Socio-ecological System Through a Sustainability Lens: Lessons and Prospects from the Central Arizona–Phoenix LTER Programme. In Long Term Socio-Ecological Research; Springer: Dordrecht, The Netherlands, 2013; pp. 217–246. [Google Scholar]
  74. Zhang, C.; Tian, H.; Chen, G.; Chappelka, A.; Xu, X.; Ren, W.; Hui, D.; Liu, M.; Lu, C.; Pan, S.; et al. Impacts of urbanization on carbon balance in terrestrial ecosystems of the Southern United States. Environ. Pollut. 2012, 164, 89–101. [Google Scholar] [CrossRef] [PubMed]
  75. Zölch, T.; Maderspacher, J.; Wamsler, C.; Pauleit, S. Using green infrastructure for urban climate-proofing: An evaluation of heat mitigation measures at the micro-scale. Urban For. Urban Green. 2016, 20, 305–316. [Google Scholar] [CrossRef]
  76. Brink, E.; Aalders, T.; Ádám, D.; Feller, R.; Henselek, Y.; Hoffmann, A.; Ibe, K.; Matthey-Doret, A.; Meyer, M.; Negrut, N.L.; et al. Cascades of green: A review of ecosystem-based adaptation in urban areas. Glob. Environ. Chang. 2016, 36, 111–123. [Google Scholar] [CrossRef]
  77. Smart, J.C.R.; Hicks, K.; Morrissey, T.; Heinemeyer, A.; Sutton, M.A.; Ashmore, M. Applying the ecosystem service concept to air quality management in the UK: A case study for ammonia. Environmetrics 2011, 22, 649–661. [Google Scholar] [CrossRef]
  78. Tiwary, A.; Kumar, P. Impact evaluation of green–grey infrastructure interaction on built-space integrity: An emerging perspective to urban ecosystem service. Sci. Total Environ. 2014, 487, 350–360. [Google Scholar] [CrossRef] [PubMed] [Green Version]
  79. Teague, A.; Russell, M.; Harvey, J.; Dantin, D.; Nestlerode, J.; Alvarez, F. A spatially-explicit technique for evaluation of alternative scenarios in the context of ecosystem goods and services. Ecosyst. Serv. 2016, 20, 15–29. [Google Scholar] [CrossRef]
  80. Luo, Y.; Wan, S.; Hui, D.; Wallace, L.L. Acclimatization of soil respiration to warming in a tall grass prairie. Nature 2001, 413, 622–625. [Google Scholar] [CrossRef] [PubMed]
  81. Koerner, B.; Klopatek, J. Anthropogenic and natural CO2 emission sources in an arid urban environment. Environ. Pollut. 2002, 116, S45–S51. [Google Scholar] [CrossRef]
  82. Grimm, N.B.; Faeth, S.H.; Golubiewski, N.E.; Redman, C.L.; Wu, J.; Bai, X.; Briggs, J.M. Global Change and the Ecology of Cities. Science 2008, 319, 756–760. [Google Scholar] [CrossRef] [PubMed]
  83. Yospin, G.I.; Bridgham, S.D.; Neilson, R.P.; Bolte, J.P.; Bachelet, D.M.; Gould, P.J.; Harrington, C.A.; Kertis, J.A.; Evers, C.; Johnson, B.R. A new model to simulate climate-change impacts on forest succession for local land management. Ecol. Appl. 2015, 25, 226–242. [Google Scholar] [CrossRef] [PubMed]
  84. Keane, R.E.; Cary, G.J.; Flannigan, M.D.; Parsons, R.A.; Davies, I.D.; King, K.J.; Li, C.; Bradstock, R.A.; Gill, M. Exploring the role of fire, succession, climate, and weather on landscape dynamics using comparative modeling. Ecol. Modell. 2013, 266, 172–186. [Google Scholar] [CrossRef]
  85. Wimberly, M.C.; Liu, Z. Interactions of climate, fire, and management in future forests of the Pacific Northwest. For. Ecol. Manag. 2014, 327, 270–279. [Google Scholar] [CrossRef]
  86. McDowell, W.G.; Benson, A.J.; Byers, J.E. Climate controls the distribution of a widespread invasive species: Implications for future range expansion. Freshw. Biol. 2014, 59, 847–857. [Google Scholar] [CrossRef]
  87. Barney, J.N.; DiTomaso, J.M. Bioclimatic predictions of habitat suitability for the biofuel switchgrass in North America under current and future climate scenarios. Biomass Bioenergy 2010, 34, 124–133. [Google Scholar] [CrossRef]
  88. Loss, S.R.; Terwilliger, L.A.; Peterson, A.C. Assisted colonization: Integrating conservation strategies in the face of climate change. Biol. Conserv. 2011, 144, 92–100. [Google Scholar] [CrossRef]
  89. Chown, S.L.; Huiskes, A.H.L.; Gremmen, N.J.M.; Lee, J.E.; Terauds, A.; Crosbie, K.; Frenot, Y.; Hughes, K.A.; Imura, S.; Kiefer, K.; et al. Continent-wide risk assessment for the establishment of nonindigenous species in Antarctica. Proc. Natl. Acad. Sci. USA 2012, 109, 4938–4943. [Google Scholar] [CrossRef] [PubMed]
  90. Elith, J.; Kearney, M.; Phillips, S. The art of modelling range-shifting species. Methods Ecol. Evol. 2010, 1, 330–342. [Google Scholar] [CrossRef]
  91. Zhang, C.; Tian, H.; Pan, S.; Lockaby, G. Multi-factor controls on terrestrial carbon dynamics in urbanized areas. Biogeosciences 2014, 11, 7107. [Google Scholar] [CrossRef]
  92. Roy, S.; Byrne, J.; Pickering, C. A systematic quantitative review of urban tree benefits, costs, and assessment methods across cities in different climatic zones. Urban For. Urban Green. 2012, 11, 351–363. [Google Scholar] [CrossRef]
  93. Von Döhren, P.; Haase, D. Ecosystem disservices research: A review of the state of the art with a focus on cities. Ecol. Indic. 2015, 52, 490–497. [Google Scholar] [CrossRef]
  94. Escobedo, F.J.; Kroeger, T.; Wagner, J.E. Urban forests and pollution mitigation: Analyzing ecosystem services and disservices. Environ. Pollut. 2011, 159, 2078–2087. [Google Scholar] [CrossRef] [PubMed]
  95. Obermeier, W.A.; Lehnert, L.W.; Kammann, C.I.; Muller, C.; Grunhage, L.; Luterbacher, J.; Erbs, M.; Moser, G.; Seibert, R.; Yuan, N.; et al. Reduced CO2 fertilization effect in temperate C3 grasslands under more extreme weather conditions. Nat. Clim. Chang. 2017, 7, 137–141. [Google Scholar] [CrossRef]
  96. Tubby, K.V.; Webber, J.F. Pests and diseases threatening urban trees under a changing climate. Forestry 2010, 83, 451–459. [Google Scholar] [CrossRef]
  97. Ordonez, C.; Duinker, P.N. Climate change vulnerability assessment of the urban forest in three Canadian cities. Clim. Chang. 2015, 131, 531–543. [Google Scholar] [CrossRef]
  98. Ciais, P.; Reichstein, M.; Viovy, N.; Granier, A.; Ogée, J. Europe-wide reduction in primary productivity caused by the heat and drought in 2003. Nature 2005, 437, 529. [Google Scholar] [CrossRef] [PubMed]
  99. Ainsworth, E.A.; Long, S.P. What have we learned from 15 years of free-air CO2 enrichment (FACE)? A meta-analytic review of the responses of photosynthesis, canopy properties and plant production to rising CO2. New Phytol. 2004, 165, 351–372. [Google Scholar] [CrossRef] [PubMed]
  100. Schlenker, W.; Lobell, D.B. Robust negative impacts of climate change on African agriculture. Environ. Res. Lett. 2010, 5, 14010. [Google Scholar] [CrossRef]
  101. Terrer, C.; Vicca, S.; Hungate, B.A.; Phillips, R.P.; Prentice, I.C. Mycorrhizal association as a primary control of the CO2 fertilization effect. Science 2016, 353, 72–74. [Google Scholar] [CrossRef] [PubMed]
  102. Poland, T.M.; McCullough, D.G. Emerald ash borer: Invasion of the urban forest and the threat to North America’s ash resource. J. For. 2006, 104, 118–124. [Google Scholar]
  103. Wallach, D.; Mearns, L.O.; Ruane, A.C.; Rotter, R.P.; Asseng, S. Lessons from climate modeling on the design and use of ensembles for crop modeling. Clim. Chang. 2016, 139, 551–564. [Google Scholar] [CrossRef]
Figure 1. Hierarchical land structure of Phoenix, AZ USA: (a) the study area of Phoenix and land use composition of the urban landscape; and (b) land cover composition of land use functional types.
Sustainability 09 01366 g001
Figure 2. Annual variations of environmental factors in three representative concentration pathway (including RCP2.6, RCP4.5, and RCP8.5) during the 21st century. (ad) is precipitation, tavg, tmax, and tmin in RCP2.6 scenario, respectively. (eh) is precipitation, tavg, tmax, and tmin in RCP4.5 scenario, respectively. (il) is precipitation, tavg, tmax, and tmin in RCP8.5 scenario, respectively. (m) is the trend of carbon dioxide from 2006 to 2099 under RCP2.6, RCP4.5, and RCP8.5 scenario, respectively. Precipitation is mean annual precipitation; tavg is mean annual temperature; tmax is maximum annual temperature; and tmin is minimum annual temperature, averaged across the study area.
Sustainability 09 01366 g002
Figure 3. Influence of environmental factors on NPP change in Phoenix since early 21st century as simulated by the HPM-UEM under RCP2.6, RCP4.5, and RCP8.5 scenario, respectively: (a) A five-year moving average NPP of multiple factors (temperature, precipitation and CO2) under RCP2.6, RCP4.5, and RCP8.5 scenario, respectively. (bd) Changes in NPP since the early 21st century (i.e., in comparison to the mean annual NPP of 2006–2010) in response to different factors under RCP2.6, RCP4.5 and RCP8.5 scenario, as predicted by the numeric experiments: CO2 is the carbon dioxide change only experiment; TMP is the temperature change only experiment; PPT is the precipitation change experiment; and the OVERALL experiment simulate the synergistic effects of CO2, temperature and precipitation.
Sustainability 09 01366 g003
Figure 4. Spatiotemporal pattern of NPP (g C/m2) in the Phoenix city during 2006–2099 as simulated by HPM-UEM: (a) RCP2.6 scenario; (b) RCP4.5 scenario; and (c) RCP8.5 scenario. NPP change of 2006–2099 is the value of late 21st century subtract that of early 21st century; NPP of early 21st century is the mean value during 2006–2010; NPP of late 21st century is the mean value during 2095–2099; NPP is net primary productivity; RCP is representative concentration pathway; 2.6, 4.5 and 8.5 are the radiative forcings of year 2100 relative to that of year 1750.
Sustainability 09 01366 g004
Figure 5. NPP change of different vegetation types scenario during three time periods (2006–2050, 2050–2099, and 2006–2099). RCP is representative concentration pathway, while 2.6, 4.5 and 8.5 are the radiative forcings of year 2100 in contrast to year 1750; TBDF is temperate broadleaf deciduous forest; Dshrub is desert shrub.
Sustainability 09 01366 g005
Table 1. Evaluating the CMIP5 GCM products using historical (2000–2005) monthly climate dataset developed based on field observations by Zhang et al. [21].
CIMP5 GCM ProductsMean Air TemperatureAnnual Precipitation
Correlation (R2)Bias (°C)Correlation (R2)Bias (mm/Year)
EC-EARTH Model 0.795.180.48−230
HadCM3 Model 0.854.050.29−150
CCSM4 0.869.480.72−234
CanCM40.845.270.47−253
GEOS-50.823.50.16−216
MIROC5 Model 0.784.080.38−169
MPI-ESM-LR0.763.50.48−253
MPI-ESM-MR0.852.910.64−81
Table 2. Description of the 11 land-use types in the Phoenix city.
Land-Use TypeArea (km2)Percentage (%)Description
Commercial area137.544.74Commercial High-Community Retail/Regional Retail
Commercial Low-Amusement/Movie Theatre/Specialty Retail/Neighborhood Retail
Tourist Accommodations-Motel/Hotel/Resort
Business Park
Industrial area157.455.43Industrial
Other Employment-Landfill/Proving Grounds/Sand and Gravel/etc.
Residential (mesi and xeri)1372.647.3Single Family Medium Density-1 to 4 du/ac
Multi Family-Apartment/Condo
Single Family Low Density-Less than 1 du/ac
Single Family High Density-Greater than 4 du/ac-Includes Mobile Homes
Institutional area406.314Cemetery
Educational
Medical/Nursing Home
Mixed Use
Office
Public/Special Event/Military
Religious/Institutional
Transportation36.431.26Airport
Transportation
Waters52.751.82Water
Recreation area93.033.21Golf Course
Construction/transition39.361.36Developing Employment Generating
Developing Residential
Agricultural139.54.81Agriculture
Vacant natural467.0416.09Vacant
Active Open Space
Passive/Restricted Open Space/Undevelopable
Table 3. Model projected changes in the total ecosystem NPP of the Phoenix city, AZ, during the 21st century.
Mean Annual NPP (K Ton C/Year)
RCP2.6RCP4.5RCP8.5
TimeperiodEarly-21st century (2006–2010)327327315
Mid-21st century (2048–2052)381408446
Late-21st century (2095–2099)376495629
NPP changes in the 1st half of the 21st centuryMagnitude of the change5481131
Change rate (%)16%25%41%
NPP changes in the 2nd half of the 21st centuryMagnitude of the change−587184
Change rate (%)−1%21%41%
NPP changes in the 21st centuryMagnitude of the change49168314
Change rate (%)15%51%100%
Note: RCP is Representative Concentration Pathway, and 2.6, 4.5 and 8.5 are radiative forcing of year 2100 in contrast to year 1750. Mean annual NPP of the early-, mid- and late-21st century are the mean NPPs of 2006–2010, 2048–2052 and 2095–2099, respectively. The NPP changes in the 1st half of the 21st century was calculated as the difference between the mean NPP in the mid-21st century and that in the early-21st century. The NPP changes in the 2nd half of the 21st century was calculated as the difference between the mean NPP in the late-21st century and that in the mid-21st century. The NPP changes in the 21st century was calculated as the difference between the mean NPP in the late-21st century and that in the early-21st century. Unit: K ton C (1 K = 1000).
Table 4. Results of factorial analysis in Phoenix.
RCP2.6RCP4.5RCP8.5
2006–20502050–20992006–20992006–20502050–20992006–20992006–20502050–20992006–2099
OVERALL53.78−5.2648.5180.6987.49168.18130.66183.78314.44
CO242.78−15.7627.0365.8635.97101.8288.2491.16179.4
TMP23.140.6523.781.0717.4618.5322.9211.3434.26
PPT−12.1912.460.2712.820.4433.2311.7817.7929.57
INTACTIVE0.04−2.61−2.570.9713.6214.597.7263.4971.21
OVERALL: the multiple factors experiment that simulated combined effect of climate and CO2 change on NPP; CO2: the CO2 experiment that CO2 was transient during 2000–2099 while climate data were equilibrium level; TMP: the temperature experiment that temperature was transient while CO2 and precipitation were equilibrium level; PPT: the precipitation experiment that precipitation was transient while CO2 and temperature were equilibrium level; and INTACTIVE: the interactive effect between climate change and CO2 change. RCP2.6: RCP is Representative Concentration Pathway, while 2.6, 4.5 and 8.5 are the radiative forcings of year 2100 in contrast to year 1750. NPP is net primary productivity. Unit: K ton C.
Table 5. Comparison of NPP trend derived from CO2 change between HPM-UEM model and FACE/OTC experiment (FACE: Free-air CO2 enrichment).
Ecosystem TypeStudy AreaMethodologyβ-Factor (1 SE)Source
GrasslandPhoenix city, AZ, USAModel simulation0.85 (0.26)This study
central Colorado, USAOpen Top Chamber0.92–0.95Milchunas et al., 2005 [54]
northwestern SwitzerlandScreen aided CO2 control0.45Niklaus et al., 2001 [55]
Minnesota, USAFACE experiments0.52Reich et al., 2001 [56]
BelgiumOpen Top Chamber0.50Zavalloni et al., 2012 [57]
Shrubland or desertPhoenix city, AZ, USAModel simulation0.79 (0.27)This study
Nevada Desert FACE facility, southern Nevada, USAOpen Top Chamber1.68 (0.92)Housman et al., 2006 [58]
1.31Smith et al., 2000 [59]
Global desertModel simulation0.76–0.77Alexandrov et al., 2003 [51]
ForestPhoenix city, AZ, USAModel simulation0.83 (0.31)This study
Florida, USAOpen Top Chamber1.02–1.95Dijkstra et al., 2002 [60]
Florida, USAOpen Top Chamber0.88–1.18Tognetti et al., 1999 [61]
BelgiumOpen Top Chamber0.72Jach et al., 2000 [62]
Edinburgh, UKOpen Top Chamber0.84Rey et al., 1997 [63]
Global forestFACE experiments0.6Norby et al., 2005 [49]
CroplandPhoenix city, AZ, USAModel simulation0.15–0.16This study
NetherlandsOpen Top Chamber0.28Dijkstra et al., 1999 [64]
SwitzerlandFACE experiments0.1 (0.29)Hebeisen et al., 1997 [65]
GermanyFACE experiments0.37Högy et al., 2010 [66]

