Applying the Concept of Perceived Restoration to the Case of Cheonggyecheon Stream Park in Seoul, Korea

1
Bureau of Ecological Research, Division of Ecosystem Services and Research Planning, National Institute of Ecology, Chungcheongnam-do 33657, Korea
2
Department of Environmental Planning, Interdisciplinary Program in Landscape Architecture and Environmental Planning Institute, Gwanak-ro 1, Gwanak-gu, 82-222, Seoul National University, Seoul 08826, Korea
3
Graduate School of Environmental Studies, Gwanak-ro 1, Gwanak-gu, 82-222, Seoul National University, Seoul 08826, Korea
*
Author to whom correspondence should be addressed.
Sustainability 2017, 9(8), 1368; https://doi.org/10.3390/su9081368
Submission received: 21 June 2017
/
Revised: 31 July 2017
/
Accepted: 1 August 2017
/
Published: 3 August 2017
(This article belongs to the Special Issue Nature-Based Solutions for Urban Challenges)
Abstract
:Studies on perceived restoration have focused on the differences between natural and artificial environments, whereas studies on what makes people select a particular restorative environment are limited. Using the location of Cheonggyecheon Stream Park in the urban center of Seoul, South Korea, this study tests whether people self-select locations based on individual and environmental characteristics. Empirical testing was conducted on 268 responses on a visitor survey that was developed based on the Perceived Restorativeness Scale. The major findings were that visitors’ characteristics such as gender, age, number of companions, visit frequency, and travel mode affect their selection of a particular setting, and that the chosen setting subsequently influences three dimensions of the Scale: being away, fascination, and coherence. These findings suggest that both individual and environmental characteristics should be considered in the creation of an effective perceived restorative environment in an urban center.
1. Introduction
The natural environment in urban areas can be enhanced by building parks and maintaining green spaces and streams through conservation (or restoration). It is relatively easy to obtain consensus on the development or conservation of a natural environment compared to the development of other types of urban structures, particularly as a reaction to urbanization [1]. This is because humans inherently yearn for and feel comfortable in nature [2]. According to Wilson [3], the natural urban environment is indispensable for humans from psychological, emotional, and transpersonal perspectives.
Open to everybody, urban parks are representative of the natural urban environment, and they have considerable value for public health. That is, they provide physical and mental health value for their users [4,5,6]. The benefit of physical health is provided by physical activities (including, but not limited to, those from the use of exercise facilities) [7,8,9] and that of mental health is offered mainly by being in and viewing nature [10,11].
Attention Restoration Theory argues that by viewing and using the natural components of urban parks, people can reduce their mental fatigue. The theory states that Directed Attention causes mental fatigue, but Involuntary Attention works in the restorative environment [10,11]. Directed Attention is applied when tasks require concentration and effort. After a certain duration, it causes mental and physical fatigue. By contrast, Involuntary Attention is not related to concentration or effort. Rather, it reduces the fatigue caused by Directed Attention. Attention Restoration Theory explains how negative feelings are reduced by Involuntary Attention that is stimulated by the environment [10].
According to Kaplan and Kaplan [10], fatigue is reduced in a space in which people have the feelings of (1) Being Away; (2) Coherence; (3) Fascination; and (4) Compatibility. That is, a space or environment may reduce fatigue if its users feel that (1) they are away from their daily routine; the components of the space are (2) well-composed or (3) fascinating; and (4) the use of the space is compatible with the users’ purpose.
The theory is based on the idea that tasks requiring mental effort (Directed Attention) are taxing on the brain. Fascination requires no mental effort and therefore gives the prefrontal cortex, the part of the brain responsible for concentration and self-regulation, a chance to rest. As a result, the brain has a chance to recover its ability to concentrate, resist distractions, problem solve, and control impulses and behaviors.
The level of the attention restored by an environment is influenced by an individual’s psychological responses [12,13], suggesting the importance of exploring what affects his or her self-selection: those who are interested in attention restoration are more likely to self-select an environment favorable for it. In the field of urban planning, the effects of the built environment on behavioral responses were studied in relation to the degree to which people self-select a specific environment [14]. In landscape architecture, White et al. [15] suspected that people’s personal characteristics lead them to self-select to be closer to green spaces.
However, most studies have focused on identifying differences between natural and artificial environments [12,13,16,17,18,19,20,21,22], and between mixed built and natural gardens [23]. Few have analyzed what makes people self-select an environment capable of providing a restorative experience.
The selection of a perceived restorative environment depends on the physical characteristics of the environment and the personal characteristics of the user [24]. This implies that to better understand the relationships between environments and their users, studies need to examine the sociodemographic variables of the user [24,25] in addition to the variations among different types of environments [26]. Mozingo [27] and Whyte [28] reported that men and women occupy and use space differently. Previous studies found that age affects preferences for different kinds of places [29]. Moreover, factors such as the number of companions [30]; frequency of visits [31]; and mode and time of travel [32] influence how a place is used.
In relation to this study, Nikunen [33] reported a variation in stress reduction based on the level of night lighting, and Ivarsson and Hargerhall [23] argued that the variation may result from how many artificial structures are visible.
Moreover, social context is also a factor in restorative effects [34,35] that has not yet been fully investigated compared to personal characteristics, although such characteristics are formed in the context of the social settings. The frequency of visits to a place influences the level of attentional restoration [36]. Using the setting of Cheonggyecheon Stream Park, a built environment in the urban center of Seoul, South Korea, this study aims to examine how environmental and individual characteristics affect the selection of a perceived restorative environment. To this aim, it is hypothesized that:
Hypothesis 1.
User characteristics affect the selection of a place considering social context.
Hypothesis 2.
The characteristics of a place affect perceived restoration because of the variation of restorative settings.
2. Materials and Methods
A way to measure the effects of an attention-restoring environment was proposed by Hartig et al. [12,13]. They used Perceived Restorativeness Scale (PRS) items and based the measurement on Kaplan and Kaplan’s Attention Restoration Theory [10]. The items were categorized into four dimensions: Being Away (providing a feeling of escape from daily routine), Fascination (leading to effortless attention), Coherence (well-structured spatial composition), and Compatibility (the environment satisfied the user’s purpose for visiting). A fifth dimension, Scope (user’s perception of the setting), is also sometimes included.
The measurement developed by Hartig et al. [13] uses either 26 or 16 items. This study employed the 16-item method (using an 11-point rating scale ranging from 0 = strongly disagree to 10 = strongly agree) that included: two items for Being Away, five for Fascination, five for Coherence, and four for Compatibility. For Korean respondents, the items were translated into Korean by referring to the items from a Korean study [37] as well as those of other international studies [21,35]. Also, unlike the original items, five of the items were reverse scored to prevent hasty responses. The translated versions of the 16 items were approved by two Korean-English translation experts.
The survey asked about personal information including gender (male or female), age group (11–20, 21–30, 31–40, 41–50, 51–60, and more than 60 years of age), number of companions (none, 1, 2, or more than 2 persons), average frequency of visits (1–2 per year, 1–2 per month, 1–2 per week, or almost every day), mode of transportation (personal vehicle, subway, bus, walking, or other) and travel time (less than 10 min, less than 1 h, 1–2 h, or more than 2 h).
The survey was conducted over 10 days (2 September 2014–11 September 2014, including two weekend days) in Cheonggyecheon Stream Park by four fieldworkers who collected responses through a face-to-face, hand-delivered survey. The questionnaires were revised after a pilot test. One of the authors trained fieldworkers to prevent any errors that the survey setting itself may cause (i.e., non-sampling errors). The fieldworkers carried out the survey targeting people who were visiting the park during the daytime. As the authors’ master’s advisees, the fieldworkers asked about the respondents’ personal characteristics and the settings of the venue where he or she was contacted. Different locations in the park were categorized similarly to by Kim et al. [38] as: “the lower part of a bridge”, “areas with stepping stones”, “an artificial waterfront”, “a natural waterfront”, and “an inner part of the border” (between a trail and a border or wall by which the park is separated from the outside) (see Figure 1). The survey initially requested respondents to mark their spot on a large-scale map, but this request was discontinued because it was difficult or time-consuming for most respondents. A total of 268 responses were collected and used for empirical analyses.
Cheonggyecheon Stream Park
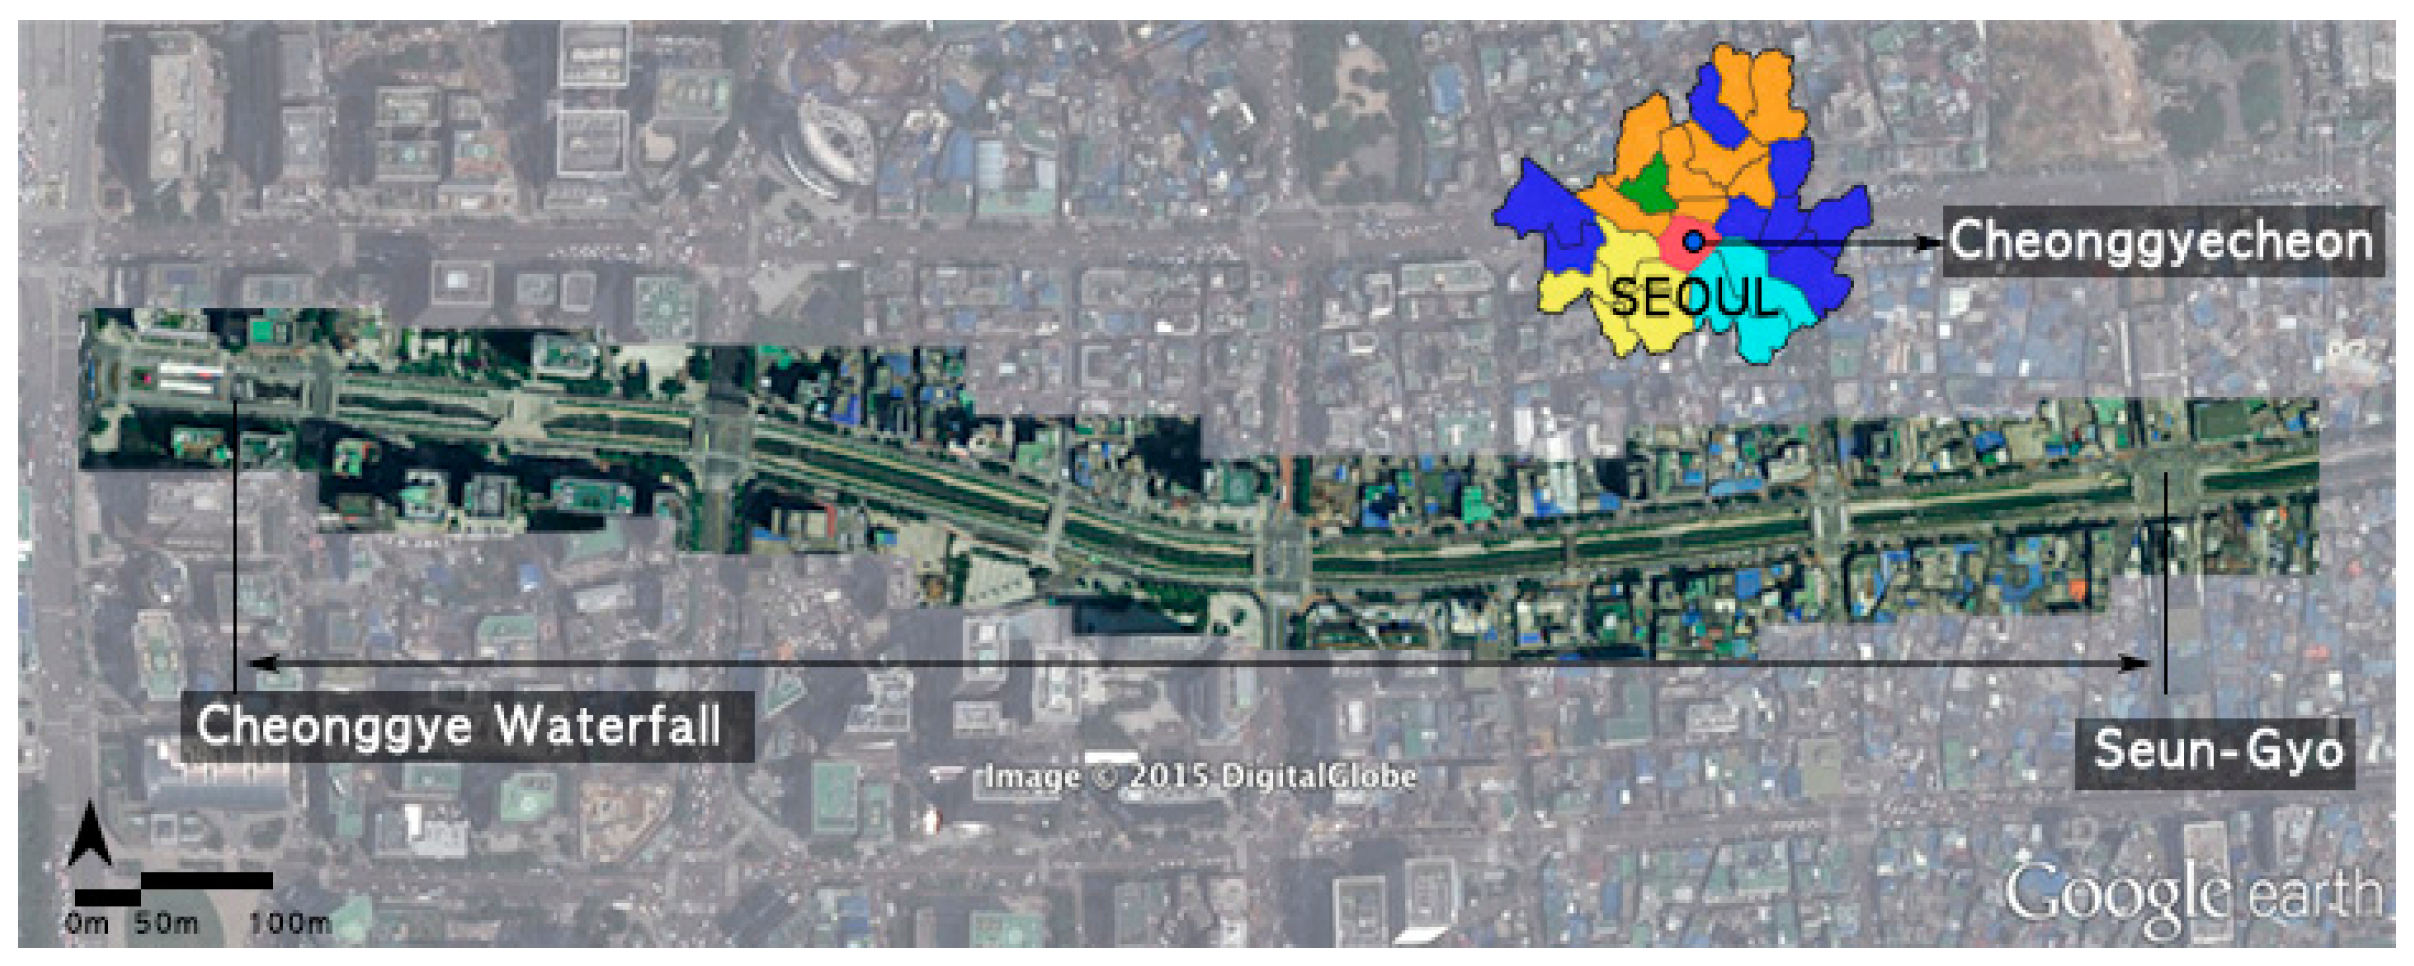
Located in the urban center of Seoul, Cheonggyecheon Stream Park has mitigated the urban heat island effect [39] and is used to relax and enjoy the urban culture of Seoul [40,41]. Most people in the study area, which ranges from Cheonggye Waterfall to Seun-Gyo Bridge, enjoy relaxing or sightseeing [42]. This section of the park is considered beneficial to one’s mental health (see Figure 2).
In urban open spaces, health utility is provided by observing the natural environment, getting into nature, and actively becoming a part of nature [43]. Cheonggyecheon Stream Park is located four to five meters below the level of the surrounding area, and it is visually separated from other parts of the urban center. The park has natural components, including a stream and green spaces (border parts and walls). These spatial characteristics allow visitors to feel that they are in a unique urban natural environment, which can provide restorative benefits.
3. Results
3.1. Descriptive Statistics
After weighting, 54% of the survey respondents were female and 46% were male. There were six age groups: 11–20 (13%), 21–30 (43%), 31–40 (22%), 41–50 (14%), 51–60 (5%), and over 60 (3%) years. First and foremost, each of the five predetermined categories of locations included a sufficient number of respondents; in other words, the responses were adequately distributed across categories. The average respondent was a female in her 20s who visits the park once or twice a year, usually for leisure purposes. She brought one companion and traveled less than one hour by public transportation (subway, bus, or both). Moreover, as this study uses inferential statistics, securing enough variations is a matter of consideration rather than making all statistics exactly representative of the population, and in this sense, the sample of this study is highly acceptable.
Table 1 shows how people responded to the items of the PRS (11-point rating scale: 0–10). Notably, the overall mean of the PRS is 6.12. This value can be used to characterize Cheonggyecheon Stream Park. Ivarsson and Hagerhall [23] provide a guide for assessing the perceived restoration levels of different study subjects. The value of 6.12 is higher than the mid-point as well as the value for the garden of the case of Sweden [23]. In addition, this value is higher than that for urban facilities, such as streets and plazas, and similar to a value for a natural lake [22] or for an environment with clean streams that provide a moderate level of fascination [13].
3.2. Multinomial Logistic Regression: Relationship between Personal Characteristics and the Place Visit Selection
While the environmental characteristics of a place can reduce PRS scores, the visitor’s own personal characteristics may be an antecedent variable that makes him or her self-select the restorative setting. Then, the effect of the environmental characteristics on the perceived restorative quality becomes spurious in as much as part or all of the effect originates from the personal characteristics. To test if such self-selection is present, this study conducted multinomial logistic regression in which the location was the dependent variable. (The most frequently chosen category was the artificial waterfront (f = 65)). Predictors, or covariates, were categorical, and included: gender, age group, number of companions, average frequency of visits, mode of transportation, travel time, and purpose for visiting. For the gender variable, the reference category was female. For the number of companions, travel mode, and travel time, the responses that could be considered the control groups—none (f = 16), walking (f = 38), and less than 10 min (f = 40), respectively—were chosen as the reference categories. (Particularly for the mode of transportation, this study initially considered the automobile as the reference category, but its frequency was not high enough (f = 6)). For the other predictors, namely age group, the average frequency of visits, and the purpose of the visit, categories with the largest proportion were set as the reference categories: 21–30 years old (f = 115), 1–2 times per year (f = 160), and leisure (f = 234).
When the initial data was analyzed, several categories, including age group, travel mode, travel time, and visit purpose produced unusually large standard errors. In particular, 51–60 years (age group), older than 60 years (age group), automobile (travel mode), more than 2 h (travel time), work/study (visit purpose), and transit (visit purpose) had standard errors that were larger than the generally accepted level (SE > 2). Possible reasons for this include multicollinearity, no or few cases for the categories, and separation problems. (Separation problems occur if the dependent variable separates a predictor (i.e., when the same outcome is always produced for a certain category of the predictor)). This study had already been checked for multicollinearity, and through preprocessing categories with few cases had been combined. It was found that the separation problem inflated the standard errors, so categories were regrouped accordingly. First, for the age group variable, 51–60 years (f = 13) and older than 60 years (f = 9) were combined with 41–50 years (f = 36), forming a category called “older than 40”. For travel mode, automobile (f = 6) was added to the reference category along with walk (f = 38); this “other than public transportation” category became the reference. For travel time, the “more than 2 h” category (f = 13) was combined with “1–2 h” (f = 43), creating a new category, “more than 1 h”. Lastly, for visit purpose, work/study (f = 7) and transit (f = 5) were combined to form the “other than leisure” category.
Table 2 shows the results of the multinomial logistic regression model. Significant variables (p < 0.1) are in bold and, as presented, most personal characteristics were associated with the selection of a specific place. First, males tended to visit the inner part of a border or areas with stepping stones rather than an artificial waterside. Compared to those in their 20s, teenagers and visitors older than 40 years tended to choose the artificial waterside rather than the lower part of a bridge or areas with stepping stones. If visiting with any companions, people were likely to select the artificial waterside, not the natural one. With more than two companions, they did not go to areas with stepping stones. People who rarely visited Cheonggyecheon Stream Park (1–2 times per year) tended to visit the lower part of a bridge, while monthly visitors (1–2 times per month) preferred the artificial waterside. Everyday visitors tended not to be in the inner border part. Among transit riders, those who took either metro or buses did not visit the lower part of a bridge, and especially if they used metro only, areas with stepping stones were not selected either. By contrast, people who travelled to the park via transferring between the metro and buses were likely to choose the inner border part. In comparison to those who traveled a short time (<10 min), visitors who traveled longer (<1 h) were more likely to go to the lower part of a bridge, and those who traveled for the longest time (≥1 h) were unlikely to choose the inner part of a border.
In summary, among the personal characteristics considered in this study, all but visit purpose affected the visitor’s selection of a setting within the park. This implies that visitors self-selected places with a perceived restorative quality. Accordingly, insofar as the characteristics of the specific setting depend on those of the person (i.e., a place is selected according to personal characteristics), studies on the affect that a setting has on perceived restorative quality need to control for personal characteristics.
Before analyzing the effects that the characteristics of the setting had on the perceived restoration, it should be confirmed that all the categories were distinct. In this sense, this study tested the IIA (independence of irrelevant alternatives) assumption and the potential for category combination.
The IIA assumption is met when the exclusion of a certain response category does not alter the chances of choosing other categories. For example, if the “natural waterside” category is removed, cases for this category should be redistributed equally to the other categories; if the cases are biased to the “artificial waterside,” then the assumption is violated. The IIA assumption is tested by the Hausman test, whose null hypothesis is that odds are independent of other alternatives. The Hausman test showed that this hypothesis was satisfied for all response categories.
Secondly, the potential for category combination was checked, because if the same set of predictors affects different categories, collapsing the categories into one is more efficient. The potential is tested by the LR (Likelihood Ratio) test, whose null hypothesis is that alternatives can be collapsed. It shows that the pair of natural waterside–artificial waterside and that of inner part of a border–areas with stepping stones can be combined. At the same time, however, these four categories were found to be distinct in relation to other categories. (For instance, if the pair of natural waterside–artificial waterside is combined, any differences between the natural waterside and the lower part of a bridge cannot be revealed (see Table S1 in Supplementary Materials)).
That is, the tests of the IIA assumption and those for the alternative combination confirm that response categories—as conceptually defined according to Kim et al. [38]— represent all options for settings well. In this sense, each and every category is included as a dummy in the hierarchical regression models.
3.3. Hierarchical Regression: Relationship between the Place of Visit and the PRS Score
Since most personal characteristics were found to affect the selection of the visit place, this study controlled for those characteristics in the process of estimating how strongly the setting characteristics explain some of the variance for the PRS score. The estimation was made through a hierarchical regression (first block = personal characteristics).
Before running the regression, this study examined the internal consistency among individual survey items. For the four dimensions of the PRS, Cronbach’s α was higher than the reference level: α (two items of Being Away) = 0.918, α (five items of Fascination) = 0.824, α (four items of Coherence) = 0.643, and α (five items of Compatibility) = 0.879. Thus, as with the Likert scale, this study calculated the score of each dimension by summing its individual items.
Unlike a logistic regression based on maximum likelihood estimation, a linear regression is relatively free from the separation problem. Thus, this study made dummies using the original categories of the predictors (see the Section 3.2).
Table 3 presents the results of a hierarchical regression model that used the PRS to evaluate how the waterfront landscape of Cheonggyecheon Stream Park contributed to the perceived restorative quality or attention restoration. As shown in the Block 2 section of the table, the lower part of a bridge turned out to be less fascinating than an artificial waterside. Also, a natural waterside was likely to offer a better feeling of coherence than an artificial one. Compared to an artificial waterside, the inner part of a border part was perceived as a better place for a feeling of being away, fascination, and coherence. Notably, regarding the Fascination and Coherence dimensions, being in the inner border part was found to be the second most important variable in the respective regression models. Lastly, no places created a sense of compatibility with the visitors in terms of their personal characteristics, visit purposes, or otherwise. This may be because this study controlled for self-selection, that is, personal characteristics that affect the chosen setting.
4. Discussion
This study utilized a hand-delivered survey in Cheonggyecheon Stream Park, a built environment in an urban center. Analyses of empirical data yielded by this survey found that while the perceived restorative environment is associated with personal characteristics, the environmental characteristics of a place influence people’s selections. Visitors’ personal characteristics, particularly gender, age, number of companions, average frequency of visits, use of public transportation, and trip distance affected their perceived restorative quality. Positive aspects or the ways that the PRS score was reduced were categorized in three dimensions: Being Away, Fascination, and Coherence. The hypotheses of this study, namely that a visitor’s personal characteristics affect the selection of a place, and those of a place reduce the score, can be supported in the case of Cheonggyecheon Stream Park.
The finding that the visitor’s characteristics affect the selection of a visiting place could be potentially useful in designing a perceived restorative environment. For example, this study found that males do not tend to choose the “artificial waterside” since it is crowded, relatively open, and easily viewed by those at the other side of the stream. On the other hand, the “inner part of a border” forms a more private space. This finding is in line with the argument that differences among users leads to variations in the occupation and use of open space. Previous studies found that age differences affect preferences for a place [29] and individual characteristics, such as the number of companions [30], frequency of visits [31], and mode and time of travel [32], influence how places are used. All these variables turned out to significantly affect the selection of a perceived restorative environment, suggesting that landscape architects and planners need to consider these variables.
Another important finding is that the score of the Perceived Restorativeness Scale depends on the characteristics of the place, and this should be reflected in the site design. Specifically, for stationary users only, the “inner part of a border” offered strong feelings of Being Away, Fascination, and Coherence, particularly for the latter two. The inner part of a border is close to a wall and thus provides a secure sitting place where people can view nature rather than other park visitors. Identifying a site with high safety, where visitors can view nature without feeling uncomfortable, is known to be an important consideration in designing a perceived restorative environment [44].
5. Conclusions
The major contribution of this study is that it uses Attention Restoration Theory to find the importance of considering who (personal characteristics of the user) as well as where (characteristics of the setting), since both influence a person’s choice of a perceived restorative environment, where previous studies were limited to testing the perceived restorative quality of a natural component. These empirical findings are based only on the main part of Cheonggyecheon Stream Park. Moreover, the issue of self-selection needs to be studied further with other explanatory factors. Nevertheless, it identified a potential for the extension of Attention Restoration Theory, and future studies are recommended to test the geographical transferability of the findings.
Supplementary Materials
The following are available online at www.mdpi.com/2071-1050/9/8/1368/s1, Table S1: Tests of the outcome variable: IIA (independence of irrelevant alternatives) assumption and potential for category combination (n = 238).
Acknowledgments
The work was supported by Seoul National University.
Author Contributions
Moohan Kim conceived and designed the research; Tae-Hyoung Tommy Gim analyzed the data and revised the manuscript; Jong-Sang Sung proofread and revised the manuscript. All authors have read and approved the final manuscript.
Conflicts of Interest
The authors declare no conflict of interest.
References
- James, P.; Tzoulas, K.; Adams, M.D.; Barber, A.; Box, J.; Breuste, J.; Elmqvist, T.; Frith, M.; Gordon, C.; Greening, K.L.; et al. Towards an integrated understanding of green space in the European built environment. Urban For. Urban Green. 2009, 8, 65–75. [Google Scholar] [CrossRef]
- Maller, C.J.; Henderson-Wilson, C.; Townsend, M. Rediscovering nature in everyday settings: Or how to create healthy environments and healthy people. Ecohealth 2009, 6, 553–556. [Google Scholar] [CrossRef] [PubMed]
- Wilson, E.O. Biophilia and the conservation ethic. In Evolutionary Perspectives on Environmental Problems; Penn, D.J., Mysterud, I., Eds.; Aldine Transaction: Piscataway, NJ, USA, 2007; pp. 249–257. [Google Scholar]
- Hartig, T. Three steps to understanding restorative environments as health resources. In Open Space: People Space; Thompson, C.W., Travlou, P., Eds.; Taylor and Francis: London, UK, 2007; pp. 163–179. [Google Scholar]
- Hill, K. Design and planning as arts: The broader context of health and environment. In Ecology and Design: Frameworks for Learning; Johnson, B., Hill, K., Eds.; Island Press: Washington, DC, USA, 2001; p. 203. [Google Scholar]
- Kaplan, R. The role of nature in the urban context. In Behavior and the Natural Environment; Altman, I., Wohlwill, J.F., Eds.; Springer: New York, NY, USA, 1983; pp. 127–161. [Google Scholar]
- Cohen, D.A.; McKenzie, T.L.; Sehgal, A.; Williamson, S.; Golinelli, D.; Lurie, N. Contribution of public parks to physical activity. Am. J. Public Health 2007, 97, 509–514. [Google Scholar] [CrossRef] [PubMed]
- Floyd, M.F.; Spengler, J.O.; Maddock, J.E.; Gobster, P.H.; Suau, L.J. Park-based physical activity in diverse communities of two US cities: An observational study. Am. J. Prev. Med. 2008, 34, 299–305. [Google Scholar] [CrossRef] [PubMed]
- Shores, K.A.; West, S.T. Rural and urban park visits and park-based physical activity. Prev. Med. 2010, 50, 13–17. [Google Scholar] [CrossRef] [PubMed]
- Kaplan, R.; Kaplan, S. The Experience of Nature: A Psychological Perspective; CUP Archive: New York, NY, USA, 1989. [Google Scholar]
- Ulrich, R.S. Effects of gardens on health outcomes: Theory and research. In Healing Gardens: Therapeutic Benefits and Design Recommendations; Marcus, C.C., Barnes, M., Eds.; John Wiley and Sons: New York, NY, USA, 1999; pp. 27–86. [Google Scholar]
- Hartig, T.; Böök, A.; Garvill, J.; Olsson, T.; Gärling, T. Environmental influences on psychological restoration. Scand. J. Psychol. 1996, 37, 378–393. [Google Scholar] [CrossRef] [PubMed]
- Hartig, T.; Kaiser, F.G.; Bowler, P.A. Further Development of a Measure of Perceived Environmental Restorativeness; Institute of Housing Research: Uppsala, Sweden, 1997; pp. 1–19. [Google Scholar]
- Gim, T.-H.T. Testing the reciprocal relationship between attitudes and land use in relation to trip frequencies: A nonrecursive model. Int. Reg. Sci. Rev. 2016, 39, 203–227. [Google Scholar] [CrossRef]
- White, M.P.; Alcock, I.; Wheeler, B.W.; Depledge, M.H. Would you be happier living in a greener urban area? A fixed-effects analysis of panel data. Psychol. Sci. 2013, 24, 920–928. [Google Scholar] [CrossRef] [PubMed]
- Adevi, A.A.; Grahn, P. Attachment to certain natural environments: A basis for choice of recreational settings, activities and restoration from stress? Environ. Nat. Resour. Res. 2011, 1, 36. [Google Scholar] [CrossRef]
- Berto, R. Exposure to restorative environments helps restore attentional capacity. J. Environ. Psychol. 2005, 25, 249–259. [Google Scholar] [CrossRef]
- Grahn, P.; Stigsdotter, U.A. Landscape planning and stress. Urban For. Urban Green. 2003, 2, 1–18. [Google Scholar] [CrossRef]
- Grahn, P.; Stigsdotter, U.A. The relation between perceived sensory dimensions of urban green space and stress restoration. Landsc. Urban Plan. 2010, 94, 264–275. [Google Scholar] [CrossRef]
- Hartig, T.; Staats, H. The need for psychological restoration as a determinant of environmental preferences. J. Environ. Psychol. 2006, 26, 215–226. [Google Scholar] [CrossRef]
- Korpela, K.; Hartig, T. Restorative qualities of favorite places. J. Environ. Psychol. 1996, 16, 221–233. [Google Scholar] [CrossRef]
- Purcell, T.; Peron, E.; Berto, R. Why do preferences differ between scene types? Environ. Behav. 2001, 33, 93–106. [Google Scholar] [CrossRef]
- Ivarsson, C.T.; Hagerhall, C.M. The perceived restorativeness of gardens: Assessing the restorativeness of a mixed built and natural scene type. Urban For. Urban Green. 2008, 7, 107–118. [Google Scholar] [CrossRef]
- Bell, P.A.; Green, T.; Fisher, J.D.; Baum, A. Environmental Psychology; Thomson Wadsworth: Belmont, CA, USA, 2001. [Google Scholar]
- Altman, I. The Environment and Social Behavior: Privacy, Personal Space, Territory, and Crowding; Brooks and Cole: Monterrey, CA, USA, 1975. [Google Scholar]
- Velarde, M.D.; Fry, G.; Tveit, M. Health effects of viewing landscapes: Landscape types in environmental psychology. Urban For. Urban Green. 2007, 6, 199–212. [Google Scholar] [CrossRef]
- Mozingo, L. Women and downtown open spaces. Places 1989, 6, 38–47. [Google Scholar]
- Whyte, W.H. The Social Life of Small Urban Spaces; Project for Public Spaces: New York, NY, USA, 1980. [Google Scholar]
- Chiesura, A. The role of urban parks for the sustainable city. Landsc. Urban Plan. 2004, 68, 129–138. [Google Scholar] [CrossRef]
- Day, K. The ethic of care and women’s experiences of public space. J. Environ. Psychol. 2000, 20, 103–124. [Google Scholar] [CrossRef]
- Krenichyn, K. Women and physical activity in an urban park: Enrichment and support through an ethic of care. J. Environ. Psychol. 2004, 24, 117–130. [Google Scholar] [CrossRef]
- Parra, D.C.; Hoehner, C.M.; Hallal, P.C.; Ribeiro, I.C.; Reis, R.; Brownson, R.C.; Pratt, M.; Simoes, E.J. Perceived environmental correlates of physical activity for leisure and transportation in Curitiba, Brazil. Prev. Med. 2011, 52, 234–238. [Google Scholar] [CrossRef] [PubMed]
- Nikunen, H. Perceptions of Lighting, Perceived Restorativeness, Preference and Fear in Outdoor Spaces. Ph.D. Thesis, Aalto University, Espoo, Finland, 2013. [Google Scholar]
- Herzog, T.R.; Rector, A.E. Perceived danger and judged likelihood of restoration. Environ. Behav. 2009, 41, 387–401. [Google Scholar] [CrossRef]
- Staats, H.; Jahncke, H.; Herzog, T.R.; Hartig, T. Urban options for psychological restoration: Common strategies in everyday situations. PLoS ONE 2016, 11, e0146213. [Google Scholar] [CrossRef] [PubMed]
- Cutt, H.; Giles-Corti, B.; Knuiman, M.; Burke, V. Dog ownership, health and physical activity: A critical review of the literature. Health Place 2007, 13, 261–272. [Google Scholar] [CrossRef] [PubMed]
- Lee, S.H.; Hyun, M.H. The comparison of natural environment and restorative environment in stress-buffering effects. Korean J. Psychol. 2004, 9, 609–632. [Google Scholar]
- Kim, M.; Sung, J.S.; Park, J.M. Behavior setting theory draws Cheonggyecheon. J. Urban Des. Inst. Korea 2014, 15, 33–46. [Google Scholar]
- Han, S.G.; Huh, J.H. Estimate of the heat island and building cooling load changes due to the restored stream in Seoul, Korea. Int. J. Urban Sci. 2008, 12, 129–145. [Google Scholar] [CrossRef]
- Kim, S.; Choi, J.; Kim, S. Roadside walking environments and major factors affecting pedestrian level of service. Int. J. Urban Sci. 2013, 17, 304–315. [Google Scholar] [CrossRef]
- Mariarinaldi, B. Landscapes of metropolitan hedonism: The Cheonggyecheon Linear Park in Seoul. J. Landsc. Archit. 2007, 2, 60–73. [Google Scholar] [CrossRef]
- Hwang, J.Y.; Jo, K.C.; Yang, S.W. Analysis on the behavioral characteristics of visitors to Cheonggyecheon in Seoul. J. Archit. Inst. Korea 2011, 27, 185–192. [Google Scholar]
- Pretty, J.; Peacock, J.; Sellens, M.; Griffin, M. The mental and physical health outcomes of green exercise. Int. J. Environ. Health Res. 2005, 15, 319–337. [Google Scholar] [CrossRef] [PubMed]
- Marcus, C.C.; Sachs, N.A. Therapeutic Landscapes: An Evidence-Based Approach to Designing Healing Gardens and Restorative Outdoor Spaces; John Wiley and Sons: London, UK, 2013. [Google Scholar]
Figure 1.
Place types in Cheonggyecheon Stream Park [37].
Figure 1.
Place types in Cheonggyecheon Stream Park [37].
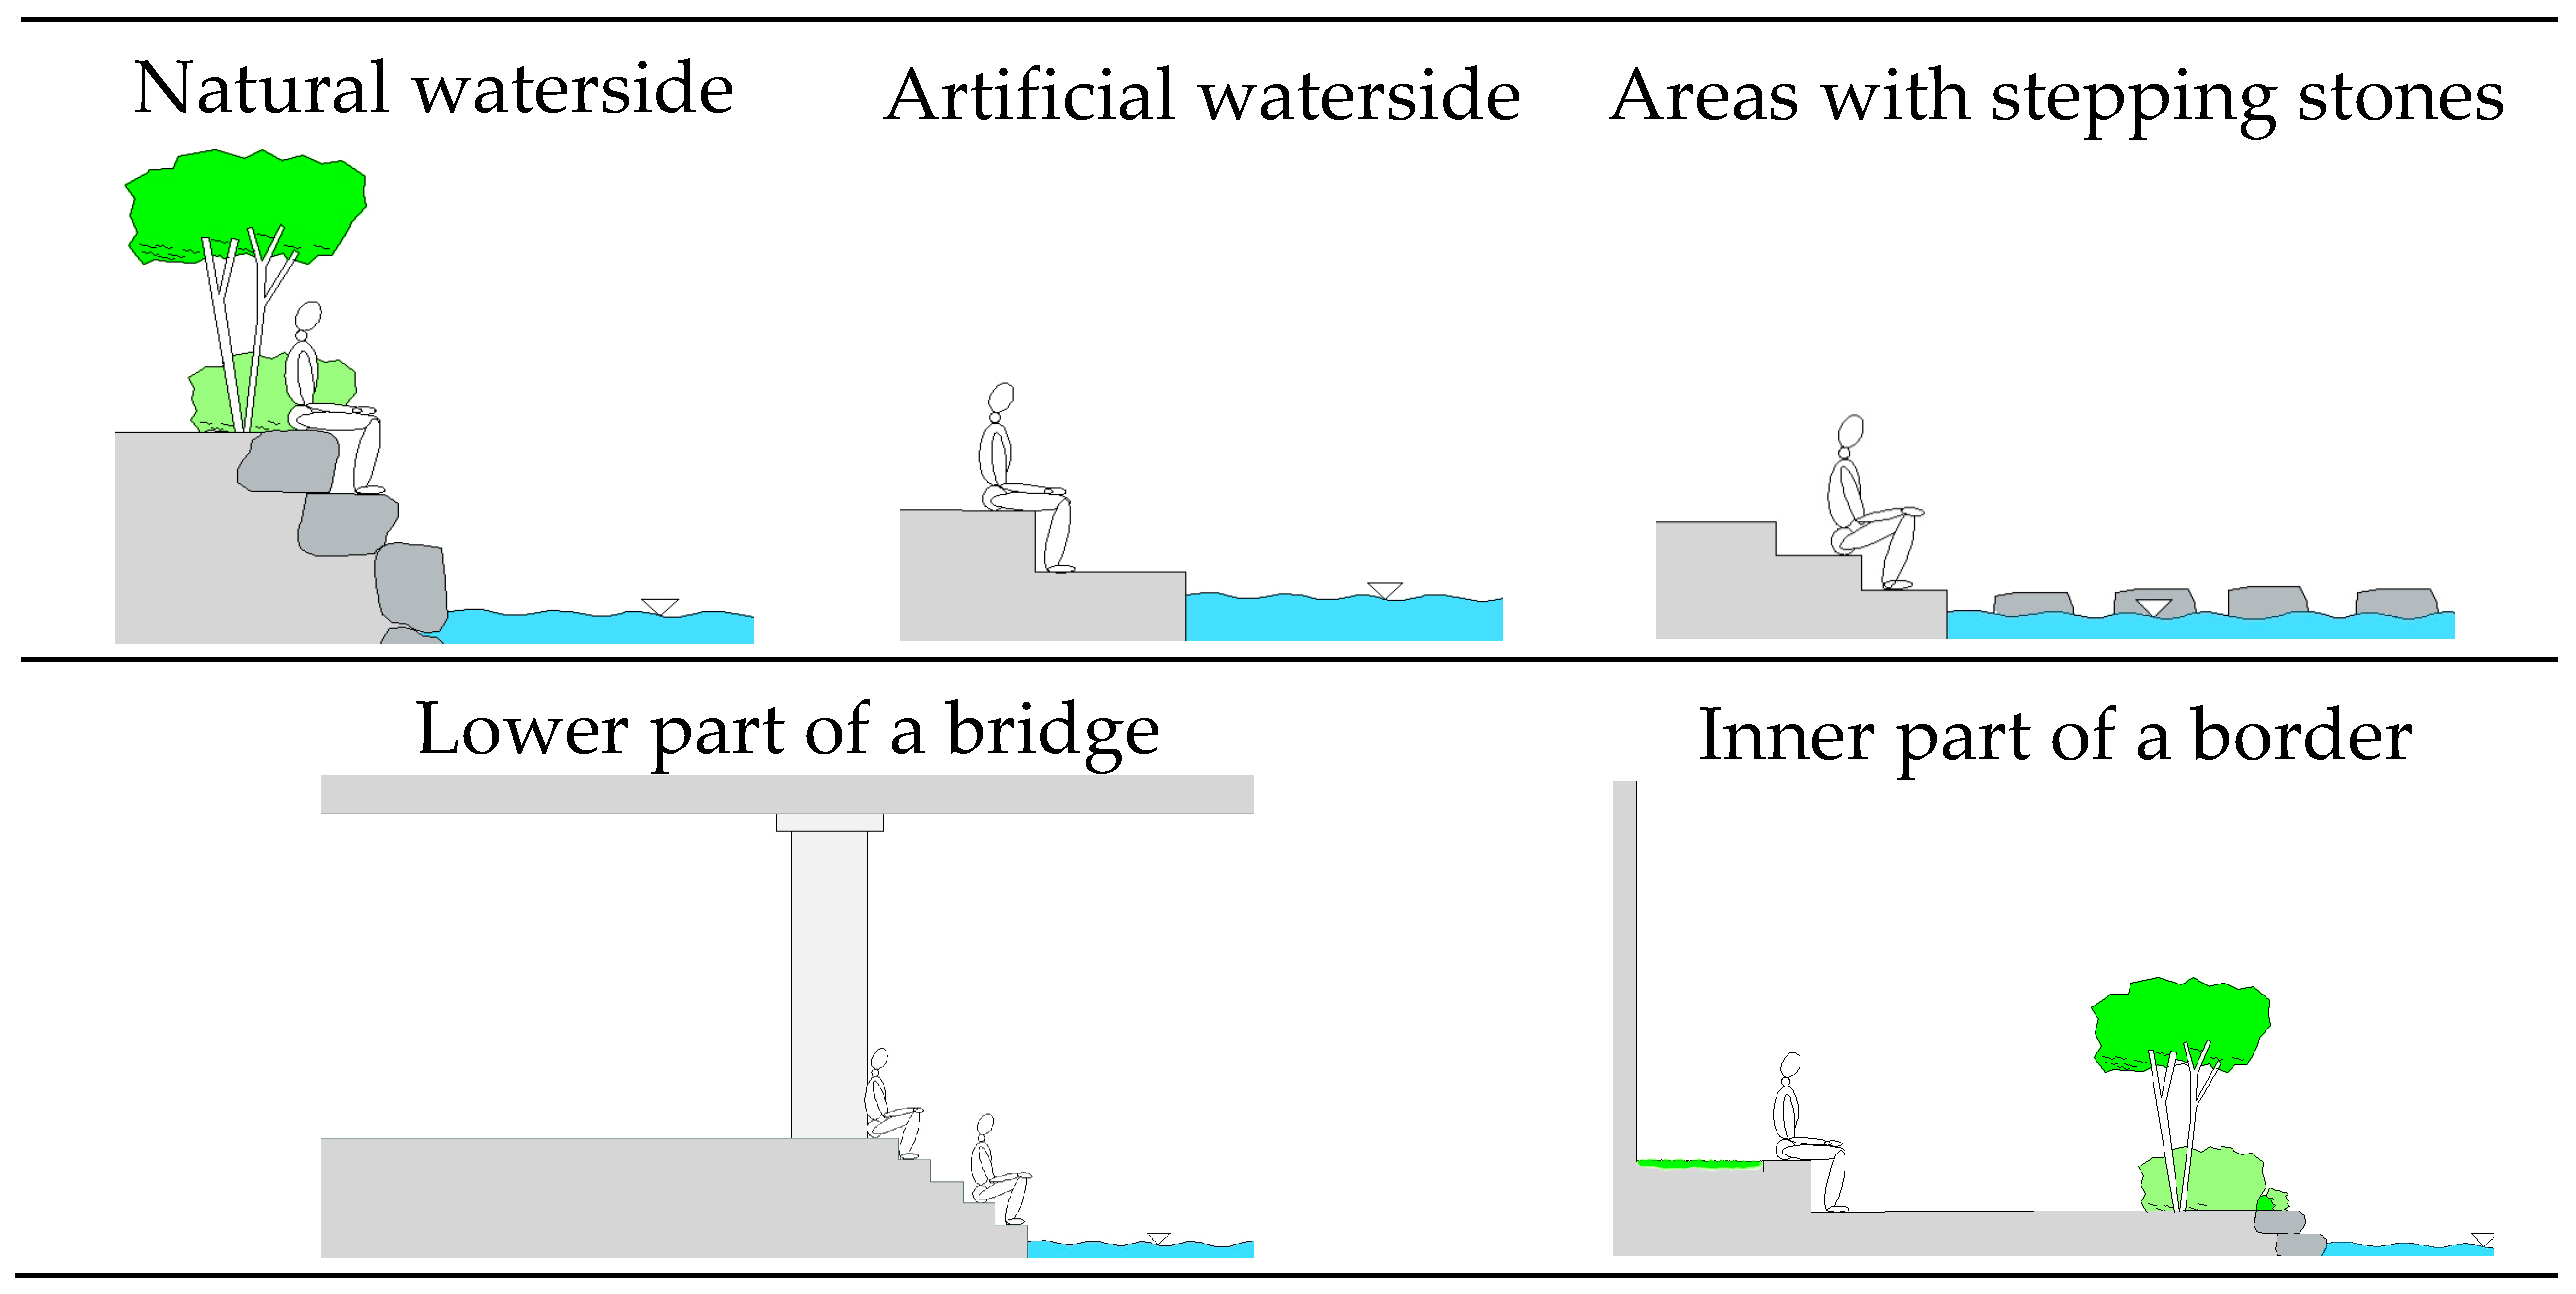
Figure 2.
Study area.

Table 1.
Descriptive statistics: Perceived Restorativeness Scale.
| Dimensions * | Survey Items | n | Mean | S.D. | Min | Max |
|---|---|---|---|---|---|---|
| Being Away | Being here allows me to get away from my daily routines. | 267 | 6.693 | 2.094 | 0 | 10 |
| Taking time here enables a temporary escape from my ordinary life. | 267 | 6.888 | 2.006 | 0 | 10 | |
| Fascination | This place is fascinating. | 268 | 6.175 | 2.226 | 0 | 10 |
| This place is visually stimulating. | 268 | 5.478 | 2.287 | 0 | 10 | |
| I want to know this place further. | 268 | 5.119 | 2.293 | 0 | 10 | |
| This place lacks eye-catching things. (Reversely coded) | 268 | 5.881 | 2.274 | 0 | 10 | |
| This place is boring. (Reversely coded) | 267 | 6.682 | 2.009 | 0 | 10 | |
| Coherence | Things in this place are well-structured. | 268 | 5.455 | 1.942 | 0 | 10 |
| This place is confusing. (Reversely coded) | 268 | 5.157 | 2.428 | 0 | 10 | |
| A lot of things in this place irritate me. (Reversely coded) | 267 | 5.637 | 2.254 | 0 | 10 | |
| This place is disorderly. (Reversely coded) | 268 | 6.534 | 1.881 | 0 | 10 | |
| Compatibility | This place fits my character. | 267 | 6.255 | 1.972 | 0 | 10 |
| This place serves my visit purpose. | 266 | 6.695 | 1.890 | 0 | 10 | |
| I feel like I am a part of this place. | 267 | 5.820 | 1.879 | 0 | 10 | |
| I am happy to be here. | 268 | 6.672 | 1.800 | 0 | 10 | |
| While being here, I feel united with this place. | 268 | 5.563 | 2.048 | 0 | 10 |
* Being Away; the feeling of escape from ordinary life, Fascination; leading effortless attention, Coherence; having a well-structured spatial composition, and Compatibility; the environment satisfies the user’s purpose of visiting.
Table 2.
Multinomial logistic regression: personal characteristics as related to the selection of a visiting place †.
Table 2.
Multinomial logistic regression: personal characteristics as related to the selection of a visiting place †.
| Variables | Categories | Lower Part of a Bridge | Natural Waterside | Inner Part of a Border | Areas with Stepping Stones | ||||||||||||
|---|---|---|---|---|---|---|---|---|---|---|---|---|---|---|---|---|---|
| Coef. | SE | RRR | p | Coef. | SE | RRR | p | Coef. | SE | RRR | p | Coef. | SE | RRR | p | ||
| Gender (ref. = female) | Male | 0.516 | 0.451 | 1.675 | 0.253 | 0.450 | 0.565 | 1.568 | 0.426 | 1.108 | 0.472 | 3.029 | 0.019 ** | 1.240 | 0.481 | 3.457 | 0.010 |
| Age group (ref. = 21–30 years) | 11–20 | −1.619 | 0.917 | 0.198 | 0.077 * | 0.372 | 0.815 | 1.450 | 0.648 | 0.654 | 0.710 | 1.924 | 0.357 | −0.013 | 0.755 | 0.987 | 0.986 |
| 31–40 | −0.099 | 0.549 | 0.905 | 0.856 | −0.561 | 0.820 | 0.571 | 0.494 | 0.630 | 0.586 | 1.877 | 0.282 | −0.096 | 0.605 | 0.908 | 0.874 | |
| >40 ‡ | 0.445 | 0.539 | 1.560 | 0.409 | 0.802 | 0.658 | 2.230 | 0.223 | −0.581 | 0.681 | 0.559 | 0.393 | −2.673 | 1.120 | 0.069 | 0.017 ** | |
| Number of companions (ref. = none) | 1 | −0.503 | 1.056 | 0.605 | 0.634 | −1.812 | 1.026 | 0.163 | 0.077 * | −0.664 | 1.068 | 0.515 | 0.534 | −0.492 | 1.091 | 0.612 | 0.652 |
| 2 | −0.149 | 1.086 | 0.862 | 0.891 | −2.819 | 1.232 | 0.060 | 0.022 ** | −0.357 | 1.093 | 0.699 | 0.744 | −1.201 | 1.154 | 0.301 | 0.298 | |
| >2 | −1.181 | 1.121 | 0.307 | 0.292 | −2.376 | 1.102 | 0.093 | 0.031 ** | −1.792 | 1.164 | 0.167 | 0.124 | −2.152 | 1.235 | 0.116 | 0.081 * | |
| Number of visits (ref. = 1–2 per year) | 1–2 a month | −1.134 | 0.546 | 0.322 | 0.038 ** | 0.136 | 0.651 | 1.145 | 0.835 | −0.286 | 0.529 | 0.751 | 0.589 | −0.072 | 0.541 | 0.931 | 0.895 |
| 1–2 a week | −1.376 | 1.011 | 0.252 | 0.173 | 0.412 | 1.119 | 1.510 | 0.713 | 0.438 | 0.904 | 1.549 | 0.628 | −0.514 | 1.038 | 0.598 | 0.621 | |
| Almost every day | −1.029 | 0.975 | 0.357 | 0.291 | −0.621 | 1.254 | 0.537 | 0.620 | −2.447 | 1.344 | 0.087 | 0.069 * | −1.829 | 1.362 | 0.161 | 0.179 | |
| Travel mode (ref. = other than public transportation ‡) | Metro | −1.610 | 0.768 | 0.200 | 0.036 ** | 0.392 | 1.037 | 1.480 | 0.705 | −0.285 | 0.940 | 0.752 | 0.762 | −3.279 | 1.032 | 0.038 | 0.001 *** |
| Bus | −2.105 | 0.844 | 0.122 | 0.013 ** | 0.411 | 1.074 | 1.508 | 0.702 | 1.147 | 0.953 | 3.149 | 0.229 | −1.252 | 0.984 | 0.286 | 0.203 | |
| Metro–bus | −1.162 | 0.771 | 0.313 | 0.132 | 0.328 | 1.090 | 1.388 | 0.763 | 1.822 | 0.960 | 6.183 | 0.058 * | −0.481 | 0.927 | 0.618 | 0.604 | |
| Travel time (ref. = less than 10 min) | <1 h | 1.527 | 0.886 | 4.604 | 0.085 * | −0.378 | 0.948 | 0.685 | 0.690 | −0.533 | 0.818 | 0.587 | 0.515 | 1.451 | 0.998 | 4.269 | 0.146 |
| ≥1 h ‡ | 1.154 | 0.914 | 3.172 | 0.206 | −0.225 | 1.009 | 0.798 | 0.823 | −2.598 | 1.009 | 0.074 | 0.010 ** | 0.491 | 1.097 | 1.634 | 0.654 | |
| Visit purpose (ref. = leisure) | Other than leisure ‡ | −0.476 | 1.051 | 0.622 | 0.651 | 1.010 | 0.903 | 2.747 | 0.263 | −0.646 | 1.311 | 0.524 | 0.622 | −0.689 | 1.320 | 0.502 | 0.602 |
| (Constant) | 0.775 | 1.379 | 2.170 | 0.574 | 0.614 | 1.456 | 1.847 | 0.674 | 0.069 | 1.398 | 1.071 | 0.961 | 0.704 | 1.415 | 2.022 | 0.619 | |
| n = 238; LR χ2 (64) = 137.718 (p = 0.000) Pseudo R2 = 0.183 (adjusted pseudo R2 = 0.002); count R2 = 0.441 (adjusted count R2 = 0.253) | |||||||||||||||||
† Reference = artificial waterside; ‡ categories were combined to secure sufficient cases in number (see Table 1), that is, to prevent the separation problem. (* p < 0.1, ** p < 0.05, *** p < 0.01).
Table 3.
Hierarchical regression: Perceived Restorativeness Scale (PRS).
| Variables | Categories | Dependent = Being Away | Dependent = Fascination | Dependent = Coherence | Dependent = Compatibility | |||||||||||||
|---|---|---|---|---|---|---|---|---|---|---|---|---|---|---|---|---|---|---|
| Coef. | SE | Stand. coef. | p | Coef. | SE | Stand. coef. | p | Coef. | SE | Stand. coef. | p | Coef. | SE | Stand. coef. | p | |||
| Block 1 | Gender (ref. = female) | Male | 0.393 | 0.526 | 0.052 | 0.456 | 0.640 | 1.156 | 0.038 | 0.580 | −0.466 | 0.855 | −0.039 | 0.587 | 0.236 | 1.100 | 0.015 | 0.831 |
| Age group (ref. = 21–30 years) | 11–20 | 0.371 | 0.889 | 0.033 | 0.677 | −0.431 | 1.929 | −0.017 | 0.824 | 1.780 | 1.428 | 0.100 | 0.214 | −0.586 | 1.838 | −0.026 | 0.750 | |
| 31–40 | −0.609 | 0.665 | −0.068 | 0.361 | −2.594 | 1.456 | −0.131 | 0.076 * | −0.524 | 1.077 | −0.037 | 0.627 | −1.643 | 1.396 | −0.090 | 0.240 | ||
| 41–50 | −0.666 | 0.833 | −0.057 | 0.425 | 1.060 | 1.825 | 0.041 | 0.562 | 2.025 | 1.351 | 0.109 | 0.135 | 0.849 | 1.740 | 0.036 | 0.626 | ||
| 51–60 | 0.471 | 1.173 | 0.028 | 0.689 | −0.639 | 2.570 | −0.017 | 0.804 | 1.705 | 1.901 | 0.065 | 0.371 | −0.396 | 2.448 | −0.012 | 0.872 | ||
| >60 | −1.619 | 1.881 | −0.061 | 0.390 | 0.132 | 4.116 | 0.002 | 0.975 | 3.663 | 3.048 | 0.088 | 0.231 | 1.976 | 3.927 | 0.037 | 0.615 | ||
| Number of companions (ref. = none) | 1 | −2.222 | 1.076 | −0.294 | 0.040 | −2.379 | 2.352 | −0.142 | 0.313 | 0.705 | 1.743 | 0.059 | 0.686 | −1.724 | 2.243 | −0.112 | 0.443 | |
| 2 | −2.613 | 1.148 | −0.275 | 0.024 | −1.257 | 2.518 | −0.059 | 0.618 | 2.678 | 1.861 | 0.178 | 0.152 | −0.996 | 2.405 | −0.051 | 0.679 | ||
| >2 | −2.648 | 1.202 | −0.292 | 0.029 | −2.725 | 2.627 | −0.135 | 0.301 | −0.290 | 1.947 | −0.020 | 0.882 | −4.669 | 2.508 | −0.253 | 0.064 | ||
| Number of visits (ref. = 1–2 per year) | 1–2 a month | −0.246 | 0.607 | −0.029 | 0.686 | −0.691 | 1.330 | −0.037 | 0.604 | 0.736 | 0.986 | 0.055 | 0.456 | 0.123 | 1.269 | 0.007 | 0.923 | |
| 1–2 a week | 1.479 | 1.085 | 0.104 | 0.174 | 6.857 | 2.374 | 0.216 | 0.004 | 0.077 | 1.759 | 0.003 | 0.965 | 5.084 | 2.267 | 0.175 | 0.026 | ||
| Almost every day | 0.521 | 1.287 | 0.030 | 0.686 | −0.954 | 2.813 | −0.025 | 0.735 | −1.132 | 2.082 | −0.041 | 0.587 | −7.394 | 2.681 | −0.211 | 0.006 | ||
| Travel mode (ref. = walk) | Automobile | −0.900 | 1.837 | −0.037 | 0.624 | 0.367 | 3.993 | 0.007 | 0.927 | −0.731 | 2.959 | −0.019 | 0.805 | 0.337 | 3.809 | 0.007 | 0.930 | |
| Metro | −2.093 | 1.068 | −0.242 | 0.051 | −2.091 | 2.309 | −0.109 | 0.366 | 1.270 | 1.710 | 0.093 | 0.459 | −2.382 | 2.206 | −0.135 | 0.281 | ||
| Bus | −1.681 | 1.092 | −0.177 | 0.125 | −1.965 | 2.367 | −0.093 | 0.408 | 2.336 | 1.754 | 0.156 | 0.184 | −1.719 | 2.258 | −0.089 | 0.447 | ||
| Metro–bus | −1.281 | 1.036 | −0.163 | 0.218 | −0.244 | 2.258 | −0.014 | 0.914 | 0.096 | 1.671 | 0.008 | 0.954 | −2.170 | 2.149 | −0.136 | 0.314 | ||
| Travel time (ref. = less than 10 min) | <1 h | 2.726 | 1.031 | 0.344 | 0.009 | 4.361 | 2.204 | 0.248 | 0.049 | −0.186 | 1.633 | −0.015 | 0.909 | 1.139 | 2.103 | 0.071 | 0.588 | |
| 1–2 h | 2.610 | 1.155 | 0.250 | 0.0205 | 2.869 | 2.466 | 0.124 | 0.246 | −0.420 | 1.827 | −0.025 | 0.819 | 0.776 | 2.351 | 0.037 | 0.742 | ||
| >2 h | 4.958 | 1.560 | 0.263 | 0.002 | 8.649 | 3.372 | 0.207 | 0.011 | −1.061 | 2.500 | −0.036 | 0.672 | 6.735 | 3.215 | 0.176 | 0.037 | ||
| Visit purpose (ref. = leisure) | Work/study | 4.014 | 1.675 | 0.167 | 0.017 | 4.300 | 3.485 | 0.087 | 0.219 | −4.519 | 2.583 | −0.128 | 0.082 * | −1.340 | 3.325 | −0.030 | 0.687 | |
| Transit | −2.030 | 1.776 | −0.077 | 0.254 | 1.502 | 3.885 | 0.026 | 0.699 | −0.699 | 2.877 | −0.017 | 0.808 | −3.101 | 3.704 | −0.058 | 0.403 | ||
| Block 2 | Visiting place (ref. = artificial waterside) | Lower part of a bridge | −0.821 | 0.722 | −0.091 | 0.257 | −3.050 | 1.583 | −0.151 | 0.055 * | −0.584 | 1.169 | −0.041 | 0.618 | −2.423 | 1.506 | −0.132 | 0.109 |
| Natural waterside | −0.635 | 0.925 | −0.052 | 0.493 | −0.874 | 2.018 | −0.033 | 0.665 | 2.821 | 1.495 | 0.150 | 0.061 * | −0.421 | 1.925 | −0.017 | 0.827 | ||
| Inner part of a border | 1.447 | 0.751 | 0.155 | 0.056 * | 4.735 | 1.646 | 0.228 | 0.004 *** | 2.375 | 1.218 | 0.161 | 0.052 * | 0.784 | 1.568 | 0.041 | 0.618 | ||
| Areas with stepstones | 0.143 | 0.794 | 0.015 | 0.857 | −0.927 | 1.738 | −0.044 | 0.594 | 0.317 | 1.289 | 0.021 | 0.806 | −0.321 | 1.672 | −0.017 | 0.848 | ||
| (Constant) | 14.702 | 1.540 | 0.000 | 28.628 | 3.368 | 0.000 | 20.180 | 2.495 | 0.000 | 34.789 | 3.218 | 0.000 | ||||||
| F (25, 211) = 1.968 (p = 0.006) R2 = 0.189 (adjusted R2 = 0.093) ΔR2 = 0.035; ΔF (4, 211) = 2.264 (p = 0.063) Durbin-Watson statistic = 2.261 | F (25, 211) = 2.285 (p = 0.001) R2 = 0.213 (adjusted R2 = 0.120) ΔR2 = 0.083; ΔF (4, 211) = 5.548 (p = 0.000) Durbin-Watson statistic = 1.851 | F (25, 211) = 1.485 (p = 0.071) R2 = 0.150 (adjusted R2 = 0.049) ΔR2 = 0.039; ΔF (4, 211) = 2.409 (p = 0.050) Durbin-Watson statistic = 2.000 | F (25, 211) = 1.433 (p = 0.091) R2 = 0.145 (adjusted R2 = 0.044) ΔR2 = 0.018; ΔF (4, 211) = 1.081 (p = 0.367) † Durbin-Watson statistic = 2.003 | |||||||||||||||
† ΔF was not significant even when each of the five items in the “Compatibility” dimension was used as the dependent variable: (1) ΔF_fitting my character (4, 212) = 1.539 (p = 0.192); (2) ΔF_serving my visit purpose (4, 211) = 0.536 (p = 0.710); (3) ΔF_being a part of this place (4, 212) = 0.916 (p = 0.456); (4) ΔF_happy to be here (4, 212) = 0.833 (p = 0.506); (5) ΔF_I feel united with this place (4, 212) = 1.335 (p = 0.258). (* p < 0.1, ** p < 0.05, *** p < 0.01).
© 2017 by the authors. Licensee MDPI, Basel, Switzerland. This article is an open access article distributed under the terms and conditions of the Creative Commons Attribution (CC BY) license (http://creativecommons.org/licenses/by/4.0/).
Share and Cite
MDPI and ACS Style
Kim, M.; Gim, T.-H.T.; Sung, J.-S. Applying the Concept of Perceived Restoration to the Case of Cheonggyecheon Stream Park in Seoul, Korea. Sustainability 2017, 9, 1368. https://doi.org/10.3390/su9081368
AMA Style
Kim M, Gim T-HT, Sung J-S. Applying the Concept of Perceived Restoration to the Case of Cheonggyecheon Stream Park in Seoul, Korea. Sustainability. 2017; 9(8):1368. https://doi.org/10.3390/su9081368
Chicago/Turabian StyleKim, Moohan, Tae-Hyoung Tommy Gim, and Jong-Sang Sung. 2017. "Applying the Concept of Perceived Restoration to the Case of Cheonggyecheon Stream Park in Seoul, Korea" Sustainability 9, no. 8: 1368. https://doi.org/10.3390/su9081368
Note that from the first issue of 2016, this journal uses article numbers instead of page numbers. See further details here.