Environmental and Socio-Economic Analysis of Naphtha Reforming Hydrogen Energy Using Input-Output Tables: A Case Study from Japan

Center for Creation of Symbiosis Society with Risk (CCSSR), Yokohama National University, 79-5 Tokiwadai, Hodogaya, Yokohama 240-8501, Japan
Sustainability 2017, 9(8), 1376; https://doi.org/10.3390/su9081376
Submission received: 31 May 2017
/
Revised: 31 July 2017
/
Accepted: 1 August 2017
/
Published: 4 August 2017
(This article belongs to the Special Issue Hydrogen Economy: Technology and Social Issue)
Abstract
:Comprehensive risk assessment across multiple fields is required to assess the potential utility of hydrogen energy technology. In this research, we analyzed environmental and socio-economic effects during the entire life cycle of a hydrogen energy system using input-output tables. The target system included hydrogen production by naphtha reforming, transportation to hydrogen stations, and FCV (Fuel Cell Vehicle) refilling. The results indicated that 31%, 44%, and 9% of the production, employment, and greenhouse gas (GHG) emission effects, respectively, during the manufacturing and construction stages were temporary. During the continuous operation and maintenance stages, these values were found to be 69%, 56%, and 91%, respectively. The effect of naphtha reforming was dominant in GHG emissions and the effect of electrical power input on the entire system was significant. Production and employment had notable effects in both the direct and indirect sectors, including manufacturing (pumps, compressors, and chemical machinery) and services (equipment maintenance and trade). This study used data to introduce a life cycle perspective to environmental and socio-economic analysis of hydrogen energy systems and the results will contribute to their comprehensive risk assessment in the future.
1. Introduction
We currently face significant environmental and energy problems. In particular, economic activity and greenhouse gas (GHG) production are strongly correlated [1]. Current GHG emissions are expected to increase by one-third before 2040, based on current projections of economic development and population growth in the Middle East, India, China, Africa, and Southeast Asia [2]. Hydrogen energy technology is expected to address this problem. In the latest Basic Energy Plan, the Japanese government expressed the need for comprehensive analysis of hydrogen energy technology from the perspectives of environmental safety, convenience, and economy throughout the entire supply chain, including production, transportation, and utilization of hydrogen [3]. In addition, the Japanese government intends to employ hydrogen energy in transport, athletes’ villages, and venues during the Tokyo Olympic and Paralympic Games in 2020 [4]. Fuel cell vehicles (FCVs) have been available on the Japanese market since 2015. The Tokyo Metropolitan Government is aiming to build 35 hydrogen fueling stations by 2020 [5].
The triple bottom line viewpoint says that energy technology is an important element of a functioning society [6]. International Organization for Standardization/ International Electrotechnical Commission (ISO/ICE) Guide 73 [7] defines risk as the “effect of uncertainty on objectives”, and effect as “deviation from the expected-positive and/or negative”. In his social risk analysis for energy systems and social infrastructure, Branscomb [8] indicated 13 features—including agriculture, food, water, public health, emergency services, government, defense industrial base, information and telecommunications energy, transportation (people and products), banking and finance, the chemical industry, and postal and shipping—that are important for the functioning of a city, with reference to United States Department of Homeland Security [9]. Shi et al. [10] assessed social risks associated with the process of urban development using observations, expert meetings, interviews, and discussion forums. Furthermore, in energy technology analysis, McLellan et al. [11] studied the social risks of the main power generation technologies when impacted by natural disasters from points of view of humanity, society, economics, manufacturing, and nature. In addition, Japanese decision-making and social acceptance emphasizes a balance of multiple values, including stable economic foundation, safety, security, reliable social systems, and sustainable and good relationships among different groups. [12,13]; therefore, it is important to identify the variety of risks generated by new energy technologies and systems in order to promote their popularity within society and consider risk balance among various fields.
To date, Japanese hydrogen energy technology has been analyzed in several areas. In the safety field, Sakamoto et al. [14] analyzed the safety distance between pieces of equipment in a hydrogen fueling station; Nakayama et al. [15] analyzed accident scenarios that could occur in hydrogen stations; and Okada et al. [16] analyzed the safety of organic chemical hydride. Ono and Tsunemi [17] suggested that providing precise risk information contributes to better acceptance. In the economic field, cost analyses of the manufacturing, construction, and operation phases have been conducted [18,19,20,21,22,23,24]. Additionally, environmental analyses have focused on CO2 emissions in the supply chain during hydrogen production [25,26,27,28,29].
However, many of these studies were not conducted from a consistent, holistic point of view as operators and technicians in their respective areas developed them independently. Studies of future energy technology from an inclusive viewpoint that spans all areas and incorporates the values of users are very limited. Furthermore, studies that adopt a life cycle perspective across multiple industries are lacking.
Input-output analysis is useful as a method for life cycle analyses. The effectiveness of input-output analysis and scenario analysis for energy technology has been demonstrated, especially for renewable energy technology [30,31,32,33,34,35,36]. Currently, Lee et al. [37] and Chun et al. [38] are developing analyses for hydrogen energy systems to harness attention for future development.
This study aimed to highlight the environmental and socio-economic effects caused by the hydrogen energy system during its life cycle in Japan, using input-output tables. This basic analysis introduces the assessment of life cycle effects of hydrogen energy systems and will assist in future comprehensive risk (In reference to the ISO/ICE Guide 73 [7], risk is defined as the “effect of uncertainty on objectives.” In addition, similarly, the effect is defined as “a deviation from the expected—positive and/or negative.”) analysis of hydrogen energy technology.
2. Materials and Methods
2.1. Input-Output Analysis
Input-output analysis can comprehensively estimate direct and indirect effects caused by final demand. Balance of the input-output table is shown in Equation (1). Direct and indirect production was estimated using Equation (2). Using the diagonal matrix of employment , and GHG emissions , direct and indirect employment and GHG emissions were estimated using Equations (3) and (4), respectively:
where is the input coefficient matrix, is the unit matrix, and is the final demand column vector calculated using the detailed cost. The Ministry of Internal Affairs and Communications 2011 edition includes the latest version of the input-output table [39]. However, the Japanese economics and energy systems were strongly affected by the Great East Japan Earthquake in 2011, and no information is available to estimate GHG emissions. Therefore, we used the input-output table of 2005 ( sectors) [40], employment table [40], and 3EID (Embodied Energy and Emission Intensity Data for Japan) [41] for our calculations. We assumed that all production activities occurred in Japan because we focused on highlighting the direct and indirect effects of each sector in the hydrogen energy system.
2.2. Assumptions of the Hydrogen Energy System
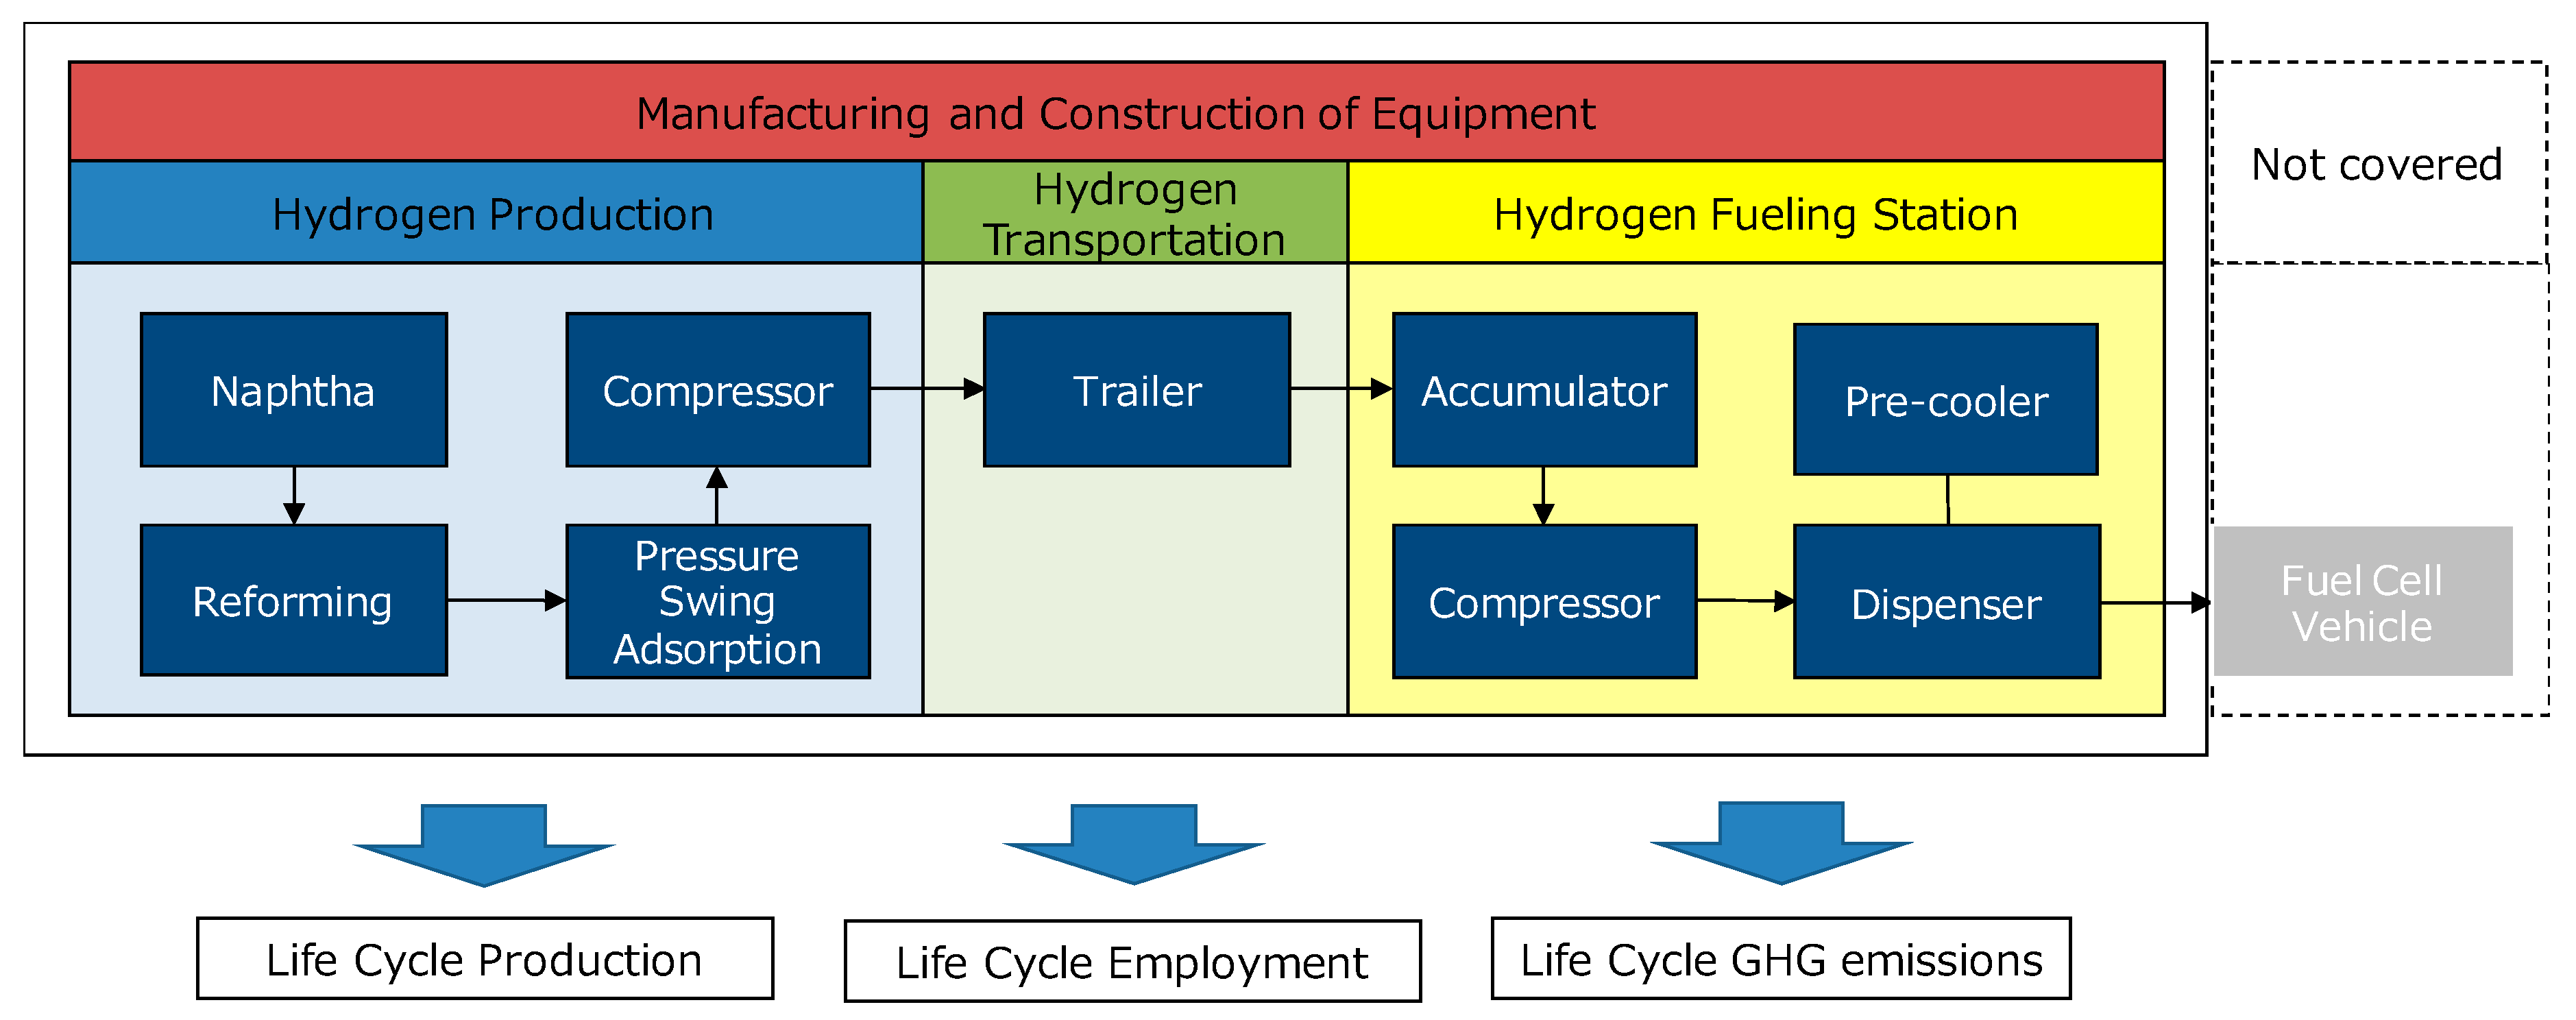
Hydrogen production and transportation were included within the system boundary to comprehensively analyze environmental and socio-economic effects associated with the introduction of hydrogen fueling stations. For practical and economic purposes, hydrogen was produced by steam reforming of naphtha [42], and transported to eight hydrogen stations [23] as high-pressure gas, and used to fill FCVs (Figure 1 and Table 1). The lifetime of all hydrogen equipment was assumed to be ten years, with an equipment utilization rate of 0.8 [43]. The hydrogen filling capacity of the hydrogen station during its life cycle was 9 450 t-H2. The sales price in Japan was estimated (USD equivalent was calculated using the exchange rate of 110.22 JPY per USD in 2005 [44]) at 1080 JPY/kg according to the author’s field survey, and production cost was calculated as JPY 10 206 million, according to the Japan Hydrogen & Fuel Cell Demonstration Project (JHFC) [23] and Fuji [45] (Table 2). The overall cost balance was adjusted based on the added value of the original input-output table’s closing sectors in 2005 (hydrogen production was from “petroleum refinery products, Inc. greases”; hydrogen transportation was from “road freight transport”; hydrogen fueling station was represented by “retail trade”). These costs are projected for the period 2015 to 2020.
This study considered the manufacturing, construction, operation, and maintenance stages. The manufacturing and construction costs of a hydrogen production facility established near the refinery, with a running time of 24 h per day, a production capacity of 1500 Nm3/h, and employing one person per year were estimated. The manufacturing and construction costs included: PSA (Pressure Swing Adsorption) equipment, hydrogen compressor, suction drum, off-gas compressor, other piping, installation, electrical equipment, civil engineering, construction, engineering, raw material and fuel naphtha, power, clean water, labor, repairs, insurance premiums, property tax, and overheads. In addition, the costs for raw material and fuel naphtha were assumed to be 45,900 JPY/kL, cost for power was 12 JPY/kWh, and cost for clean water was 300 JPY/t.
Transportation routes included path from the production location to the eight hydrogen fueling stations. Transport distance was assumed to be 100 km per round trip, and eight round trips per day were undertaken for each station. Eight trailers and two tractors were used for transport. Each trailer consisted of 68 pieces of the CFRP (Carbon Fiber-Reinforced Plastics) container (45 MPa). Trailers were allocated as follows: eight trailers in detention, two trailers in transportation, and two trailers in filling. However, we assumed that only four tractors were produced within the life cycle, as the lifetime of each tractor is five years. In addition, we assumed that 2 km/L of light oil was required for transport, at a unit price of 120 JPY/L, and four laborers are used per year.
Hydrogen stations were assumed to be built at eight off-site locations, producing 300 Nm3/h, and operating 15 h every day. Manufacturing and construction costs included costs for the pressure accumulator (high pressure), compressor (filling), hydrogen dispenser, pre-cooler equipment, hydrogen valve, hydrogen sensors, civil engineering, construction, and engineering. In the operation and maintenance stages, costs of 2.98 kWh/kg-H2 power requirement for equipment control, lighting power, and pre-cooler starting power/maintaining power/H2 distribution were considered, in addition to regular maintenance costs.
The details of final demand () created from the above-mentioned prerequisite and the cost information are described in Appendix A.
2.3. Established New Sectors
Table 3 showed six new sectors in this study. Three new sectors related to hydrogen energy were established in the original input coefficient matrix to reflect the technical characteristics of hydrogen. These included hydrogen production, hydrogen transport, and the hydrogen fueling station. Input coefficients (), employment coefficient (), and GHG emissions coefficient () of the three sectors were estimated. GHG emissions caused by naphtha reforming and light oil combustion were quoted as 2.24 (As information on clear GHG emissions caused by naphtha reforming is not available, the value of naphtha combustion was substituted) and 2.58 t/kL of CO2, respectively [46]. Additionally, production () during the manufacturing and construction stages was estimated by setting the final demand vector () in as much detail as possible, as the appropriate sectors appeared in the original input-output table.
The details of three new sectors related to hydrogen energy system () created from the above-mentioned prerequisite and the cost information are described in Appendix B.
A relatively large amount of electric power is input to the hydrogen energy system from the above cost information (Table 2). The grid mix of Japan has changed greatly since the Great East Japan Earthquake of 2011. In 2015, nuclear power generation was 1%, thermal power was 89%, and others were 10%, while, in 2005, nuclear power was 31%, thermal power was 61%, and others were 9%. The differences in the grid mix between 2005 and 2015 might have a significant effect on the results [47]; therefore, the structures input into the grid mix of a given year are reflected in the input-output table.
Three new sectors related to power generation were established in the original input coefficient matrix to reflect the 2005 grid mix. The power generation sectors in the original basic input output table consisted of one row (total power generation) and three columns (“nuclear power generation”, “thermal power generation”, and “hydro and geothermal power generation”). Therefore, all sectors of the input coefficient (A) were disaggregated to three sectors by the grid mix ratio in 2005 (Table 3). Employment coefficients were estimated using the original employment matrix [40] and number of employees of each type of power generation in 2005 [47]. The GHG emissions coefficient was estimated by 3EID [41] and assumed that everything would discharge in thermal power generation.
3. Results and Discussion
3.1. Life Cycle Effects
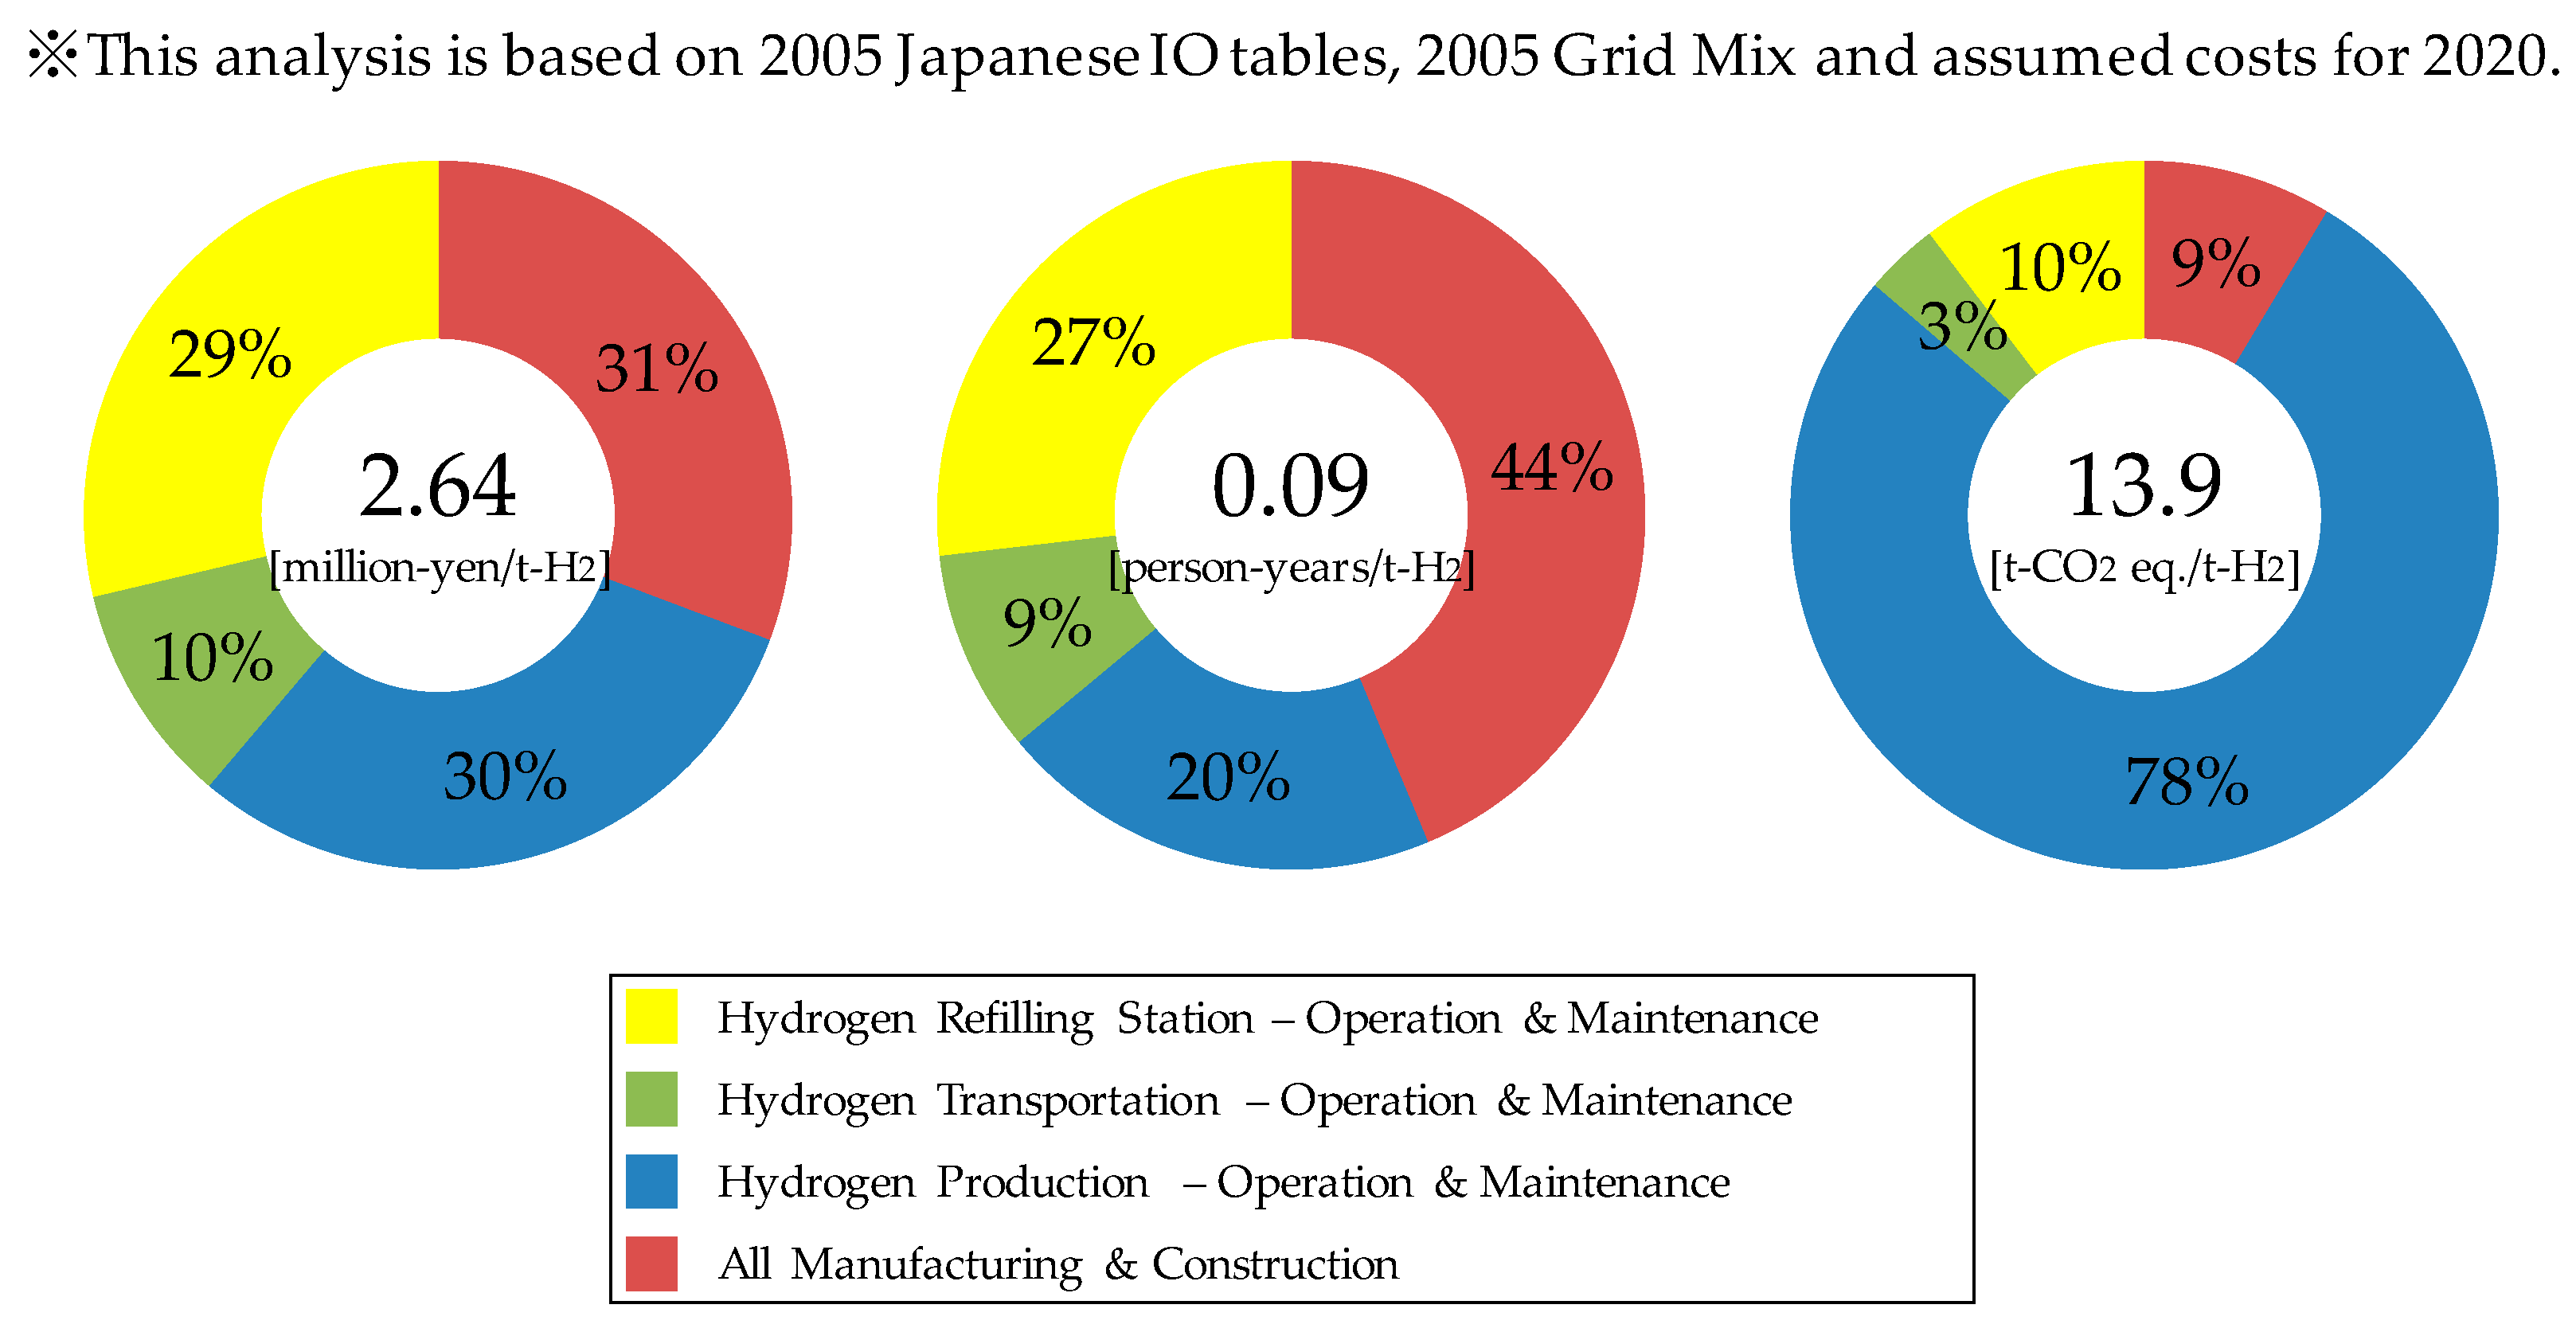
The input-output analysis estimated the effect of production, employment, and GHG emissions per ton of the hydrogen energy system at JPY 2.64 million, 0.09 person per year, and 13.9 t-CO2 eq., respectively (Figure 2). The ratios of the effects of production and employment in the manufacturing and construction stages were calculated as 31% and 44%, respectively, and are relatively higher compared to the operation and maintenance stages. Thus, about 30–40% of the production and employment effects associated with manufacturing and construction stages were temporary. However, 91% of the GHG emission effects were associated with operation and maintenance stages, which included 78% production, 3% transportation, and 10% hydrogen fueling stations.
3.2. Sectoral Effects
Sectoral effects of the hydrogen energy system are illustrated in Figure 3. The direct effect of hydrogen refill stations, hydrogen production, and hydrogen transportation ranked the highest. Indirect effect was attributed to various industries including energy production of naphtha (petroleum refinery products, including greases) and its material (coal mining, crude petroleum, and natural gas) in the operation and maintenance stages; engineering services (other business services), electricity, commercial (wholesale trade) during the entire life cycle; and manufacturing of pumps, compressors, and chemical machinery in the manufacturing and construction stages.
The effect of employment was the same as production, with the greatest effect from the hydrogen station. However, the effects of engineering services (other business services), commercial (wholesale trade and retail trade) and civil engineering and construction were greater than the direct effect of hydrogen production and hydrogen transportation. In addition, temporary effects of manufacturing were recorded owing to pumps, compressors, and chemical machinery. For example, this study assumed that there were two employers at a hydrogen station, based on published reports [18,45]. However, our field survey revealed that two to five employees were always working. Furthermore, operation and maintenance of the hydrogen fueling station is often carried out by the same enterprise that maintains the gas station, indicating that a direct increase effect of employment owing to the hydrogen system is unlikely. However, different qualifications are required for hydrogen fueling stations and gas stations operation as specific laws concerning dangerous goods and high-pressure gas safety are applied. Therefore, it is desirable to interpret these numerical values in light of social and business conditions. The indirect effect of GHG emissions accounted for about 55% of the total during hydrogen production and 25% during electricity consumption. The former is due to naphtha reforming and could possibly be reduced by CO2 recovery and industrial use. The latter is attributed to the power required for the naphtha reforming refinery, hydrogen station compressor, and precooling equipment, which can be reduced by selection improved power generation technology. However, despite similar fuel combustion for thermal power, the effects for the hydrogen transportation sector are relatively small, and account for about 2% of the entire life cycle. This can be attributed to the large difference in consumption. While the amount of light fuel needed for transport is 0.4 kL/day, the amount of naphtha is 12.5 kL/day during hydrogen production.
Environmental and socio-economic effects due to fuel consumption by high-pressure hydrogen transport (tractor and lorries) are small throughout the life cycle, and it is unlikely that this result will change significantly in the near future. However, in the liquefied hydrogen and organic hydride methods, although the amount of hydrogen that can be transported increases, the trade-off between the total energy input and transportation mode needs to be studied. As these two methods have not currently been introduced in Japan, it is necessary to assess the economic effect, employment effect, and GHG emissions, along with safety and acceptability.
3.3. Sensitivity Analysis Using Grid Mix Scenarios
When hydrogen is used in society, significant power is needed for compressing and cooling over the life cycle. In the transportation of high pressure hydrogen, the effect of this electric power also applies to hydrogen production as by-product of hydrogen and water electrolysis hydrogen. Japan's power supply composition in 2005 was influenced by thermal power generation, which contributed nearly 60%, while nuclear power contributed 30%. As the ratio of thermal power generation in 2015 rose to 90%, current production, employment, and GHG emissions from this sector may now be even larger [47]. Therefore, sensitivity analysis was performed assuming three grid mixes (Table 4). The first (base) scenario was 31%, 60%, and 9% for nuclear, thermal, and hydrogen and geothermal, respectively. For the second scenario, the values were 16%, 74%, 9%, and, for the third scenario, the values were 1%, 89%, 10%, respectively. The first and third grid mix were assumed to be 2005 and 2015. The second was the average of the two.
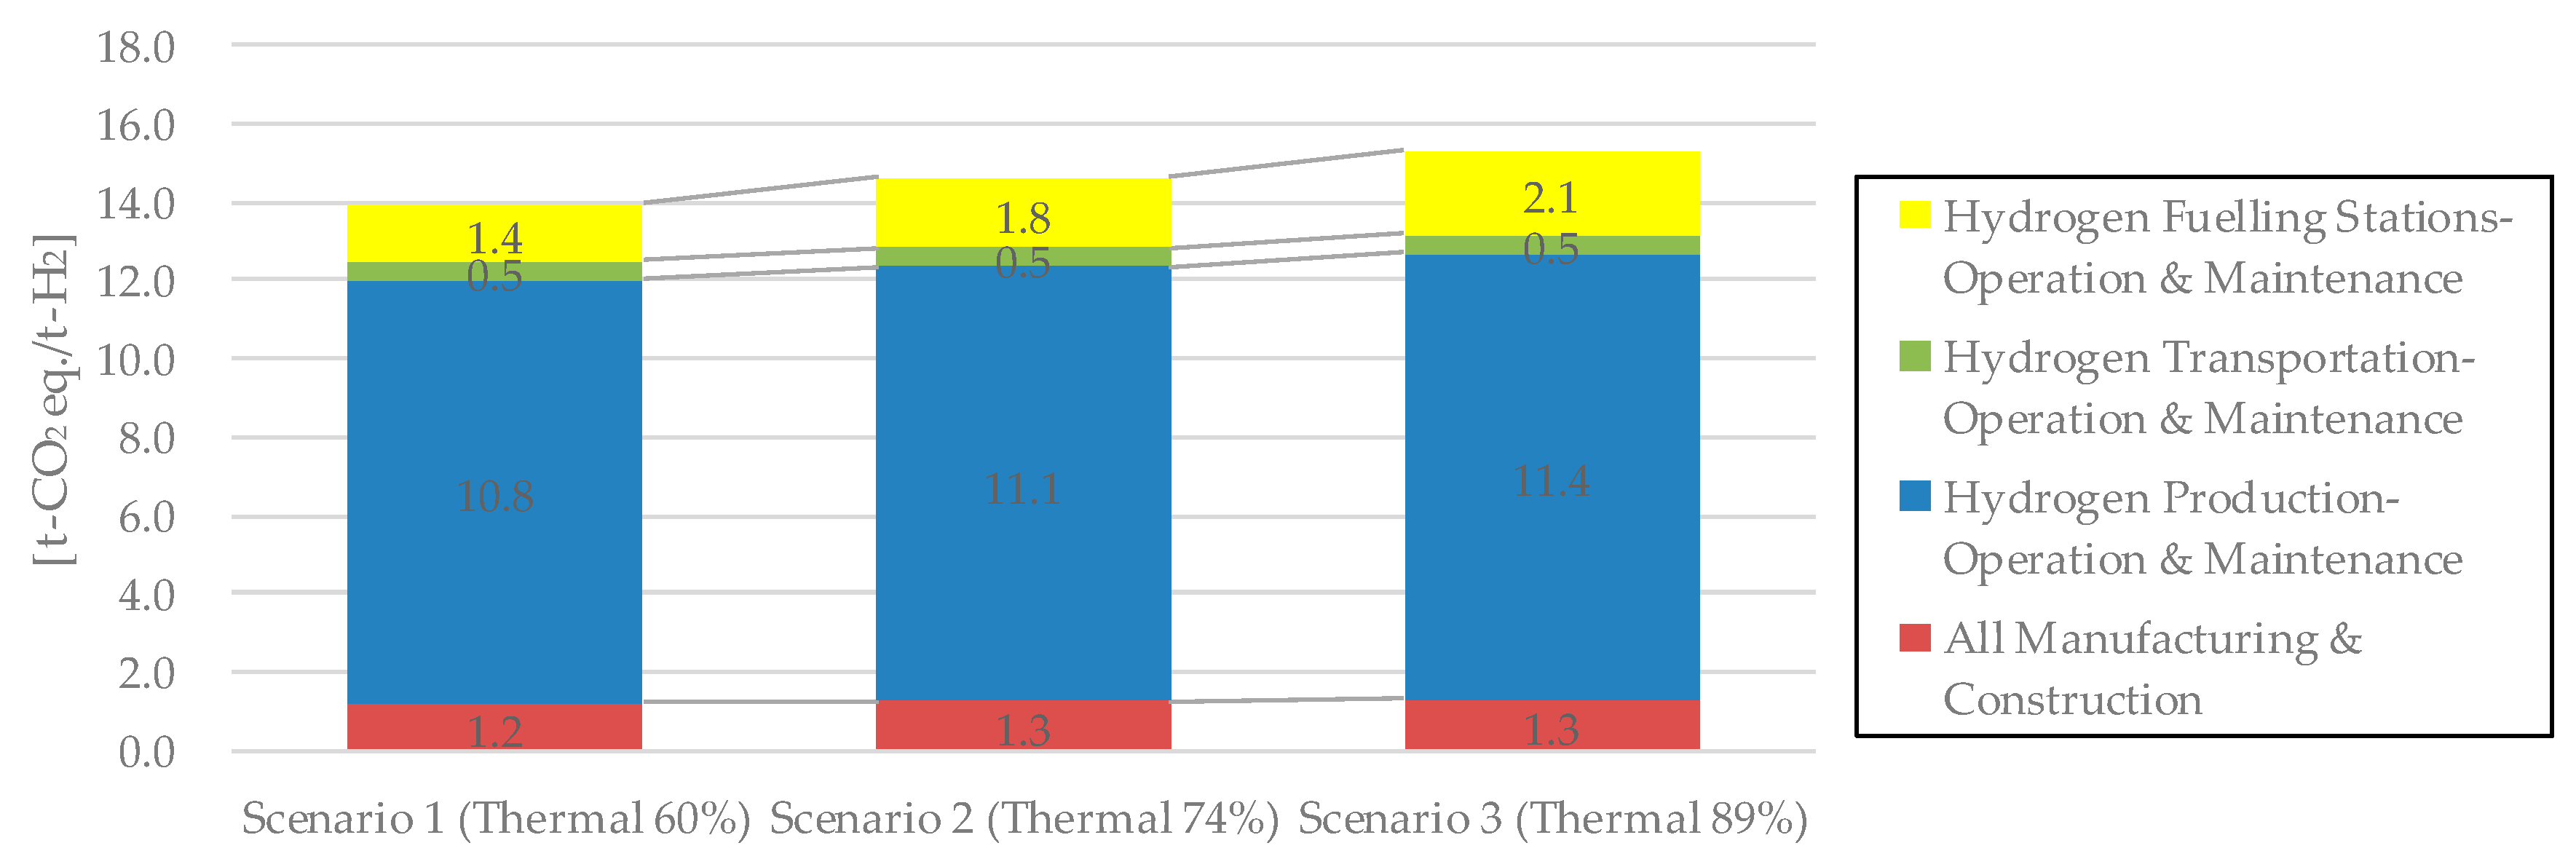
For grid mixes of scenarios 2 and 3, GHG emissions per ton of the hydrogen energy system were found to be 14.6 and 15.3 t-CO2 eq. (Table 4). The grid mix of 2015 would discharge about 10% more GHG emissions than that of 2005. In scenarios 2 and 3, GHG emissions for the thermal power generation sector increased by +24% and +48%, respectively. In particular, the amounts of electric power used for hydrogen production and for the hydrogen fueling station would be significant, regardless of the method of hydrogen production. On the other hand, production and employment had no major change in total in spite of the differences in the grid mixes.
Figure 4 shows the results of sensitivity analysis for each scenario. The stages of hydrogen production and hydrogen fueling station account for 90% of the total increase, reflecting the differences in grid mix between 2005 and 2015. It should be noted that the stage of hydrogen production included 8.6 t-CO2 eq. from naphtha reforming. Therefore, at the hydrogen production stage, the remaining 2.2, 2.5, 2.8 t-CO2 eq. influenced the increased in thermal power generation. At the hydrogen fueling station stage, there is a possibility of a ~50% increase in GHG emissions due to the change in grid mixes. This is most influenced by stage-by-stage analysis among the four life cycle stages. Finally, the remaining ~10% of the total increase reflect the manufacturing and construction stage, which is affected relatively less than the previous two stages.
4. Conclusions
In this study, we analyzed the environmental and socio-economic effects of the hydrogen energy system during its life cycle from hydrogen production by naphtha reforming to refilling fuel cell cars. Currently, field-specific assessments highlight valuable information, but do not holistically assess effects of hydrogen energy systems. However, input-output analysis conducted in this study enables assessment of a range of effects in an objective manner using economic indicators, and contributes to the identification of potential risks in related sectors. The following were clarified.
- Many of the socio-economic analyses of hydrogen energy systems are limited to direct cost calculations, which focus on manufacturing and construction stages. Our study reveals that the effect of production, employment, and GHG emissions during the operation and maintenance stages was also significant. Thus, this study highlights the contributions of different indicators change during the life cycle, confirming that a life cycle perspective using multiple indices is very important for hydrogen energy system analysis.
- The socio-economic effect due to the introduction of the hydrogen energy system is influenced by direct effects of hydrogen production, hydrogen transportation, and hydrogen station, along with indirect effects of raw materials, electrical power, equipment maintenance, and commerce. Specifically, indirect effects of the service sector such as equipment maintenance and commerce among others are highlighted by the input-output table.
- Most of the GHG emissions were discharged during hydrogen production indicating that low-carbon hydrogen production options such as renewable energy can significantly reduce emissions. Additionally, the amount of electricity required for compressor and pre-cooling devices is also significant, and similar active use of low-carbon power generation systems including renewable energy can contribute to a more decarbonized society. The results of the sensitivity analysis also indicate that life cycle of GHG emissions are influenced by changes in the grid mix. However, since low-carbon power generation technology generally tends to be expensive, it is necessary to analyze the trade-off between the expected-positive (GHG emission reduction) and the expected-negative (its cost, stable supply and security, etc.).
This research undertakes the first steps in life-cycle based environmental and socio-economic effect analysis using collected information, and contributes to comprehensive risk assessment of hydrogen energy systems in the future. We propose to develop the following in the future:
- In this study, data regarding hydrogen production using naphtha reforming and high-pressured transportation were employed. However, there are several types of production, including by-product hydrogen and water electrolysis using renewable energy among others. In addition, different types of hydrogen transport are employed for liquefied and organic hydride systems. Future research should address multiple production and transportation methods.
- The input-output table employed in this study assumed the setup to include three sectors: hydrogen production, hydrogen transportation, and hydrogen station. However, future studies should address other factors while accounting for the demand and supply of hydrogen energy.
- All hydrogen energy systems discussed in this research are expressed in terms of 2020 prices as hydrogen energy systems are currently in the initial stage of introduction. Therefore, it is necessary to investigate additional changes in the future, such as price changes and subsidies.
Acknowledgments
This work was supported by the Council for Science, Technology and Innovation (CSTI) through its cross-ministerial Strategic Innovation Promotion Program (SIP), “Energy Carrier” (funding agency: Japan Science and Technology Agency (JST).
Conflicts of Interest
The author declares no conflict of interest.
Appendix A

Table A1.
Details of final demand.
| Life Cycle Stage | Sector | Final Demand [Million-JPY] | |
|---|---|---|---|
| Manufacturing & Construction | Hydrogen Production | Other electrical devices and parts | 99 |
| Pumps and compressors | 146 | ||
| Other business services | 50 | ||
| Wholesale trade | 50 | ||
| Other civil engineering and construction | 30 | ||
| Other Sectors | 4 | ||
| Total | 380 | ||
| Hydrogen Transportation | Chemical machinery | 281 | |
| Trucks, buses, and other cars | 89 | ||
| Wholesale trade | 83 | ||
| Retail trade | 16 | ||
| Road freight transport | 5 | ||
| Other Sectors | 1 | ||
| Total | 476 | ||
| Hydrogen Fueling Station | Pumps and compressors | 729 | |
| Other civil engineering and construction | 549 | ||
| Other business services | 406 | ||
| Chemical machinery | 335 | ||
| Wholesale trade | 297 | ||
| Other Sectors | 305 | ||
| Total | 2619 | ||
| Operation & Maintenance | Hydrogen Production (Established New Sector) * | 2932 * | |
| Hydrogen Transportation (Established New Sector) * | 1597 * | ||
| Hydrogen Fueling Station (Established New Sector) * | 5677 * | ||
* Final demand of established new sector included depreciation.
Appendix B
Table A2.
Input ratio of new sectors.
| Life Cycle Stage | Sector | Ratio | |
|---|---|---|---|
| Operation & Maintenance | Hydrogen Production | Petroleum refinery products (Inc. greases) | 42.0% |
| Thermal power generation | 10.9% | ||
| Wholesale trade | 8.9% | ||
| Other business services | 5.1% | ||
| Other industrial sectors | 9.1% | ||
| Total added value * | 24.0% * | ||
| Total | 100.0% | ||
| Hydrogen Transportation | Machine repair | 11.9% | |
| Petroleum refinery products (Inc. greases) | 6.5% | ||
| Other business services | 2.9% | ||
| Non-life insurance | 1.8% | ||
| Other industrial sectors | 2.3% | ||
| Total added value * | 74.5% * | ||
| Total | 100.0% | ||
| Hydrogen Fueling Station | Thermal power generation | 7.4% | |
| Other business services | 5.6% | ||
| Hydro and geothermal power generation | 0.9% | ||
| Nuclear power generation | 0.1% | ||
| Other industrial sectors | 0.1% | ||
| Total added value * | 85.9% * | ||
| Total | 100.0% | ||
* “Total added value” was not included coefficient matrix ().
References
- Intergovernmental Panel on Climate Change (IPCC). Climate Change 2013, The Physical Science Basis. 2013. Available online: http://www.ipcc.ch/report/ar5/wg1/ (accessed on 2 August 2017).
- International Energy Agency (IEA). World Energy Outlook 2015, Executive Summary. 2015. Available online: http://www.worldenergyoutlook.org/weo2015/ (accessed on 13 February 2016).
- Ministry of Economy, Trade and Industry (METI). Strategic Energy Plan; Fiscal 2014. April 2014. Available online: http://www.enecho.meti.go.jp/en/category/others/basic_plan/pdf/4th_strategic_energy_plan.pdf (accessed on 2 August 2017).
- Cabinet Office, Government of Japan (CAO). Energy Innovation 2020; Hydrogen Energy System. 2014. Available online: http://www8.cao.go.jp/cstp/tyousakai/olyparatf/sassi/siryo5.pdf (accessed on 2 August 2017). (In Japanese).
- Elkington, J. Towards the Sustainable Corporation: Win-Win-Win Business Strategies for Sustainable Development. Calif. Manag. Rev. 1994, 36, 90–100. [Google Scholar] [CrossRef]
- Tokyo Metropolitan Government Bureau of Environment (Tokyo Metropolitan). Tokyo Strategy Meeting Summarized toward the Realization of a Hydrogen Society; Fiscal 2015. 2014. Available online: https://www.kankyo.metro.tokyo.jp/energy/tochi_energy_suishin/attachement/26torimatome.pdf (accessed on 7 January 2016). (In Japanese).
- International Organization for Standardization (ISO). ISO Guide 73:2009: Risk Management—Vocabulary. 2009. Available online: https://www.iso.org/obp/ui/#iso:std:44651:en (accessed on 2 August 2017).
- Branscomb, L.M. Sustainable cities: Safety and security. Technol. Soc. 2006, 28, 225–234. [Google Scholar] [CrossRef]
- US Office of Homeland Security. The National Strategy for Homeland Security. 16 July 2002. Available online: https://www.dhs.gov/sites/default/files/publications/nat-strat-hls-2002.pdf (accessed on 2 August 2017).
- Shi, Q.; Liu, Y.; Zuo, J.; Pan, N.; Ma, G. On the management of social risks of hydraulic infrastructure projects in China: A case study. Int. J. Proj. Manag. 2015, 33, 483–496. [Google Scholar] [CrossRef]
- McLellan, B.; Zhang, Q.; Farzaneh, H.; Utama, N.A.; Ishihara, K.N. Resilience, sustainability and risk management: A focus on energy. Challenges 2012, 3, 153–182. [Google Scholar] [CrossRef]
- Kinehara, Y.; Noguchi, K.; Inoue, R.; Takahashi, H.; Shibuya, Y.; Nagano, M. New Treatise on How to Enrich Our Country. 2008. Available online: http://www.mri.co.jp/NEWS/magazine/journal/47/__icsFiles/afieldfile/2008/10/21/jm06111504.pdf (accessed on 2 August 2017). (In Japanese with English Summary).
- Noguchi, K. Seeking the Form of a New Country (1); Looking to the Questionnaire Survey “New Treatise on How to Enrich Our Country”; What Is the Richness of Japanese People Think. 2011. Available online: http://diamond.jp/articles/-/13390 (accessed on 2 August 2017). (In Japanese).
- Sakamoto, J.; Nakayama, J.; Nakarai, T.; Kasai, N.; Shibutani, T.; Miyake, A. Effect of gasoline pool fire on liquid hydrogen storage tank in hybrid hydrogen–gasoline fueling station. Int. J. Hydrogen Energy 2016, 41, 2096–2104. [Google Scholar] [CrossRef]
- Nakayama, J.; Sakamoto, J.; Kasai, N.; Shibutani, T.; Miyake, A. Preliminary hazard identification for qualitative risk assessment on a hybrid gasoline-hydrogen fueling station with an on-site hydrogen production system using organic chemical hydride. Int. J. Hydrogen Energy 2016, 41, 7518–7525. [Google Scholar] [CrossRef]
- Okada, Y. Safety of hydrogen storage and transportation system by organic chemical hydride method. J. Hydrogen Energy Syst. Soc. Jpn. 2010, 35, 19–24, (In Japanese with English Abstract). [Google Scholar]
- Ono, K.; Tsunemi, K. Identification of public acceptance factors with risk perception scales on hydrogen fueling stations in Japan. Int. J. Hydrogen Energy 2017, 42, 10697–10707. [Google Scholar] [CrossRef]
- Itoh, T. Hydrogen Supply Case Studies and Economic Evaluation. 2003. Available online: http://www.pecj.or.jp/japanese/report/reserch/report-pdf/H15_2003/03cho3-3.pdf (accessed on 2 August 2017). (In Japanese).
- Kanoh, T. Current Status of Producing Hydrogen as By-Product and Technology for Utilization. Best Value, 20 Theme 7. 2008. Available online: http://www.vmi.co.jp/info/bestvalue/pdf/bv20/bv20_07.pdf (accessed on 10 March 2016). (In Japanese).
- Nakamura, T.; Iwabuchi, H.; Murata, K.; Sakata, K. Supply Cost and Technology Issues of Hydrogen for Fuel Cell Vehicles. J. Hydrogen Energy Syst. Soc. Jpn. 2008, 33, 27–34, (In Japanese with English abstract). [Google Scholar]
- Kokubun, Y. Cost and energy efficiency in transportation of high pressure hydrogen. J. Hydrogen Energy Syst. Soc. Jpn. 2009, 34, 24–30, (In Japanese with English abstract). [Google Scholar]
- Matsuo, Y.; Hirai, H.; Uno, J.; Nagatomi, Y. Hydrogen Energy as Automotive Fuel. 2010. Available online: https://eneken.ieej.or.jp/data/3098.pdf (accessed on 2 August 2017). (In Japanese with English Abstract).
- Japan Hydrogen & Fuel Cell Demonstration Project (JHFC). Fuel Cell System Empirical Research Report (Phase 2 JHFC Project); Fiscal 2011. 2011. Available online: http://www.jari.or.jp/Portals/0/jhfc/data/report/pdf/tuuki_phase2_01.pdf (accessed on 2 August 2017). (In Japanese).
- Yamashita, Y.; Yoshino, Y.; Yoshimura, K.; Shindo, K.; Harada, E. Feasibility study on the hydrogen energy supply chain for low carbon society. J. Jpn. Soc. Energy Resour. 2014, 35, 11–19, (In Japanese with English Abstract). [Google Scholar]
- Hondo, H.; Moriizumi, Y.; Usui, T. Life Cycle Environmental Analysis of Hydrogen Storage Technology Using Organic Hydride: Energy Requirement and CO2 Emission. J. Jpn. Inst. Energy 2008, 87, 753–762, (In Japanese with English Abstract). [Google Scholar]
- Usui, T.; Hondo, H. Life Cycle CO2 Emission Analysis of Hydrogen Storage and Battery for Wind Power Generation. J. Jpn. Inst. Energy 2010, 89, 551–561, (In Japanese with English Abstract). [Google Scholar] [CrossRef]
- Japan Automobile Research Institute (JARI). Overall Efficiency and Analysis of GHG Emissions. 2011. Available online: http://www.jari.or.jp/Portals/0/jhfc/data/report/2010/pdf/result.pdf (accessed on 2 August 2017). (In Japanese).
- Toyota Motor Corporation. The MIRAI LCA Report for Communication. 2015. Available online: https://www.toyota.co.jp/jpn/sustainability/environment/low_carbon/lca_and_eco_actions/pdf/life_cycle_assessment_report.pdf (accessed on 2 August 2017). (In Japanese).
- Mizuho Information & Research Institute, Inc. Evaluation Report on Greenhouse Gas Emissions of Hydrogen Considering Life Cycle (Overview Version). 2016. Available online: https://www.mizuho-ir.co.jp/publication/report/2016/pdf/wttghg1612.pdf (accessed on 2 August 2017). (In Japanese).
- Lambert, R.J.; Silva, P.P. The challenges of determining the employment effects of renewable energy. Renew. Sustain. Energy Rev. 2012, 16, 4667–4674. [Google Scholar] [CrossRef]
- Lehr, U.; Nitsch, J.; Kratzat, M.; Lutz, C.; Edler, D. Renewable energy and employment in Germany. Energy Policy 2008, 36, 108–117. [Google Scholar] [CrossRef]
- Markaki, M.; Belegri-Roboli, A.; Michaelides, P.; Mirasgedis, S.; Lalas, D.P. The impact of clean energy investments on the Greek economy: An input–output analysis (2010–2020). Energy Policy 2013, 57, 263–275. [Google Scholar] [CrossRef]
- Matsumoto, N.; Hondo, H. Analysis on Employment Effects of the Introduction of Renewable Energy Technologies Using an Extended Input-output Table. J. Jpn. Inst. Energy 2011, 90, 258–267, (In Japanese with English Abstract). [Google Scholar] [CrossRef]
- Hienuki, S.; Kudoh, Y.; Hondo, H. Life cycle employment effect of geothermal power generation using an extended input–output model: The case of Japan. J. Clean. Prod. 2015, 93, 203–212. [Google Scholar] [CrossRef]
- Hienuki, S.; Kudoh, Y.; Hondo, H. Establishing a Framework for Evaluating Environmental and Socio-Economic Impacts by Power Generation Technology Using an Input–output Table—A Case Study of Japanese Future Electricity Grid Mix. Sustainability 2015, 7, 15794–15811. [Google Scholar] [CrossRef]
- Moriizumi, Y.; Hondo, H.; Nakano, S. Development and Application of Renewable Energy-Focused Input-Output Table. J. Jpn. Inst. Energy 2015, 94, 1397–1413, (In Japanese with English Abstract). [Google Scholar] [CrossRef]
- Lee, D.H.; Lee, D.J.; Chiu, L.H. Biohydrogen development in United States and in China: An input–output model study. Int. J. Hydrogen Energy 2011, 36, 14238–14244. [Google Scholar] [CrossRef]
- Chun, D.; Woo, C.; Seo, H.; Chung, Y.; Hong, S.; Kim, J. The role of hydrogen energy development in the Korean economy: An input-output analysis. Int. J. Hydrogen Energy 2014, 39, 7627–7633. [Google Scholar] [CrossRef]
- Ministry of Internal Affairs and Communications (MIAC). Input-Output Tables. 2015. Available online: http://www.e-stat.go.jp/SG1/estat/ListE.do?bid=000001060671&cycode=0 (accessed on 1 March 2016).
- Ministry of Internal Affairs and Communications (MIAC). Input-Output Tables. 2009. Available online: http://www.soumu.go.jp/english/dgpp_ss/data/io/io05.htm (accessed on 1 March 2016).
- Center for Global Environmental Research, National Institute for Environmental Studies (CGER). Embodied Energy and Emission Intensity Data for Japan Using Input–Output Tables (3EID): For 2005 IO Table. 2013. Available online: http://www.cger.nies.go.jp/publications/report/d031/index.html (accessed on 4 May 2014).
- Ministry of Economy, Trade and Industry (METI). For Hydrogen and Fuel Cell; Fiscal 2013. 2013. Available online: http://www.enecho.meti.go.jp/committee/council/basic_policy_subcommittee/008/pdf/008_008.pdf (accessed on 2 August 2017). (In Japanese)
- JX Nippon Oil & Energy Corporation (JX). Changes in Crude Oil Processing Capacity/Throughput/Capacity Utilization. 2014. Available online: http://www.noe.jx-group.co.jp/binran/data/pdf/40.pdf (accessed on 20 February 2016). (In Japanese).
- World Bank. Official Exchange Rate (LCU per US$, Period Average). Available online: http://data.worldbank.org/indicator/PA.NUS.FCRF?page=1 (accessed on 20 February 2016).
- Fuji Keizai Co., Ltd. (Fuji). Future Prospects of Hydrogen Fuel-Related Markets (Fiscal 2017 Edition). 2017. Available online: https://www.fuji-keizai.co.jp/report/index/141609842.html (accessed on 2 August 2017). (In Japanese).
- Ministry of the Environment (MoE). Calculation Methods and Emission Coefficients List in Accounting and Reporting System. 2015. Available online: http://ghg-santeikohyo.env.go.jp/files/calc/itiran.pdf (accessed on 19 January 2015). (In Japanese)
- The Federation of Electric Power Companies of Japan. Power Statistics Information. 2017. Available online: http://www.fepc.or.jp/library/data/tokei/index.html (accessed on 19 June 2017). (In Japanese).
Figure 1.
System boundary.

Figure 2.
Life cycle embodied intensity.

Figure 3.
Hydrogen production—sectoral effects.
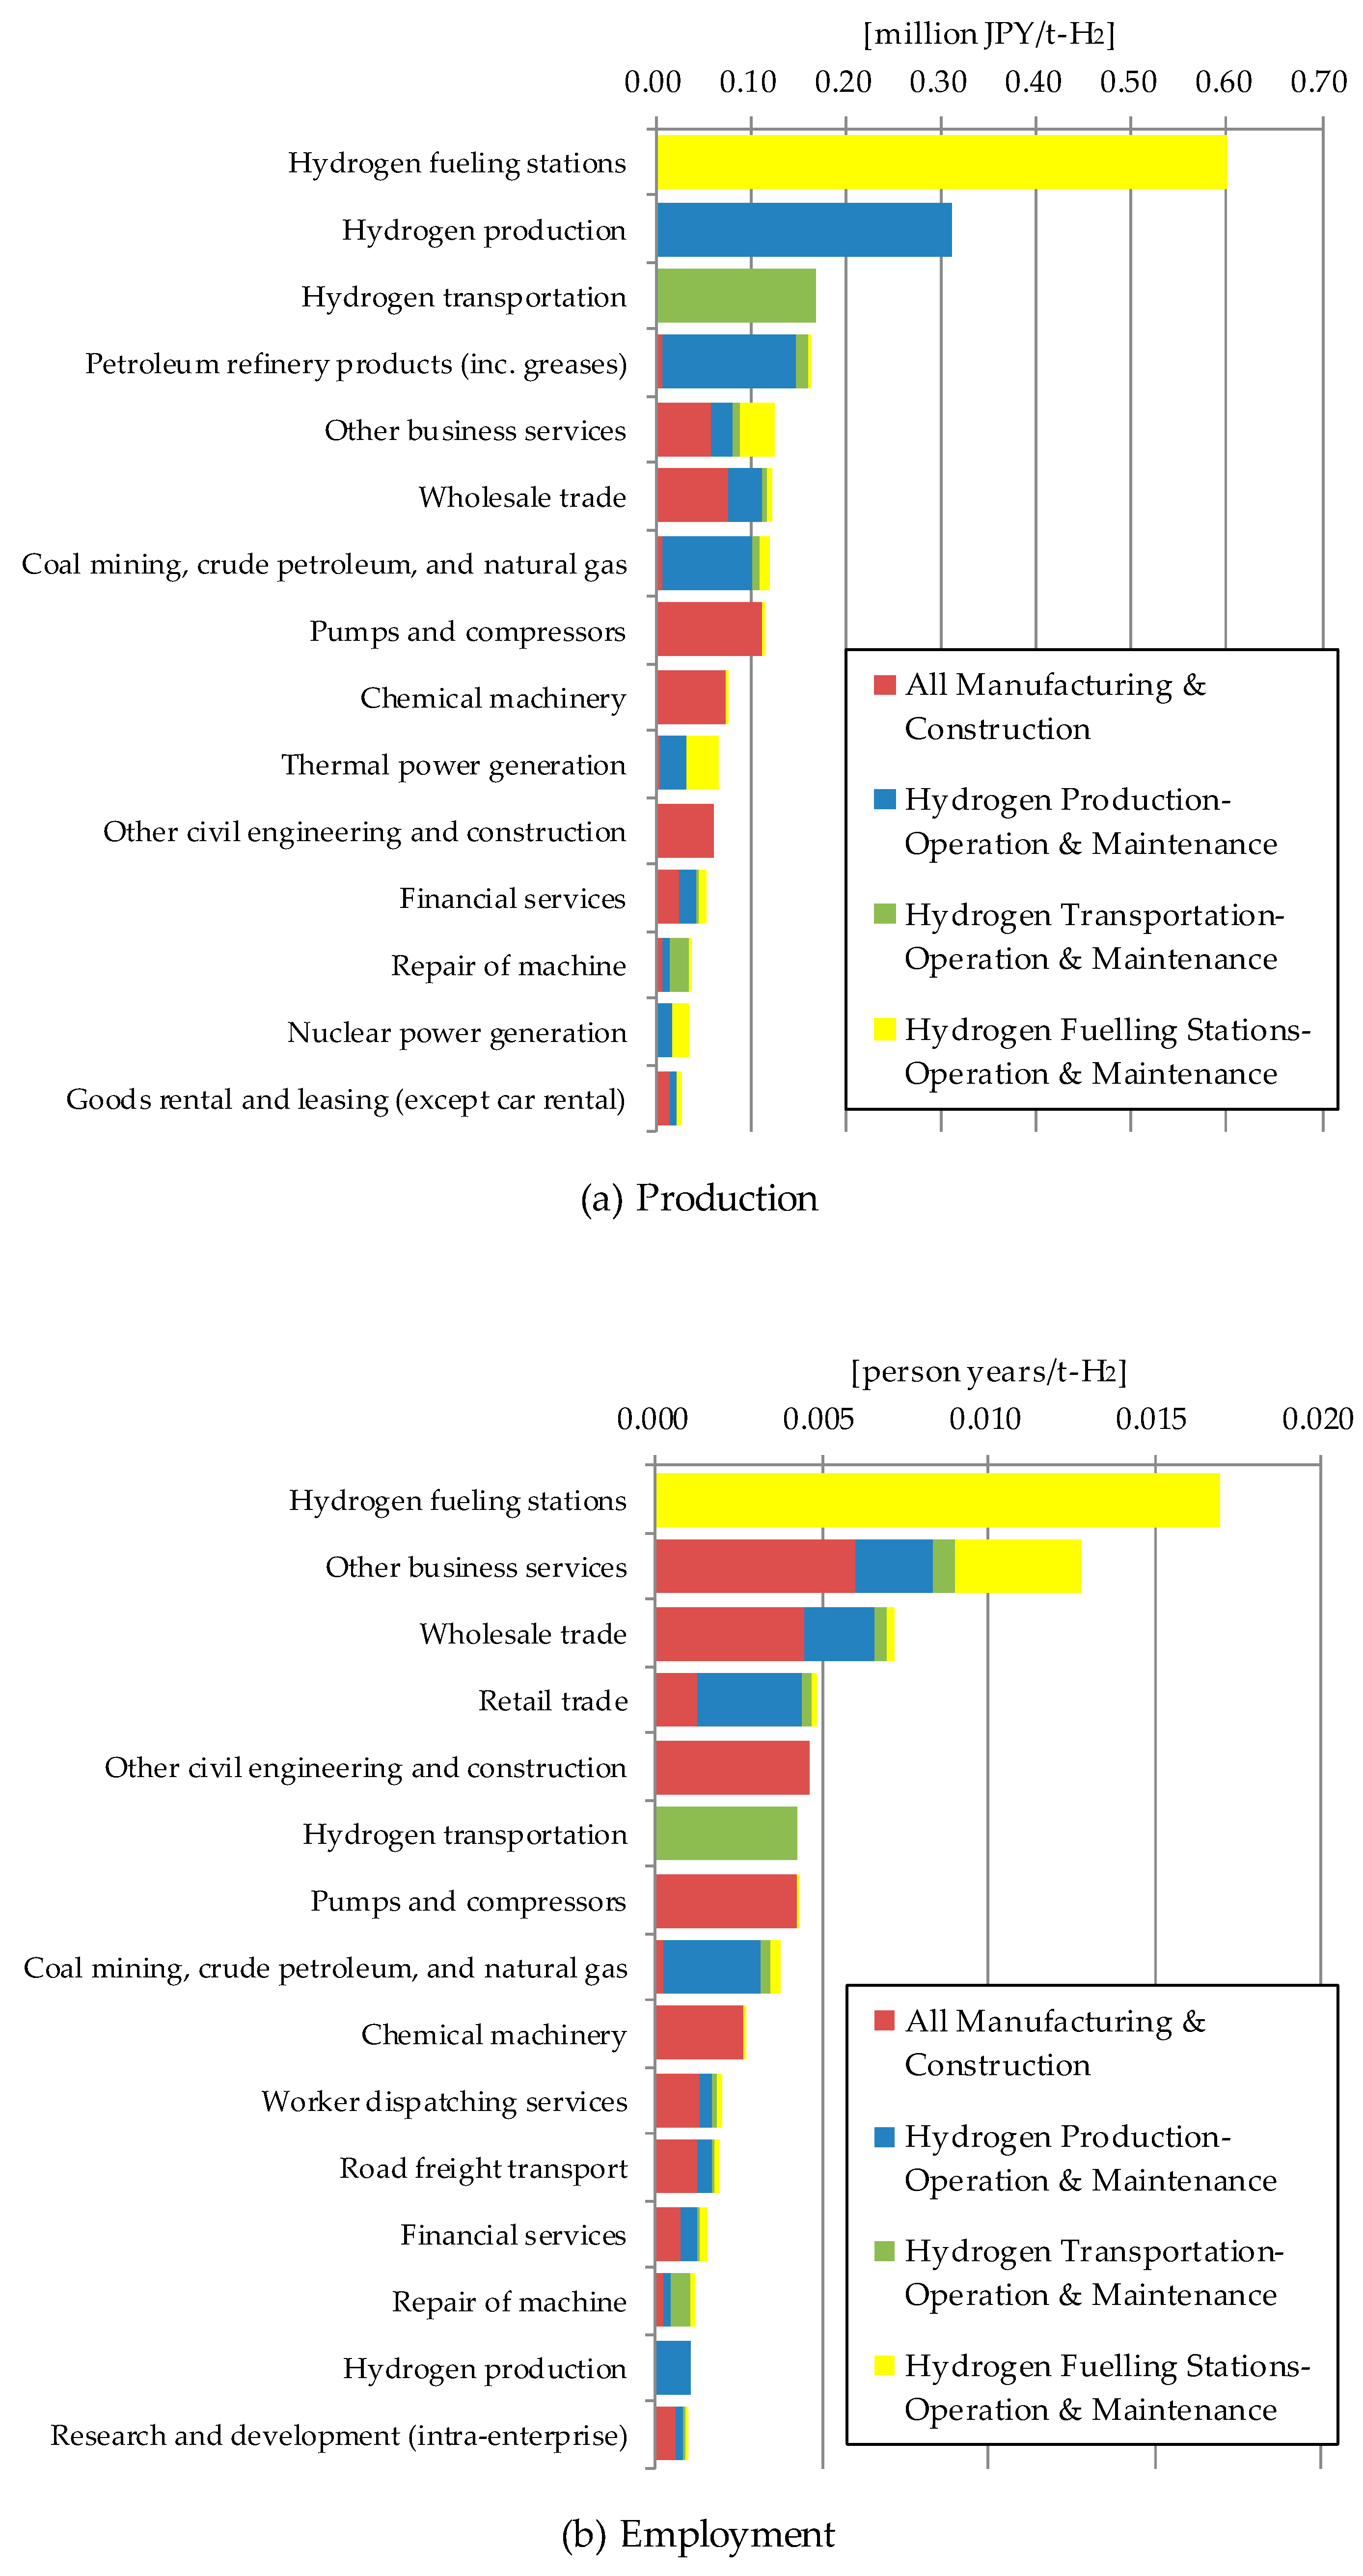
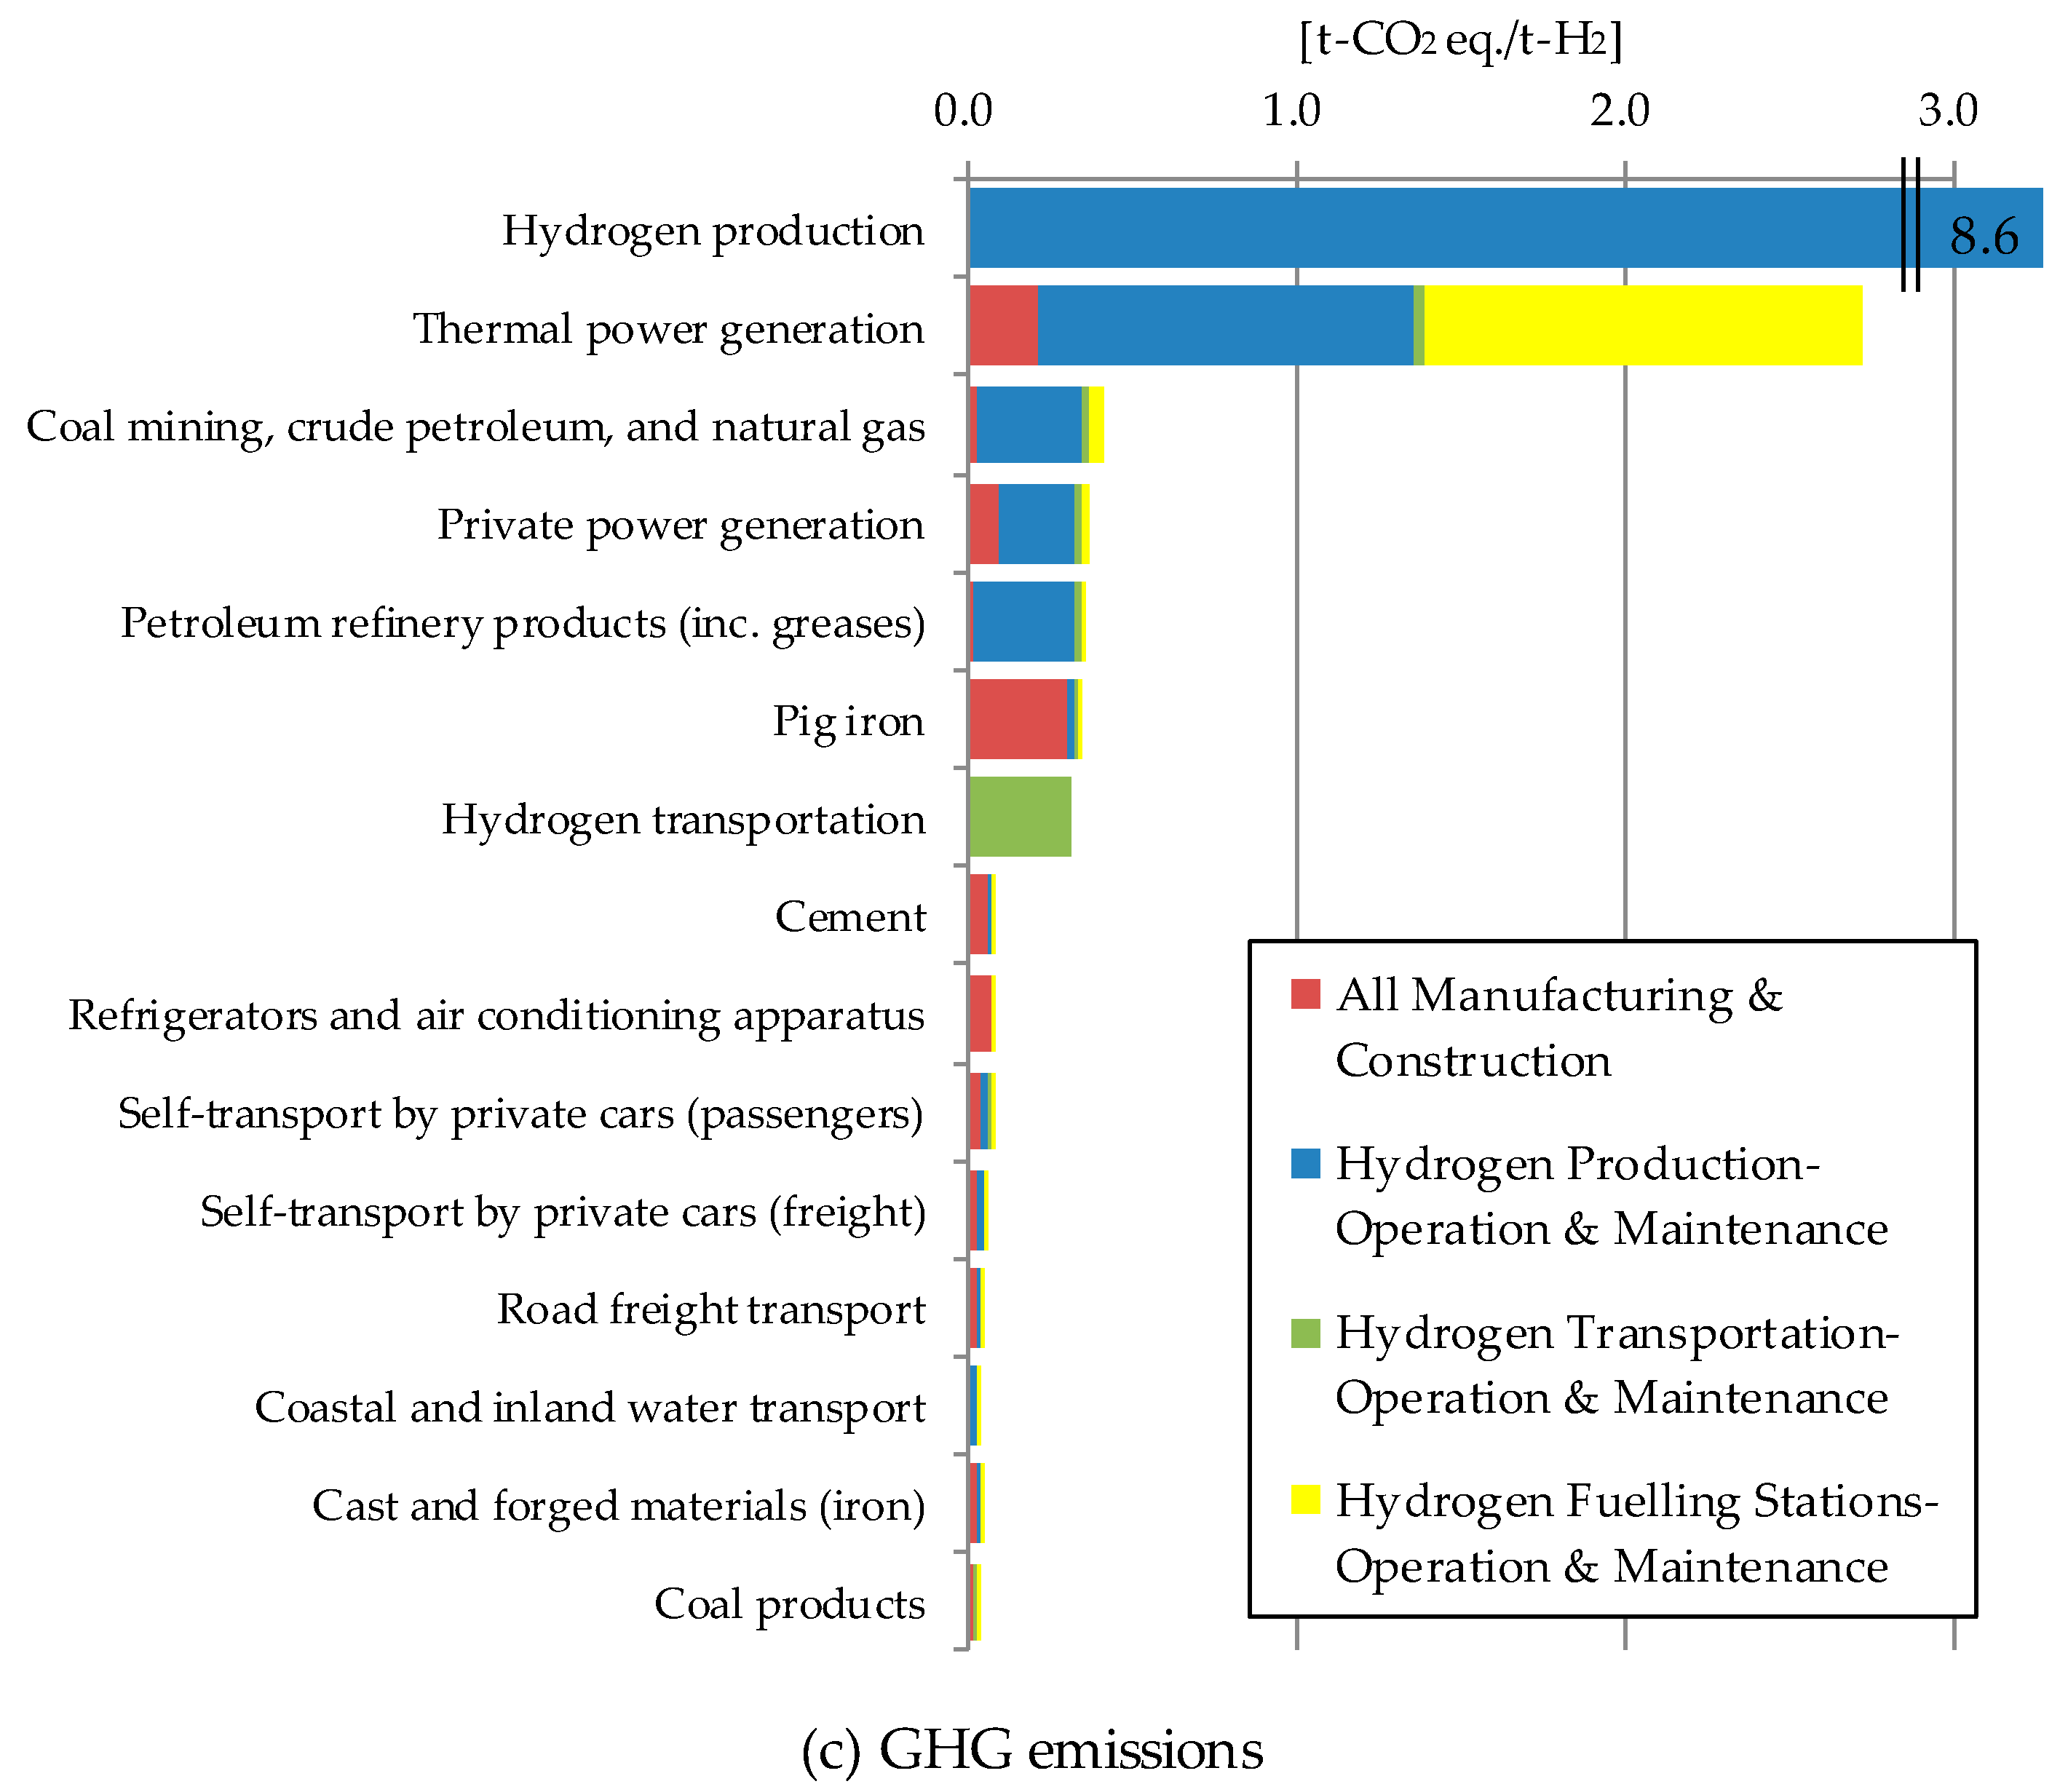
Figure 4.
Sensitivity analysis of GHG emissions in each life cycle stage.

Table 1.
Preconditions of the hydrogen energy system.
| Activity | Amount/Rate | Unit | Reference | ||
|---|---|---|---|---|---|
| Hydrogen Production | Supply capacity | 1500 | Nm3/h | [23] | |
| Business hours | 24 | h | |||
| Utilization rate | 0.8 | - | [43] | ||
| Lifetime | 10 | years | [23] | ||
| Employment | 1 | person-years | |||
| Hydrogen Transportation | Trailer | Number for detainment | 8 | unit | [23] |
| Number for transportation | 2 | unit | |||
| Number for filling | 2 | unit | |||
| Lifetime | 10 | years | |||
| Tractor | Number | 2 | cars | ||
| Lifetime | 5 | years | |||
| Diesel oil consumption | 50 | l/time/car | |||
| Transport frequency | 4 | time/car | |||
| Running number | 2 | car/day | |||
| Transport distance (round trip) | 100 | km/time | |||
| Utilization rate | 0.8 | - | * | ||
| Employment | 4 | person-years | [23] | ||
| Hydrogen Fueling Station | Type | Off-site | [23] | ||
| Supply capacity | 300 | Nm3/h | |||
| Business hours | 15 | h/day | * | ||
| Number | 8 | places | [23] | ||
| Lifetime | 10 | years | |||
| Utilization rate | 0.8 | - | * | ||
| Employment (8 stations total) | 16 | person-years | [23] | ||
* Estimated by the authors.
Table 2.
Assumed cost data during 10 years.
| Activity | Life Cycle Stage | Goods and Services | Cost [Million-JPY] | References |
|---|---|---|---|---|
| Hydrogen Production | Manufacturing & Construction | PSA (Pressure Swing Adsorption) | 70 | [23] |
| Hydrogen compressor | 101 | |||
| Suction drum | 4 | |||
| Off-gas compressor | 11 | |||
| Piping, installation, instrumentation, electrical equipment | 113 | |||
| Civil engineering and construction | 30 | |||
| Engineering | 51 | |||
| Operation & Maintenance | Naphtha (raw material) | 1616 | ||
| Naphtha (fuel) | 54 | |||
| Power | 361 | |||
| Clean water | 22 | |||
| Personnel expenses | 70 | |||
| Repair costs | 114 | |||
| Insurance fee | 23 | |||
| Property tax | 53 | |||
| Overhead | 38 | |||
| Value added except for depreciation cost | 200 | [23,39] | ||
| Total | 2932 | - | ||
| Hydrogen Transportation | Manufacturing & Construction | Hydrogen trailer (45 MPa) | 336 | [23] |
| Undercarriage | 96 | |||
| Tractor | 44 | |||
| Operation & Maintenance | Maintenance | 190 | ||
| Insurance fee | 29 | |||
| Property tax | 67 | |||
| Overhead | 48 | |||
| Fuel cost | 140 | |||
| Personnel expenses | 280 | |||
| Value added for depreciation cost | 200 | [23,39] | ||
| Total | 1597 | - | ||
| Hydrogen Fueling Stations | Manufacturing & Construction | Accumulator (high and low pressure) | 210 | [45] |
| Compressor (filling) | 720 | |||
| Hydrogen dispenser | 400 | |||
| Pre-cooler equipment | 240 | |||
| Hydrogen valve | 63 | |||
| Hydrogen sensor | 26 | |||
| Engineering | 411 | |||
| Civil engineering and construction | 549 | |||
| Operation & Maintenance | Maintenance | 324 | ||
| Power | 476 | [23] | ||
| Personnel expenses | 1600 | [45] | ||
| Value added for depreciation cost | 200 | [23,39] | ||
| Total | 5677 | - | ||
Table 3.
Methods of establishment of new sectors.
| Sector | Input Coefficients-Column- | Output Coefficients-Row- | Employment Coefficients | GHG Emissions Coefficient |
|---|---|---|---|---|
| Hydrogen Production | Publication information [23,43,45] | Zero vector | Publication information [23,43,45] | Publication information [23,46] |
| Hydrogen Transportation | ||||
| Hydrogen Fueling Station | ||||
| Nuclear Power Generation | Basic table of original input-output table in 2005 [40] | Disaggregation of grid mix in 2005 or any year [47] | Employment table of original IO in 2005 [40] Number of employees of each type of power generation in 2005 [47] | 3EID (Embodied Energy and Emission Intensity Data for Japan) [41] |
| Thermal Power Generation | ||||
| Hydro and Geothermal Power Generation |
Table 4.
Preconditions and results of sensitivity analysis.
| Grid Mix | Production [Million-Yen/t-H2] | Employment [Person-Years/t-H2] | GHG Emissions [t-CO2 eq./t-H2] | ||
|---|---|---|---|---|---|
| 2005 (Scenario 1) | Nuclear | 31% | 2.64 (Base) | 0.09 (Base) | 13.9 (Base) |
| Thermal | 60% | ||||
| Hydro & Geothermal | 9% | ||||
| Mean of 2000 and 2015 (Scenario 2) | Nuclear | 16% | 2.65 (+0.4%) | 0.09 (+0.4%) | 14.6 (+4.9%) |
| Thermal | 74% | ||||
| Hydro & Geothermal | 9% | ||||
| 2015 (Scenario 3) | Nuclear | 1% | 2.67 (+0.8%) | 0.09 (+0.8%) | 15.3 (+9.9%) |
| Thermal | 89% | ||||
| Hydro & Geothermal | 10% | ||||
© 2017 by the author. Licensee MDPI, Basel, Switzerland. This article is an open access article distributed under the terms and conditions of the Creative Commons Attribution (CC BY) license (http://creativecommons.org/licenses/by/4.0/).
Share and Cite
MDPI and ACS Style
Hienuki, S. Environmental and Socio-Economic Analysis of Naphtha Reforming Hydrogen Energy Using Input-Output Tables: A Case Study from Japan. Sustainability 2017, 9, 1376. https://doi.org/10.3390/su9081376
AMA Style
Hienuki S. Environmental and Socio-Economic Analysis of Naphtha Reforming Hydrogen Energy Using Input-Output Tables: A Case Study from Japan. Sustainability. 2017; 9(8):1376. https://doi.org/10.3390/su9081376
Chicago/Turabian StyleHienuki, Shunichi. 2017. "Environmental and Socio-Economic Analysis of Naphtha Reforming Hydrogen Energy Using Input-Output Tables: A Case Study from Japan" Sustainability 9, no. 8: 1376. https://doi.org/10.3390/su9081376
Note that from the first issue of 2016, this journal uses article numbers instead of page numbers. See further details here.