Vulnerability of Fishing Communities from Sea-Level Change: A Study of Laemsing District in Chanthaburi Province, Thailand


1
Climate Change and Sustainable Development Program, School of Environment, Resources and Development, Asian Institute of Technology, PO Box 4, Klong Luang, Pathumthani 12120, Thailand
2
Regional and Rural Development Planning Program, School of Environment, Resources and Development, Asian Institute of Technology, PO Box 4, Klong Luang, Pathumthani 12120, Thailand
*
Author to whom correspondence should be addressed.
Sustainability 2017, 9(8), 1388; https://doi.org/10.3390/su9081388
Submission received: 1 July 2017
/
Revised: 26 July 2017
/
Accepted: 3 August 2017
/
Published: 7 August 2017
Abstract
:Continuous increases in global mean sea level is affecting coastal communities worldwide. In Thailand, the rising sea level exacerbates the vulnerability of coastal communities to changes in geographic conditions seriously affecting communities with low adaptive capacity and mostly dependent on natural resources. This paper identifies the potential vulnerability of coastal fishing communities which are prone to severe sea-level rises, like in the case of Laemsing District in Chanthaburi Province, Thailand. Climate simulation, Geographic Information System (GIS) and remote sensing techniques were applied to quantify potential sea-level change (exposure), inundated areas and affected households (sensitivity). Adaptive capacity was analyzed in terms of social, human, institutional, economic, and natural conditions. Based on A1F1 (the worst case of future greenhouse gas emissions) and the Goddard Institute for Space Studies model EH (GISS-EH) best estimate for 2050, relative sea-level increase from 2000 would be 0.50 m, resulting in a loss of about 87.77 km2 of land and inundation of 2060 households. Opinions on alleviating vulnerability suggested that each condition of vulnerability is associated with two stages of development, urgent and medium. Laemsing District can face the serious effects of seawater inundation in the future. The results of this paper could be appropriately used as a reference for mainstreaming climate change adaptation into development policies and raising the awareness of stakeholders on how to cope with sea-level change and its impacts.
1. Introduction
Climate change has resulted in increasing land and sea surface temperatures, widespread reduction of snow and ice, and sea-level rises [1], creating adverse impacts on the coastal systems [2] all over the globe in the recent decades which are risky in the future, especially in the tropical zone and the Arctic [3]. Likewise, the coastal zones are being confronted with various stresses, such as land use change, pollution, and tourism among others. Meanwhile, the global mean sea level (GMSL) had increased continuously from 1.80 to 2 mm/year in 1961–2003 and 1971–2010, respectively, brought about by ocean thermal expansion, and glacier and ice sheet melting [1,4]. Sea-level rise which leads to coastal erosion, seawater intrusion, and floods [5,6,7] threatens coastal communities by exacerbating the impacts on their socio-economic and environmental dimensions. These, for instance, impact on the physical environments, fish stocks, ecosystems, coastal infrastructures, as well as on marine and inland fishing operations [8,9], and coastal aquaculture, especially in coastal zones of developing countries and small islands [10].
The aforementioned consequences of rising sea levels have caused serious vulnerability of coastal countries in Southeast Asia [11], particularly in the rural coastal zones. The majority of people in the coastal zones depend on natural resources for their livelihoods and are characterized by their low adaptive capacity [5], especially people in fishery-related communities [12]. Coastal zones in the seaside of Thailand—those along the Andaman Sea and Gulf of Thailand, have experienced gradual increases of sea level at the rate of 3–6 mm per year from 1981 to 2006 [13]. Moreover, such areas are also confronted with shoreline retreat and tidal flooding, for instance in the Gulf of Thailand, eastward coastal areas of Chao Phraya river mouth have continuously faced erosion problems mostly attributed to sea-level rise [14]. Rising sea levels in Thailand have been predicted to become the worst, especially in the Gulf of Thailand, in all its three regions, the inner part, eastern coast and southern coast which could experience a high sea-level rise in the future [15].
Laemsing District in Chanthaburi Province—a coastal district settled in the eastern coast of the Gulf of Thailand—had experienced the occurrence of rising sea levels by 10.50 mm/year during 1993–2004 [16]. From a preliminary field survey in 2014, the District has also been facing temporary flooding during high tide that resulted in damages of coastal infrastructures, aquaculture facilities, and residences of the District’s population. Likewise, [17] indicated that sea levels will rise by up to 0.63 m in 2100 and cause the subsidence of mangrove forests along the shoreline of Laemsing District by 2050. Residents in Laemsing District who get involved with some forms of coastal fishing activities are among the poorest of the country [18]. This condition can aggravate the vulnerability of this District to sea-level rise that would have severe impacts on coastal fishing communities in the future.
Vulnerability assessment of such communities—at local levels—has therefore become imperative [9,19,20] to compile plausible information related to the nexus of future climate change and its impacts on livelihoods of people and to come up with adaptation responses. The case study on impact assessment as a bottom-up approach is a suitable guideline to make insights on the vulnerability of coastal people to climate change and its impacts, especially at the local level. Moreover, the approach can also help researchers in providing effective and realistic responses for ameliorating the current and potential vulnerability [21]. This would enable policy makers as well as the local people to cope with the effects of inundation due to sea-level rise. However, rising sea levels as a creeping process is possibly not evident and thus addressing such a concern might not have been mainstreamed in the plans of relevant government agencies. Therefore, this paper is intended to focus on the impacts of sea-level change and elucidate the vulnerability situation on the social-environmental systems in Laemsing District, Thailand through three objectives: (1) projection of potential sea-level change; (2) identification of physical and population effects attributed to the threats of seawater inundation; and (3) assessment of differential levels of livelihood vulnerability of coastal fishing communities.
2. The Study Area
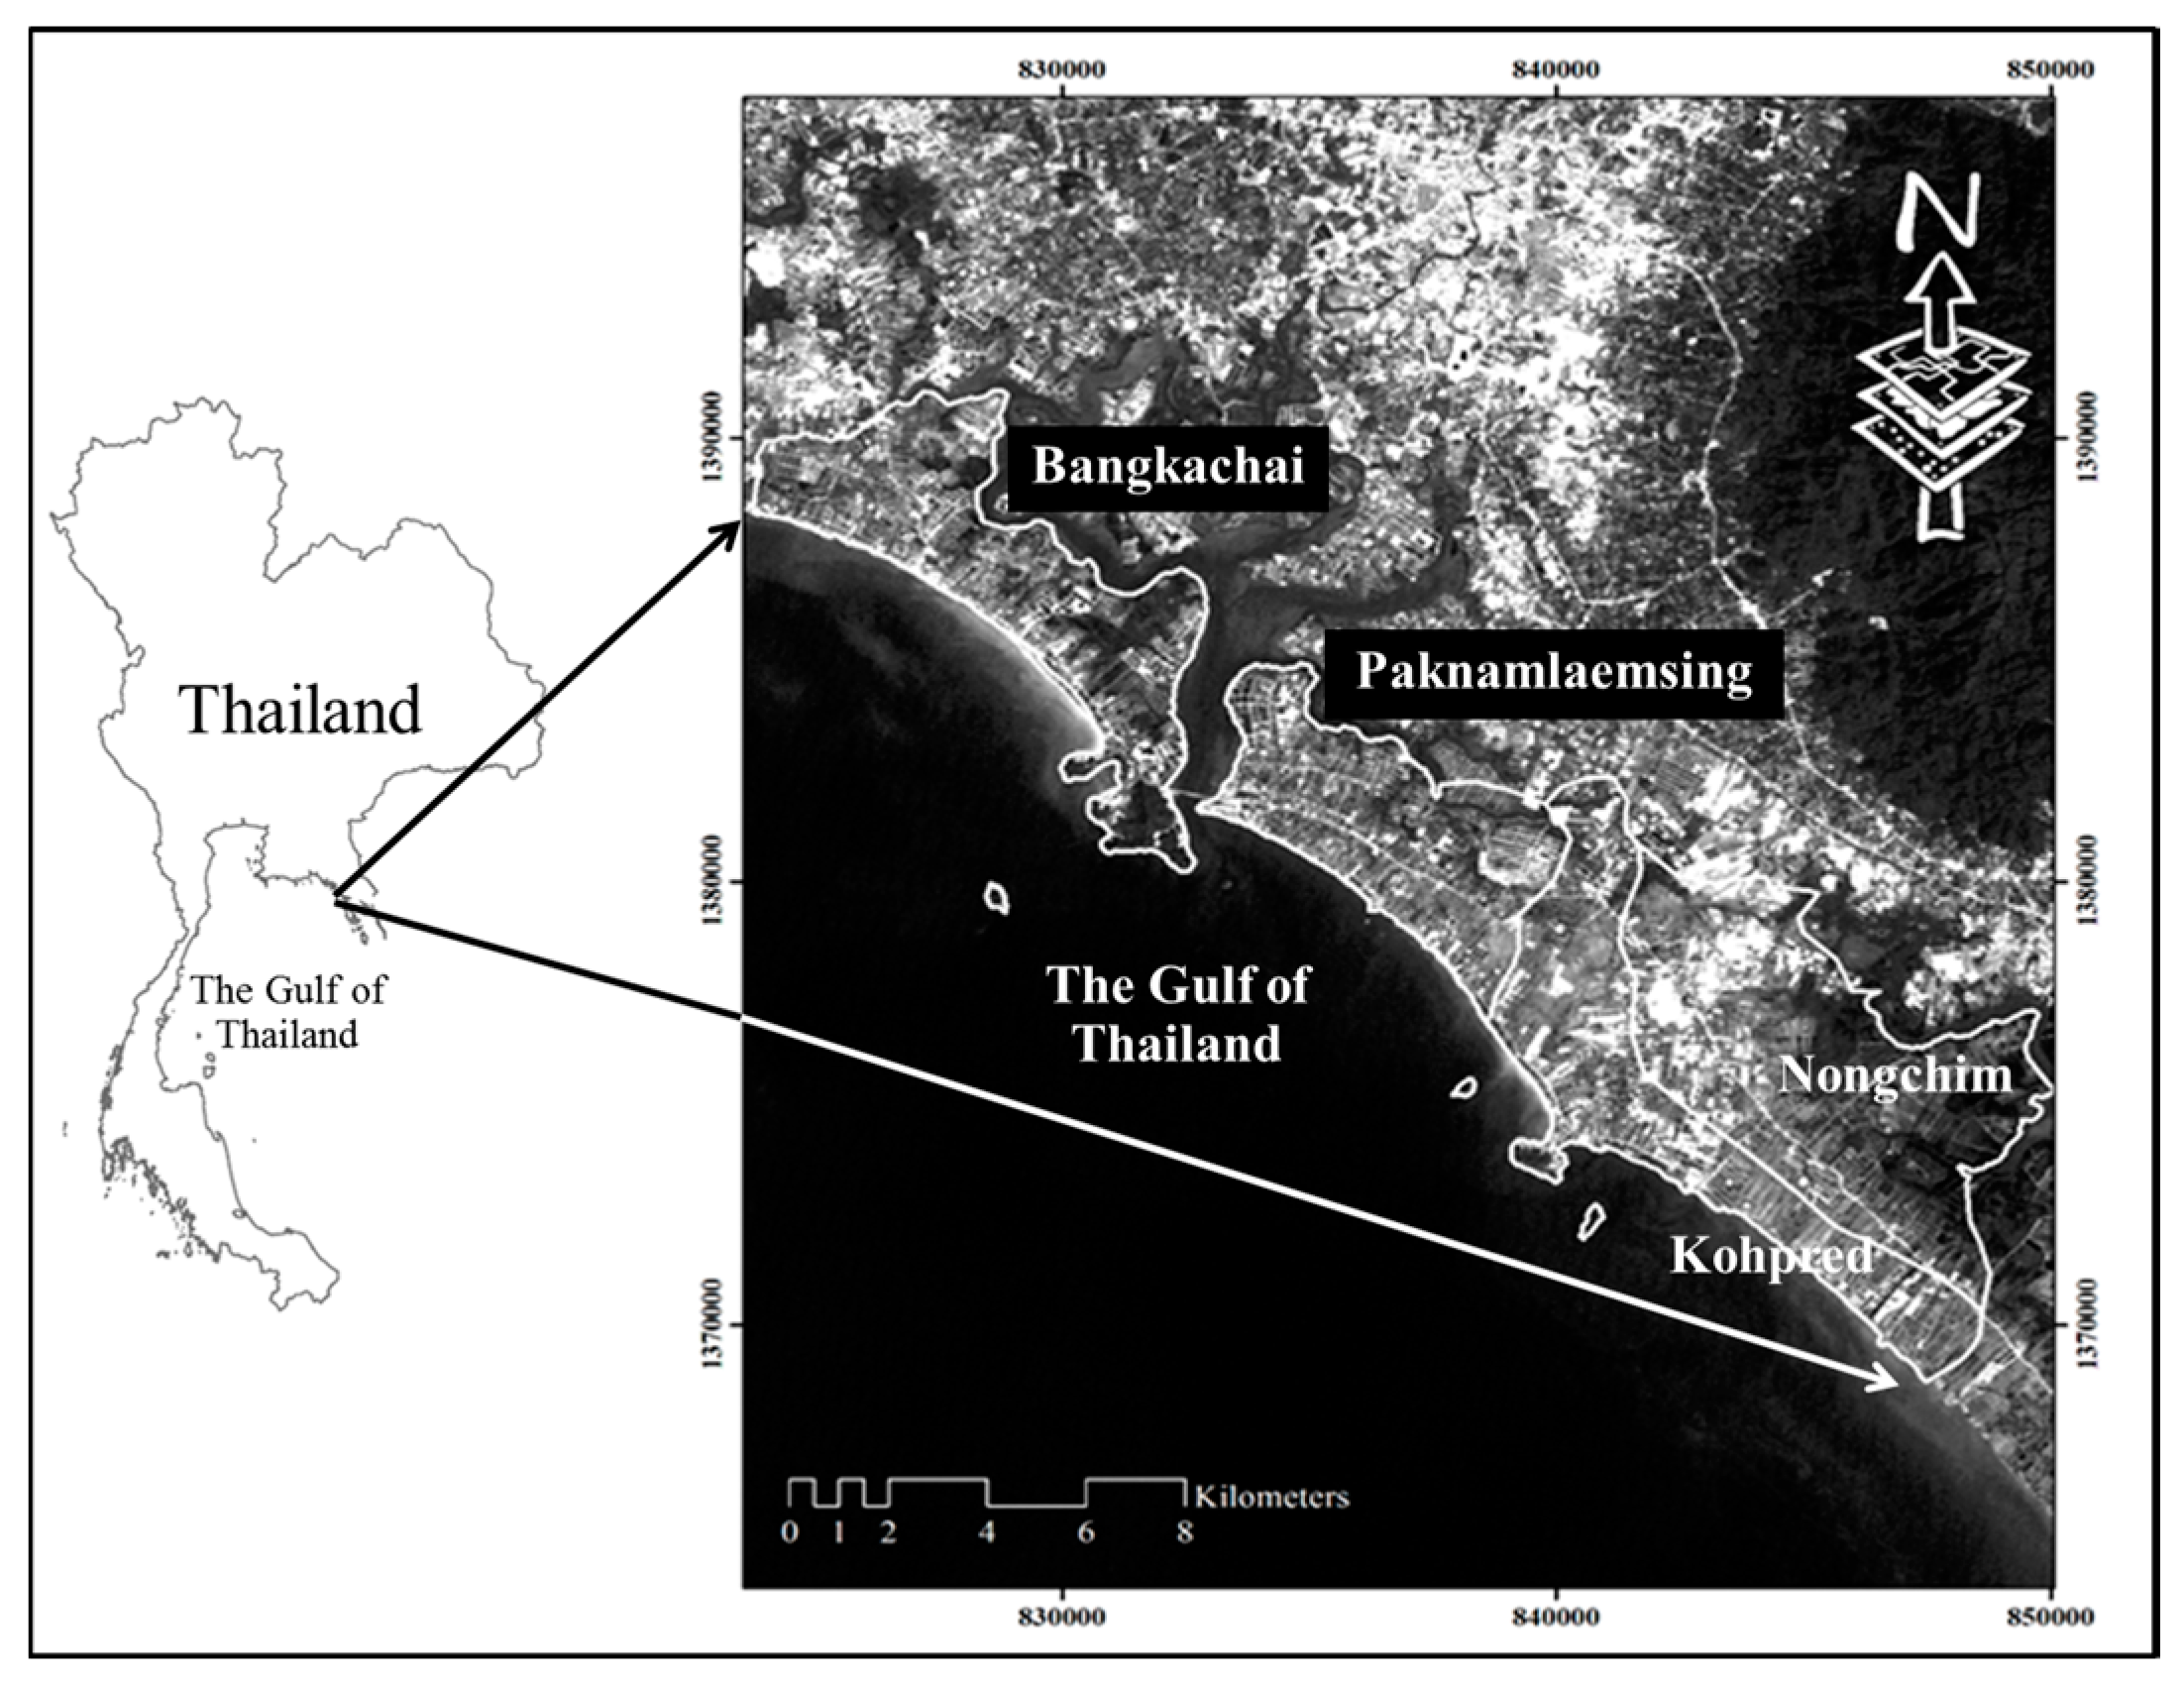
Laemsing District with approximately 45 km of coastline is one of the coastal districts of Chanthaburi Province located in the south of Mueang District with seven sub-districts inhabited by approximately 30,600 residents [22]. Four sub-districts, Nongchim, Kohpred, Paknamlaemsing, and Bangachai, which are rural areas, represent the study area (Figure 1). Nongchim is the only sub-district of the study area that has no shoreline, but is mostly connected to brackish water zones through canals. The shape of shoreline of the other sub-districts is likely curved and the beaches along the coastline of the study area are characterized by three types, namely: shingle, sandy and sand-muddy [23].
The study area is mostly low-lying and has been experiencing sea-level rise and its consequences, especially shoreline erosion [23] and tidal flooding (preliminary field survey in 2014). It is located in the coastal zone with areas mostly flat below 1 m above mean sea level, making it susceptible to sea-level rises itself. Figure 2a shows that 41 per cent of the entire study area has elevations below 0.50 m above mean sea level while areas with elevations lower than 1 m could be approximately 73 per cent (Figure 2b). Bangkachai has the highest proportion of low-lying land with around 59 and 84 per cent of its entire area having elevations lower than 0.50 or equal to 1 m, respectively. The lowest portion of low-lying land is in Nongchim, with 31 per cent of its entire area for elevations of 0.50 m, while the sub-district having the lowest rate of elevation, lower than 1 m, becomes Paknamlaemsing with 64 per cent of its entire area.
The study area has three rocky headlands; two of them are located in Bangkachai and another is in Kohpred. It embraces the Laemsing estuary mouth which connects to Chanthaburi River and canals that link with Walu River representing the boundary line defining the Provinces of Chanthaburi and Trat. The Laemsing estuary mouth, which includes swamp areas, has been utilized for oyster rearing and as a fishing ground for small-scale fishers. Aquaculture in the study area is practiced and in the largest land covering 56.52 per cent of the entire study area, and aquafarms are not only located close to the estuary, but are also distributed in many areas (Figure 3). Meanwhile, most aquafarms are found in Nongchim. Households settling in the area connecting the sea or in restricted areas; for instance, mangrove areas, particularly in Nongchim and Kohpred, have no land tenure and their houses are made of light materials.
3. Research Methodology
In this paper, the concept of vulnerability was defined by the Intergovernmental Panel on Climate Change (IPCC) and the concept of political ecology followed the work of [24]. Through the above concept, vulnerability is defined as a level of susceptibility to the shocks which the systems are confronted with. It is broken down in three aspects which are exposure, sensitivity and adaptive capacity, which explain what adverse phenomena the systems are confronted with, how the systems such as people, places, etc., are affected by such phenomena and what capacity the system impedes or copes with the problems. Vulnerability assessment is an important key step for developing adaptation strategies, and provides current and future climate risk information for formulating the plans and strategies of climate change adaptation by policy makers, managers, people, and other stakeholders, including non-governmental organizations (NGOs), community leaders and researchers [25].
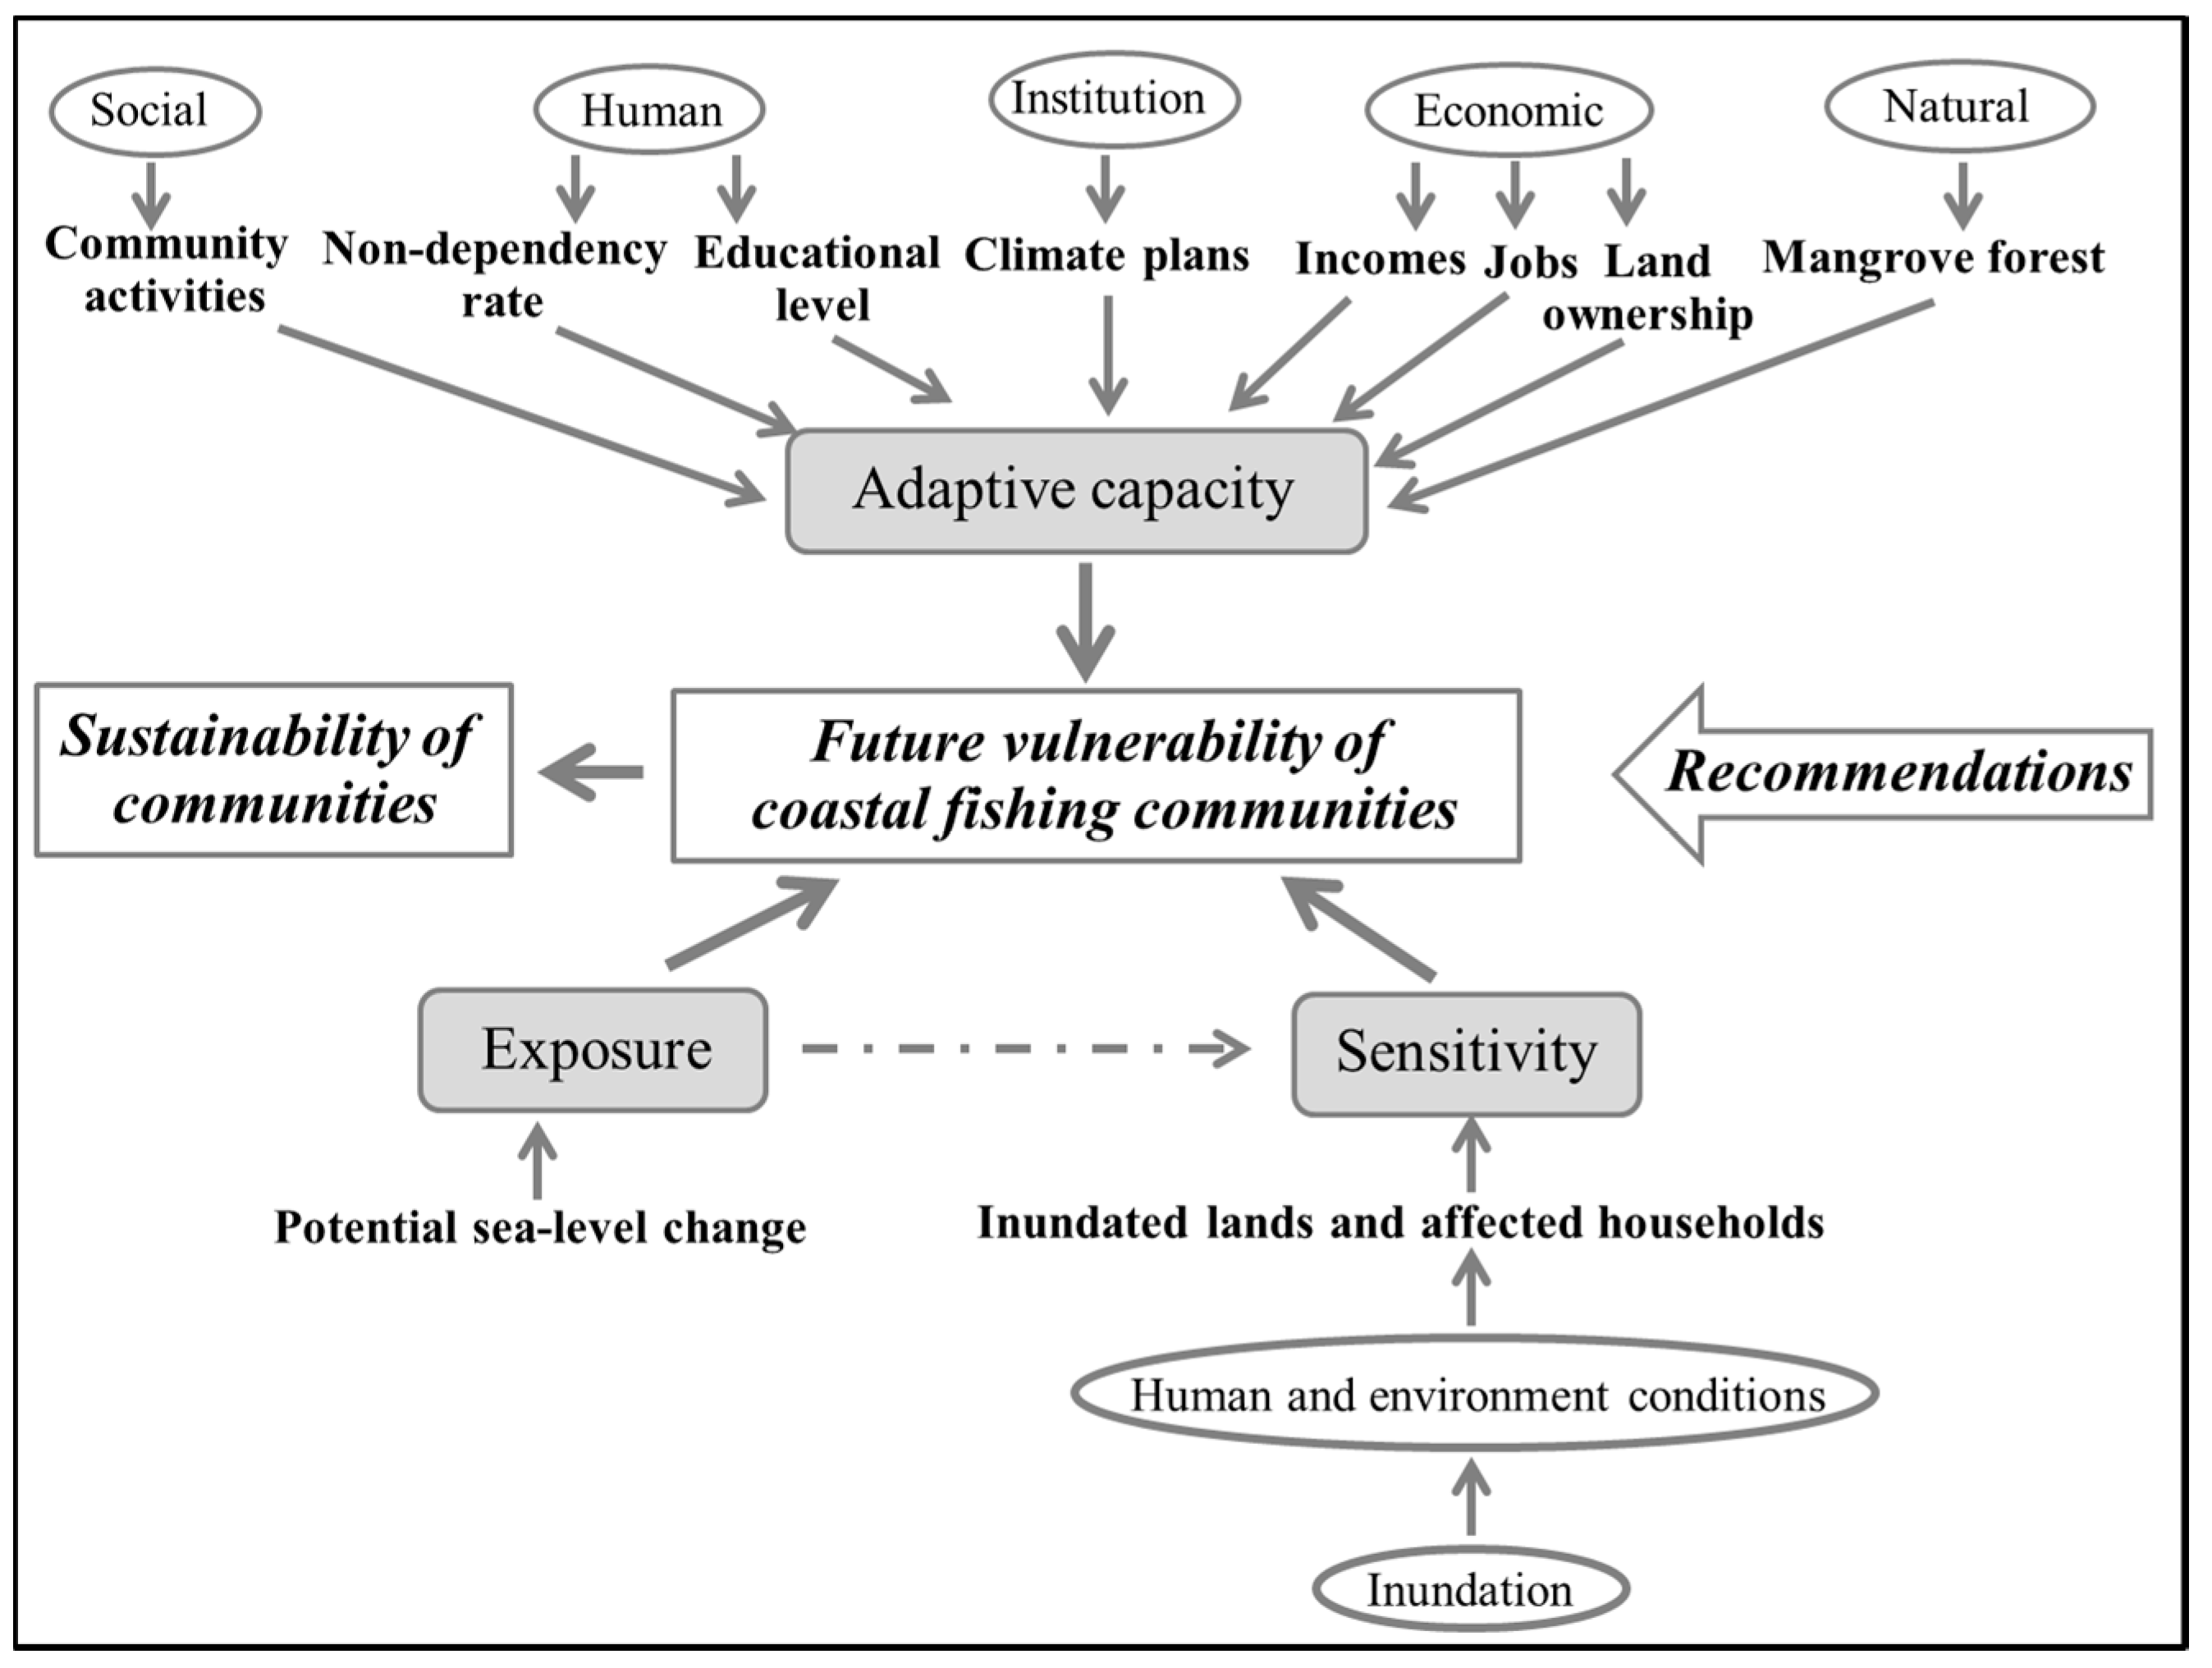
Three vulnerability aspects in this paper are focused on characterizing the interaction among causation with socio-economic and environmental processes, in different scales, including household and community scales (Figure 4). The outputs of the vulnerability assessment are given in quantitative values. Human and environmental conditions were considered as sensitivity factors affected by potential sea-level change which was defined as exposure. Land loss and affected households—anticipated to face the havoc of seawater inundation—represent the sensitivity of people’s livelihoods in fishing villages to climate change-relevant stimulus—the sea-level change. The last vulnerability aspect, adaptive capacity, which is the capacity of people and communities to cope with potential changes of sea level and its impacts was explored in all five conditions, namely: social, human, institutional, economic and natural conditions [26], the proxies of which were selected by using complex inter-relationships in individual and collective scales. These proxies—eight of them are presented in Table 1—were gathered based on social, environmental and economic conditions taking into account the limited available data and most of them were adapted from [9,27,28].
This research was conducted in collaboration with many stakeholders, including local people, government officials, etc. It adopted some techniques for climate change-relevant data collection from [7,29], including questionnaire survey, key informant interview and focus group discussion for gathering the primary data. Meanwhile, some data were collected through field level measurements. Adaptive capacity-relevant data was collected by using a questionnaire survey, which used open- and close-ended questions, conducted between October and November in 2014. The paper made use of the two-stage sampling approach for selecting the respondents. Firstly, purposive sampling was used to select the fishing village from each of the four sub-districts. Lastly, the numbers of respondents in each selected village were calculated using the well-known sampling formula of Yamane [30] and were randomly chosen. The 25 respondents who lived in fishing villages along the coast line and nearby brackish canals were the representatives of sub-districts—Nongchim, Kohpred, Paknamlaemsing, and Bangkachai. In total, 100 of targeted respondents who were the heads of households were asked to answer the questionnaire in order to gain the adequate information related to their households [7]. The respondents were mostly male (68 per cent) and most of them were aged 31–50 years (61 per cent). The questionnaire tool mostly aims at collecting data related to livelihood assets at the household level, especially the indicators of adaptive capacity, such as age, education level and income of each member of the household, among others. Meanwhile, the focus group discussion tool, which was conducted one time per each targeted sub-district (30 participants), mostly gathered information about climate change-relevant events and suggestions to enhance the adaptive capacity of households, from people in the fishing village of each targeted sub-district. The collected information helped the authors in clearly identifying the problems regarding climate change and its impacts in the study area, adaptive capacity of community, adaptation responses, and so on. The last tool—key informant interview—was used to mostly ask the leaders of villages and officials in high position in each targeted sub-district administration about climate change situations and collectively their mitigation and adaptation plans and activities in the community or sub-district level.
To quantify the numerical results of the overall vulnerability, the formula: ‘Vulnerability = (exposure + sensitivity) − adaptive capacity’ which was stated in [31] was used in the calculations.
3.1. Quantifying Vulnerability on Exposure to Potential Sea-Level Change
The potential sea-level change in the four sub-districts—climate change stimulus—was projected for four years by using the SimCLIM software. The numerical vulnerability on exposure of each sub-district is presented as scores from 0 to 1. Degree of the study area’s exposure to the anticipated change of sea level was quantified by using the method mentioned in [32], as detailed in the following equation.
where X = predicted sea-level change for a sub-district, Min = minimum predicted sea level for all sub-districts, and Max = maximum predicted sea level for all sub-districts.
Dimension index (DI) = (X − Min)/(Max − Min)
Meanwhile, the sub-district with high scores is interpreted as having high exposure to sea-level change, and the sub-district with low scores is considered as having low exposure.
The potential change of relative sea level was estimated for four years, namely: 2020, 2030, 2040, and 2050. Prediction was calculated by taking into account the combination of greenhouse gas emission scenarios, climate-predicted results of General Circulation Models (GCMs), and change of local mean sea level. A1F1 and B1 scenarios released in the Fourth Assessment Report (AR4) by IPCC were referred to as the worst and best cases of future greenhouse gas emissions, respectively [33]. The Goddard Institute for Space Studies model EH (GISS-EH)—one of the nine GCMs in the Coupled Model Inter comparison Project Phase 3 (CMIP 3) of AR4 installed in the computer software, was selected for projecting both emission scenarios. Comparison of the potential sea-level rise between AR5 and AR4, although in overall, the rising sea level by the end of 21st century based on AR5 is in duration of 0.29–0.82 m higher than duration of sea-level rise 0.18–0.59 based on AR4. The range of rising sea levels associated with A1F1 in A4—0.26–0.59 m [1]—is very similar to RCP 2.6 with the duration of 0.26–0.56 m [4]. GISS-EH was chosen based on the best comparative results among the nine GCMs and the changing trend of observed sea levels in Laemsing District from 1990 to 2001.
The increased sea levels of 10.50 mm/year as measured at Laemsing tide-gauge measuring station (coordinates: 102.0700, 12.4654) by the Hydrographic Department of the Royal Thai Navy, was incorporated for simulating the potential change of relative sea level. Results in cm are presented as the potential change of relative sea level for 2020, 2030, 2040, and 2050 with 2000 as baseline.
3.2. Quantifying Vulnerability on Sensitivity to Seawater Inundation
Seawater inundation is identified as one of the two events of primary biophysical consequences of sea-level rise [6] that seriously affects coastal communities. Therefore, this research considered potentially inundated lands and affected households that are sensitive to sea-level change, as parameters to assess the vulnerability of coastal fishing communities on sensitivity in terms of environmental and human conditions. The aforementioned equation for assessing numerical vulnerability on exposure was also used for future sensitivity assessment. The two parameters, the lost areas and the affected households caused by inundation, were similarly weighted and standardized in scores of 0–1. Sub-districts with high values of vulnerability on sensitivity have more negative impacts than those with low values.
To map the potential seawater inundation, this research adapted the National Oceanic and Atmospheric Administration’s Methodology for Mapping Sea-Level Rise Inundation which was preceded by Geographic Information System (GIS) software-installed spatial analysis tools to simply create the inundation map. The method used in this paper is a simple and static modeling effort which adapted a bathtub approach and focuses on potential sea-level rise, digital elevation data (DEM) and hydrological connectivity [34]. Although this mapping technique is a coarse approach and does not do a probabilistic model which includes dynamic components such as storm surge, wave, landform response, etc. [35], it is appropriate for this paper to spur policy makers to be aware of effects of seawater inundation in Thailand. The quality of inundation mapping in both static and dynamic approaches depends on accuracy of land surface elevation [35]. Meanwhile, the paper used DEM with 5 m of spatial resolution—high resolution showing the vertical distances in meters from mean sea level (MSL) of Thailand (2.50 m)—which was provided by the LDD, Thailand, in 2006, and was extracted from Aerial Photo. In addition, considering land form response, although mangrove soil-surface elevation gains can help coastal systems, such as wetland to avoid the biophysical effects of inundation, the increasing rate of sea level in the long-term in the Gulf of Thailand, especially in the eastern part, is higher than the increasing rate of soil elevation gains in mangrove areas [17]. Thereby, the elevation gains in the study area cannot prevent the inundation and are not considered for inundation mapping for this paper.
The inundation-mapping approach and evaluation of affected households for this paper are described below.
1. Creating sea surface map (Figure 5): Sea surface in this paper is the accumulation of desired sea level and mean high water (MHW) in the study area. The desired sea level is a potential rise of relative sea level with median sensitivity, in four years presented in Section 3.1 and MHW is the sea level at 3.04 m or 0.54 m above MSL in Thailand measured at Laemsing tide-gauge station during 1990–2001. The sea surface map of each year of interest was created in raster by using spatial analyst installed in Arc Map 10.1.
2. Creating seawater inundation grid based on hydrological connectivity (Figure 5): Firstly, the preparation for evaluating connectivity was processed by using Map Algebra to identify areas equal to or lower than the sea surface as showing at value of 1. Secondly, creating extent raster of hydrological connectivity was processed through a menu of ‘region group’ in a Generalization tool. The inundation grid as a result of this process shows the inundated extent with hydrological connectivity by 40 m. Finally, extraction of the maximum value from the extent raster was processed using a menu of extract by attribute in extraction tool. The output from this process shows connected areas with 40 m which have an elevation equal to or lower than the sea surface map.
3. Creating seawater inundation map contained inundated land use types (Figure 5): Firstly, the conversion on the seawater inundation grid in raster to vector was processed by using a menu of ‘raster to vector’ in conversion tool. Finally, overlaying inundation surface shape file on land use shape file provided in 2010 by LDD, Thailand was processed by using a menu of clip in geoprocessing. The outputs from this process show land loss due to seawater inundation.
4. Assessing the affected households: This paper calculated the rate of village-inundated areas in each sub-district while the affected number of households was quantified by multiplying this rate to the entire number of households in each sub-district which was gathered for the development plan of each sub-district.
3.3. Quantifying Vulnerability on Adaptive Capacity of Coastal Fishing Communities
Five aspects of adaptive capacity were considered in describing the capability of coastal fishing communities to cope with negative impacts of potential sea-level change. In addition, eight indicators of the five aspects in Table 1 considered in the individual and collective conditions were determined for the assessment depending on the available data due to limited access. The indicators representing the five aspects of adaptive capacity in terms of livelihood dimension, including institutional condition, were selected based on the parameters proposed in [28]; [9] are described below:
- (1)
- Social aspect: This aspect indicates the existence of relationship among individuals within households and households within a community as a social network, which is necessary to establish a better understanding of climate change through communications and creates climate change resilience by facilitating the development of collective actions [28]. One resource—numbers of times or frequency of household heads participating in community activities—is an indicator that strengthens the relationship among households and was selected to measure the ability of households to cope with the challenges on the social aspect. High frequency represents more capacity than low frequency. The average number of times of attendance by all respondents in each sub-district was calculated.
- (2)
- Human aspect: This aspect refers to the availability of people’s knowledge, skills and living experiences, and last but not least, the physical capability which is the greatest human resource to respond to and cope with the challenges that people face and will be confronted with. The educated members of households will have high opportunity to implement climate change-impeding and coping plans. Likewise, households with high numbers of people at their working age may be less constrained to access income and information, and can easily implement climate change adaptation than those households with high numbers of dependents [28]. Therefore, this paper considered these two human resources shown in Table 1 as the vulnerability-measuring indicators in the human aspect. For the per cent of people in households having non-dependency rate (age 15–65 years old), the per cent of members of households aged 15–65 years old was calculated for each household and then the average per cent was calculated as the per cent for each sub-district.
- (3)
- Institutional aspect: this aspect refers to the capacity of community as collective resources in the form of institution, to impede and cope with the impacts of climate change. Ref. [28] suggested that activities, plans, efforts, and the like, which are beneficial to communities in terms of ability to reduce current and future vulnerability to climate change, are indicators that show the institutional aspect of adaptive capacity. Therefore, the paper collected the total number of plans or activities of each sub-district that aim to impede and cope with climate change, including coastal protections, alternative livelihood opportunities, and climate change plans were used as indicators for this aspect.
- (4)
- Economic aspect: This represents the economic assets, including income and its accessibility to individuals within households who can support the households in absorbing the shocks. The paper employed three indicators to measure the ability of households such as the following:
Numbers of households having more than one job, showing diversification of income sources. It is assumed that a household having only one job is highly susceptible to the impacts of climate change. However, this paper divided the job of people in fishing community into two categories, namely: fishery and non-fishery occupations. The total number of households which have two occupations was calculated and represented for each sub-district.
The average monthly income of households, considering that households having high incomes are assumed to have high capability to address and find opportunities to cope with climate change and its impacts more than those households having low incomes. The income of all members of households was averaged and the calculated number was averaged again as representative for the sub-district.
Land areas of households indicate easy access to income sources. The paper assumes that households having high quantities of land areas have more capability to access income sources than those households having low quantities of land areas. The average land areas of each household were calculated as representative for the sub-district.
- (5)
- Natural aspect: This aspect includes the natural resources that support present and future settlements and income sources of people in rural areas. This aspect enhances the livelihoods of people who live in the proximity of and depend on natural resources [28] such as mangrove forests, fisheries resources, water resources, and so on. Therefore, a community having high natural resources would gain more capability than a community having low natural resources. Hence, the paper considered the number of mangrove areas as an indicator to measure the vulnerability on adaptive capacity in terms of the natural aspect, because people in the study area mostly depended on mangrove forests for their economic activities. The areas of mangrove of each sub-district were collected and calculated using GIS as shown in Table 1.
The quantitative values of the adaptive capacity were calculated using the DI equation based on equal weights of all parameters and standardized in scores from 0 to 1 in line with vulnerability assessment on sensitivity. Sub-districts with high scores were considered as having more adaptive capacity than sub-districts with low scores.
4. Results and Discussion
4.1. Changing Sea Level and Level of Numerical Vulnerability on Exposure
Rise of sea level is clearly evident in the study area. At the tide gauge-measuring station of Laemsing, during 1993–2004, the sea level has risen 10.50 mm/year, and was higher than the rise of GMSL during 1993–2010 which was optimal at 3.20 mm/year [4]. The rate of apparent sea-level rise in the study area was 6.60 mm/year and the vertical land movement was 3.90 mm/year [16]. The results clearly showed that the sea level was rising at rates higher than the global trend. This paper also projected that the study area would be confronted with continuing high rates of relative sea-level rise in both two emission scenarios of all three sensitivities; low, median and high. Projection for sea-level change in the paper would be in the same coordinates as those indicated by Laemsing tide gauge station and the same positions along the seafront areas in all sub-districts. These projected volumes of sea level are the same as the number of total sea-level changes. Potential sea-level changes in all sub-districts were therefore presented only at positions similar to those of Laemsing tide gauge station, as shown in Table 2. For the median sensitivity in 2050, the projected relative sea level based on A1F1 will increase by about 0.50 m from that of 2000. Likewise, the projection using B1 indicated that relative sea level will increase by 0.47 m from 2000 until the mid of the 21st century. The potential relative sea level in each scenario gradually differs from the early years of interest while the relative sea level will be explicitly different by the last ten-year period and quite different in the last 50 years of the century.
Similarly, the simulation illustrated that rising levels of seawater in all sub-districts resulted in numerical vulnerability on exposure with a score of 1 in each of the sub-districts (Figure 6). This describes the situation where each sub-district is exposed to potential sea-level change at the same rate.
4.2. Consequences of Rising Sea Level and Level of Numerical Vulnerability on Sensitivity
4.2.1. Physical Impacts Caused by Inundation
Sea level in Laemsing is influenced by northeast monsoons (October–February) causing high sea levels during this period. Meanwhile, during May–August, sea level is low due to southwest monsoons (Figure 7).
Tidal flooding is one of the adverse events caused by rising sea levels in the study area. From results of the survey undertaken in this research, the flooding happened in Nongchim and Bangkachai during high tide in November 2012. Such temporary flood events affected shrimp and fish ponds, houses and some parts of roads located in these sub-districts. The study area has therefore reached the sensitivity to sea-level rise that tends to be severe associated with the anticipated rise of sea levels.
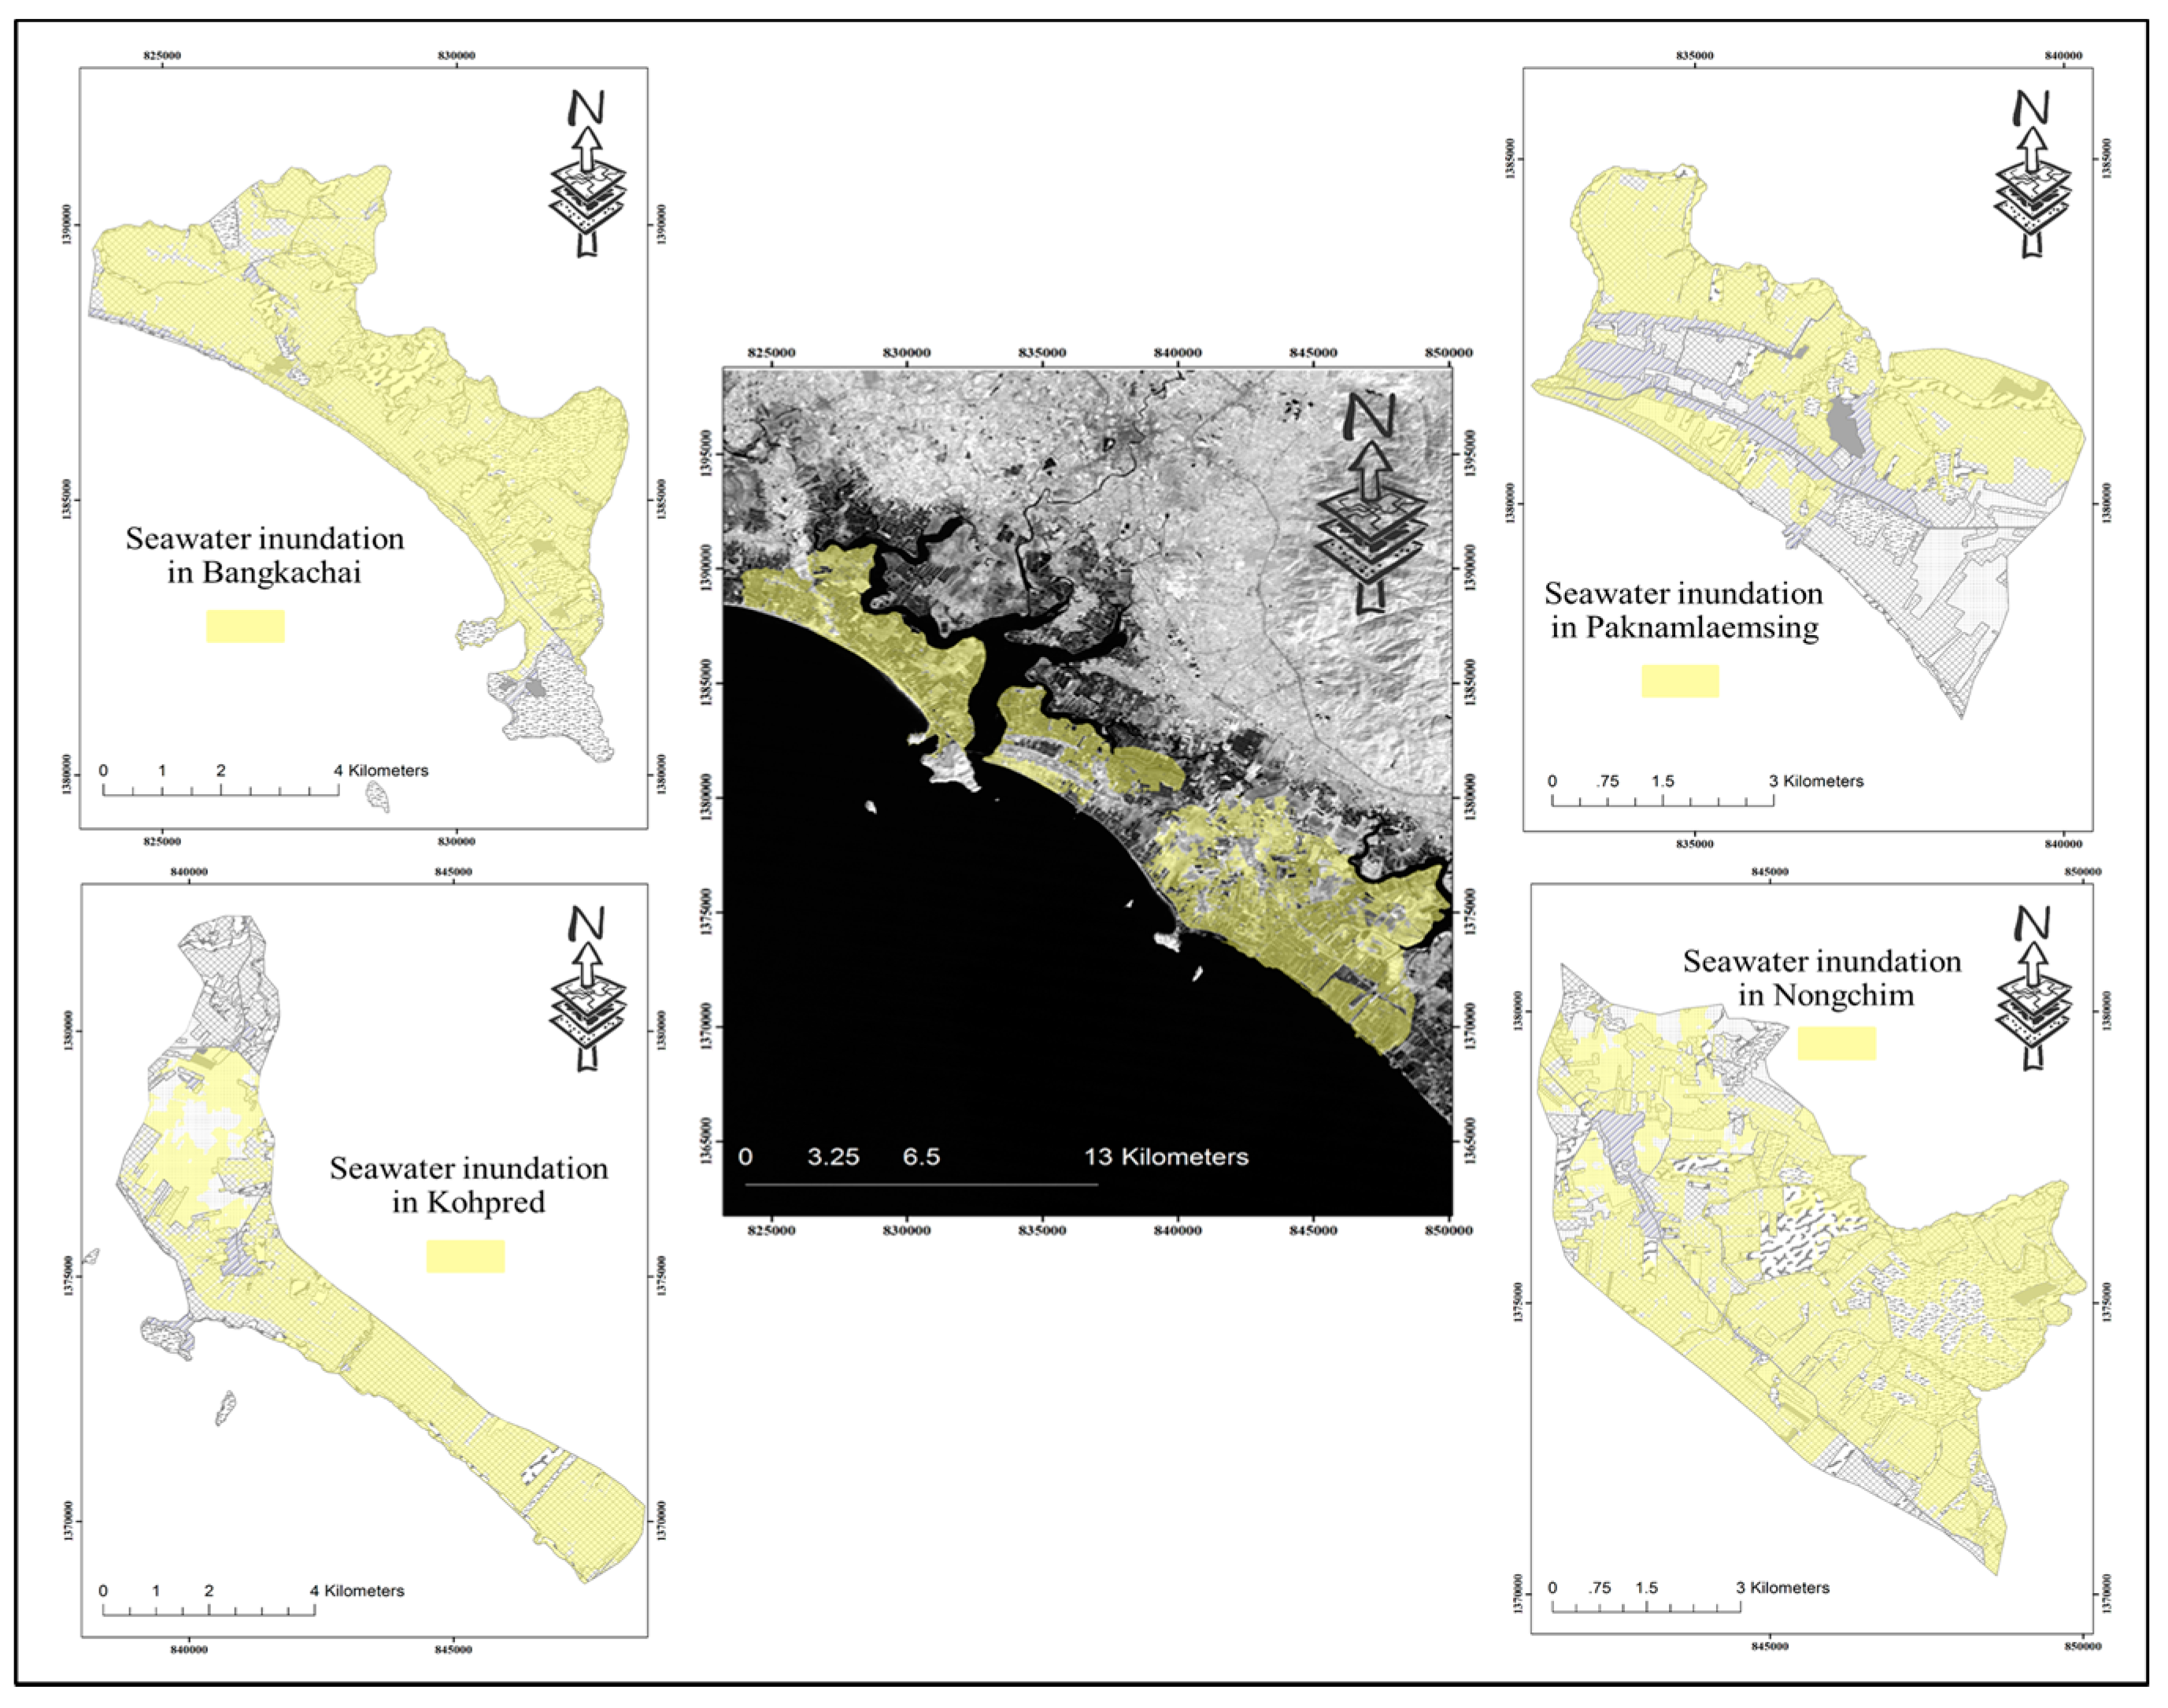
Potential inundated areas, estimated by combining the data from DEM, MHW and potential sea-level rise, will be severe continuously in all years of interest and in both of the emission scenarios. Mostly occurring at Nongchim, the total land loss could be 30.43 km2 in 2050 (Table 3 and Figure 8). Thus, the study area will be confronted with the worst inundated land in 2050 by 88.77 and 85.32 km2 associated with A1F1 and B1, respectively; in other words, land loss based on simulation by A1F1 is slightly higher than that of B1 by 3 per cent.
Aquaculture areas would be the most affected, particularly the shrimp ponds which are located mostly in low-lying areas of the study area, approximately comprising 65 per cent of the whole inundated areas (Table 4). Considering the natural resources, seawater inundation will pose vegetation which consisted of deciduous, mangrove forests, and grasslands resulting in the second most inundated areas. About 11.27 km2 of the mangrove forests or approximately 99 per cent of total inundated vegetation are at risk of degradation, affecting the sustainability of fishery resources and fishers’ income as well. Mangrove forests as nursery ground that sustains stocks of estuarine and coastal fisheries will always be inundated through tidal cycle. Forest degradation could cause reduction of the fishery stocks affecting fishers, as the volume of fishery catch would decrease leading to less income by fishers.
4.2.2. Households Affected by Inundation
Communities in the study area occupy mostly the coastline and near brackish water canal-connected areas (Figure 3). Most houses are constructed with rigid and strong structures, but are still affected by inundation. Overall, based on A1F1, 2060 households would be affected by seawater inundation (Table 5). Potentially, Paknamlaemsing would have the most affected households compared with the other three sub-districts. Although Paknamlaemsing has the lowest potential inundation areas, it has the highest number of affected households in 2050 because most of its residents and households are crowded along the shoreline and close to Chanthaburi River. However, the proportion of affected households in Paknamlaemsing to its whole households could be approximately 30 per cent. Thus, the affected households due to inundation in Bangkachai would be the highest at around 57 per cent.
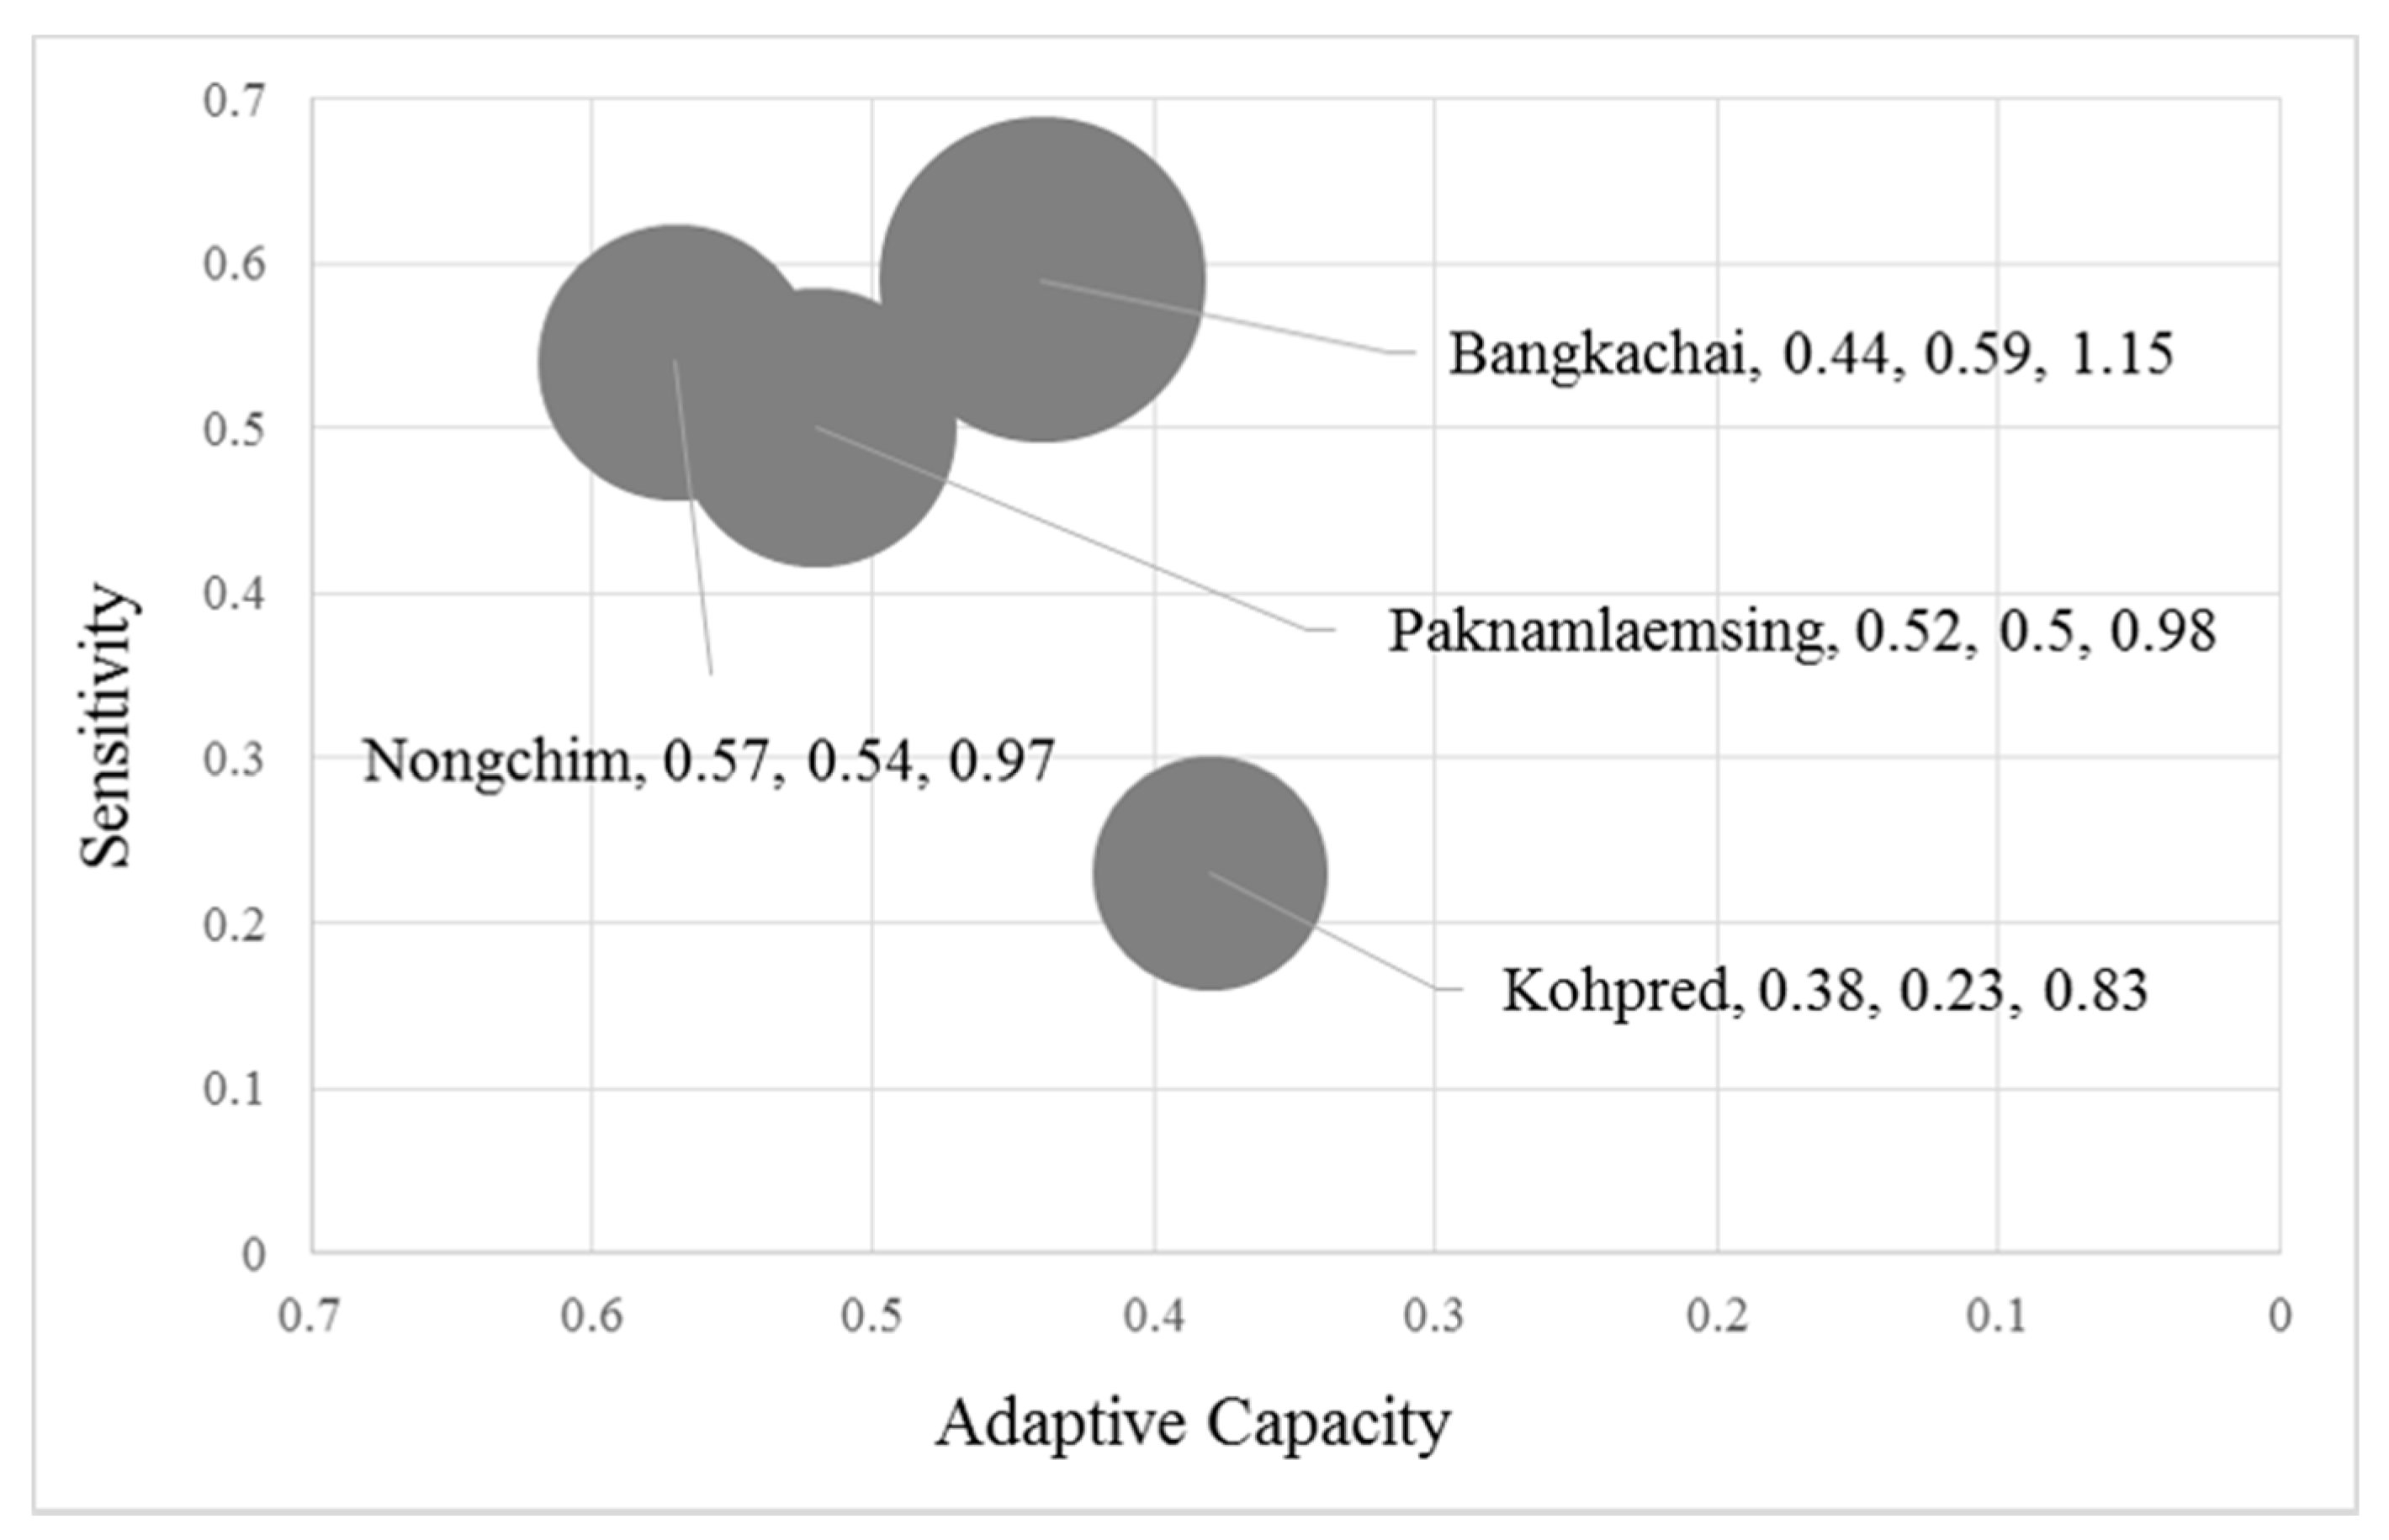
Land loss and affected households due to inundation were standardized by using the DI equation to quantify numerical vulnerability on sensitivity. The results indicated that the highest vulnerability on sensitivity occurred in Bangkachai with a score of 0.59, followed by Nongchim, Paknamlaemsing and Kohpred with the scores of 0.54, 0.50 and 0.23, respectively (Figure 6). Statistically, these scores are significantly different (t (3) = 5.78, p = 0.01).
4.3. Capacity of Fishing Communities to Alleviate the Impacts of Potential Sea-Level Change and Numerical Vulnerability on Adaptive Capacity
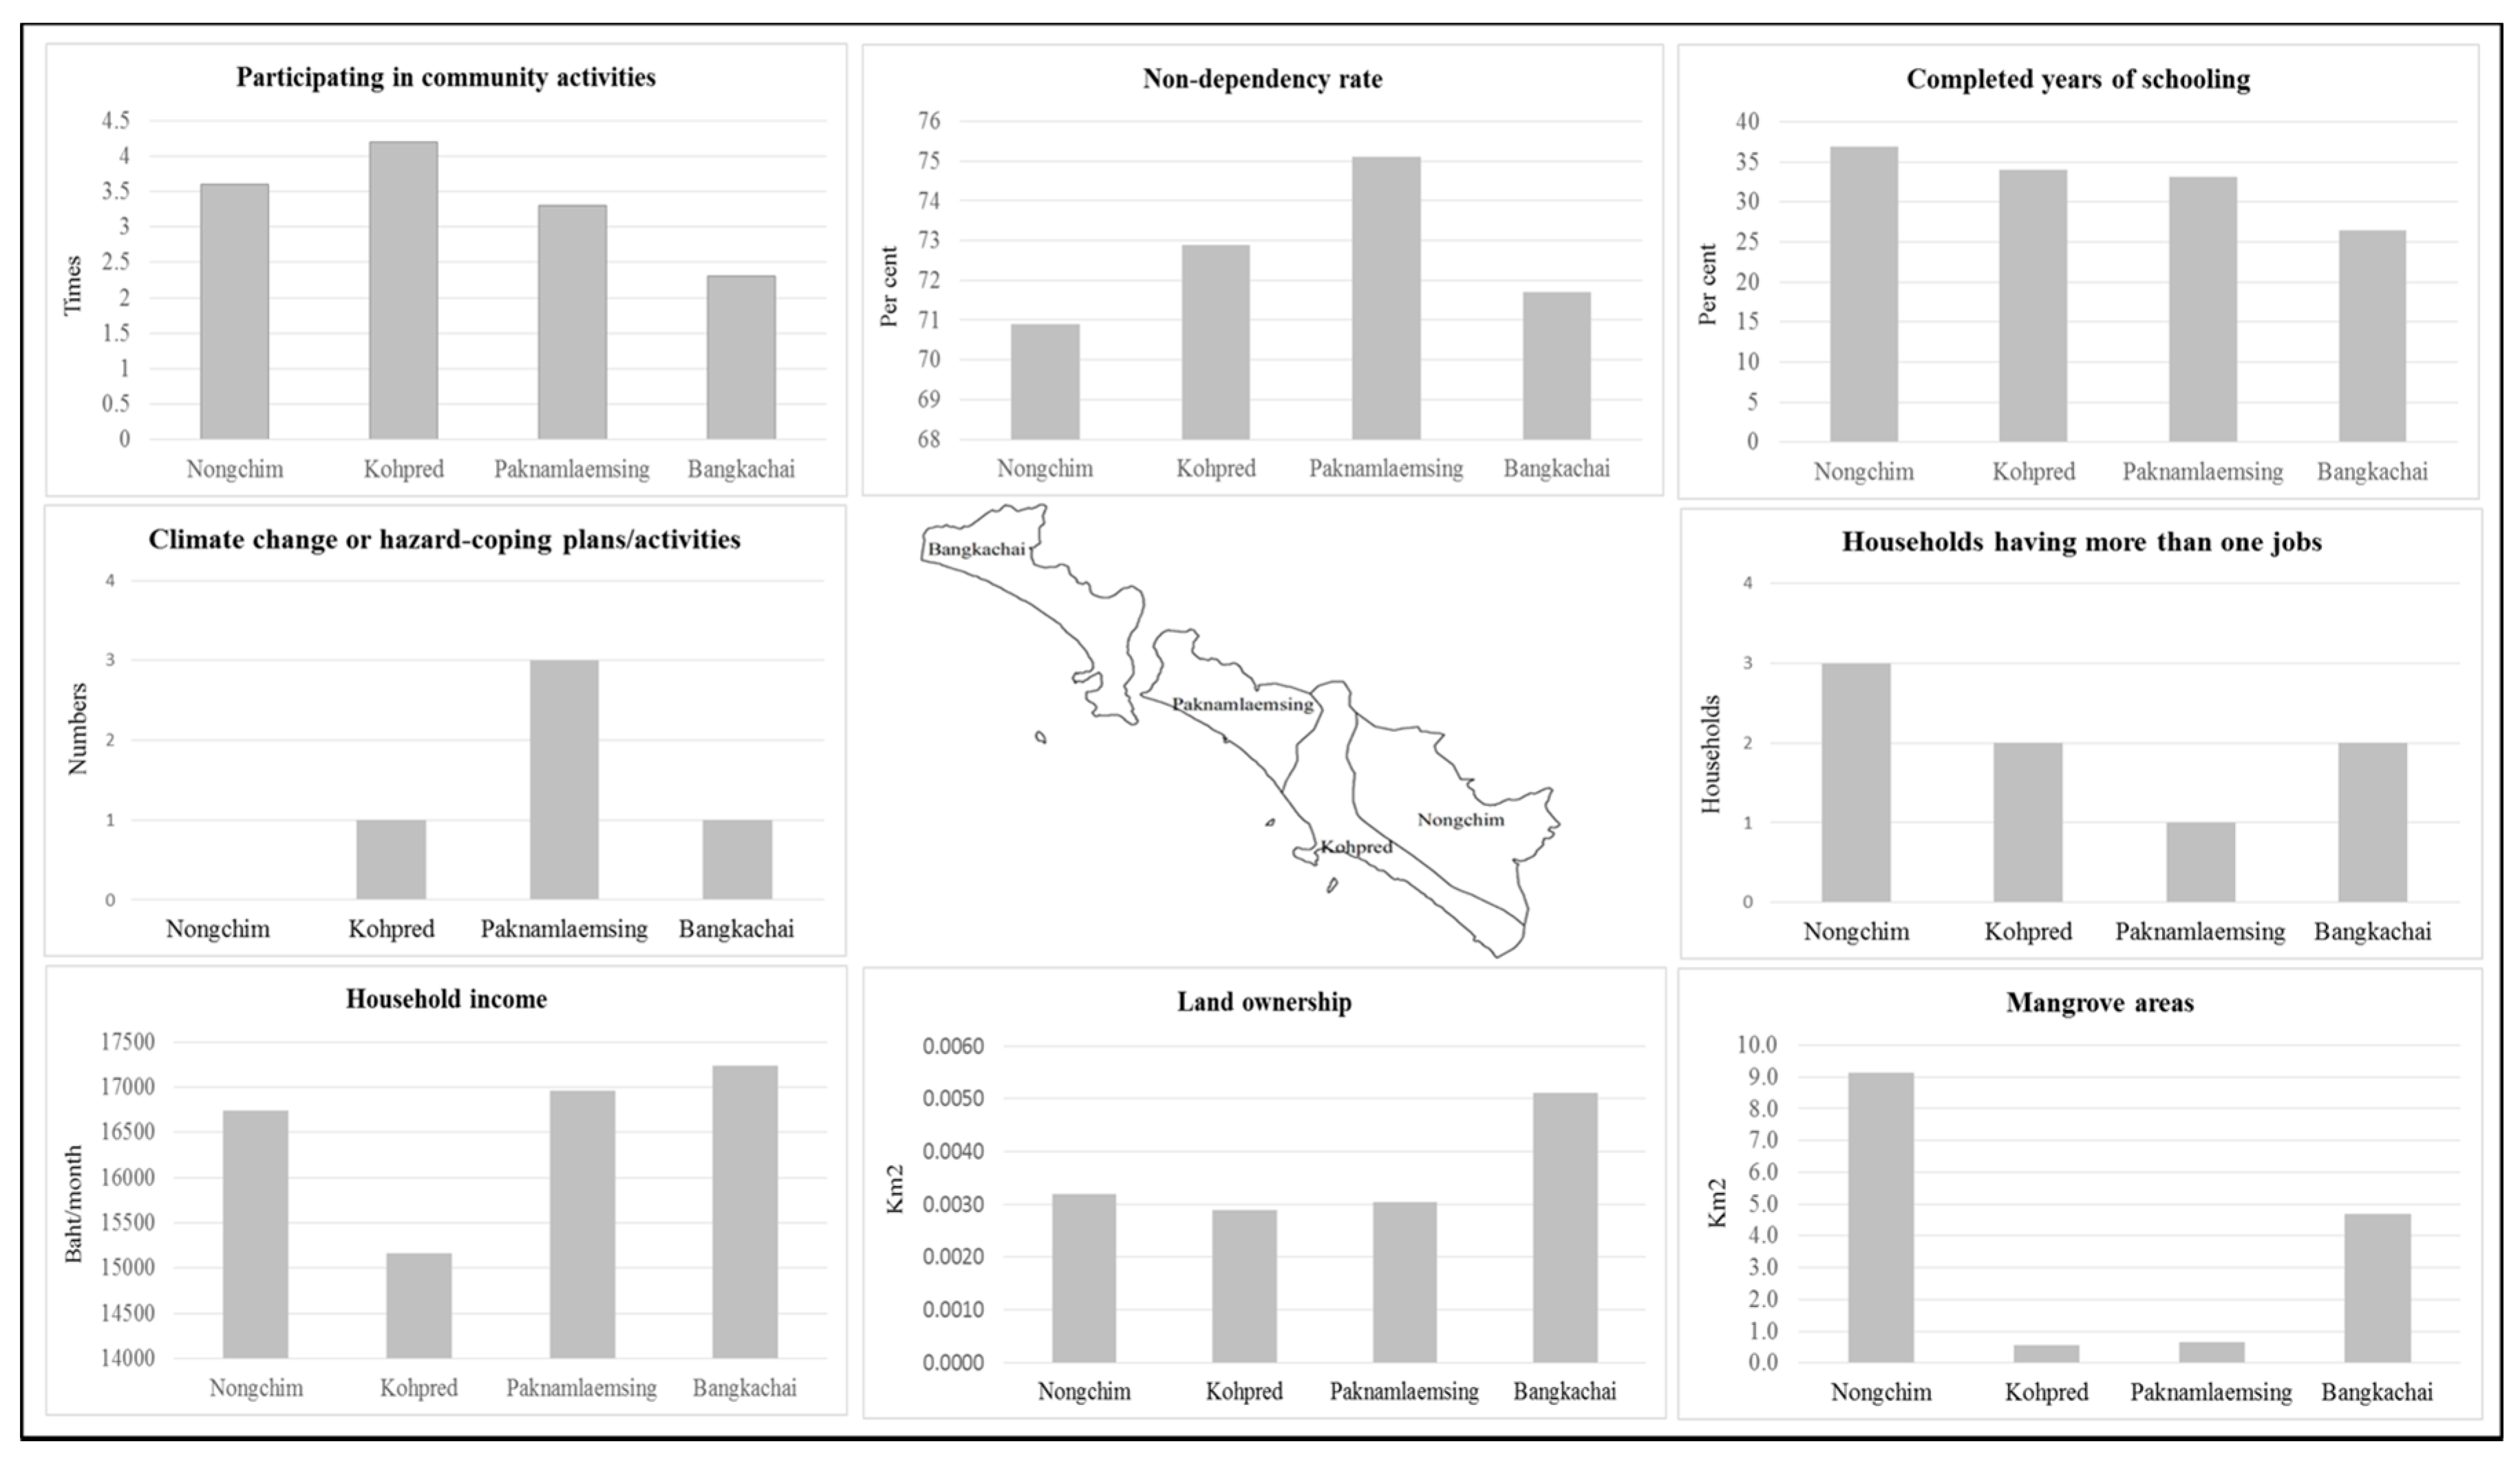
The parameters of adaptive capacity in each sub-district were analyzed and then standardized by using the DI formula. Finally, the level of adaptive capacity in each proxy was compared among the sub-districts. The paper provided eight indicators in both individual and collective conditions (Table 1) which show the ability of households and communities to ameliorate the impacts of rising sea levels through inundation. Six parameters, including frequency of attendance in community activities, rate of non-age dependency, level of education, income, diversity of jobs, and land ownership were considered at the household level while climate change-relevant plans or activities and areas of mangrove were included being representatives of collective conditions (Figure 9). Information on these selected parameters were collected at the local level to ensure that individual and collective demonstrated capacity of sub-districts in terms of livelihood dimensions including institutional conditions to cope with the future impacts of sea-level rise, are considered. The parameters associated with parameters of livelihood assets presented in [7] are necessary to suitably clarify the effective responses of socio-ecological resilience of the target communities. However, the adaptive capacity presented in this paper is slightly different from the vulnerability study of [20] in a coastal city which did not consider the characteristics of local people.
In the study area, the sub-districts have unequal values of the indicators on adaptive capacity indicating that sub-districts with less values of each indicator are more susceptible to sea-level rise when it happens than the sub-districts with high values of each indicator.
The results, from the calculation, indicated that Nongchim has the highest capability to adapt to potential sea-level rise with a score of 0.57, followed by Paknamlaemsing and Bangkachai at 0.52 and 0.44, respectively. Meanwhile, with a score of 0.38, Kohpred has the lowest level of adaptive capacity (Figure 6). Based on statistical analysis, the adaptive capacity of the sub-districts are statistically significantly different from each other (t (3) = 11.34, p = 0.001). Nongchim on the one hand, has the highest level in three proxies of adaptive capacities that include residents having completed a certain number of years of schooling and more than one occupation, and existing mangrove areas. On the other hand, the lowest level of the three proxies of adaptive capacities occurred in Kohpred. The sub-district with a high level of adaptive capacity indicates higher capacity for alleviating the effects of rising sea level-relevant consequences than the sub-district with low adaptive capacity.
Overall, vulnerability of coastal fishing communities in the study area based on three aspects indicated that Bangkachai faces the vulnerability to potential sea-level rise at the highest level with a score of 1.15. Paknamlaemsing ranks the second most vulnerable sub-district with a score of 0.98, followed by Nongchim and Kohpred with scores of 0.97 and 0.83, respectively (Figure 6). Statistically, the results confirm that the sub-districts will be vulnerable to sea-level change in different degrees (t (3) = 15.00, p = 0.001). Bangkachai has the longest coastline and highest percentage of areas with elevation below 1.0 m, thus, leading to it being the most sensitive to the biophysical effects of potential seawater inundation. Additionally, this sub-district also has a low capacity of vulnerability reduction, resulting in the highest score of its total livelihood vulnerability.
5. Suggestions for Vulnerability Alleviation
Comparatively numerical vulnerability assessments of coastal fishing communities is illustrated with three aspects demonstrating how households are susceptible to biophysical impacts of potential sea-level change and the capabilities and responsibilities to ameliorate the adverse impacts. The results indicated that a sub-district with the highest total vulnerability could have the highest sensitivity, but not necessarily the lowest adaptive capacity. Thus, proper options for coping and reducing potential vulnerability could not be specifically identified on any sub-districts, but could be specific on each vulnerability aspect. Meanwhile, the responsibilities and actions for vulnerability alleviation could be spatially and temporarily distinct [12]. Thereby, this paper provided options for two levels of each vulnerability aspect; at local and national, and urgent and medium time frame. A one-year period was considered for the urgent time frame and a five-year period for the medium time frame. The suggested options would attempt to sustain livelihoods of coastal fishing communities toward lowering exposure, preventing sensitivity and enhancing adaptive capacity (as shown in Table 6).
In case of exposure, since it is clear that sea levels in the study area will gradually increase annually, an option could be to prevent the exacerbation of the increase of relative sea level, especially its cause of local characteristics such as land subsidence and decline in sediment supply. Stopping using underground water in the study area is ambiguous, such as for aquaculture, can impede the rise in relative sea levels caused by land sinking although the subsidence caused by underground water extraction. One of the tangible events is shown in Chao Phraya River Delta [17]. Likewise, the reduction of sediment supply which is caused by several infrastructures in the river such as dams as well as aquaculture by using raft systems can exacerbate the increase of relative sea levels, especially in Chao Phraya River Delta [17]. Chantaburi and Walu River Delta might face the sediment budget decline like Chao Phraya River Delta; the systematic plans on sediment supply is therefore necessary. In addition, existing regulations on utilization of land must be strictly enforced by local government agencies, and industrial-related projects or other land use types should not be allowed to encroach the agricultural areas as well as mangrove areas.
To reduce sensitivity, a sub-district that experiences coastal erosion and tidal flooding, the trend of which is expected to continue severely during the rest of the 21st century, should be regularly monitored by local government agencies and corresponding programs on the maintenance of existing coastal protectors should be enhanced. However, since such measures do not cover the coastlines’ extended coastal protectors, measures such as bamboo sea-walls accompanied by mangrove planting should also be urgently required. This measure is succeeded in several provinces, especially in Samut Sakorn Province, and can trap sediment behind such walls resulting in land accretion. Mangrove reforestation and afforestation are important measures which can enhance the elevation of soil surface and stocks of fisheries and prevent effects of seawater inundation. Although mangrove has the capability to migrate to high elevation areas, the mangrove in the study areas may die because many coastal areas in the study areas are covered by infrastructure and aquaculture ponds, and especially shrimp ponds can block the landward migration of mangrove. Thereby, the local government agencies should provide the retreated areas for mangrove and the corridors for mangrove movements. In addition, national government agencies should conduct a study on the application of artificial reefs to coastal areas, including mangrove areas. This measure is implemented in coastal areas worldwide, including Rayong, Songkhla and Satun Provinces of Thailand.
Results of the survey indicated that most people engaged in fishery activities have not mobilized their new occupations during the past five years, with only few households doing more than one job. Therefore, new employment opportunities should be created to increase their incomes and capability to cope with potentially severe vulnerability. However, this may be difficult considering the fishing communities are only familiar with fishery activities [12]. Therefore, local government agencies should urgently conduct studies that aim to identify suitable alternative livelihoods in fishing communities and then train them in other livelihood options which they can do. Enhancing their knowledge on climate change adaptation is another important issue which local government agencies should promote among the communities through social activities, for example, the assembly of people during Buddhist Holy Day which are simple and effective channels that people can easily access. Local governments can work with academic institutes or universities to obtain information on climate change, such as the potential sea-level rise, its adverse effects to coastal people, coping measures, and so on. Such information can stimulate the awareness of people on the need for them to provide plans to cope with climate change-relevant impacts. In the meantime, national government agencies should find the ways and means of realizing the enforcement of aquaculture insurance to reduce the risk of farmers from income losses due to sea-level rise and its associated consequences. Integrated Coastal Management (ICM), which integrates climate change adaptation issues, is one of the important possible options for reducing and coping with climate change and its impacts [2]. The national government agencies should extend the ICM approach that operates in Chon Buri Province [37] to the study areas and study the integration of climate change issues into the ICM like other conservation efforts. ICM could be promoted as an effective management tool through the participation of local communities in management to sustain their areas.
6. Conclusions and Lessons Learned
The vulnerability concept of IPCC and [24] was adopted in this paper while climate simulation and GIS and remote sensing-relevant tools were applied to identify potential livelihood vulnerability of coastal fishing communities in four sub-districts of Laemsing District. Since this District is exposed to sea-level change and its associated consequences, especially seawater inundation, the potential inundated areas were considered as sensitive to sea-level change as well as the affected households. The capacity of households and communities to adapt to potential sea-level change was characterized in five conditions; social, human, institutional, economic, and natural conditions. The approach in this paper was hinged to the collaboration of local people and other stakeholders. It is expected that by 2050, relative sea levels will increase by approximately 50 cm from 2000 (worse case of emission scenario in AR4—A1F1—, sea level based on A1F1 is similar to RCP 2.6 in AR5) causing inundated areas by 87.77 km2 in all sub-districts. Meanwhile, the number of affected households in the affected areas would be 2060. Bangkachai will be the most vulnerable sub-district followed by Paknamlaemsing, Nongchim and Kohpred with Bangkachai and Nongchim having the highest sensitivity and adaptive capacity, respectively. Options for reducing and coping vulnerability are suggested based on each vulnerability aspect for two levels of developmental responsibility; local and national.
Since climate change-relevant issues, especially climate change adaptation, had become a major concern, sectoral government agencies in Thailand have now integrated such issues in their strategic plans, although such efforts are still in the infancy stage [18]. However, like the Philippines [7], integration of climate change adaptation in Thailand’s development plans, especially at the provincial level, is not yet adequately promoted. Furthermore, climate change problems related to seawater inundation seems to be given less priority, even if it is going to be serious problem in the near future. This paper provides plausible information related to sea-level change, seawater inundation, the capacity of people and community, and adaptation responses. Such information can promote better understanding on climate change problems, necessary for all stakeholders, especially the policy makers to enable them to mainstream effective adaptation measures into developmental plans, especially in provincial and provincial cluster and sub-district development plans.
While the approach used in this paper could be adopted for studying other areas, results of the assessment could be appropriate for use as data for planning and raising the awareness of stakeholders on how to impede and cope with sea-level change and its impacts. Therefore, there is a need to upgrade and update information. Likewise, assessment of the economic impacts of inundation and the ecological effects of sea-level rise, particularly on inland fishery and aquatic resources, are needed as well.
Acknowledgments
The authors would like to express sincere thanks to Ed Sarobol and K.R. Salin for their suggestions to improve the quality of the research, Puvadol Doydee for his suggestions on remote sensing and GIS applications, and Sulit Vigillia, Sarinda Sukarat, Wipusana Maneesuk and Sornarin Pato for providing information and support during data collection. The GIS software is granted through MyCOE/SERVIR Fellowship Program in Southeast Asia.
Author Contributions
Jirawat Panpeng and Mokbul Ahmad, both of us together formed and designed conceptual framework and research methodology, respectively. The data collection, analysis of collected data and paper writing were done by Jirawat Panpeng. Meanwhile, Mokbul Ahmad also reviewed and edited this paper.
Conflicts of Interest
The authors declare no conflict of interest.
References
- Intergovernmental Panel on Climate Change (IPCC). Climate Change 2007: Synthesis Report Contribution of Working Group I to the Forth Assessment Report of the Intergovernmental Panel on Climate Change; IPCC: Geneva, Switzerland, 2007. [Google Scholar]
- Snoussi, M.; Ouchani, T.; Niazi, S. Vulnerability Assessment of the Impact of Sea-Level Rise and Flooding on the Moroccan Coast: The Case of the Mediterranean Eastern Zone. Estuar. Coast. Shelf Sci. 2008, 77, 206–213. [Google Scholar] [CrossRef]
- IPCC. Summary for policymakers. In Climate Change 2014: Impacts, Adaptation, and Vulnerability Contribution of Working Group II to the Fifth Assessment Report of the Intergovernmental Panel on Climate Change; Cambridge University Press: Cambridge, UK, 2014. [Google Scholar]
- IPCC. Climate Change 2013: The Physical Science Basis Summary for Policymakers Contribution to Working Group I to the Fifth Assessment Report of the Intergovernmental Panel on Climate Change; IPCC: Geneva, Switzerland, 2013. [Google Scholar]
- Sales, R.F.M. Vulnerability and Adaptation of Coastal Communities to Climate Variability and Sea-Level Rise: Their Implications for Integrated Coastal Management in Cavite City Philippines. Ocean Coast. Manag. 2009, 52, 395–404. [Google Scholar] [CrossRef]
- Mcleod, E.; Poulter, B.; Hinkel, J.; Reyes, E.; Salm, R. Sea-Level Rise Impact Models and Environmental Conservation: A Review of Models and Their Applications. Ocean Coast. Manag. 2010, 53, 507–517. [Google Scholar] [CrossRef]
- Uy, N.; Takeuchi, Y.; Shaw, R. Local Adaptation for Livelihood Resilience in Albay, Philippines. Environ. Hazards 2011, 10, 139–153. [Google Scholar] [CrossRef]
- Allison, E.H.; Perry, L.A.; Badjeck, M.C.; Adger, W.N.; Brown, K.; Conway, D.; Halls, A.S.; Pilling, G.M.; Reynolds, J.D.; Andrew, N.L.; et al. Vulnerability of National Economies to the Impacts of Climate Change on Fisheries. Fish Fish. 2008, 10, 173–196. [Google Scholar] [CrossRef]
- Shah, K.U.; Dulal, H.B.; Johnson, C.; Baptiste, A. Understanding Livelihood Vulnerability to Climate Change: Applying the Livelihood Vulnerability Index in Trinidad and Tobago. Geoforum 2013, 47, 125–137. [Google Scholar] [CrossRef]
- Dow, K.; Downing, T.E. The Atlas of Climate Change: Mapping the World’s Greatest Challenge; Earthscan: London, UK, 2006. [Google Scholar]
- Nicholls, R.J.; Wong, P.P.; Burkett, V.R.; Codignotto, J.O.; Hay, J.E.; McLean, R.F.; Ragoonaden, S.; Woodroffe, C.D. Coastal Systems and Low-Lying Areas. In Change 2007: Impacts Adaptation and Vulnerability Contribution of Working group II to the Fourth Assessment Report of the Intergovernmental Panel on Climate Change; Parry, M.L., Canziani, O.F., Palutikof, J.P., Linden, P.J., Hanson, C.E., Eds.; Cambridge University Press: Cambridge, UK, 2007; pp. 316–347. [Google Scholar]
- Cinner, J.E.; McClanahan, T.R.; Graham, N.A.J.; Daw, T.M.; Stead, S.M.; Wamukota, A.; Brown, K.; Bodin, O. Vulnerability of Coastal Communities to Key Impacts of Climate Change on Coral Reef Fisheries. Glob. Environ. Chang. 2012, 22, 12–20. [Google Scholar] [CrossRef]
- Neelasri, K. Global Warming and Sea-Level Change in the Water Body of Thailand; Hydrographic Department, Royal Thai Navy: Bangkok, Thailand, 2008. (In Thai)
- Mimura, M. Chapter 2: State of the Environment in the Asia and Pacific Coastal Zones and Effects of Global Change. In Global Change and Integrated Coastal Management: The Asia-Pacific Region; Harvey, N., Ed.; Springer: Dordrecht, The Netherlands, 2006; p. 19. ISBN 978-1-4020-3628-6. (e-book). [Google Scholar]
- Southeast Asia START. Preparation of Climate Change Scenarios for Climate Change Impact Assessment in Thailand; Southeast Asia START Regional Center: Bangkok, Thailand, 2010. [Google Scholar]
- Trisirisatayawong, I.; Naeije, M.; Simons, W.; Fenoglio-Marc, L. Sea Level Change in the Gulf of Thailand from GPS-Corrected Tide Gauge Data and Multi-Satellite Altimetry. Glob. Planet. Chang. 2011, 76, 137–151. [Google Scholar] [CrossRef]
- Lovelock, C.E.; Cahoon, D.R.; Friess, D.A.; Guntenspergen, G.R.; Krauss, K.W.; Reef, R.; Rogers, K.; Saunders, M.L.; Sidik, F.; Swales, A.; et al. The Vulnerability of Indo-Pacific Mangrove Forests to Sea-Level Rise. Nature 2015, 526, 559–563. [Google Scholar] [CrossRef] [PubMed]
- Ketsomboon, B.; von der Dellen, K. Climate Vulnerability and Capacity Analysis Report South of Thailand: Building Coastal Resilience to Reduce Climate Change Impact in Thailand and Indonesia; CARE Deutschland-Luxemburg e.V. in cooperation with Raks Thai Foundation: Bangkok, Thailand, 2013. [Google Scholar]
- Natural Resources and Environment Policy and Planning (NREPP). Thailand’s Second National Communication under the United Nations Framework Convention on Climate Change; Ministry of Natural Resources and Environment: Bangkok, Thailand, 2011.
- Yoo, G.; Hwang, J.H.; Choi, C. Development and Application of a Methodology for Vulnerability Assessment of Climate Change in Coastal Cities. Ocean Coast. Manag. 2011, 54, 524–534. [Google Scholar] [CrossRef]
- Younus, A.F.; Harvey, N. Community-Based Flood Vulnerability and Adaptation Assessment: A Case Study from Bangladesh. J. Environ. Assess. Policy Manag. 2013, 15, 32. [Google Scholar] [CrossRef]
- Chanthaburi Office. Chanthaburi Provincial Development Plan 2014–2017; Chanthaburi Government: Chanthaburi, Thailand, 2013. (In Thai)
- Department of Marine and Coastal Resources (DMCR). Management on Coastal Erosion in Thailand; DMCR: Bangkok, Thailand, 2011. (In Thai)
- Eakin, H.; Luers, A.L. Assessing the Vulnerability of Social-Environmental Systems. Annu. Rev. Environ. Resour. 2006, 31, 365–394. [Google Scholar] [CrossRef]
- Glick, P.; Stein, B.A.; Edelson, N.A. Scanning the Conservation Horizon: A Guide to Climate Change Vulnerability Assessment; National Wildlife Federation: Washington, DC, USA, 2011. [Google Scholar]
- Vincent, K. Uncertainty in Adaptive Capacity and the Importance of Scale. Glob. Environ. Chang. 2007, 17, 12–24. [Google Scholar] [CrossRef]
- Adger, W.N. Social Vulnerability to Climate Change and Extreme in Coastal Vietnam. World Dev. 1999, 27, 249–269. [Google Scholar] [CrossRef]
- Wall, E.; Marzall, K. Adaptive Capacity for Climate Change in Canadian Rural Communities. Local Environ. 2006, 11, 373–397. [Google Scholar] [CrossRef]
- Daze, A.; Ambrose, K.; Ehrhart, C. Climate Vulnerability and Capacity Analysis: Handbook. 2009. Available online: http://www.care.org/sites/default/files/documents/CC-2009-CARE_CVCAHandbook.pdf (accessed on 5 November 2015).
- Yamane, T. Statistics: An Introductory Analysis, 2nd ed.; Harper and Row: New York, NY, USA, 1973. [Google Scholar]
- IPCC. Climate Change 2001: Impacts Adaptation and Vulnerability Contribution of Working Group II to the Third Assessment Report of the Intergovernmental Panel on Climate Change; Cambridge University Press: Cambridge, UK, 2001. [Google Scholar]
- United Nations Development (UNDP). Adaptation Policy Frameworks for Climate Change: Developing Strategies Policies and Measures; Cambridge University Press: Cambridge, UK, 2005. [Google Scholar]
- CLIMsystems. SimCLIM Essentials Training Book Version 2.0; CLIMsystems Limited: Hamilton, New Zealand, 2011. [Google Scholar]
- Coastal Service Center. Method Description: Detailed Methodology for Mapping Sea Level Rise Inundation. 2012. Available online: http://coast.noaa.gov/slr/assets/pdfs/Inundation_Methods.pdf (accessed on 19 April 2014).
- Massachusetts Office of Coastal Zone Management. Sea Level Rise: Understanding and Applying Trends and Future Scenarios for Analysis and Planning; Massachusetts Office of Coastal Zone Management: Boston, MA, USA, 2013.
- Hydrographic Department. Data of Sea Level in Laemsing District, Chanthaburi Province; Hydrographic Department, Royal Thai Navy: Bangkok, Thailand, 2014. (In Thai)
- Tunkijjanukij, S.; Khunplome, V.; Thimkrajang, C. Roles of Academic Institutes in Integrated Coastal Management (ICM) in Chonburi Province, Thailand. In Proceedings of the International Symposium on Integrated Coastal Management for Marine Biodiversity in Asia, Kyoto, Japan, 14–15 January 2010. [Google Scholar]
Figure 1.
The study area. Source: Landsat imagery provided by U.S. Geological Survey.

Figure 2.
Elevation maps of the study area extracted from digital elevation data (DEM): color showing areas equal to or lower than 0.50 m (a); color showing areas equal to or lower than 1 m (b). Source: DEM was provided by Land Development Department (LDD), Thailand.
Figure 2.
Elevation maps of the study area extracted from digital elevation data (DEM): color showing areas equal to or lower than 0.50 m (a); color showing areas equal to or lower than 1 m (b). Source: DEM was provided by Land Development Department (LDD), Thailand.
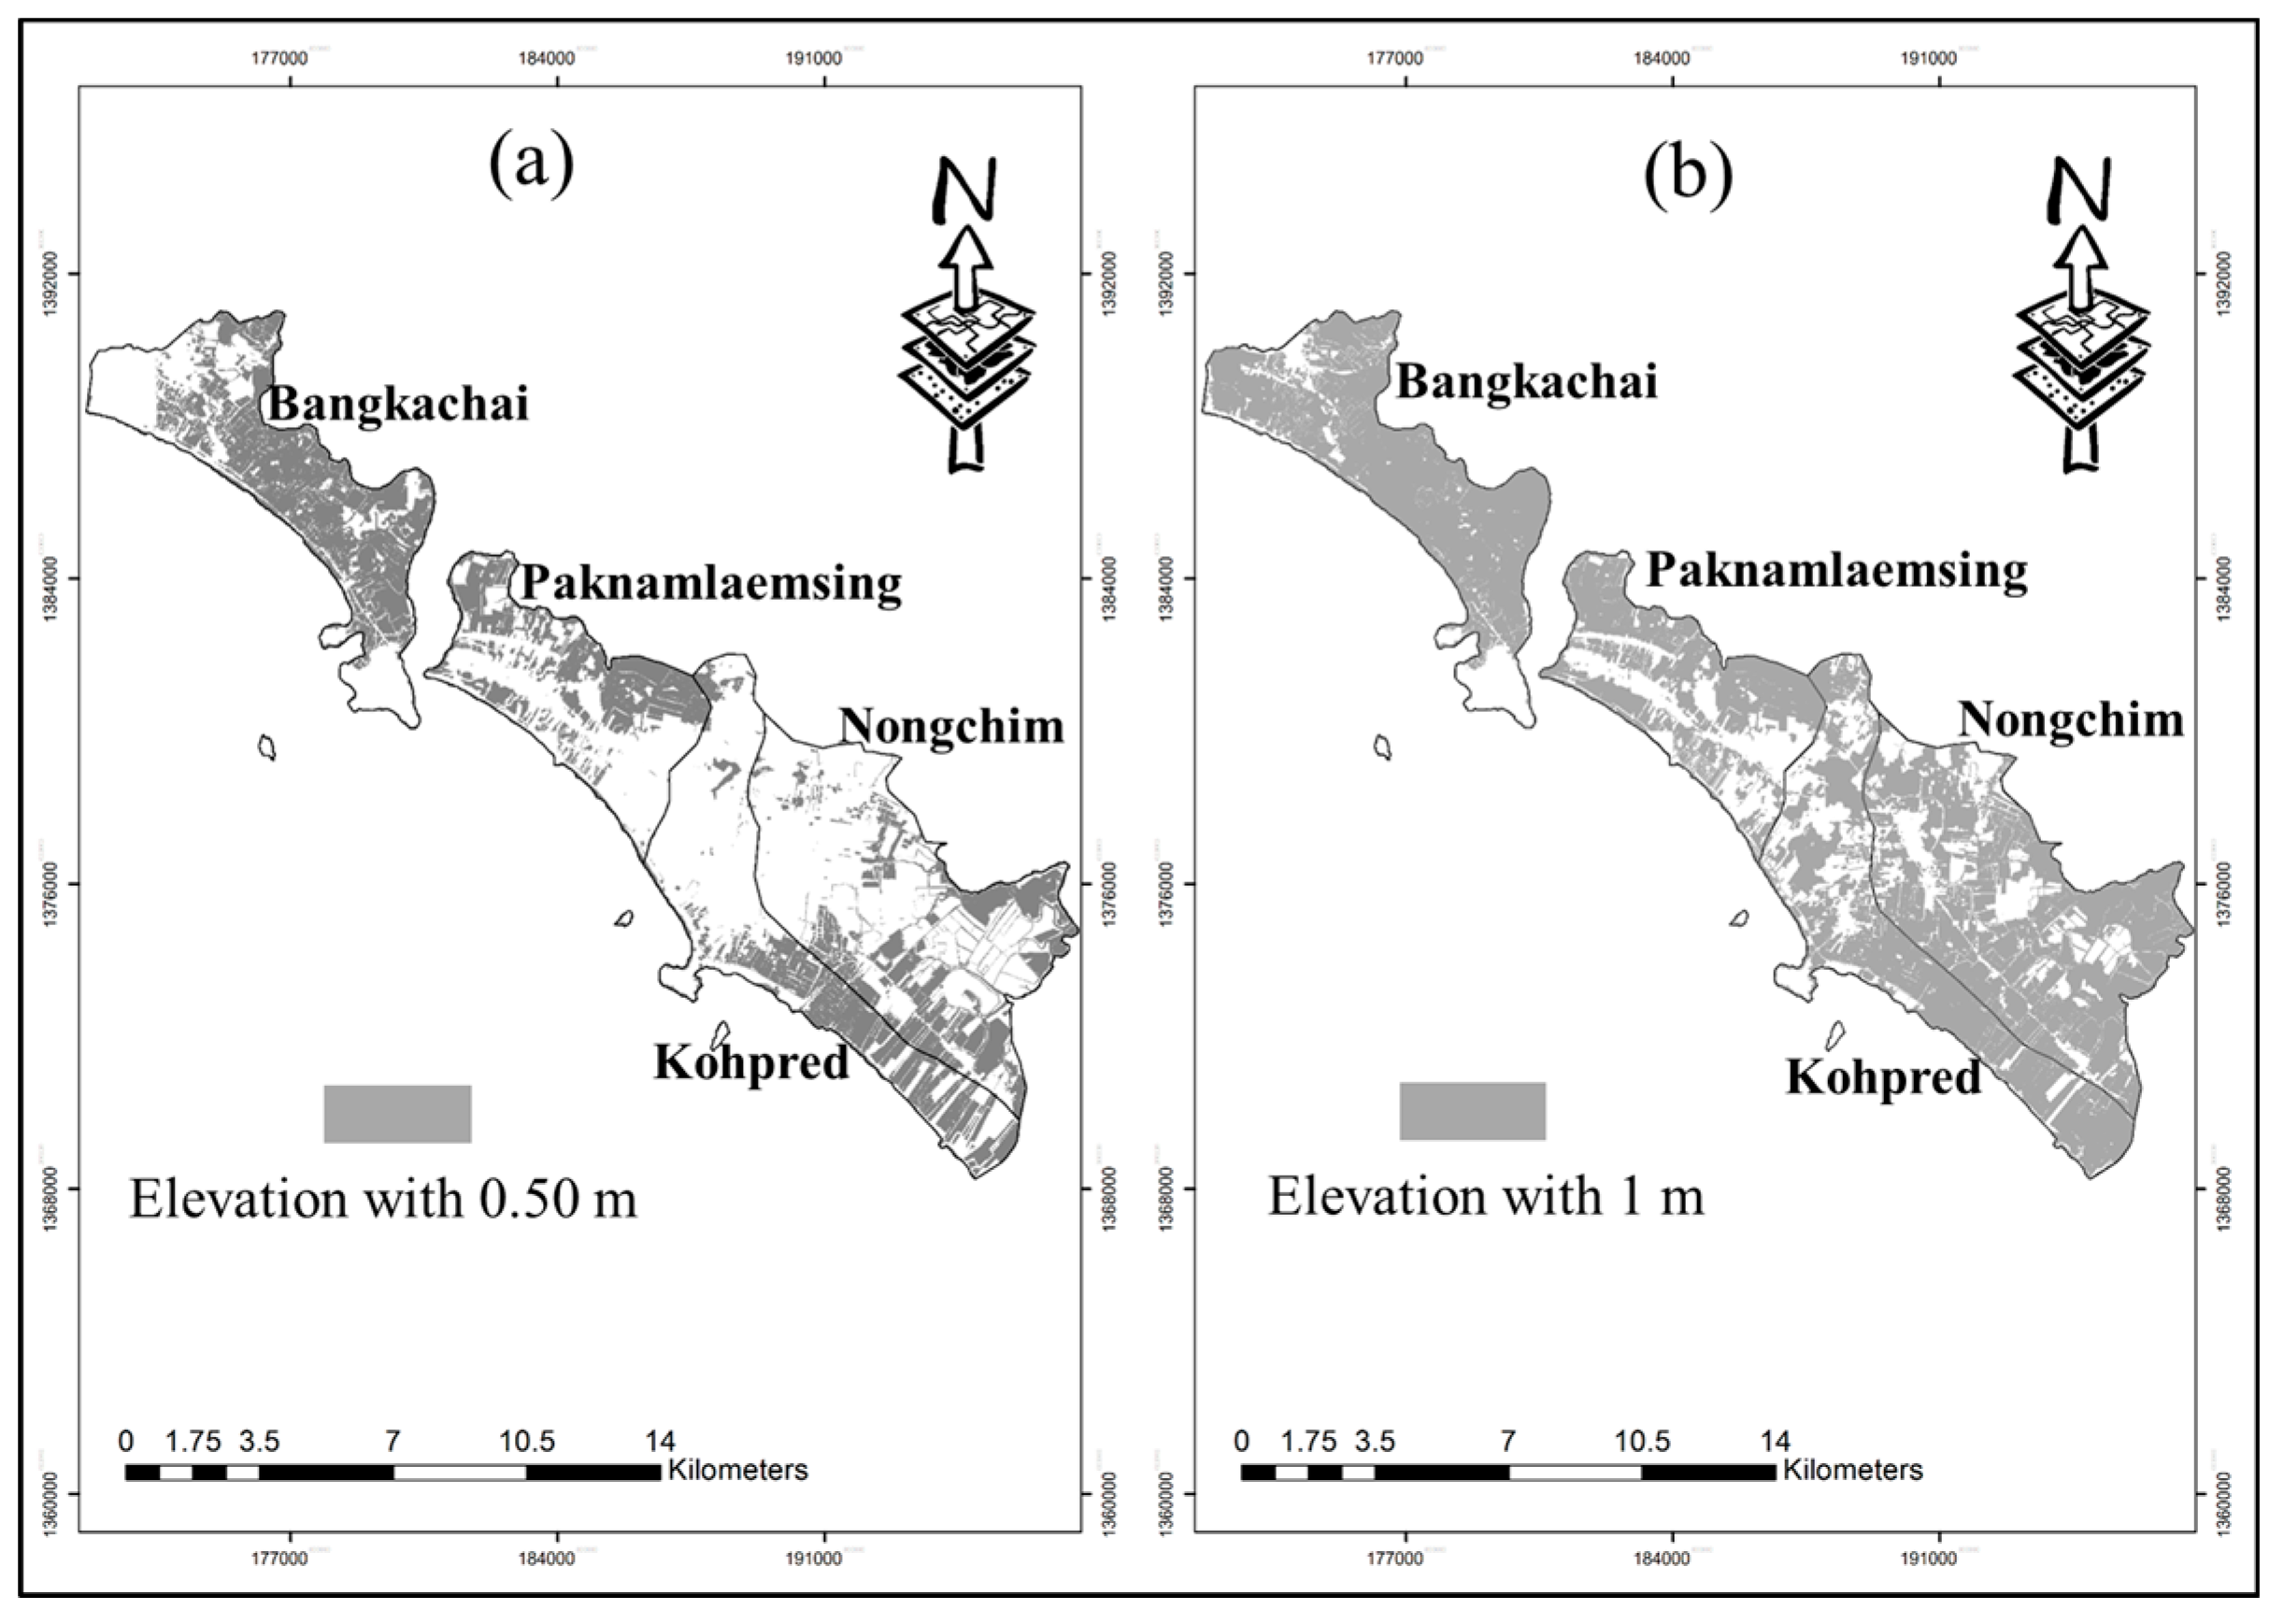
Figure 3.
Types of land use in the study area in 2010. Source: LDD, Thailand.
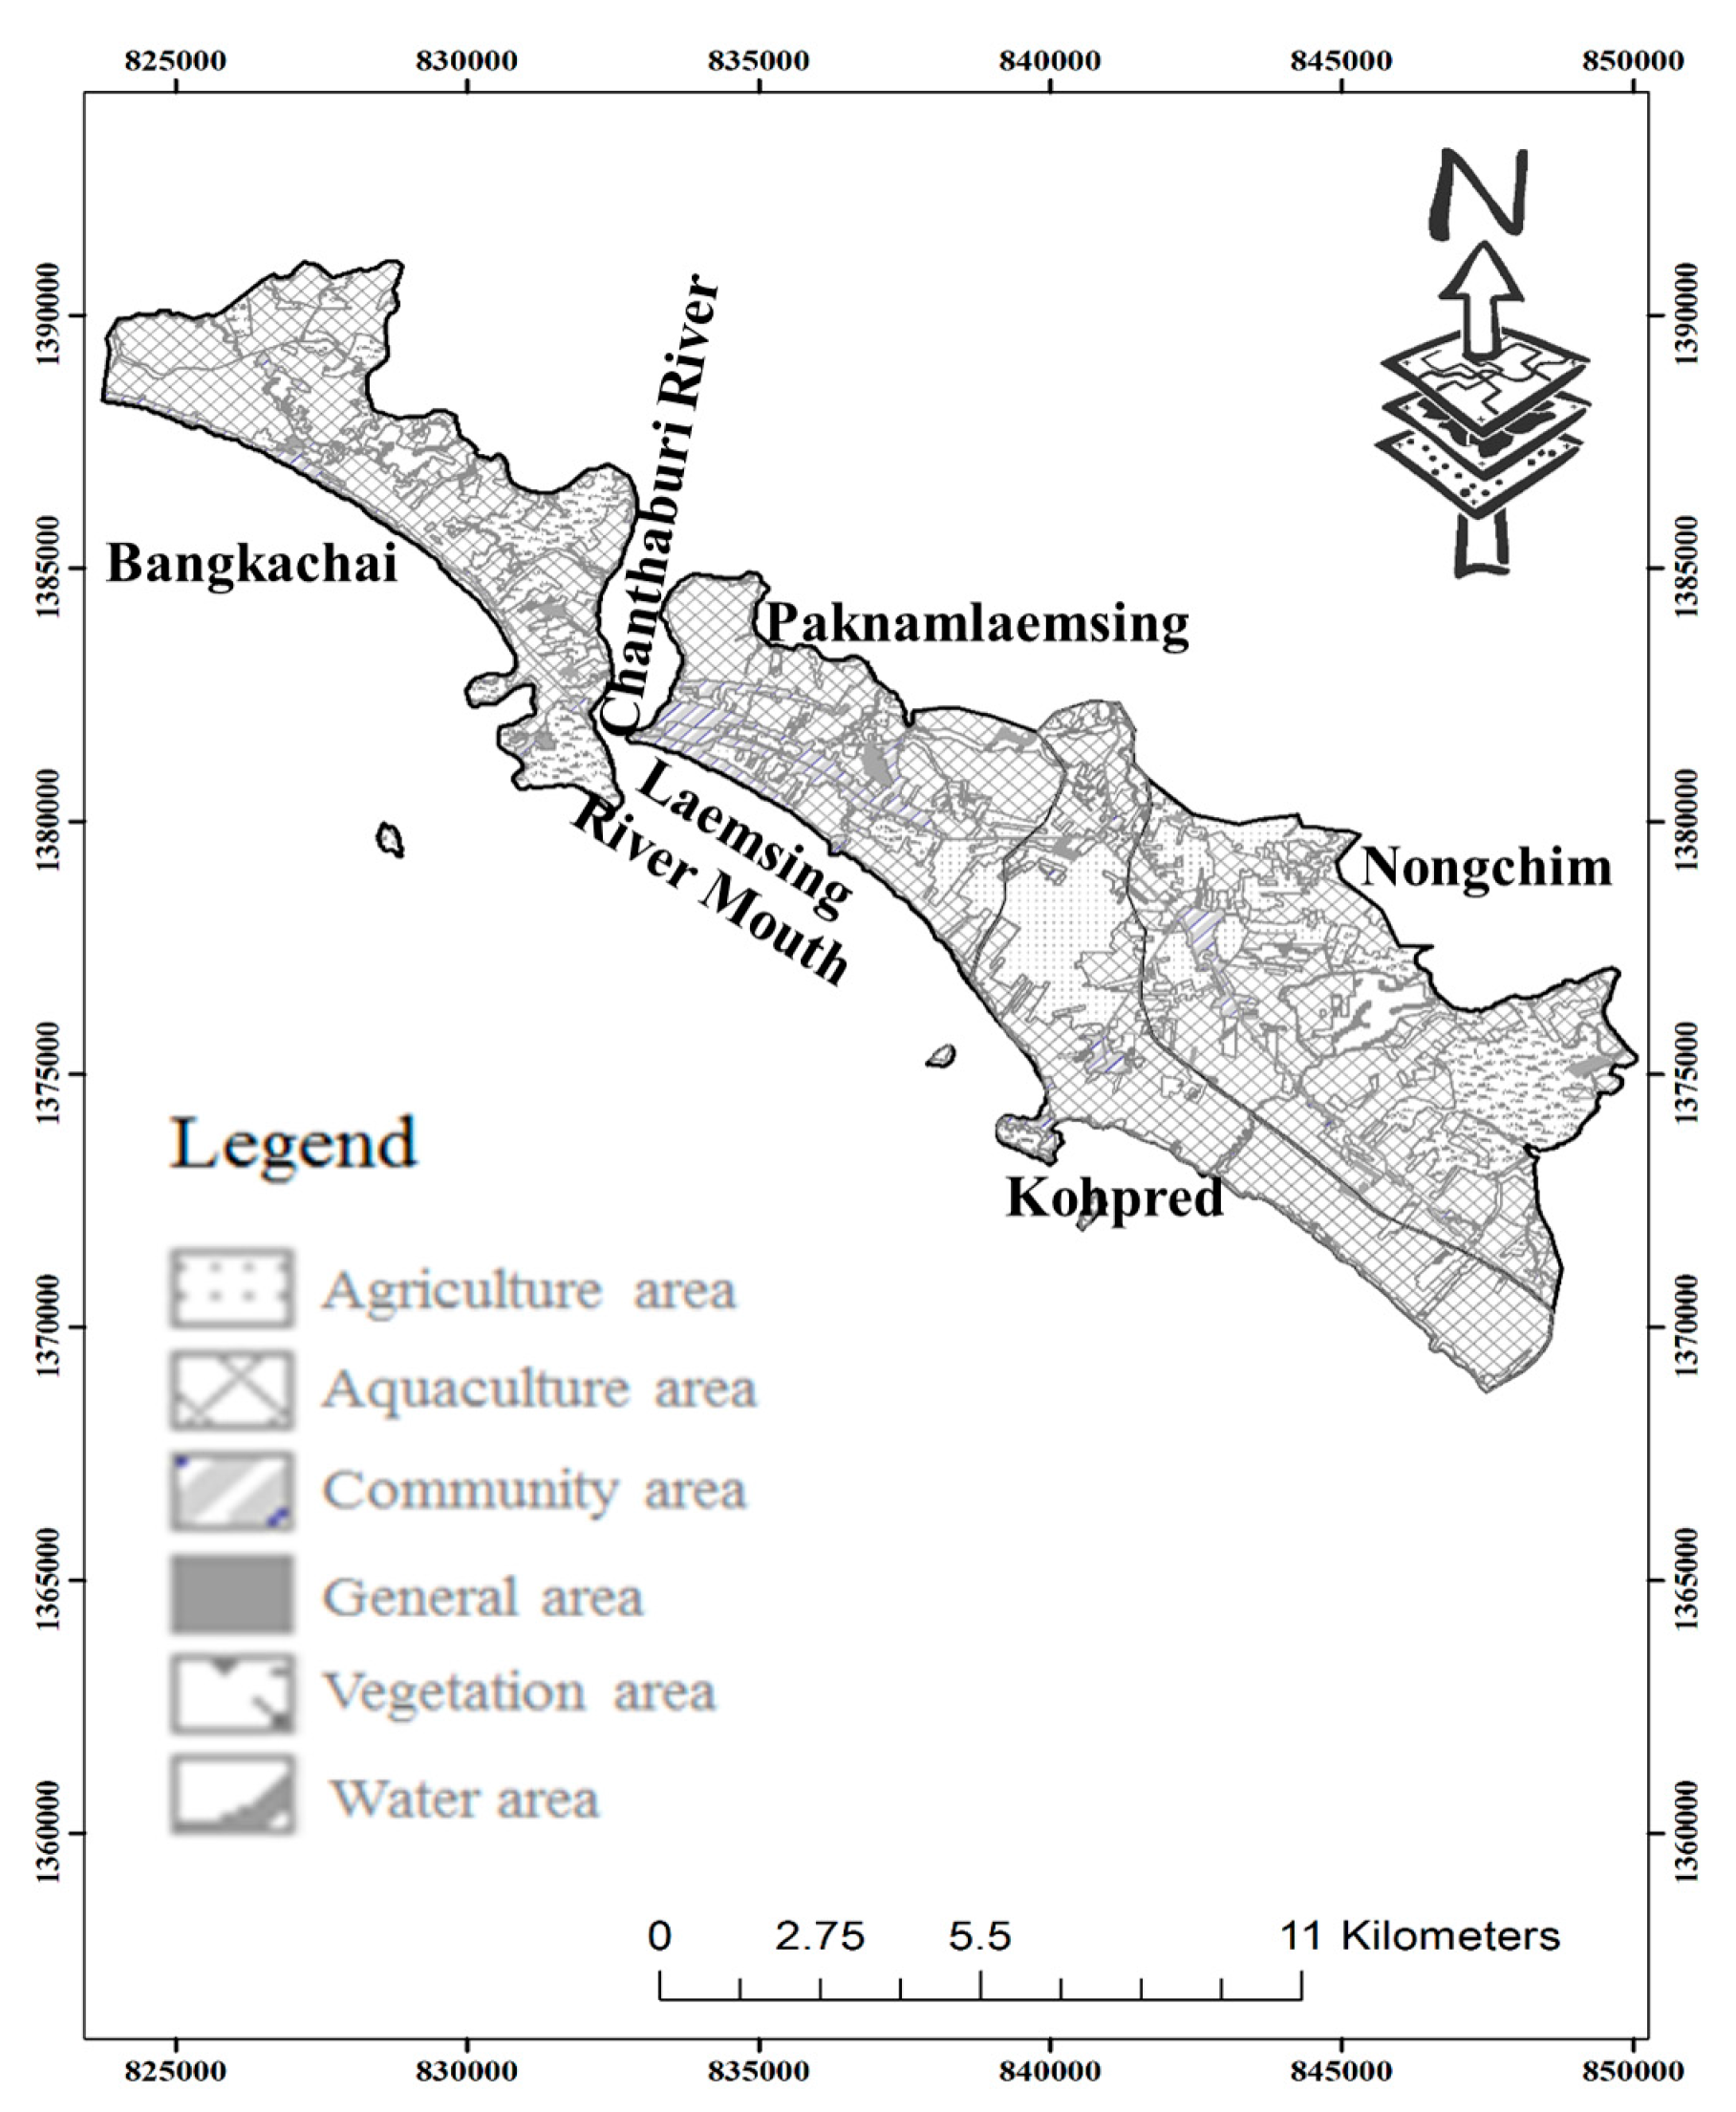
Figure 4.
The conceptual framework.

Figure 5.
Inundation-mapping process used for the research. Source: Adapted from the approach of National Oceanic and Atmospheric Administration.
Figure 5.
Inundation-mapping process used for the research. Source: Adapted from the approach of National Oceanic and Atmospheric Administration.
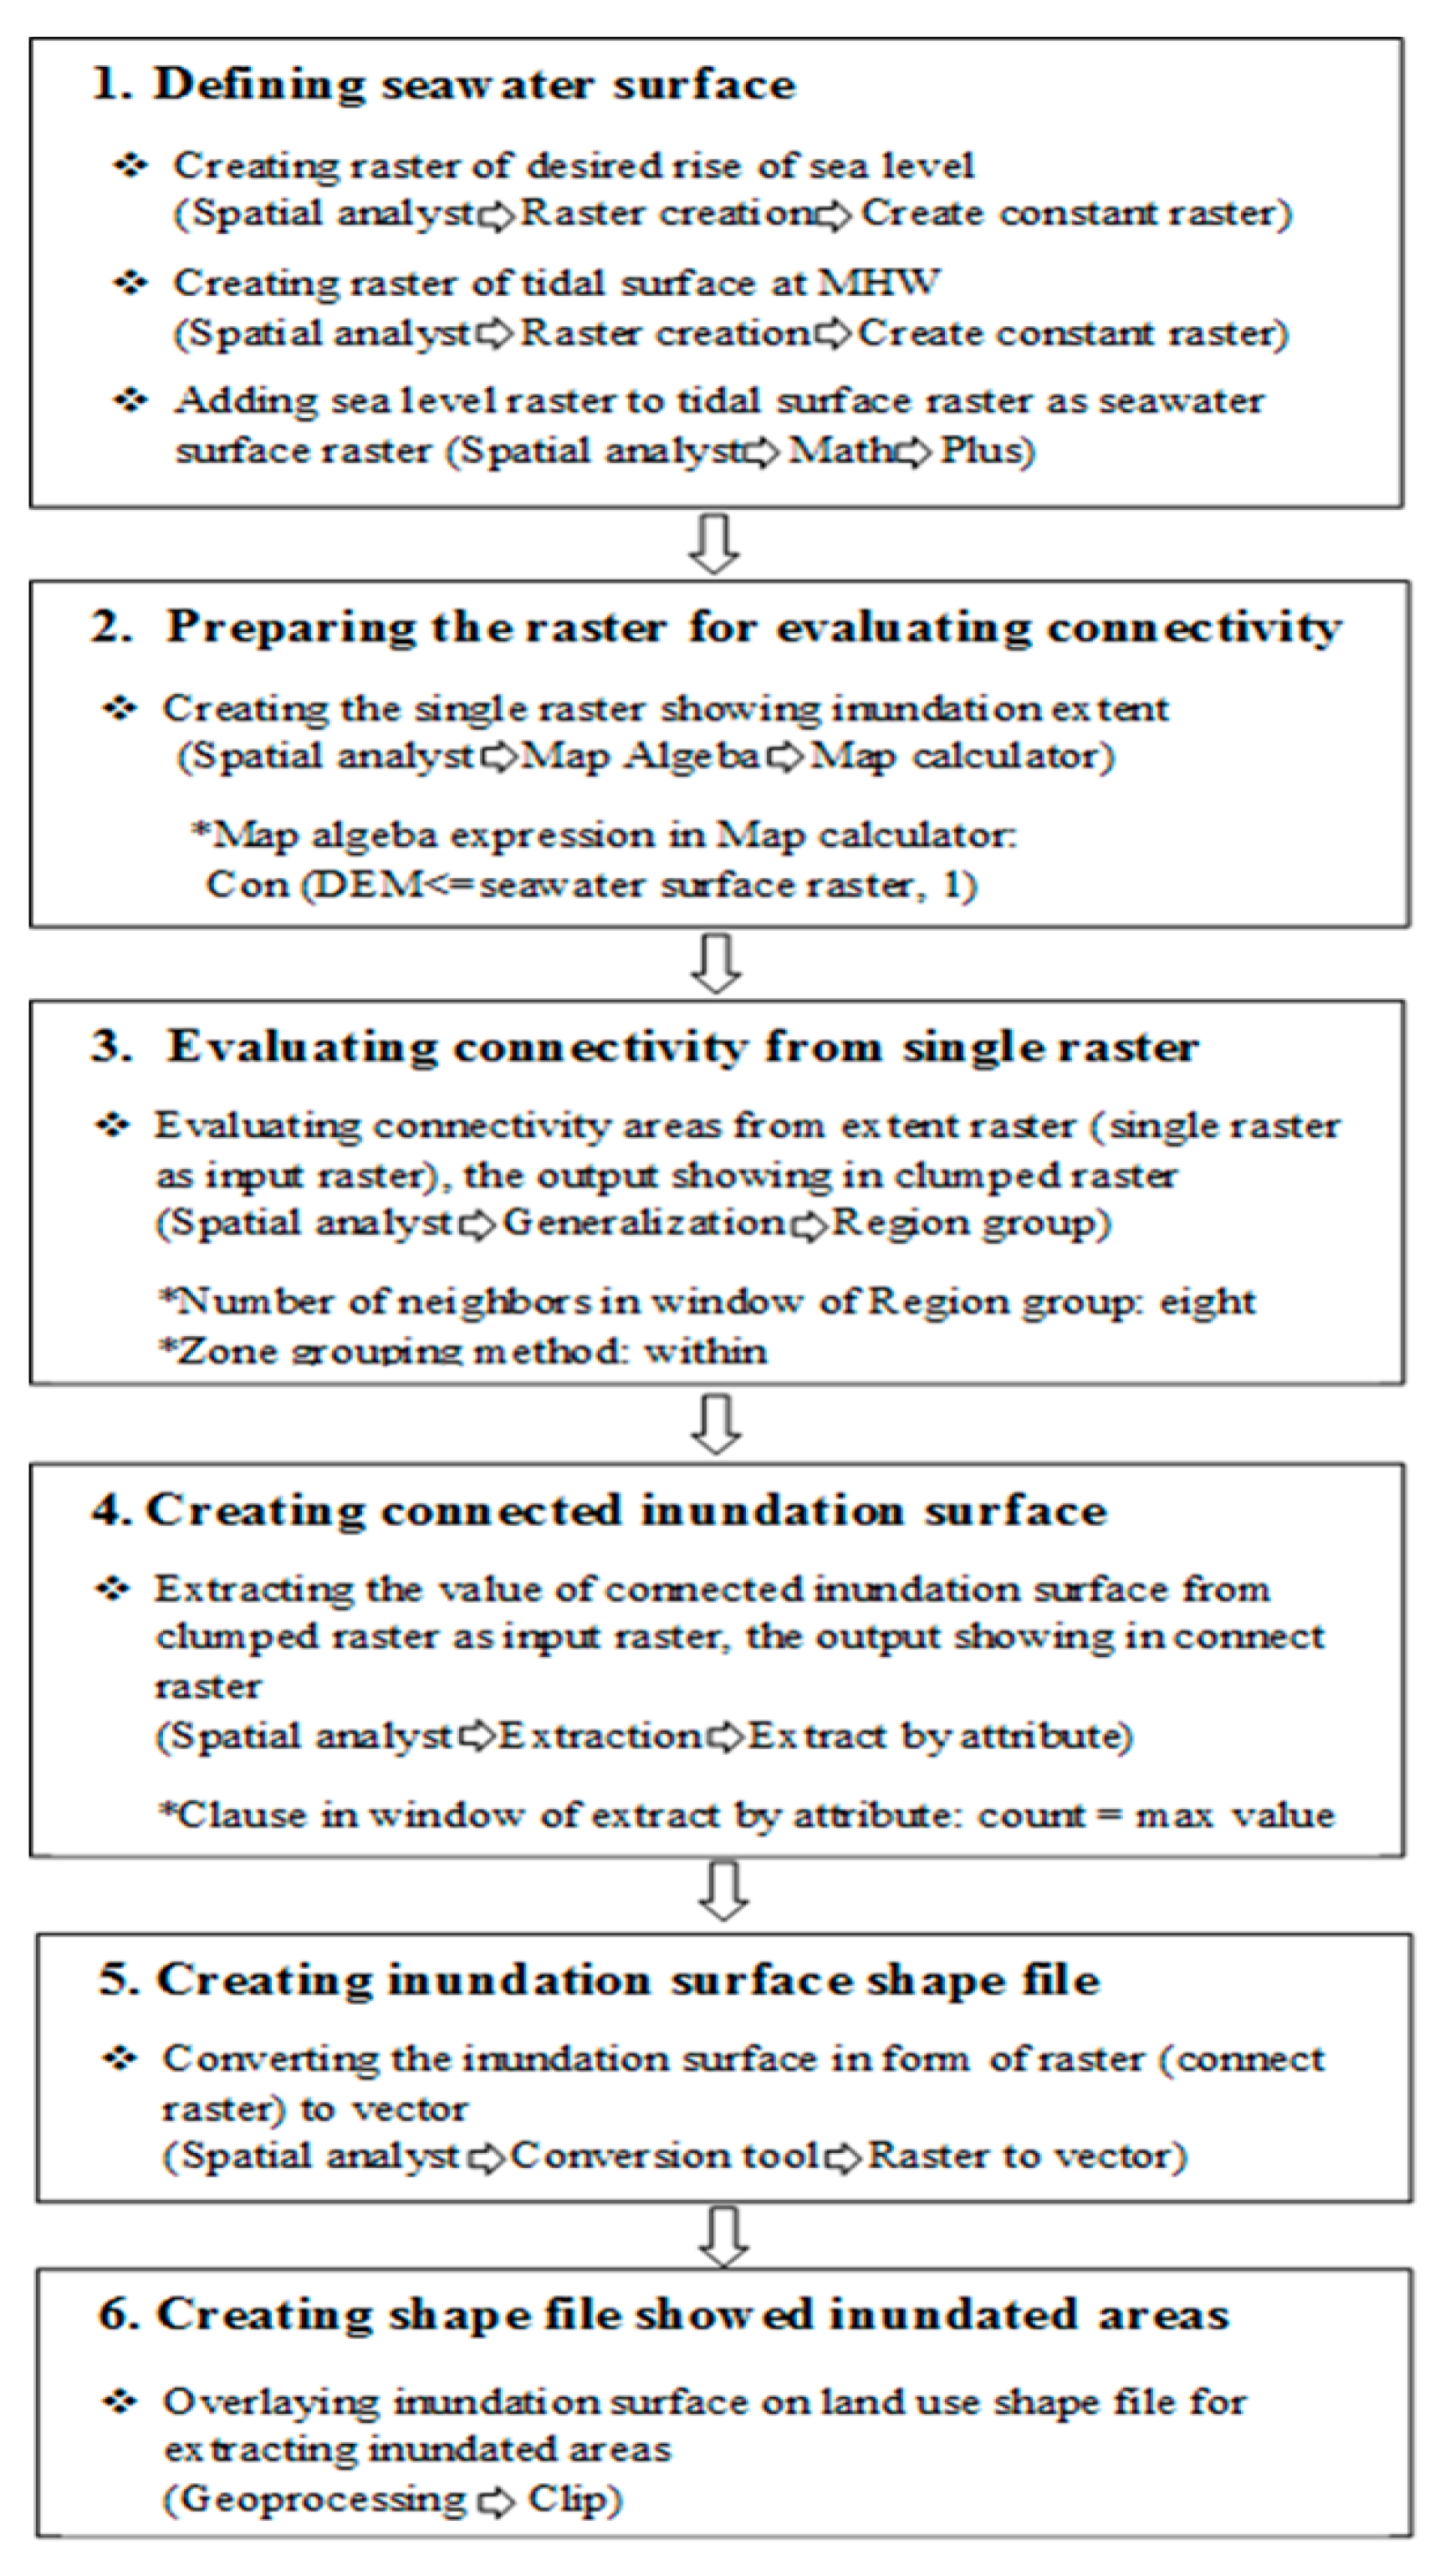
Figure 6.
Numerical vulnerability on adaptive capacity (first number), sensitivity (second number) and overall vulnerability (third number), in each sub-district. Note: Size of bubbles showing the scores of overall vulnerability. Score of vulnerability on exposure is 1 in each sub-district.
Figure 6.
Numerical vulnerability on adaptive capacity (first number), sensitivity (second number) and overall vulnerability (third number), in each sub-district. Note: Size of bubbles showing the scores of overall vulnerability. Score of vulnerability on exposure is 1 in each sub-district.

Figure 7.
Characteristics of sea levels in each month during 1990–2001. Source: [36].
Figure 7.
Characteristics of sea levels in each month during 1990–2001. Source: [36].
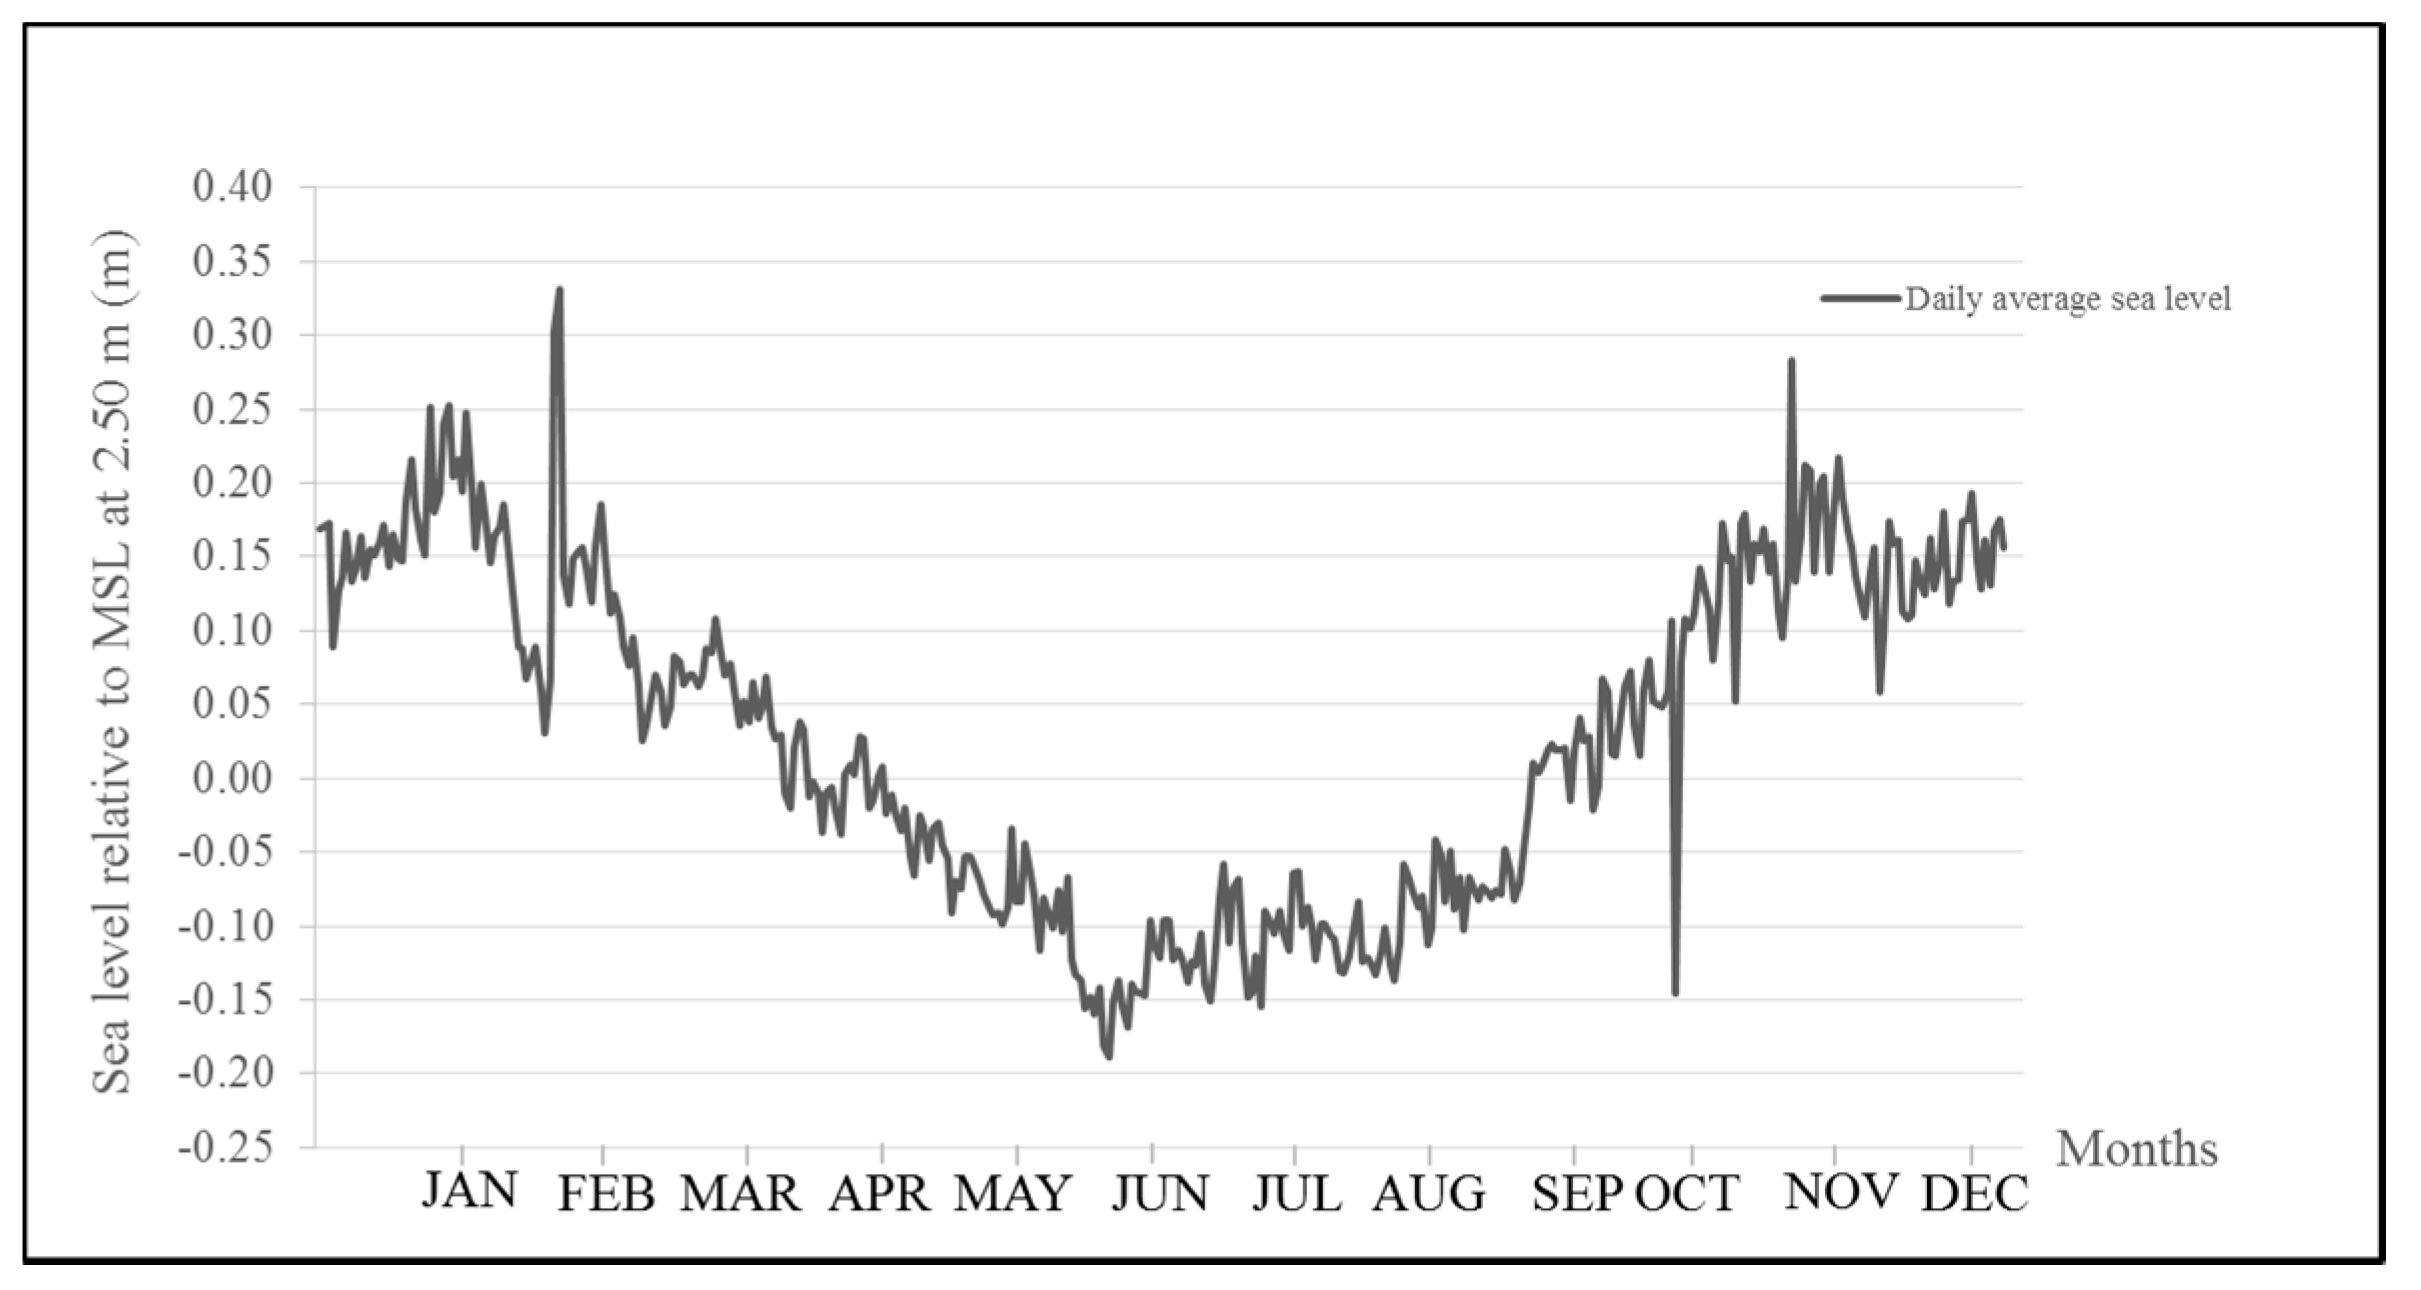
Figure 8.
Inundation maps in the year 2050 associated with A1F1. Source: Only land use map was provided by LDD, Thailand.
Figure 8.
Inundation maps in the year 2050 associated with A1F1. Source: Only land use map was provided by LDD, Thailand.

Figure 9.
Parameters for measuring the adaptive capacity of each sub-district.


Table 1.
Input parameters for calculating numerical vulnerability.
| Aspects | Proxies | Sources |
|---|---|---|
| Exposure | Potential sea-level change | Analyzed by using climate software provided by SimCLIM company |
| Sensitivity | Land loss and affected households due to potential seawater inundation | Analyzed by using GIS tool |
| Adaptive capacity | ||
| Social condition | Number of times household heads participated in community activities, in one year | Questionnaire |
| Human condition | per cent of people in households having non- dependency rate (age 15–65 years old) | Questionnaire |
| per cent of people in households completed years of schooling (nine years) | Questionnaire | |
| Institutional condition | Number of climate or hazard-coping plans or activities of each study area | Questionnaire and interview |
| Economic condition | Numbers of households having more than one job | Questionnaire |
| Average income of households | Questionnaire | |
| Ownership of land areas by households | Questionnaire | |
| Natural condition | Mangrove areas | Assessing the areas from land use shape file provided by LDD, Thailand, by using GIS |
Table 2.
Prediction on sea-level change (cm) in years of interest relative to 2000, for both greenhouse gas emission scenarios and Goddard Institute for Space Studies model EH (GISS-EH). Source: Calculated by using SIMCLIM Software.
Table 2.
Prediction on sea-level change (cm) in years of interest relative to 2000, for both greenhouse gas emission scenarios and Goddard Institute for Space Studies model EH (GISS-EH). Source: Calculated by using SIMCLIM Software.
| Years of Interest | Low Sensitivity | Median Sensitivity | High Sensitivity | |||
|---|---|---|---|---|---|---|
| A1F1 | B1 | A1F1 | B1 | A1F1 | B1 | |
| 2000 | 0 | 0 | 0 | 0 | 0 | 0 |
| 2020 | 16.90 | 16.55 | 18.18 | 17.87 | 19.44 | 19.21 |
| 2030 | 25.57 | 24.82 | 28.19 | 27.24 | 30.80 | 29.64 |
| 2040 | 34.35 | 33.09 | 38.81 | 36.81 | 43.28 | 40.53 |
| 2050 | 43.23 | 41.33 | 50.05 | 46.57 | 56.88 | 51.79 |
Table 3.
Land loss in all sub-districts for four years of interest (km2) relative to 2000 for inundation associated with A1F1.
Table 3.
Land loss in all sub-districts for four years of interest (km2) relative to 2000 for inundation associated with A1F1.
| Sub-Districts | Inundated Areas | |||
|---|---|---|---|---|
| 2020 | 2030 | 2040 | 2050 | |
| Nongchim | 15.13 | 17.98 | 19.77 | 30.43 |
| Kohpred | 7.67 | 8.29 | 15.28 | 18.45 |
| Paknamlaemsing | 9.53 | 10.12 | 10.55 | 12.59 |
| Bangkachai | 18.34 | 19.26 | 20.24 | 26.31 |
| Total | 50.67 | 55.65 | 65.83 | 87.77 |
Table 4.
Loss of land use (km2) attributed to inundation in 2050.
| Sub-Districts | Aquaculture Areas | Vegetation Areas | Water Areas | Community Areas | General | Total |
|---|---|---|---|---|---|---|
| Nongchim | 17.79 | 4.46 | 2.18 | 0.22 | 3.78 | 30.43 (35%) |
| Kohpred | 13.25 | 0.02 | 1.05 | 0.12 | 4.01 | 18.45 (21%) |
| Paknamlaemsing | 8.81 | 0.29 | 1.86 | 1.13 | 0.49 | 12.59 (14%) |
| Bangkachai | 16.82 | 4.57 | 3.66 | 0.95 | 0.32 | 26.31 (30%) |
| Total | 56.67 (65%) | 11.34 (13%) | 8.75 (10%) | 2.42 (3%) | 8.60 (9%) | 87.77 (100%) |
Note: Number in parentheses referring to percentage of inundated areas to the total areas of inundation of the study area.
Table 5.
Projected number of households at risk from inundation associated with A1F1.
| Sub-Districts | Affected Households Due to Inundation | |||
|---|---|---|---|---|
| 2020 | 2030 | 2040 | 2050 | |
| Nongchim | 80 | 124 | 161 | 272 |
| Kohpred | 46 | 67 | 115 | 163 |
| Paknamlaemsing | 331 | 408 | 468 | 860 |
| Bangkachai | 375 | 436 | 472 | 765 |
| Total | 832 | 1035 | 1216 | 2060 |
Table 6.
Possible options to alleviate vulnerability.
| Local | National | |||
|---|---|---|---|---|
| Vulnerability aspects | Exposure | Urgent |
|
|
| Medium | - |
| ||
| Sensitivity | Urgent |
|
| |
| Medium |
|
| ||
| Adaptive capacity | Urgent |
|
| |
| Medium |
|
|
© 2017 by the authors. Licensee MDPI, Basel, Switzerland. This article is an open access article distributed under the terms and conditions of the Creative Commons Attribution (CC BY) license (http://creativecommons.org/licenses/by/4.0/).
Share and Cite
MDPI and ACS Style
Panpeng, J.; Ahmad, M.M. Vulnerability of Fishing Communities from Sea-Level Change: A Study of Laemsing District in Chanthaburi Province, Thailand. Sustainability 2017, 9, 1388. https://doi.org/10.3390/su9081388
AMA Style
Panpeng J, Ahmad MM. Vulnerability of Fishing Communities from Sea-Level Change: A Study of Laemsing District in Chanthaburi Province, Thailand. Sustainability. 2017; 9(8):1388. https://doi.org/10.3390/su9081388
Chicago/Turabian StylePanpeng, Jirawat, and Mokbul Morshed Ahmad. 2017. "Vulnerability of Fishing Communities from Sea-Level Change: A Study of Laemsing District in Chanthaburi Province, Thailand" Sustainability 9, no. 8: 1388. https://doi.org/10.3390/su9081388
Note that from the first issue of 2016, this journal uses article numbers instead of page numbers. See further details here.