Effects of Biochar Application on CO2 Emissions from a Cultivated Soil under Semiarid Climate Conditions in Northwest China

1
State Key Laboratory of Soil Erosion and Dryland Farming on the Loess Plateau, Northwest A&F University, Yangling 712100, China
2
College of Natural Resources and Environment, Northwest A&F University, Yangling 712100, China
*
Authors to whom correspondence should be addressed.
Sustainability 2017, 9(8), 1482; https://doi.org/10.3390/su9081482
Submission received: 8 June 2017
/
Revised: 27 July 2017
/
Accepted: 16 August 2017
/
Published: 21 August 2017
Abstract
:Biochar amendments to soil have potential as a climate change mitigation strategy. However, their effect on carbon exchange in different ecosystems has not been well evaluated. Understanding how biochar affects carbon exchange from agricultural soil is essential for clarifying the contribution of biochar management to the carbon budget. We performed a laboratory and a two-year field experiment to investigate the short- and medium-term effects of biochar application on CO2 emissions from semiarid farmland. There was no statistically significant alteration in the cumulative CO2 emissions from the mixture of soil with biochar alone, while the emissions increased significantly with additional nitrogen amendment over the 46-day experimental period. Over the two-year experimental period, the cumulative CO2 emissions from the field experiment decreased in the biochar-amended treatment, and the effects were significant at high application rates (20 and 30 t·ha−1) relative to the control in the MS. The seasonal CO2 dynamics were strongly dependent on soil temperature, with a higher correlation with the temperature at a depth of 10cm than with the temperature at a depth of 0cm. Soil temperature, rather than soil water content, was the major environmental factor controlling the soil carbon exchange in the semiarid farmland of the Loess Plateau. In general, biochar additions enhanced aboveground dry matter accumulation in both the early and late stages of maize growth. The results suggested that biochar amendment was a preferable management practice to help maintain or increase carbon sequestration for this region with lower CO2 emissions and higher dry matter production over a longer period.
1. Introduction
Carbon dioxide (CO2), as a potent greenhouse gas (GHG), is responsible for global climate change due to an increasing concentration in the atmosphere. Intensive agriculture is another contributor to the increase in GHGs [1]. Biochar, as a key technology, has been widely added to farmland soils to moderate global climate change. Produced by the thermochemical conversation of organic residues in an oxygen-limited environment [2], biochar is highly resistant to degradation due to recalcitrant carbon, and it has the potential to improve soil quality [3]. The addition of biochar has been documented to alter the soil porosity, moisture content, pH, labile C and N pool sizes, which would markedly impact soil CO2 emissions [4,5]. However, previous studies have shown that biochar addition with different rawmaterials and different soil textures can have different effects (an increase, decrease or no effect) on the CO2 flux in the laboratory or field experiments [6,7,8]. Additionally, the underlying mechanism of CO2 emissions induced by the addition of biochar is still not fully understood.
Due to biotic or abiotic processes, biochar can be mineralized over a period of days to years after its incorporation into soils [9], which can affect the native soil organic carbon dynamics. However, the mechanism is not clear and needs further investigation [10]. Some studies have shown that biochar addition could stimulate the mineralization of soil organic carbon (SOC) [11,12] and correspondingly increase emissions of CO2. However, conversely, the suppression of SOC mineralization was also reported [13,14], thereby causing a decrease in CO2 emissions. The interactions of biochar and soil properties contribute to the different processes of SOC mineralization [11]. Notably, soil microbes and the native soil C availability were demonstrated to affect soil C mineralization [9,15]. The improvement of microbial growth by the small fraction of labile C in biochar and nutrients provided by biochar would stimulate an increase in SOC mineralization, which is known as a positive priming effect. In contrast, a negative priming effect was observed in the SOC mineralization at month to year timescales due to the protection induced by biochar, in which C was absorbed onto the surface or into the pores of biocha [16], thereby decreasing SOC mineralization. Therefore, it is important to clarify the changes in soil C mineralization and the variation in the behavior of biochar after its incorporation into the soils.
To meet the demand for increasing crop yields, inorganic nitrogen (N) fertilization, especially urea, is being intensively used. Undoubtedly, N input can cause a fluctuation in soil microbes and native soil nutrient availability [17]. The high N utilization efficiency, stimulated by N application associated with biochar [18], was attributed to mineral nutrient retention or biological fixation. In addition, N application can affect biochar stability and SOC mineralization. Peer-reviewed reports have demonstrated that N application could change microbial growth and affect soil C mineralization [19], increasing or decreasing [20] SOC mineralization. Ding et al. [21] found that N fertilization could decrease cumulative CO2 emissions during maize growth periods. However, an increase CO2 emission was observed in a long-term maize-wheat cropping system study conducted by Dhadli and Brar [22]. After the application of biochar to the soil, C mineralization induced by microbes appeared in a short time [23], and this process could be affected when N was incorporated in the biochar-amended soil due to the improvement of soil microbial biomass stimulated by N application [24]. Conversely, the decrease in microbial activity was observed in the soil amended with biochar and N fertilization was most likely due to a decrease in soil pH [25]. Thus, the release of CO2 from soil C mineralization affected by the association of biochar and N addition should be well investigated.
In this study, we performed two experiments to investigate the effects of biochar addition on CO2 emissions from semiarid farmland in a region in northwestern China. The incubation experiment aimed to investigate the short-term effects of biochar application in a semiarid agricultural soil, with or without nitrogen addition. The field experiment aimed to examine the sustained effects on CO2 emissions following biochar addition at different rates combined with the same N inputs in maize fields in a typical loam soil of northwestern China. The objectives were: (1) to determine the sustainable responses of CO2 emission dynamics to biochar amendments; and (2) to identify a preferable biochar application rates with optimum nitrogen combinations to simultaneously obtain a high dry matter accumulation and low CO2 emission intensity. Our results will provide a better understanding of the effects of biochar on the carbon sequestration potential over a longer period, which is important to assessing the true climate change mitigation value of biochar application in agriculture.
2. Materials and Methods
2.1. Soil and Biochar
The soils used for this study were Cumuli-UsticIsohumosols, according to the Chinese soil taxonomy [26], with a silty loam soil texture (clay 37%, silt 59% and sand 4%), and were typical of semiarid agriculture fields in Changwu (35.28°N, 107.88°E), China. The basic properties of the topsoil before the experimental field in 2012 were: bulk density 1.3 g·cm−3, pH 7.9, total C 19.9 g·kg−1, total N 1.05 g·kg−1, Olsen-P 6.56 mg·kg−1, and NH4OAc-K 127.1 mg·kg−1.
The biochar used for the experiment was produced by the pyrolysis of maize straw at the temperature of 400–450 °C at the Sanli New Energy Company in Henan, China. The biochar had the following characteristics: C, N and H contents of 59.16%, 0.98% and 1.69%, respectively, as well as a pH of 9.8, and a specific surface area (Brunauer–Emmett–Teller) of 53.03 m2·g−1.
2.2. Incubation Experiment
Biochar’s effect on short-term carbon mineralization was tested by means of an incubation experiment. The soil samples were homogenized and sieved using a <2-mmsieve prior to use and analysis. The application rate of 30 t·biochar·ha−1 without (BC3) or with 225 kgN·ha−1 (B3N), and 70 t·biochar·ha−1 without (BC7) or with 225 kgN·ha−1 (B7N) were incubated in 250-mL jars for 46 days in the dark at 25 °C and with a soil-water content of 20% (w/w). The nitrogen fertilizer type was urea ((NH2)2CO). There were three replicates per treatment. A control treatment (soil without any addition, BC0) in triplicate was also included. The emitted CO2 was trapped in 10 mL·1 M NaOH. At days 1, 2, 4, 6, 8, 10, 12, 14, 16, 18, 20, 24, 31, 38 and 46, the vials with NaOH were removed and titrated with HCl in the presence of BaCl2.
2.3. Field Experiment and Crop Management
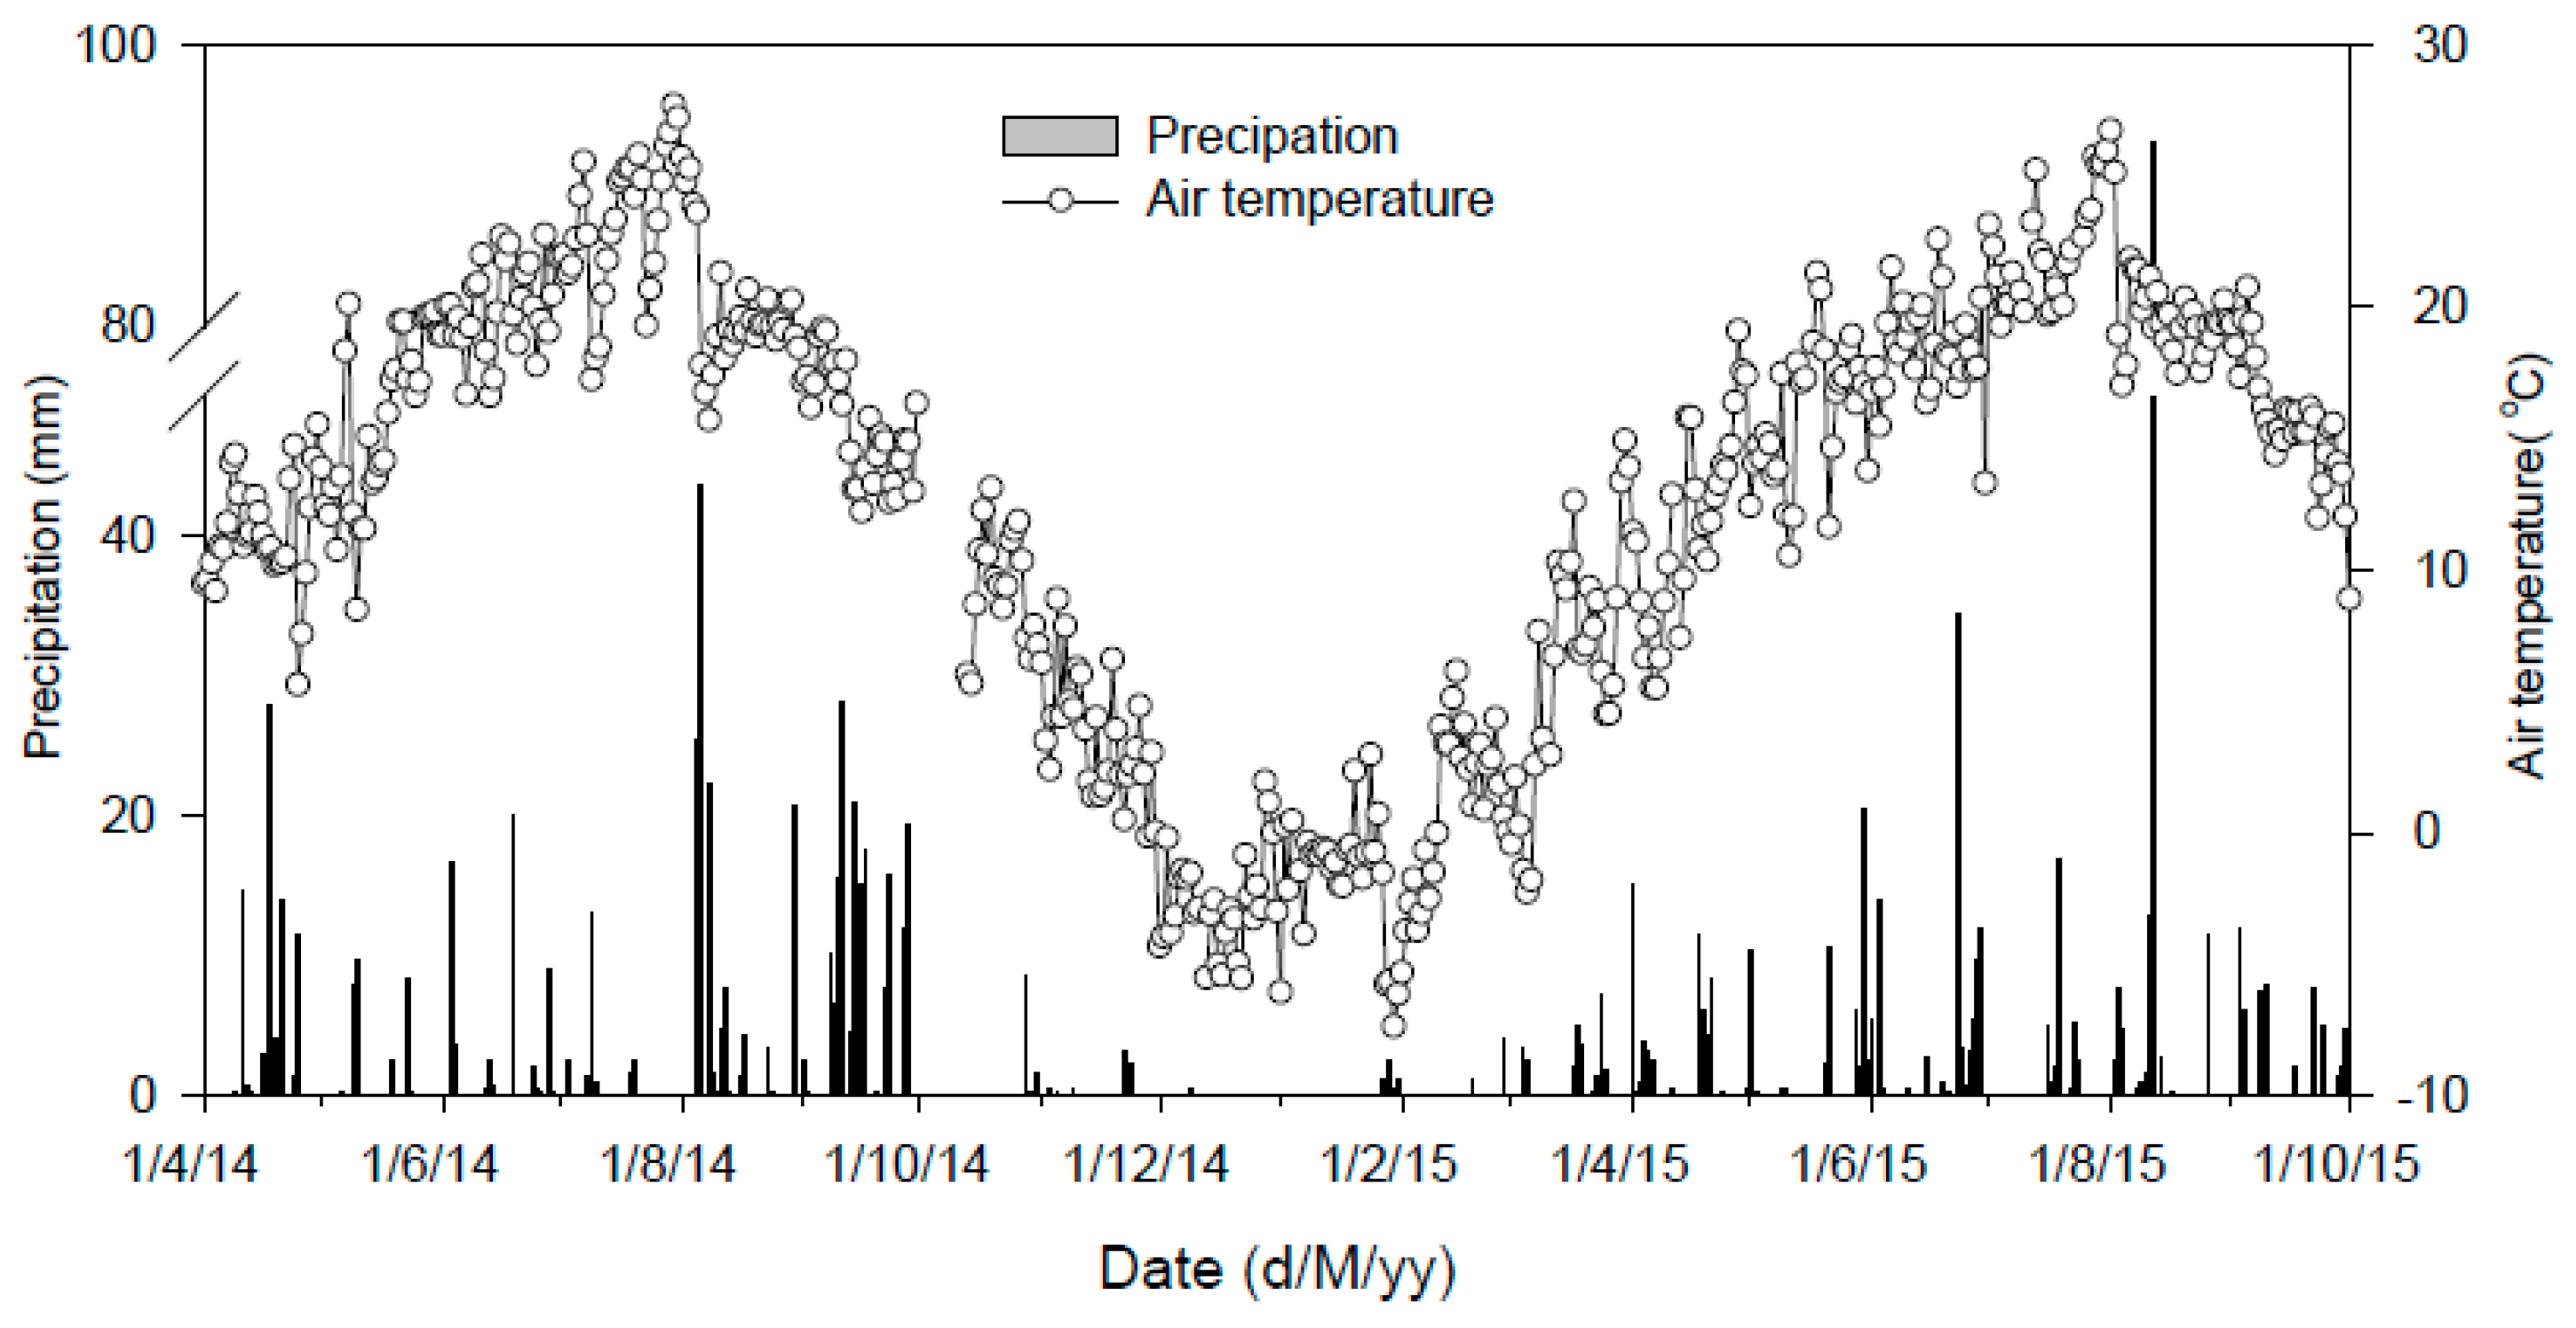
The field experiments were conducted starting in 2012 at the Changwu Agricultural and Ecological Experimental Station (35.28°N, 107.88°E, 1200 m altitude), which is a typical, semiarid farming area on the Loess Plateau of China, with an average annual rainfall of 555 mm and annual evaporation of 1565 mm. The average annual temperature is 9.2 °C, and the groundwater depth is 50 m to 80 m. Generally, the main cropping system in this region includes harvesting one crop of maize or wheat per year. The gas sample collection study was conducted in 2014 and 2015, and the annual precipitation was 573 mm and 557 mm, with 65.4% and 64.8% of the yearly totals in 2014 and 2015 (Figure 1), respectively. The daily average air temperature varied from approximately −7.4 °C in January to approximately 27.7 °C in July.
The experimental design consisted of a completely randomized block design with three replicates, with an area of 7m × 8 m for each plot with a buffer zone of 1.0 m between every two plots. Biochar was surface applied by hand in April 2012 before the maize was sown and immediately incorporated into 0–20 cm soil layer at rates of 0, 10, 20 and 30 t·ha−1 and were labelled BC0, BC10, BC20, and BC30, respectively. Nitrogen (as urea) fertilizers were applied at rates of 90 kg·N·ha−1 before the seeding of maize, 67.5 kg·N·ha−1 at the jointing stage and 67.5 kg·N·ha−1 at the silking stage. Phosphorus (as calcium superphosphate) and potassium (as potassium sulphate) fertilizers were applied at rates of 40 kg·P·ha−1 and 80 kg·K·ha−1 before seeding of maize. All basal fertilizers were mixed into the top 20 cm of the soil by ploughing. The same rates and timing of N, P and K fertilization were used in all plots. A high-yielding maize hybrid (Pioneer 335) was used in this study; the plant density was 65,000 plants ha−1. The plots were gradually manually harvested as the maize ripened in late September every year. The soil water supply of the field experiment was solely dependent on natural rainfall for all of the treatments. The consistent protection and other practices were managed following the local convention during the entire growth stages. No more biochar was subsequently added following the single biochar amendment.
The standard maize development stage system was used to identify the growth stages of the planted crop. Plant samples were collected at the 10-leaf stage and physiological maturity (R6). On each sampling occasion, three adjacent plants (located at least 1 m from the edges of the plot and 0.5 m from the previous sample sites) in a row were selected randomly from each plot and cut at ground level. The samples were dried initially at 105 °C for 30 min and then oven-dried to constant weight at 80 °C.
2.4. Gas Sampling and Measurements
Year-round CO2 emissions were measured using the closed static chamber method in every plot from April 2014 to September 2015. In each experimental plot, one chamber consisted of a base frame and a removable top chamber was set prior to planting and remained there until planting time next year. The top chamber was 50 cm × 50 cm × 50 cm and the stainless-steel base frame was 50 cm × 50 cm × 20 cm, inserted to a depth of 20 cm into the soil. The frame had a water-filled groove to form an airtight seal in the upper chamber airtight during the period of sampling. To avoid the sharp increase of air temperature inside the chamber in the summer during the gas sampling period, each side of the top chamber was covered with a Styrofoam coating, and two small fans were installed at opposite positions at the top of each chamber to ensure the complete mixing of air in the headspace. Two maize plants were in the chamber area, and were cut at 50 cm above the soil surface when their main stalks became too high, due to the height limitation of the top chambers.
For each measurement event, emissions were measured between 8:30 a.m. and 11:30 a.m. in the morning. Four 50 mL headspace samples were taken consecutively, using plastic gas-tight syringes equipped with 3-way stopcocks at 0, 10, 20, and 30 min after the chambers were closed. Gas was sampled daily for 10 days after each fertilization event and for 7 days after a precipitation event. The remaining measurements were at intervals of 2–5 days in the maize growing season (MS) and 7–15 days in the fallow season (FS). The samples were analysed with a gas chromatograph (Agilent 7890A, Agilent Technologies, Santa Clara, CA, USA) for CO2 concentrations on the same day of sampling.
The CO2 emissions were calculated from the linear increase or decrease in the gas concentrations inside the chamber during the sampling period, and were presented as the mean values of replicated measurements on three different plots. Cumulative emissions over the monitoring period were calculated by linear interpolation.
2.5. Additional Parameters
Samples for soil moisture determinations were taken from each plot every 7 days and 15 days during the maize growing and fallow season using a 4-cm-diameter gage auger, respectively. However, soil samples to 20-cm depth were collected once every two days during the 10 days and 6 days following N fertilizations and precipitation, respectively. The gravimetric soil water content was measured after drying the soil in an oven at 105 °C for 24 h.
The soil temperatures at the 0-cm and 10-cm depths and the air temperature inside the headspace of the chambers were measured immediately at the first and last gas sampling using portable digital thermometers (JM624, Jinming Instrument Ltd., Tianjin, China). The mean values of the two measurements were used as the temperature on the sampling day, and the average air temperature was then used to calculate the emissions.
2.6. Statistical Analysis
The means and standard deviations were calculated for all of the parameters. A one-way analysis of variance (ANOVA) was used to evaluate the effects of different biochar application rates on the measured parameters, and differences between the treatment means were compared using least significant difference testing (LSD) at the 5% level. All statistical analyses were performed using the SPSS (16.0) software package (SPSS Inc., Chicago, IL, USA).
3. Results
3.1. Incubation Experiment
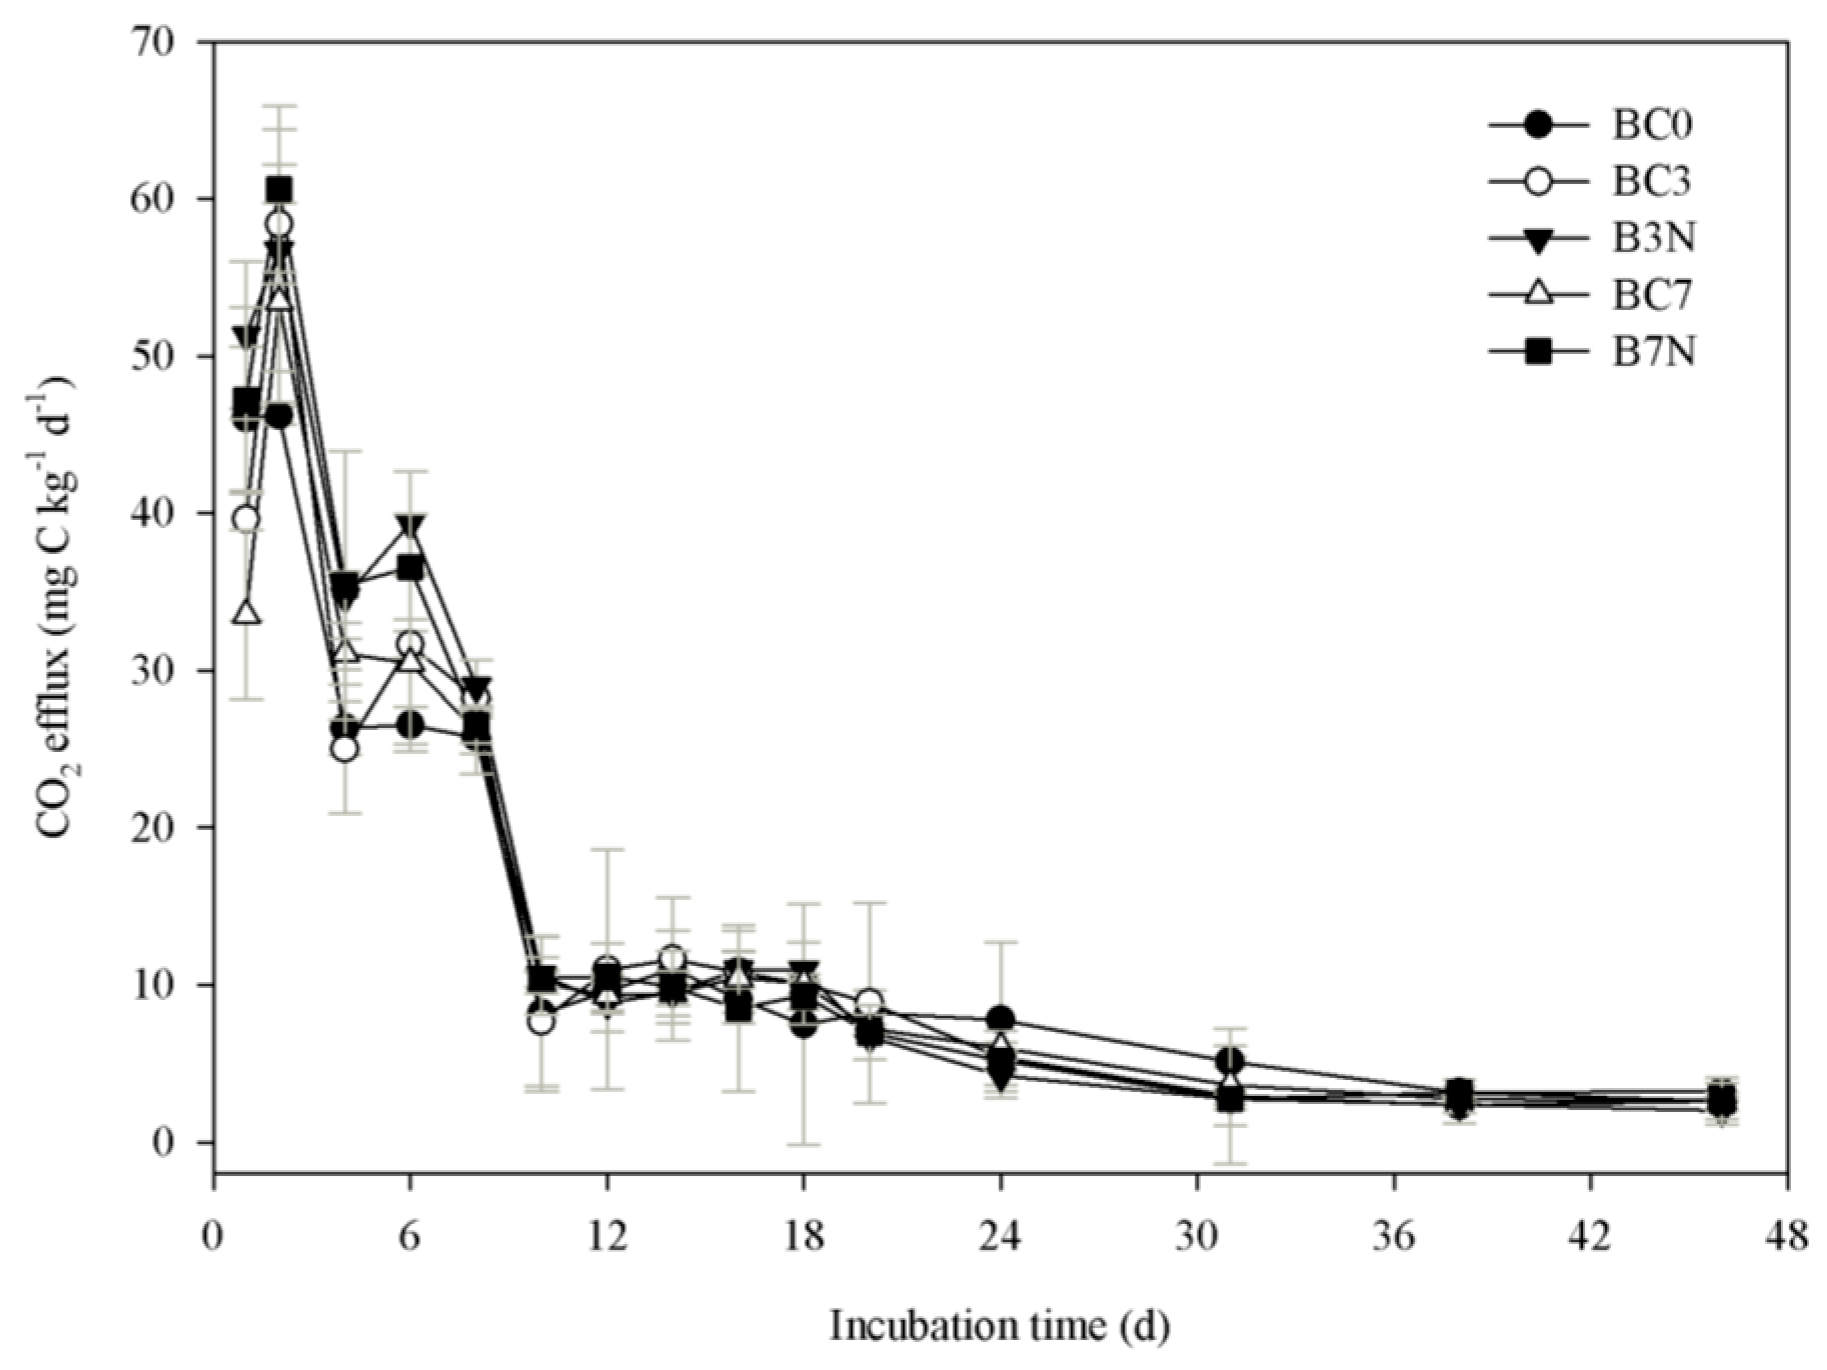
As shown in Figure 2, soil CO2 efflux changed over time in a similar temporal variation pattern for both the amendment of biochar alone or together with N during the incubation period. The highest CO2 efflux was observed on the second day after the incubation started in the soil. Amendment with biochar alone significantly decreased the soil CO2 efflux on the first day of incubation, compared to the soil alone treatment and the biochar together with N addition treatment (Figure 2). The CO2 efflux from biochar together with N addition treatments from 2 to 6 days were greater than that of the soil alone treatment (p < 0.05). After 10 days of incubation, the CO2 efflux rates from the soil strongly decreased both with and without biochar. During the later phase of the incubations, all treatments continued to decrease to a lower C mineralization rate, and no significant difference was found between the soil-alone and biochar mixture with or without N treatment.
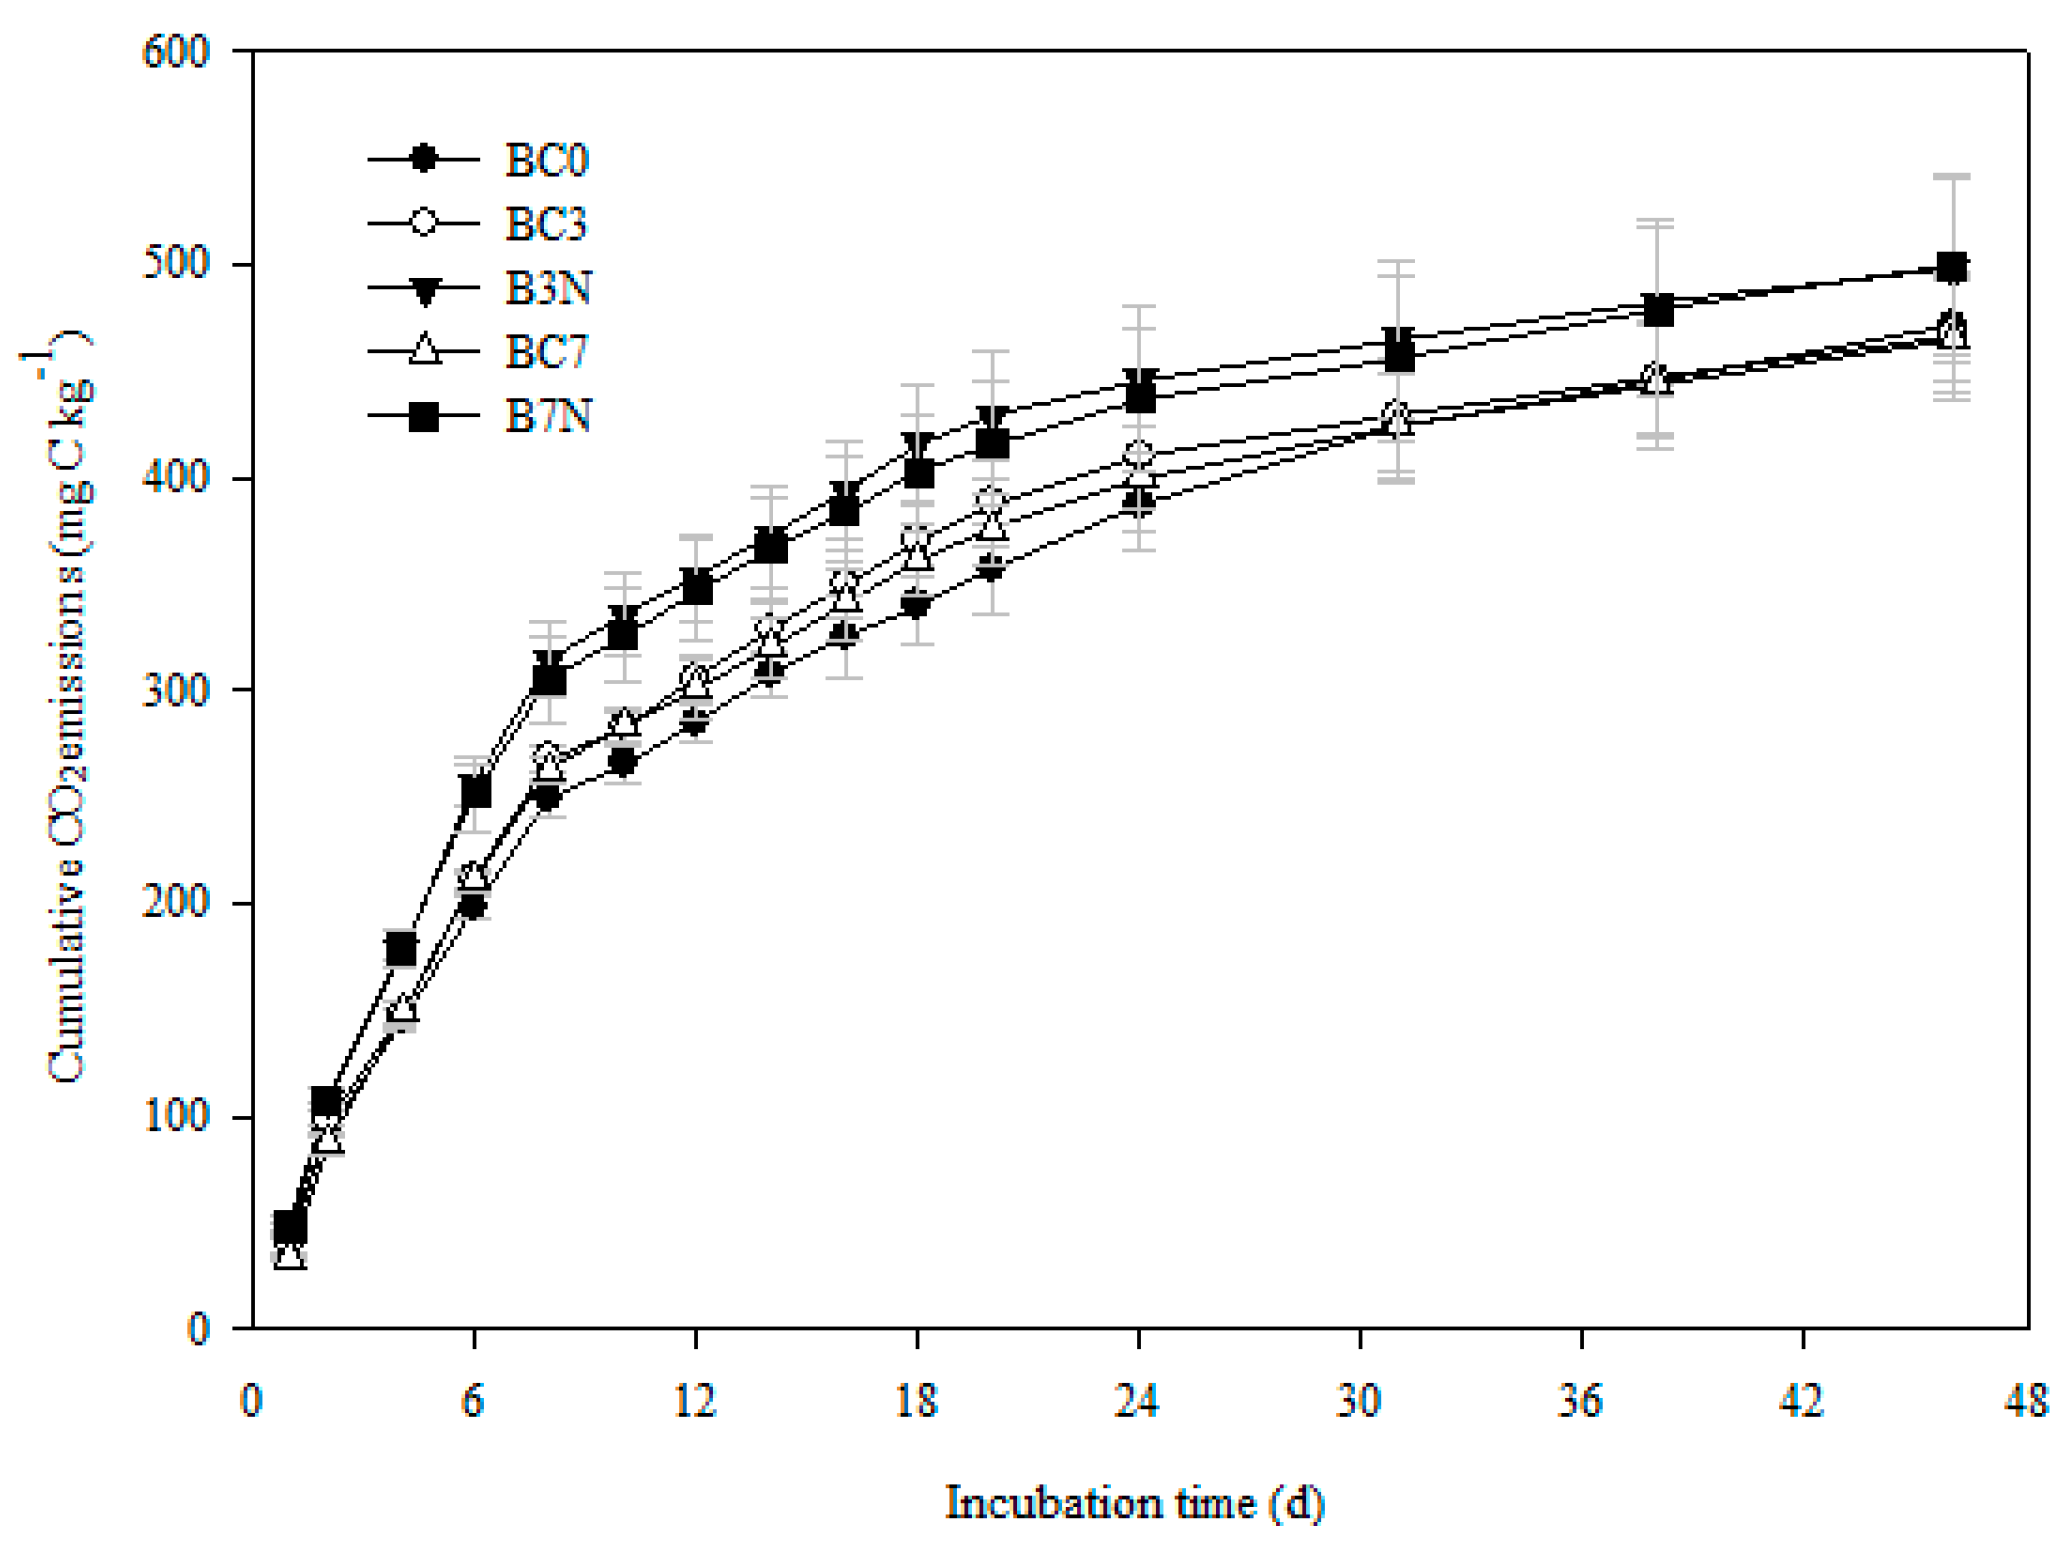
The cumulative CO2 emissions from the biochar-soil mixtures with or without N addition generally corresponded to the same order of increasing mineralization observed in soil-alone incubations (Figure 3). Accumulative mineralized C rapidly increased during the first 8 days, and then the rate was slower. Biochar-soil mixtures had no significant effect on the 46-day cumulative CO2 emissions relative to the BC0, even though the cumulative CO2 emissions from the BC0 treatment were significantly lower than the BC3 and BC7 treatments between 8 and 24 days. No obvious differences in cumulative CO2 emissions were found between the BC3 and BC7 treatments. Nitrogen significantly affected the CO2 emission rate. Higher cumulative CO2 emissions were observed in the B3N and B7N treatments compared to the BC0, BC3 and BC7 treatments after the first day (Figure 3). The cumulative CO2 emissions did not differ significantly between the B3N and B7N during the incubation. At the end of the incubation, 0.86–3.53% of the C was lost from each soil, with the highest amount in the BC0 treatment, followed by the BC3 and B3N treatments, while the amounts in the BC7 and B7N treatments were the smallest. A two-factor analysis of variance showed that there was no significant interaction of biochar × N on total soil cumulativeCO2 emissions (p > 0.05).
3.2. Field Scale of CO2 Emissionsand Dry Matter Accumulation
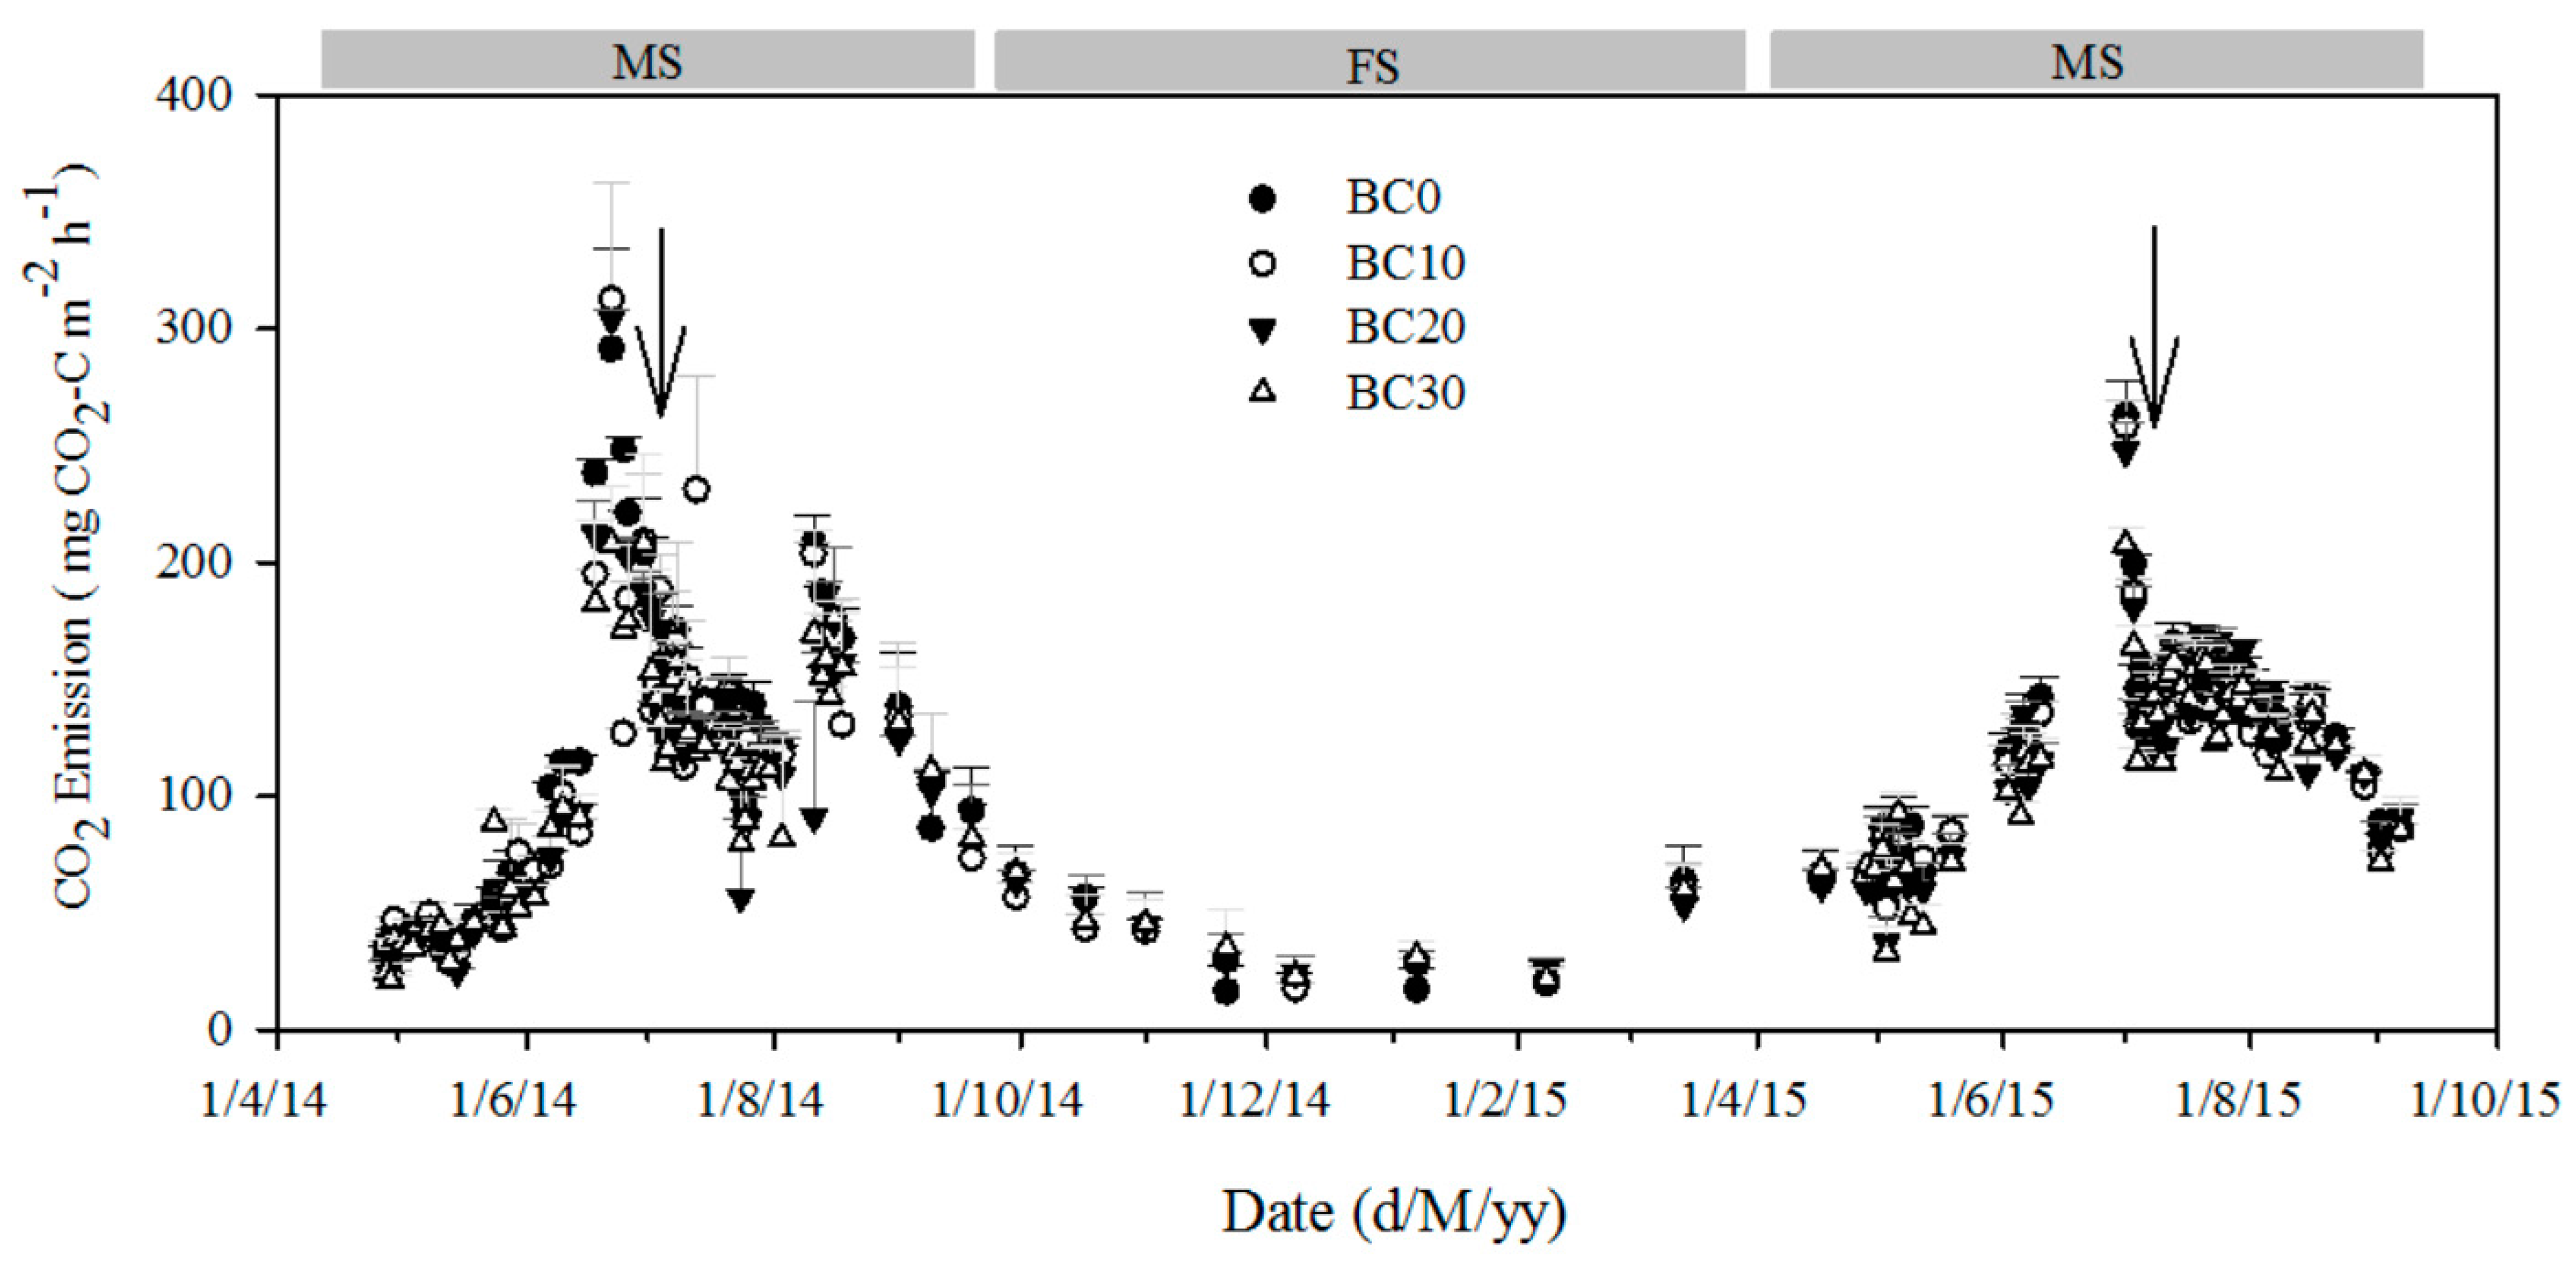
The CO2 emissions fluctuated from the biochar-mixture treatments generally corresponded to the same order of soil-alone treatment (Figure 4). Overall, mean daily CO2 emissions ranged from 17.1 to 312.4 mg·CO2-C·m−2·h−1, and a high temporal variation was observed for all treatments. The CO2 emissions markedly increased with plant growth, and peaked at the values from 208 to 312 mg·CO2-C·m−2·h−1 on 22 June during the MS in 2014–2015 and from 207 to 262 mg·CO2-C·m−2·h−1 on 1 July during the MS in 2015 before the cut events. The rates then decreased during the MS season, except for some small spikes, and were maintained at a relatively low level during the FS season. The average CO2 emission rates were similar for the different biochar treatments and were 117.0, 109.0, 106.5 and 103.2 mg·CO2-C·m−2·h−1 for the BC0, BC10, BC20 and BC30 treatments during the MS in 2014, respectively, and 103.5, 99.5, 96.9 and 92.8 mg·CO2-C·m−2·h−1 for the BC0, BC10, BC20 and BC30 treatments during the MS in 2015, respectively. Although there were no significant differences in CO2 emission rates between different biochar-mixture treatments over the whole experimental period, BC30 treatment did bring about a significant reduction of CO2 emissions during a few short periods with generally high CO2 emissions (when compared to the control) (p < 0.05). No significant differences were detected in net CO2 emissions among different biochar rates over the entire fallow period.
The cumulative CO2 emissions were significantly lower in the biochar treatments compared to the “no amendment” control, while no significant differences were found between the BC10, BC20 and BC30 treatments, ranging from 3.79 × 10³ to 3.59 × 10³ kg·CO2-C·ha−1 in the MS of 2014 (Table 1). During the MS, the cumulative CO2 emissions from the BC0 treatment were not significantly higher compared to those of the BC10 treatment, but they were significantly higher than those of the BC20 and BC30 treatments in 2015. There was also a significant difference (p < 0.05) between years during the maize growing season due to different precipitation and temperature conditions. The cumulative CO2 emissions showed no difference between different biochar application treatments during the FS in 2014–2015, ranging from 1.72 × 10³ to 1.81 × 10³ kg·CO2-C·ha−1 and accounting for 30.8–33.4% of the annual emissions.
In general, the additions of biochar increased the shoot dry matter accumulation both in the early and late stages of maize growth (Table 2). At the 10-leaf stage (V10), the dry matter accumulation in the BC30 treatment was significantly higher than that in the BC10 and BC20 treatments in 2014. However, no significant difference in dry matter accumulation was observed between the BC30, BC20, and BC10 treatments in 2015, but it was markedly higher than that in the BC0 treatment. At physiological maturity (R6), the amounts of dry matter accumulated were markedly higher in the BC30 treatment than in the BC10 treatment in 2014 and 2015, but no significant difference was observed between the BC30and BC20 treatments. The accumulation in the BC0 treatment was markedly lower than that in the BC10, BC20 and BC30 treatments in 2014 and 2015. The shoot dry matter accumulation was significantly affected by the year. For all of the treatments, the accumulation during both the 10-leaf and physiological maturity stages in 2014 was significantly lower than that in 2015 (p < 0.05)
3.3. The Relationship between CO2 Emissionsand Environmental Indexes
CO2 emissions were related to changes in soil temperature and the soil water content (SWC). In our study, a significant positive correlation could be observed between CO2 emission rates and soil temperature (Table 2). A linear temperature function could explain a large part of the variation in CO2 emissions, with a higher correlation coefficient with the temperature at the 10-cm-depth than with the temperature at the 0-cm-depth during the growing season. The exponential function, however, had a better fit compared to the linear function (p < 0.001). The single effect of soil moisture on CO2 emissions could also be simulated using a linear equation and exponential function. However, there was only a weak negative correlation between CO2 emission rates and soil moisture (SWC) in the shallow 0–20 cm soil. The soil moisture accounted for less than 22.5% of variation in CO2 emissions, indicating that CO2 emissions were highly dependent on the effect of soil temperature. CO2 emission dynamics may be less tightly linked to soil temperature and moisture with the identical biochar addition to soil, which was supported by the observed coefficient between the unamended and biochar-amended treatments.
4. Discussion
4.1. Biochar Impact on Soil CO2 Emissions
The highest CO2 efflux rate was found at the beginning of the experiment, and it decreased with the incubation time (Figure 2). The CO2 efflux rate reached a peak one day after biochar and N fertilization addition, mainly due to the stimulation of microbial activity [27] or the dissociation of carbonates [28]. The cumulative CO2 emissions from the BC0 treatment were significantly lower than those from the BC3 and BC7 treatments between 8 and 24 days. However, the cumulative CO2 emissions showed no significant difference between the treatments with biochar alone and the control for the incubation (Figure 3). The CO2 emissions were also not proportional to the amount of biochar added to the soil. In most other studies, a negative priming effect or no priming effects were found in biochar-amended soils [6,12]. In our study, a shift from a negative to a positive priming effect was observed during 0–10 days of incubation, and biochar alone caused a large negative priming effect on the first day, while it a positive priming effect, between 2 and 10 days of incubation (Figure 2). A rather similar priming effect was also found by Luo et al. [12]; while increased mineralisation occurred, it came exclusively from the biochar itself.
It must be noted out that, in contrast to the results of short incubation, a significant decrease in the cumulative CO2 emissions induced by biochar addition was observed in the longer field natural systems (Table 1), indicating that biochar could suppress soil respiration during the maize growing season, which was consistent with previous studies [29,30], but biochar addition had no effect on soil respiration during the fallow season. Similarly, with the increasing biochar addition, biochar caused a progressive reduction of CO2 emissions [31], which may be ascribed to the sorption of labile C onto the surface or into the pores of biochar [32]. Spokas and Reicosky have demonstrated that biochar produced at the temperatures of 400–510 °C could inhibit soil CO2 emissions. The lack of a measured difference inCO2 emissions has also been reported for high temperature biochar due to the decrease in the volatile matter [33]. Additionally, the application of biochar powder and freshly burned litter also had lower or no significant effect on soil respiration [34]. However, the effect of biochar addition on soil C cycling could influence the soil CO2 emission rate in the soil-water-gas system, since the fluctuation of SOC [35], dissolved organic carbon [36] and microbial biomass carbon that resulted from biochar addition could impact the mineralization of soil C. The balance of air and water was established in the proceeding of incubation and field conditions, and the liming effect of biochar (pH = 9.8) could absorb the released CO2 from the biochar-soil system [29]. Additionally, biochar might suppress related microbial activity and thereby decrease the emission of CO2 [37]. On the other hand, the decrease of SOC mineralization induced by the absorption of enzymes might also contribute to a decrease in CO2 emissions. Notably, increases in CO2 emissions from biochar-amended soil were reported by Sui et al. [38], which might be contributed to the volatile organic C contained in the biochar [39]. Soil microbial activities fluctuated by biochar suggested that the long-term CO2 emissions from biochar amended soils may be influenced indirectly as a result of possible alterations in soil physico-chemical and biological properties following biochar addition throughout the crop growing season in a dry agricultural system [40,41].The underlying mechanism of soil C mineralization induced by biochar addition needs further investigation for the different probable reasons showed by the above studies.
4.2. Biochar Combined with N Fertilization Impact on Soil CO2 Emissions
It is worth noting that soil physical disruption, such as drying, sieving and rewetting, prior to incubation might cause stimulation or suppression in CO2 emissions. Additionally, temperature and moisture during the incubation were obviously different from field conditions [35].
In this study, though no significant interaction of the biochar and N input appeared, our results showed that the levels of CO2 in the biochar-amended treatments with N inputs were higher than those in the biochar alone soils and the control (Figure 3) over the short term, which was in agreement with the results reported by Wang et al. and Song et al. [42,43], who found that the application of biochar combined with N fertilization enhanced CO2 emissions in the incubation experiments. A significant increase in basal and substrate-induced respiration occurred in the treatments with added biochar combined with mineral fertilization [34,39], which suggested that soil C mineralization would be stimulated in the short term. However, the cumulative CO2 emissions were lower in the treatments with both biochar and N fertilization compared to the control (Figure 4, Table 1) in the field system, suggesting that the positive priming effect of biochar and N input on C mineralization was a transient accent and gradually vanished in the long term. The reduction in CO2 emissions from the biochar-amended soil with N input has also been observed in other studies [16,44]. Zhang et al. [45] also found that the total CO2 emission decreased when N fertilizer was added to the soil in the presence of biochar. The reduction in soil respiration might have partly contributed to the decrease in phenol oxidization activity induced by N suppression of white-rot fungi [46]. The changes in the soil pH at this site observed in our previous study [47] might also contribute to the suppression effect since soil acidity or alkalinity was responsible for microbial activity [48]. In addition, the high correlation between soil pH and total CO2 emissions also provided evidencefor this phenomenon [49]. The variances in different studies might be attributed to the different types and rates of biochar used, the aging effect, N fertilization and soil type, as well as short-term incubation or field conditions [6,50].
Biochar addition has the potential to neutralize total CO2 emissions induced by N fertilization. Therefore, although biochar addition tended to increase the cumulative CO2 in the short term, it would be an effective strategy to mitigate GHG emissions caused by the utilization of N fertilizer [51] and could sever as long-term C sequestration as a relative recalcitrant C source in soil [32].
4.3. Crop Production
In the present study, biochar addition increased maize dry matter accumulation both at the V10 and R6 stages, and the effect increased with the increasing biochar addition rate (Table 1). In agreement with previous studies, biochar additions have been shown to increase crop productivity by improving of soil chemical and physical properties [45,52]. A meta-analysis showed that biochar added into soil could improve crop productivity by approximately 10% [53]. Relative to the control, the increase of crop biomass reached 42% in our study, while biochar could increase crop biomass by less than 10% to more than 200% [42,53]. The large variation might be attributed to soil types, biochar types and rates, and crops [53]. The increase in crop biomass might be attributed to the improvement in soil physical properties indicated by a decrease in bulk density and to the enhancement in nutrient availability in our previous study [47]. It has been verified that biochar could increase N availability to crops [54] and high levels of soil organic carbon could improve soil N efficiency, thus increasing crop production [55]. Thus, the increasing soil C accumulation induced by biochar additions might be an alternative to economize the N fertilization used [51].
4.4. Relationships between Total CO2 Emission and Environmental Factors
Soil moisture and temperature are two important environmental variables that influence CO2 emissions, which is in accordance with other studies [56]. Soil daily CO2 emissions were negatively related with soil moisture in this study (Table 2), in contrast to the results of Liu et al. [56] who found a positive relationship. However, Zhang et al. [57] showed no significant relationship between soil moisture and CO2 emission in a chestnut plantation. When the soil suffered from extreme dryness or wetness, the soil CO2 emissions also might be influenced [58], but this phenomenon mostly did not exist in our experimental site. Soil temperature is positively correlated with soil CO2 emissions [59]. Similarly, our study found that soil CO2 emissions were positively related with soil temperature both at the surface (0 cm) and at a depth of 10 cm. An exponential relationship between soil CO2 emissions and temperature has been reported by Ding et al. and Zhang et al. [57,60]. Such a relationship was also observed in our study, with 59–70% of the variation attributed to soil temperature.
5. Conclusions
This study examined the carbon dioxide (CO2) emissions from a semiarid farmland soil due to biochar application. After a short period, the biochar addition to the soil had a small or insignificant effect on CO2 emissions without additional nitrogen amendment. By contrast, the apparent reduction was observed to be dependent on the biochar concentration, soil temperature, and soil water content from the experiments performed over two years in the semiarid farmland of the Loess Plateau. In general, biochar addition enhanced aboveground dry matter accumulation both in theearly and late stages of maize growth. Thus, this paper contributes to the evidence that biochar amendments in agricultural soil may serve as a potential tool for climate change mitigation, with lower CO2 emissions and higher dry matter production in semi-arid farmland over a longer period. However, our data are not conclusive, and further studies therefore need to verify possible optimum or maximum biochar application rates together with appropriate fertilization practices for various agricultural fields in order to recommend the full-scale successive biochar application.
Acknowledgments
This work was jointly supported by the National Natural Science Foundation of China (Grant No. 51279197, No. 41671307, and No. 50809068), the Fundamental Research Funds for the Central Universities (Grant No. YQ2013009), and the State Key Laboratory of Soil Erosion and Dryland Farming on the Loess Plateau (Grant No. A314021403-C4).
Author Contributions
Yufang Shen and Shiqing Li conceived and designed the experiments; Lixia Zhu and Hongyan Cheng, performed the experiments; Lixia Zhu and Shanchao Yue analyzed the data; Yufang Shen wrote the paper.
Conflicts of Interest
The authors declare no conflict of interest.
References
- Melillo, J.M.; Morrisseau, S. Soil warming and carbon-cycle feedbacks to the climate system. Science 2002, 298, 2173–2176. [Google Scholar] [CrossRef] [PubMed]
- Scott, D.S.; Jan, P. The continuous flash pyrolysis of biomass. Can. J. Chem. Eng. 1984, 62, 404–412. [Google Scholar] [CrossRef]
- Ahmad, M.; Rajapaksha, A.; Lim, J.; Zhang, M.; Bolan, N.; Mohan, D.; Vithanage, M.; Lee, S. Biochar as a sorbent for contaminant management in soil and water: A review. Chemosphere 2014, 99, 19–33. [Google Scholar] [CrossRef] [PubMed]
- Sohi, S.P.; Krull, E.; Lopez-Capel, E.; Bol, R. Chapter 2—A review of biochar and its use and function in soil. Adv. Agron. 2010, 105, 47–82. [Google Scholar]
- Stavi, I.; Lal, R. Agroforestry and biochar to offset climate change: A review. Agron. Sustain. Dev. 2013, 33, 81–96. [Google Scholar] [CrossRef]
- Novak, J.M.; Busscher, W.J.; Watts, D.W.; Laird, D.A.; Ahmedna, M.A.; Niandou, M.A.S. Short-term CO2 mineralization after additions of biochar and switchgrass to a Typic Kandiudult. Geoderma 2010, 154, 281–288. [Google Scholar] [CrossRef]
- Scheer, C.; Grace, P.R.; Rowlings, D.W.; Kimber, S.; Zwieten, L.V. Effect of biochar amendment on the soil-atmosphere exchange of greenhouse gases from an intensive subtropical pasture in northern New South Wales, Australia. Plant Soil 2011, 345, 47–58. [Google Scholar] [CrossRef] [Green Version]
- Wang, Z.; Li, Y.; Chang, S.X.; Zhang, J.; Jiang, P.; Zhou, G.; Shen, Z. Contrasting effects of bamboo leaf and its biochar on soil CO2 efflux and labile organic carbon in an intensively managed Chinese chestnut plantation. Biol. Fertil. Soils 2014, 50, 1109–1119. [Google Scholar] [CrossRef]
- Smith, J.L.; Collins, H.P.; Bailey, V.L. The effect of young biochar on soil respiration. Soil Biol. Biochem. 2010, 42, 2345–2347. [Google Scholar] [CrossRef]
- Verheijen, F.G.A.; Graber, E.R.; Ameloot, N.; Bastos, A.C.; Sohi, S.; Knicker, H. Biochars in soils: New insights and emerging research needs. Eur. J. Soil Sci. 2014, 65, 22–27. [Google Scholar] [CrossRef]
- Cely, P.; Tarquis, A.M.; Pazferreiro, J.; Méndez, A.; Gascó, G. Factors driving the carbon mineralization priming effect in a sandy loam soil amended with different types of biochar. Solid Earth 2014, 6, 1748–1761. [Google Scholar] [CrossRef] [Green Version]
- Luo, Y.; Durenkamp, M.; Nobili, M.D.; Lin, Q.; Brookes, P.C. Short term soil priming effects and the mineralisation of biochar following its incorporation to soils of different pH. Soil Biol. Biochem. 2011, 43, 2304–2314. [Google Scholar] [CrossRef]
- Kuzyakov, Y.; Subbotina, I.; Chen, H.; Bogomolova, I.; Xu, X. Black carbon decomposition and incorporation into soil microbial biomass estimated by 14C labeling. Soil Biol. Biochem. 2009, 41, 210–219. [Google Scholar] [CrossRef]
- Singh, B.P.; Cowie, A.L. Long-term influence of biochar on native organic carbon mineralisation in a low-carbon clayey soil. Sci. Rep. 2014, 4, 3687. [Google Scholar] [CrossRef] [PubMed]
- Lu, W.; Ding, W.; Zhang, J.; Li, Y.; Luo, J.; Bolan, N.; Xie, Z. Biochar suppressed the decomposition of organic carbon in a cultivated sandy loam soil: A negative priming effect. Soil Biol. Biochem. 2014, 76, 12–21. [Google Scholar] [CrossRef]
- Zimmerman, A.R.; Gao, B.; Ahn, M.Y. Positive and negative carbon mineralization priming effects among a variety of biochar-amended soils. Soil Biol. Biochem. 2011, 43, 1169–1179. [Google Scholar] [CrossRef]
- Allison, S.D.; Czimczik, C.I.; Treseder, K.K. Microbial activity and soil respiration under nitrogen addition in Alaskan boreal forest. Glob. Chang. Biol. 2008, 14, 1156–1168. [Google Scholar] [CrossRef]
- Borchard, N.; Wolf, A.; Laabs, V.; Aeckersberg, R.; Scherer, H.W.; Moeller, A.; Amelung, W. Physical activation of biochar and its meaning for soil fertility and nutrient leaching—A greenhouse experiment. Soil Use Manag. 2012, 28, 177–184. [Google Scholar] [CrossRef]
- Gundale, M.J.; Deluca, T.H. Charcoal effects on soil solution chemistry and growth of koeleria macrantha in the Ponderosa Pine/Douglas-fir ecosystem. Biol. Fertil. Soils 2007, 43, 303–311. [Google Scholar] [CrossRef]
- Pergitzer, K.S.; Burton, A.J.; Zak, D.R.; Talhelm, A.F. Simulated chronic nitrogen deposition increases carbon storage in Northern Temperate forests. Glob. Chang. Biol. 2007, 14, 142–153. [Google Scholar] [CrossRef]
- Ding, W.; Yu, H.; Cai, Z.; Han, F.; Xu, Z. Responses of soil respiration to N fertilization in a loamy soil under maize cultivation. Geoderma 2010, 155, 381–389. [Google Scholar] [CrossRef]
- Dhadli, H.S.; Brar, B.S. Effect of long-term differential application of inorganic fertilizers and manure on soil CO2 emissions. Plant Soil Environ. 2016, 62, 195–201. [Google Scholar]
- Cheng, C.H.; Lehmann, J.; Thies, J.E.; Burton, S.D.; Engelhard, M.H. Oxidation of black carbon by biotic and abiotic processes. Org. Geochem. 2006, 37, 1477–1488. [Google Scholar] [CrossRef]
- Kolb, S.E.; Fermanich, K.J.; Dornbush, M.E. Effect of charcoal quantity on microbial biomass and activity in temperate soils. Soil Sci. Soc. Am. J. 2009, 73, 1173–1181. [Google Scholar] [CrossRef]
- Clough, T.J.; Bertram, J.E.; Ray, J.L.; Condron, L.M.; O’Callaghan, M.; Sherlock, R.R.; Wells, N.S. Unweathered wood biochar impact on nitrous oxide emissions from a bovine-urine-amended pasture soil. Soil Sci. Soc. Am. J. 2010, 74, 852–860. [Google Scholar] [CrossRef]
- Gong, Z.T.; Zhang, G.L.; Chen, Z.C. Pedogenesis and Soil Taxonomy; Science Press: Beijing, China, 2007. [Google Scholar]
- El-Naggar, A.H.; Usman, A.R.A.; Al-Omran, A.; Yong, S.O.; Ahmad, M.; Al-Wabel, M.I. Carbon mineralization and nutrient availability in calcareous sandy soils amended with woody waste biochar. Chemosphere 2015, 138, 67–73. [Google Scholar] [CrossRef] [PubMed]
- Bruun, E.W.; Hauggaard-Nielsen, H.; Ibrahim, N.; Egsgaard, H.; Ambus, P.; Jensen, P.A.; Dam-Johansen, K. Influence of fast pyrolysis temperature on biochar labile fraction and short-term carbon loss in a loamy soil. Biomass Bioenergy 2011, 35, 1182–1189. [Google Scholar] [CrossRef]
- Liu, Y.; Yang, M.; Wu, Y.; Wang, H.; Chen, Y.; Wu, W. Reducing CH4 and CO2 emissions from waterlogged paddy soil with biochar. J. Soil Sediments 2011, 11, 930–939. [Google Scholar] [CrossRef]
- Spokas, K.A.; Reicosky, D.C. Impacts of sixteen different biochars on soil greenhouse gas production. Ann. Environ. Sci. 2009, 3, 179–193. [Google Scholar]
- Prayogo, C.; Jones, J.E.; Baeyens, J.; Bending, G.D. Impact of biochar on mineralisation of C and N from soil and willow litter and its relationship with microbial community biomass and structure. Biol. Fertil. Soils 2013, 50, 695–702. [Google Scholar] [CrossRef]
- Lehmann, J.; Rillig, M.C.; Thies, J.; Masiello, C.A.; Hockaday, W.C.; Crowley, D. Biochar effects on soil biota—A review. Soil Biol. Biochem. 2011, 43, 1812–1836. [Google Scholar] [CrossRef]
- Case, S.D.C.; Mcnamara, N.P.; Reay, D.S.; Whitaker, J. The effect of biochar addition on N2O and CO2 emissions from a sandy loam soil—The role of soil aeration. Soil Biol. Biochem. 2012, 51, 125–134. [Google Scholar] [CrossRef]
- Steiner, C.; Teixeira, W.G.; Lehmann, J.; Zech, W. Microbial response to charcoal amendments of highly weathered soils and amazonian dark earths in central Amazonia: Preliminary results. In Amazonian Dark Earths: Explorations in Space and Time; Springer: Berlin, Germany, 2004; pp. 195–212. [Google Scholar]
- Fernández, J.M.; Nieto, M.A.; López-De-Sá, E.G.; Gascó, G.; Méndez, A.; Plaza, C. Carbon dioxide emissions from semi-arid soils amended with biochar alone or combined with mineral and organic fertilizers. Sci. Total Environ. 2014, 482–483, 1–7. [Google Scholar] [CrossRef] [PubMed] [Green Version]
- El-Mahrouky, M.; El-Naggar, A.H.; Usman, A.R.; Al-Wabel, M. Dynamics of CO2 emission and biochemical properties of a Sandy calcareous soil amended with conocarpus waste and biochar. Pedosphere 2015, 25, 46–56. [Google Scholar] [CrossRef]
- Liang, B.; Lehmann, J.; Solomon, D.; Sohi, S.; Thies, J.E.; Skjemstad, J.O.; Luizão, F.J.; Engelhard, M.H.; Neves, E.G.; Wirick, S. Stability of biomass-derived black carbon in soils. Geochim. Cosmochim. Acta 2008, 72, 6069–6078. [Google Scholar] [CrossRef]
- Sui, Y.; Gao, J.; Liu, C.; Zhang, W.; Lan, Y.; Li, S.; Meng, J.; Xu, Z.; Tang, L. Interactive effects of straw-derived biochar and N fertilization on soil C storage and rice productivity in rice paddies of Northeast China. Sci. Total Environ. 2015, 544, 203–210. [Google Scholar] [CrossRef] [PubMed]
- Spokas, K.A.; Novak, J.M.; Stewart, C.E.; Cantrell, K.B.; Uchimiya, M.; Dusaire, M.G.; Ro, K.S. Qualitative analysis of volatile organic compounds on biochar. Chemosphere 2011, 85, 869–882. [Google Scholar] [CrossRef] [PubMed]
- Zhu, L.; Xiao, Q.; Shen, Y.; Li, S. Microbial functional diversity responses to 2 years since biochar applicationin silt-loam soils on the Loess Plateau. Ecotoxicol. Environ. Saf. 2017, 144, 578–584. [Google Scholar] [CrossRef] [PubMed]
- Zhu, L.; Xiao, Q.; Cheng, H.; Shi, B.; Shen, Y.; Li, S. Seasonal dynamics of soil microbial activity after biochar addition in adryland maize field in North-Western China. Ecol. Eng. 2017, 104, 141–149. [Google Scholar] [CrossRef]
- Wang, J.; Pan, X.; Liu, Y.; Zhang, X.; Xiong, Z. Effects of biochar amendment in two soils on greenhouse gas emissions and crop production. Plant Soil 2012, 360, 287–298. [Google Scholar] [CrossRef]
- Song, D.; Xi, X.; Huang, S.; Liang, G.; Sun, J.; Zhou, W.; Wang, X. Short-term responses of soil respiration and C-cycle enzyme activities to additions of biochar and urea in a calcareous soil. PLoS ONE 2016, 11, e1694. [Google Scholar] [CrossRef] [PubMed]
- Iqbal, J.; Hu, R.; Shan, L.; Hatano, R.; Feng, M.; Lan, L.; Ahamadou, B.; Du, L. CO2 emission in a subtropical red paddy soil (Ultisol) as affected by straw and N-fertilizer applications: A case study in Southern China. Agric. Ecosyst. Environ. 2009, 131, 292–302. [Google Scholar] [CrossRef]
- Zhang, A.; Liu, Y.; Pan, G.; Hussain, Q.; Li, L.; Zheng, J.; Zhang, X. Effect of biochar amendment on maize yield and greenhouse gas emissions from a soil organic carbon poor calcareous loamy soil from Central China Plain. Plant Soil 2012, 351, 263–275. [Google Scholar] [CrossRef]
- Frey, S.D.; Knorr, M.; Parrent, J.L.; Simpson, R.T. Chronic nitrogen enrichment affects the structure and function of the soil microbial community in temperate hardwood and pine forests. For. Ecol. Manag. 2004, 196, 159–171. [Google Scholar] [CrossRef]
- Xiao, Q.; Zhu, L.; Zhang, H.; Li, X.; Shen, Y.; Li, S. Soil amendment with biochar increases maize yields in a semi-arid region by improving soil quality and root growth. Crop Pasture Sci. 2016, 67, 495–507. [Google Scholar] [CrossRef]
- Pietri, J.C.A.; Brookes, P.C. Relationships between soil pH and microbial properties in a UK arable soil. Soil Biol. Biochem. 2008, 40, 1856–1861. [Google Scholar] [CrossRef]
- Zhao, R.; Coles, N.; Wu, J. Soil carbon mineralization following biochar addition associated with external nitrogen. Chil. J. Agric. Res. 2015, 75, 465–471. [Google Scholar] [CrossRef]
- Singh, B.P.; Hatton, B.J.; Singh, B.; Cowie, A.L.; Kathuria, A.; Pignatello, J.; Katz, B.G. Influence of biochars on nitrous oxide emission and nitrogen leaching from two contrasting soils. J. Environ. Qual. 2010, 39, 1224–1235. [Google Scholar] [CrossRef] [PubMed]
- Zhang, A.; Cui, L.; Pan, G.; Li, L.; Hussain, Q.; Zhang, X.; Zheng, J.; Crowley, D. Effect of biochar amendment on yield and methane and nitrous oxide emissions from a rice paddy from Tai Lake plain, China. Agric. Ecosyst. Environ. 2010, 139, 469–475. [Google Scholar] [CrossRef]
- Major, J.; Rondon, M.; Molina, D.; Riha, S.J.; Lehmann, J. Maize yield and nutrition during 4years after biochar application to a Colombian savanna oxisol. Plant Soil 2010, 333, 117–128. [Google Scholar] [CrossRef]
- Jeffery, S.; Verheijen, F.G.A.; Velde, M.V.D.; Bastos, A.C. A quantitative review of the effects of biochar application to soils on crop productivity using meta-analysis. Agric. Ecosyst. Environ. 2011, 144, 175–187. [Google Scholar] [CrossRef]
- Chan, K.Y.; Van Zwieten, L.; Meszaros, I.; Downie, A.; Joseph, S. Using poultry litter biochars as soil amendments. Aust. J. Soil Res. 2008, 46, 437–444. [Google Scholar] [CrossRef]
- Pan, G.; Ping, Z.; Li, Z.; Smith, P.; Li, L.; Qiu, D.; Zhang, X.; Xu, X.; Shen, S.; Chen, X. Combined inorganic/organic fertilization enhances N efficiency and increases rice productivity through organic carbon accumulation in a rice paddy from the Tai Lake region, China. Agric. Ecosyst. Environ. 2009, 131, 274–280. [Google Scholar] [CrossRef]
- Liu, J.; Jiang, P.; Wang, H.; Zhou, G.; Wu, J.; Yang, F.; Qian, X. Seasonal soil CO2 efflux dynamics after land use change from a natural forest to Moso bamboo plantations in subtropical China. Fuel Energy Abstr. 2011, 262, 1131–1137. [Google Scholar] [CrossRef]
- Zhang, J.; Li, Y.; Chang, S.X.; Jiang, P.; Zhou, G.; Liu, J.; Wu, J.; Shen, Z. Understory vegetation management affected greenhouse gas emissions and labile organic carbon pools in an intensively managed Chinese chestnut plantation. Plant Soil 2014, 376, 363–375. [Google Scholar] [CrossRef]
- Wu, X.; Yao, Z.; Brüggemann, N.; Shen, Z.Y.; Wolf, B.; Dannenmann, M.; Zheng, X.; Butterbach-Bahl, K. Effects of soil moisture and temperature on CO2 and CH4 soil-atmosphere exchange of various land use/cover types in a semi-arid grassland in Inner Mongolia, China. Soil Biol. Biochem. 2010, 42, 773–787. [Google Scholar] [CrossRef]
- Laganière, J.; Paré, D.; Bergeron, Y.; Chen, H.Y.H. The effect of boreal forest composition on soil respiration is mediated through variations in soil temperature and C quality. Soil Biol. Biochem. 2012, 53, 18–27. [Google Scholar] [CrossRef]
- Ding, W.; Cai, Y.; Cai, Z.; Zheng, X. Diel pattern of soil respiration in N-amended soil under maize cultivation. Atmos. Environ. 2006, 40, 3294–3305. [Google Scholar] [CrossRef]
Figure 1.
Daily precipitation (mm) and mean air temperature (°C) during the field experiment.

Figure 2.
CO2 efflux (mg·C·kg−1·d−1) from incubations of soil amended with or without biochar and N. Error bars indicate standard deviations of the means (n =3).
Figure 2.
CO2 efflux (mg·C·kg−1·d−1) from incubations of soil amended with or without biochar and N. Error bars indicate standard deviations of the means (n =3).

Figure 3.
Cumulative CO2 emissions (mg·C·kg−1) from the different treatments after 46 days (incubation experiment). Error bars indicate standard deviations of the means (n = 3).
Figure 3.
Cumulative CO2 emissions (mg·C·kg−1) from the different treatments after 46 days (incubation experiment). Error bars indicate standard deviations of the means (n = 3).

Figure 4.
Seasonal dynamics of CO2 emissions for the different biochar treatments. Error bars indicate standard deviations of the means (n = 3). MS and FS denote the maize growing season and fallow season, respectively. Solid line arrows indicate the date of maize broken.
Figure 4.
Seasonal dynamics of CO2 emissions for the different biochar treatments. Error bars indicate standard deviations of the means (n = 3). MS and FS denote the maize growing season and fallow season, respectively. Solid line arrows indicate the date of maize broken.


Table 1.
The cumulative CO2 emissions and dry matter accumulation as affected by different biochar application.
Table 1.
The cumulative CO2 emissions and dry matter accumulation as affected by different biochar application.
| BC0 | BC10 | BC20 | BC30 | ||
|---|---|---|---|---|---|
| Cumulative CO2 Emissions (kg·CO2-C·ha−1) | |||||
| 2014 | MS | 4072.5 ± 99.5a † | 3793.5 ± 148.2b | 3705.5 ± 106.7b | 3592.9 ± 196.6b |
| FS | 1812.1 ± 174.8a | 1720.0 ± 30.8a | 1761.2 ± 49.8a | 1805.5 ± 123.2a | |
| Annual | 5884.6 ± 112.8a | 5513.5 ± 165.3b | 5466.7 ± 120.1b | 5398.4 ± 181.6b | |
| 2015 | MS | 3602.1 ± 37.6a | 3464.9 ± 89.6ab | 3372.0 ± 35.3b | 3228.6 ± 109.8c |
| Dry Matter Accumulation (Mg·ha−1) | |||||
| 2014 | V10 | 1.53 ± 0.06c | 1.81 ± 0.08b | 1.99 ± 0.11b | 2.18 ± 0.10a |
| R6 | 13.71 ± 0.31c | 14.92 ± 0.20b | 15.62 ± 0.15ab | 16.44 ± 0.41a | |
| 2015 | V10 | 2.69 ± 0.14b | 2.83 ± 0.15a | 3.39 ± 0.10a | 3.53 ± 0.11a |
| R6 | 16.09 ± 0.32c | 18.10 ± 0.31b | 18.60 ± 0.28b | 20.01 ± 0.31a | |
Notes: MS and FS denote the maize growing season and fallow season, respectively. † Means within a row followed by the different letters are significantly different at p < 0.05.
Table 2.
Equation fitting between CO2 emissions and soil variables as affected by biochar application.
Table 2.
Equation fitting between CO2 emissions and soil variables as affected by biochar application.
| Treatment | Linear Equation | R2 | Exponential Equation | R2 | |
|---|---|---|---|---|---|
| Un-amended | T0 | y = 7.81x − 22.63 | 0.390 ** | y = 17.24 × 100.099x | 0.570 ** |
| T10 | y = 8.67x − 28.58 | 0.479 ** | y = 16.81 × 100.107x | 0.665 ** | |
| SWC | y = −5.57x + 219.96 | 0.157 n.s. | y = 307.07 × 10−0.062x | 0.225 n.s. | |
| Amended | T0 | y = 6.12x − 6.78 | 0.359 ** | y = 21.62 × 100.078x | 0.495 ** |
| T10 | y = 7.87x − 24.52 | 0.443 ** | y = 18.05 × 100.098x | 0.606 ** | |
| SWC | y = −0.03x + 20.66 | 0.148 n.s. | y = 20.36 × 10−0.02x | 0.134 n.s. |
Notes: T0 and T10, the soil temperature at the 0-cm and 10-cm depth (°C); SWC, the soil water content in the top 20 cm (%). ** Significant at p < 0.001, n.s.: not significant.
© 2017 by the authors. Licensee MDPI, Basel, Switzerland. This article is an open access article distributed under the terms and conditions of the Creative Commons Attribution (CC BY) license (http://creativecommons.org/licenses/by/4.0/).
Share and Cite
MDPI and ACS Style
Shen, Y.; Zhu, L.; Cheng, H.; Yue, S.; Li, S. Effects of Biochar Application on CO2 Emissions from a Cultivated Soil under Semiarid Climate Conditions in Northwest China. Sustainability 2017, 9, 1482. https://doi.org/10.3390/su9081482
AMA Style
Shen Y, Zhu L, Cheng H, Yue S, Li S. Effects of Biochar Application on CO2 Emissions from a Cultivated Soil under Semiarid Climate Conditions in Northwest China. Sustainability. 2017; 9(8):1482. https://doi.org/10.3390/su9081482
Chicago/Turabian StyleShen, Yufang, Lixia Zhu, Hongyan Cheng, Shanchao Yue, and Shiqing Li. 2017. "Effects of Biochar Application on CO2 Emissions from a Cultivated Soil under Semiarid Climate Conditions in Northwest China" Sustainability 9, no. 8: 1482. https://doi.org/10.3390/su9081482
Note that from the first issue of 2016, this journal uses article numbers instead of page numbers. See further details here.