Article

Understanding the Generation of Value along Supply Chains: Balancing Control Information and Relational Governance Mechanisms in Downstream and Upstream Relationships

by
Juan Manuel Ramon-Jeronimo
1,*,
Raquel Florez-Lopez
1 and
Maria Angeles Ramon-Jeronimo
2
1
Department of Financial Economics and Accounting, Pablo de Olavide University, Carretera de Utrera Km 1, 41013 Seville, Spain
2
Department of Business Administration and Marketing, Pablo de Olavide University, Carretera de Utrera Km 1, 41013 Seville, Spain
*
Author to whom correspondence should be addressed.
Sustainability 2017, 9(8), 1487; https://doi.org/10.3390/su9081487
Submission received: 30 June 2017 / Revised: 14 August 2017 / Accepted: 15 August 2017 / Published: 22 August 2017
(This article belongs to the Section Economic and Business Aspects of Sustainability)

Abstract

:
Firms are involved in supply chains to achieve operative efficiency, develop strategic advantages, and generate financial profits. However, there is limited evidence regarding how governance mechanisms influence the generation of value from collaboration. Furthermore, how a particular buyer or supplier position provides benefits to partners is unclear. In this paper, we examine the roles of management control information as both a governance mechanism and a source of dynamic capabilities, and its interaction with relational variables to create and capture value following a demand-side perspective. Two separate studies are developed using multigroup structural equation modelling, which analyse buyer and supplier positions played by the firm as a complex supply chain node. The results demonstrate that the characteristics of information sharing have different impacts on value, depending on the role played in the relationship. Although timely information sharing appears to be the key source of operative and financial value in downstream relationships, disaggregated information sharing generates additional strategic advantages in upstream relationships. The presence of different control-trust frameworks mediates the process of value generation, leading to different managerial and theoretical implications.

1. Introduction

Firms join collaborative supply chains to achieve efficiency and create unique value that neither participant can obtain independently [1,2,3,4]. Research suggests that value extraction is a multifaceted phenomenon that includes different dimensions [5]: As a result of collaborative relationships, partners can improve their operational performance by reducing costs, increasing quality, or improving fill rate, cycle time, and lead-time [6,7]. In addition, partner interdependencies could produce strategic advantages in terms of key resource access, market information, know-how, product innovation, or new business opportunities [8,9,10,11]. As a result, supply chains create financial value for participants [12], which is eventually captured in the form of increases in sales, market shares, or profit margins [11,13]. As a result of collaboration, corporate sustainability, which concerns a firm’s long term success and survival, should be enhanced [14]. As corporate sustainability has been found to depend on sustainable relationships between the firm and its multiple stakeholders [15,16], the supply value-network is expected to emphasize the issue of value creation beyond the boundaries of the firm [17]; however, many relationships do not produce the benefits that are expected to result from collaboration [18] so there is a need of additional investigation into the success factors of interorganisational relationships [19].
Recently, management literature has started to analyse the process of value generation that emanates from supplier networks, considering pooled interactions among partners that appear as interdependent nodes in a complex value system [3,20]. According to the value net perspective, partners create value by combining their unique resources and competences, leading to new, dynamic capabilities [21]. However, research on value nets has “rarely been connected to studies on supply chain management even though the current business environment clearly requires companies to create value through their supply activities and supply networks, and to create it more efficiently” [4]. The need for a better understanding of the potential of supply chain management in value generation has been emphasised by both academics and practitioners [5,11,18]. Two unanswered questions emerge from a conceptual perspective [4,22]: a deeper comprehension of value generation mechanisms, and a sound understanding of the multidimensional nature of value in supply chain relationships.
Supply chain value is promoted through information sharing and tight coordination mechanisms between partners [3,4,23] which relies on two theoretical foundations: the resource-based view (RBV) and the transaction cost economics (TCE) approach. The RBV literature conceives of information sharing as a source of dynamic capabilities in terms of information visibility (accurate, up-to date data) and supply chain flexibility (adaptability to data changes), which improve market understanding and enhance competitive efficiency [24,25,26,27,28]. Additionally, information sharing appears to be a source of relational competence that fosters value-enhanced organisational processes and collaborative advantages [7] reduces information asymmetry [29] and mitigates opportunism [30] leading to operational and strategic benefits [7,11,26]. However, although informational capabilities are critical to maintaining a successful relationship [31] evidence on how these mechanisms interact to govern transactions and create value is “disjointed, largely anecdotal, and without a strong theoretical underpinning” [32] (p. 45).
TCE provides a well-known framework for deep analysis of the role of information sharing to govern collaborative transactional relationships [33,34]. In TCE, collaborative supply chains are viewed as hybrid structures that combine market and hierarchical characteristics [35,36,37]. As a result, supply chain management requires hybrid governance mechanisms that integrate control-related information and trust-based mechanisms that either substitute for or complement each other [37,38,39,40,41]. Although the control-trust debate has been largely analysed by the literature, conclusions are not definitive [5,42,43]. One of the reasons for this lack of consensus is the misunderstanding of the roles that control and trust play in the management of interfirm relationships [37] so there is a need for ‘considering such multiple roles (…) to clarify why, in some cases, trust and control assume a certain relationship and, in others, an opposite relationship’ [42]. Vosselman and Van der Meer-Kooistra [44] advanced on the trust-control nexus and theorised them not as substitutive or complementary but as interacting governance mechanisms that are promoted by information sharing. Within this framework, accounting information sharing appears to be a collaborative device in three scenarios: accounting for control that prevents opportunistic behaviours (basic scenario), accounting for relational signalling that builds trust and commitment (intermediate scenario), and accounting for stable and durable relationships that produce positive expectations for future behaviours and could produce higher value (advanced scenario). However, this integrative framework has not been tested empirically.
The role of information sharing with regard to supply chain performance also depends on partners’ position within the chain and their power-dependence balance [11,45,46,47,48,49]. Although both partners share the objective of value generation, their operational and commercial goals largely differ [46,50]. The overall firm, conceived of as a complex node inside a value net, could extract different benefits from the collaborative supply chain, depending on its position as either buyer (upstream supply chains) or supplier (downstream supply chains). Thus, “more intensive (…) studies of business relationships where the role of different organisational units and the relationships between them are investigated in detail” [51] are necessary for an understanding of how value can be co-created in the relationships within the supply chain [52].
Integrating the TCE approach, the RBV view, the value net perspective, and the demand-side multidimensional concept of value, this research analyses the multiple roles played by information sharing, as a source of dynamic capabilities and as a hybrid governance mechanism, and theorises and empirically tests its effects on value generation through relational signalling. Different characteristics of management control information are analysed to clarify the substitutive, complementary, or interactive relationships between control and trust-based mechanisms and its effects on interorganisational value. Considering the firm as a complex node within the supply chain, both buyer and supplier roles are analysed in an attempt to understand the full impact of information on value for each participant. Our primary research question is ‘How do the characteristics of management control information sharing interact with relational variables (trust and continuity expectations) as a source of dynamic capabilities to create and/or capture value for partners?’
This paper contributes to the literature in several ways. It departs on a multiple theoretical perspective to explain the governance practices and relational variables as mediators of value chain generation [5]. To formulate this explanation, the theoretical framework of [44] is tested and extended towards value creation and capture [4,53] the conceptualisation of three interconnected value dimensions provides guidelines for relationship value modelling [4,22]. Although previous studies have analysed value generation while considering independent buyers’ or suppliers’ perspectives, this study compares both roles performed by the firm as a multi-relational supply chain node. Such comparison is critical to an understanding of how dimensions of value are synergistically extracted from upstream and downstream relationships and translated along the supply chain. Evidence of the multifaceted nature of value and the presence of different control-trust frameworks is found, which creates possibilities for future theoretical and empirical research.
In the following section, we review the literature to provide a theoretical backdrop to our proposal. In Section 3, we develop our model and define the research hypotheses. Next, the methodology is described followed by hypothesis testing and results. Section 5 presents a discussion and implications of results. Finally, we highlight limitations and suggestions for future research.

2. Literature Review

In this section, we analyse the prevailing theories regarding the relevance of governance mechanisms and information sharing to the management of supply chains and the creation of value.

2.1. Governance Mechanisms in Collaborative Supply Chains

2.1.1. TCE Perspective

The TCE literature has largely examined the effectiveness of hybrid governance mechanisms with regard to managing interorganisational relationships [28,30]. Formal controls and trust-based mechanisms have been proposed for managing opportunistic behaviour, safeguarding specific investments, and minimising transactions cost [33,34,36,43].
Trust is defined as the extent to which partners perceive others as credible and benevolent [54,55]: Credibility relates to the extent to which a firm believes that another party possesses the expertise required to perform the transaction effectively and reliably (thin trust), benevolence refers to the partner’s belief that the other party has intentions and motives that will benefit the relationship, even if new conditions without prior commitment arise (thick trust). Trust has primarily been viewed as a crucial governance mechanism that promotes voluntary, nonobligating exchanges [56] which compensates for legitimate negative expectations about future partner behaviours [44]. Trust between partners influences the relationship in three primary manners [54,55,57,58]: reducing the perceived risk of opportunism, building expectations that short-term unfairness will be eliminated in the long-term and that potential conflicts will be easily dissolved, and reducing interorganisational transaction costs.
Management control (MC) mechanisms are formal rules, procedures and policies established to safeguard, monitor and reward desirable performance, which are codified in contractual arrangements [59]. Formal controls include output control and process control, both of them relying on accounting information [60]. Output control refers to the degree to which partners monitor the outcomes produced by the relationship; output control is achieved in three steps, defining the dimensions and standards of performance, measuring the performance and comparing with targets, and rewarding results that reach these goals. Process control refers to the extent to which partners monitors the behaviours or means used to achieve the desired outputs, process control ensures that desirable actions are performed while also preventing undesirable actions [37,44]. The debate regarding control and trust as governance mechanisms has predominantly concerned (i) their substitutive or complementary character; and (ii) the role that information sharing plays on it [35,37,39,42]. The substitution perspective considers trust to be a substitute for control: more control results in less trust and vice versa [35]. In the complementary perspective, control and trust are viewed as being mutually reinforcing [61] where trust emerge through control mechanisms [62].
MC information sharing refers to the extent to which critical, often proprietary, information is communicated to the partner [63]. Although MC information is thought to have an impact on level of trust [61], its direct role in trust building has been largely forgotten [5]. Recently, Vosselman and Van der Meer-Kooistra [44] extended the accounting-control-trust nexus by analysing MC information’s triple role as a device of control, relational signalling, and stable relationships. In the simplest framework, MC information is conceived of as a formal control device that compensates for legitimate negative expectations for potential partner’s opportunism [35,64]. Accounting for control facilitates the alignment of partners’ interests and entails monitoring, producing thin trust at the level of the transactional relationships [29]. However, these embedded governance structures are necessary but not sufficient for the continuance of the relationship. As a consequence of environmental uncertainty, contractual clauses are not complete, so additional incentives for opportunistic behaviour emerge [41]. Such relational risk can be mitigated by building thick trust, which reflects positive expectations regarding partner’s future behaviour [65]. In this intermediate framework, MC information, in the form of ad hoc calculations and accounts, is perceived as relational signals that illustrate partners’ continued commitment and intentions to behave co-operatively, enlightening self-interest, and leading to identification issues [61,66]. Finally, in the advanced framework, control and trust interact to fully manage behaviour uncertainty, producing stable and durable relationships in terms of future transactions [44]. Building thick trust requires an embedded governance structure, in reverse, trust building enhances the credibility of formal controls. However, the balance between control and trust is key to the long-term survival of the relationships and must be closely monitored. If the control exceeds or does not reach the legitimate threshold of control, negative relational consequences could be obtained and thus produce mistrust or fail to generate zero-positive expectations, respectively.
Besides, it is not the extent of shared information but its characteristics that contribute to develop durable relationships [67]. In accordance with [68], four dimensions of information have been identified to impact on managing interorganisational relationships: scope (narrow to broad), timeliness (slow/standard to fast/customised to requests), aggregation (summarised to very detailed), and integration (one-unit information to multiple-unit information). These four dimensions describe MC information’s level of innovativeness, which can be regarded as innovative (right-side characteristics) or more traditional MC (left-side characteristics) [69].
Innovative information has been found to be particularly useful in the presence of high levels of uncertainty and decentralisation, new methods of competition, or more highly interdependent relationships that need to be proactively managed [17,67]. Focusing on supply chain, the literature has highlighted the effects of two of these innovative informational characteristics on the fostering of partner collaboration: timely (accurate, fast, and customised) and disaggregated (flexible, detailed, and relevant) data [68,70]. Timely information reduces relationship uncertainty, allowing managers to adjust their activities in response to continuous changes and solve problems as soon as they occur, in addition, the frequent exchange of strategic and operational information reduces dysfunctional conflicts [58,71]. Disaggregated information provides managers with a better understanding of problems and alternative solutions, improves decision making and facilitates adaption to partners’ priorities and goals [72]. There is evidence that purchasing and sales managers perceive innovative information as more useful information to increase performance [73]. However, the effectiveness of innovative information in governing supply chain relationships has not been suitably investigated.

2.1.2. RBV Perspective

From the RBV perspective, the governing of collaborative relationships is focused on the management of partners’ resources and capabilities for the development of relational competences, competitive advantages, and superior value [1,7,28,74]. Supply chain relationships are viewed as a source of dynamic capabilities embedded in relational routines, organisational skills, and knowledge processes [75]. To acquire and exploit such capabilities, partners must establish a relational governance system that incorporates effective communication protocols and information sharing [1,30]. Two important information capabilities can be obtained from collaborative supply chain relationships: information visibility and supply chain flexibility [24,28]. These capabilities are valuable with regard to creating competitive advantages in dynamic markets because no individual firm can possess them, and both are useful only if partners cooperate within the supply chain [28].
Information visibility refers to the degree to which partners share timely, accurate, and relevant information related to demand and supply for control management and decision making [60]. Such information shared between buyer and supplier facilitates forecasting, planning, product design, and produce scheduling, thus controlling partners’ opportunism and reducing the bullwhip effect, information asymmetry and opportunistic behaviours [25,26,49].
Supply chain flexibility refers to the degree to which partners meet customers’ requirements speedily enough to respond to changes in dynamic manufacturing and market environments [27,28]. From an offering perspective, supply chain flexibility requires a flow of detailed ‘what-if’ decision-supporting information that facilitates decisions regarding changes in product offers with current partners [76]. From a buyer perspective, sharing extensive, disaggregated information with suppliers allows for quick responses to financial, environmental and market changes [49,77], thus increasing commitment in the relationship [78].
Consequently, both capabilities seem to be closely connected to the MC information sharing characteristics provided for in the TCE framework: although timely information can be viewed as a source of information visibility, disaggregated information produces supply chain flexibility.

2.2. Value Generation in Collaborative Supply Chains: A Multidimensional Approach

The supply chain literature has devoted considerable effort to establishing the antecedents of performance and value for collaborative relationships. Prior research has theoretically argued that firms enrol supply chains because of an expectation of benefiting from the relationship [12,79]. Empirical research has supported the connection between cooperation and performance, finding that closer relationships improve partners’ performance [10,11,32,36]. Different measures of supply chain performance have been proposed, mostly focused on the viewpoint of buyers or suppliers [5].
The analysis of supply chain value has emerged increasingly relevant in recent years, linked to the literature on value nets [4,20,80]. The concept of interorganisational value generation is not new, and could be defined as the “process by which the capabilities of the partners are combined so that the competitive advantage of either the hybrid or one or more of the parties is improved” [81] (p. 241). This concept overpowers the vision of Porter’s traditional value chain, by introducing the links between firms in the supply chain as additional sources of value to the activities performed by each particular partner [17]. If the view of dynamic, interdependent networks, in which firms are complex nodes maintaining collaborative relationships with other companies, the concept of value net is introduced. A value net is defined as a dynamic, flexible network in which partners co-create value through collaborative relationships by combining their unique resources, competences, and capabilities, creating a business environment in which each firm can be successful [20,80].
To be effective, the orientation of value nets should overcome the firm-based point of view and adopt an end-user perspective [20]. In dynamic markets, customers are key to success, so value generation should rely on maximising the value and satisfaction perceived by customers. Thus, value analysis should shift from a firm-centric position towards a customer-centric one based on the provision of specific products to interconnected customers [4]. In accordance with an end-user perspective, demand side-theory has emerged in recent years to explain the process of firm value generation [81,82,83,84]. Although this line of research follows end-consumer perceptions to explain value, there is a demand for integrated demand-side and dynamic capabilities arguments that address the generation of value and its transmission between value net participants [4,53,84].
In demand-side theory, a key distinction is made between value creation, which refers to the benefits that the firm’s products provide to consumers (e.g., [82,83,84]) and value capture, which is determined by the portion of value, in the form of profits, that is captured or appropriated by the firm itself rather than other competitors [53,83,85]. In an initial stage, producers compete for customers by offering the maximal use value to consumers, only after this selection can the producer compete with other firms to capture value [85]. Accordingly, attention to value creation appears to be a stage preceding the devotion of attention to value capture [53].
Value creation is determined by consumers’ willingness to pay [53] which relies on both the drivers of customers’ value perceptions [86] and the ability to select adequate competitors [87]. Because value creation is determined by consumer evaluations, the literature has largely analysed the relationship between production characteristics and consumer choices [88]. Operational aspects related to functional product characteristics, such as affordable quality, service support, price, delivery flexibility, location convenience or usability, have appeared to increase the value perceived by consumers [22,83]. However, suppliers’ strategic decisions also have the potential to increase consumer benefits. Decision on product innovation and research efforts, diversification, access to unique resources, expert sales assistance and know-how, or personal interaction allow to create value by increasing the customers’ stock of human capital and knowledge [22,53,89] also reducing the consumer attention, search cost, and human capital that must be expended during the consumption process, reducing consumers’ uncertainties regarding benefit expectations, or enhancing consumption experiences through the sharing of experts’ human capital [83].
Value capture refers to the firm’s appropriation and retention of payments made by customers, which is influenced by market structure, resource ownerships, and the relative power of actors in the supply chain [53,83]. Value is captured when a maximal portion of profit is appropriated by the firm itself rather than by other competitors, and those payments are retained by resisting claims from upstream or downstream members of the supply chain [83] thus, value has been intuitively related to financial variables such as sales growth, operating income, profitability or market share [85].
Previous dimensions of value are consistent with the value net literature, which distinguishes among different perspectives in value creation, including the ability to understand and respond to customer requirements (operational perspective), and the ability to exploit relational capabilities and knowledge to develop strategic core competences (strategic perspective) [4]. Similarly, the ability to improve the firm’s profitability and competitive position in relation to other competitors (value capture perspective) is conceived as the main goal of each individual firm in the net [4]. Table 1 summarises recent studies on supply chain performance, which are classified according to value-based dimensions and the view of the particular partner being analysed.

2.3. Effects of Firm Roles within Inter-Organisational Supply Chain Relationships

The supply chain literature has devoted little effort to documenting the effect of collaborative relationships on partners’ performance and value from concurrent buyer and supplier perspectives [11,42,49,57]. Although the literature has largely assumed that partners enter into alliances for mutual gain, it is not clear whether both partners benefit equitably, so additional evidence becomes critical [5,91]. Some researchers have found that ‘win-win’ outcomes are possible but each partner ‘wins’ differently [11,32,47,92] although buyers appear to be concerned with cost control, suppliers are focused on gaining competitive advantages that lead to value creation and long-term profitability [46,91].
Mouritsen et al. [93] observe that the ‘win-win’ ideal could evolve into ‘win-lose’ and asymmetric value exchanges for buyers and suppliers. Additionally, Corsten and Kumar [2] find that even if both partners benefit from supply chain relationships, suppliers more strongly feel that they are receiving less than they deserve [2]. Feelings of inequity are found to negatively impact trust and continuity expectations, in particular for suppliers [57,94], leading to lower financial performance and less value capturing [11]. Asymmetries in partners’ relative power and dependence lead to different levels of trust and commitment [57] affecting operational value creation [11,46].
Partners can also have differing perceptions of the usefulness of governance mechanisms and innovative information, suppliers have been found to be more interested in timely information because they need customer information for internal planning processes, whereas buyers could prefer flexible information so that plans can be adjusted accurately [70]. Evidence has also demonstrated that buyers consider inter-organisational trust a more important factor on the supply chain success than suppliers do [11,57,92].
Although firms integrated in supply networks play buyer and supplier roles simultaneously with upstream and downstream partners, this point has been ignored in the supply chain literature. Frohlich and Westbrook [95] observe that firms integrated on both supplier and buyer sides tend to improve productivity and non-productivity performance. However, to our knowledge, there is no research that analyses how the role in the supply chain affects the efficacy of governance mechanisms and how value could be asymmetrically created, captured, or even destroyed from each position. Instead, the literature on inter-organisational relationships has largely focused on the buyer perspective [13,66,96,97] whereas downstream relationships have scarcely been studied [97].
The limited literature that distinguishes between the buyer and supplier perspectives has assumed the unique, sole role of each analysed firm in the supply chain [7,11,32,46,52,70,92]. Departing on it, this paper simultaneously analyses the buyer and supplier roles of the firm in the generation of value along collaborative supply chains. To do so, the model explores buyer and supplier similarities and differences along the supply chain. The hypothesized relationships will be tested separately using two independent samples [11]: The first study sample examines the model from a buyer role’s perspective, while the second study examines the collaboration model from a supplier role’s perspectives. Firstly, the separate models will be compared using invariance testing to determine if differences exist between the buyer sample and the supplier sample. Then, comparisons across the two models will focus on comparing: (1) if the model’s paths are the same for each model; (2) if the hypotheses are supported.

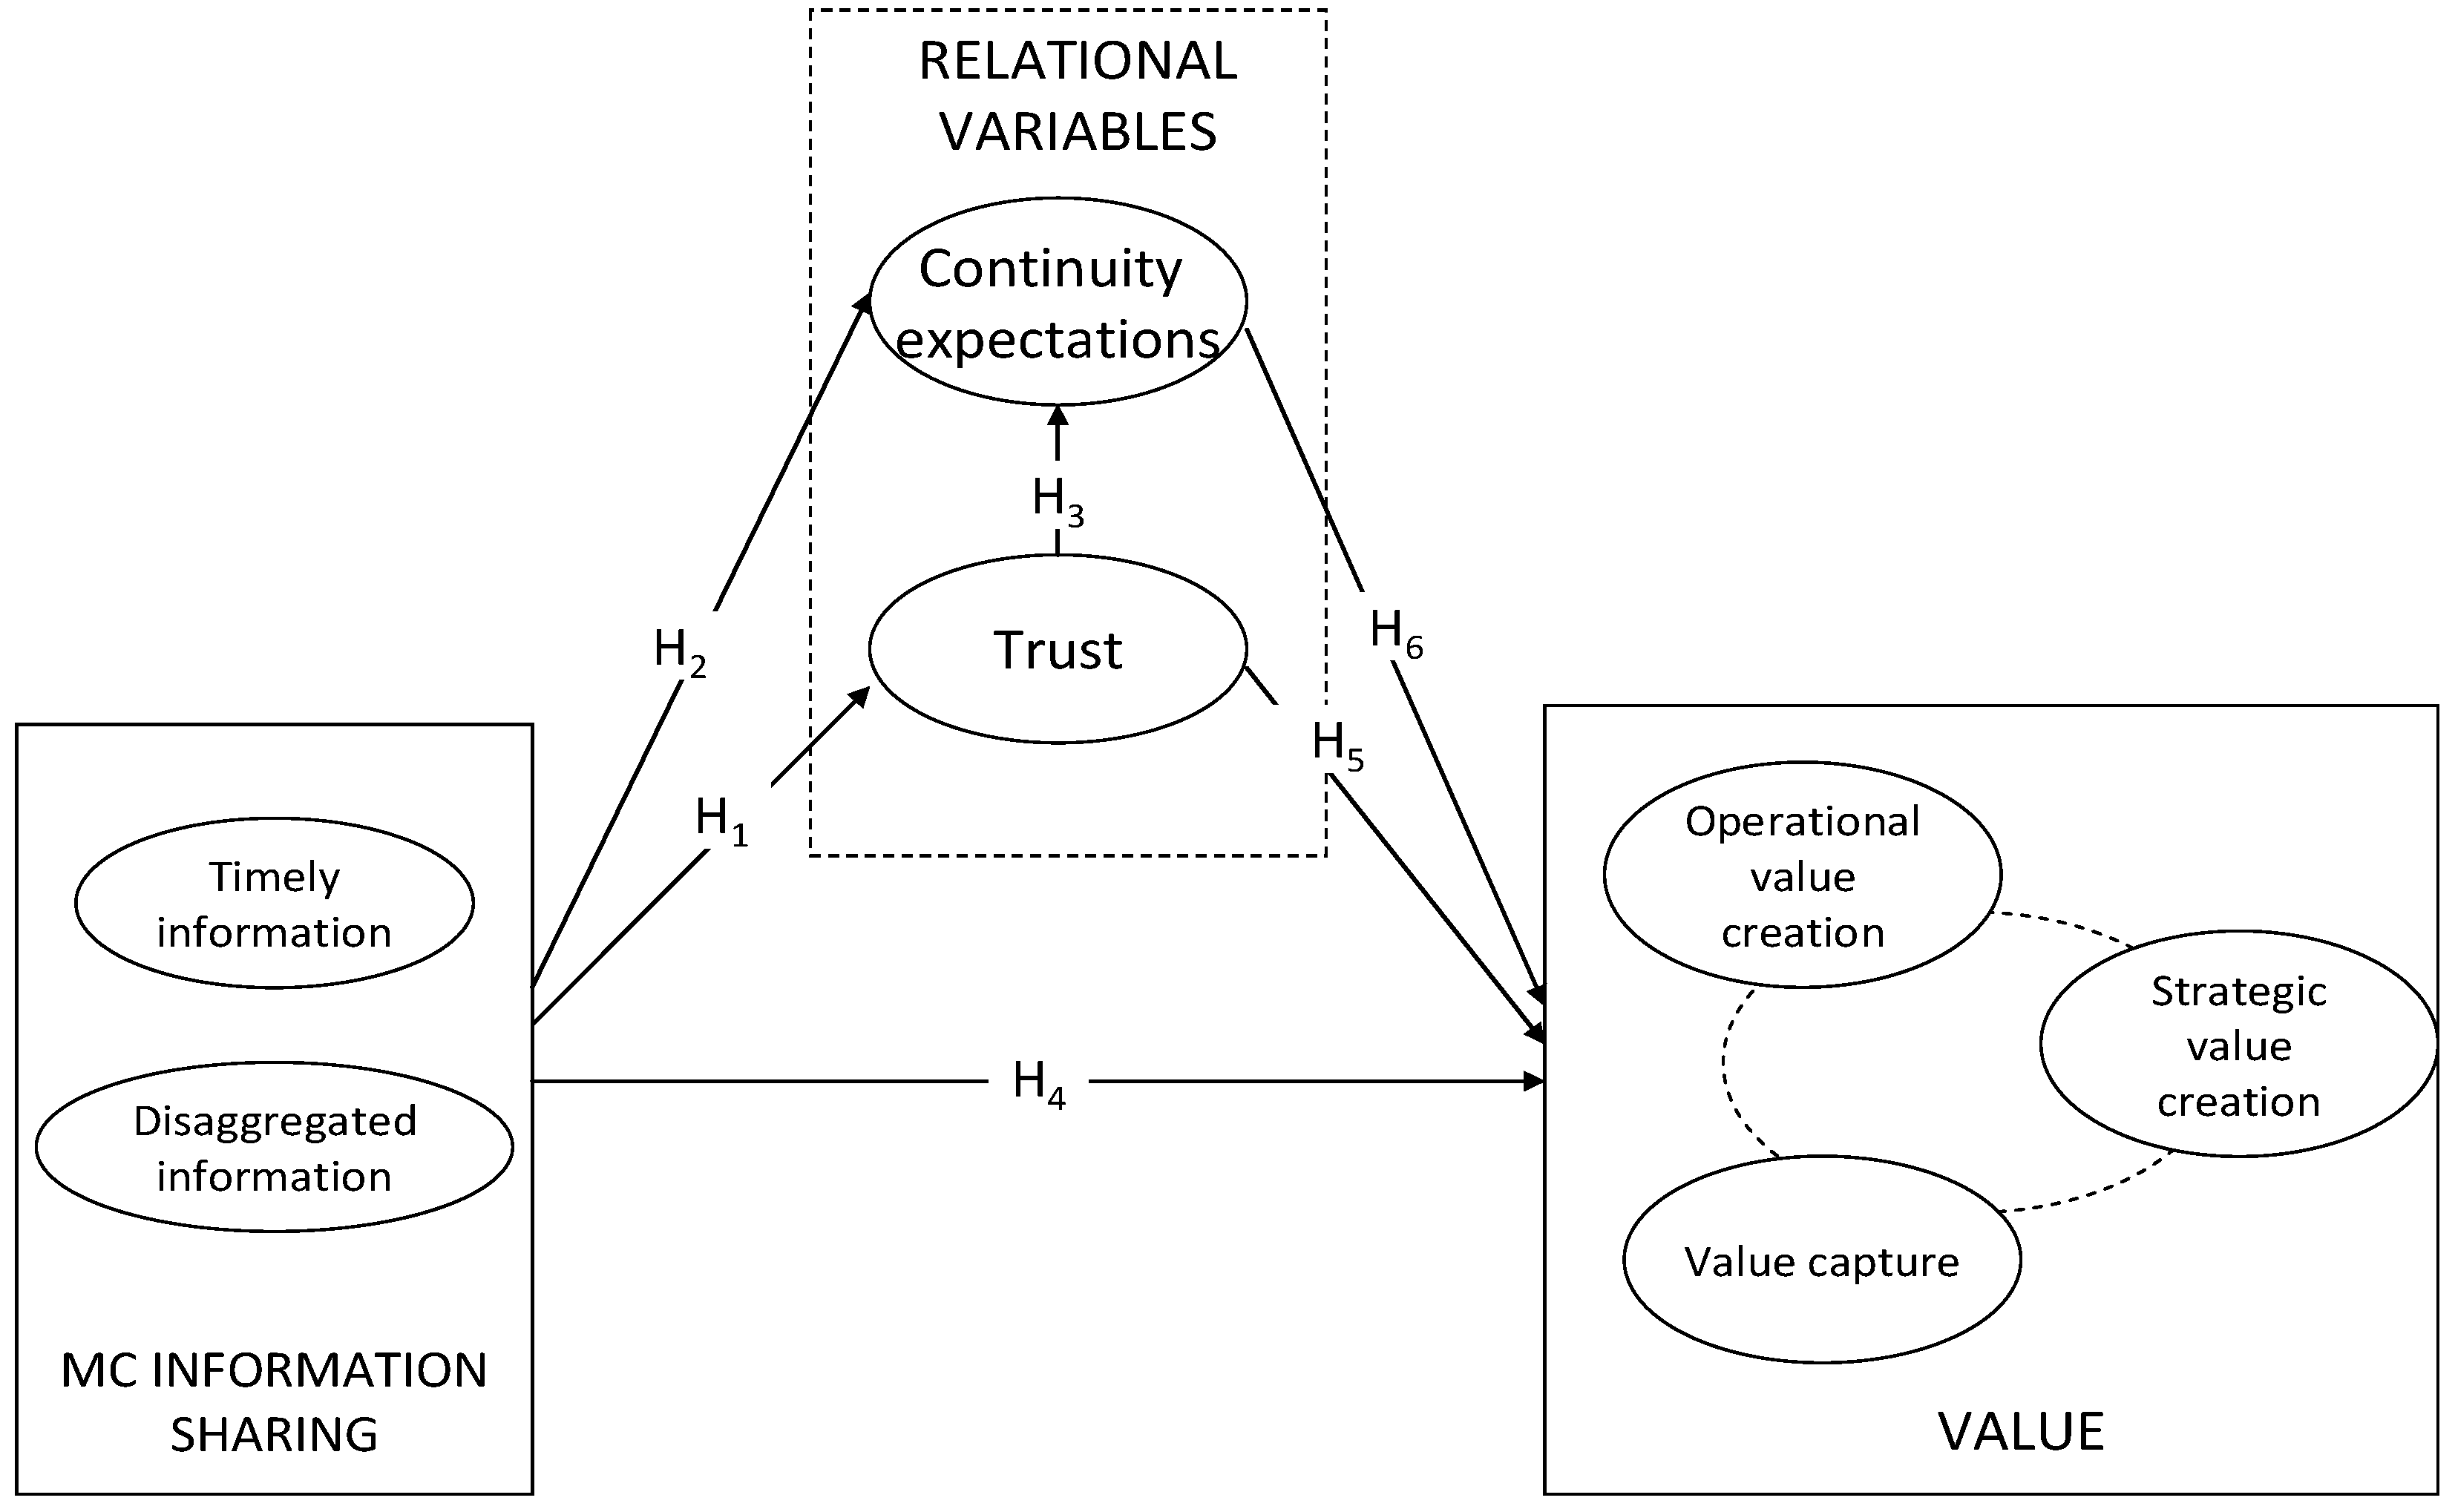
3. Model and Hypotheses

Collaborative supply chains require appropriate governance mechanisms to develop dynamic capabilities that generate value for partners and produce durable relationships [7,14,28,44,84]. In this framework, innovative information sharing would play a double role, first, it is a device for relational signalling, which promotes trust and positive expectations of continuity [44,65], second, it is a source of valuable interorganisational capabilities, in terms of information visibility and supply chain flexibility [28]. Consequently, more timely, disaggregated information facilitates the governance and exploitation of collaborative relationships, achieving greater value for partners [5,98]. Because the position of the firm along the supply chain could affect the process of creating and capturing value, different models are developed for buyer and supplier roles (Figure 1).
Information sharing has been alternatively perceived as a resource [74,99] a source of capabilities [31,100] and a dynamic capability in and of itself [7,28,101]. By sharing relevant, accurate, complete, and confidential information in a timely, frequent manner, partners send relational signals that exhibit both their trustworthiness and their expectations of continuing the relationship [28,32,44].
Trust both acts through information and is a result of it [28,44]. The literature has suggested that intensive bilateral information sharing reduces uncertainty, thereby engendering appropriate levels of trust between partners [1,61,102]. Sharing information signals that the other party’s intentions and plans are benevolent [103]. Kwon and Suh [104] add that information is crucial for building trust because it enables partners to understand each other’s routines and allows for conflict resolution. Nyaga et al. [11] find that information sharing has a positive impact on trust for supply chains, which is stronger for buyers than suppliers. In particular, the innovative characteristics of information are found to play a crucial role with regard to relational variables [70]. The sharing of disaggregated ‘what-if’ information promotes supply chain flexibility [7,28], increases coordination and adaptation [76,78] reduces relational risk [40] and indicates trustworthiness [66]. As the frequent exchange of timely and accurate information, information visibility promotes coordination and joint-solving processes, increases cooperation, and indicates that a partner is trustable [55,63,71]. Therefore:
Hypothesis 1 (H1).
Sharing innovative information within a collaborative supply chain has a positive effect on trust in a relationship.
Supply chain collaboration relies on partners’ desire to maintain the relationship in the long term [32,54,105], even if it implicates lower benefits in the short term [60,106]. Partners require considerable time to develop the knowledge required to obtain a high level of relationship efficacy; it includes joint technical expertise, mature personal relationships, and broad prior experience [66]. To exploit durable strategic advantages and promote cooperation, partners should demonstrate a long-term commitment to the relationship by mutually signalling their expectations for future interaction and continued exchange [1,32]. Such continuity expectations are a result of open, frequent communication [105]. Information sharing creates positive expectations for the capabilities of the partner [107], which increase willingness for continuity [108]. The timely exchange of information increases behavioural transparency and reduces information asymmetry [29,32], leading to greater confidence in the future of the relationship [71]. Complementary, disaggregated information supporting supply chain flexibility increases the partner’s expectations of being involved in the relationship in the future [78]. Accordingly, the following is hypothesised:
Hypothesis 2 (H2).
Sharing innovative information within a collaborative supply chain has a positive effect on continuity expectations.
Trust has been suggested to reinforce continuity in supply chains [54,109,110]. Partners who trust each other will be more satisfied and perceive less risk, so they will devote more effort to remaining in the relationship when facing an unknown or untrustworthy alternative [111]. Morgan and Hunt [55] find a positive relationship between trust and expectations for collaborative relationship continuity. Ganesan [54] finds that partners involved in trustworthy supply chain relationships devote more effort towards ensuring its continuity. Similarly, Pavlou [102] observes that two dimensions of trust (credibility and benevolence) have a positive effect on continuity expectations in supply chain relationships. With this caveat in mind, we submit the following hypothesis:
Hypothesis 3 (H3).
Trust has a positive effect on continuity expectations.
Information sharing interacts with relational signalling to produce durable relationships that improve partners’ performance and generate value [11,32,44]. Studies have revealed that information sharing can lead partners to feel that the other’s needs, priorities, goals and values are similar to their own [44]. This sense of common identity or ‘attachment’ provides a template for problem solving that reduces the costs of protection from opportunistic behaviour, saves costs through operational efficiencies, and leads to higher performance [47,49,90,98]. The exchange of information between partners is crucial to the reduction of costs and the generation of financial profit [7,13], as well as for the effective and efficient use of resources, which lead to operational advantages (quality, time, delivery, product design, after-sale services) that create value in terms of customers’ expectations [11,32]. Under the value net perspective, the sharing of information is a driver of exploitation of the value potential of supply chain relationships, facilitating coordination [3], knowledge accumulation between partners, and an understanding of end-customer needs [4]. So information sharing is postulated to have a direct and positive effect on partners’ value creation and value capture, which has been documented in both buyer and supplier positions [5,7,11]. However, it not simply the amount of information shared but also the quality and relevance of such information that results in higher value [55]. Interorganisational relationships in which parties share timely, accurate, flexible, and relevant information have been observed as being more successful for partners than those that do not exhibit such characteristics [63]. Information visibility, in terms of frequent, accurate information, facilitates the development of relational capabilities that increases parties’ benefits [31]. Firms that share disaggregated, flexible data are able to react to changing dynamic environments and retain customers [78], generating value from their alliances [29,47]. Therefore, we propose the following hypothesis:
Hypothesis 4 (H4).
Sharing innovative information within a collaborative supply chain has a positive effect on value.
Trust is a relational signalling mechanism considered key to gaining value and reducing risk in collaborative relationships [41,56,102,112]. Trust has been traditionally associated with successful buyer-supplier relationships [58,103], particularly if the buyer must encourage the supplier to be innovative and a knowledge source [102]. Empirical researchers have discovered a strong relationship between trust and strategic competitive advantages [2,55,92,103], trust and operative performance [11,105], and trust and financial profitability [7,63,104]. As a driver of long-term collaboration, trust’s potential to generate value has also been indicated in the value net literature [4]. Thus, we hypothesise the following:
Hypothesis 5 (H5).
Trust has a positive effect on value.
In addition to trust, value-creating supply chains are thought to rely on future-orientated relationships [4]. Partners’ expectations for continuity signal relational commitment, improve task coordination, display cooperative behaviours, and promote synergies between parties’ capabilities to develop a stronger basis for strategic advantage [113,114], which supports mutual gains [47]. Noordewier et al. [24] state that long-term supply chain agreements have a positive impact on the reduction of buyers’ acquisition costs. Zeller and Gillis [115] find that stable supply relationships increase buyer’s financial profit; also, they enhance supplier attention to buyers’ needs, relying on a better understanding of their needs, reduced cost, and increased profit [90,116,117]. The above argument leads to the hypothesis:
Hypothesis 6 (H6).
Continuity expectations have a positive effect on value.
As stated previously, relational variables are proposed as a mediator of the links between innovative information sharing and value along the supply chain. Adding to the effects of MC information sharing, trust and continuity expectations are suggested to produce implicit self-enforcing incentives to maintain the relationship and generate value [11,55,104]. Trust has been largely considered a key mediating variable between MC information sharing and supply chain performance [11,55,118]. Under conditions of trust, partners are more open to exchanging strategic information and knowledge, which is critical to realising the benefits of collaborative relationships [2]. In addition, long-term expectations provide the adequate context for facilitating and exploiting strategic information and knowledge [32], resulting in lower transaction costs, reduced relational risk [40,54], and enhanced transaction value [11]. So we hypothesise the following:
Hypothesis 7 (H7).
Relational variables (trust and continuity expectations) have a positive mediation effect on the relationships between innovative information sharing and value.
We note that, in line with previous researchers in the field of interfirm relationships, we use dyadic business relationships within a supply network context to test previous hypotheses [47,48,49,119,120]. This point of view has been adopted to develop the research model in an affordable way, but it represents a partial view of the functions of network relationships; in practice, each dyadic buyer-supplier relationship (‘strong network ties’) is connected to several different relationships than the either the supplier or the buyer has (‘weak network ties’) [120]. Thus, this research mainly focuses on the primary functions of network relationships, meaning the direct effects on the two partners of their interaction in a particular strong network tie [121]; they include the leverage of information, activities, and resources between the two parties, who learn by cooperating to raise mutual benefits. Furthermore, secondary network functions capture the indirect effects of a dyadic relationship because it is directly or indirectly connected to other relationships; they represent chains of activities that involve more than two firm, resources controlled by more than two firms, and shared perceptions and goals by more than two firms. Since secondary network functions also impact on partners’ behaviour, the results of our model implicitly integrate part of them, even if such effects can not explicitly be separated through the statistical analysis. In summary, our theoretical model focuses on ‘strong ties’ and the strength of a ‘dual network architecture’, where a small core of strong ties is integrated with a large periphery of weak ties [120]. It implies the need to include the strength of ties as an exogenous variable to analyse interorganizational relationships: We have approached the operationalization of tie strength by defining two control variables on the importance (trade volume) and length of the relationship (Table 2); it closely approaches the definition in [120], which considers (1) the relationships’ overall duration; and (2) the intensity of collaboration. Such an approach is not a perfect way to approach supply network relationships, which could affect the interpretation and potential of generalisation of results.

4. Research Methodology

4.1. Sample Design and Data Collection

Our empirical analysis aims to examine the hypothesised relationships among information sharing, relational variables and value within a collaborative supply chain (Figure 1). Because of the differing nature of relations that the firm establishes with downstream and upstream partners, the unit of analysis is the firm and its interorganisational supply chain relationships. For each focal firm, two roles are analysed: the supplier and the buyer perspectives.
A cross-sectional mail survey was developed and implemented for data collection. In accordance with other studies, key informants were considered sources of data [32], both purchasing and sales executives play strategic roles in firms, being the most knowledgeable with regard to managerial aspects of inter-organisational supply chains. Two subsamples were considered: the first targeted purchasing managers (buyer role), and the second targeted sales managers (supplier role). Purchasing and sales managers were requested to focus on a specific upstream or downstream relationship, respectively, being representative of their supply chain collaborative interactions. For the purposes of the survey, a collaborative supply chain relationship was defined as ‘a relationship in which participants (buyers and suppliers) work as a team and adjust themselves to mutual needs to achieve aims’. Research hypotheses were tested separately for both roles. Invariance analysis was performed using multi-group structural equation modelling (SEM) to test whether differences between roles were statistically significant [11,77].
The sample frame consisted of original equipment manufacturers covered under the two-digit SIC levels 35, 36, and 37 (general machinery, electrical and electronic machinery and transportation equipment), drawn from the DUM database, which captures the 50,000 largest Spanish companies. Typically, these firms are manufacturers that buy physical products from and sell physical products to other industries and dealers. They are regularly embedded in collaborative supply chains for access to competitive advantage in terms of new capability, resources, and knowledge [3,77,106]. This sample frame allows a wide range of inter-organisational relationships to be captured for the guarantying of model validation. The sample population was controlled for extraneous variance by excluding bankruptcy firms and those that emerged from or were purchased by business groups. This refinement resulted in a list of 1380 potential respondents for each buyer and supplier role.
The development of the survey and the sampling procedures followed the guidelines suggested by [122]. A three-stage analysis was designed to guarantee the adequacy of the survey to the proposed conceptual model. First, preliminary field interviews were conducted with 4 industry representatives to assess the relevance and clarity of the question items and constructs. Based on the feedback obtained from interviewees, redundant and ambiguous items were deleted or modified. A preliminary questionnaire was pre-tested by 8 academic researchers and 6 industrial practitioners. Based on the pre-test, minor changes were made to guarantee that the questionnaire was clear, complete, and concise and that the items were parsimonious. A mail questionnaire was sent to the entire sample population of 1380 buyer and 1380 supplier respondents. All mailings included a cover letter, the questionnaire, and a postage-paid envelope, additionally, in an attempt to increase the response rate, respondents were promised confidential notification of the results. After three recall waves utilising mail letters and telephone calls, 194 usable questionnaires were returned: 104 from buyers (7.54% response rate) and 90 from suppliers (6.52% response rate) (Table 2). The response rate aligns with that reported in recent supply chain management articles [7,77,123].

4.2. Instrument Development

The theoretical model included twenty-five items that measure different facets of six factors. A list of the specific items for our constructs is presented in Appendix A. A seven-point Likert scale with the end points ‘strongly disagree’ and ‘strongly agree’ was used to capture responses for all of the items, with the exception of value variables, for which the end points ‘much worse’ and ‘much better’ were used, because the value generation process implies competitive decisions in dynamic markets, value-based features were measured in comparison with competitors’ relative situation [85,87]. To the extent possible, we adopted existing tested scales from previous supply chain studies, which were adapted to the specific context where appropriate. In some cases, validated scales in intraorganisational environments were adapted to the interorganisational context [124]. In accordance with [122] recommendations, questions were limited to the greatest extent possible in an effort to increase the response rate.
MC information sharing. We measured the two MC information sharing constructs (timely and disaggregated) using an adapted version of the scale from [68], which has been tested in the intraorganisational context, (e.g., [67]). Timely information sharing (TI) was measured in terms of the frequent exchange of relevant data and the reporting of data immediately upon request (six-item scale). Disaggregated information sharing (DI) was measured in terms of the exchange of detailed cost-based information, supporting a ‘what-if’ analysis (four-item scale).
Trust. The six-item scale was adapted from [103], who measure trust by including credibility and benevolence items. Although both dimensions of trust could be considered conceptually distinct [54,71,102], in practice, they are operationally joined [11] (p. 201). Trust (TR) was defined as a one-dimensional construct that measures the respondent’s perception of the partner’s trustworthiness, honesty, ability to provide product and services, promise keeping, and common interest focus.
Continuity expectations. Continuity expectations (CE) were operationalised in accordance with [120], with four items measuring the partners’ belief that they will continue to transact over time and the intensity of partners’ planning based on continuance.
Value. We adapted the measures from the work of [10,22,124,125,126]. Value measurement involves three separate constructs: operational value creation (3-item scale), strategic value creation (3-item scale), and value capture (2-item scale), measured in comparison with competitors. Operational value creation (OV) measures the firm’s fulfilment of customers’ demand in terms of quality, price, and service. Strategic value creation (SV) measures the firms’ relative competitive advantage in terms of research, ability to win resources, and staff training programs. Value capture (VC) measures the profitability (return-on-assets) and market share captured by the firm.

4.3. Nonresponse Bias

Data were collected from respondents with different demographic characteristics, so non-response bias was tested. Nonresponse bias could become a serious research problem if systematic differences between those who responded and those who did not respond appear and if such differences affect results. To address this problem, three tests were run to check for non-response bias in the separate supplier and buyer samples. First, data from earlier and later respondents were compared using chi-square tests [127,128] no significant differences were found between the first-wave and second-wave respondents in terms of primary demographic variables (SIC code, sales volume, and asset volume), and in terms of constructs of the conceptual model, at the significant level of 0.05. Second, buyer and supplier responses from the three SIC codes were evaluated to ensure that the samples were not significantly different. The chi-square test indicated that there were no significant sector differences for either sample (p > 0.05).
Finally, respondents were compared with the population using previous demographic variables. Some significant differences were found across samples of respondents and population profiles at the level of 0.05, suggesting that a non-response bias could be present in the sample; However, the phenomenon being studied has been found to be remarkably resistant to such source of sampling bias [129]: As the conceptual model focuses on relationships, not on individual variables, the diversity of the sample necessary for the acceptance of generalisability is guaranteed with regard to the extent to which all of the relationships are observed across the complete range of size, turnover and industry describing the population. This element suggests that non-response bias is not a major concern for this research.

4.4. Common Method Bias

Data were collected from respondents who answered questions on both the dependent and independent variables, so common method bias may be a problem. Several controls of common method bias were implemented in accordance with [130] recommendations: Evaluation apprehension and item social desirability effects were reduced by offering respondents complete confidentiality and anonymity in collecting and modelling data, in addition, responses were not identified as right or wrong so that they would be answered as honestly as possible.
The potential for common method bias was assessed in accordance with the Harman’s one-factor test [130] bias exists if either a single factor emerges from a factor analysis on all survey items or the first factor accounts for most of the common variance existing in the data. Items were loaded on an un-rotated factor analysis using the criterion based on eigenvalue-greater-than-one. The results revealed eight factors accounting for 69.61% (buyer sample) and 70.91% (supplier sample) of the total variance, respectively. The first factor captured 27.19% of the total variance of buyer responses (22.99% of the variance of supplier responses), which is not the majority of the total variance. A confirmatory factor analysis (CFA) was applied to Harman’s single-factor model [7]; the CFA model fit indices for buyers (X2/df = 3.063, CFI: 0.441, GFI: 0.530, AGFI: 0.448) and suppliers (X2/df = 3.309, CFI: 0.315, GFI: 0.470, AGFI: 0.389) confirmed that no single factor emerged.
To further assess common method bias, an extended measurement model was developed that included both original traits and a method factor [130]. The results of the CFA indicates that the extended model improved the measurement model fit only marginally for buyers (CFI: 0.066, GFI: 0.036, AGFI: 0.012) and suppliers (CFI: 0.067, GFI: 0.044, AGFI: 0.025), the method factor accounted for only 16.167% and 5.024% of the total variance (for buyers and suppliers, respectively), which is significantly less than the threshold of 25%. Finally, path coefficients were similar in both models, with item loadings for the original constructs remaining significant, so common method bias does not appear to be a significant problem in this research.

4.5. Measurement Model Results

On the basis of the assumed causal relationships of different variables and their potential impact on value, we validate the measures using structural equation model (SEM) through Amos 18.0 software (SPSS Inc.: Chicago, IL, USA). Following [131,132] mathematical formulation, let ηi, i = 1, ..., 3 be the latent constructs of value dimension (OV, SV, VC), ξj, j = 1, 2, be innovative information sharing variables (TI, DI), ξj, j = 3, 4, be relational variables (TR, CE). We hypothesize items of {OV, SV, VC} variables, yi, satisfies the following relationship,
yi = f(ξ1, ξ2, ξ3, ξ4) + ζi = ηi + ζi, ∀i
where ζi is an error term with Σi = Cov(ζi), see Figure 1. All of the exogenous variables ξj are hypothesized to impact on each endogenous latent variable (observable), ηi, positively, so,
∂(ηi)/∂(ξj) > 0, ∀i,j.
A linear structural equation can be used to represent Equation (1) as follows,
yi = Γξ + ζi,
where ξ = [ξ1, ξ2, ξ3, ξ4]. The exogenous variables ξ1, ξ2, ξ3, ξ4 are unobservable, so different items of xj, (xjk, j = 1, …, 4) are used to measure ξj for each j. As a result, the measurement model for the vector of the exogenous latent variables is,
x = Λxξ + δ,
where x = [x11, x12, x13, x14, x21, x22, x31, x32, x33, x34, x41, x42, x43, x44] and ξ = [ξ1, ξ2, ξ3, ξ4] (by examining modification indices, correlated errors, and factor loadings, some items were iteratively eliminated to guarantee to improve model fit statistics [133]).
Finally, parameters are estimated using maximum likelihood estimation. We skip additional methodological details on SEM definition, which can be found in [131].
We used CFA to identify the endogenous and exogenous latent variables (measurement model, Equation (4)) and test the hypothesized conceptual model (structural path model, Equations (1) and (3)). About measurement model, the CFA allows the robust examination of the unidimensionality, reliability, and convergent validity of the scales (Table 3, + p < 0.10; * p < 0.05; ** p < 0.01; *** p < 0.001).
Unidimensionality refers to the extent to which the items are strongly associated with each other, and represent a single factor, which is a necessary condition for reliability analysis and construct validation. Both CFA model fit indices and reliability results were used for assessing unidimensionality [132]. CFA was conducted to confirm the factor structure of information sharing, relational, and value-based performance dimensions, using the comparative fit index (CFI), the goodness of fit index (GFI), the adjusted goodness of fit index (AGFI), the root mean square error of approximation (RMSEA) and the normed chi-square (X2/df) [133,134]. For an adequate fit, the literature recommends a cut-off value higher than 0.90 for the CFI index [135], but values over 0.80 indicate a reasonable fit [136]; AGFI and GFI values over 0.9 also represent a very good fit. RMSEA values less than 0.08 [132] or 0.10 [133] suggests an adequate model fit; a X2/df value lower than 3.0 indicates that competing models have reasonable relative efficiency, with values less than 2.0 indicating a good fit [136]. Table 3 suggest a good fit of the hypothesized measurement model.
Convergent validity refers to the extent to which indicators of a specific variable share a high proportion of variance in common. It was initially assessed through an analysis of the reliability of individual factor items [77]; a common threshold is a minimum level of 0.7 for item loadings, which indicates statistical significance for t-values at p < 0.05, items below 0.4 should be eliminated, whereas items below 0.7 could be acceptable in the presence of high model fit-data indexes [133]. As shown in Table 3, item loadings for each factor approach the 0.70 cut-off point and are significant at p < 0.001 based on robust bias-corrected bootstrapping estimates of t-values (10,000 replications). Besides, convergent validity was analysed on the basis of composite reliability (CR), which informs both on the reliability and internal consistency of each construct; as minimum recommended values, CR scores over 0.7 indicate that the variance captured by the construct is significantly higher than the variance indicated in the error component [133,137]. As reported in Table 3, all factors but value capture have CRs greater than 0.7, thus exhibiting adequate reliability; because value capture’s CR scores approach 0.7, considering previous CFA model fit, convergent validity can be accepted.
Discriminant validity assesses the degree to which a construct and its items differ from another construct. Discriminant validity was assessed for all possible pairs of theoretical constructs. For each selected pair, two CFA models were tested by allowing for free correlation between the two constructs (unconstrained model) and then constraining such correlation to 1 (constrained model). A significant X2 difference test for the constrained and unconstrained model was found for each pair of constructs, indicating strong discriminant validity [138]. For each correlation coefficient, a 95% bias-corrected percentile bootstrapping confidence interval was also estimated; since none of them include the value 1, the constructs was found to support discriminant validity [138]. Finally, discriminant validity was also assessed by comparing the square of the root of the average variance extracted (AVE) with the maximum correlation coefficients of latent variables [139]; results should be greater than 1. As presented in Table 4, this ratio was ranged from 1.006 to 2.185, implying that all variables indicate strong discriminant validity [132].

4.6. Invariance Testing

The conceptual model was tested using AMOS 18.0 (SPSS Inc.: Chicago, IL, USA). Firstly, a multi-group analysis was conducted to test invariance across samples [140], i.e., whether relationship perceptions differ across buyers and suppliers. Authors as [141] demonstrate that accurate invariance tests could be obtained if sample sizes are slightly different; in our model, two groups of 104 (buyers) and 90 (suppliers) responses are considered, so the multi-group analysis should yield accurate results; this step is needed before comparisons across the buyer and supplier model can be made. Following past studies, invariance tests were assessed at three levels [140]: configural invariance, measurement invariance, and structural invariance (Table 5). To determine invariance, the difference in X2 values between the restricted model and the baseline configural model was analysed, a statistically significant difference (p < 0.05) would demonstrate that the models are not equivalent across groups [140]; to prevent a sample size and non-normality bias, a negligible change in CFI values between models is also recommended.
Configural invariance assesses if the same number of factors and factor-loading patterns holds across groups. A baseline model was conducted without imposing any equality constraints on buyer and supplier samples. The chi-square for the baseline model was 381.9 with 299 df, with the following test statistics: X2/df = 1.277 (p = 0.001), CFI: 0.940, GFI: 0.842, AGFI: 0.778, and RMSEA: 0.038. Because the model fit was adequate, the structure of the model could be considered as optimally represented with the factor loadings and paths specified for each sample.
Measurement invariance indicates whether the measurement model is equal across independent groups, showing if respondents interpret measurement items equivalently [141]. First, each factor loading was forced to be equal across buyer and supplier groups (metric invariance): the insignificant X2 difference between this nested model and the baseline model was 9.569 with 13 df (p = 0.729), thus, buyers and suppliers generally interpret measurement items equivalently. Subsequently, factorial invariance was tested by forcing factor loadings and factor inter-correlations to be equal across groups (factorial invariance), the X2 difference (2.014 with 4 df) was also insignificant (p = 0.733), indicating that measurement invariance could be accepted across groups.
Structural invariance assesses the similarity of measurements and structural models across groups. Structural invariance testing was performed by constraining the structural paths to be equal across samples and also by retaining previous equality constraints of paths. The results in Table 5 show that this nested model fit the data well: X2 (329) = 418.478 (p = 0.001), X2/df = 1.272, CFI: 0.935, GFI: 0.832, AGFI: 0.785, RMSEA: 0.038. The X2 difference of 24.992 with 13 df was statistically significant, indicating that the level of association between analysed constructs was different across the buyer and supplier samples. As a result, it is confirmed that the role that the firm plays in the collaborative supply chain relationship (buyer or supplier) significantly affects the way in which innovative information sharing and relational variables impact value creation and value capture.

4.7. Structural (Path) Model

Table 6 summarises the standardised structural weights of all groups drawing on the previous measurement (factorial) invariance model, which are the best estimates of the true structural (path) weights for H1–H6 hypotheses testing [11]. Comparison of the paths between samples will provide evidence of the nature of the differences to gain further information about how value is created and captured along the supply chain. Direct, indirect, and total effects are presented to test the H7 mediation hypothesis. As shown in Table 6, all hypotheses except H2 are fully (p < 0.05) or marginally (p < 0.1) supported, however, significant differences appear for the buyer and supplier sample.
H1: Focusing on hypotheses linking innovative information sharing to relational variables, timeliness and disaggregation were hypothesised to positively impact trust. While the positive effect of timeliness on trust is strongly supported in the supplier and the buyer model (p < 0.001), a negative association between disaggregation and trust is confirmed for the buyer (p < 0.05) and partially for the supplier role (p < 0.1), reflecting that in the presence of high, disaggregated information sharing, the perception of trust is reduced.
H2, H3: In addition, timeliness and disaggregation were hypothesised to positively impact continuity expectations. While no direct effects were found for these relationships in any sample, a positive indirect effect of timeliness on continuity expectations was found through trust, given that H3 was confirmed in both roles, this indirect effect is stronger for buyers (p < 0.001) than for suppliers (p < 0.05). As a result, the total effect of timely information sharing on continuity expectations is found to be positive and statistically significant for buyers. Oppositely, a significant but negative indirect effect of disaggregation on continuity expectations through trust is found for buyers (p < 0.05) and marginally observed for suppliers (p < 0.1), however, the total effect is not significant at the 95% confidence level.
H4: The results indicate significant differences in hypotheses linking innovative information and value, timeliness appears to be a key information-sharing characteristic for suppliers to create value, while disaggregation is key for buyers. Direct paths leading to operational value creation from timeliness are significant for the supplier role (p < 0.05) but not for the buyer role, similarly, the strategic perspective of value creation is positively affected by timeliness for suppliers (p < 0.1), however, the effect is not significant for buyers. However, the hypothesis that timeliness directly impacts value capture is just marginally supported for buyers (p < 0.1). Disaggregation is hypothesised to positively impact operational value creation, which is only supported for buyers. Additionally, the direct and positive impact of disaggregation on strategic value creation is statistically significant for buyers, however, the effect is not significant for suppliers. Finally, the relationship between disaggregation and value capture is not significant, and this hypothesis is thus not supported in either the buyer or the supplier model.
H5, H6: The hypotheses linking the relational signalling antecedents to value are just partially supported. Whereas trust marginally affects the operational value performance for suppliers (p < 0.1), a negative effect is observed, indicating that in high-trust relationships, operational excellence is relaxed. On the contrary, a direct effect is marginally confirmed between trust and strategic value creation for buyers (p < 0.1). A positive and significant effect is also confirmed between continuity expectations and value capture for suppliers, as a result, a significant parameter estimate is found for the indirect effect of trust on value capture through continuity expectations (p < 0.1), even if the total effect is not statistically significant.
H7: Finally, very few significant relationships are observed for indirect effects testing the partial mediation effect of relational variables on value. Specifically, the paths linking timeliness to (a) buyers’ strategic value creation (p < 0.1), and (b) suppliers’ value capture (p < 0.1) confirm a positive but partial indirect impact of relational variables on partners’ value.

5. Results

5.1. Results of Relational Variables

In line with the accounting-control-trust literature, the results of hypothesis H1 suggests that timeliness of information is a positive source of trust for both the buyer and supplier role, i.e., the frequent exchange of accurate, fast data that follows from the use of controls is a relational device that produces positive expectations about the ability, benevolence, and integrity of the other party [61,62,64], fostering greater confidence, and enhancing trust [32,71]. Additionally, trust is found to have a direct, positive effect on continuity expectations (H3), in line with literature that suggests that trust shifts the focus of a relationship to future conditions [11,54,55,102,118], such an effect is particularly significant for buyers, adding evidence to [57] results on the importance of trust to promote buyers’ cooperation. By facilitating trust building, timeliness of information has an indirect but significant effect on the partner’s long-term expectations (H7), however, no direct relationship is found (H2 is not supported), suggesting that timeliness of information may be considered an ‘operationally focused’ variable that helps to avoid short-term problems and to quickly respond to market changes, producing just an indirect long-term impact on the relationship.
Conversely, disaggregated information negatively affects trust for buyers and suppliers (H1), while no direct effect is observed on continuity expectations (H2), an indirect negative impact is observed on the basis of trust (H7). A double explanation emerges, which combines the adverse effects of an excess of control over trust [44] and the risk of a partner’s appropriation of a firm’s core knowledge [40]. On the first point, Van der Meer-Kooistra and Vosselman [35] suggest that if control information derived from formal governance mechanisms is considered excessive compared to the cooperative attitude of partners, negative consequences can be expected for the level of trust, a proclivity to behave opportunistically also appears that compromises the continuity of the relationship because the perceived illegitimate control reduces cooperation and promotes partners’ self-interest. From this point of view, disaggregated information sharing may be seen to exceed the legitimate threshold of control, leading to partners’ mistrust and instability of the relationship.
However, the negative impact of disaggregated information on trust also suggests that the interchange of detailed core information between partners is considered as a source of relational risk, which produces mistrust; in this point, two forms of risk are relevant to supply chain relationships: relational risk is concerned with the probability and consequences that a partner does not commit itself to the alliance in the desired manner, performance risk refers to the risk of not achieving the relationship goals even if the partners cooperate fully [142]. This result is in line with [40], who argues that the mutual exchange of information, while needed to exploit complementary competencies, creates the risk that core competences can be spilled over to competitors, directly or indirectly, by partners. This risk increases in presence of explicit, documented knowledge such as in the form of documents produced by cost-based information systems. Thus, the flow of sensitive, detailed MC information would increase the perception of spillover risk, which is considered a negative relational signal [38,40,142]. Such effect is stronger for buyers than for suppliers, in line with previous studies postulating that buyers’ perceived risk stems mostly from the partners’ behaviour [143]. Besides, our results suggest that the negative association between perceived risk and continuity expectations is just an indirect consequence of mistrust [102].
Regarding [35] framework, timeliness of information fulfils the ‘accounting for trust building’ role because it acts as a direct trust-building mechanism, additionally, it partially fulfils the ‘accounting for stable and durable relationships’ role, as an indirect trust-based signal that the relationship can be expected to continue in the future. In contrast, disaggregation of information acts as a pure ‘accounting for control’ mechanism, with evidence that control exceeding the legitimate control threshold is having negative consequences for trust [44]. The effects of information sharing on relational signalling are stronger for buyers than for suppliers, in line with previous research [11]. As such, timeliness of information is a relational device that partners should exploit, whereas disaggregated information is a control mechanism that should be carefully managed to avoid undesirable relational consequences.

5.2. Results of Value Creation and Capture

Supply chain studies have observed how the share of MC information, conceived as a source of relational capabilities, results in improved performance for both buyers and suppliers [5,11,25,32]. The findings in support of H4 provide additional, detailed results about the impact of each characteristic of innovative information sharing on value dimensions considering the particular role of the firm along the supply chain. On the buyer side (upstream relationships), both timeliness and disaggregated characteristics are found to be relevant and complementary factors for value generation. However, if the firm assumes a supplier role (downstream relationships), timeliness is key for gaining value, in line with [70] who find that suppliers are focused on timely information because they rely on customer data to begin internal processes. On the contrary, the exchange of disaggregated cost-based data does not add significant value for suppliers, being a source of relational risk as observed previously, suppliers’ reasons to share such information should range on a continuum from pure altruism based on considering partners’ needs as their own [44] to full dependency of a powerful buyer that imposes its own needs [46]. A particular analysis of each value dimension provides an additional understanding of the flow of value creation and value capture along the supply chain.
Operational value creation is observed on both sides of collaborative relationships, this result is in line with literature reporting that concerns about day-to-day commercial and production factors, such as quality, delivery, cost and price, or support service, are key reasons for entering into a buyer-supplier relationship [6,11,92]. This result also supports the traditional value chain focus on the optimisation of production and operations, as a key source of value [3,5].
The results suggest that different characteristics of information sharing are able to exploit operative opportunities along the supply chain. The findings in support of H4 indicate the significant effect of timeliness of information on operational value creation when the firm faces downstream relationships (supplier role), which supports the visibility function with effects on the capacity of adjusting to demand changes, the fast solution of problems, and the adequate product design and service [28,63,71]. As a result, customers’ needs are better understood and fulfilled, reinforcing the competitive position of suppliers [4,22,83]. However, when upstream relationships are faced (buyer role), timely information is not significant for adding operational value to a firm’s offers. In this context, sharing disaggregated cost information with suppliers is the key factor to obtain efficiencies in the production process that relies on more valuable products than competitors, this finding provides support to the argument that buyers are more concerned than suppliers about detailed cost information [66,144] that allows to adjust plans properly [70]. No direct or indirect relational effects on operational value creation are found, thus, the control role of information sharing appears to be the basis of partners’ operational benefits. A minor exception is observed regarding the negative impact of trust on suppliers’ operational value, since buyers’ perceptions could cause suppliers to relax the effort of providing better offers than competitors. However, this effect is compensated by the timely exchange of information between partners.
The importance of the strategic dimension of value has been highlighted by literature over the past two decades [5], being conceived as a source of long-term competitive advantages and a defence against adverse competitive actions [8,9,135]. The results of H4 provide evidence of significant strategic value creation through upstream supply chain relationships (buyer role), where both disaggregated and timely information help to obtain strategic advantages. Such benefits in terms of superior innovation, know-how, and access to resources are in line with [5], who argue that capitalising on suppliers’ capabilities will become an increasingly important source of value in supply chain relationships. While disaggregated information sharing has a direct, control-based effect on buyers’ strategic performance, timely information appears as an indirect source of value through relational variables. In particular, maintaining a trustable relationship could be a necessary condition for obtaining strategic value from the frequent, accurate exchange of information (TR→SV total effect being partially significant).
When a firm is positioned on the downside side of a relationship (supplier role), the ability to generate strategic value is very limited: Timely information sharing appears as the unique source of strategic benefits, however, its effect is weak (p < 0.1) without being reinforced by significant relational effects in terms of trust or long-term focused relationships. In the limited literature on suppliers’ strategic value, Sanders [10] also finds no direct relationship between information sharing and strategic performance, defined in terms of capturing market data, enhancing product innovation, and developing new business opportunities. The failing of management information systems to create strategic value for suppliers represents a lost opportunity to develop durable competitive advantages, innovations developed with customers may improve the supplier’s future offerings, while improved market knowledge could be relevant for developing new business [11].
Finally, the results in support of H4 indicate a positive effect of timely information sharing on value capture on both sides of supply chain relationships, adding detailed evidence to the recent literature on the determinants of financial performance [7,11,125]. However, despite this fact, there are significant differences in the way partners capture value. While buyers rely exclusively on timely data, suppliers need a trustable and long-term focused relationship to capture financial value (H7), in line with Cheung et al. [52]’s suggestion about suppliers’ short-term discount of financial gains in exchange of the long-term benefit potential of the relationship. These findings suggest that an ‘accounting for control’ framework is enough to manage value capture when facing upstream supply chain interactions, however, an ‘accounting for durable and stable relationship’ is needed to produce financial benefits in downstream exchanges. On the contrary, the effect of disaggregated information is not significant for value capture on any side of the supply chain relationships. Thus, the effects of detailed information on supply chain flexibility do not have a key impact on partners’ profit and market share.

6. Discussion and Conclusions

6.1. Managerial and Theoretical Implications

This study departs from the ‘accounting-control-trust’ literature in that it conceptualises management control information and trust as two interacting, reinforcing governance structures [61,62], which produce long-term continuity expectations and stable relationships [44]. The analysis of two key information characteristics, timeliness and disaggregation, provides long-demanded empirical evidence of the direct impact of information sharing on trust building and relationship continuity [5,44]. The first implication of this study is the identification of a global view of information sharing as a relational device, suggesting significant effects of accounting information on stable relationships along the supply chain network, developed through control and trust interactions. Timely information appears to be a direct source of relational signalling that promotes trust and continuity expectations, which explains the high values observed for this variable for both roles. However, disaggregated information is perceived as a pure control variable with negative effects on relational factors and the potential risk of core knowledge spillover [40]. The identification of the preponderance of timely information as an “accounting for trust” and “accounting for stable and durable relationship” mechanism, before the “accounting for control” role of disaggregated information, are significant contributions to the theoretical debate on the “accounting-control-trust” nexus [44], providing evidence of the coexistence of formal and relational mechanisms through information sharing. This finding also offers evidence that it is not the volume of information sharing but its nature which impacts on relational variables [67,69], suggesting that information sharing is a multidimensional variable instead of the traditional one-dimensional view [11,32,52].
Drawing from literature on value nets and demand-side theory, this study has defined the value of the supply chain relationship as a multidimensional concept integrated by three interconnected dimensions and developed reliable instruments for their measurement. The definitions of operational value creation, strategic value creation, and value capture provide an additional conceptual and methodological understanding of the potential value-based benefits of supply chain relationships [18]. Based on the operationalisations of value dimensions, the second and most salient feature of this study is the fact that the two complementary characteristics of information sharing have different impacts on value creation and capture depending on the role played in the collaborative relationship. Timely information sharing appears as the key source of value when facing downstream relationships (supplier role) that generates both short-term operative benefits and financial value, in line with findings on the effects of timely information to gain internal process efficiency [70] and financial performance [11]. However, contrary to the literature on the long-term benefits of collaboration [8,24,125], the informational effect on suppliers’ strategic value is weak. However, in upstream collaborative relationships, the dimensions of buyer’s value are complementary enhanced by both timely (strategic, financial value) and disaggregated (operational, strategic value) characteristics, this finding is in line with [145] findings of information sharing as a good predictor of the buyer’s full competitive position. But while sharing of disaggregated information has a positive effect on buyers’ value, suppliers do not obtain benefits from it, so they could develop feelings of inequity and opportunism that are particularly significant when customers implement sustainable assessment governance initiatives [94]. This finding is important for managers who should establish appropriate mechanisms to handle these negative relational effects in order to maximize supply chain value, combining monitoring instruments (contractual knowledge protection) and loyalty-based identification (implicit know-how protection) [40]. These results have challenging theoretical implications, providing support to the conceptual multi-dimensional nature of value [5,20,53] and to the role of supply chain partners as value co-creators [4,52]. The results also provide understanding on how value is created and captured in supply chains, this point is critical because gaining and sustaining competitive advantages depends on understanding the firm’s position in the supply chain value system, and managers are responsible for optimizing this advantage [3,52].
Even if the results support that each node into the supply chain is able to generate and capture value from any upstream or downstream relationship, they also suggest that the firms obtain a higher value in managing upstream relationships in respect to downstream interchanges [5]. In fact, operative and financial benefits are shared across supply chain nodes, while strategic value is just obtained in upstream relationships, suggesting a buyer’s self-serving behaviour in the acquisition of long-term advantages. The turn of this behaviour into a synergistic scheme of value creation, requiring increased cross-functional cooperation and complex supply chain governance mechanisms, represents an opportunity to achieve a better strategic alignment that will provide additional operational value, more perceived market benefits, and new opportunities for exploiting business opportunities [38,52].
Linked to previous results, the third feature of this study is the evidence provided on the complex direct and indirect effects of relational variables on value generation in a collaborative scenario [5]. The findings demonstrate different frameworks for the interaction between information sharing, trust, and continuity expectations depending on both the firm’s role and the nature of value (Table 7). Operative value creation is obtained under an “accounting for control” frame, where information sharing obtained from formal control structures helps align the interests of patterns, producing thin trust and controlling the adequacy of obtained outputs [37,44], in this framework, relational signals are not necessary to improve product-based benefits. However, an “accounting from trust building” frame is needed to capture the full strategic advantage of upstream relationships, thus, the appropriation of long-term competitive advantage requires the control role of accounting to be completed with the building of trust, which reduces perceptions of opportunism and increases partners’ commitment [44,61,62].
Value capture requires a very different framework for partners. In upstream relationships, control information is the basis for value appropriation effects, instead, in downstream relationships a complete “accounting for stable and durable relationships” frame is needed to gain financial value Thus, while suppliers need to foster long-term relationships to exploit relational value opportunities, buyers do not have such a need. This finding is broadly in line with previous studies on buyer-supplier power priorities, which argue that buyers’ primary priorities focus on short-term issues, whereas suppliers’ priorities focus on long-term profitability [46,144]. This difference could be a source of challenging managerial implications for suppliers because suppliers could accept maintaining asymmetrical value exchanges out of fears of disrupting long-term oriented relationships [46,50,56], leading to feelings of inequity [2]. However, power imbalances could result in the position of the weaker party to be eroded too much in the long term, ultimately destroying the relationship with negative effects for both partners [45,142]. Developing governance mechanisms on the basis of trust could be a safeguard to avoid such effects [40], which reaffirms the need for a trustable relational scenario despite discrete effects on value generation. Previous results add valuable knowledge to the limited literature on the mediation role of relational variables between collaborative activities and relationship outcomes [5,11].
Finally, this study provides additional evidence on the firm as a complex node that plays different roles in value-based supply chains [20,21,145]. Literature on the effect of partners’ perspective on supply chain performance is still limited. Paulraj et al. [32] analyse the relationships between inter-organisational communication, buyer performance and supplier performance. However, their informants hail exclusively from the buyer side of the dyad, as a result, the firm is assumed to play only a purchasing role. Cao and Zhang [7] analyse the relationship between supply chain collaboration and firm performance considering a generic supply chain partner without analysing the particular position of the firm as a buyer or supplier along the supply chain. While Cheung et al. [52] analyse cross-border vertical dyads, their study is circumscribed to five manufacturing companies and their overseas suppliers, with each respondent being assumed to play a unique role in the supply chain. Similarly, Kim et al. [57] study supplier relationships connected to a major telecommunication service company that acts as buyer in a monopsonistic situation. Other authors studying collaborative relationships, while analysing both buyer and supplier perspectives, consider a single position for each firm in the net [11,46,49,70,92]. In this study, both downstream and upstream positions are analysed with respect to the firm to understand the complex process of value generation inside supply chains and the role played by MC governance mechanisms. Evidence on the different nature of value being captured from each side can serve as a powerful tool for managers to negotiate specific actions that maximise collaborative benefits and minimise the chance of relationship failures [7]. This study also provides a structured understanding of the full benefits of collaboration, which opens potential lines of research on supply chain management mechanisms as sources of value [4].

6.2. Limitations and Future Research

There are several limitations of this study that need to be considered. First, the research, while assuming a supply chain perspective, analyses the value created through specific buyer-supplier and supplier-buyer relationships in the context of the firm as a network node. To further assess the process of value transmission along the supply network as the unit of analysis, specific triads should be considered (supplier-firm-buyer), or, ideally, all organisations from raw material suppliers to end customers should be analysed. While our perspective limits the applicability of results to full supply chains, several considerations directed this decision, including complexities of research design and the lack of access to supply networks in practice, as reported by previous literature [32,46]. However, further efforts should be made to test the process of value generation in business network contexts in order to validate the results and to identify additional informational and relational interactions. A point of departure to conduct this research could be the definition of constructs from the perspective of dyadic relationships that are connected with other indirect relationships along the supply chain [121]. Besides, cost-benefit sharing and relationship pay-offs should be deeper analysed in order to identify specific win-win, win-lose, lose-win, or lose-lose strategies for buyers and suppliers along the supply chain [11].
Second, the research focuses on the absence of a validated scale to measure value in supply chain contexts. This focus has necessitated a research design based on adopting multiple theoretical perspectives to approach the multifaceted phenomena of value creation and value extraction [5], defining direct and mediation effects of MC mechanisms on value extraction. While the proposed measurement scale seems to be statistically reliable, further analysis is warranted to test the suitability of additional items in defining those and other value dimensions [4], with a particular emphasis on social [146] and environmental value [147]. Additionally, in testing the hypothesised multidimensional nature of value using SEM we assumed, in line with prior research on supply chain performance [7,32], that unidimensional constructs were reflective rather than formative. Future research should analyse the potential formative nature of value in detail using other SEM approaches that are better adapted to formative constructs such as Partial Least Squares [32]. Also, the multidimensional nature of information visibility and supply chain flexibility should be further analysed; their role in our theoretical model should be explored as second-order formative capabilities [148], being integrated by MC information characteristics and strongly linked to relational governance mechanism as trust [28,149].
Third, contextual variables should be included to identify the conditions under which the proposed model is justified and more effective. The effects of market conditions, product characteristics, and firm-contextual characteristics, while still rarely addressed in the field of supply chain research, should be further analysed to test the real benefits of information sharing and relational variables for the buyer and supplier roles [5]. Besides, the level and types or risk that supply chain relationships face should be considered in order to complete the conceptual ‘control-trust-value’ framework [43,150]; this is particularly significant in sustainable intra-industry alliances, where sharing information and organization routines would lead to a improved supply risk management and a higher efficiency [151]. Finally, the cross-sectional design of the study should be completed with a longitudinal analysis that would help to better understand the sequential relationships that could emerge between the informational, relational, and value-based constructs as the relationship advances. Despite these limitations, we believe that this study makes a compelling case toward viewing MC information sharing and relational variables as interactive key sources of valuable benefits for firms participating in collaborative supply chains.

Acknowledgments

The authors would like to thank the academic editor and the anonymous referees for their constructive and helpful suggestions on early versions of the paper. Authors would also like to acknowledge the funding support from the Andalusia Regional Government (projects SEJ111, SEJ1933) and the Spanish Ministry of Education and Science (projects ECO2014-57023-P, ECO2016-75047-P).

Author Contributions

All authors contributed equally to this work. Juan Manuel Ramon-Jeronimo conceived the paper and reviewed related studies; Raquel Florez-Lopez drafted the paper and designed the empirical analysis; Maria Angeles Ramon-Jeronimo performed the data analysis. All authors wrote, reviewed and commented on the manuscript. All authors have read and approved the final manuscript.

Conflicts of Interest

The authors declare no conflict of interest.

Appendix A. Survey Items and Descriptives

Table A1. Descriptive statistics (buyer and supplier samples).
MC Information Sharing (Timely)Buyer Sample Mean (sd)Supplier Sample Mean (sd)
TI1—Requested information arrives immediately upon request5.28 (1.03)5.06 (1.22)
TI2—There is no delay between an event and the reporting of relevant information to you5.29 (1.03)5.16 (1.24)
TI3—Reports are received frequently 5.02 (1.13)4.88 (1.34)
TI4—Information requested by the partner is provided immediately upon request5.25 (1.29)5.38 (1.27)
TI5—There is no delay between an event and the provision of relevant information to the partner5.53 (1.09)5.55 (1.22)
TI6—Reports are provided frequently5.18 (1.13)5.50 (1.09)
MC Information Sharing (Disaggregated)
DI1—Information is received in forms that support a “what if?” analysis5.12 (1.17)5.22 (1.13)
DI2—Costs information received is separated into fixed and variable components3.87 (1.85)3.68 (1.69)
DI3—Information is provided in forms that support a “what if?” analysis5.24 (1.09)5.56 (1.08)
DI4—Costs information provided is separated into fixed and variable components4.02 (1.68)3.79 (1.68)
Trust
TR1—This partner is trustworthy5.72 (1.02)5.39 (1.29)
TR2—This partner is always honest with us5.63 (0.94)5.32 (1.31)
TR3—The partner is capable of providing quality products and services to us5.92 (0.89)5.61 (1.22)
TR4—This partner keeps promises it makes to our firm5.35 (1.15)5.27 (1.14)
TR5—This partner’s beliefs serve our specific need well5.77 (0.93)5.18 (1.16)
TR6—We trust this partner to keep our best interests in mind5.42 (1.20)5.34 (1.68)
Continuity Expectations
CE1—Your company expects that the relationship will continue over time6.02 (0.80)6.34 (0.85)
CE2—You believe that your partner expects the relationship to continue over time6.16 (0.84)5.96 (1.10)
CE3—Your company makes plans based on continuance5.82 (1.23)6.06 (1.18)
CE4—You believe that your partner makes plans based on continuance5.91 (0.94)5.13 (1.50)
Operational Value Creation
OV1—Please indicate the level of your firm’s performance in terms of overall product quality relative to your major industrial competitors 5.18 (1.01)5.13 (0.91)
OV2—Please indicate the level of your firm’s performance in terms of average selling price relative to your major industrial competitors4.67 (1.09)4.76 (1.01)
OV3—Please indicate the level of your firm’s performance in terms of overall customer service level relative to your major industrial competitors4.99 (1.36)5.08 (1.27)
Strategic Value Creation
SV1—Please indicate the level of your firm’s performance in terms of research investment relative to your major industrial competitors4.65 (1.47)4.58 (1.40)
SV2—Please indicate the level of your firm’s performance in terms of ability to win resources relative to your major industrial competitors4.98 (1.21)4.55 (1.28)
SV3—Please indicate the level of your firm’s performance in terms of staff training programs relative to your major industrial competitors4.72 (1.23)4.56 (1.26)
Value Capture
VC1—Please indicate the level of your firm’s performance in terms of return on assets relative to your major industrial competitors4.66 (0.93)4.41 (1.22)
VC2—Please indicate the level of your firm’s performance in terms of market share relative to your major industrial competitors4.57 (1.39)4.56 (1.40)

References

  1. Dyer, J.H.; Singh, H. The relational view: Cooperative strategy and sources of interorganizational competitive advantage. Acad. Manag. Rev. 1998, 23, 660–679. [Google Scholar]
  2. Corsten, D.; Kumar, N. Do suppliers benefit from collaborative relationships with large retailers? An empirical investigation of efficient consumer response adoption. J. Mark. 2005, 69, 80–94. [Google Scholar] [CrossRef]
  3. Huemer, L. Supply Management: Value creation, coordination and positioning in supply relationships. Long Range Plan. 2006, 39, 133–153. [Google Scholar] [CrossRef]
  4. Kähkönen, A.-K.; Lintukangas, K. The underlying potencial of supply management in value creation. J. Purch. Supply Manag. 2012, 18, 68–75. [Google Scholar] [CrossRef]
  5. Terpend, R.; Tyler, B.B.; Krause, D.R.; Handfield, R.B. Buyer-supplier relationships: Derived value over two decades. J. Supply Chain Manag. 2008, 44, 28–55. [Google Scholar] [CrossRef]
  6. Daugherty, P.J.; Richey, R.G.; Roath, A.S.; Min, S.; Chen, H.; Arndt, A.D.; Genchev, S.E. Is collaboration paying off for firms? Bus. Horiz. 2006, 49, 61–70. [Google Scholar] [CrossRef]
  7. Cao, M.; Zhang, Q. Supply Chain Collaboration: Impact on Collaborative Advantage and Firm Performance. J. Oper. Manag. 2011, 29, 163–180. [Google Scholar] [CrossRef]
  8. Walter, A.; Ritter, T.; Gëmunden, H.G. Value-creation in buyer-supplier relationships. Ind. Mark. Manag. 2001, 30, 365–377. [Google Scholar] [CrossRef]
  9. Möller, K.E.K.; Törrönen, P. Business suppliers’ value creation potential: A capability-based analysis. Ind. Mark. Manag. 2003, 32, 109–118. [Google Scholar] [CrossRef]
  10. Sanders, N.R. Pattern of information technology use: The impact on buyer–supplier coordination and performance. J. Oper. Manag. 2008, 26, 349–367. [Google Scholar] [CrossRef]
  11. Nyaga, G.N.; Whipple, J.M.; Lynch, D.F. Examining supply chain relationships: Do buyer and supplier perspectives on collaborative relationships differ? J. Oper. Manag. 2010, 28, 101–114. [Google Scholar] [CrossRef]
  12. Cannon, J.P.; Homburg, C. Buyer-seller relationships and customer firm costs. J. Mark. 2001, 65, 29–43. [Google Scholar] [CrossRef]
  13. Li, S.; Ragu-Nathan, B.; Ragu-Nathan, T.S.; Rao, S.S. The impact of supply chain management practices on competitive advantage and organizational performance. Omega 2006, 34, 107–124. [Google Scholar] [CrossRef]
  14. Dyllick, T.; Hockerts, K. Beyond the business case for corporate sustainability. Bus. Strategy Environ. 2002, 11, 130–141. [Google Scholar] [CrossRef]
  15. Wheeler, D.; Colbert, B.; Freeman, R.E. Focusing on value: Reconciling corporate social responsibility, sustainability and a stakeholder approach in a network word. J. Gen. Manag. 2003, 28, 1–28. [Google Scholar] [CrossRef]
  16. Perrini, F.; Tencati, A. Sustainability and stakeholder management: The need for new corporate performance evaluation and reporting systems. Bus. Strategy Environ. 2006, 15, 296–308. [Google Scholar] [CrossRef]
  17. Wu, M. Sustainability as Stakeholder Management. In Business and Sustainability: Concepts, Strategies and Changes; Critical Studies on Corporate Responsibility, Governance and Sustainability; Emerald: New York, NY, USA, 2012; Volume 3, pp. 221–239. [Google Scholar]
  18. Frankel, R.; Goldsby, T.J.; Whipple, J.M. Grocery industry collaboration in the wake of ECR. Int. J. Logist. Manag. 2002, 13, 1–16. [Google Scholar] [CrossRef]
  19. Daugherty, P.J. Review of logistics and supply chain relationships literature and suggested research agenda. Int. J. Phys. Distrib. Logist. Manag. 2011, 23, 14–26. [Google Scholar] [CrossRef]
  20. Bovet, D.; Martha, J. Value Nets: Breaking the Supply Chain to Unlock Hidden Profits; Wiley: New York, NY, USA, 2000. [Google Scholar]
  21. Möller, K.; Rajala, A.; Svahn, S. Strategic business nets-their type and management. J. Bus. Res. 2005, 58, 1274–1284. [Google Scholar] [CrossRef]
  22. Ulaga, W.; Eggert, A. Value-based differentiation in business relationships: Gaining and sustaining key supplier status. J. Mark. 2006, 70, 119–136. [Google Scholar] [CrossRef]
  23. Romano, P. Co-ordination and Integration Mechanisms to Manage Logistics Processes across Supply Networks. J. Purch. Supply Manag. 2003, 9, 119–134. [Google Scholar] [CrossRef]
  24. Noordewier, T.G.; John, G.; Nevin, J.R. Performance outcomes of purchasing arrangements in industrial buyer-vendor relationships. J. Mark. 1990, 54, 80–93. [Google Scholar] [CrossRef]
  25. Sanders, N.R.; Premus, R. Modeling the relationship between firm IT capability, collaboration, and performance. J. Bus. Logist. 2005, 26, 1–23. [Google Scholar] [CrossRef]
  26. Kulp, S.C.; Lee, H.L.; Ofek, E. Manufacturer benefits from information integration with retail customers. Manag. Sci. 2004, 50, 431–444. [Google Scholar] [CrossRef]
  27. Zhang, Q.; Vonderembse, M.A.; Lim, J. Value chain flexibility: A dichotomy of competence and capability. Int. J. Prod. Res. 2002, 40, 561–583. [Google Scholar] [CrossRef]
  28. Wang, E.T.G.; Wei, H. Interorganizational Governance Value Creation: Coordinating for Information Visibility and Flexibility in Supply Chains. Decis. Sci. 2007, 38, 647–674. [Google Scholar] [CrossRef]
  29. Heide, J.B.; Miner, A.S. The shadow of the future: Effects of anticipated interaction and frequency of contact on buyer-seller cooperation. Acad. Manag. J. 1992, 35, 265–291. [Google Scholar] [CrossRef]
  30. Grover, V.; Teng, J.; Fiedler, K. Investigating the role of information technology in building buyer-supplier relationship. J. Assoc. Inf. Syst. 2002, 3, 217–245. [Google Scholar]
  31. Kale, P.; Singh, H.; Perlmutter, H. Learning and protection of proprietary assets in strategic alliances: Building relational capital. Strateg. Manag. J. 2000, 21, 217–237. [Google Scholar] [CrossRef]
  32. Paulraj, A.; Lado, A.A.; Chen, I.J. Inter-organizational communication as a relational competency: Antecedents and performance outcomes in collaborative buyer-supplier relationships. J. Oper. Manag. 2008, 26, 45–64. [Google Scholar] [CrossRef]
  33. Williamson, O.E. Transaction cost economics: The governance of contractual relations. J. Law Econ. 1979, 22, 3–61. [Google Scholar] [CrossRef]
  34. Hopwood, A.G. Looking across rather than up and down: On the need to explore the lateral processing of information. Account. Organ. Soc. 1996, 21, 589–590. [Google Scholar] [CrossRef]
  35. Van der Meer-Kooistra, J.; Vosselman, E.G.J. Management control of interfirm trasactional relationships: The case of industrial renovation and maintenance. Account. Organ. Soc. 2000, 25, 51–77. [Google Scholar] [CrossRef]
  36. Anderson, S.W.; Dekker, H.C. Management control for market transactions: The relation between transaction characteristics, incomplete contract design, and subsequent performance. Manag. Sci. 2005, 51, 1734–1753. [Google Scholar] [CrossRef]
  37. Dekker, H.C. Control of inter-organizational relationships: Evidence on appropriation concerns and co-ordination requirements. Account. Organ. Soc. 2004, 29, 27–49. [Google Scholar] [CrossRef]
  38. Ring, P.S.; Van de Ven, A.H. Structuring cooperative relationships between organizations. Strateg. Manag. J. 1994, 13, 483–498. [Google Scholar] [CrossRef]
  39. Langfield-Smith, K.; Smith, D. Management control systems and trust in outsourcing relationships. Manag. Account. Res. 2003, 14, 281–307. [Google Scholar] [CrossRef]
  40. Nooteboom, B. Learning and governance in inter-firm relations. Rev. D’écon. Polit. 2004, 114, 55–76. [Google Scholar] [CrossRef]
  41. Han, G.; Dong, M. Sustainable regulation of information sharing with electronic data interchange by a trust-embedded contract. Sustainability 2017, 9, 964. [Google Scholar] [CrossRef]
  42. Caglio, A.; Ditillo, A. A review and discussion of management control in inter-firm relationships: Achievements and future directions. Account. Organ. Soc. 2008, 33, 865–898. [Google Scholar] [CrossRef]
  43. De Man, A.-P.; Roijakkers, N. Alliance governance: Balancing control and trust in dealing with risk. Long Range Plan. 2009, 42, 75–95. [Google Scholar] [CrossRef]
  44. Vosselman, E.; Van der Meer-Kooistra, J. Accounting for control and trust building in interfirm transactional relationships. Account. Organ. Soc. 2009, 34, 267–283. [Google Scholar] [CrossRef]
  45. Caniëls, M.J.C.; Gelderman, C.J. Purchasing strategies in the Kraljic matrix-A power and dependence perspective. J. Purch. Supply Manag. 2005, 11, 141–155. [Google Scholar] [CrossRef]
  46. Meehan, J.; Wright, G.H. Power priorities: A buyer-seller comparison of areas of influence. J. Purch. Supply Manag. 2011, 17, 32–41. [Google Scholar] [CrossRef]
  47. Yao, Y.; Dresner, M.; Palmer, J.W. Impact of boundary-spanning information technology and position in chain of firm performance. J. Supply Chain Manag. 2009, 45, 3–17. [Google Scholar] [CrossRef]
  48. Anderson, E.; Weitz, B. The use of pledges to build and sustain commitment in distribution channels. J. Mark. Res. 1992, 29, 18–34. [Google Scholar] [CrossRef]
  49. Kim, K.K.; Park, S.H.; Ryoo, S.Y.; Park, S.K. Inter-organizational information systems visibility in buyer-supplier relationships: The case of telecommunication equipment component manufacturing industry. Omega 2011, 39, 667–676. [Google Scholar] [CrossRef]
  50. Cox, A. The art of the possible: Relationship management in power regimes and supply chains. Supply Chain Manag. 2004, 9, 346–356. [Google Scholar] [CrossRef]
  51. Hakansson, H.; Lind, J. Accounting and network coordination. Account. Organ. Soc. 2004, 29, 51–72. [Google Scholar] [CrossRef]
  52. Cheung, M.S.; Myers, M.B.; Mentzer, J.T. Does relationship learning lead to relationship value? A cross-national supply chain investigation. J. Oper. Manag. 2010, 28, 472–487. [Google Scholar] [CrossRef]
  53. Priem, R.L.; Li, S.; Carr, J.C. Insights and new directions from demand-side approaches to technology innovation, entrepreneurship, and strategic management research. J. Manag. 2012, 38, 346–374. [Google Scholar] [CrossRef]
  54. Ganesan, S. Determinants of long-term orientation in buyer-seller relationships. J. Mark. 1994, 58, 1–19. [Google Scholar] [CrossRef]
  55. Morgan, R.M.; Hunt, S.D. The commitment-trust theory of relationship marketing. J. Mark 1994, 58, 20–38. [Google Scholar] [CrossRef]
  56. Uzzi, B. Social structure and competition in interfirm networks: The paradox of embeddedness. Adm. Sci. Quart. 1997, 42, 35–67. [Google Scholar] [CrossRef]
  57. Kim, K.K.; Park, S.H.; Ryoo, S.Y.; Park, S.K. Inter-organizational cooperation in buyer-supplier relationships. J. Bus. Rev. 2010, 63, 863–869. [Google Scholar]
  58. Bromiley, P.; Cummins, L.L. Transaction Costs in Organizations with Trust. In Research on Negotiation in Organizations; Bies, R., Sheppard, B., Lewicki, R., Eds.; JAI Press: Greenwich, UK, 1995. [Google Scholar]
  59. Eisenhardt, K.M. Control: Organizational and economic approaches. Manag. Sci. 1985, 31, 134–149. [Google Scholar] [CrossRef]
  60. Ouchi, W.G. A conceptual framework for the design of organizational control mechanisms. Manag. Sci. 1979, 25, 833–847. [Google Scholar] [CrossRef]
  61. Tomkins, C. Interdependencies, trust and information in relationships, alliances and networks. Account. Organ. Soc. 2001, 26, 161–191. [Google Scholar] [CrossRef]
  62. Mouritsen, J.; Thrane, S. Accounting, network complementarities and the development of inter-organisational relations. Account. Organ. Soc. 2006, 31, 241–275. [Google Scholar] [CrossRef]
  63. Mohr, J.; Spekman, R. Characteristics of partnership success: Partnership attributes, communication behaviour, and conflict resolution techniques. Strateg. Manag. J. 1994, 15, 135–152. [Google Scholar] [CrossRef]
  64. Seal, W.B.; Berry, A.; Cullen, J. Disembedding the supply chain: Institutionalized reflexivity and inter-firm accounting. Account. Organ. Soc. 2004, 29, 73–92. [Google Scholar] [CrossRef]
  65. Lindenberg, S. It takes both trust and lack of mistrust: The workings of cooperation and relational signalling in contractual relationships. J. Manag. Gov. 2000, 4, 11–33. [Google Scholar] [CrossRef]
  66. Cooper, R.; Slagmulder, R. Interorganizational cost management and relational context. Account. Organ. Soc. 2004, 29, 1–26. [Google Scholar] [CrossRef]
  67. Bouwens, J.; Abernethy, M.A. The consequences of customisation on management accounting system design. Account. Organ. Soc. 2000, 25, 221–241. [Google Scholar] [CrossRef]
  68. Chenhall, R.H.; Morris, D. The Impact of Structure, Environment, and Interdependence on the Perceived Usefulness of Management Accounting Systems. Account. Rev. 1986, 6, 16–35. [Google Scholar]
  69. Chenhall, R.H. Management control systems design within its organizational context: Findings from contingency-based research and directions for the future. Account. Organ. Soc. 2003, 28, 127–168. [Google Scholar] [CrossRef]
  70. Whipple, J.M.; Frankel, R.; Daugherty, P.J. Information support for alliances: Performance implications. J. Bus. Logist. 2002, 23, 67–82. [Google Scholar] [CrossRef]
  71. Anderson, E.; Narus, J.A. A model of distributor firm and manufacturer firms working partnership. J. Mark. 1990, 54, 42–58. [Google Scholar] [CrossRef]
  72. Grant, R. Prospering in dynamically-competitive environments: Organizational capability as knowledge integration. Org. Sci. 1996, 7, 375–387. [Google Scholar] [CrossRef]
  73. Chenhall, R.H.; Landfield-Smith, K. Multiple Perspectives of Performance Measures. Eur. Manag. J. 2007, 25, 266–282. [Google Scholar] [CrossRef]
  74. Barney, J.B. Firm resources and sustained competitive advantage. J. Manag. 1991, 17, 99–120. [Google Scholar] [CrossRef]
  75. Chen, H.; Daugherty, P.J.; Landry, T.D. Supply Chain Process Integration: A Theoretical Framework. J. Bus. Logist. 2009, 30, 27–46. [Google Scholar] [CrossRef]
  76. Young, G.; Sapienza, H.; Baumer, D. The influence of flexibility in buyer-seller relationships on the productivity of knowledge. J. Bus. Res. 2003, 56, 443–445. [Google Scholar] [CrossRef]
  77. Liao, Y.; Hong, P.; Rao, S.S. Supply management, supply flexibility and performance outcomes: An empirical investigation of manufacturing firms. J. Supply Chain Manag. 2010, 46, 6–22. [Google Scholar] [CrossRef]
  78. Hartmann, E.; De Grahl, A. The flexibility of logistics service providers and its impact on customer loyalty: An empirical study. J. Supply Chain Manag. 2011, 47, 63–85. [Google Scholar] [CrossRef]
  79. Dwyer, F.R.; Schurr, P.H.; Oh, S. Developing buyer-seller relationships. J. Mark. 1987, 51, 11–27. [Google Scholar] [CrossRef]
  80. Ehret, M. Managing the trade-off between relationships and value networks. Towards a value-added approach of customer relationship management in business-to-business markets. Ind. Mark. Manag. 2004, 33, 465–473. [Google Scholar] [CrossRef]
  81. Borys, B.; Jemison, D.B. Hybrid arrangements as strategic alliances: Theoretical issues in organizational combinations. Acad. Manag. Rev. 1989, 14, 234–249. [Google Scholar]
  82. Adner, R.; Zemsky, P. A demand-based perspective on sustainable competitive advantage. Strateg. Manag. J. 2006, 27, 215–239. [Google Scholar] [CrossRef]
  83. Priem, R.L. A consumer perspective on value creation. Acad. Manag. Rev. 2007, 32, 219–235. [Google Scholar] [CrossRef]
  84. Priem, R.L.; Swink, M. A demand-side perspective on supply chain management. J. Supply Chain Manag. 2012, 48, 7–13. [Google Scholar] [CrossRef]
  85. Aspara, J.; Tikkanen, H. Creating novel consumer value vs. capturing value: Strategic emphases and financial performance implications. J. Bus. Res. 2013, 66, 593–602. [Google Scholar] [CrossRef]
  86. DeSarbo, W.S.; Ebbes, P.; Fong, D.K.; Snow, C.C. Revisiting customer value analysis in a heterogeneous market. J. Model. Manag. 2010, 5, 8–24. [Google Scholar] [CrossRef]
  87. Madhok, A.; Li, S.; Priem, R.L. The resource-based view revisited: Comparative firm advantage, willingness-based isolating mechanisms and competitive heterogeneity. Eur. Manag. Rev. 2010, 7, 91–100. [Google Scholar] [CrossRef]
  88. Zander, I.; Zander, U. The inside track: On the important (but neglected) role of customers in the resource-based view of strategy and firm growth. J. Manag. Stud. 2005, 42, 1519–1548. [Google Scholar] [CrossRef]
  89. Mizik, N.; Jacobson, R. Trading off between value creation and value appropriation: The financial implications of shifts in strategic emphasis. J. Mark. 2003, 67, 63–76. [Google Scholar] [CrossRef]
  90. Prahinski, C.; Benton, W.C. Supplier evaluations: Communication strategies to improve supplier performance. J. Oper. Manag. 2004, 22, 39–62. [Google Scholar] [CrossRef]
  91. Cox, A. Business relationship alignment: On the commensurability of value capture and mutuality in buyer and supplier exchange. Supply Chain Manag. 2004, 9, 410–420. [Google Scholar] [CrossRef]
  92. Saccani, N.; Perona, M. Shaping buyer-supplier relationships in manufacturing contexts: Design and test of a contingency model. J. Purch. Supply Manag. 2007, 13, 36–41. [Google Scholar] [CrossRef]
  93. Mouritsen, J.; Hansen, A.; Hansen, C.O. Interorganizational controls and organizational competencies: Episodes around target cost management/functional analysis and open book accounting. Manag. Account. Res. 2001, 12, 221–244. [Google Scholar] [CrossRef]
  94. Normann, U.; Ellegaard, C.; Munkgaard, M. Supplier perceptions of distributive justice in sustainable apparel sourcing. Int. J. Phys. Distrib. Logist. Manag. 2017, 47, 368–386. [Google Scholar] [CrossRef]
  95. Frohlich, M.T.; Westbrook, R. Arcs of integration: An international study of supply chain strategies. J. Oper. Manag. 2001, 19, 185–200. [Google Scholar] [CrossRef]
  96. Dekker, H.C. Value chain analysis in interfirm relationships: A field study. Manag. Account. Res. 2003, 14, 1–23. [Google Scholar] [CrossRef]
  97. Kulp, S.C. The effect of information precision and information reliability on manufacturer-retail relationships. Account. Rev. 2002, 77, 653–677. [Google Scholar] [CrossRef]
  98. Subramani, M. How do suppliers benefit from information technology use in supply chain relationships? MIS Q. 2004, 28, 45–73. [Google Scholar]
  99. Fawcett, S.E.; Calantone, R.; Smith, S.R. An investigation of the impact of flexibility on global reach and firm performance. J. Bus. Logist. 1996, 17, 167–196. [Google Scholar]
  100. Amit, R.; Schoemaker, P.J. Strategic assets and organisational rent. Strateg. Manag. J. 1993, 14, 33–46. [Google Scholar] [CrossRef]
  101. Eisenhardt, K.; Martin, J. Dynamic Capabilities: What Are They? Strateg. Manag. J. 2010, 21, 1105–1121. [Google Scholar] [CrossRef]
  102. Pavlou, P.A. Institution-based trust in interorganizational exchange relationships: The role of online B2B marketplaces on trust formation. J. Strateg. Inf. Syst. 2002, 11, 215–243. [Google Scholar] [CrossRef]
  103. Doney, P.M.; Cannon, J.P. An examination of the nature of trust in buyer-seller relationships. J. Mark. 1997, 61, 35–51. [Google Scholar] [CrossRef]
  104. Kwon, I.-G.; Suh, T. Factors affecting the level of trust and commitment in supply chain relationships. J. Supply Chain Manag. 2004, 40, 4–14. [Google Scholar] [CrossRef]
  105. Mohr, J.; Fisher, R.J.; Nevin, J.R. Collaborative communication in interfirm relationships: Moderating effects of integration and control. J. Mark. 1996, 54, 36–51. [Google Scholar] [CrossRef]
  106. Heide, J.B.; Stump, R.L. Performance Implications of Buyer-Supplier Relationships in Industrial Markets: A Transaction Cost Explanation. J. Bus. Res. 1995, 32, 57–66. [Google Scholar] [CrossRef]
  107. Fiala, P. Information sharing in supply chains. Omega 2005, 33, 419–423. [Google Scholar] [CrossRef]
  108. Singh, K.; Mitchell, W. Growth Dynamics: The bidirectional relationship between interfirm collaboration and business sales in entrant and incumbent alliances. Strateg. Manag. J. 2005, 26, 497–521. [Google Scholar] [CrossRef]
  109. Anderson, E.; Weitz, B. Determinants of continuity in conventional industrial channel dyads. Mark. Sci. 1989, 8, 310–323. [Google Scholar] [CrossRef]
  110. Ryu, S.; Park, J.E.; Min, H. Factors of determining long-term orientation in interfirm relationships. J. Bus. Res. 2007, 60, 1225–1233. [Google Scholar] [CrossRef]
  111. Wallenburg, C.M.; Cahill, D.L.; Knemeyer, A.M.; Goldsby, T.J. Commitment and trust as drivers of loyalty in logistics outsourcing relationships: Cultural differences between the United States and Germany. J. Bus. Logist. 2011, 32, 83–98. [Google Scholar] [CrossRef]
  112. Palmatier, R.W. Interfirm relational drivers of customer value. J. Mark. 2008, 72, 76–89. [Google Scholar] [CrossRef]
  113. De Toni, A.; Nassimbeni, G. Buyer-supplier operational practices, sourcing policies and plant performance: Results of an empirical research. Int. J. Prod. Res. 1999, 37, 597–619. [Google Scholar] [CrossRef]
  114. Madhok, A. Reassessing the fundamentals and beyond: Ronald Coase, the transaction cost and resource-based theories of the firm and the institutional structure of production. Strateg. Manag. J. 2002, 23, 535–550. [Google Scholar] [CrossRef]
  115. Zeller, T.L.; Gillis, D.M. Achieving market excellence through quality: The case of Ford Motor Company. Bus. Horiz. 1995, 38, 23–30. [Google Scholar] [CrossRef]
  116. Krause, D.R.; Handfield, R.B.; Tyler, B.B. The relationships between supplier development, commitment, social capital accumulation and performance improvement. J. Oper. Manag. 2007, 25, 528–545. [Google Scholar] [CrossRef]
  117. Whipple, J.M.; Lynch, D.F.; Nyaga, G.N. A buyer’s perspective on collaborative versus transactional relationships. Ind. Mark. Manag. 2010, 39, 507–518. [Google Scholar] [CrossRef]
  118. Morris, M.; Carter, C.R. Relationship marketing and supplier logistics performance: An extension of the key mediating variables model. J. Supply Chain Manag. 2005, 41, 32–43. [Google Scholar] [CrossRef]
  119. Borgatti, S.P.; Foster, P.C. The network paradigm in organizational research: A review and typology. J. Manag. 2003, 29, 991–1013. [Google Scholar]
  120. Capaldo, A. Network structure and innovation: The leveraging of a dual network as a distinctive relational capability. Strateg. Manag. J. 2007, 28, 585–608. [Google Scholar] [CrossRef]
  121. Anderson, J.C.; Hakansson, H.; Johanson, J. Dyadic business relationships within a business network context. J. Mark. 1994, 58, 1–15. [Google Scholar] [CrossRef]
  122. Dillman, D.A. Mail and Internet Surveys: The Tailored Design Method; John Wiley & Sons: New York, NY, USA, 2000. [Google Scholar]
  123. Van der Stede, W.A.; Young, S.M.; Chen, C.X. Assessing the quality of evidence in empirical management accounting research: The case of survey studies. Account. Organ. Soc. 2005, 30, 655–684. [Google Scholar] [CrossRef]
  124. Abernethy, M.A.; Brownell, P. The role of budgets in organizations facing strategic change. Account. Organ. Soc. 1999, 24, 189–204. [Google Scholar] [CrossRef]
  125. Chen, J.I.; Paulraj, A.; Lado, A.A. Strategic purchasing, supply management and firm performance. J. Oper. Manag. 2004, 22, 505–523. [Google Scholar] [CrossRef]
  126. Narasimhan, R.; Nair, N. The antecedent role of quality, information sharing and supply chain proximity on strategic alliance formation and performance. Int. J. Prod. Econ. 2005, 96, 301–313. [Google Scholar] [CrossRef]
  127. Amstrong, J.S.; Overton, T.S. Estimating nonresponse bias in mail surveys. J. Mark. Res. 1977, 14, 396–402. [Google Scholar] [CrossRef]
  128. Rogelberg, S.G.; Stanton, J.M. Understanding and Dealing with Organizational Survey Nonresponse. Organ. Res. Methods 2007, 10, 195–209. [Google Scholar] [CrossRef]
  129. Blair, E.; Zinkhan, G.M. Non-response and generalizability in academic research. J. Mark. Sci. 2006, 34, 4–7. [Google Scholar] [CrossRef]
  130. Podsakoff, P.M.; MacKenzie, S.B.; Lee, J.-Y.; Podsakoff, N.P. Common method biases in behavioural research: A critical review of the literature and recommended remedies. J. Appl. Psychol. 2003, 88, 879–903. [Google Scholar] [CrossRef] [PubMed]
  131. Liao, Z.; Wong, W.K. The determinants of customer interactions with internet-enable e-banking services. J. Oper. Res. Soc. 2008, 59, 1201–1210. [Google Scholar] [CrossRef]
  132. Moslehpour, M.; Wong, W.K.; Aulia, C.K.; Pham, V.K. Repurchase intention of Korean beauty products among Taiwanese consumers. Asian Pac. J. Mark. Logist. 2017, 29, 569–588. [Google Scholar] [CrossRef]
  133. Hair, J.F.; Black, W.C.; Babin, B.R.; Anderson, R.E.; Tatham, R.L. Multivariate Data Analysis; Prentice-Hall: Upper Saddle River, NJ, USA, 2006. [Google Scholar]
  134. Steiger, J.H. Structural model evaluation and modification: An interval estimation approach. Multivar. Behav. Res. 1990, 25, 173–180. [Google Scholar] [CrossRef] [PubMed]
  135. Hu, L.T.; Bentler, P.M. Fit indices in covariance structure modeling: Sensitivity to underparameterized model misspecification. Psychol. Methods 1998, 3, 424. [Google Scholar] [CrossRef]
  136. Segars, A.H.; Grover, V. Strategic information systems planning success: An investigation of the construct and its measurement. MIS Q. 1998, 22, 139–163. [Google Scholar] [CrossRef]
  137. Doll, W.J.; Raghunathan, T.; Lim, S.J.; Gupta, Y.P. A confirmatory factor analysis of the user information satisfaction instruments. Inf. Syst. Res. 1995, 6, 177–188. [Google Scholar] [CrossRef]
  138. Bagozzi, R.P.; Yi, Y.; Phillips, L.W. Assessing construct validity in organizational research. Admin. Sci. Q. 1991, 36, 421–458. [Google Scholar] [CrossRef]
  139. Fornell, C.; Larcker, D.F. Evaluating structural equation models with unobservable variables and measurement error. J. Mark. Res. 1981, 18, 39–50. [Google Scholar] [CrossRef]
  140. Byrne, B.M. Structural Equation Modelling with EQS: Basic Concepts, Applications, and Programming; Lawrence Erlbaum Associates: New York, NY, USA, 2006. [Google Scholar]
  141. Baumgartner, H.; Steenkamp, J.-B. Multi-group latent variable models for varying numbers of items and factors with cross-national and longitudinal applications. Mark. Lett. 1998, 9, 21–35. [Google Scholar] [CrossRef]
  142. Das, T.K.; Teng, B.S. Trust, control, and risk in strategic alliances: An integrated framework. Organ. Stud. 2001, 22, 251–283. [Google Scholar] [CrossRef]
  143. Mayer, R.C.; Davis, J.; Schoorman, F.D. An integrative model of organizational trust. Acad. Manag. Rev. 1995, 20, 709–734. [Google Scholar]
  144. Hines, T.; McGowan, P. Supply chain strategies in the UK fashion industry—The rhetoric of partnership and realities of power. Int. Entrep. Manag. J. 2005, 1, 519–537. [Google Scholar] [CrossRef]
  145. Tan, K.C. Supply Chain Management: Practices, Concerns, and Performance Issues. J. Supply Chain Manag. 2002, 38, 42–53. [Google Scholar] [CrossRef]
  146. Köksal, D.; Strähle, J.; Müller, M.; Freise, M. Social sustainable supply chain management in the textile and apparel industry. A literature review. Sustainability 2017, 9, 100. [Google Scholar] [CrossRef]
  147. Varsei, M.; Christ, K.; Burrit, R. Distributing wine globally: Financial and environmental trade-offs. Int. J. Phys. Distrib. Logist. Manag. 2017, 47, 410–428. [Google Scholar] [CrossRef]
  148. Brusset, X. Does supply chain visibility enhance agility? Int. J. Prod. Econ. 2016, 171, 46–59. [Google Scholar] [CrossRef]
  149. Lee, H.; Kim, M.S.; Kim, K.K. Interorganizational information systems visibility and supply chain performance. Int. J. Inf. Manag. 2014, 34, 285–295. [Google Scholar] [CrossRef]
  150. Seuring, S.; Müller, M. From a literature review to a conceptual framework for a sustainable supply chain management. J. Clean. Prod. 2008, 16, 1699–1710. [Google Scholar]
  151. Canzaniello, A.; Hartmann, E.; Fifka, M.S. Intra-industry strategic alliances for managing sustainability-related supplier risks: Motivation and outcome. Int. J. Phys. Distrib. Logist. Manag. 2017, 47, 387–409. [Google Scholar] [CrossRef]
Figure 1. The conceptual model.
Sustainability 09 01487 g001
Table 1. Literature on supply chain performance. A value-based classification.
ResearchInterorganisational PerformanceResearch Details
Operational Value-CreationStrategic Value-CreationValue Capture
[8] (S)Short-notice deliveriesInnovation, information, references to potential customers, reduction in dependency on other customers, access to third parties Margin per profit, overall profit, number of deliveries, sales volume, profitability247 German suppliers (electronic, mechanical, chemical and vehicle industries)
[9] (S)-Product and process innovation, market information acquisition, access to other relevant factors in working environmentDirect profit, business volume, level of business, revenue guaranteeTheoretical approach
[90] (S)Product quality, delivery performance, price, responsiveness to requests for changes, service support--Survey of 139 first-tier North American automotive suppliers
[25] (S)Cost improvement, product quality, delivery speedInnovation introduction-Survey of 245 US industrial firms
[6] (B) & (S)Service level, flexibility, cycle timeInformation visibility, end-customer satisfaction, inventory visibilityBusiness volumeSurvey sent to The University of Oklahoma Logistics/Supply Chain Executive Panel (56 members)
[22] (B)Product cost, product quality, delivery performance, service support, conformance to specificationsPersonal interaction, know-how, time to market, reduction inventories-Interviews with 10 manufacturers in a variety of areas and survey of 118 + 228 purchasing managers
[10] (S)Cost efficiency obtained from higher sales volumesImprovements of processes, new product, learning about customers and markets, product enhancements, new business opportunities.Profitability241 first-tier OEM suppliers in the computer industry
[32] (S) & (B)Quality, cost, volume flexibility, delivery, response promptness, product conformance to specifications, reliability/dependability, customer order confirmation speed, customer complaint handling speed, delivery dependability--232 United States firms (SIC 34–39).
[11] (B) & (S)Order cycle times, order processing accuracy, delivery promptnessForecast accuracy, satisfaction with the relationshipProfitability, market share, sales growth397 buyers and 290 suppliers (US manufacturing and service industries)
[44] (B) & (S)Product quality, delivery performance, cost and priceKnow-how, communication-126 buyer units and 126 suppliers of 5 international manufacturing companies
[7] (B) or (S)Quality (as relational collaborative advantage)Innovation (as relational collaborative advantage)Growth of sales, ROI, growth on ROI, profit margin on sales227 US managers with experience in supply chain management (SIC 25, 20, 34–28)
Note: Buyer (B) and/or supplier (S) performance analysed through the relationships.
Table 2. Demographic data.
The FirmBuyers (%/sd)Suppliers (%/sd)
General machinery57 (54.81%)42 (46.66%)
Electrical and electronic machinery22 (21.15%)24 (26.67%)
Transportation equipment25 (24.04%)24 (26.67%)
Number of employees301.46 (1052.87)229.00 (1117.03)
Age of firm19.21 (15.72)19.38 (14.38)
ROA0.01 (0.13)0.05 (0.07)
ROE0.02 (1.06)0.07 (0.25)
The relationship
Volume of purchases/sales represented by the relationship (%)15.09 (14.50)17.71 (21.93)
Length of relationship (years)12.13 (8.32)11.42 (7.62)
Note: percentage (%); standard deviations (sd); return on assets (ROA); return on equity (ROE).
Table 3. Unidimensionality, reliability and convergent validity.
FactorBuyer SampleSupplier Sample
Factor Loadings (p-Value < 0.05)CR (>0.7)CFA Model Fit (Minimum Recommended Values)Factor Loadings
(p-Value)
CR (>0.7)CFA Model Fit (Minimum Recommended Values)
TITI2: 0.651
(0.000 ***)
0.772X2 = 12.209, df = 8
X2/df: 1.526 (<3)
GFI: 0.963 (>0.9)
AGFI: 0.903 (>0.9)
CFI: 0.978 (>0.9)
RMSEA = 0.091 (<0.1)
TI2: 0.649
(0.000 ***)
0.774X2 = 8.001, df = 8
X2/df: 1.000 (<3)
GFI: 0.973 (>0.9)
AGFI: 0.929 (>0.9)
CFI: 1.000 (>0.9)
RMSEA = 0.071 (<0.08)
TI3: 0.643
(0.000 ***)
TI3: 0.753
(0.000 ***)
TI4: 0.705
(0.000 ***)
TI4: 0.629
(0.000 ***)
TI6: 0.708
(0.000 ***)
TI6: 0.683
(0.000 ***)
DIDI2: 0.900
(0.000 ***)
0.862DI2: 0.756
(0.000 ***)
0.811
DI4: 0.840
(0.000 ***)
DI4: 0.892
(0.000 ***)
TRTR2: 0.750
(0.000 ***)
0.842X2 = 0.432, df = 2
X2/df: 0.216 (<3)
GFI: 0.998 (>0.9)
AGFI: 0.990 (>0.9)
CFI: 1.000 (>0.9)
RMSEA = 0.000 (<0.08)
TR2: 0.674
(0.000 ***)
0.869X2 = 1.970, df = 2
X2/df: 0.985 (<3)
GFI: 0.989 (>0.9)
AGFI: 1.000 (>0.9)
CFI: 1.000 (>0.9)
RMSEA = 0.000 (<0.08)
TR3: 0.728
(0.000 ***)
TR3: 0.752
(0.000 ***)
TR4: 0.730
(0.000 ***)
TR4: 0.902
(0.000 ***)
TR5: 0.812
(0.000 ***)
TR5: 0.819
(0.000 ***)
CECE1: 0.903
(0.000 ***)
0.754CE1: 0.722
(0.000 ***)
0.738
CE3: 0.606
(0.000 ***)
CE3: 0.731
(0.000 ***)
CE4: 0.603
(0.000 ***)
CE4: 0.633
(0.000 ***)
OVOV1: 0.767
(0.002 ***)
0.728X2 = 9.336, df = 11
X2/df: 0.849 (<3)
GFI: 0.976 (>0.9)
AGFI = 0.938 (>0.9)
CFI = 1.000 (>0.9)
RMSEA = 0.000 (<0.08)
OV1: 0.991
(0.000 ***)
0.756X2 = 29.249, df = 11
X2/df: 2.659 (<3)
GFI: 0.919 (>0.9)
AGFI = 0.793 (>0.9)
CFI = 0.909 (>0.9)
RMSEA = 0.100 (≤0.1)
OV3: 0.746
(0.004 ***)
OV3: 0.529
(0.015 **)
SVSV1: 0.865
(0.004 ***)
0.805SV1: 0.835
(0.000 ***)
0.821
SV2: 0.753
(0.003 ***)
SV2: 0.715
(0.000 ***)
SV3: 0.658
(0.007 ***)
SV3: 0.780
(0.000 ***)
VCVC1: 0.565
(0.004 ***)
0.619VC1: 0.612
(0.000 ***)
0.606
VC2: 0.767
(0.007 ***)
VC2: 0.706
(0.000 ***)
Note: Bias-corrected percentile bootstrap results for small sample estimates (10,000 replications).
Table 4. Test of discriminant validity.
Buyer SampleSupplier Sample
TIDGTRCEOVSVVCTIDGTRCEOVSVVC
TI10.3740.6530.5200.2820.3460.43410.4100.3520.3610.3280.3200.396
DG0.3741−0.0290.0570.3720.3390.0870.4101−0.0320.5830.0910.1820.123
TR0.653−0.02910.7140.1250.2440.2540.352−0.03210.3620.2030.0320.281
CE0.5200.0570.71410.0440.2470.3760.3610.5830.36210.1020.0330.290
OV0.2820.3720.1250.04410.3120.1180.3280.0910.2030.10210.4490.425
SV0.3460.3390.2440.2470.31210.4140.3200.1820.0320.0330.44910.439
VC0.4340.0870.2540.3760.1180.41410.3960.1230.2810.2900.4250.4391
Max corr0.6530.3740.7140.7140.3720.4140.4340.4100.5830.3620.5830.4490.4490.439
√AVE0.6800.8710.7560.7180.7560.7640.6740.6800.8270.7910.6960.7930.7640.674
√AVE/max corr1.0412.3291.0591.0062.0321.8451.5531.6591.4192.1851.1941.7661.7021.535
Note: max corr: maximum correlation.
Table 5. Test of invariance results.
InvarianceΧ2 (p)dfΧ2/dfCFIGFIAGFIRMSEAΔΧ2 (p)ΔCFI
Configural381.903 (0.001)2991.2770.9400.8420.7780.038--
Metric391.472 (0.000)3121.2550.9420.8390.7830.0369.569 (0.729)0.002
Factorial393.496 (0.002)3161.2450.9440.8380.7840.0362.014 (0.733)0.002
Structural418.478 (0.001)3291.2720.9350.8320.7850.03824.992 (0.023)−0.009
Table 6. Result of the hypotheses based on standardized bootstrapping estimates.
Direct EffectsIndirect EffectsTotal Effects
HPathBuyerSupplierHPathBuyerSupplierBuyerSupplier
H1TI→TR0.761 ***0.458 ***----0.761 ***0.458 ***
H1DI→TR−0.307 *−0.226 +-- −0.307 *−0.226 +
H2TI→CE−0.0680.193H7TI→TR→CE0.638 ***0.145 *0.570 ***0.338 +
H2DI→CE0.1320.172H7DI→TR→CE−0.258 *−0.071 +−0.1260.101
H3TR→CE0.838 ***0.316 *----0.838 ***0.316 *
H4TI→OV−0.0010.565 *H7TI→{TR,CE}→OV0.104−0.1480.1030.417 *
H4TI→SV0.0830.319 +H7TI→{TR,CE}→SV0.173 +−0.0640.256 *0.255 +
H4TI→VC0.480 +0.242H7TI→{TR,CE}→VC−0.0070.155 +0.473 **0.397 *
H4DI→OV0.392 *−0.161H7DI→{TR,CE}→OV−0.0560.0690.335 *−0.092
H4DI→SV0.308 *0.086H7DI→{TR,CE}→SV−0.064−0.0080.244 *0.078
H4DI→VC−0.0660.016H7DI→{TR,CE}→VC0.0350.0250.0310.041
H5TR→OV0.240−0.313 +H7TR→CE→OV−0.117−0.0050.124−0.318 +
H5TR→SV0.184−0.030H7TR→CE→SV0.049−0.0470.233 +−0.077
H5TR→VC−0.2380.059H7TR→CE→VC0.2560.120 +0.0180.178
H6CE→OV−0.139−0.014----−0.139−0.014
H6CE→SB0.059−0.148----0.059−0.148
H6CE→VC0.306 0.378 *----0.3060.378 *
Note: + p < 0.10; * p < 0.05; ** p < 0.01; *** p < 0.001. In bold, supported hypotheses (p < 0.05); in cursive, partially supported hypotheses (p < 0.1). Significance of total effects are also reported.
Table 7. Information-sharing roles for value creation and capture.
Suppliers Value-Based PerformanceBuyers Value-Based Performance
OVSVVCOVSVVC
TIAccounting for controlAccounting for control (weak)Accounting for durable and stable relationships-Accounting for trustAccounting for control
DI---Accounting for controlAccounting for control-

