Accelerated Urban Expansion in Lhasa City and the Implications for Sustainable Development in a Plateau City


1
Key Laboratory of Mountain Surface Processes and Ecological Regulation, Institute of Mountain Hazard and Environment, Chinese Academy of Sciences, Chengdu 640016, China
2
Institute of Geographic Sciences and Natural Resources Research, Chinese Academy of Sciences, Beijing 100101, China
3
College of Earth Sciences, Chengdu University of Technology, Chengdu 610059, China
4
Land and Resources College, China West Normal University, Nanchong 637009, China
*
Authors to whom correspondence should be addressed.
Sustainability 2017, 9(9), 1499; https://doi.org/10.3390/su9091499
Submission received: 24 July 2017
/
Revised: 16 August 2017
/
Accepted: 21 August 2017
/
Published: 23 August 2017
(This article belongs to the Special Issue Sustainable Smart Cities and Smart Villages Research)
Abstract
:Urbanization challenges regional sustainable development, but a slight expansion mechanism was revealed in a plateau city. We have integrated the urban expansion process and analyzed its determinants in Lhasa (Tibet), and we provide insightful suggestions for urban management and planning for Lhasa. The full continuum of the urban expansion process has been captured using time-series of high-resolution remote sensing data (1990–2015). Four categories of potential determinants involved in economic, demographic, social, and government policy factors were selected, and redundancy analysis was employed to define the contribution rates of these determinants. The results illustrate that considerable urban expansion occurred from 1990 to 2015 in Lhasa, with the area of construction land and transportation land increasing at rates of 117.2% and 564.7%, respectively. The urban expansion in the center of Lhasa can be characterized as temperate sprawl from 1990 through 2008, primarily explained by governmental policies and investment, economic development, tourist growth, and increased governmental investment resulting in faster urban expansion from 2008 to 2015, mainly occurring in the east, south, and west of Lhasa. In contrast with other cities of China, central government investment and “pairing-up support” projects have played an important role in infrastructure construction in Lhasa. The miraculous development of the tourism industry had prominent effects on this economic development and urbanization after 2006, due to the running of the Tibetan Railway. An integrative and proactive policy framework, the “Lhasa development model”, having important theoretical, methodological, and management implications for urban planning and development, has been proposed.
1. Introduction
Unprecedented urbanization, one of the most irreversible human impacts, has taken place globally in recent decades [1,2,3]. More than 50% of the global population now lives in cities, and this is expected to exceed 67% by 2050 [4,5]. Urbanization promotes social-economic development, which inevitably converts semi-natural and natural ecosystems into urban environments, which has enormous and inevitable effects on the surrounding area [6,7,8,9]. Thus, more attention should be paid to the drastic expansion of urbanization. Many studies have been conducted worldwide [1], including in regions of Africa [10], Europe [11], Latin America [12], North America [13], and Asia [14,15,16]. Previous studies have also explored the mechanisms of many cities, population and income related to urban expansion in the USA [17], social infrastructure in the Ulaanbaatar [18], and population, economics, and infrastructure in Freetown [19].
China has been undergoing dramatic urban expansion since the “Reform and Open Policy” in 1978 [20]. Many studies have investigated the spatiotemporal patterns of urban expansion at the national scale [21,22,23,24,25,26,27,28,29,30,31]. Moreover, the spatiotemporal trajectories and patterns of urban expansion have been investigated in “hot” cities in China, such as the megacities in Eastern China [32,33,34,35,36,37,38,39], Northeastern China [40], and Central China [41,42,43,44], in addition to a few metropolises in Western China [45,46,47]. Generally, the primary form of urban expansion in China has been edge-expansion around cities supported by infilling expansion in city centers; leapfrog expansion has been the form in a few metropolises [25].
The speed of urban expansion has fluctuated during different periods [27], and it has been necessary to understand the determinants for urban expansion in different periods [48,49,50]. Studies have indicated that marketization, globalization, and decentralization accounted for urban expansion in China [51]. However, the mechanisms of urban expansion have differed in different regions and periods [31]. Geographic location, population growth, economic development, and government policies, and the interaction of these factors, have been important drivers for urban expansion in the eastern coastal areas, such as Shenzhen [52,53], Shanghai [54], and Xiamen [55]. As for the resource-based cities, mining activities were considered as one of the most important factors in urban expansion, such as in the cities of Pingshuo and Shuozhou [42,43]. Government policies (“Revitalizing Old Industrial Base of Northeast China”), as well as high-technology, stimulated the re-expansion in Northeast China [40]. Similar situations are found in western cities under the “Development of the West Region” policy [4,56].
Urbanization in mountain cities has become somewhat differentiated from the processes experienced elsewhere. Although there are many studies on urbanization in general, only few studies focus on the urban expansion in mountain cities. In the French Alps, a rapid and continuous urban expansion at the expense of farm land was observed from 1998 to 2009 [57]. In the Peruvian Central Andes, not merely the urban rapidly growth, but also the human land use expanded for the reforestation, as well as range burning for economic development [58]. In the Himalayas, the develop model of urban in Thimphu combined the traditional elements for the site of political, as well as economic, power [59].
To seek the sustainable development (smart cities) in the process of urbanization, for policy-makers, policies should be linked to the reality of local urban expansion [31], encouraging local residents to get actively involved in decision-making processes [60]. Additionally, a compact pattern of urban expansion may be more friendly to ecology and the natural environmental than a dispersed pattern would be [61], and urban redevelopment is also an effective measure [62]. Moreover, stronger measures should be enforced to control inefficient utilization of land on the city fringes [33], promoting reasonable and sustainable transportation [48,54], while also improving citizens’ continuous awareness of sustainable development [44,63]. In general, it is difficult to realize smart cities in mountain regions and creating a database (socio-economic data and GIS data) depends on the consistency of element contents. Modeling the urban expansion boundaries is regarded as an effective approach to guide urban smart growth [64]. More investment should be made for the development and construction of smart low-carbon cities in China [65].
As for the mountain city in China, Lhasa, the average elevation of Lhasa is approximately 3650 m, and solar radiation is strong. With diverse topography, as well as climate, it is rich in biodiversity. However, the natural environment is extremely harsh, with a fragile ecosystem that is extremely susceptible to the impacts of climate change and human activities [66]. In Tibet, Tibetan Buddhism, with its distinctive characteristics, and the politico-religious merged system of government that was established in the 17th century, played an important part in the development of cities and towns before 1951. In 1951, Lhasa was taken as the only urban lay settlement in Tibet; the population of Lhasa was less than thirty thousand, and the urban area was no more than 3 km2. Nevertheless, after democratic reform in 1959, especially in the last three decades, Lhasa has been clearly expanding and transforming in the process of modernization. However, it is important to note that a limited number of studies have analyzed the urban expansion and its determinants in mountain cities in China, especially for Lhasa, which is the most important Tibetan city. This sparse attention has unavoidably created knowledge gaps and left numerous pivotal issues unaddressed and unclear. The mechanism of urban expansion might exhibit different characteristics in the plateau city; revealing the mechanism of urban expansion in the plateau city is essential to understand its environmental impacts and to protect the socio-ecological diversity.
Consequently, against this context, this study aims to reveal the spatial-temporal pattern of urban expansion and its determinants in Lhasa from 1990 to 2015, while simultaneously outlining policy suggestions containing relevant planning and guidelines for local development.
2. Materials and Methods
2.1. Study Area
Lhasa is not only the capital of Tibet, but also the its political, economic, cultural, and religious center (Figure 1). The city contains many archaeological sites that are listed as world cultural heritage sites: these include the Potala Palace, the Jokhang Temple, and Norbulingka. In the present study, the term “Lhasa” refers to the Lhasa urban area, comprised of Downtown Chengguan (DCG), Liuwu New District (LND), Dongcheng New District (DCND), and Dongga New District (DGND).
Lhasa is an old city, with a history going back more than 1300 years. At the beginning of the 7th century, Songtsen Gampo established the first unified regime in the history of Tibet. In AD 633, he moved the capital of Tubo Dynasty from Shannan to today’s Lhasa and ordered the construction of Potala Palace and the Jokhang and Ramoche Temples, turning Lhasa into the most populous town in Tibet. From the collapse of the Tubo Dynasty in the 9th century until the Ming Dynasty in the early 14th century, Lhasa lost its previous political status and developed slowly. Potala Palace was destroyed in warfare, but Lhasa remained an important place for Buddhists, because of the Jokhang Temple. In the early 15th century, the importance of Lhasa as a holy site for Tibetan Buddhism became increasingly significant, following the founding of the “great three” (Ganden Monastery, Salad Monastery, and Drepung Monastery) Gelug university monasteries by Je Tsongkhapa. In the 17th century, with the support of the Qing Dynasty, the fifth Dalai Lama unified Tibet again and established a politico-religious merged system of government named Ganden Podrang. Following the liberation of Tibet in 1951, Lhasa became the capital of the Tibet Autonomous Region in 1965 and entered into a new age. Over the last 50 years, Lhasa has experienced rapid growth and development. Nowadays, Lhasa is still the political and cultural center in Tibet, and has retained its importance as a holy city for the entire realm of Lamaist Buddhism.
2.2. Satellite Images
To delineate the urban area more precisely, high-resolution remotely-sensed data SPOT1/4/5 and Word-View images (Appendix A) were used to acquire the time-series land-use information of Lhasa, covering four time periods (1990, 2001, 2008, and 2015). The preprocessing of the images included atmospheric correction and geometric rectification in ENVI. Then, we adopted the object-oriented method (a method that not only considers the spectral signature in classification but also evaluates the tone, texture, and shape, of image objects at the same time) to obtain the land-use categories, including the classifications of water (W), greenbelt (including natural grassland, GB), forest land (FL), plough land (PL, including arable areas and crops), unutilized land (UL), construction land (CL), transportation land (TL), and wetland (WL). Following classification, manual vectorization was conducted in ArcGIS 10.2 (ESRI, Inc., Redlands, CA, USA) to correct in accurate classifications. Via randomly stratified methods that overlapped the fact-finding points with the land cover maps, the final accuracy of the classification was evaluated. The total accuracy for four land cover maps was 90.1% for 1990, 91.2% for 2001, 92.5% for 2008, and 94.3% for 2015, respectively.
2.3. Determinants and Analysis Methods
Considering data representative and the availability of prior literature [31,42,48,52,67,68,69,70], we selected 12 potential determinants for urban expansion in Lhasa that were extracted from the corresponding statistical yearbook: these determinants are total population (TP), urban population (UP), country population (CP), number of foreign travelers (FT), number of domestic tourists (DT), gross domestic product (GDP), GDP in primary industries (GDPPI), GDP in secondary industries (GDPSI), GDP in tertiary industries (GDPTI), tourist income (TI), actual investment (AI), and investment in fixed assets (FA). In addition, the build-up area (BA) was selected to reflect the degree of urban expansion. The redundancy analysis is a linear canonical ordination method, which is advantageous to detect the pattern of dynamics in response variables [71]. The redundancy analysis is closely related to potential explanatory variables, which is effective to evaluate the relationships among multiple interacting variables [72,73]. Thus, the redundancy analysis of R software (Vegan) was employed to explore the relationships of BA with determinants (determinants were partitioned into four explanatory variable groups: TP (UP and CP), GDP (GDPPI, GDPSI and GDPTI), AI, and TI) and to identify the major factors influencing the expansion of Lhasa. The associations between the BA and the determinants with p < 0.05 were regarded as statistically significant.
3. Results
3.1. Land Cover Change of Lhasa (1990–2015)
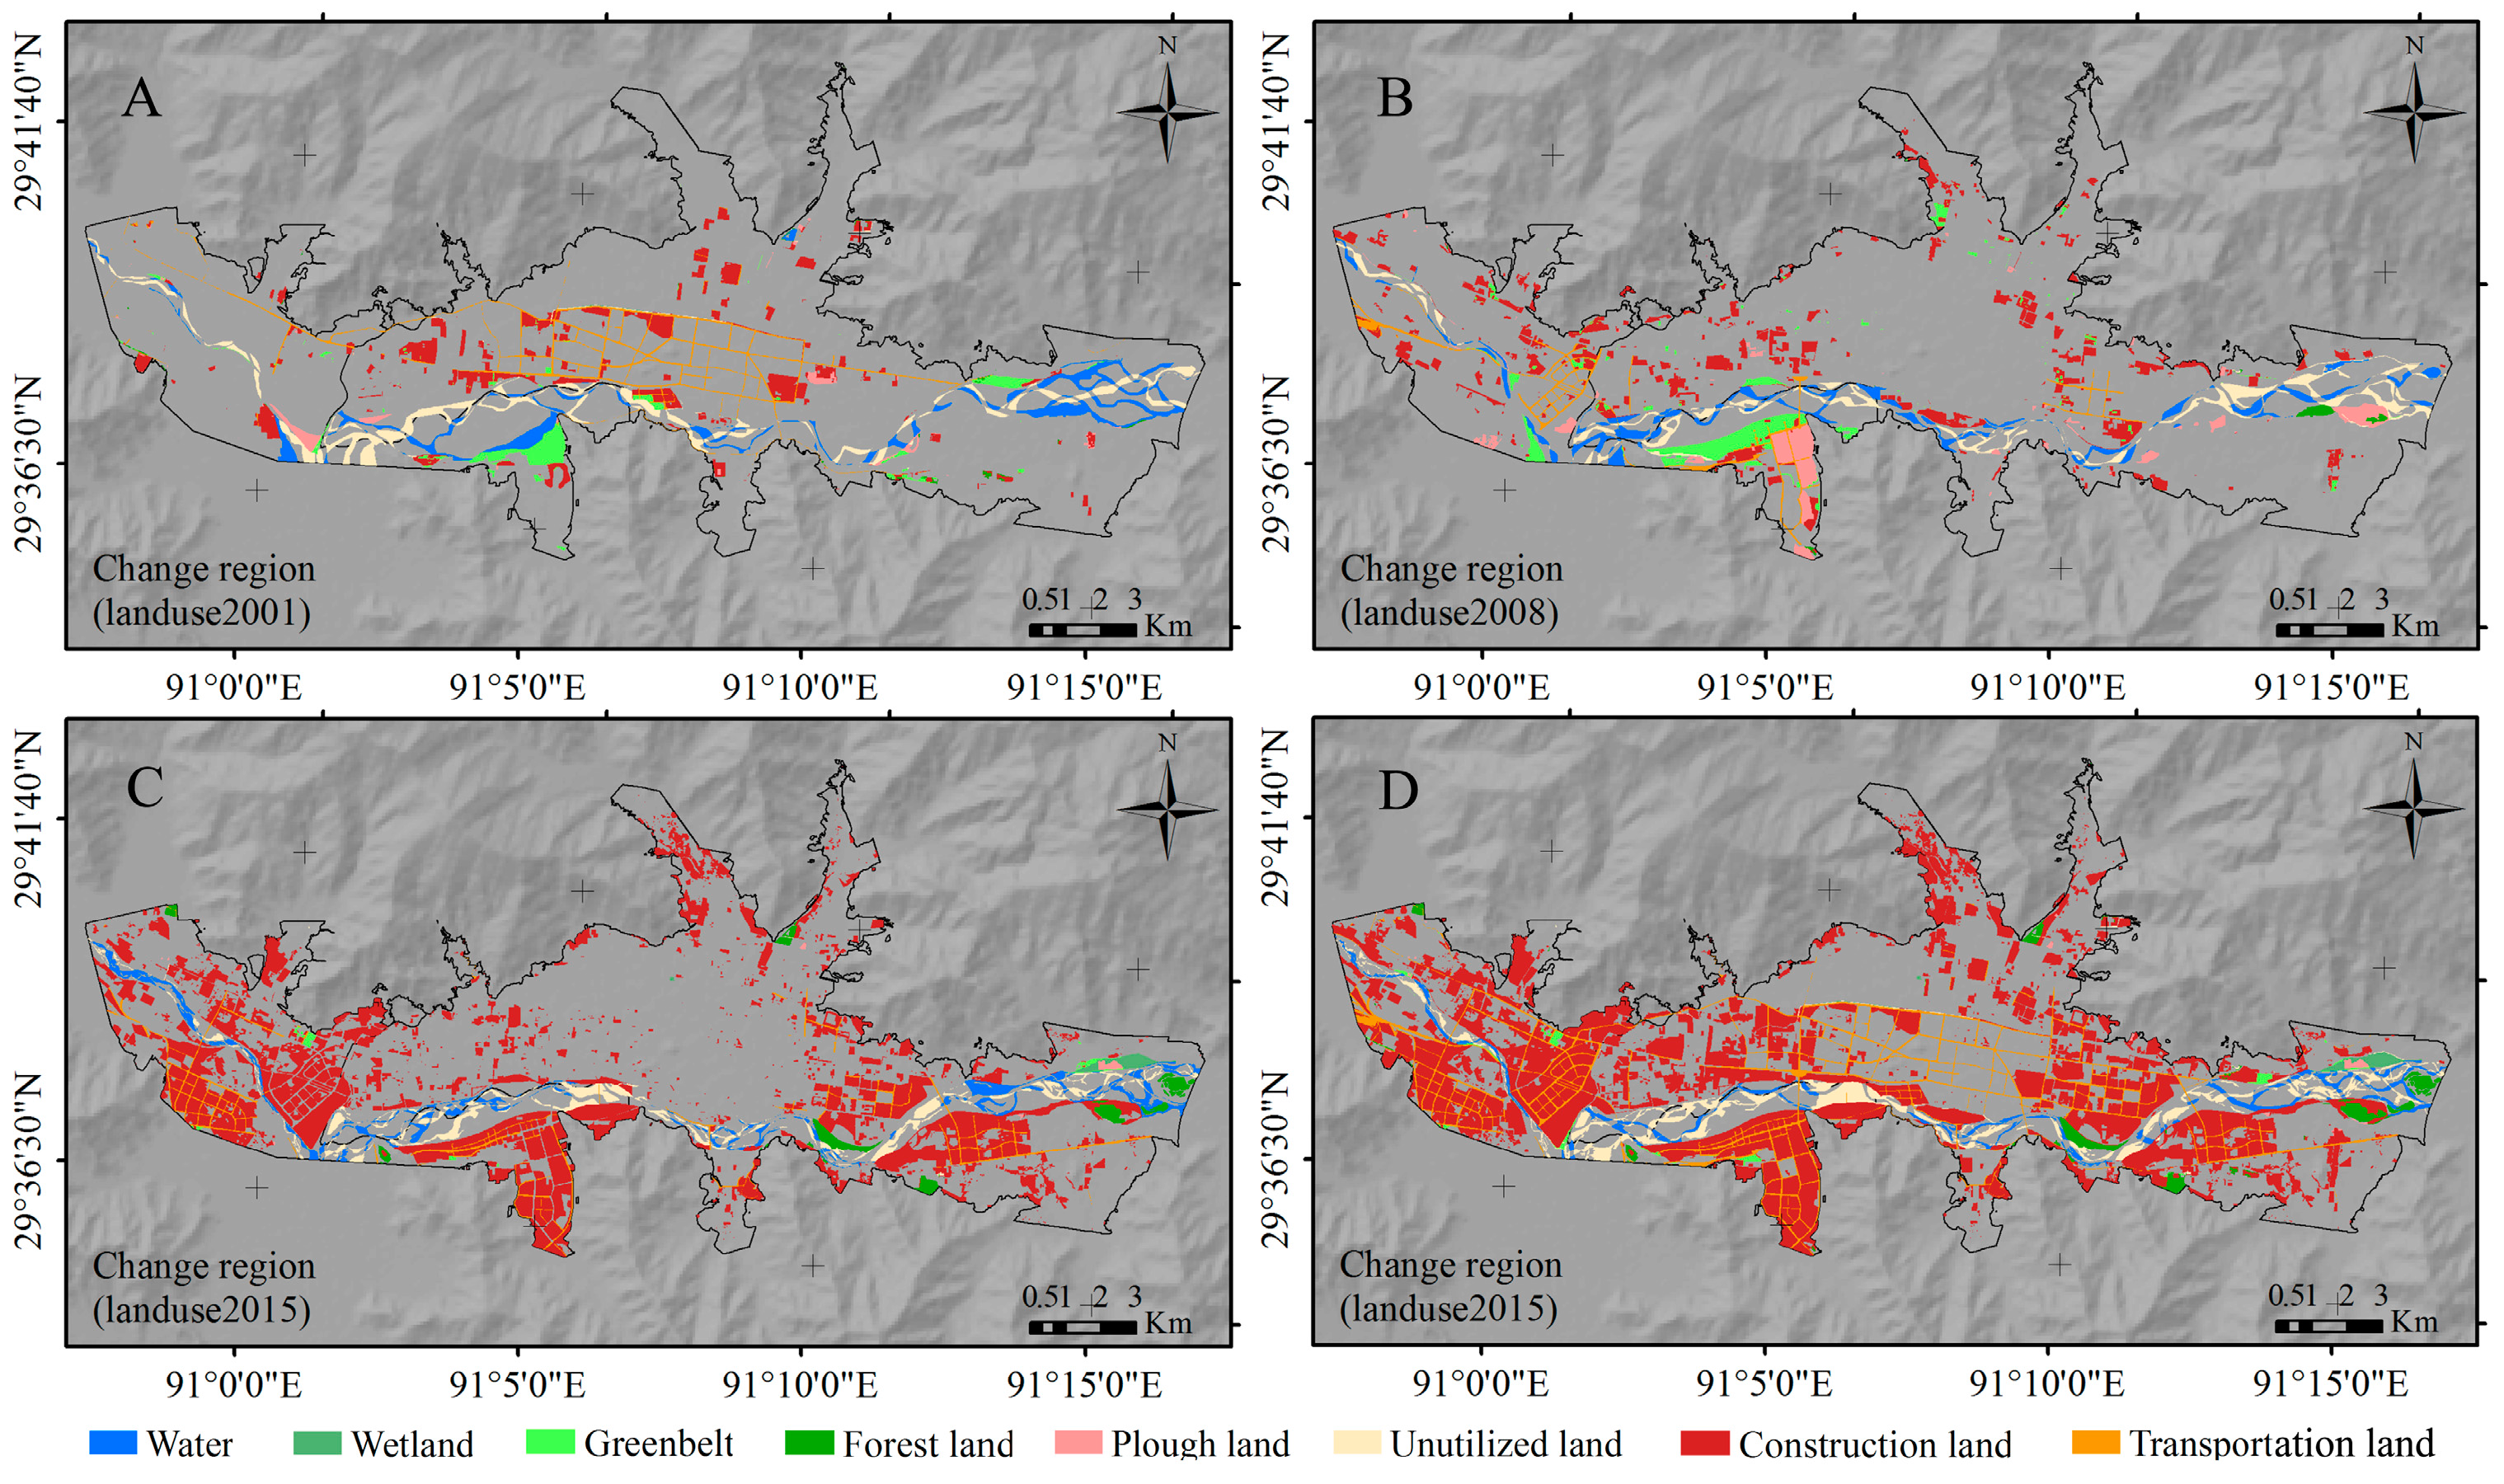
From 1990 to 2015, Lhasa experienced considerable urban expansion. In all, 56.80% of the total land in the study area was urbanized; this urbanization was mainly distributed in the DCND, DGND, and LND (Figure 2D). The areas of CL and TL increased from 45.0 km2 and 1.4 km2, respectively, in 1990 to 97.7 km2 and 9.0 km2, respectively, in 2015, with increased rates of 117.2% and 564.7%, respectively. On the contrary, the areas of PL and GB decreased by 38.0 km2 and 17.7 km2, respectively. Additionally, the increased TL was mainly found in the center of Lhasa (1990–2001, Figure 2A), the west of Lhasa (2001–2008, Figure 2B), and the east, the south, and the west of Lhasa (2008–2015, Figure 2C), with increased areas of 3.0 km2, 2.1 km2, and 2.6 km2, respectively.
Mutual transfer quantities of land-use were investigated using the overlay analysis and transition matrices in ArcGIS 10.2 (ESRI, Inc., Redlands, CA, USA) (Figure 3). The PL and CL were found to be the main land classes in 1990, while CL was the main land class in 2015. The most extensive and intensive transition occurred between the PL and CL, with approximately 35.1 km2 (58.0%) of PL transferred into CL. Approximately 19.0 km2 (86.7%) and 1.5 km2 (6.5%) of GB and W, respectively, were transferred to CL from 1990 to 2015, and small areas of FL, UL, and TL were transferred to CL. Meanwhile, during the highest urban expansion period of 2008–2015, approximately 24.4 km2 PL and 12.3 km2 GB changed into CL. Moreover, almost 3.4 km2 PL and 2.4 km2 CL have been transferred into TL over the past 25 years.
3.2. The Changes of the Main Socio-Economic Indicators of Lhasa (1990–2015)
3.2.1. Economic Development
During the past 25 years, the GDPSI and GDPTI reflected the economic development traits, and the GDPTI was the dominant economy for the growth of the economy in Lhasa. Figure 4 shows that GDP, GDPSI, and GDPTI grew continuously from 1990 to 2014, while GDPPI increased relatively slowly. As for GDP, a general linear model analysis showed that the year 2006 can be considered as a “tipping point”, with slopes of 5.74 × 10² million/year (y = 5.74x − 11,423.29) and 2.90 × 10³ million/year (y = 2.90x − 58,137.54), respectively, before and after 2006. Similarly, the rate of GDPSI sharply increased from 2007 to 2014 (slope = 12.98), whereas the process was slower from 1990 to 2006 (slope = 1.53), and the GDPSI accounted for 36.77% of the GDP in 2014. Meanwhile, the GDPTI has expanded continuously during the past 25 years; reaching up to 2.07 × 10⁴ million Renminbi (RMB) in 2014, accounted for 59.51% of the GDP in that year. The GDPTI also demonstrated significantly increasing trends after 2005 (before 2005, the slope = 15.17; after 2005, the slope = 3.75).
3.2.2. Urban Population Growth
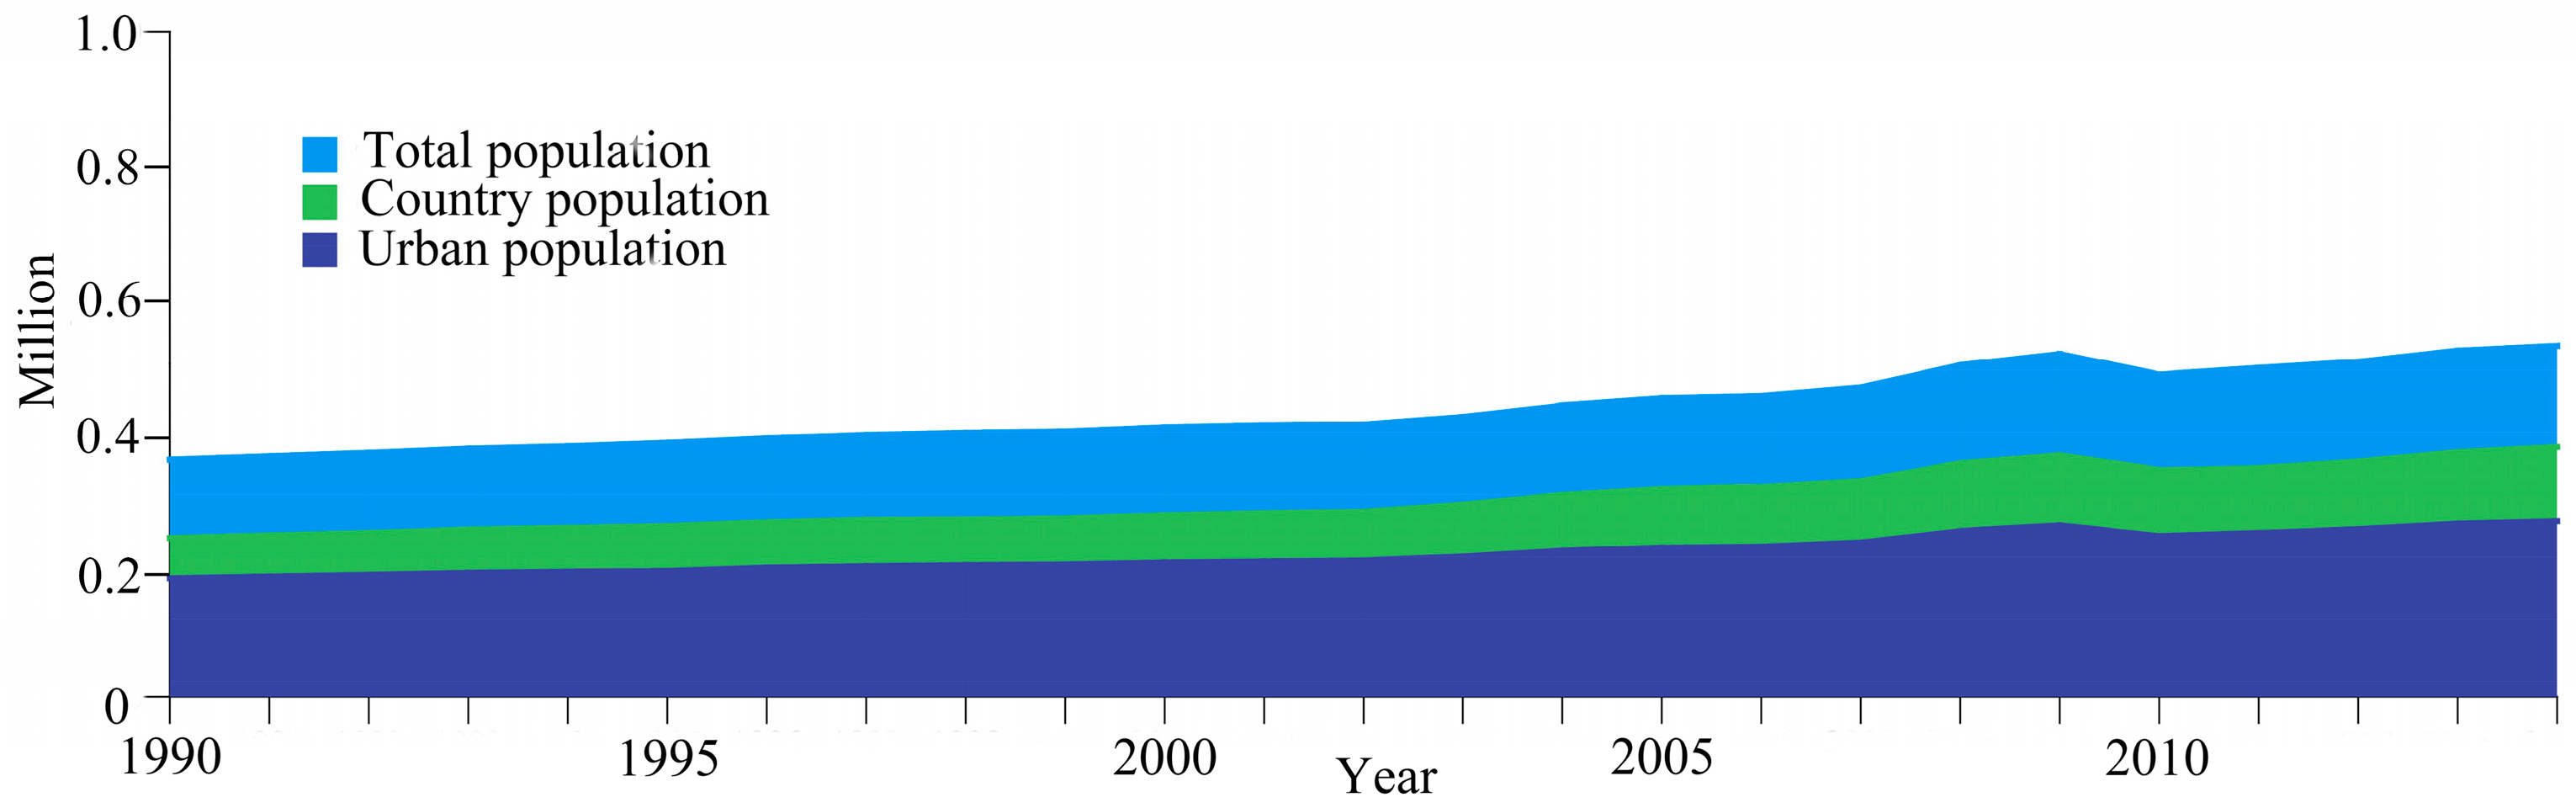
A growing trend of the total population in Lhasa from 1990 to 2014 was observed (Figure 5). The total population increased from 3.57 × 10⁵ (1990) to 5.27 × 10⁵ (2014), with a rate of increase equal to 47.87%. Incredibly, a sharp expansion of the total population occurred between 2008 and 2009. Moreover, the urban population increased to 2.23 × 10⁵ in 2014, with the proportion increasing from 34.2% in 1990 to 42.3% in 2014. Consequently, the proportion of the rural population decreased by 8.1% during the same period, with the population in 2014 being 3.04 × 10⁵.
3.2.3. Government Investment
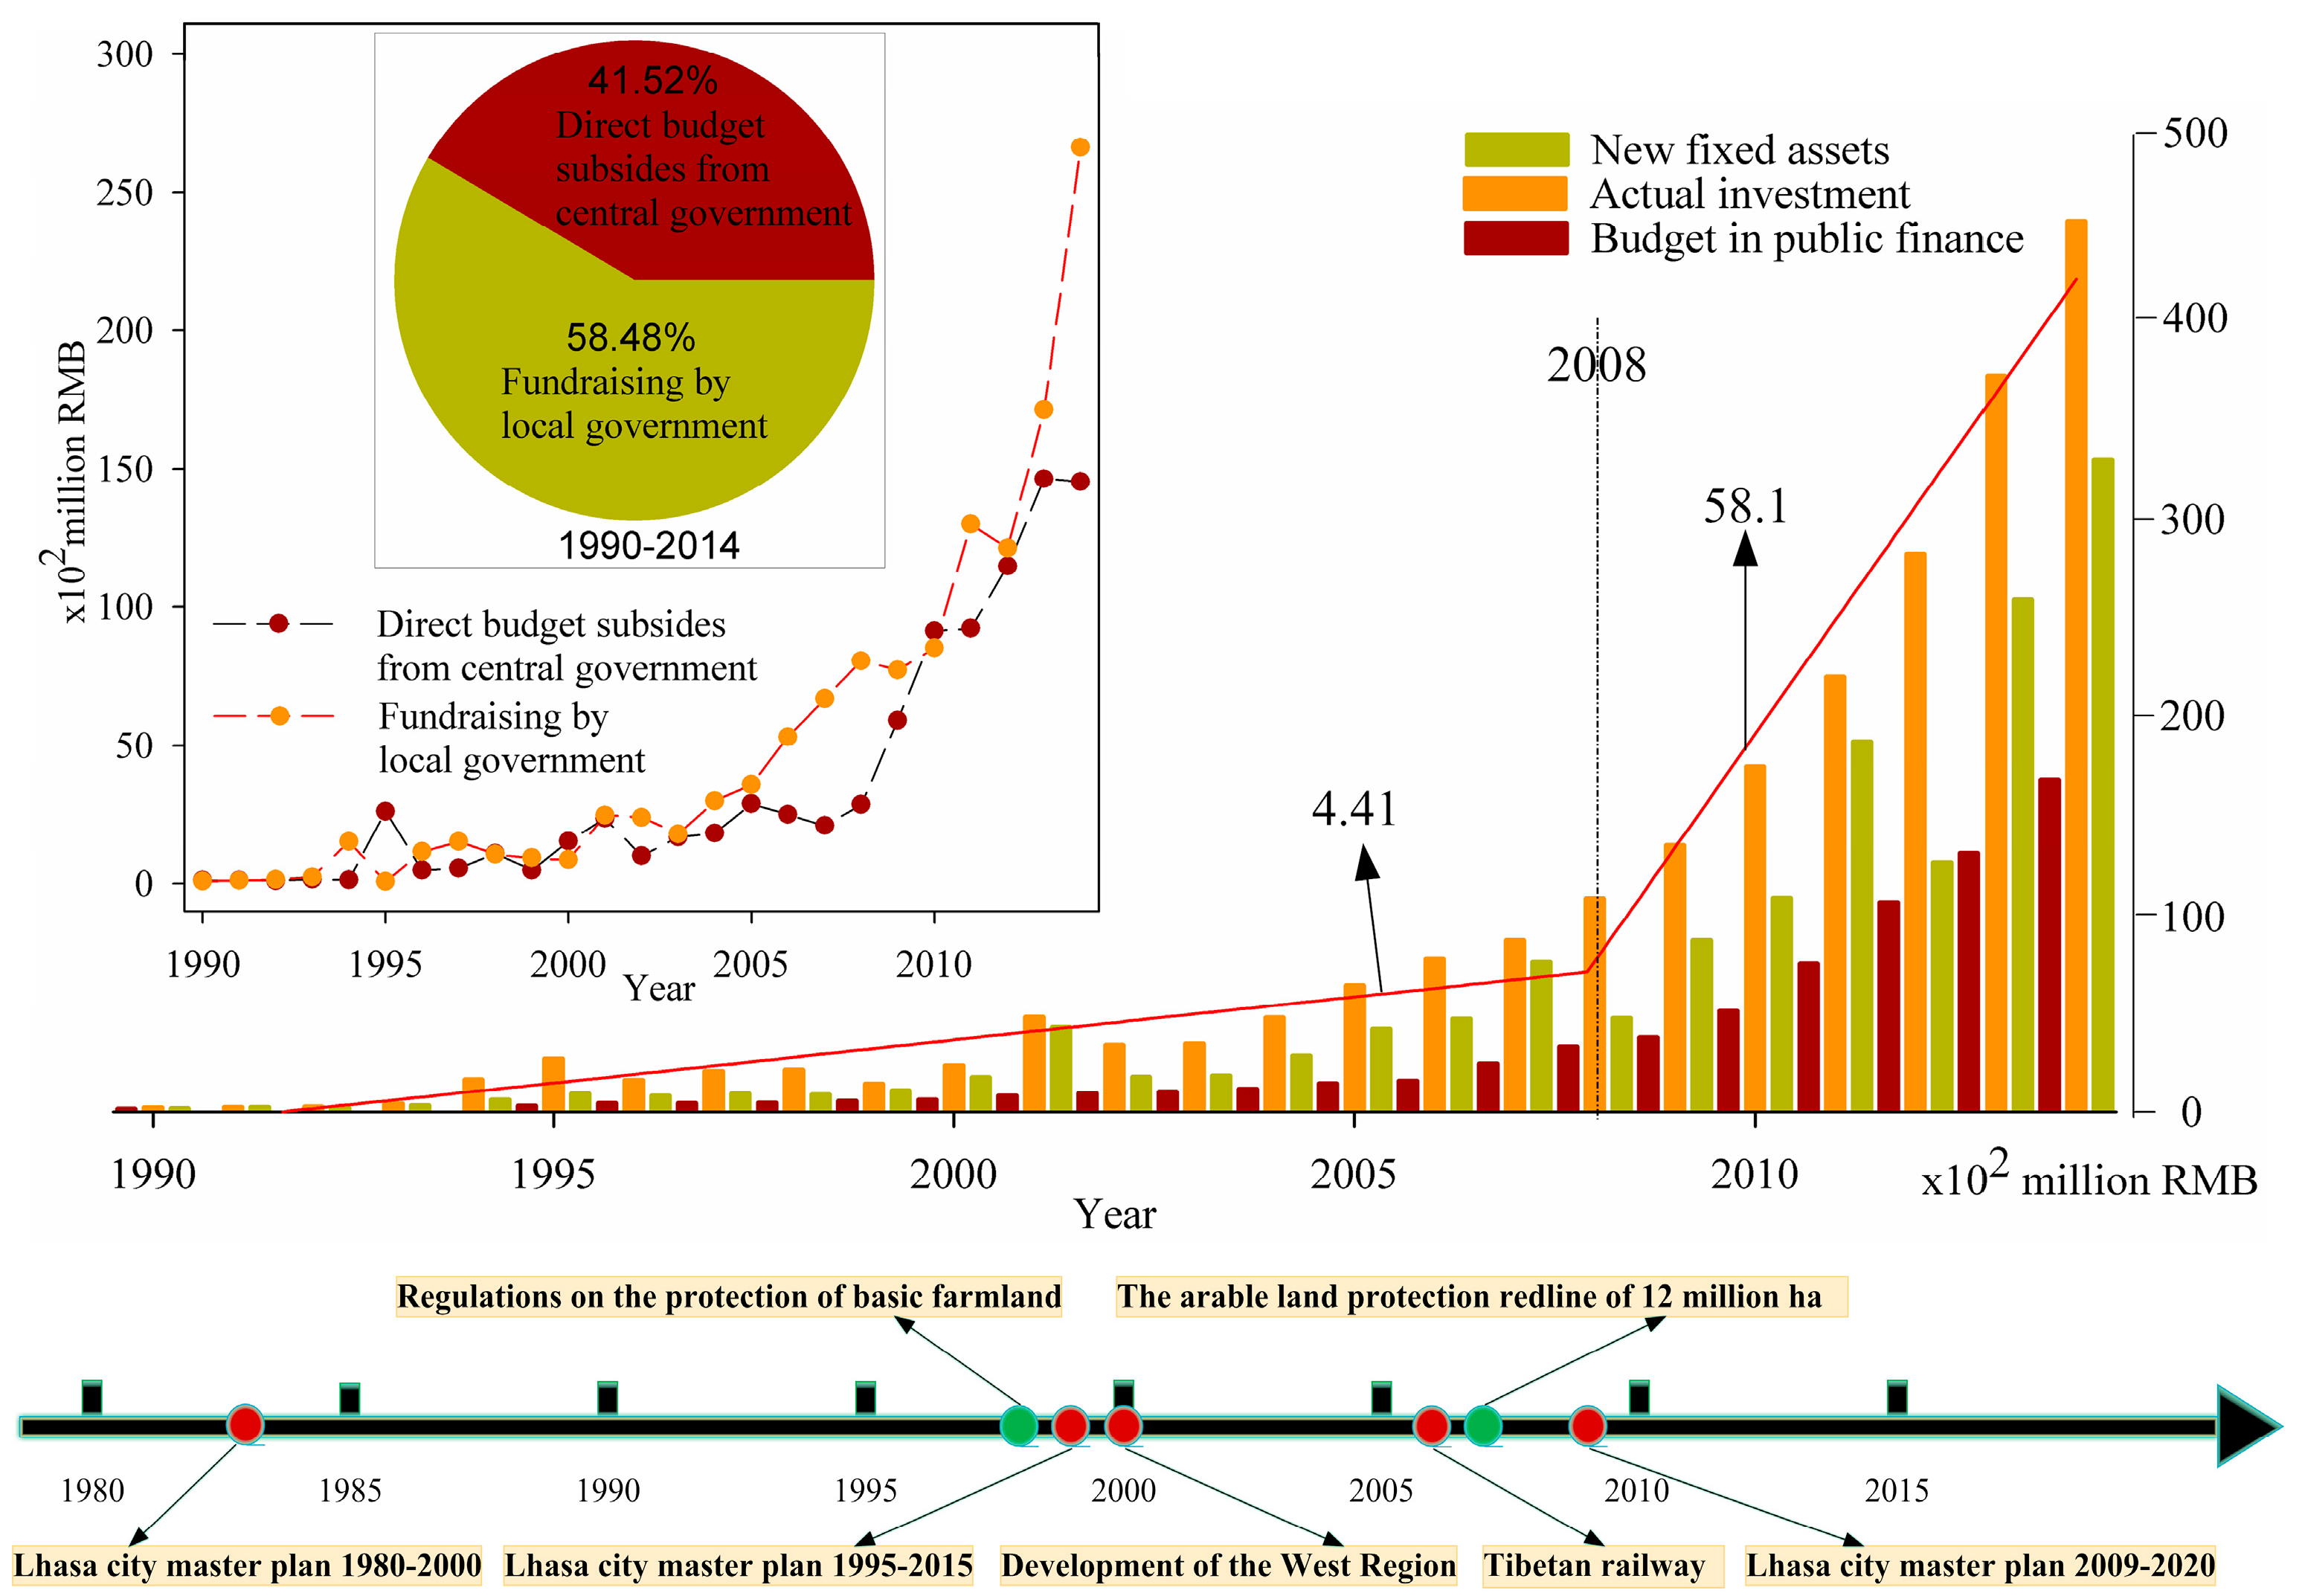
Along with the time series data, Figure 6 shows that both the budget in public and actual investment and new fixed assets showed increasing trends from 1990 to 2014. Through the budget spending of the public finance merely 1.69 × 10⁴ million RMB in 2014, the actual investment reached 4.55 × 10⁴ million RMB, exceeding 73.20% of the investment from government converted to new fixed assets in 2014. Thus, investment by government was preferred to infrastructure construction and public service. Moreover, the government increased investment after 2008, with slopes of 4.41 × 10² million/year (y = 4.41x − 8778.4) and 58.1 × 10² million/year (y = 58.1x − 116,518.2), respectively, before and after 2008. Meanwhile, high increasing speeds of direct budget subsides from the central government and fundraising by the local government were observed between 1990 and 2014 (Figure 6). Moreover, the proportion of state budget appropriation in actual investment accounted for 41.52%, with a value of 89.42 billion RMB from 1990 to 2014. Furthermore, Figure 6 also shows a series of policies and campaigns, including the “Lhasa City Master Plan 1980–2000” in 1983, the “Lhasa City Master Plan 1995–2015” in 1999, the “Development of the Western Region” in 2000, the Tibetan Railway, running in 2006, and the “Lhasa City Master Plan 2009–2020”. The plough land protection policies of “Regulations on the Protection of Basic Farmland” and “The Arable Land Protection Redline of 12 million ha” are also presented.
3.2.4. Tourism Development
The population of domestic tourists was the presentation of the economic development trait, and the tourist industry gradually became the dominant economy for tertiary industry in Lhasa (Figure 7). From 1990 to 2006, the population of foreign travelers and domestic tourists (slope = 3.5) did not show significant variation; hence, tourist income remained stable (slope = 0.4). Conversely, from 2006 to 2014, with a sharp increase of domestic tourists (slope = 97.4), the tourist income increased by 93.67 × 10² million RMB (slope = 11.0). Moreover, the proportion of tourist income in the tertiary industry economy has been growing continuously, increasing from 1.06% in 1990 to 54.01% in 2014.
3.3. Determinants of Urban Expansion in Lhasa
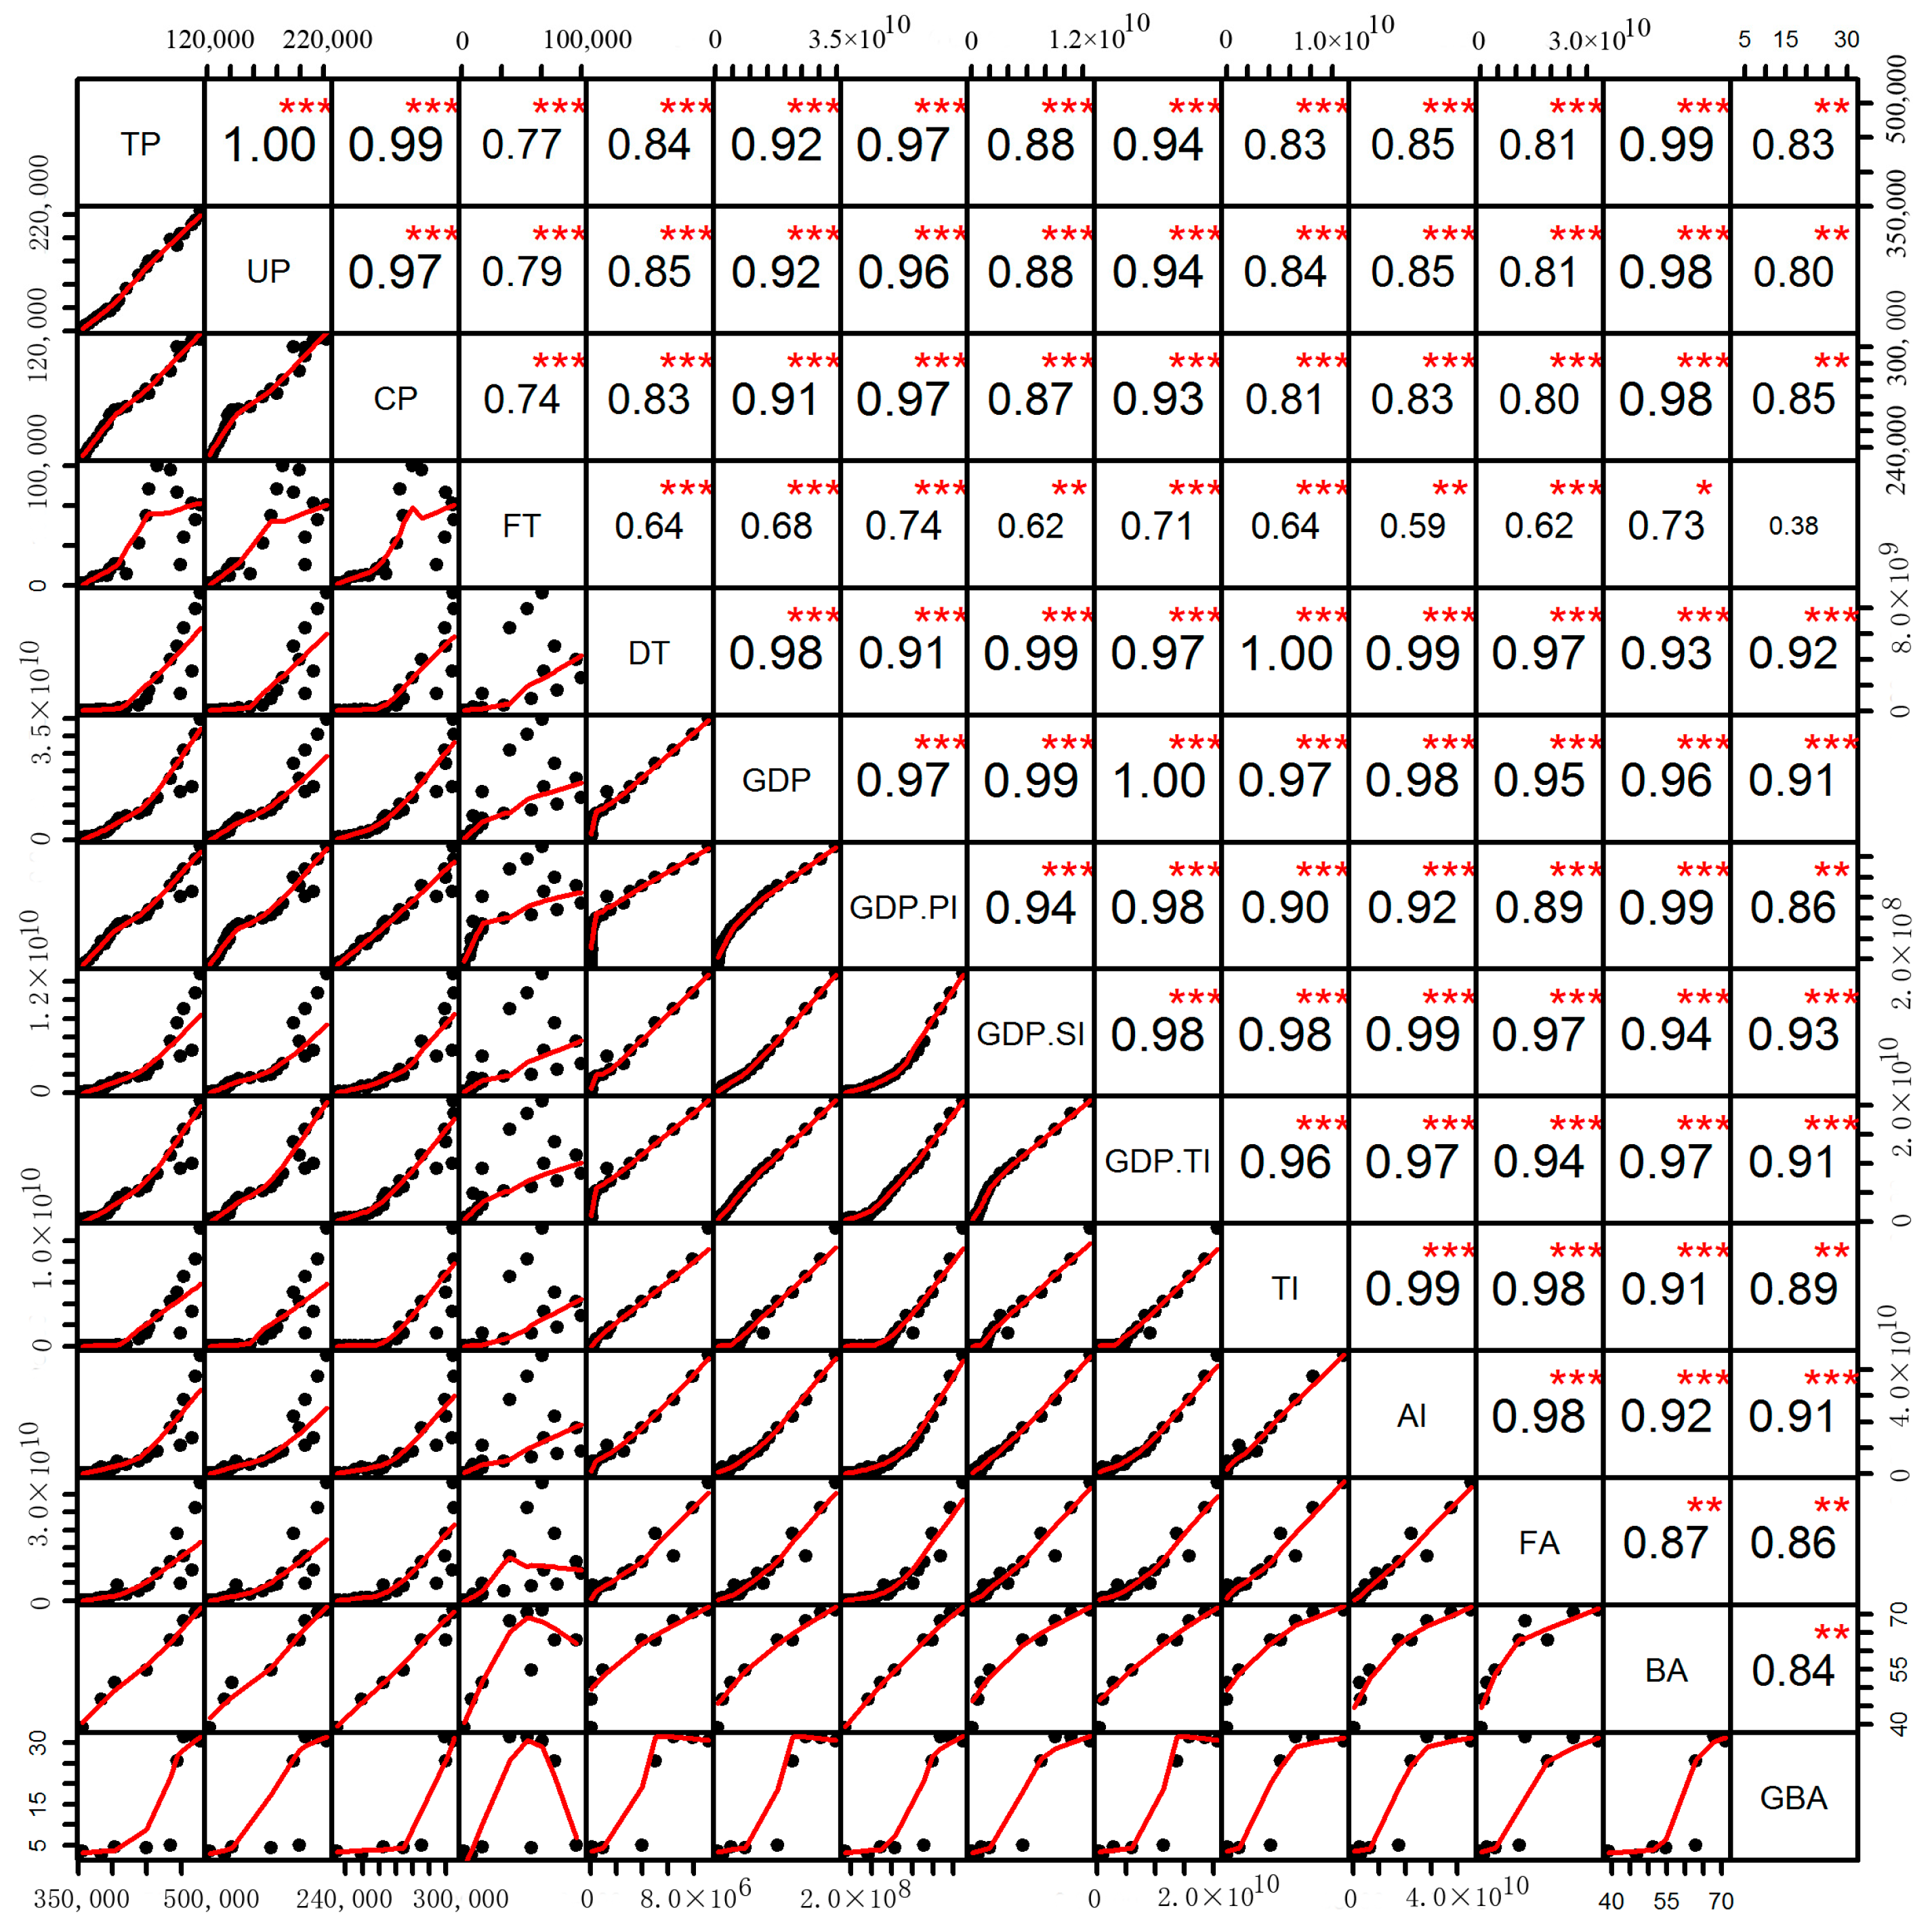
The relationships among the BA, greenbelt area (GBA) and determinants were examined at 0.05 level (Figure 8). All the selected determinants were observed significantly positively correlated with the BA, the whole of the correlation coefficients were greater than 0.85, except a relatively weak relationship between FT and BA. Moreover, remarkable relationships among the TP, GDP, TI, and AI were observed. However, fickle and lower values of correlation coefficients between the GBA and determinants were presented. Thus, to quantify the determinants for the urban expansion, we conduct a relative importance analysis between BA and TP, GDP, TI, and AI in the next section.
3.4. Relative Importance of the Identified Determinants
Based on the redundancy analysis, the relative importance of the main determinants for Lhasa’s expansion was investigated (Figure 9). The results showed that the interactions of determinants (TP, GDP, AI, and TI) was the main driver of urban expansion in Lhasa, explaining 81.24% of the urban expansion. More specifically, the determinant TP had a relatively larger influence, explaining 99.38% of the urban expansion, followed by the GDP determinant, which explained 96.04% of the expansion, and AI and TI explained 86.96% and 84.97% of the expansion, respectively.
4. Discussion
4.1. Determinants for Lhasa Expansion
The urban expansion of Lhasa is primarily explained by governmental policies and investment in the early stage (1990–2008); economic development, tourist growth, and increased government investment resulted in faster urban expansion from 2008 to 2015. The government’s policies controlled and guided the macroscopic development of cities [69]; the development of cities is especially sensitive to administrative polices in China [74]. For historical reasons, urban planning in Lhasa has exhibited relative hysteresis. Until 1983, the local government promulgated and implemented the “Lhasa City Master Plan 1980–2000”, which determined the basic pattern of Lhasa. Of note, most public infrastructures developed around the center of Lhasa during the 30th anniversary of the founding of the Tibet Autonomous Region (1985) and on the 40th anniversary of the peaceful liberation of the Tibet Autonomous Region (1991). Stimulated by the government investment, resulting in insufficient usable land for the development in the center of Lhasa. Specifically, urban expansion of Lhasa can be characterized as temperate sprawl between 1990 and 2001, with an annual average expansion area of 0.47 km2, mainly around the “old center of Lhasa” (Downtown Chengguan, Figure 2A). Under these circumstances, the local government implemented the “Lhasa City Master Plan 1995–2015” in 1999, which not only confirmed the spatial layout of Lhasa as seven districts, but also determined the development of the south bank of Lhasa and selected LND, DCND, and DGND as the stand-by spare areas for future development of Lhasa. Moreover, in the national strategy “Development of the West Region”, implemented in 2000, very large amounts of national capital continuously promoted urban and industrial expansion in the western provinces [4,21]. Against this backdrop, the area of construction land expanded by annual average of 1.36 km2 from 2001 to 2008. With faster urban expansion outward, Lhasa’s urban area started to grow past the fringe of the DCG. Thus, the LND in the southwest, the DCND in the east, and the DGND in the west of the DCG were formed gradually (Figure 2B), which was consistent with the connotations of the government policies.
Economic development is fundamental to urban expansion, because city expansion principally depends on the city’s financial strength [69]. To further promote economic development, the government may attempt to enlarge investments in industrial parks and key infrastructures [48,60]. As more land is converted into construction land for industrial parks and scenic spots, this, in turn, promotes the growth of GDP [52]. Between 2007 and 2014, the GDP increased by 5.2 times, and the annual GDP was 4.52 × 10³ million (1990–2007), which was much lower than the annual value level of 2.29 × 10⁴ million from 2008 to 2014. Additionally, the GDP per capita increased from 1.96 × 10⁴ RMB (2007) to 5.66 × 10⁴ RMB (2014). The effect of rising GDP per capita and better services is to attract more rural people to migrate to the city, bringing more tourists and workers to Lhasa [29,31]. To simultaneously meet the economic development, population concentration, and old-city protection demands, the local government further implemented the “Lhasa City Master Plan 2009–2020” in 2009. This policy proposed the future expansion layouts of Lhasa: “East extension, westward and south pass, one city with two sides and three districts”. Thus, a “tipping point” of government investment is observed after 2008, with governments expanding their public finances from 1.09 × 10⁴ million RMB in 2008 to 4.55 × 10⁴ million RMB in 2014, and 73.20% of the public finances were transformed into new fixed assets in 2014 (Figure 6). Meanwhile, Tibet has the highest proportion of state budget appropriation in fixed assets among western provinces (Appendix B). Consequently, Lhasa has been witnessing unimaginable growth of population and urban expansion: tourism increased by 7.91 million from 2008 to 2014, accompanied by urban expansion rates of 0.82 km2/year and 5.43 km2/year, respectively, before and after 2008, mainly occurring in LND, DGND and DCND (Figure 2C).
In particular, the “Pairing-up support” project also played an important role in the infrastructure expansion process, with assistance funds in Tibet being 14.1 billion RMB from 2011 to 2015 (Appendix C). Additionally, the running of the Tibetan Railway in 2006 accelerated the economic growth because of the “tipping point” found in GDP (Figure 5) and tourism income (Figure 8) was 2006. Overall, Lhasa transformed from a decentralized “old center of Lhasa” (DCG) to a new urban area with different functional zones in the south, west, and east during the study period.
However, with the growth of population and economy, the urban expansion in Lhasa is exactly a dilemma for the limited agriculture land and fragile ecosystem. Meanwhile, the inconvenient and unintelligent transportation hinders the economic development in Lhasa. In addition, education in Lhasa is faced with the challenges, such as the limitation of research teams and a shortage of education resources. It is difficult to evaluate the complete situation in Lhasa for the limited share database. In the future, the government should promote the progress of sustainable mobility payments and increase financial support [75], putting forth efforts to integrate the social-economic, democratic, technological, and sustainable aspects for the sustainable development in the mountain city of Lhasa [76].
4.2. Determinants of Urban Expansion in Different Regions in China
The interactions of GDP growth, population immigration from rural to urban areas, industrial development, and national regional strategies have been significantly positive factors for urban expansion in China [4,5,24,51,63,65]. However, the determinants of urban expansion have varied in different regions (Appendix D). For Eastern China, more international trade has been available for population growth, road construction, and service exports, resulting in economic growth [21,31,55,61]. This is particularly true for the cities in the pearl river delta and the Yangtze river delta, where favorable geographical conditions, accompanied by more government investment, have led to the development of many services, high-tech companies, and commercial centers [3,52,69,77]. Industrial direct investment by foreigners has been a positive determinant for urban expansion in Central China, where the large number of people working in coal enterprises has promoted the industrial output value [21,31,42,78,79]. Economic growth stimulated by industrialization has been considered as the main factor for urban expansion in Western China [24]. In general, the industrialization with population growth (mostly immigrants and workers) has played a critical role in urban expansion throughout China [49,52,80,81].
In contrast with other cities of China, the relatively weaker importance of secondary industries and immigration, and the development of tertiary industries, have contributed positively and significantly to urban expansion in Lhasa. Lhasa has served as the most dynamic potential core area for tourist aggregation in Tibet, which is famous for its unique plateau customs and religious culture and attracted more than 9.26 million tourists in 2014; this is about 17.56 times the TP in Lhasa in 2014. Thus, Lhasa experienced a drastic transformation of its economic structure because of the rapid development of tourism. Simultaneously, in terms of GDP, the proportion of the tourism revenues in Lhasa increased from 0.65% in 1990 to 32.14% in 2014, accounting for 54.01% of the GDP in tertiary industry. Obviously, the demands for residence, traffic, and tourism facilities resulted in rapid urban expansion from the urban areas to surrounding rural areas in Lhasa. With the accelerated social-economic growth, tertiary industries will further influence the urbanization process in Lhasa.
4.3. Suggestions and Implications
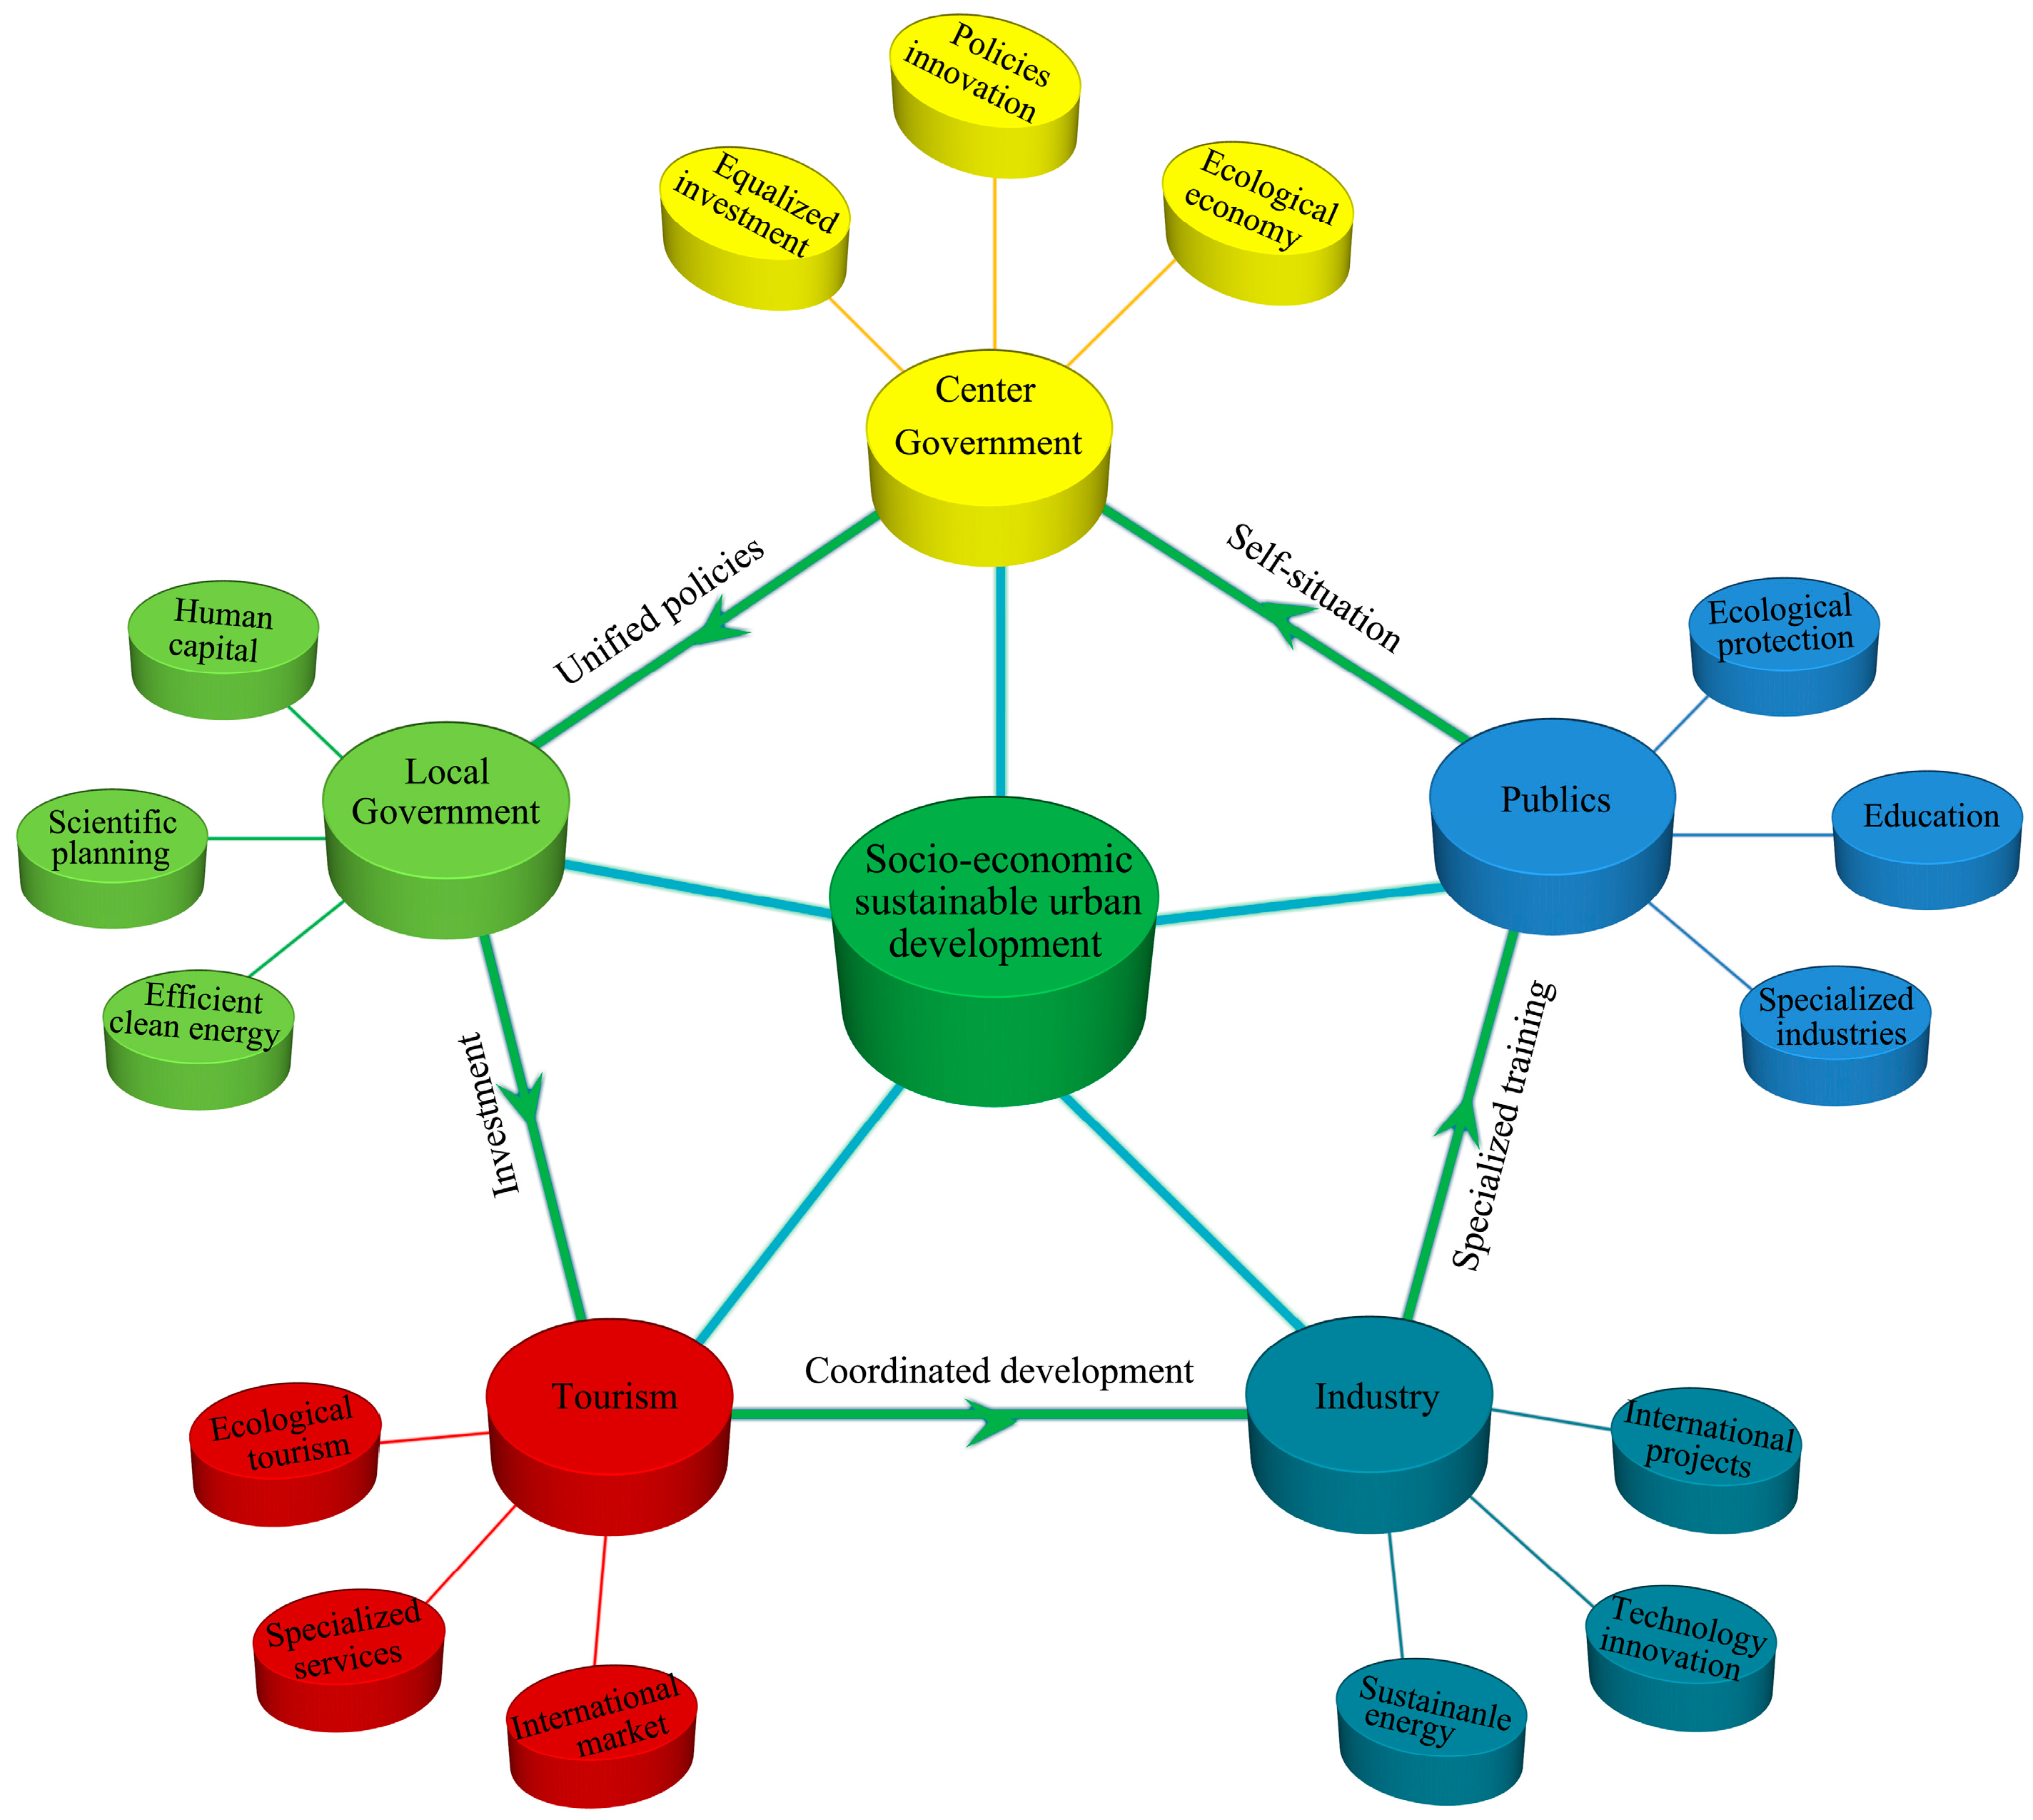
China became the world’s second-largest economy in 2011. Simultaneously, the “National New-Style Urbanization Plan” and “China’s 13th Five-Year Plan” were promulgated and implemented recently. So, how can eco-sustainable urban development be applied in Lhasa? To explore a “smart development model” suitable for Lhasa, it is essential to establish links between financial assistance and economic development to improve the self-sufficiency rate in Lhasa. For the central government, policies should be innovated and unified within the framework of the “Lhasa sustainable development model” for Lhasa’s ecological economy. For local government, promoting scientific urban planning and increasing investment in human capital are decisive factors. Local government should implement preferential policies to attract medium and top talents to improve Lhasa’s self-development capability. Simultaneously, investment in environmentally-friendly and sustainable economics of tertiary industries, especially tourism, should be increased. With financial assistance, further transforming and upgrading the industrial structure into a public service-type, developing ecological tourism and more specialized services, and improving access to international markets the rely on Lhasa’s unique plateau custom and cultural advantages. Furthermore, full use should be made of the unique plateau’s green resources, and technical innovations to avoid insufficient utilization of various resources, such as solar and water resources, should be applied. Lastly, the “Urban-Rural and Regional Integration Strategy” should be implemented to equalize urban–rural development. In practical terms, strategies should include promoting regional traffic and transport, extending specialized industries in villages, and elevating the self-supporting capability of natives through basic education and vocational training. We expect that the policy framework (Figure 10) can provide a few fresh insightful suggestions to policy-makers to establish a smart Lhasa development model for long-term stability and prosperity.
To realize the smart city in China, the coordination and communication between the administrative agencies are particularly important. Thus, contradictions exist between the administrative agencies: local government receives extra budgetary revenue by a land granting strategy [82], while the central government enacts regulations to re-control urban expansion [83]. However, the local government plays a proactive role [84]. In addition, intra-urban planning also touches off the chance to reexamine the distribution of infrastructure for intelligent transportation [85]. Attempts should be made to coordinate the increase of the population and built-up areas for a smart city. It was noticeable that the development of the economy would stimulate the growth of the population and the expansion of the city. The social-economic, population, and policies are spatially correlated and interaction has an effect radius. This implies it is essential to balance the demand for building in urban planning among these variational factors. Thus, a smart city can be realized.
5. Conclusions
This study systematically revealed the mechanisms of urban expansion in the plateau city (Lhasa) during the past 25 years. Lhasa has experienced great expansion intensity, with the area of CL increasing by 52.7 km2 between 1990 and 2015, and the areas of PL and GB transforming by 35.1 km2 and 19.0 km2, respectively, to CL at the same time. The faster urban expansion speed that was observed from 2008 to 2015 (5.4 km2/year) mainly occurred in the east (DCND), south (LND), and west (DGND) of Lhasa.
In general, urban expansion in Lhasa is influenced by governmental investment, tourist population growth, and economic development. From 1990 to 2008, a series of governmental policies promoted the infrastructure construction process in the center of Lhasa. From 2008 to 2015, with a more rapid rate of increase of GDP increase, faster growth of the tourist population, and continuous government investment, there was an obvious high rate of urban expansion. In particular, the tourism industry apparently promoted economic development and urban expansion in recent years, and the running of Tibetan Railway accelerated the urbanization process in Lhasa.
In this paper, the spatial-temporal pattern of urban expansion and its determinants are performed for quantitative research to reveal the urban expansion mechanism in Lhasa, from which the integrative and proactive policy framework are put forward for smart city development in Lhasa. However, in this paper, the geographical factors (slope, temperature, precipitation, and so on) were neglected. Modeling the urban expansion under many factors (the socio-economic, policy, and geographical factors) will be a supplemental research agenda. To achieve a win-win situation in the dilemma of urban expansion and socio-economic development, and improve the self-sufficiency rate of Lhasa, the government policy must be innovated and unified, enhancing coordination and efficiency between administrative agencies and establishing links between financial assistance and economic development within the framework of the “Lhasa development model”. In the future, to be a smart city, Lhasa should invest more money in transforming and upgrading industrial structures, especially in the environmentally-friendly and sustainable economic development of tertiary industries.
Acknowledgments
This research was supported by the National Natural Science Foundation of China (Grant No. 41201167, 41571166), Foundation of Youth Innovation Promotion Association, CAS (Grant No. Y4R2190190), and the West Light Foundation of the Chinese Academy of Science.
Author Contributions
J.S. contributed to the study design, W.T., T.C.Z., J.S., Y.L. and W.L. were involved in drafting the manuscript, approving the final draft, and agree to be accountable for the work. All authors read and approved the final manuscript.
Conflicts of Interest
The authors declare no conflict of interest.
Appendix A

Table A1.
Source of remote sensing data of Lhasa metropolitan area 1990–2015.
| Data | Column/Row | Year | Spatial Resolution (m) |
|---|---|---|---|
| Spot1 | 5924/6000 | March 1990 | 10 |
| Spot4 | 5110/1768 | November 2001 | 10 |
| Spot5 | 18307/6258 | December 2008 | 2.5 |
| Word View | 94420/31076 | May 2015 | 0.5 |
Appendix B
Table A2.
Sources of funds for investment in fixed assets in western provinces of China in 2014 (billion RMB).
Table A2.
Sources of funds for investment in fixed assets in western provinces of China in 2014 (billion RMB).
| Qinghai | Gansu | Sichuan | Xinjiang | Ningxia | Chongqing | Guizhou | Inner Mongolia | Tibet | |
|---|---|---|---|---|---|---|---|---|---|
| State budget appropriation | 55.994 | 84.449 | 152.782 | 132.678 | 23.734 | 106.499 | 64.44 | 68.499 | 84.931 |
| Self-raised funds | 136.351 | 485.644 | 1688.449 | 610.044 | 162.486 | 835.35 | 570.403 | 941.733 | 38.12 |
| Domestic loans | 59.622 | 94.856 | 249.009 | 137.062 | 74.621 | 265.193 | 118.318 | 152.99 | 0.58 |
| Foreign investment | 0.422 | 3.448 | 9.507 | 0.325 | 0.285 | 28.269 | 2.776 | 1.02 | 0.14 |
| Bonds | 1.646 | 2.04 | 7.421 | 2.774 | 0 | 0.512 | 0 | 0 | 0 |
| Others | 28.532 | 77.054 | 442.192 | 96.514 | 37.764 | 315.732 | 239.596 | 68.637 | 6.36 |
| Total investment in fixed assets | 282.567 | 747.491 | 2549.36 | 979.397 | 298.89 | 1551.555 | 995.533 | 1232.879 | 130.131 |
| The proportion of state budget appropriation in investment in fixed assets | 19.82% | 11.3% | 5.99% | 13.55% | 7.94% | 6.86% | 6.47% | 5.56% | 65.27% |
Appendix C
Table A3.
The financial assistance budgets in “The Twelfth Five-year Plan” from 2011 to 2015.
| Districts | Number of Projects | Total (Billion RMB) | 2011 (Billion RMB) | 2012 (Billion RMB) | 2013 (Billion RMB) | 2014 (Billion RMB) | 2015 (Billion RMB) | Proportion |
|---|---|---|---|---|---|---|---|---|
| Lhasa | 165 | 3.08 | 0.52 | 0.56 | 0.63 | 0.68 | 0.68 | 21.82% |
| Lhoka Prefecture | 176 | 1.30 | 0.38 | 0.29 | 0.13 | 0.28 | 0.22 | 9.17% |
| Shigatse Prefecture | 575 | 3.26 | 0.57 | 0.64 | 0.60 | 0.72 | 0.74 | 23.10% |
| Nyingchi Prefecture | 361 | 2.66 | 0.51 | 0.52 | 0.44 | 0.57 | 0.62 | 18.80% |
| Chamdo Prefecture | 132 | 0.75 | 0.14 | 0.15 | 0.15 | 0.18 | 0.14 | 5.28% |
| Nagqu prefecture | 128 | 2.11 | 0.38 | 0.41 | 0.40 | 0.43 | 0.49 | 14.89% |
| Ngari Prefecture | 73 | 0.98 | 0.17 | 0.19 | 0.20 | 0.21 | 0.22 | 6.94% |
| Total | 1610 | 14.14 | 2.67 | 2.75 | 2.54 | 3.07 | 3.10 | 100% |
Appendix D
Table A4.
The determinants of urban expansion in different regions.
| Period | Regions | Determinants | Literatures | |
|---|---|---|---|---|
| China | 2005–2008 | China | Marketization, Globalization, Government | [49] |
| 1990–2010 | China | Immigration rural-urban, Fixed-asset investments, GDP growth, National regional strategies | [4] | |
| 1993–2012 | China | Economic growth, Industrial development, Economic structural transformation | [5] | |
| China | - | China | Institutional, cultural conditions, Economy and industry conditions | [65] |
| China | - | China | Globalization, Government | [63] |
| Eastern China | 2000–2010 | Eastern China | Service exports, International trade | [21] |
| Central China | Central China | Service exports, International trade, Foreign direct investment | ||
| Northeastern | Northeastern | Service exports, International trade | ||
| Eastern China | 1990–2010 | Eastern China | Population growth, Road construction | [31] |
| Middle China | Middle China | Secondary industry, Economic development | ||
| Western China | Western China | Economic growth | ||
| Provincial level | 1992–2009 | Provincial level | Economic factors | [24] |
| Prefectural level | Prefectural level | Economic, Demographic, and traffic factors | ||
| County level | County level | Demographic factors | ||
| Beijing | 1972–2010 | Beijing | Physical, Socioeconomic, Neighborhood factors | [61] |
| Xiamen Island | 1908–2007 | Xiamen Island | Natural and socio-economic factors | [55] |
| The pearl river delta | 1979–2002 | Guangzhou | GDP, Total population, Urban resident income, Urban traffic | [69] |
| 1990–2008 | Shenzhen | Technology, Government policy, Geographical factor, GDP | [52] | |
| The Yangtze river delta | 1985–2013 | Nanjing | Non-agricultural population, Foreign direct investment, Tertiary sector | [3] |
| 1995–2013 | Nanjing | Infrastructure, Commercial, Industrial sub-centers, Government policies | [77] | |
| 1985–2006 | Shanghai | Industrial structure improvement, Government policy | [70] | |
| Central China | 1986–2013 | Shuozhou City | Non-agricultural population, Coalindustry | [42] |
| 1980–2010 | Wuhan | Industrialization, Urban population growth, Government policies | [78] | |
| 1949–2004 | Changsha | Population, Economic, Transportation infrastructure, Strategic instruction | [67] |
References
- Angel, S.; Parent, J.; Civco, D.L.; Blei, A.; Potere, D. The dimensions of global urban expansion: Estimates and projections for all countries, 2000–2050. Prog. Plan. 2011, 75, 53–107. [Google Scholar] [CrossRef]
- Seto, K.C.; Fragkias, M.; Guneralp, B.; Reilly, M.K. A Meta-Analysis of Global Urban Land Expansion. PLoS ONE 2011, 6, e23777. [Google Scholar] [CrossRef] [PubMed]
- Chen, J.L.; Gao, J.L.; Chen, W. Urban land expansion and the transitional mechanisms in Nanjing, China. Habitat Int. 2016, 53, 274–283. [Google Scholar] [CrossRef]
- Kuang, W.H.; Liu, J.Y.; Dong, J.W.; Chi, W.F.; Zhang, C. The rapid and massive urban and industrial land expansions in China between 1990 and 2010: A CLUD-based analysis of their trajectories, patterns, and drivers. Landsc. Urban Plan. 2016, 145, 21–33. [Google Scholar] [CrossRef]
- Zhang, Q.W.; Su, S.L. Determinants of urban expansion and their relative importance: A comparative analysis of 30 major metropolitans in China. Habitat Int. 2016, 58, 89–107. [Google Scholar] [CrossRef]
- Sakata, Y.; Yamasaki, M.; Ohgushi, T. Urban landscape and forest vegetation regulate the range expansion of an exotic lace bug Corythucha marmorata (Hemiptera: Tingidae). Entomol. Sci. 2016, 19, 315–318. [Google Scholar] [CrossRef]
- He, C.Y.; Liu, Z.F.; Tian, J.; Ma, Q. Urban expansion dynamics and natural habitat loss in China: A multiscale landscape perspective. Glob. Chang. Biol. 2014, 20, 2886–2902. [Google Scholar] [CrossRef] [PubMed]
- Lin, T.; Xue, X.Z.; Shi, L.Y.; Gao, L.J. Urban spatial expansion and its impacts on island ecosystem services and landscape pattern: A case study of the island city of Xiamen, Southeast China. Ocean Coast. Manag. 2013, 81, 90–96. [Google Scholar] [CrossRef]
- Batisani, N.; Yarnal, B. Urban expansion in Centre County, Pennsylvania: Spatial dynamics and landscape transformations. Appl. Geogr. 2009, 29, 235–249. [Google Scholar] [CrossRef]
- Agegnehu, S.K.; Fuchs, H.; Navratil, G.; Stokowski, P.; Vuolo, F.; Mansberger, R. Spatial Urban Expansion and Land Tenure Security in Ethiopia: Case Studies from Bahir Dar and Debre Markos Peri-Urban Areas. Soc. Nat. Resour. 2016, 29, 311–328. [Google Scholar] [CrossRef]
- Valerio, Q.; Anna, B.; Francesco, C.; Diego, G.; Dalila, R.; Piermaria, C. Monitoring land take by point sampling: Pace and dynamics of urban expansion in the Metropolitan City of Rome. Landsc. Urban Plan. 2015, 143, 126–133. [Google Scholar] [CrossRef]
- Barragan, J.M.; de Andres, M. Urban expansion in the coastal areas of Latin America and Caribbean. Rev. Geogr. Norte Gd. 2016, 64, 129–149. [Google Scholar]
- Leyva-Camacho, O.; Venegas-Cardoso, R.; Rojas-Caldelas, R.; Ranfla-Gonzalez, A.; Pena-Salmon, C. Urban expansion and change of land uses: City of Mexicali 1990–2005. Wit Trans. Ecol. Environ. 2010, 129, 547–558. [Google Scholar]
- Kantakumar, L.N.; Kumar, S.; Schneider, K. Spatiotemporal urban expansion in Pune metropolis, India using remote sensing. Habitat Int. 2016, 51, 11–22. [Google Scholar] [CrossRef]
- Gibson, J.; Boe-Gibson, G.; Stichbury, G. Urban land expansion in India 1992–2012. Food Policy 2015, 56, 100–113. [Google Scholar] [CrossRef]
- Kumar, A.; Pandey, A.C.; Hoda, N.; Jeyaseelan, A.T. Evaluating the Long-term Urban Expansion of Ranchi Urban Agglomeration, India Using Geospatial Technology. J. Indian Soc. Remote Sens. 2011, 39, 213–224. [Google Scholar] [CrossRef]
- Paulsen, K. Yet even more evidence on the spatial size of cities: Urban spatial expansion in the US, 1980–2000. Reg. Sci. Urban Econ. 2012, 42, 561–568. [Google Scholar] [CrossRef]
- Tsutsumida, N.; Saizen, I.; Matsuoka, M.; Ishii, R. Addressing urban expansion using feature-oriented spatial data in a peripheral area of Ulaanbaatar, Mongolia. Habitat Int. 2015, 47, 196–204. [Google Scholar] [CrossRef] [Green Version]
- Mansaray, L.R.; Huang, J.F.; Kamara, A.A. Mapping deforestation and urban expansion in Freetown, Sierra Leone, from pre- to post-war economic recovery. Environ. Monit. Assess. 2016, 188, 470. [Google Scholar] [CrossRef] [PubMed]
- Zhang, Z.X.; Wen, Q.K.; Liu, F.; Zhao, X.L.; Liu, B.; Xu, J.Y.; Yi, L.; Hu, S.G.; Wang, X.; Zuo, L.J.; et al. Urban expansion in China and its effect on cultivated land before and after initiating “Reform and Open Policy”. Sci. China Earth Sci. 2016, 59, 1930–1945. [Google Scholar] [CrossRef]
- Shi, Y.; Yang, J.Y.; Hu, X.Y. How economic globalization affects urban expansion: An empirical analysis of 30 Chinese provinces for 2000–2010. Qual. Quant. 2016, 50, 1117–1133. [Google Scholar] [CrossRef]
- Huang, X.M.; Schneider, A.; Friedl, M.A. Mapping sub-pixel urban expansion in China using MODIS and DMSP/OLS nighttime lights. Remote Sens. Environ. 2016, 175, 92–108. [Google Scholar] [CrossRef]
- Wen, Q.K.; Zhang, Z.X.; Shi, L.F.; Zhao, X.L.; Liu, F.; Xu, J.Y.; Yi, L.; Liu, B.; Wang, X.; Zuo, L.J.; et al. Extraction of basic trends of urban expansion in China over past 40 years from satellite images. Chin. Geogr. Sci. 2016, 26, 129–142. [Google Scholar] [CrossRef]
- Ma, Q.; He, C.Y.; Wu, J.G. Behind the rapid expansion of urban impervious surfaces in China: Major influencing factors revealed by a hierarchical multiscale analysis. Land Use Policy 2016, 59, 434–445. [Google Scholar] [CrossRef]
- Liu, F.; Zhang, Z.X.; Wang, X. Forms of Urban Expansion of Chinese Municipalities and Provincial Capitals, 1970s-2013. Remote Sens. 2016, 8, 930. [Google Scholar] [CrossRef]
- Liu, F.; Zhang, Z.X.; Shi, L.F.; Zhao, X.L.; Xu, J.Y.; Yi, L.; Liu, B.; Wen, Q.K.; Hu, S.G.; Wang, X.; et al. Urban expansion in China and its spatial-temporal differences over the past four decades. J. Geogr. Sci. 2016, 26, 1477–1496. [Google Scholar] [CrossRef]
- Zhao, S.Q.; Zhou, D.C.; Zhu, C.; Sun, Y.; Wu, W.J.; Liu, S.G. Spatial and Temporal Dimensions of Urban Expansion in China. Environ. Sci. Technol. 2015, 49, 9600–9609. [Google Scholar] [CrossRef] [PubMed]
- Zhao, S.Q.; Zhou, D.C.; Zhu, C.; Qu, W.Y.; Zhao, J.J.; Sun, Y.; Huang, D.; Wu, W.J.; Liu, S.G. Rates and patterns of urban expansion in China’s 32 major cities over the past three decades. Landsc. Ecol. 2015, 30, 1541–1559. [Google Scholar] [CrossRef]
- Gibson, J.; Li, C.; Boe-Gibson, G. Economic Growth and Expansion of China’s Urban Land Area: Evidence from Administrative Data and Night Lights, 1993–2012. Sustainability 2014, 6, 7850–7865. [Google Scholar] [CrossRef]
- Liu, J.Y.; Zhang, Q.; Hu, Y.F. Regional differences of China’s urban expansion from late 20th to early 21st century based on remote sensing information. Chin. Geogr. Sci. 2012, 22, 1–14. [Google Scholar] [CrossRef]
- Tian, G.J.; Xu, X.L.; Liu, X.J.; Kong, L.Q. The Comparison and Modeling of the Driving Factors of Urban Expansion for Thirty-Five Big Cities in the Three Regions in China. Adv. Meteorol. 2016, 2016. [Google Scholar] [CrossRef]
- Wu, W.J.; Zhao, S.Q.; Zhu, C.; Jiang, J.L. A comparative study of urban expansion in Beijing, Tianjin and Shijiazhuang over the past three decades. Landsc. Urban Plan. 2015, 134, 93–106. [Google Scholar] [CrossRef]
- Zhao, P.J. Sustainable urban expansion and transportation in a growing megacity: Consequences of urban sprawl for mobility on the urban fringe of Beijing. Habitat Int. 2010, 34, 236–243. [Google Scholar] [CrossRef]
- Wu, Y.Y.; Li, S.Y.; Yu, S.X. Monitoring urban expansion and its effects on land use and land cover changes in Guangzhou city, China. Environ. Monit. Assess. 2016, 188, 54. [Google Scholar] [CrossRef] [PubMed]
- Chen, J.L.; Gao, J.L.; Yuan, F. Growth Type and Functional Trajectories: An Empirical Study of Urban Expansion in Nanjing, China. PLoS ONE 2016, 11, e0148389. [Google Scholar] [CrossRef] [PubMed]
- Li, H.; Wei, Y.H.D.; Huang, Z.J. Urban Land Expansion and Spatial Dynamics in Globalizing Shanghai. Sustainability 2014, 6, 8856–8875. [Google Scholar] [CrossRef]
- Yin, J.; Yin, Z.E.; Zhong, H.D.; Xu, S.Y.; Hu, X.M.; Wang, J.; Wu, J.P. Monitoring urban expansion and land use/land cover changes of Shanghai metropolitan area during the transitional economy (1979–2009) in China. Environ. Monit. Assess. 2011, 177, 609–621. [Google Scholar] [CrossRef] [PubMed]
- Tian, G.J.; Ma, B.R.; Xu, X.L.; Liu, X.P.; Xu, L.Y.; Liu, X.J.; Xiao, L.; Kong, L.Q. Simulation of urban expansion and encroachment using cellular automata and multi-agent system model-A case study of Tianjin metropolitan region, China. Ecol. Indic. 2016, 70, 439–450. [Google Scholar] [CrossRef]
- Ma, X.Y.; Zhang, Y.C. Numerical study of the impacts of urban expansion on Meiyu precipitation over Eastern China. J. Meteorol. Res. 2015, 29, 237–256. [Google Scholar] [CrossRef]
- Sun, Y.; Zhao, S.Q.; Qu, W.Y. Quantifying spatiotemporal patterns of urban expansion in three capital cities in Northeast China over the past three decades using satellite data sets. Environ. Earth Sci. 2015, 73, 7221–7235. [Google Scholar] [CrossRef]
- Zeng, C.; Zhang, M.D.; Cui, J.X.; He, S.W. Monitoring and modeling urban expansion—A spatially explicit and multi-scale perspective. Cities 2015, 43, 92–103. [Google Scholar] [CrossRef]
- Cao, Y.G.; Bai, Z.K.; Zhou, W.; Zhang, X.R. Analyses of traits and driving forces on urban land expansion in a typical coal-resource-based city in a loess area. Environ. Earth Sci. 2016, 75, 1191. [Google Scholar] [CrossRef]
- Zhang, X.; Bai, Z.; Fan, X.; Lu, Y.; Cao, Y.; Zhao, Z.; Sun, Q.; Pan, J. Urban Expansion Process, Pattern, and Land Use Response in an Urban Mining Composited Zone from 1986 to 2013. J. Urban Plan. Dev. 2016, 142, 04016014. [Google Scholar] [CrossRef]
- Jiang, L.; Zhang, Y.H. Modeling Urban Expansion and Agricultural Land Conversion in Henan Province, China: An Integration of Land Use and Socioeconomic Data. Sustainability 2016, 8, 920. [Google Scholar] [CrossRef]
- Peng, W.F.; Wang, G.J.; Zhou, J.M.; Zhao, J.F.; Yang, C.J. Studies on the temporal and spatial variations of urban expansion in Chengdu, western China, from 1978 to 2010. Sustain. Cities Soc. 2015, 17, 141–150. [Google Scholar] [CrossRef]
- Liu, Y.X.; Zhang, X.L.; Lei, J.; Zhu, L. Urban expansion of oasis cities between 1990 and 2007 in Xinjiang, China. Int. J. Sustain. Dev. World. Ecol. 2010, 17, 253–262. [Google Scholar] [CrossRef]
- Cao, Y.G.; Bai, Z.K.; Zhou, W.; Ai, G. Gradient Analysis of Urban Construction Land Expansion in the Chongqing Urban Area of China. J. Urban Plan. Dev. 2015, 141. [Google Scholar] [CrossRef]
- Shu, B.R.; Zhang, H.H.; Li, Y.L.; Qu, Y.; Chen, L.H. Spatiotemporal variation analysis of driving forces of urban land spatial expansion using logistic regression: A case study of port towns in Taicang City, China. Habitat Int. 2014, 43, 181–190. [Google Scholar] [CrossRef]
- Deng, X.Z.; Huang, J.K.; Rozelle, S.; Uchida, E. Growth, population and industrialization, and urban land expansion of China. J. Urban Econ. 2008, 63, 96–115. [Google Scholar] [CrossRef]
- Fahmi, F.Z.; Hudalah, D.; Rahayu, P.; Woltjer, J. Extended urbanization in small and medium-sized cities: The case of Cirebon, Indonesia. Habitat Int. 2014, 42, 1–10. [Google Scholar] [CrossRef]
- Huang, Z.J.; Wei, Y.D.; He, C.F.; Li, H. Urban land expansion under economic transition in China: A multilevel modeling analysis. Habitat Int. 2015, 47, 69–82. [Google Scholar] [CrossRef]
- Chen, J.F.; Chang, K.T.; Karacsonyi, D.; Zhang, X.L. Comparing urban land expansion and its driving factors in Shenzhen and Dongguan, China. Habitat Int. 2014, 43, 61–71. [Google Scholar] [CrossRef]
- Quan, B.; Bai, Y.J.; Romkens, M.J.M.; Chang, K.T.; Song, H.; Guo, T.; Lei, S. Urban land expansion in Quanzhou City, China, 1995–2010. Habitat Int. 2015, 48, 131–139. [Google Scholar] [CrossRef]
- Li, Y.; Ye, J.H.; Chen, X.H.; Abdel-Aty, P.E.M.A.; Cen, M. Transportation Characteristics Change under Rapid Urban Expansion: A Case Study of Shanghai. Chin. Geogr. Sci. 2010, 20, 554–561. [Google Scholar] [CrossRef]
- Li, X.H.; Lin, T.; Zhang, G.Q.; Xiao, L.S.; Zhao, Q.J.; Cui, S.H. Dynamic analysis of urban spatial expansion and its determinants in Xiamen Island. J. Geogr. Sci. 2011, 21, 503–520. [Google Scholar] [CrossRef]
- Long, H.; Wu, X.; Wang, W.; Dong, G. Analysis of Urban-Rural Land-Use Change during 1995–2006 and Its Policy Dimensional Driving Forces in Chongqing, China. Sensors 2008, 8, 681–699. [Google Scholar] [CrossRef] [PubMed]
- Vannier, C.; Jérémie, L.; Pierre-Yves, L.; Sandra, L. Patterns of landscape change in a rapidly urbanizing mountain region. Cybergeo 2016. [Google Scholar] [CrossRef]
- Haller, A. Vivid valleys, pallid peaks? Hypsometric variations and rural-urban land change in the Central Peruvian Andes. Appl. Geogr. 2012, 35, 439–447. [Google Scholar] [CrossRef] [PubMed]
- Walcott, S.M. Thimphu. Cities 2009, 26, 158–170. [Google Scholar] [CrossRef]
- Cai, Y.B.; Zhang, H.; Pan, W.B.; Chen, Y.H.; Wang, X.R. Urban expansion and its influencing factors in Natural Wetland Distribution Area in Fuzhou City, China. Chin. Geogr. Sci. 2012, 22, 568–577. [Google Scholar] [CrossRef]
- Li, Z.; Gu, X.; Wang, L.; Li, D.; Xie, Y.; Li, K.; Dubovik, O.; Schuster, G.; Goloub, P.; Zhang, Y.; et al. Aerosol physical and chemical properties retrieved from ground-based remote sensing measurements during heavy haze days in Beijing winter. Atmos. Chem. Phys. 2013, 13, 10171–10183. [Google Scholar] [CrossRef] [Green Version]
- Qian, J.; Peng, Y.F.; Luo, C.; Wu, C.; Du, Q.Y. Urban Land Expansion and Sustainable Land Use Policy in Shenzhen: A Case Study of China’s Rapid Urbanization. Sustainability 2016, 8, 16. [Google Scholar] [CrossRef]
- Lu, D.; Tian, Y.; Liu, V.; Zhang, Y. The Performance of the Smart Cities in China—A Comparative Study by Means of Self-Organizing Maps and Social Networks Analysis. Sustainability 2015, 7, 7604–7621. [Google Scholar] [CrossRef]
- Zhou, R.; Zhang, H.; Ye, X.-Y.; Wang, X.-J.; Su, H.-L. The Delimitation of Urban Growth Boundaries Using the CLUE-S Land-Use Change Model: Study on Xinzhuang Town, Changshu City, China. Sustainability 2016, 8, 1182. [Google Scholar] [CrossRef]
- Pang, B.; Fang, C.; Liu, H. Quantitative Study on the Dynamic Mechanism of Smart Low-Carbon City Development in China. Sustainability 2016, 8, 507. [Google Scholar] [CrossRef]
- Sun, J.; Wang, X.; Cheng, G.; Wu, J.; Hong, J.; Niu, S. Effects of grazing regimes on plant traits and soil nutrients in an alpine steppe, Northern Tibetan Plateau. PLoS ONE 2014, 9, e108821. [Google Scholar] [CrossRef] [PubMed]
- Li, C.; Zhao, J.; Xu, Y. Examining spatiotemporally varying effects of urban expansion and the underlying driving factors. Sustain. Cities Soc. 2017, 28, 307–320. [Google Scholar] [CrossRef]
- Choudhary, K.; Boori, M.S.; Kupriyanov, A.; Kovelskiy, V. Analysis of urban spatio-temporal land use/cover change and expansion with their driving force through remote sensing and GIS in Samara city, Russia. Adv. Mater. Mech. Struct. Eng. 2016. [Google Scholar] [CrossRef]
- Ma, Y.L.; Xu, R.S. Remote sensing monitoring and driving force analysis of urban expansion in Guangzhou City, China. Habitat Int. 2010, 34, 228–235. [Google Scholar] [CrossRef]
- Shi, L.Y.; Shao, G.F.; Cui, S.H.; Li, X.Q.; Lin, T.; Yin, K.; Zhao, J.Z. Urban three-dimensional expansion and its driving forces—A case study of Shanghai, China. Chin. Geogr. Sci. 2009, 19, 291–298. [Google Scholar] [CrossRef]
- Almadani, S.; Ibrahim, E.; Abdelrahman, K.; Al-Bassam, A.; Al-Shmrani, A. Magnetic and seismic refraction survey for site investigation of an urban expansion site in Abha District, Southwest Saudi Arabia. Arab. J. Geosci. 2015, 8, 2299–2312. [Google Scholar] [CrossRef]
- Webster, R.D.J. Haze Measurement. J. Inst. Brew. 1983, 89, 143. [Google Scholar]
- Chen, Y.-L.; Ding, J.-Z.; Peng, Y.-F.; Li, F.; Yang, G.-B.; Liu, L.; Qin, S.-Q.; Fang, K.; Yang, Y.-H. Patterns and drivers of soil microbial communities in Tibetan alpine and global terrestrial ecosystems. J. Biogeogr. 2016, 43, 2027–2039. [Google Scholar] [CrossRef]
- Gao, J.L.; Wei, Y.D.; Chen, W.; Yenneti, K. Urban Land Expansion and Structural Change in the Yangtze River Delta, China. Sustainability 2015, 7, 10281–10307. [Google Scholar] [CrossRef]
- Pinna, F.; Masala, F.; Garau, C. Urban Policies and Mobility Trends in Italian Smart Cities. Sustainability 2017, 9, 494. [Google Scholar] [CrossRef]
- Anttiroiko, A.V. Urban Planning 2.0. Int. J. E Plan. Res. 2012, 1, 16–30. [Google Scholar] [CrossRef]
- Chen, J.L.; Gao, J.L.; Yuan, F.; Wei, Y.D. Spatial Determinants of Urban Land Expansion in Globalizing Nanjing, China. Sustainability 2016, 8, 868. [Google Scholar] [CrossRef]
- Lu, S.S.; Guan, X.L.; He, C.; Zhang, J.L. Spatio-Temporal Patterns and Policy Implications of Urban Land Expansion in Metropolitan Areas: A Case Study of Wuhan Urban Agglomeration, Central China. Sustainability 2014, 6, 4723–4748. [Google Scholar] [CrossRef]
- Zhou, G.H.; He, Y.H. The influencing factors of urban land expansion in Changsha. J. Geogr. Sci. 2007, 17, 487–499. [Google Scholar] [CrossRef]
- Xiao, J.; Shen, Y.; Ge, J.; Tateishi, R.; Tang, C.; Liang, Y.; Huang, Z. Evaluating urban expansion and land use change in Shijiazhuang, China, by using GIS and remote sensing. Landsc. Urban Plan. 2006, 75, 69–80. [Google Scholar] [CrossRef]
- Li, T. Land use dynamics driven by rural industrialization and land finance in the peri-urban areas of China: “The examples of Jiangyin and Shunde”. Land Use Policy 2015, 45, 117–127. [Google Scholar]
- Gao, J.L.; Wei, Y.D.; Chen, W.; Chen, J.L. Economic transition and urban land expansion in Provincial China. Habitat Int. 2014, 44, 461–473. [Google Scholar] [CrossRef]
- Feng, J.; Lichtenberg, E.; Ding, C.R. Balancing act: Economic incentives, administrative restrictions, and urban land expansion in China. China Econ. Rev. 2015, 36, 184–197. [Google Scholar] [CrossRef]
- Li, H.; Wei, Y.D.; Liao, F.H.; Huang, Z.J. Administrative hierarchy and urban land expansion in transitional China. Appl. Geogr. 2015, 56, 177–186. [Google Scholar] [CrossRef]
- Balasubramaniam, A.; Paul, A.; Hong, W.-H.; Seo, H.; Kim, J. Comparative Analysis of Intelligent Transportation Systems for Sustainable Environment in Smart Cities. Sustainability 2017, 9, 1120. [Google Scholar] [CrossRef]
Figure 1.
The study area, including the division districts of Lhasa: Downtown Chengguan (DCG), Liuwu New District (LND), Dongcheng New District (DCND), and Dongga New District (DGND).
Figure 1.
The study area, including the division districts of Lhasa: Downtown Chengguan (DCG), Liuwu New District (LND), Dongcheng New District (DCND), and Dongga New District (DGND).

Figure 2.
The changed regions of land cover in Lhasa. Graphs (A–D) represent the land-use changed area during 1990–2001, 2001–2008, 2008–2015, and 1990–2015, respectively.
Figure 2.
The changed regions of land cover in Lhasa. Graphs (A–D) represent the land-use changed area during 1990–2001, 2001–2008, 2008–2015, and 1990–2015, respectively.

Figure 3.
The transition process of classifications in Lhasa from 1990 to 2015. The circles present the area of each land cover in different year, and the blue lines represent the changed area in each land cover between the two periods; the red lines represent the changed area among classes during the two periods.
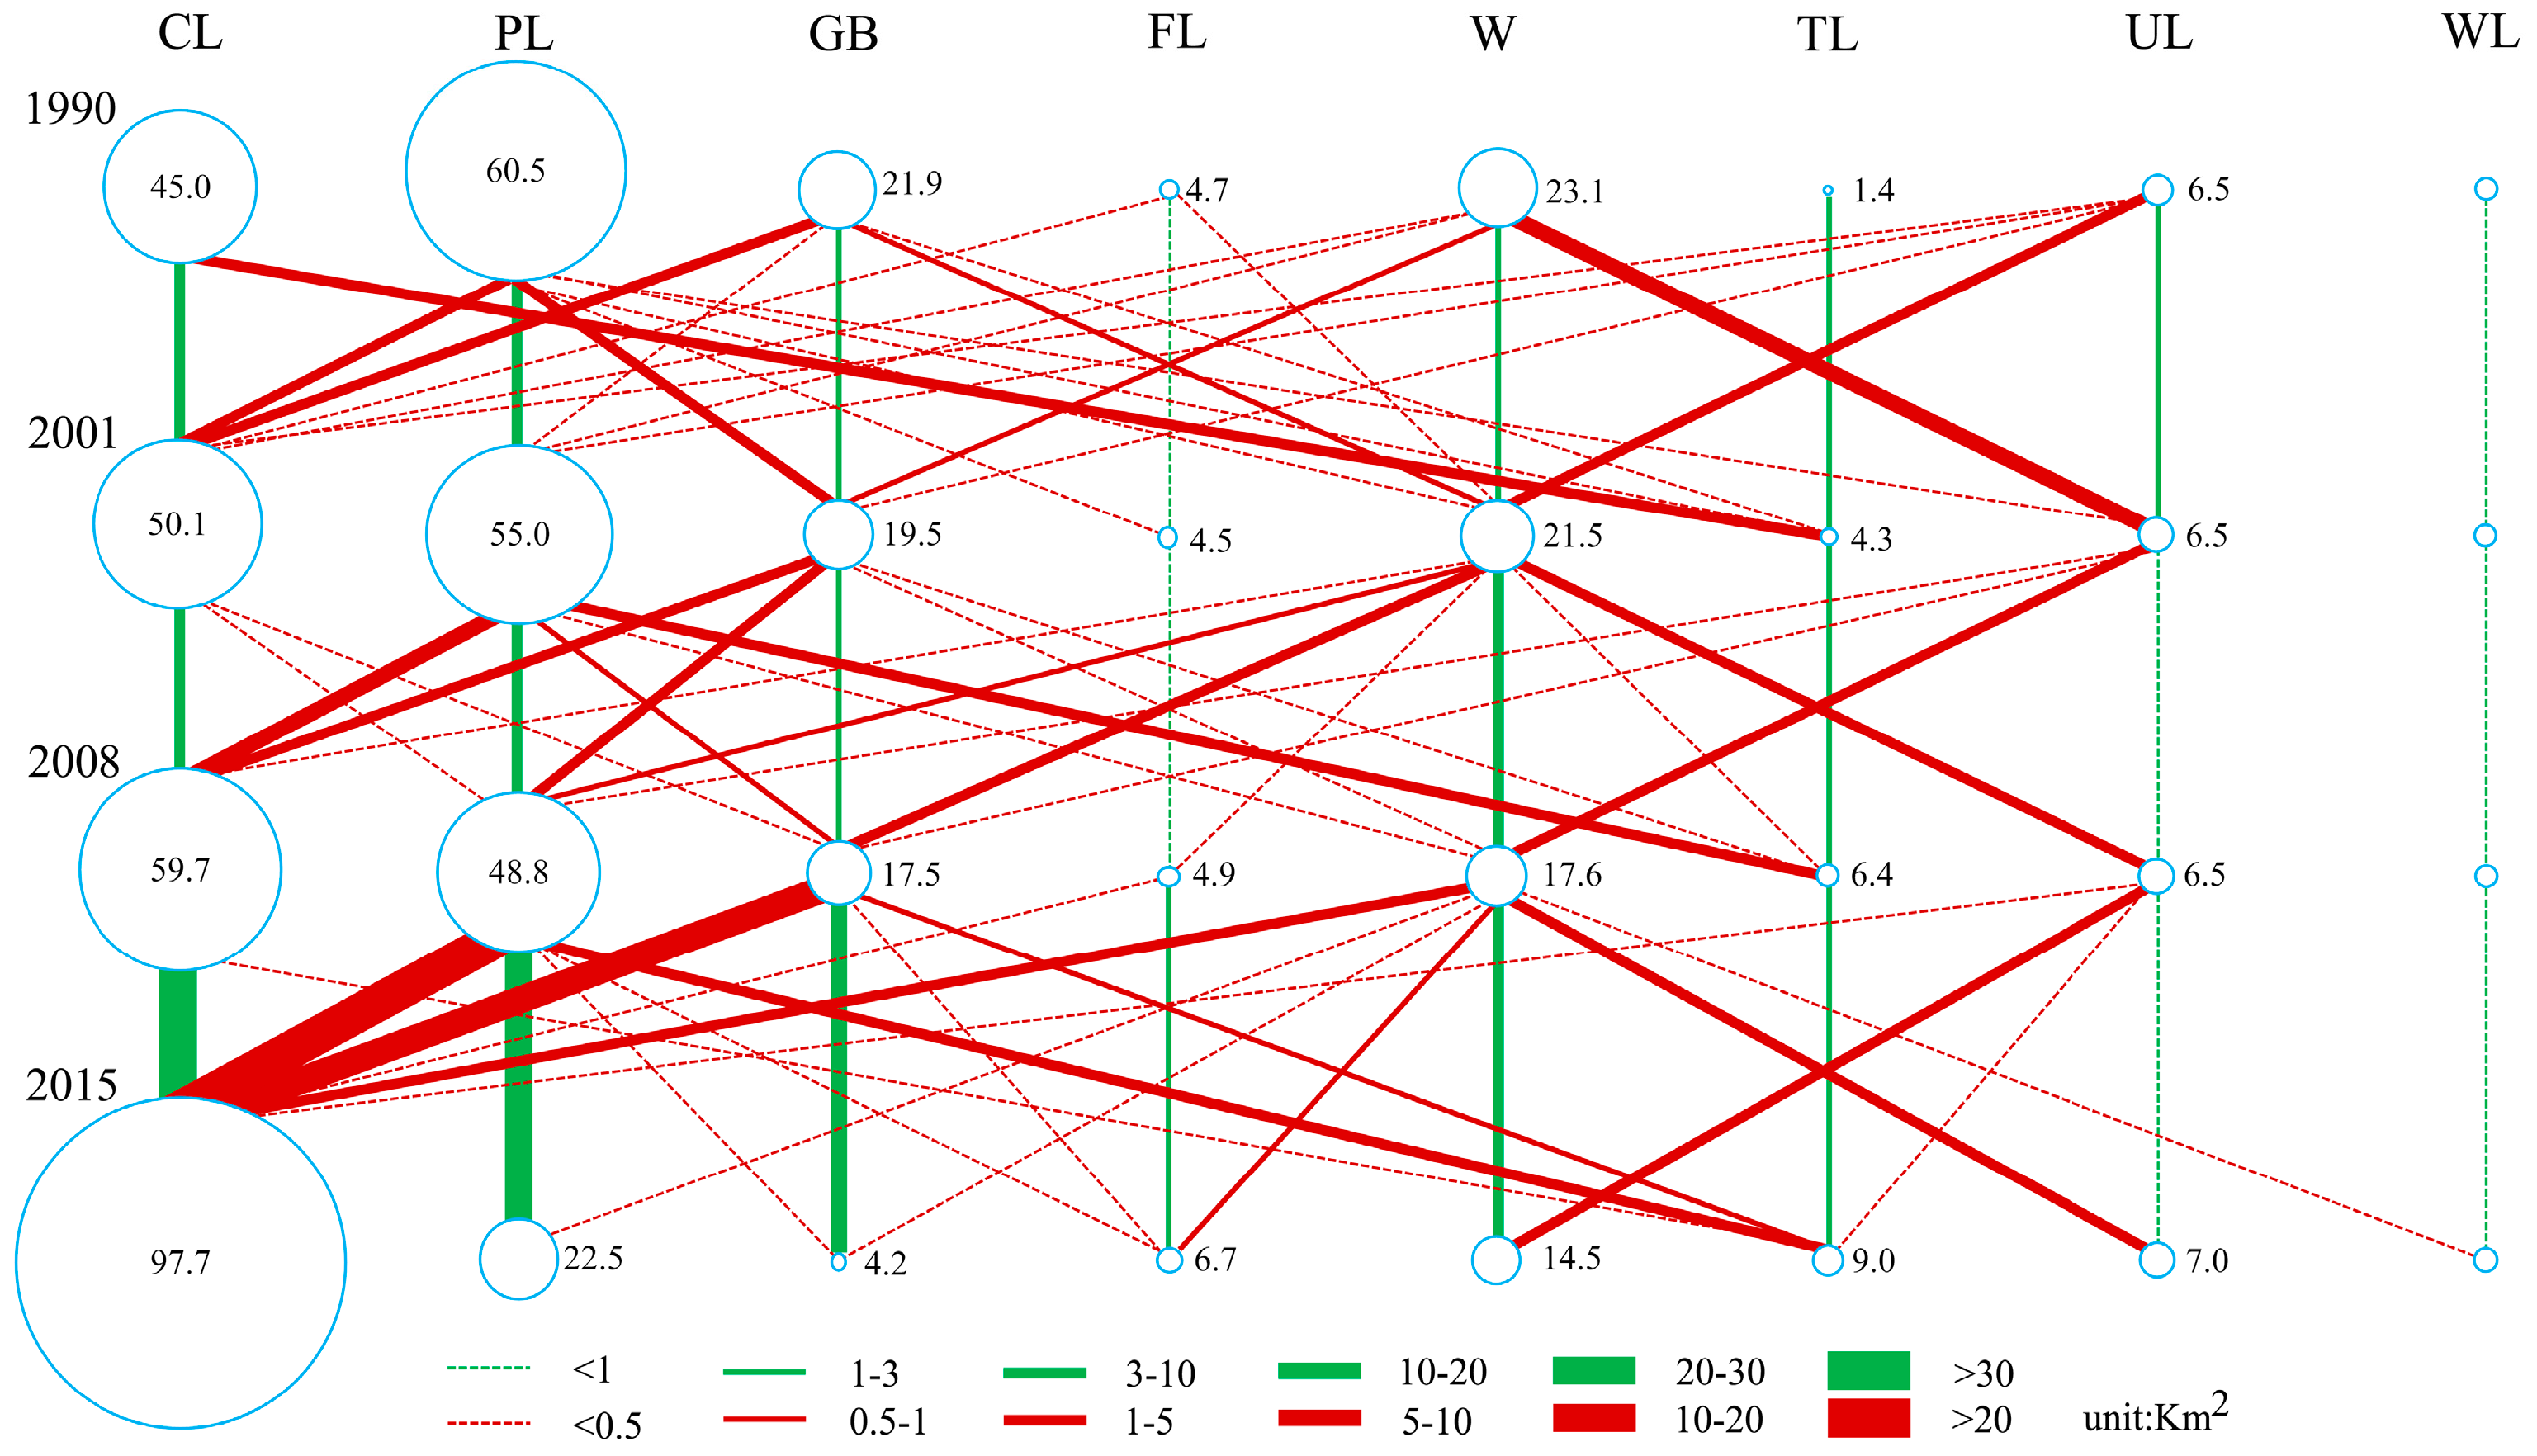
Figure 4.
The gross domestic product (GDP), GDP in primary industries (GDPPI), GDP in secondary industries (GDPSI), GDP in tertiary industries (GDPTI), and the variations of GDP from 1990 to 2014.
Figure 4.
The gross domestic product (GDP), GDP in primary industries (GDPPI), GDP in secondary industries (GDPSI), GDP in tertiary industries (GDPTI), and the variations of GDP from 1990 to 2014.
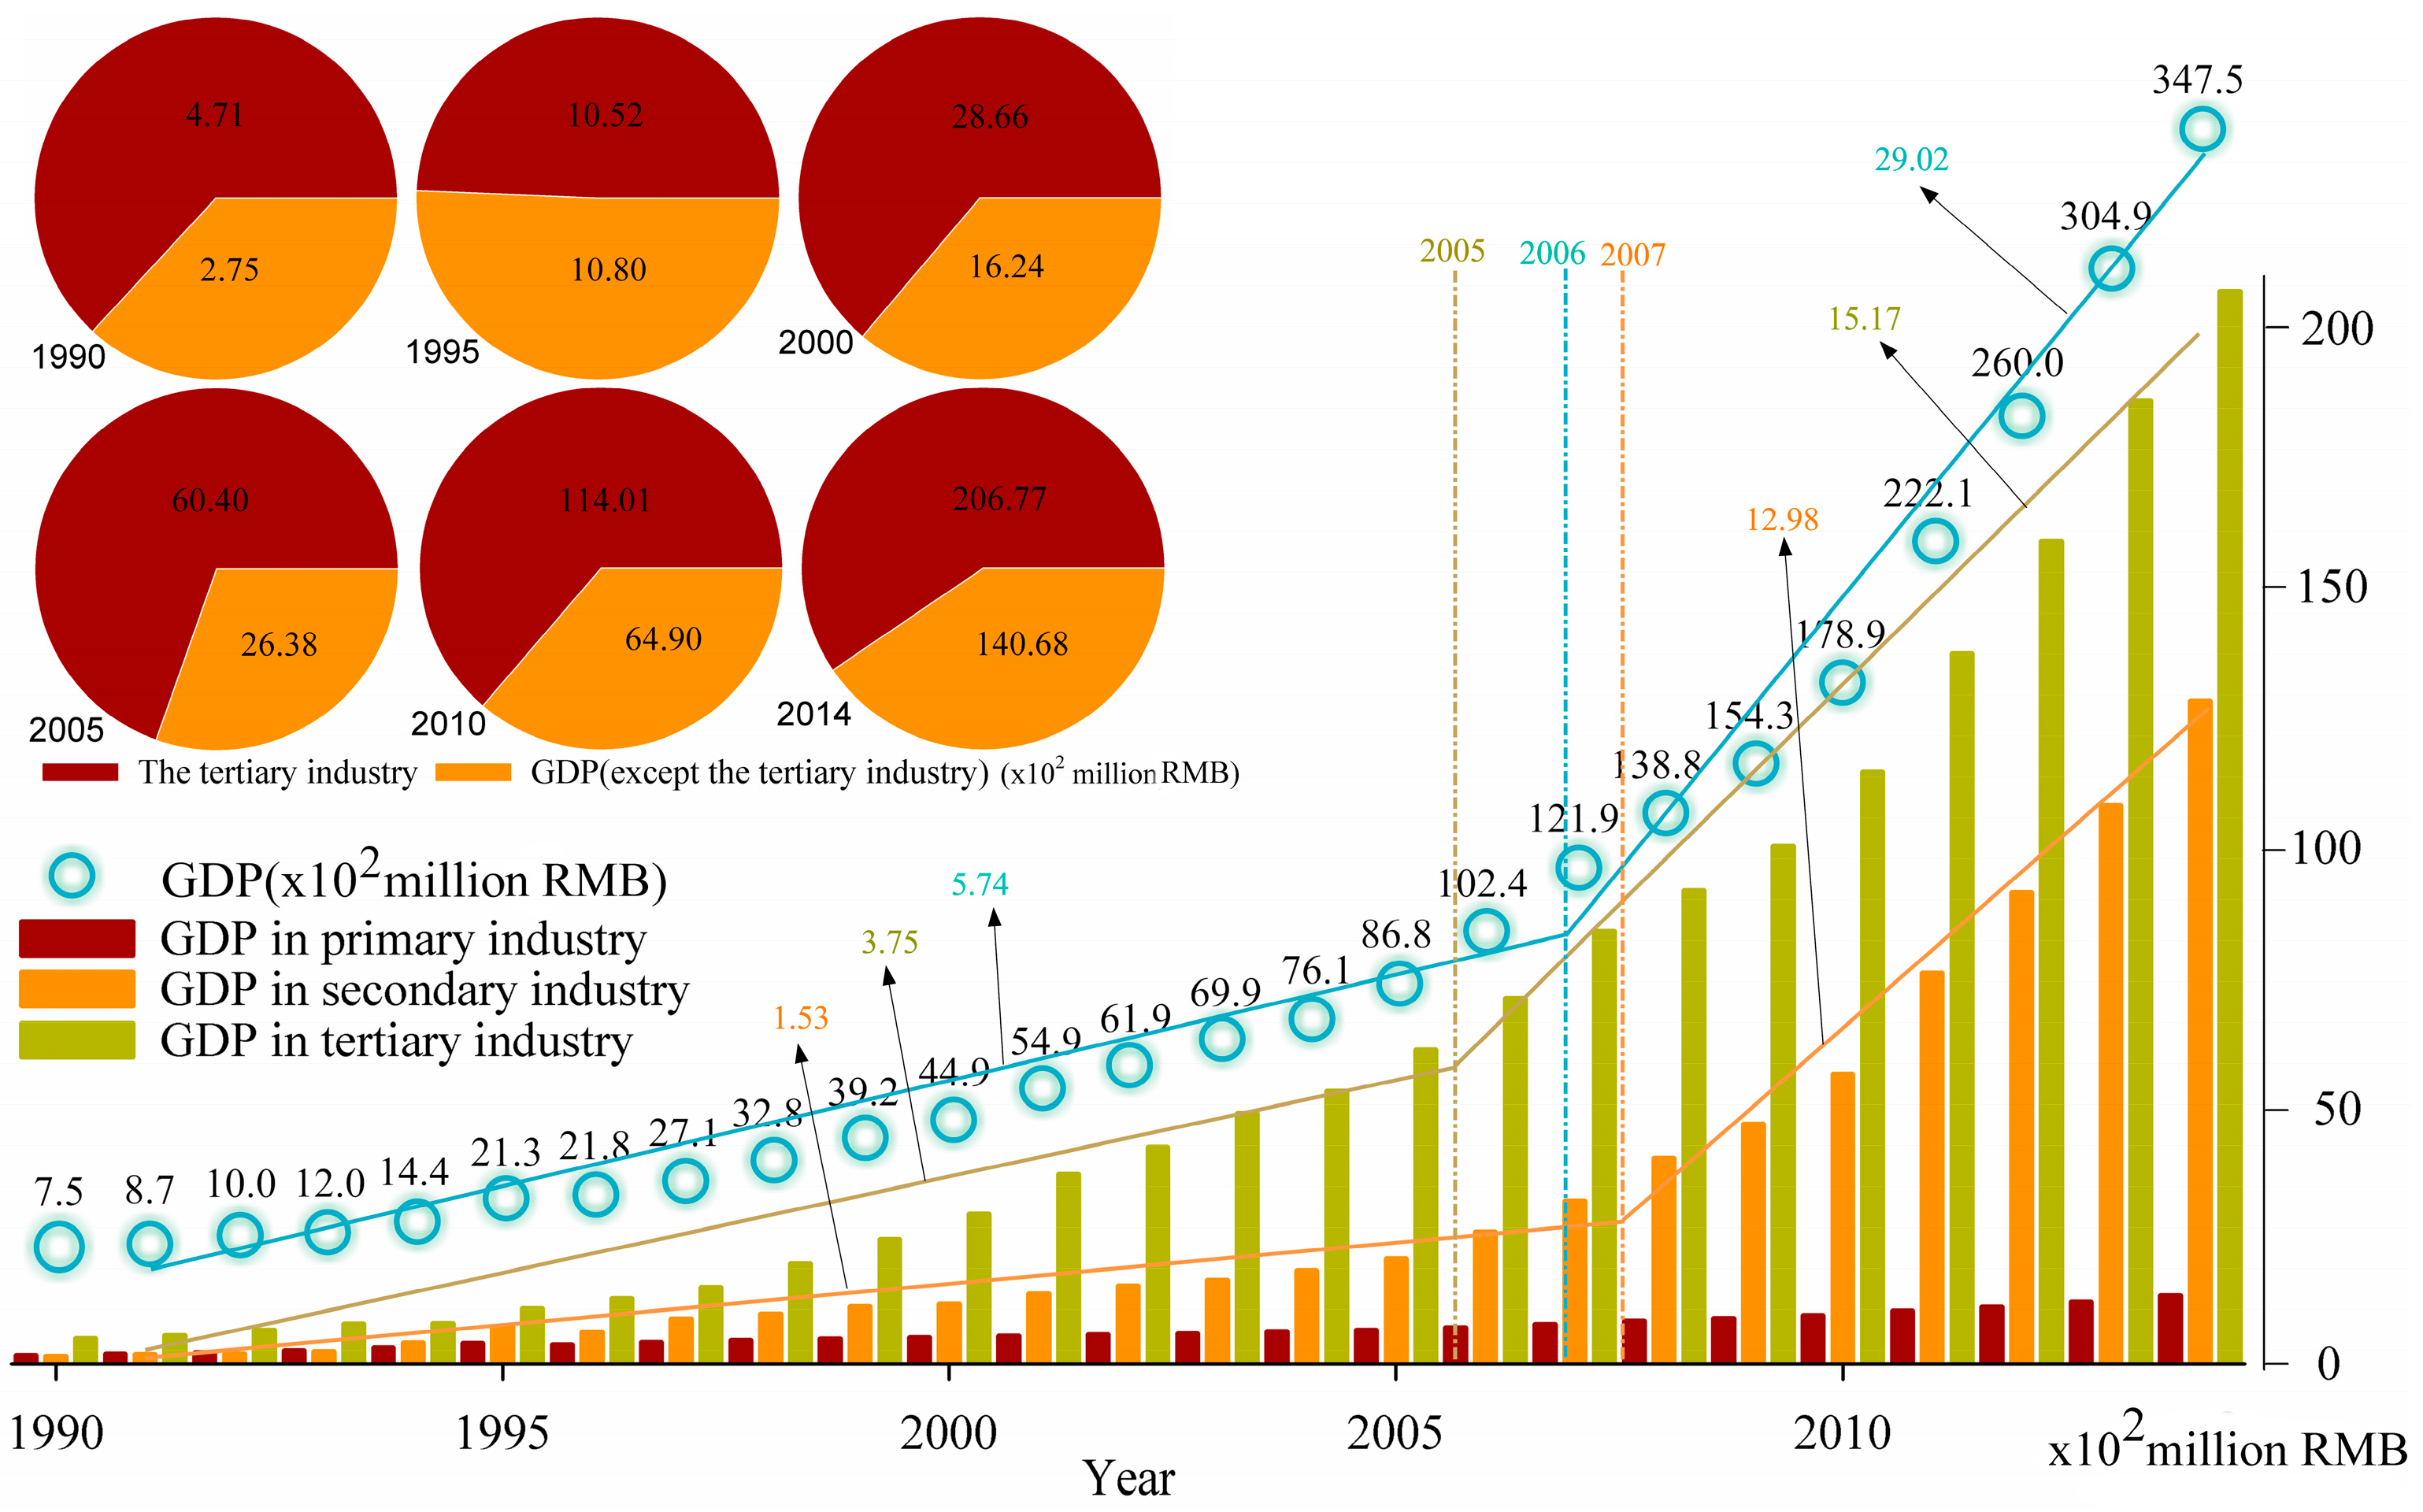
Figure 5.
The total population, country population, and urban population from 1990 to 2010.

Figure 6.
The actual investment of government, new fixed assets, and budget spending of public finance from 1990 to 2014, and the main policies on construction land and transportation land from the 1980s to the 2010s.
Figure 6.
The actual investment of government, new fixed assets, and budget spending of public finance from 1990 to 2014, and the main policies on construction land and transportation land from the 1980s to the 2010s.

Figure 7.
The population of foreign travelers and domestic tourists, as well as the tourist income and its dynamics in tertiary industries from 1990–2014.
Figure 7.
The population of foreign travelers and domestic tourists, as well as the tourist income and its dynamics in tertiary industries from 1990–2014.
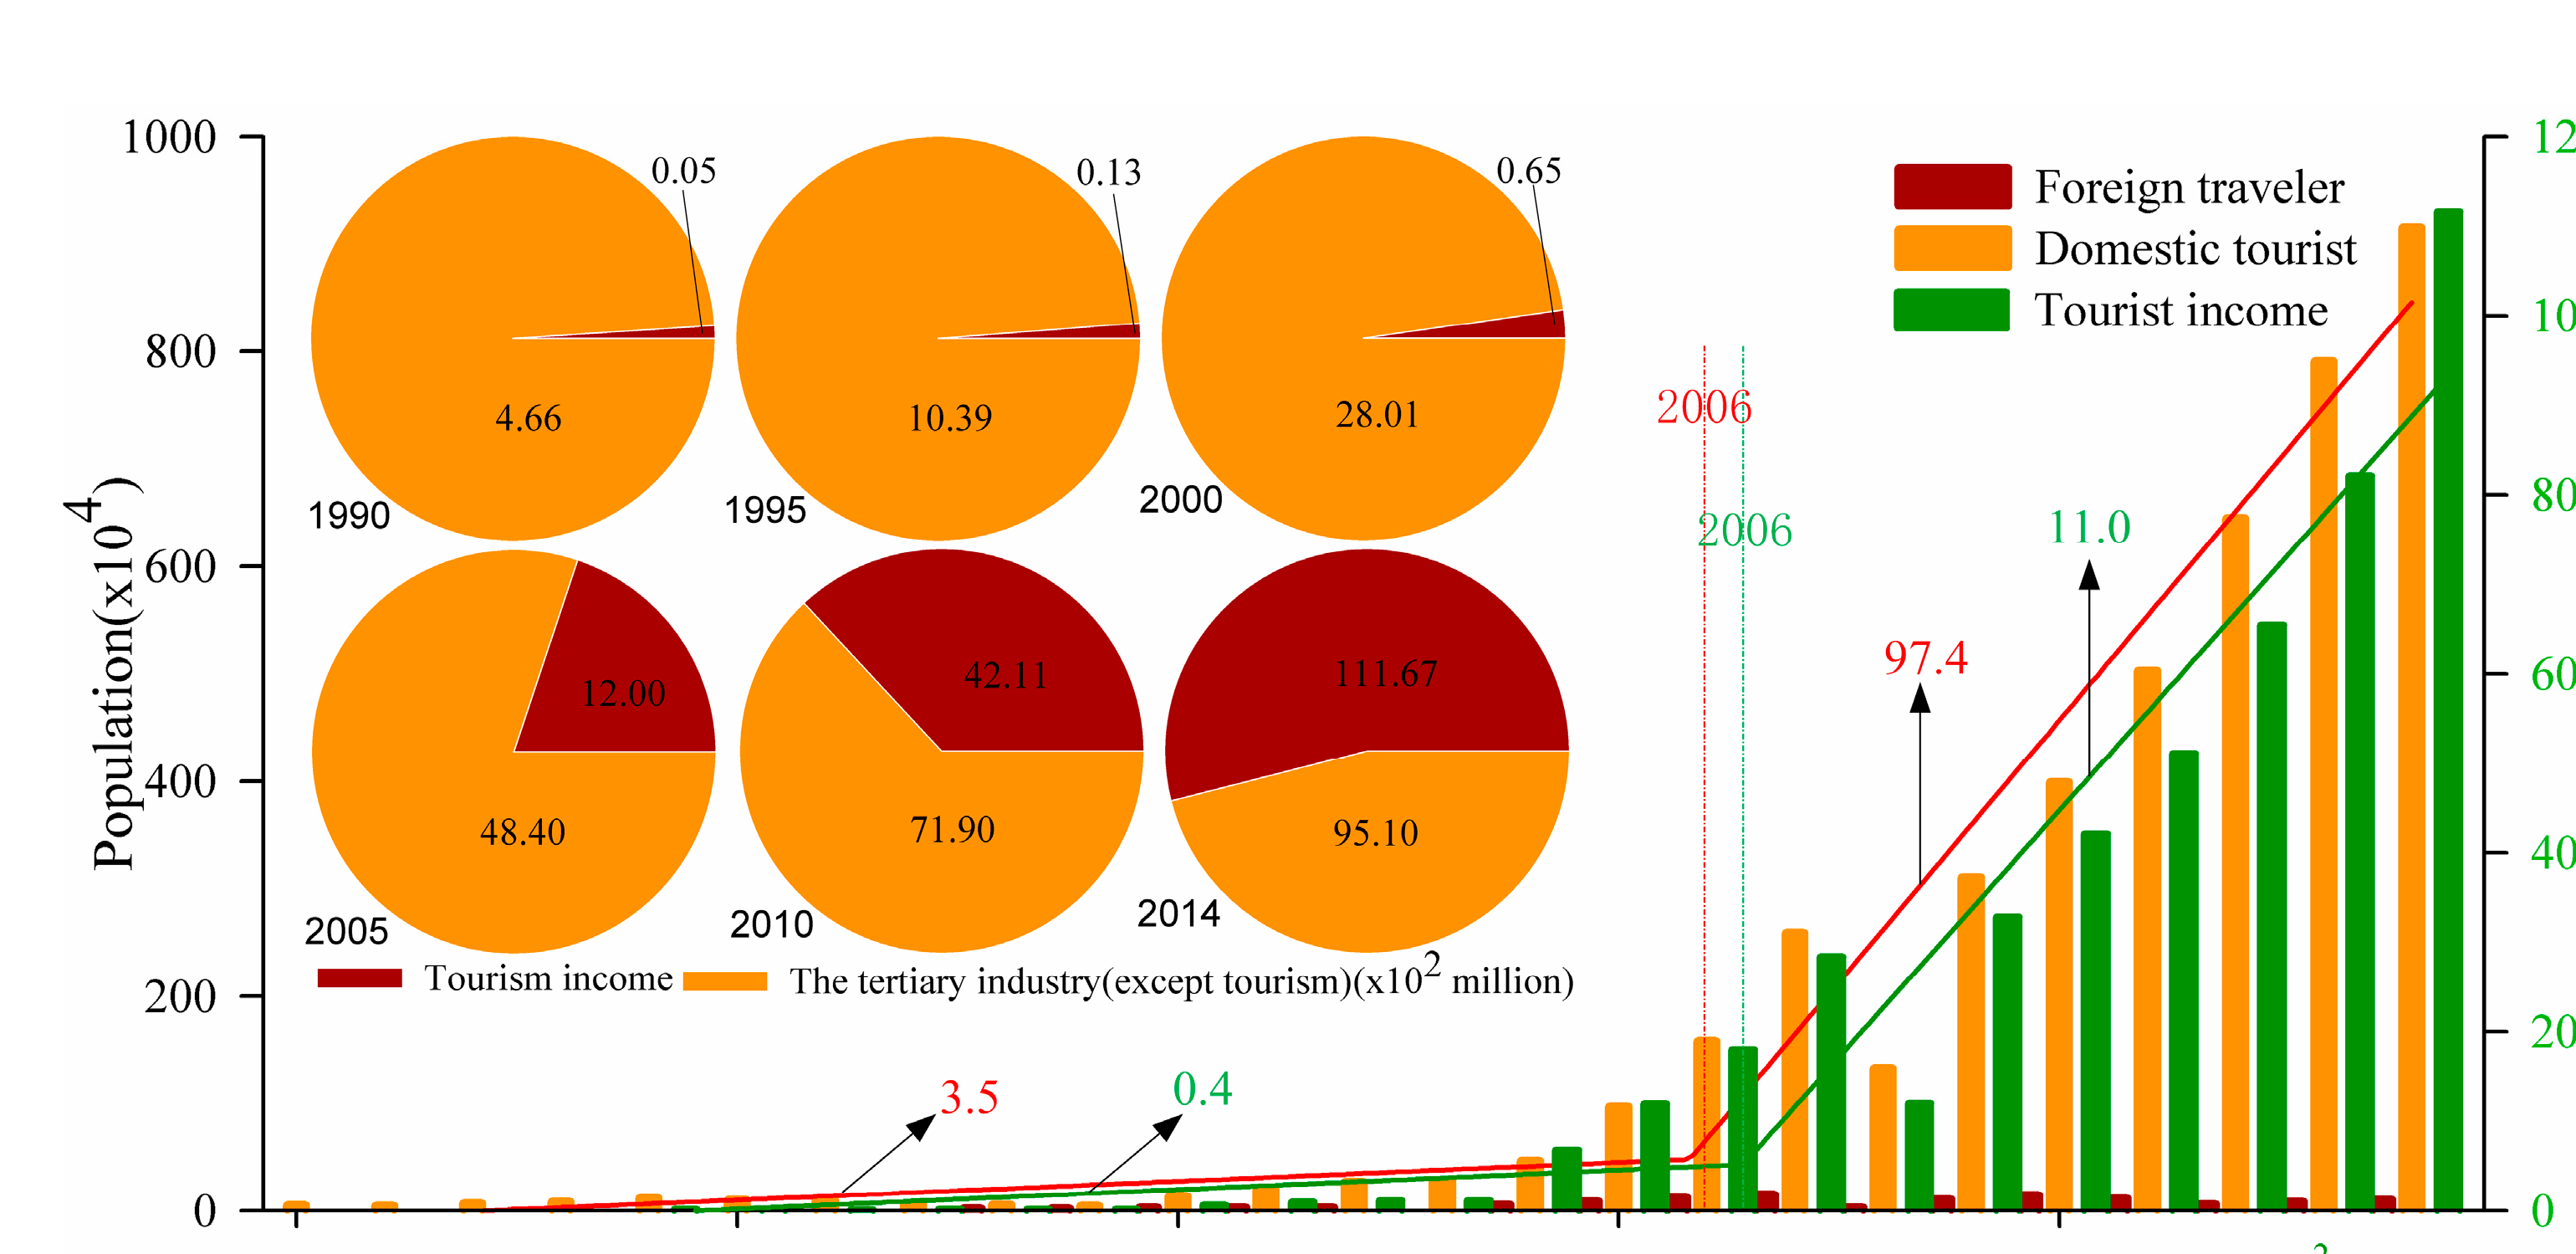
Figure 8.
The relationships between the BA, GBA, and the determinants.

Figure 9.
The contributions (%) of different categories’ determinants to BA via redundancy analysis is presented in Venn diagrams.
Figure 9.
The contributions (%) of different categories’ determinants to BA via redundancy analysis is presented in Venn diagrams.
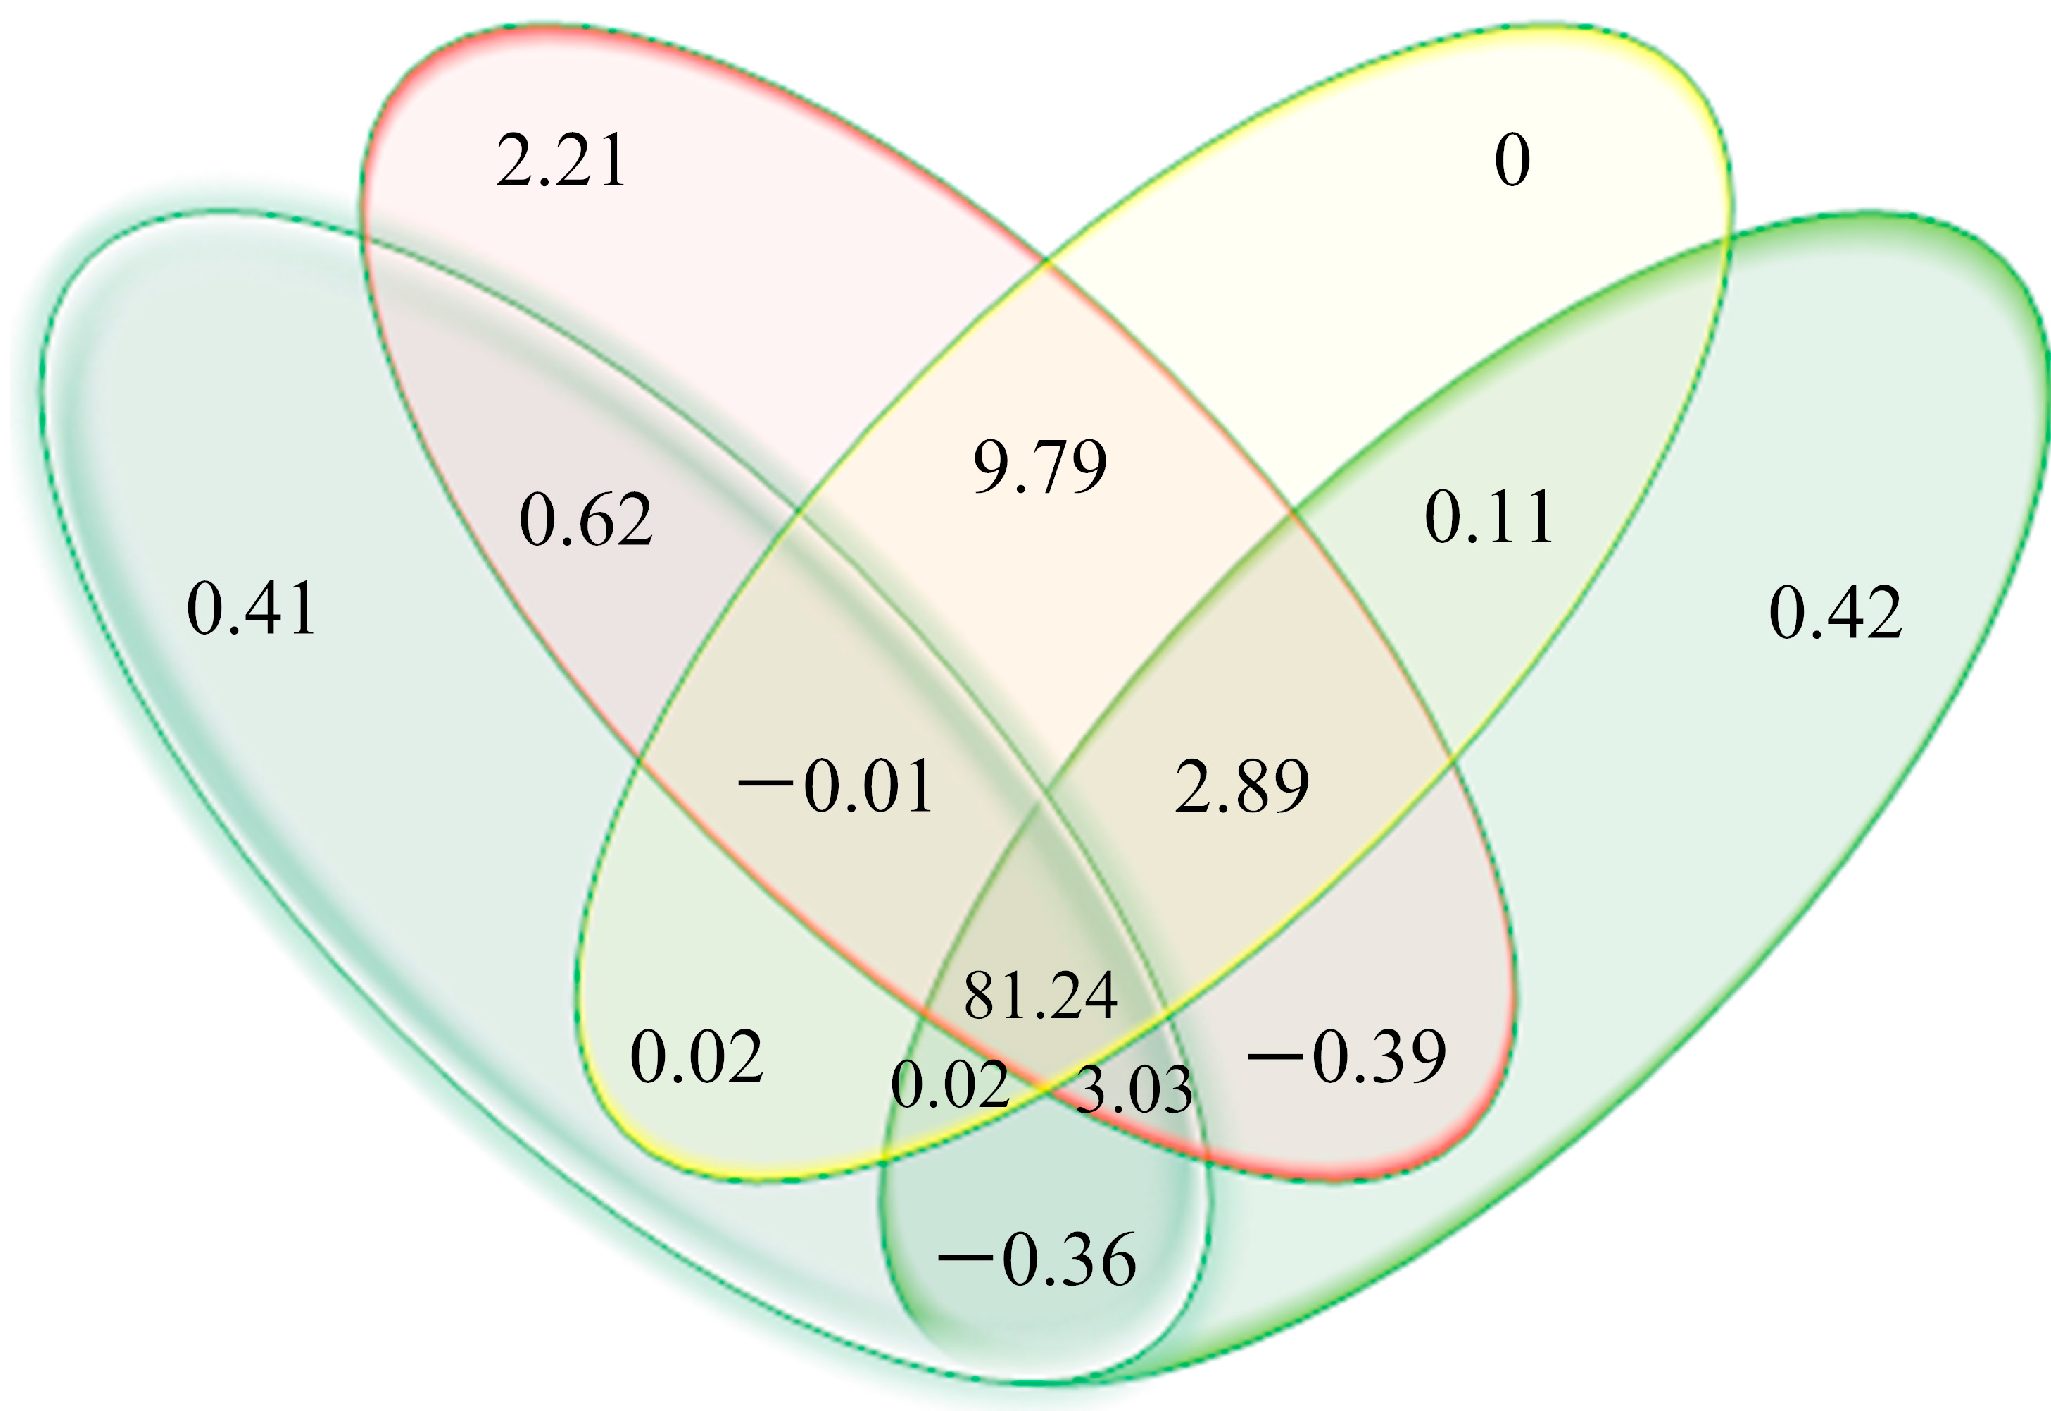
Figure 10.
The policy framework of the “Lhasa development model”.
© 2017 by the authors. Licensee MDPI, Basel, Switzerland. This article is an open access article distributed under the terms and conditions of the Creative Commons Attribution (CC BY) license (http://creativecommons.org/licenses/by/4.0/).
Share and Cite
MDPI and ACS Style
Tang, W.; Zhou, T.; Sun, J.; Li, Y.; Li, W. Accelerated Urban Expansion in Lhasa City and the Implications for Sustainable Development in a Plateau City. Sustainability 2017, 9, 1499. https://doi.org/10.3390/su9091499
AMA Style
Tang W, Zhou T, Sun J, Li Y, Li W. Accelerated Urban Expansion in Lhasa City and the Implications for Sustainable Development in a Plateau City. Sustainability. 2017; 9(9):1499. https://doi.org/10.3390/su9091499
Chicago/Turabian StyleTang, Wei, Tiancai Zhou, Jian Sun, Yurui Li, and Weipeng Li. 2017. "Accelerated Urban Expansion in Lhasa City and the Implications for Sustainable Development in a Plateau City" Sustainability 9, no. 9: 1499. https://doi.org/10.3390/su9091499
Note that from the first issue of 2016, this journal uses article numbers instead of page numbers. See further details here.