Spatio-Temporal Variations of Health Costs Caused by Chemical Fertilizer Utilization in China from 1990 to 2012


1
School of Geographic and Oceanographic Sciences, Nanjing University, Nanjing 210023, China
2
Department of Geography and Environmental Science, University of Reading, Reading RG6 6AB, UK
3
The Key Laboratory of the Coastal Zone Exploitation and Protection, Ministry of Land and Resources, Nanjing 210024, China
4
Institute of Advanced Studies in Humanities and Social Sciences, Nanjing University, Nanjing 210023, China
*
Authors to whom correspondence should be addressed.
Sustainability 2017, 9(9), 1505; https://doi.org/10.3390/su9091505
Submission received: 8 May 2017
/
Revised: 24 July 2017
/
Accepted: 1 August 2017
/
Published: 24 August 2017
(This article belongs to the Special Issue Sustainable Land Use in China)
Abstract
:The health impacts caused by chemical fertilizer utilization have challenged long-term sustainable development in many countries, particularly developing countries. Based on the emergy analysis method, we estimated the temporal and spatial variations of the health costs, through atmospheric, water, and soil pathways, of chemical fertilizer utilization in China during the period from 1990 to 2012. The results showed an obvious increasing trend of health costs from 1.8 billion Yuan in 1990 to 23.0 billion Yuan in 2012, while the ratio of health costs to agriculture output value declined slowly and became stable in recent years. Regional differences were remarkable and were significantly correlated to the levels of economic development (r = 0.843 and p < 0.001) and crop-sown area in the region (r = 0.588 and p < 0.001). Economically developed regions, especially the eastern coastal provinces, had much higher costs than the western regions. Meanwhile, fertilizer consumption shifted from the eastern to the northwest region, which was the same as the health costs. This study provides a reference to estimate the health costs of fertilizer utilization, and the results highlight the importance of sustainable development in China.
1. Introduction
Chemical fertilizer, as a supporter of crop yield and quality, is a key element of agricultural production. Currently nearly half of the world’s population is supplied with food produced using chemical fertilizers [1]. The excepted increase of population in the coming decades will put 50% to 80% more pressure on agricultural production and intensify the dependency on fertilizer utilization [2,3]. With around 9% of the world’s arable land, China has made substantive progress in the last decades to plant sufficient crops to feed 20% of the global population, which is supported by the rapid development of the fertilizer industry [4]. With China’s growing agricultural inputs and the adjustment of the agricultural planting structure, the fertilizers applied to crops, especially fruits, vegetables, and other horticultural crops, have increased remarkably from the 1980s. The amount of fertilizer applied was 47,970 kg km−2 for cultivated areas or 35,730 kg km−2 for sown areas in 2012 (Table S1), which is much higher than the safe limits of 22,500 kg km−2 and nearly four times the world’s average [5]. China has already become world’s largest fertilizer consumer [6], accounting for almost one third of the global total consumption [7]. Moreover, excessive and unreasonable fertilizer use has induced a series of environmental and ecological problems such as soil acidification, lake eutrophication, and emissions of greenhouse gases (notably CO2, CH4, and N2O) and ammonia gas (NH3), which could worsen the secondary fine particulate matter; for example, PM2.5 pollution [8,9,10,11]. All these environmental impacts will finally threaten human and ecosystem health in China and the rest of the world.
To implement welfare enhancing agricultural policy, the first step is to estimate the pollution cost caused by agricultural production [12]. Some studies have been conducted to estimate the environmental and health costs of agricultural production, including the impacts on soil acidification, climate change, eutrophication, biodiversity, and human health [13,14,15,16,17,18,19,20] (Table 1). However, the economic costs of the health damage caused by fertilizer utilization in China are still not very clear. As a country with area of 9.6 million km2, the spatial variation of these costs is also unknown.
The methods used in previous studies were selected according to their relative importance and the urgency of the impact as well as the available data. The accounting techniques usually combine the subjective methods with objective ones such as shadow price, the willingness-to-pay method, and an impact removal method. However, these subjective methods would, to some extent, affect the accuracy of the results. Emergy analysis (EmA), introduced by Odum [21], integrates all kinds of classifications and qualities of energies together by virtue of solar emergy joules (sej) and is valuable to quantify development tradeoffs that consider both economic and ecological costs and benefits. EmA has been used to analyze systems such as buildings, industrial processes, urban areas, and countries [22]. However, it has not yet been widely applied to environmental and human impact, especially for the chemical fertilizers. EmA has been combined with other methods or techniques, including life cycle assessment, ecological footprint, geographical information systems (GIS), and strategic environmental assessment in some studies [22], but, to the best of our knowledge, it is hard to find studies combining EmA with disability-adjusted life years (DALY).
In the current study, based on the data of fertilizer consumption in China between 1990 and 2012, the spatio-temporal variations of health costs were analyzed at the national, regional, and provincial levels. This study investigated these questions: (1) What was the health cost caused by nitrogen and phosphorus fertilizer utilization in China from 1990 to 2012? (2) Was there any spatial difference in the amounts and growth rates of health costs, particularly between the economically developed east coastal provinces and the less developed western provinces? (3) What were the factors causing the spatial and temporal differences in health costs? Our aim is to supply a reference for China’s sustainable development and elucidate policy implications for future fertilizer use and agricultural production.
2. Materials and Methods
2.1. Data Sources
The national and regional annual data of fertilizer consumption were analyzed from 1990 to 2012. The amounts of all kinds of fertilizer used for cultivated areas, sown areas, and the gross output of agriculture were obtained from the China Statistical Yearbook [23] and the China Agricultural Statistical Yearbook [24]. The data about Chinese society, economy, resources, and environment were collected from the China Statistical Yearbook [23] and the China Energy Yearbook [25].
To evaluate the spatial variation of the health costs, China was divided into six zones according to the characteristics of natural and agricultural production, i.e., Northeast, Huang-Huai-Hai, middle and lower Yangtze River, South, Northwest, and Southwest [26]. The regional analyses were performed at the provincial level and aggregated to the six zones.
2.2. Methodology
Emergy analysis is a type of embodied energy analysis that can provide common units (sej) for the comparison of environmental and economic goods by summing the energy of one type required directly or indirectly for producing goods. The quality of each quantity of energy is taken into account by its solar transformity, which is defined as solar emergy per unit energy (sej J−1) [27]. Compared with previous methods that assign money to services, emergy analysis has several advantages. First, it is based on biophysical processes rather than derived/perceived human value, for example, hedonic pricing and willingness-to-pay, and thus it reduces preference from the valuation schema. Second, values are allocated according to donors, and this simplifies analyses considerably. Values embodied in natural capital are estimated according to the environmental work that is required rather than according to the services that the stock provides [28].
This study took five steps to estimate the health costs of fertilizer utilization (for a flow chat, see Figure S1).
The first step is to categorize the fertilizer pollution types (air, soil, and water) to analyze the direct and indirect health harms from different contaminants. Air pollution is mainly caused by NH3, N2O, and NOx, which are the main sources of acid rain, respiratory disease, the greenhouse effect, and ozone depletion. Fertilizers can alter the physical and chemical properties of soil by nitrate, sulfate, and nitrogen and cause heavy metal pollution by cadmium (Cd) [29,30], thus forming soil pollution. The runoff of phosphorus fertilizer from farmland catchment to waters can cause serious water pollution, leading to eutrophication and algal bloom [8,31].
The second step is to summarize the experiential data of nitrogen and phosphorus during their transport and transformation, including nutrients, use efficiency, loss coefficients, and contamination generate coefficients (Equation (1)):
where Dosei represents the generated dose of contamination i, in tons; M represents the quantity of fertilizer consumption of nitrogen or phosphorus fertilizer in tons; Cei represents nutrient transfer coefficient; Wc represents the molecular weight of contamination; and Wf represents the molecular weight of N or P2O5.
Dosei = M × Cei × (Wc/Wf),
Referring to the previous studies of nutrient diversion of fertilizers, the transport and transformation rates of nitrogen and phosphate are summarized in Table 2. The average value was taken for rates with a variable range in the studies. For the contamination generation coefficients, NH3, N2O, and NOx were calculated as the percentage of the amount of nitrogen and were 5%, 0.67%, and 0.5%, respectively [32,33,34]. Due to the data limitation and small direct output of CO2, the estimation of CO2 is not involved. Regarding phosphate fertilizer, the Cd content was 1.35 mg kg−1 (range: 0.2–2.5 mg kg−1) [35]; the nitrate nitrogen runoff loss was estimated at a rate of 0.67 [36].
The third step is to estimate the impact to human health caused by each contamination. Disability-adjusted life years (DALY) were used for the calculation [45] (Equation (2)):
where DALYi represents a cumulative number of years caused by the damage of contamination i; Cdi represents the life years of damage caused by a unit dose of contamination i, namely, the impact intensity coefficients, in units of kg−1 a; and Dosei represents the dose of contamination i. The values of Cdi were obtained from the estimated numbers in ‘The Eco-indicator 99: A damage oriented method for Life Cycle Impact Assessment’ [46], and Eco-indicator 99 is a life cycle impact assessment weighting method, which is widely used for the meaningful assessment of environmental damages. Cdi for sulphate and phosphate were estimated according to the chemical potential energy, which is a form of potential energy released or absorbed during a chemical reaction or phase transition [47] (Table 2).
DALYi = Cdi × Dosei,
The fourth step is to multiply the cumulative life years of damage with the data of annual emergy consumption per capita to estimate the emergy of each contamination. Then, sum up each contamination’s emergy to get the total emergy cost derived from fertilizer utilization (Equation (3)):
where U represents the total emergy for all contaminations in sej; Emergyi represents the emergy of contamination i; DALYi represents a cumulative number of years caused by the damage of contamination i; and Cm represents the annual emergy consumption per capita. In accordance with relevant domestic and international studies [21,48,49], the total emergy used in China (including renewable as well as non-renewable environmental resources) was estimated yearly based on the material flow, and Cm was calculated by dividing the total emergy by the population (Table S2).
The fifth step is to calculate the integrated health costs based on the annual rate of emergy and currency in China (Equation (4)):
where EmYuan represents the macro-economic value of the health impacts caused by fertilizers in Renminbi Yuan (¥); U represents the total emergy in sej; and Cg represents the emergy load of unit the macro-economic value. It is the ratio of the emergy used per Gross National Product (GNP) in a country or region, in units of Yuan−1 sej. The values of Cg for each year were estimated by dividing the total emergy used in China by GNP (Table S2).
EmYuan = U/Cg,
2.3. Regression Analysis
Regression analyses (two-tailed) were performed using SPSS 21.0, which can return both the regression coefficients and the p-value (significance test). The variables considered in the regression analysis include total health cost, total fertilizer application amount, crop sown area, health cost per sown area, and the Gross Domestic Product (GDP) per capita of 30 studied provinces.
3. Results
3.1. National Health Costs
Based on steps 1 to 3 (see Methods), the health damages caused by fertilizer utilization were calculated and the results were shown in Table 3. Considering the rural population of 656.56 million in China, the total life years for health damage in 2012 were estimated at 6.02 × 10⁵ a (range: 5.78 × 10⁵ to 6.33 × 10⁵ a) or 9.17 × 10⁻⁵ a per capita, of which 9.74 × 10⁴ a, 2.52 × 10⁵ a (range: 2.28 × 10⁵–2.81 × 10⁵ a), and 2.53 × 10⁵ a (range: 2.52 × 10⁵ to 2.54 × 10⁵ a) were caused by atmosphere, soil, and water impacts, respectively, with a share of 16.17%, 41.82%, and 42.01% each, respectively. NO3-N and nitrate were the biggest contributors, sharing 36.63% and 30.31%. N2O, sulphate, and phosphate contributed relatively smaller amounts, less than 1% each. In regard to the per unit dose, Cd had the most serious harm to humans with 6.09 × 10⁻⁴ kg−1 a. With respect to the total amount, NO3-N contributed 2.21 × 10⁵ a.
Based on steps 4 to 5 (see Methods), the health cost of fertilizer application was estimated to be as much as 23.0 (range: 22.0 to 24.1) billion Yuan in 2012, of which 3.71, 9.60 (range: 8.69 to 10.71), and 9.65 (range: 9.61 to 9.69) billion Yuan were caused by atmosphere, soil, and water impacts, respectively. The total cost accounted for about 0.49% (range: 0.47 to 0.51%) of the agricultural output (Table 3). From the view of growth rate, the health cost grew 12 times (fixed-price of 2012, in other words 2012 as the baseline) from 1990 to 2012, with an average annual growth rate of 12.42%. The cost grew steadily from 1990 to 1999 and then increased rapidly from 2000, especially in the years after 2006. The ratio of health cost to agriculture output also increased in general, with a relatively stable ratio around 0.5% from 2008 to 2012 and a slight decline between 2009 and 2011.
3.2. Regional Health Costs
The health costs of fertilizer application were estimated at the provincial scale and the results were presented in Figure 1 and Figure 2 and Table 4. Judging from the regional distribution of fertilizers’ health costs, the absolute amounts were higher in the traditional agricultural provinces. The middle and lower reaches of the Yangtze River area and the Huang-Huai-Hai area had the biggest costs, with respective shares of 27.07% and 24.28% in 2012 (Table 4), over half of the national cost. It was worth noting that Henan province, as a part of the Huang-Huai-Hai area, ranked the first in China, with a total cost of 2.47 billion Yuan, contributing 10.76%. Jiangsu, Hubei, and Shandong provinces came after, with costs over 1.5 billion Yuan, while Beijing, Qinghai, and Shanghai cost just less than 0.1 billion Yuan. In terms of the intensity of health costs, Tianjin, Shaanxi, Jiangsu, Guangdong, Beijing, Zhejiang, and Fujian were in the highest group, with the costs per sown area being over 20,000 Yuan km−2. Hubei, Xinjiang, Henan, Hebei, and Hainan came second, with a value between 15,000 and 20,000 Yuan km−2, suggesting that the intensity of costs in developed regions, especially the eastern coastal area, were usually higher than those in less developed areas.
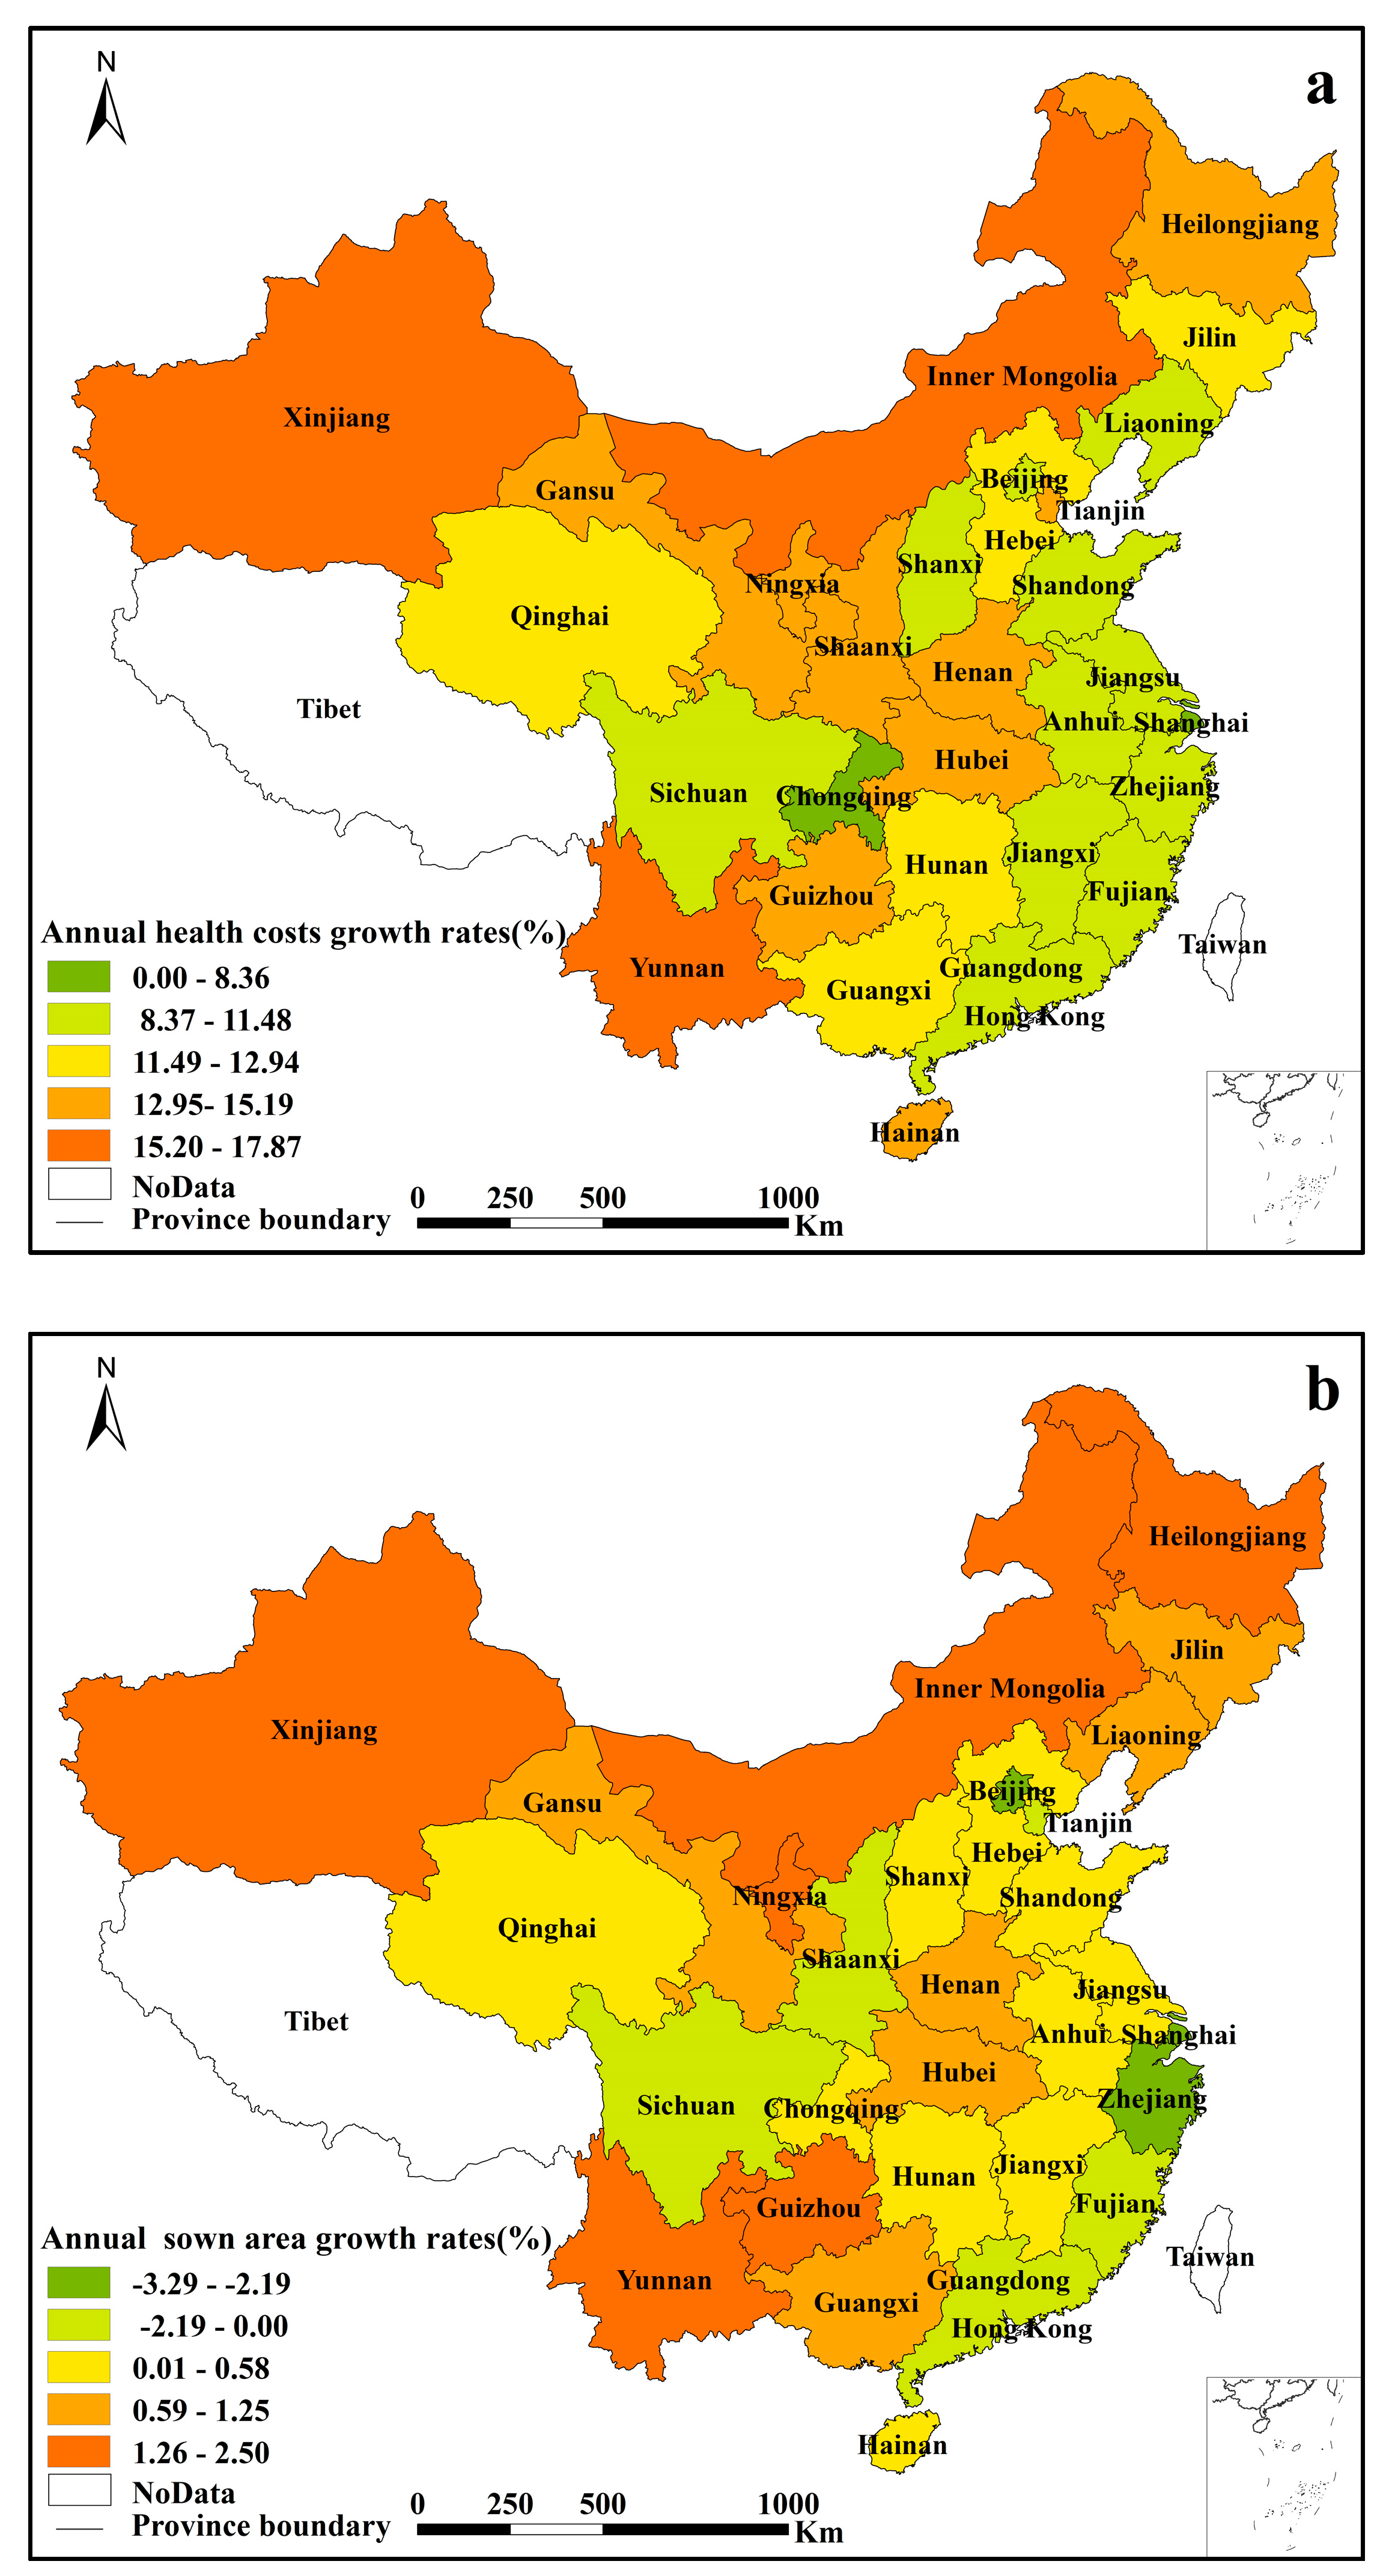
With respect to the regional growth rate of health costs from 1990 to 2012 (Figure 2a), the Northwest showed a higher trend of growth, with Xinjiang and Inner Mongolia increasing by 17.87% and 17.72% annually, respectively. The values from the Northeast and Huang-Huai-Hai regions were similar to the national average; the middle and lower reaches of Yangtze River, the southern, and the southwest regions trailed behind. Compared with the increasing rate of the whole country, the growth rates in developed areas were much smaller. The more developed the economy was, the more gently the cost increased. The growth rates in Beijing, Shanghai, Zhejiang, and Chongqing were all smaller than 10%. These values showed that China’s dominant fertilizer consumption region was shifting toward the northwest regions. Although the growth rate in the middle and lower reaches of the Yangtze River and the Huang-Huai-Hai area were relatively small, their absolute amount of costs was still very big in 2012. Meanwhile, the total amount in the Northwest was relatively small but had the highest growth rate (for provinces in northwest China, see Table 4).
3.3. Correslation Anlayses of Regional Health Costs
The distribution of crop production in China has changed dramatically in recent years. Crop production has decreased in the developed eastern regions but increased in the less developed western regions (Figure 2b). Since 2000, the crop-sown area in some developed provinces such as Beijing, Zhejiang, Shanghai, Guangdong, and Fujian, has dropped by more than 0.8% annually. Beijing holds a leading position with 3.29%. The reduction areas of these provinces (municipalities) were over 8.74 million hectare between 1990 and 2012, resulting in an obvious decline in all the eastern coastal provinces. Meanwhile, the northwest and southwest provinces such as Xinjiang, Yunnan, and Inner Mongolia had obvious annual growth rates of 2.49%, 1.98%, and 1.91%, respectively. Xinjiang ranked first, with an increase of over 2.14 million hectare.
There are significant relationships between health costs and fertilizer application rates (for total cost and total fertilizer application amount, ρ = 0.83 and p < 0.01; for cost per sown area and fertilizer application amount per sown area, ρ = 0.77 and p < 0.01). In addition, the total health cost was significantly positively correlated to crop sown area (ρ = 0.59 and p < 0.01). Furthermore, GDP per capita was significantly correlated with cost per sown area (ρ = 0.84 and p < 0.01). This indicates that the level of development is an important explanatory variable for the intensity of health costs, and crop sown area is a key explanatory variable for the variation of health costs (Tables S3 and S4).
4. Discussion
4.1. Policy Implication
Chemical fertilizer is very likely to be more widely used in the coming decades. According to the prediction, the demand for fertilizer in China in 2030 will be approximately 68 million tons [50], and the annual growth rate will be 2.4%, which is higher than the Food and Agriculture Organization of the United States (FAO)’s prediction of a world average of 1.4% [51]. In the current study, we estimated that the total number life years of health damage in total population was large, around 6.02 × 10⁵ a. Considering the big population in rural China, the total life years for health damage per capita were much smaller at 9.17 × 10⁻⁵ a. However, the combined health damages of fertilizer and other pollutants, for example, pesticide, can be big, and they should not be ignored. To both ensure national food security and reduce the environmental and health risk of chemical fertilizer, the traditional concept that focuses on crop yield should be changed to a new concept that considers the yield and quality of the crop and the environmental and social costs [9]. The accounting system of agricultural production should include agricultural external cost and public health cost to realize the rational utilization of fertilizer. It is important for the policy makers to carry out some actions to optimize the current agricultural framework. Sustainable intensification agriculture must be brought about by developing environment-smart technology [18]; for example, fertilizer efficiency improving technology, soil testing and fertilizer recommendation technology, fertilizer mechanical deep ploughing technology, and fertilizer organic composite technology. The imbalance of fertilizer consumption among regions can lead to the inefficiency of fertilizer utilization. If the fertilizer can be distributed according to the principle of maximum marginal yield, for example, reducing the fertilizer utilization in fertile fields in southern China and properly increasing the fertilizer utilization in relative barren soil in northwestern China, the national grain output can increase by around 10.3% [52]. To improve the national grain production and reduce the negative effects of chemical fertilizer, it is very important to further research the fine-scale spatial distribution and variation of fertilizer utilization. Using GIS, regional fertilizer using can be monitored and further optimized. Advocating a change in diet pattern and promoting awareness of environmental protection to the public can be an effective measure [4,53]. More measures are also needed to improve the agricultural waste treatment in rural area [54] and minimize environmental pollution, especially water pollution, from fertilizer utilization [55].
4.2. Spatial Variation of Amounts and Growth Rates
Regression analyses were conducted to explore the relationship between health costs and influencing factors. In this study, we found a significant relation between health costs from fertilizer application rates (ρ: 0.77–0.83, p < 0.01) and crop-sown areas (ρ = 0.59, p < 0.01) in China. It is generally accepted that the more fertilizer is applied, the greater the health cost is. In the same situation, increasing the crop-sown area will expand the utilized amount of fertilizer. The dose-response research confirmed the relationship between health costs and phosphorus fertilizer application in Denmark [56]. In addition, the regression analyses show a significant relationship between GDP per capita and the cost per sown area (ρ = 0.84, p < 0.01). In the more developed areas with higher GDP per capita, for example, the eastern coastal area in China, land resources are expansive due to the wide use of land for industry, business, and urban and settlement development [57,58]. In the meantime, the costs of farmland in these areas are much higher than in less developed areas with lower GDP per capita in western China. A study in New Zealand and Finland found a similar relationship between health cost and GDP [59]. As with many studies, we recognize that regression analyses only indicate a statistical relationship. More studies are still needed to explore the cause of the regional differences in health costs caused by fertilizer utilization.
The steady growth of the national health costs of fertilizer utilization is striking, but the spatial variation of amounts and growth rates should receive equal attention. The economically developed regions, especially the eastern coastal provinces, have much higher costs than the less developed regions in the western provinces (Figure 1). This is also confirmed by the significant positive relationship between GDP per capita and health costs per sown area (Table S4). With the rapid development of urbanization and industrialization, China’s developed areas are facing a conflict of land demand between food production and other economic activities. Without enough cultivated land, farmers have to increase their investment in other elements, particularly fertilizers and pesticides to stabilize and improve the crop yield. A critical point to address is that the health costs in northwestern China have increased rapidly in recent years. Despite the lower consumption of fertilizers in the past, northwestern China, particularly Xinjiang and Inner Mongolia, developed very quickly in the horticultural crop planting and animal husbandry, unavoidably increasing the fertilizer demand and health costs. However, the soil quality in western China is relatively poorer and the environment is very fragile, and fertilizer utilization may further deteriorate the soil quality and environment [60]. Despite the large health costs of fertilizer utilization in eastern China, the rate of increase has slowed down, probably due to the relative decline of agricultural production with the transfer of farmland to industrial parks and settlement areas [61]. Agricultural production is shifting from economic developed areas to the surrounding provinces and cities, where economies are relatively backward. This is the result of the law of comparative advantage as well as the inevitable choice of resource reconfiguration and optimization. It brings development opportunity as well as a huge environmental and public health threats to the economically less developed areas.
4.3. Limitations and Uncertainties
The current study provides an assessment of the national and regional health costs of fertilizer utilization in China over a 20-year period. Using the method of emergy analysis, combing DALY to quantify the health costs, the method can to some extent reduce the subjectivity and randomness of the traditional health valuation methods [28]. Combining the amount of regional fertilizer consumption, the proportion of fertilizers’ transport and transformation, the coefficients of life years for each contamination, and emergy flow, the current study could be regarded as an advisable method for comparing the health costs of different regions. To the best of our knowledge, this study provides an appropriate monetization indicator for the health costs of fertilizer utilization. Future researchers can reference the ideas of the method to establish a monetization indicator for evaluating a specific social ecological system.
Our result indicated that the health cost of fertilizer utilization was 23.0 billion Yuan, which was lower than in previous studies (Table 1). This study focused on probably the most important factor, chemical fertilizer, excluding other factors such as pesticides. The cost is directed at the health impact, excluding the complexity of environmental degradation and biodiversity loss. Since the costs of environmental depletion and degradation are in the range of 4% to 9% of gross national income [18], our result, which indicates that health costs were approximately 0.5% of the agriculture output, is acceptable. However, our result is also probably conservative, considering the complexities of assigning values to the coefficients of nutrient conversion and loss, contamination generation dose, emergy transformity, and the scarcity of local data.
In common with other studies, this research has a number of limitations, which need to be addressed in the future. Firstly, there is lack of the latest and regional coefficients, including rates of fertilizers’ transport and transformation (Cei), coefficients of life years for each contamination (Cdi), emergy consumption per capita (Cm), and emergy/economy ratios (Cg). Available Chinese and international data were applied in this study; the emergy consumption per capita and the emergy/money ratios were adjusted according to the material flow data, and others were considered as homogeneous. Some researchers have found the different effects of fertilizer composition, fertilizer amounts applied per crop, edaphic characteristics, and other factors influencing fertilization and losses in variable spatial scales [62,63,64]. For example, Sharpley found a significant relationship between phosphorus loss and soil phosphorus content in different areas (r2: 0.85 to 096) [62]. Clark et al. found that nitrogen fertilization and loss is determined by soil cation exchange capacity, regional temperature, and production responsiveness [64]. The variation of these parameters among regions and years is the main uncertainty of our study. As stated in Table 2, we recognized the variation of fertilization and losses due to edaphic factors, crops, and environmental factors in different areas. In spite of some spatial variations, the spatial disaggregation of the parameters in Table 2 was unavailable due to the data limitation in the current study. The life index or cost of living is also an important factor influencing the calculation of the health costs of fertilizer utilization [65]. In addition, the health cost of fertilizer utilization was affected by the contaminant concentration, exposure duration, the health condition of the people, the lifestyle of people, for example smoking or not, and other factors [66,67,68]. The complexity of the health cost is far from clearly understood. We recognize the changes of health costs because of these factors. The current result is a preliminary estimate of the health cost of fertilizer utilization in China, and caution should be taken in interpreting the results. More studies are needed to update and adjust the coefficients according to age and regional characteristics. Secondly, to calculate the health costs derived from fertilizer, this study focused on the utilization of fertilizer. Further studies should pay attention to fertilizer production, which can also impact the environment to a large degree. Thirdly, crop variety is not considered in the calculation. The rates of fertilization utilization and efficiency across the country also vary widely among crops [69], depending on local dietary habits and economic development. Further research should concern the health costs of different kinds of crops, not only cereal crops and cash crops, but also wheat, rice, and corn.
5. Conclusions
This study applied the method of emergy analysis combined with the dose-response method and established a monetization indicator to assess the health costs caused by fertilizer utilization. We calculated the health costs in China on national, regional, and provincial levels during the period from 1990 to 2012.
This study shows the temporal trend of health impacts caused by fertilizer utilization in the last two decades, as well as the spatial heterogeneity in different regions. From 1990 to 2012, the health costs increased 12 times (fixed-price of 2012), with an annual growth rate of 12.42%. In terms of the regional distribution of fertilizers’ health costs, the middle and lower reaches of the Yangtze River area and the Huang-Huai-Hai area had the largest contributions; 27.07% and 24.28% of the national cost in 2012, respectively. Regression analysis indicated a significant relationship between health costs, GDP per capita (ρ = 0.84 and p < 0.01), and crop-sown area (ρ = 0.59 and p < 0.01).
The results supply the basis for future agricultural production and fertilizer use in terms of policy-making.
Supplementary Materials
The following are available online at www.mdpi.com/2071-1050/9/9/1505/s1, Figure S1: Scheme of the estimation of health costs of fertilizer utilization, Table S1: Fertilizer intensity in China during the period from 1990 to 2012, Table S2: Emergy indicators for China, Table S3: Regression between health cost per sown area (PC), fertilizer application per sown area (PF), and Gross Domestic Product per capita (PG), Table S4: Regression between health cost (HC), fertilizer application amount (FA), and crop sown area (CA).
Acknowledgments
This study was provided by the National Science and Technology Program for the Twelfth Five Year Plan for Rural Construction Land Redevelopment (No. 2013BAJ13B02), the Non-profit Industry (Agriculture) Financial Program of Ministry of Agriculture of China (No. 200903001-1-4), and key projects in Jiangsu’s universities for Philosophy and Social Science (No. 2014ZDIXM001).
Author Contributions
Xianjin Huang and Hong Yang designed the research. Xiaoyan Shen and Li Lai conducted the analyses and drafted the manuscript. Yan Zhou contributed to figures. Hong Yang extensively revised the draft. All authors contributed to the writing and revising of the article. All authors approve the final version of the manuscript. The authors alone are responsible for the views expressed in this article and they do not necessarily represent the views, decisions, or policies of the institutions with which they are affiliated.
Conflicts of Interest
The authors declare no conflicts of interest.
References
- Skowronska, M.; Filipek, T. Life cycle assessment of fertilizers: A review. Int. Agrophys. 2014, 28, 101–110. [Google Scholar] [CrossRef]
- International Fertilizer Industry Association (IFA). Fertilizers, Climate Change and Enhancing Agricultural Productivity Sustainably, 1st ed.; Sirviö, H., Ed.; Task Force on Climate Change: Paris, France, 2009. [Google Scholar]
- Dawson, C.J.; Hilton, J. Fertiliser availability in a resource-limited world: Production and recycling of nitrogen and phosphorus. Food Policy 2011, 361, S14–S22. [Google Scholar] [CrossRef]
- Li, Y.; Zhang, W.; Ma, L.; Huang, G.; Oenema, O.; Zhang, F.; Dou, Z. An analysis of China’s fertilizer policies: Impacts on the industry, food security, and the environment. J. Environ. Qual. 2013, 42, 972–981. [Google Scholar] [CrossRef] [PubMed]
- Luan, J.; Qiu, H.; Jing, Y.; Liao, S.; Han, W. Decomposition of factors contributed to the increase of China’s chemical fertilizer use and projections for future fertilizer use in China. J. Nat. Res. 2013, 28, 1869–1878. [Google Scholar]
- Huang, J.; Hu, R.; Cao, J.; Rozelle, S. Training programs and in-the-field guidance to reduce China’s overuse of fertilizer without hurting profitability. J. Soil Water Conserv. 2008, 63, 165A–167A. [Google Scholar] [CrossRef]
- Fan, M.; Shen, J.; Yuan, L.; Jiang, R.; Chen, X.; Davies, W.J.; Zhang, F. Improving crop productivity and resource use efficiency to ensure food security and environmental quality in China. J. Exp. Bot. 2012, 63, 13–24. [Google Scholar] [CrossRef] [PubMed]
- Yang, H.; Xie, P.; Ni, L.; Flower, R.J. Pollution in the Yangtze. Science 2012, 337, 410. [Google Scholar] [CrossRef] [PubMed]
- Yang, H.; Flower, R.J.; Thompson, J.R. Pollution: China’s new leaders offer green hope. Nature 2013, 493, 163. [Google Scholar] [CrossRef] [PubMed]
- Chen, X.; Cui, Z.; Fan, M.; Vitousek, P.; Zhao, M.; Ma, W.; Wang, Z.; Zhang, W.; Yan, X.; Yang, J.; et al. Producing more grain with lower environmental costs. Nature 2014, 514, 486. [Google Scholar] [CrossRef] [PubMed]
- Stokstad, E. Air pollution ammonia pollution from farming may exact hefty health costs. Science 2014, 343, 238. [Google Scholar] [CrossRef] [PubMed]
- Fare, R.; Grosskopf, S.; Weber, W.L. Shadow prices and pollution costs in US agriculture. Ecol. Econ. 2006, 56, 89–103. [Google Scholar] [CrossRef]
- Pretty, J.N.; Brett, C.; Gee, D.; Hine, R.E.; Mason, C.F.; Morison, J.; Raven, H.; Rayment, M.D.; Van der Bijl, G. An assessment of the total external costs of UK agriculture. Agric. Syst. 2000, 65, 113–136. [Google Scholar] [CrossRef]
- Tegtmeier, E.M.; Duffy, M.D. External costs of agricultural production in the United States. Int. J. Agric. Sustain. 2004, 2, 1–20. [Google Scholar] [CrossRef]
- Sutton, M.A.; Howard, C.M.; Erisman, J.W.; Billen, G.; Bleeker, A.; Grennfelt, P.; van Grinsven, H.; Grizzetti, B. The European Nitrogen Assessment: Sources, Effects and Policy Perspectives; Cambridge University Press: Cambridge, UK, 2011; pp. 513–540. [Google Scholar]
- Houndekon, V.A.; De Groote, H.; Lomer, C. Health costs and externalities of pesticide use in the Sahel. Outlook Agric. 2006, 35, 25–31. [Google Scholar] [CrossRef]
- Good, A.G.; Beatty, P.H. Fertilizer nature: A tragedy of excess in the commons. PLoS Biol. 2011, 9, e1001124. [Google Scholar] [CrossRef] [PubMed]
- Norse, D.; Ju, X. Environmental costs of China’s food security. Agric. Ecosyst. Environ. 2015, 209, 5–14. [Google Scholar] [CrossRef]
- Zhu, Z.L.; Chen, D.L. Nitrogen fertilizer use in China-Contributions of food production, impacts on the environment and best management strategies. Nutr. Cycl. Agroecosyst. 2002, 63, 117–127. [Google Scholar] [CrossRef]
- Gu, B.; Ge, Y.; Ren, X.; Xu, W.; Luo, H.; Jiang, B.; Gu, J.; Chang, J. Atmospheric reactive nitrogen in China: Sources, recent trends, and damage costs. Environ. Sci. Technol. 2012, 46, 9420–9427. [Google Scholar] [CrossRef] [PubMed]
- Odum, H.T. Environmental Accounting: Emergy and Environmental Decision Making; John Wiley & Sons: New York, NY, USA, 1996. [Google Scholar]
- Amaral, L.P.; Martins, N.; Gouveia, J.B. A review of emergy theory, its application and latest developments. Renew. Sustain. Energy Rev. 2016, 54, 882–888. [Google Scholar] [CrossRef]
- National Bureau of Statistics of China. China Statistical Yearbook; China Statistics Press: Beijing, China, 1991–2013. (In Chinese)
- China Agricultural Yearbook Editorial Committee. China Agricultural Yearbook; China Agriculture Press: Beijing, China, 1991–2013. (In Chinese) [Google Scholar]
- Department of Energy Statistics, National Bureau of Statistics of China. China Energy Statistical Yearbook; China Statistics Press: Beijing, China, 1991–2013. (In Chinese)
- Xu, M.; Liang, G.; Zhang, F. Evolution of Soil Fertility in China; Chinese Agricultural Science and Technology Press: Beijing, China, 2006; pp. 1–19. (In Chinese) [Google Scholar]
- Odum, H.T.; Brown, M.T.; Brandt-Williams, S. Folio 1: Introduction and global budget. In Handbook of Emergy Evaluation: A Compendium of Data for Emergy Computation Issued in a Series of Folios; Center for Environmental Policy, University of Florida: Gainesville, FL, USA, 2000; pp. 2–3. [Google Scholar]
- Cohen, M.J.; Brown, M.T.; Shepherd, K.D. Estimating the environmental costs of soil erosion at multiple scales in Kenya using emergy synthesis. Agric. Ecosyst. Environ. 2006, 114, 249–269. [Google Scholar] [CrossRef]
- Andersson, A.; Siman, G. Levels of Cd and some other trace-elements in soils and crops as influenced by lime and fertilizer level. Acta Agric. Scand. 1991, 41, 3–11. [Google Scholar] [CrossRef]
- Mclaughlin, M.J.; Maier, N.A.; Freeman, K.; Tiller, K.G.; Williams, C.J.; Smart, M.K. Effect of potassic and phosphatic fertilizer type, fertilizer cd concentration and zinc rate on cadmium uptake by potatoes. Fertil. Res. 1995, 40, 63–70. [Google Scholar] [CrossRef]
- Yang, H.; Yi, C.; Xie, P.; Xing, Y.; Ni, L. Sedimentation rates, nitrogen and phosphorus retentions in the largest urban Lake Donghu, China. J. Radioanal. Nucl. Chem. 2005, 267, 205–208. [Google Scholar] [CrossRef]
- Crutzen, P.J. Atmospheric interactions-homogeneous gas reactions of C, N, and S containing compounds. In The Major Biogeochemical Cycles and Their Interactions; Bolin, B., Cook, R.B., Eds.; Wiley & Sons: Chichester, UK, 1983; pp. 67–112. [Google Scholar]
- Bouwman, A.F.; Boumans, L.; Batjes, N.H. Emissions of N2O and NO from fertilized fields: Summary of available measurement data. Glob. Biogeochem. Cycles 2002, 16. [Google Scholar] [CrossRef]
- Xiong, Z.Q.; Xing, G.X.; Zhu, Z.L. Nitrous oxide and methane emissions as affected by water, soil and nitrogen. Pedosphere 2007, 17, 146–155. [Google Scholar] [CrossRef]
- Lu, R.K.; Shi, Z.Y.; Xiong, L.M. Cadmium contents of rock phosphates and phosphate fertilizers of China and their effects on ecological environment. Acta Pedol. Sin. 1992, 29, 150–156. [Google Scholar]
- Legg, J.O.; Meisinger, J.J. Soil nitrogen budgets. In Nitrogen in Agricultural Soils; Stevenson, F.J., Ed.; American Society of Agronomy: Madison, WI, USA, 1982; pp. 503–566. [Google Scholar]
- Cui, Z.; Chen, X.; Zhang, F. Development of regional nitrogen rate guidelines for intensive cropping systems in China. Agron. J. 2013, 105, 1411–1416. [Google Scholar] [CrossRef]
- Li, Z.; Wang, Q.; Chen, J. Review of nitrogen cycle in agricultural ecosystem. Soil Environ. 2002, 11, 417–421. (In Chinese) [Google Scholar]
- Ju, X.T.; Xing, G.X.; Chen, X.P.; Zhang, S.L.; Zhang, L.J.; Liu, X.J.; Cui, Z.L.; Yin, B.; Christie, P.; Zhu, Z.L.; et al. Reducing environmental risk by improving N management in intensive Chinese agricultural systems. Proc. Natl. Acad. Sci. USA 2009, 106, 3041–3046. [Google Scholar] [CrossRef] [PubMed] [Green Version]
- Gao, M.; Qiu, J.; Li, C.; Wang, L.; Li, H.; Gao, C. Modeling nitrogen loading from a watershed consisting of cropland and livestock farms in China using Manure-DNDC. Agric. Ecosyst. Environ. 2014, 185, 88–98. [Google Scholar] [CrossRef]
- Stauffer, J. Water Crisis: Finding the Right Solutions; Science Press: Beijing, China, 2000; pp. 20–40. (In Chinese) [Google Scholar]
- Wei, H.P. Environmental System Engineering; Tongji University Press: Shanghai, China, 1993; pp. 183–192. (In Chinese) [Google Scholar]
- Si, Y.B.; Wang, S.Q.; Chen, H.M. Water eutrophication and losses of nitrogen and phosphates in farmland. Soils 2000, 32, 188–193. (In Chinese) [Google Scholar] [CrossRef]
- Chen, T.; Zeng, X.; Hu, Q. Utilization efficiency of chemical fertilizers among different counties of China. Acta Geogr. Sin. 2002, 57, 531–538. [Google Scholar]
- Anand, S.; Hanson, K. Disability-adjusted life years: A critical review. J. Health Econ. 1997, 16, 685–702. [Google Scholar] [CrossRef]
- Goedkoop, M.; Spriensma, R. The Eco-Indicator 99: A Damage Qriented Method for Life Cycle Impact Assessment: Methodology Report, 3rd ed.; PRé Consultants, B.V.: Amersfoort, The Netherlands, 2001. [Google Scholar]
- Szargut, J.; Morris, D.R.; Steward, F.R. Exergy Analysis of Thermal, Chemical, and Metallurgical Processes; Hemisphere Publishing: New York, NY, USA, 1988. [Google Scholar]
- Li, S.C.; Fu, X.F.; Zheng, D. Emergy analysis for evaluating sustainability of Chinese economy. J. Nat. Res. 2001, 16, 297–304. [Google Scholar]
- Jiang, M.M.; Zhou, J.B.; Chen, B.; Chen, G.Q. Emergy-based ecological account for the Chinese economy in 2004. Commu. Nonlinear Sci. Numer. Simul. 2008, 13, 2337–2356. [Google Scholar] [CrossRef]
- Li, J.K.; Lin, B.; Liang, G.Q.; Shen, G.Q. Prospect of consumption of chemical fertilizer in China. Plant Nutr. Fertil. Sci. 2001, 7, 1–10. (In Chinese) [Google Scholar]
- Alexandratos, N.; Bruinsma, J. World Agriculture towards 2030/2050: The 2012 Revision; ESA Working Paper No. 12-03; FAO: Rome, Italy, 2012; pp. 126–131. Available online: http://www.fao.org/3/a-ap106e.pdf (accessed on 16 March 2016).
- Zheng, W. Regional Difference Analysis of China’s Fertilizer Application and Effect on Grain Production. Master’s Thesis, China Agricultural University, Beijing, China, June 2005. (In Chinese). [Google Scholar]
- Yang, H. China must continue the momentum of green law. Nature 2014, 509, 535. [Google Scholar] [CrossRef] [PubMed]
- Yang, H.; Wright, J.A.; Gundry, S.W. Improving access to sanitation in China. Nature 2012, 488, 32. [Google Scholar] [CrossRef] [PubMed]
- Yang, H.; Flower, R.J.; Thompson, J.R. Sustaining China’s water resources. Science 2013, 339, 141. [Google Scholar] [CrossRef] [PubMed]
- Pizzol, M.; Smart, J.C.; Thomsen, M. External costs of cadmium emissions to soil: A drawback of phosphorus fertilizers. J. Clean. Prod. 2014, 84, 475–483. [Google Scholar] [CrossRef]
- Lai, L.; Huang, X.; Yang, H.; Chuai, X.; Zhang, M.; Zhong, T.; Chen, Z.; Chen, Y.; Wang, X.; Thompson, J.R. Carbon emissions from land-use change and management in China between 1990 and 2010. Sci. Adv. 2016, 2, e1601063. [Google Scholar] [CrossRef] [PubMed]
- Yang, H. China’s soil plan needs strong support. Nature 2016, 536, 375. [Google Scholar] [CrossRef] [PubMed]
- Myyra, S.; Scrimgeour, F.G. Farmland Prices in New Zealand and Finland. In Proceedings of the International Congress on Modelling and Simulation (MODSIM07), Christchurch, New Zealand, 10–13 December 2007; pp. 1061–1067. [Google Scholar]
- Yang, H.; Huang, X.; Thompson, J.R.; Flower, R.J. Enforcement key to China’s environment. Science 2015, 347, 834–835. [Google Scholar] [CrossRef] [PubMed]
- Zhang, M.; Huang, X.; Chuai, X.; Yang, H.; Lai, L.; Tan, J. Impact of land use type conversion on carbon storage in terrestrial ecosystems of China: A spatial-temporal perspective. Sci. Rep. 2015, 5, 10233. [Google Scholar] [CrossRef] [PubMed]
- Sharpley, A.N. Soil phosphorus dynamics: agronomic and environmental impacts. Ecol. Eng. 1995, 5, 261–279. [Google Scholar] [CrossRef]
- Baligar, V.; Fageria, N.; He, Z. Nutrient use efficiency in plants. Commun. Soil Sci. Plant Anal. 2001, 32, 921–950. [Google Scholar] [CrossRef]
- Clark, C.M.; Cleland, E.E.; Collins, S.L.; Fargione, J.E.; Gough, L.; Gross, K.L.; Pennings, S.C.; Suding, K.N.; Grace, J.B. Environmental and plant community determinants of species loss following nitrogen enrichment. Ecol. Lett. 2007, 10, 596–607. [Google Scholar] [CrossRef] [PubMed]
- Diener, E.; Suh, E. Measuring quality of life: Economic, social, and subjective indicators. Soc. Indic. Res. 1997, 40, 189–216. [Google Scholar] [CrossRef]
- Vesilind, P.A.; Peirce, J.J.; Weiner, R.F. Environmental Pollution and Control; Elsevier: Oxford, UK, 2013. [Google Scholar]
- Loehr, R. Pollution Control for Agriculture; Elsevier: London, UK, 2012. [Google Scholar]
- Ghosh, D.; Deb, A.; Bera, S.; Sengupta, R.; Patra, K.K. Measurement of natural radioactivity in chemical fertilizer and agricultural soil: Evidence of high alpha activity. Environ. Geochem. Health 2008, 30, 79–86. [Google Scholar] [CrossRef] [PubMed]
- Ju, X.T.; Liu, X.J.; Zhang, F.S.; Roelcke, M. Nitrogen fertilization, soil nitrate accumulation, and policy recommendations in several agricultural regions of China. AMBIO 2004, 33, 300–305. [Google Scholar] [CrossRef] [PubMed]
Figure 1.
(a) Health costs and (b) costs per sown area caused by fertilizer utilization in 30 provinces in China in 2012. Note: China was divided into six zones. The method of partition and the detail values of 30 provinces were shown in Table 4. For the provinces in each zone, see Table 4. Due to the data limitation, Hong Kong, Macao, Taiwan, and Tibet were excluded. The maps were generated using ArcGIS 10.0.
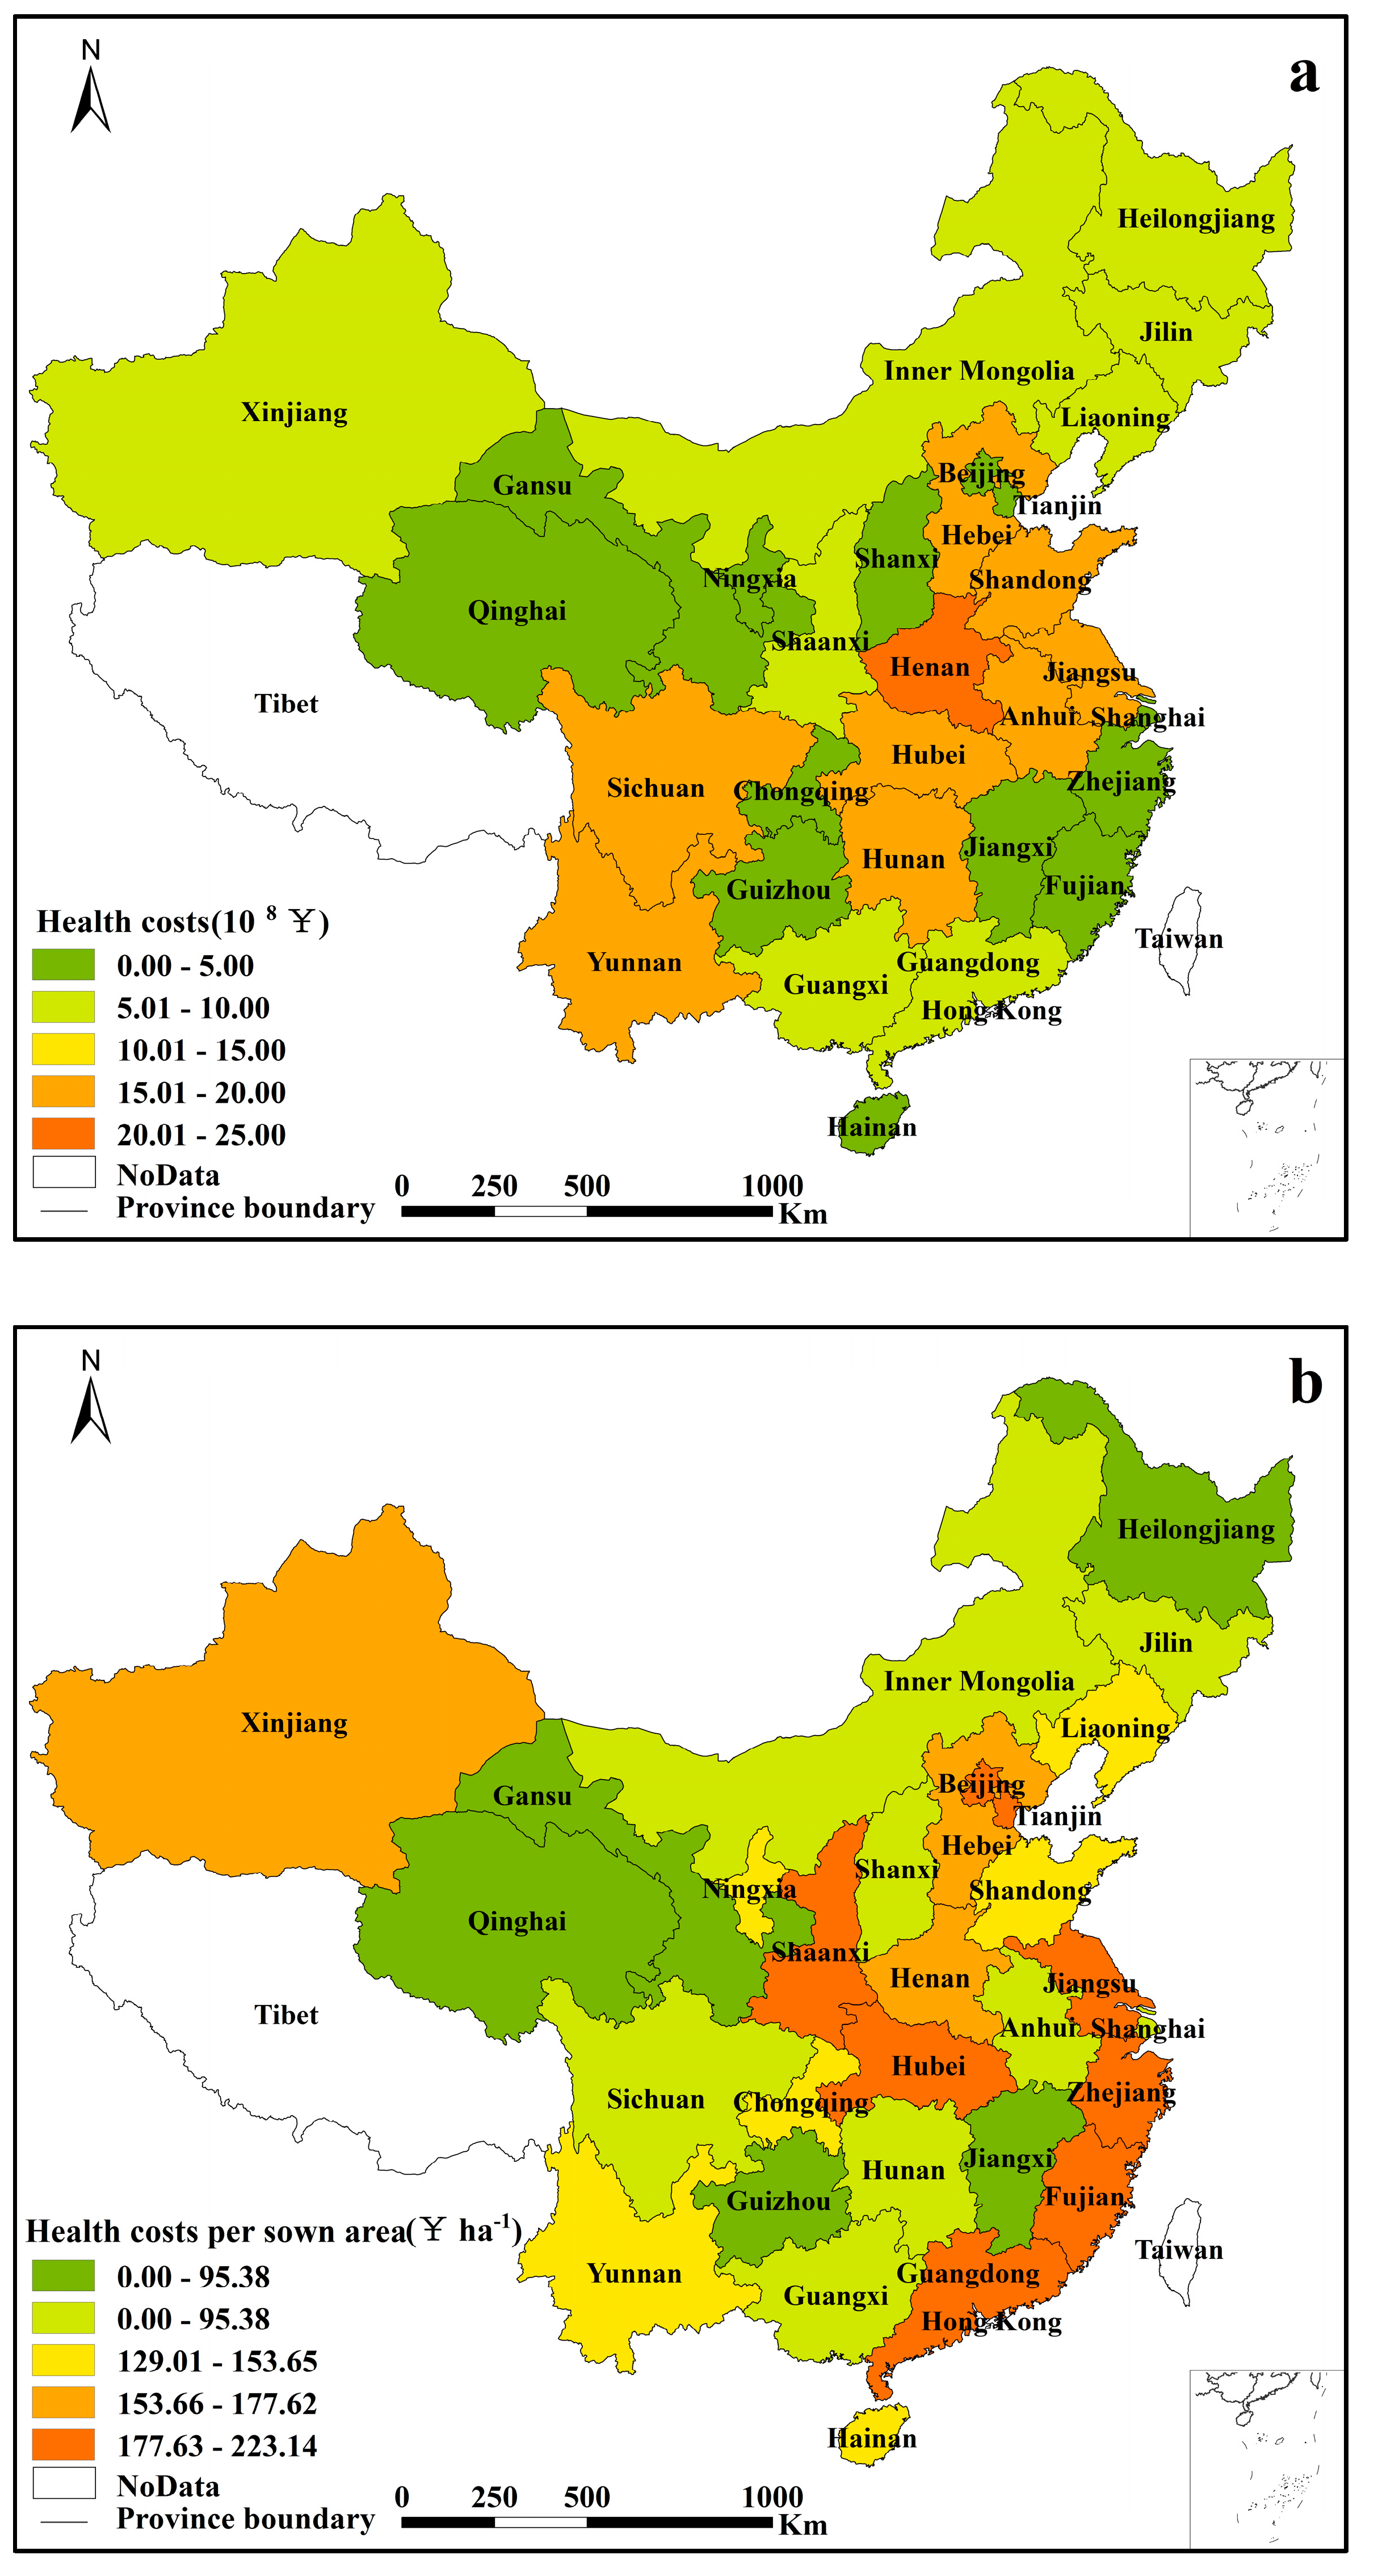
Figure 2.
Annual growth rates of (a) health costs and (b) sown areas in 30 studied provinces in China during the period from 1990 to 2012. Note: China was divided into six zones (Table 4). Due to the data limitation, Hong Kong, Macao, Taiwan, and Tibet were excluded. The maps were generated using ArcGIS 10.0.


Table 1.
The environmental and health costs in agriculture production.
| Year | Country/Region | Content | Cost Value | Source |
|---|---|---|---|---|
| 1990–1996 | U.K. | Environmental costs of agriculture | US $1.663–5.655 billion | [13] |
| 2004 | U.S. | Environmental costs of crop production | US $4.969–16.151 billion | [14] |
| 2011 | European Union 27 countries | Environmental costs of nitrogen overuse | US $79–362 billion | [15] |
| 2006 | Sahel | Health costs of pesticide | US $1.70 per hectare | [16] |
| 2020 | China | Environmental costs of nitrogen overuse | US $5 billion | [17] |
| 2015 | China | Environmental costs of food production | US $32–67 billion | [18] |
| 2002 | China | Environmental costs of fertilizer nitrogen emissions | US $57 billion | [19] |
| 2008 | China | Health costs of agriculture nitrogen emissions | US $10–34 billion | [20] |
Table 2.
The transport and transformation rates of fertilizers (percentages).
| Fertilizer Type | Use by Crops | Spread to Atmosphere | Residual in Soil | Underground Leaching | Surface Runoff | Data Sources |
|---|---|---|---|---|---|---|
| Nitrogen | 35 (20–50) a | 20 (10–30) | 35 (30–40) | 0.5 | 10 | [36,37,38,39,40] |
| Phosphate | 11 (7–15) | 5 | 65 (55–75) | 1 | 7.5 (5–10) | [41,42,43] |
Note: a Application efficiency changes according to the fertilizer intensity. We adjusted the coefficient of ‘use by crops’ for nitrogen using relevant domestic empirical data [44], which is 27.39% for high intensity area (≥30 ton km−2), 36.04% for middle intensity area (20–30 ton km−2), and 39.8% for low intensity area (≤20 ton km−2). Due to the data limitation, the effects of edaphic characteristics, crops, and environmental factors on fertilization and losses were unavailable in this research.
Table 3.
Emergy accounting of health costs caused by fertilizer utilization in China in 2012.
| Categories | Impact Dose (104 t) | DALYs/kg, Cdi (kg−1 a) | DALYs (a) | Emergy (sej) | Macro-Economic Value (Yuan, ¥) |
|---|---|---|---|---|---|
| Atmosphere impact | 9.74 × 10⁴ | 1.63 × 10²¹ | 3.71 × 10⁹ | ||
| NH3 | 145.71 | 5.10 × 10⁻⁵ | 7.43 × 10⁴ | 1.25 × 10²¹ | 2.83 × 10⁹ |
| N2O | 25.27 | 4.00 × 10⁻⁶ | 1.01 × 10³ | 1.70 × 10¹⁹ | 3.85 × 10⁷ |
| NOx | 32.57 | 6.79 × 10⁻⁵ | 2.21 × 10⁴ | 3.71 × 10²⁰ | 8.43 × 10⁸ |
| Soil impact | 2.52 × 10⁵ | 4.23 × 10²¹ | 9.60 × 10⁹ | ||
| Nitrate | 372.58 | 4.90 × 10⁻⁵ | 1.83 × 10⁵ | 3.06 × 10²¹ | 6.96 × 10⁹ |
| Sulphate | 71.64 | 1.70 × 10⁻⁶ | 1.22 × 10³ | 2.04 × 10¹⁹ | 4.64 × 10⁷ |
| Cd | 11.19 | 6.09 × 10⁻⁴ | 6.81 × 10⁴ | 1.14 × 10²¹ | 2.60 × 10⁹ |
| Water impact | 2.53 × 10⁵ | 4.25 × 10²¹ | 9.65 × 10⁹ | ||
| NO3-N | 723.57 | 3.05 × 10⁻⁵ | 2.21 × 10⁵ | 3.70 × 10²¹ | 8.41 × 10⁹ |
| NH4-N | 175.36 | 1.67 × 10⁻⁵ | 2.93 × 10⁴ | 4.91 × 10²⁰ | 1.12 × 10⁹ |
| Phosphate | 85.77 | 3.60 × 10⁻⁶ | 3.09 × 10³ | 5.18 × 10²⁰ | 1.18 × 10⁸ |
| Total | 6.02 × 10⁵ | 1.01 × 10²² | 2.30 × 10¹⁰ | ||
Table 4.
Regional health costs of fertilizer utilization in China from selected years (fixed price of 2012, 108 Yuan).
Table 4.
Regional health costs of fertilizer utilization in China from selected years (fixed price of 2012, 108 Yuan).
| Region | Year | 1990 | 1995 | 2000 | 2005 | 2010 | 2012 |
|---|---|---|---|---|---|---|---|
| Northeast | 1.57 | 3.04 | 4.60 | 7.87 | 16.98 | 21.31 | |
| Percentage | 8.93% | 8.73% | 8.29% | 8.06% | 8.93% | 9.29% | |
| Heilongjiang | 0.42 | 0.95 | 1.45 | 2.74 | 6.83 | 8.93 | |
| Jilin | 0.54 | 0.98 | 1.53 | 2.47 | 4.96 | 6.22 | |
| Liaoning | 0.60 | 1.11 | 1.62 | 2.65 | 5.19 | 6.16 | |
| Huang-Huai-Hai | 4.27 | 8.93 | 14.86 | 26.23 | 47.36 | 55.74 | |
| Percentage | 24.36% | 25.66% | 26.78% | 26.86% | 24.91% | 24.28% | |
| Beijing | 0.10 | 0.20 | 0.25 | 0.32 | 0.51 | 0.57 | |
| Tianjin | 0.05 | 0.13 | 0.23 | 0.50 | 0.95 | 1.07 | |
| Shandong | 1.62 | 3.22 | 5.05 | 8.23 | 12.99 | 15.06 | |
| Hebei | 0.99 | 2.21 | 3.77 | 6.75 | 12.23 | 14.33 | |
| Henan | 1.52 | 3.17 | 5.57 | 10.42 | 20.67 | 24.71 | |
| Northwest | 1.71 | 3.80 | 6.48 | 12.62 | 28.37 | 35.91 | |
| Percentage | 9.76% | 10.93% | 11.67% | 12.93% | 14.92% | 15.64% | |
| Shaanxi | 0.51 | 1.13 | 1.82 | 3.23 | 6.75 | 8.90 | |
| Shanxi | 0.38 | 0.73 | 1.14 | 1.88 | 3.41 | 3.92 | |
| Inner Mongolia | 0.22 | 0.56 | 1.11 | 2.65 | 6.60 | 8.04 | |
| Ningxia | 0.08 | 0.18 | 0.34 | 0.59 | 1.38 | 1.68 | |
| Gansu | 0.24 | 0.49 | 0.85 | 1.65 | 3.17 | 3.91 | |
| Qinghai | 0.03 | 0.06 | 0.09 | 0.15 | 0.28 | 0.36 | |
| Xinjiang | 0.24 | 0.66 | 1.14 | 2.47 | 6.78 | 9.11 | |
| Middle and lower reaches of Yangtze River | 5.80 | 11.20 | 16.91 | 28.62 | 52.98 | 62.14 | |
| Percentage | 33.10% | 32.17% | 30.46% | 29.30% | 27.87% | 27.07% | |
| Jiangsu | 1.59 | 2.97 | 4.78 | 7.83 | 14.13 | 15.79 | |
| Anhui | 0.99 | 1.86 | 3.08 | 4.90 | 9.00 | 10.83 | |
| Hubei | 1.00 | 2.26 | 3.50 | 6.41 | 12.98 | 15.57 | |
| Hunan | 0.82 | 1.63 | 2.46 | 4.50 | 8.62 | 10.40 | |
| Shanghai | 0.19 | 0.30 | 0.35 | 0.37 | 0.47 | 0.48 | |
| Zhejiang | 0.71 | 1.12 | 1.47 | 2.37 | 4.08 | 4.71 | |
| Jiangxi | 0.51 | 1.05 | 1.26 | 2.24 | 3.71 | 4.36 | |
| Southwest | 2.15 | 4.17 | 7.12 | 12.80 | 25.94 | 32.08 | |
| Percentage | 12.25% | 11.98% | 12.82% | 13.11% | 13.64% | 13.97% | |
| Sichuan | 1.48 | 2.66 | 3.19 | 5.41 | 10.61 | 12.46 | |
| Chongqing | —— a | —— a | 1.19 | 2.07 | 4.00 | 4.81 | |
| Yunnan | 0.39 | 0.88 | 1.67 | 3.44 | 7.71 | 10.02 | |
| Guizhou | 0.28 | 0.63 | 1.06 | 1.88 | 3.61 | 4.79 | |
| Southern | 2.03 | 3.66 | 5.54 | 9.52 | 18.48 | 22.37 | |
| Percentage | 11.60% | 10.52% | 9.98% | 9.75% | 9.72% | 9.75% | |
| Guangdong | 1.00 | 1.69 | 2.36 | 3.93 | 7.74 | 9.40 | |
| Guangxi | 0.49 | 0.96 | 1.50 | 2.84 | 5.80 | 7.12 | |
| Fujian | 0.47 | 0.89 | 1.42 | 2.24 | 3.88 | 4.54 | |
| Hainan | 0.07 | 0.13 | 0.26 | 0.51 | 1.07 | 1.31 | |
| Total | 17.53 | 34.80 | 55.51 | 97.66 | 190.11 | 229.56 |
Note: a Chongqing was not set up in 1990 and 1995.
© 2017 by the authors. Licensee MDPI, Basel, Switzerland. This article is an open access article distributed under the terms and conditions of the Creative Commons Attribution (CC BY) license (http://creativecommons.org/licenses/by/4.0/).
Share and Cite
MDPI and ACS Style
Yang, H.; Shen, X.; Lai, L.; Huang, X.; Zhou, Y. Spatio-Temporal Variations of Health Costs Caused by Chemical Fertilizer Utilization in China from 1990 to 2012. Sustainability 2017, 9, 1505. https://doi.org/10.3390/su9091505
AMA Style
Yang H, Shen X, Lai L, Huang X, Zhou Y. Spatio-Temporal Variations of Health Costs Caused by Chemical Fertilizer Utilization in China from 1990 to 2012. Sustainability. 2017; 9(9):1505. https://doi.org/10.3390/su9091505
Chicago/Turabian StyleYang, Hong, Xiaoyan Shen, Li Lai, Xianjin Huang, and Yan Zhou. 2017. "Spatio-Temporal Variations of Health Costs Caused by Chemical Fertilizer Utilization in China from 1990 to 2012" Sustainability 9, no. 9: 1505. https://doi.org/10.3390/su9091505
Note that from the first issue of 2016, this journal uses article numbers instead of page numbers. See further details here.