Beer and Organic Labels: Do Belgian Consumers Care?


1
Faculty of Economics and Business, Katholieke Universiteit Leuven, Campus Brussels, Warmoesberg 26, 1000 Brussels, Belgium
2
LICOS Centre for Institutions and Economic Performance, Katholieke Universiteit Leuven, Campus Leuven, Waaistraat 6/bus 3511, 3000 Leuven, Belgium
*
Author to whom correspondence should be addressed.
Sustainability 2017, 9(9), 1509; https://doi.org/10.3390/su9091509
Submission received: 9 June 2017
/
Revised: 18 August 2017
/
Accepted: 20 August 2017
/
Published: 24 August 2017
Abstract
:We investigate whether beer drinkers are willing to pay a price premium for organic beer compared to conventional beer. Moreover, we identify subgroups of consumers with different preference patterns by investigating whether specific personal characteristics of the purchasers have an influence on this willingness-to-pay. Specifically, results are reported from a survey including a stated choice experiment of consumer decisions concerning beer purchases in Flanders (Belgium), focusing on organic labels. A non-probabilistic sampling method was used over the Internet and 334 responses were useable for the empirical analysis. Each respondent was asked to choose their preferred beer from a series of nine choice cards describing three different beer varieties. In this respect, we created a two-block design, each consisting of nine choice cards. Each respondent was randomly presented with one of the two blocks, so that an equal distribution of the blocks could be obtained. Overall, we find that our sample is statistically indifferent between a beer with an organic label and a similar beer without an organic label. This is in line with previous research that stated that consumers are unwilling to pay high price premiums for organic vice products, such as beer. We find no statistically different preferences for male or female respondents, or for members or non-members of nature protection organizations. However, we find a significant difference (p-value = 0.029) between primary beer shoppers who have a zero willingness-to-pay (WTP) for organic beer compared to similar non-organic beer and the reference group that has a negative WTP of 14 Euro per 1.5 L for organic beer. In addition, the WTP for beer drinkers older than 40 (negative WTP of 22 Euro per 1.5 L) and the WTP for frequent beer drinkers (zero WTP) are statistically different from the reference group (p-value = 0.019 and 0.000 respectively).
Classification:
D12 consumer economics: empirical analysis; Q18 agricultural policy; food policy; Q5 environmental economics1. Introduction
It is argued that consumers are increasingly interested in environmental and sustainability criteria when buying food products. These socially conscious consumers are not only actively seeking sustainable consumption options, they are also willing to pay more for their preferences such as fair trade and environment friendly food products. In this respect, research shows that consumers often perceived organic food products as healthier, tastier and better for the environment than conventional food [1,2]. When evaluating a product, consumers can use the information that is available on the packaging to evaluate the sustainability of the product [3,4]. This information includes the country of production, prices, ingredients but also organic labels. Producers can voluntarily decide whether to participate in labeling schemes or not and whether they want to incur the associated certification costs. However, to evaluate the added value of an organic label on their product, producers need to understand consumers’ preferences with regard to products with an organic label. In this research, we use survey data to investigate whether Belgian consumers care about organic labels when buying beer, since beer is a product that has only been studied in a limited number of settings [5,6]. Therefore, we estimate consumers’ willingness-to-pay for beer with an organic label and look for groups of consumers with different preference patterns.
There is a clear consensus that Belgium produces the most diverse assortment of beer varieties in the world today. According to Webb and Beaumont [7], Belgium produced in 2012 “over 400 discernably different styles of beer”. Although Belgium is “only” the seventh largest beer producer in the European Union in terms of total volume, it ranks first in the world when viewed in per capita terms [8]. In 2015, Belgium had 199 breweries, producing nearly 2500 different beer varieties. Belgium is a mature beer market, where smaller quantities of premium-priced beer (e.g., higher quality beer sold at higher prices) instead of larger quantities of low-prized beer are consumed [9,10]. In 2015, Belgian beer consumption reached 71 L per capita. As beer is such an important product for Belgium, we assume that the average Belgian citizen—whether beer lover or not—is sufficiently knowledgeable to answer questions related to his beer consumption and preferences.
Looking at the market for organic products in Belgium, we find that sales of organic products are steadily increasing with a growth of 34% between 2010 and 2014 [11]. This growth is mainly driven by an increase in the average number of organic products that are purchased per shopping trip since the total number of organic consumers is remaining virtually constant. Overall, some 88% of Belgian consumers bought at least one organic product at least once in 2014, but only 7% buys at least one organic product on a weekly basis. The most frequently bought organic products are vegetables (bought by 60% of households), fruit (43%) and dairy products (35%). Only 3% of the total assortment of organic food products bought by Belgian consumers consists of organic wine or beer [11].
2. Deriving Testable Hypotheses from the Literature
In this section, we briefly discuss the existing literature on consumer preferences for beer and characteristics of demand for organic food products. This overview allows us to derive several hypotheses that can be tested for organic beer in Flanders (Belgium).
2.1. Existing Research on Beer Consumption Preferences
To study the factors that determine beer consumption in Belgium, and specifically the role of organic labels in this market, it is important to investigate past research that has been conducted on beer consumption preferences. Colen and Swinnen [12] and Piron and Poelmans [10] provided a recent overview of the existing research on this topic. Most relevant to our study are the studies focusing on the influence of respondent characteristics as well as beer characteristics on beer consumption and beer purchasing behavior (e.g., [12,13]). This past research showed that several personal characteristics such as age, gender and religion, influence the consumption of beer. Typically, men are more likely to drink beer than women are and beer is more popular with consumers younger than 45 compared to those over 45 [14]. In addition, product characteristics such as color, alcohol content and price have been found to play an important role when consumers choose which beer to buy and/or consume.
Very few studies have focused on consumption preferences concerning organic beer. Caporale and Monteleone [5] found that information revealing the use of “organic technology” in the beer production process (i.e., beer produced with organic barley and hops) had a positive impact on Italian consumers liking the sensory experience of a particular beer type. More recently, Hasselbach and Roosen [6] used a choice experiment to analyze consumer preferences for local and organic food products for Bavaria (Germany). They investigated preferences for bread, milk and beer by using four product attributes (price, local label, organic label and brand). The respondents in this study were not willing to pay more for beer with the EU organic label unless the beer was also produced locally. The estimated willingness-to-pay for generic local and organic beer was 1.27 Euro per 0.5-L bottle compared to an otherwise similar beer without such a general label. In addition, respondents were willing to pay 0.7 Euro more per 0.5-L bottle for beer with the specific “Organic certified Bavaria” label compared to a similar beer without such a specific label, which in principle conveys the same information to consumers as the generic label for locally and organically produced beer.
2.2. Characteristics of Demand for Organic Food Products
Several motivations for purchasing organic food products have been found in the literature, such as reduced environmental impact [15,16] or improved animal welfare [15], as well as better taste [15,16,17,18] and health considerations [18,19,20] . The first group of motivations can be labeled as altruistic motivations since they reflect consumers’ desire to contribute to the common good, while the second group can be categorized as egoistic motivations [21]. This also reflects the typical economic distinction between external and private considerations [22].
Moreover, the majority of the existing studies show that several respondent characteristics can influence the respondents’ attitude with regard to their marginal willingness-to-pay (WTP) for organic food products. Note that in economics the demand for a particular good is defined as the marginal willingness-to-pay for this good keeping all else constant [22]. Moreover, past studies have shown that attitudes and purchase intentions are positively correlated with actual purchase behavior [23].
Several studies have been conducted on the impact of gender when buying organic food. Women seem to have more positive attitudes towards organic food and are more likely to purchase and consume organic food than men [17,23,24,25,26,27,28,29]. With regard to the effect of age, the existing research delivers ambiguous results as both positive and negative attitudes have been found. According to Aertsens et al. [29], age does not seem to have an influence in shaping organic food consumption, or only slightly. Other research shows that younger people have a more positive attitude towards organic products than older people and are willing to pay a price premium although their purchasing frequency is rather low [2,30,31]. This allows us to formulate a first hypothesis:
Hypothesis 1.
Female consumers have a higher willingness-to-pay for organic beer than male consumers.
According to other research [18,20,32], there is a perceived link between healthy food and organic food, which may lead to people willing to pay a price premium for organic food. Van Doorn and Verhoef [33] show that the WTP for organic food products is different for vice versus virtue food products. They define vice products as products that provide immediate pleasure, but have negative long-term outcomes (such as addictions and obesity)—i.e., “unhealthy” goods—while virtue products are less appealing in the short term, but have less negative long term consequences—i.e., “healthy” goods. They found that in vice food categories, organic claims are associated with lower quality, which seems to be only partly compensated by higher prosocial benefits. The lower-quality perceptions translate into a decreased consumer WTP. For virtue goods, the perceived health benefits tend to reinforce the value of prosocial benefits leading to higher consumer WTP. Rousseau [4] found similar results. She states that the perceived link between healthy food and organic food is important to consumers and that the impact of this “organic is healthy” idea is less prominent when it comes to “unhealthy” food. She found that the majority of respondents were not interested in the presence of an organic label when choosing chocolate and that respondents were not willing to pay a premium for organic chocolate compared to conventional chocolate. Thus, we can formulate a second hypothesis:
Hypothesis 2.
Consumers are, on average, not willing to pay a price premium for organic beer compared to conventional beer.
Choice experiments that ask about the WTP for specific products often give an overvaluation of the WTP. This effect is called the hypothetical bias [34,35] and, in the context of environmental surveys, the social desirability bias [36]. The hypothetical bias arises because respondents do not face the financial consequences from their consumption choices indicated in a survey, which makes the cost factor less salient and thus tends to bias the WTP estimates upwards. The social desirability bias is to present oneself as a green and socially aware consumer. In a survey, it is essentially costless to present a socially desirable attitude, which again leads to a possible upward bias in WTP estimates. A choice experiment setting is less susceptible to the social desirability bias than surveys that include direct questions since all beer characteristics are explicitly and simultaneously presented to respondents. Moreover, we explicitly reminded respondents of their budget constraint to make the cost attribute more salient [37]. Finally, familiarity with and knowledge of the product is found to reduce this bias [34]. For instance, primary shoppers (those that are used to doing the shopping in the household and are considered “more knowledgeable people” when it comes down to food) tend to be more familiar with grocery products and seem to be less likely to overestimate their WTP in choice experiments. Rousseau [4] showed that those responsible for the daily food purchases (i.e., the primary shoppers) have a lower WTP for labeled products then secondary shoppers. According to the existing research, these primary shoppers are mainly women when it comes to grocery shopping, except when it concerns married couples with a female spouse who has a job outside the house [38]. In general, our sample was familiar with beer and beer consumption and thus we claim that they revealed their preferences more truthfully. However, familiarity with products implies other possible biases such as habitat formation and the use of choice heuristics [39]. This paragraph allows us to formulate the following hypothesis:
Hypothesis 3.
Primary beer shoppers have a lower willingness-to-pay for organic beer than secondary shoppers.
Consumers’ attitudes towards protecting the environment also influenced their attitudes towards and their willingness to buy organic food [2,29]. For instance, Gil et al. [40] showed that Spanish consumers who were concerned about environmental degradation were most likely to buy organic food and were willing to pay a high premium. As another example, Rousseau [4] showed that Belgian respondents who were less likely to pay for organic and fairtrade labels were less likely to be members of nature protection organizations. This can be summarized in a fourth hypothesis:
Hypothesis 4.
Members of nature protection organizations have a higher willingness-to-pay for organic beer than non-members.
The main objective of this research is to test these four hypotheses for beer consumers in Flanders (Belgium). Hereby, we take into account that beer can be categorized as a vice product.
We also test for differences between younger and older respondents and between frequent and infrequent beer drinkers.
3. Data Collection and Methods
3.1. Survey Design
Our survey contained four parts: a first part dealt with our respondents’ personal characteristics; a second part involved general questions on the respondents’ preferences regarding beer consumption, a third part consisted of a choice experiment and a fourth part related to organic consumption. To avoid priming effects, all questions related to organic consumption were included after the choice experiment.
A discrete choice experiment (DCE) is a quantitative technique used for eliciting individual preferences, developed by Louviere and Hensher [41] and Louviere and Woodworth [42]. It is especially suited to deal with multidimensional choices and is based on random utility theory [43]. According to random utility theory, the utility that individuals receive from consuming a particular good consists of an observable part and an unobservable, random, part. In a choice experiment, a hypothetical marketed good (here “a particular beer variety”) is described in terms of its characteristics and the levels that these characteristics take. Next, the respondents are asked to choose their most preferred variety out of alternative varieties that are differentiated by their characteristics and levels [44]. The choices made by respondents allow us to estimate the observable part of their utility function.
In our experiment, respondents were asked to imagine that they were in a specialist beer shop or bar and wanted to buy beer for their own consumption. They were asked to choose between three different beer varieties (alternatives A, B and C) with six strategically chosen characteristics and an opt-out option, i.e., the option not to buy any beer at all (alternative D) (Table 1 and Table 2). The opt-out alternative (a baseline alternative) was included in each choice set to be able to interpret the results in standard welfare economic terms and to account for omitted variables. The specific choices made by the respondents allow us to identify which characteristics are the most important in the beer selection decision and to predict respondents’ willingness-to-pay (WTP) for marginal changes in the beer characteristics.
We present the respondents with hypothetical unlabeled beers rather than specific existing beer varieties, since beer characteristics tend to be correlated for existing beers and this precludes the identification of the individual impact of each characteristic separately. Each beer was described based on six characteristics (Table 1). These characteristics and their attribute levels were selected based on knowledge of well-known beer attributes, pre-tests with students and knowledge of previous studies [14]. We selected and included the following characteristics to describe a beer product: type of beer, color, country of production, organic label, and packaging and price.
With regard to the type of beer, we included nine different beer types that are well known to Belgian respondents [45]. Alcohol free beer contains hardly any alcohol. Table beer is a typical Belgian beer with a low alcohol content of 1.4–2%. They were traditionally consumed during meals. Belgium produces several pilsner beers (lager beers), which are brewed under bottom-fermentation. In spontaneous fermentation beer (such as lambic, and its associated gueuze beers), no brewer’s yeast is added during the brewing process. Wild yeasts and bacteria give these beers their distinctive flavors. Fruit beers can be made under spontaneous and mixed fermentation methods. Belgium also produces many beers under a top-fermentation method. For example, six breweries in Belgium make Trappist beer, which must be made within the walls of a Trappist monastery or in the vicinity of a monastery, either by monks or under their direct supervision. Abbey beer is brewed in a similar style to Trappist beer, but its producers do not have to abide by the strict production rules of the Trappist brewers. The Belgian pale ale beers resemble the pale ales brewed in the UK. Small scale local beers (“microbrews”) are generally brewed under top-fermentation with alcohol percentages up to 13%. These beers often contain exotic herbs and ingredients, and use a variety of malt and yeast types [45,46]. We selected three colors: blond, dark and amber. Furthermore, we selected three different countries of origin: Belgium (known for the historical existence of a wide variety of different beers types), the USA (known for its long tradition of pilsner type beers and a huge emergence of the craft brewery movement since the 1980s, producing a wide diversity of beers today) and the UK (historically less known for pilsner type beers, and more for pale ale beers, with also a huge craft brewery movement since the 1980s) [47,48]. We include beer varieties with and without organic label and we include different packaging options: beer on tap, in a glass bottle or in a metal can. We have chosen bottles of 25 cL as in Belgium most beer is sold in 25 cL glasses in a pub. To choose the price levels, we looked at existing price ranges for these products in specialized beer shops although beers at pubs tend to be even more expensive. Some beers are highly sought after and are only produced in limited quantities, which leads to high price levels. For instance, in July 2017, the web shop (www.belgianbeerfactory.com) priced a 33 cL bottle of the Trappist beer Westvleteren at 9.9 Euro (implying a price of 45 Euro per 1.5 L) and a 37.5 cL bottle of the organic lambic gueuze beer Cantillon at 8.5 Euro (i.e., 34 Euro per 1.5 L).
The full factorial design leads to (9 × 3 × 3 × 2 × 3 × 6) = 2916 possible combinations. To select the specific beer varieties to present to the respondents we created a D-efficient design in Ngene for a two-block design and each block consisted of nine choice cards. Each choice card consisted of three beer varieties and the opt-out option. Thus, in total we use 54 different beer varieties. Each respondent was randomly presented with one of the two blocks so that an equal distribution of the blocks could be obtained. An example of such a choice card can be found in Table 2.
3.2. Survey Distribution
We use a non-probabilistic sampling method consisting of two strategies. On the one hand, we asked Zythos—the largest Belgian beer consumer organization—to distribute the survey amongst their members. On the other hand, we use a convenience sample to fill in the survey. The survey was executed online and respondents were invited by e-mail (on 4 April 2014) to fill in the questionnaire. The input of survey data from novel respondents was stopped on 31 May 2014. We received 423 responses of which 334 were useable for the empirical analysis.
3.3. Sample Characteristics
In Table 3, we present some interesting characteristics of our respondents. The majority of the respondents were male (67%), with an average age of 39.8 years. Most respondents were always (43%) or often (32%) responsible for the beer purchases of their household. In addition, 16% was member of a nature protection organization and 55% of the respondents drank beer every day (9%) or several times per week (46%).
The fact that only 17% of the respondents could correctly identify the European organic label indicates the limited interest in organic food consumption by our respondents (see Table 3). Overall, some 75% of the respondents do not recognize the European organic label. If consumers were interested in organic food consumption, one would expect them to be able to recognize the organic label. However, this result is still better than what was found in other research amongst Belgian consumers. Rousseau [4] found in her research on organic and fair trade labels for chocolate products in Flanders, Belgium, that only 6% of respondents correctly recognized the EU organic label. However, both surveys (this one and the one by Rousseau [4]) are in line with the existing literature that claims that consumers in general do not know existing product labels very well [49,50]. This indifference of our sample towards organically labeled food is confirmed by Figure 1, which presents the factors that respondents take into account when selecting beer. Each respondent could select at most five characteristics. Not one of the 334 respondents indicates that he/she considers the environmental impact an important factor when choosing beer. In addition, health-related factors (such as calories and possibly habits and traditions)—which are also often associated with organic products—were also not that often chosen by the respondents. The most important characteristics are related to the taste of the beer, the type, the color and the brand, and only then price is considered.
3.4. Econometric Model
In our survey, individuals were offered several choice sets within a choice experiment. Each choice set C consisted of four options: beer A, beer B, beer C and the opt-out (no beer). Choosing one beer over the others implies that the utility of the chosen beer exceeds the utility associated with the other beers. Thus the probability of a respondent choosing beer i from a particular choice set C can be expressed as:
where we assume that the utility Ui derived by an individual of choosing alternative i can be approximated by a linear function of the form (Amaya-Amaya et al., 2008):
where represents an K-dimensional vector of attribute levels for beer alternative i, where β is an K-dimensional vector of coefficients capturing generic marginal (dis)utilities of attributes, where M represents the monetary attribute, and where ASCi—the alternative specific constant—captures the effect of unobserved factors for each of the beer alternatives.
Under the assumption that the random terms are independently and identically distributed following a type I extreme value distribution, the choice probabilities have a convenient closed-form solution, the so-called conditional logit model. The results of this estimation are presented in Table 4 and constitute the main results from this study. Based on these estimates, the marginal willingness-to-pay (WTP) for a particular change in one specific attribute—the marginal rate of substitution—can be estimated as a ratio of coefficients:
For more information on the mathematical and statistical details of this method, we refer the reader to Amaya-Amaya et al. [43]. To analyze the data obtained from our choice experiment, we estimated a conditional logit (CL) model. However, since a CL model assumes preference homogeneity across respondents, we include socio-economic variables as interactions with attributes [51].
4. Results
We now estimate the choice probability expressed in Equation (1) based on a conditional logit model. The estimated coefficients (and standard errors) are expressed in utility units and a transformation is needed (see Equation (3)) to express them in monetary units. Looking at the model with only main effects (see Model 1 in Table 4), we identify the different attributes that influence beer consumption in our sample.
If an estimated coefficient is positive (negative) and statistically significant (p-value below 0.05), respondents’ utility increases (decreases) when consuming a beer with this particular characteristic over the reference value (see Table 4). For example, respondents prefer Trappist beer over alcohol free beer. When the estimated coefficient is not statistically significant (p-value > 0.05), then respondents’ utility from consuming beer with this characteristic cannot be distinguished from respondents’ utility from consuming the reference beer. For example, respondents seem to be indifferent between beer produced in the UK and otherwise similar beer produced in the US.
We find a preference of abbey beer, Trappist beer, local beer and beer of spontaneous fermentation over the other beer types. This result is in line with the results of yearly surveys on Belgian alcohol consumption habits that have been undertaken by the Belgian Brewers Association since 2005. These surveys indicate a growing popularity of craft beers—especially Trappist, abbey and local beers—amongst Belgian citizens [52].
The color of the beer was not found to be statistically significant, while the respondents have a marked preference for Belgian beer. It is possible that the country-of-origin (COO) effect plays a role in this respect. A COO effect deals with the influence on consumer perception that comes from the country of origin of a brand or product. The effect assumes that a consumer can change his quality perception based on the place where the product is made. Moreover, this perception can change a consumers’ attitude and influence his buying behaviors [53]. “Brands from countries that have a favorable image generally find that their brands are more readily accepted than those from countries with less favorable image.” (p. 399). In this respect—and as Belgium is considered a real beer country with high quality beers—it is no surprise that Belgian consumers prefer Belgian beer to beer coming from other countries. We can use the estimated coefficients in Table 4 (model 1) to calculate the WTP for Belgian beer compared to otherwise similar beer from the UK or the US based on Equation (3):
WTP = −(0.8186)/(−0.0314) = 26.08 Euro per 1.5 L
The respondents dislike canned beer. Looking at our main research question, we find that our respondents are statistically indifferent between a beer with an organic label and the same beer without an organic label. This result confirms our second hypothesis. To test the finding of Hasselbach and Roosen [6], we also estimated a model with an interaction between country of production and the presence of an organic label (see Appendix A). These interaction effects were not statistically significant, so we cannot confirm the result that respondents are willing to pay for organic beer when it is produced locally. This result might indicate that respondents assume that local products are already sustainable and thus the organic label might not have an additional effect [54]. However, other measures (see Table 3 and Figure 1) also reflect the limited interest in organic food consumption and the apparent indifference of our sample towards organically produced beer.
To examine whether there are different preferences of organic beer in particular subgroups of the sample and to test the different hypotheses that we have formulated in Section 2, we extend the main effects model with different interaction effects (see Model 2 in Table 4). We test interactions with female respondents (versus males), primary beer shoppers (versus other shoppers), respondents older than 40 (versus respondents younger than 40), frequent beer drinkers defined as respondents who drink more than one beer per week (versus infrequent beer drinkers), and members of nature protection organizations (versus non-members). The results show no statistically significant results for female respondents as well as members of nature protection organizations. However, we find a positive interaction effect for primary beer shoppers and for frequent beer drinkers, while we find a negative interaction effect for respondents older than 40.
Based on the estimates of Model 2 (Table 4), we calculated the price premium that each group was willing to pay for organic beer (see Table 5) as:
with the estimated coefficient (Table 4—Model 2) for “organic label”, with I an indicator function that is 1 if respondents belong to the group and 0 if they do not belong to the group, with the estimated coefficient (Table 4—Model 2) of the interaction between organic label and a group characteristic (e.g., frequent drinkers) and with the estimated coefficient (Table 4—model 2) for the price variable. For example, this gives
We find that the reference group (consisting of non-primary beer shoppers, non-frequent beer drinkers and respondents younger than 40) has a negative WTP for organic beer and would require a price discount of almost 14 Euro for six portions of 25 cL beer with an organic label compared to a similar beer without an organic label. Primary beer shoppers and frequent beer drinkers have a willingness-to-pay that is statistically insignificant from zero (see Table 5), while respondents older than 40 have an even more negative view of organic beers and would require a price discount of 22 Euro for six portions of 25 cL beer with an organic label compared to the reference group. Note that we estimate the WTP (a measure of the value of buying a beer to consumers) and this should be higher than the market price. Consumers are only willing to pay a beer at a certain price if its value to them is at least as high as that price. Nonetheless, a hypothetical bias may still be present which may cause an upward bias of our estimates.
5. Discussion
We now have a closer look at each of the hypotheses that we formulated in Section 2 and discuss how these are situated in the existing literature.
Hypothesis 1. (Female consumers have a higher willingness-to-pay for organic beer than male consumers) is not confirmed. We found no statistically significant gender effects. These results contradict a large part of the literature by, among others, Aertsens et al. [29] and Nasir and Karakaya [2] who claim that women are more open to organic products than men. However, some past studies have also found insignificant gender effects [55]. These ambiguous results might reflect that, under certain circumstances, other consumer characteristics (such as environmental attitudes or familiarity with the product) dominate the impact of gender on consumption choices.
Hypothesis 2. (Consumers are—on average—not willing to pay a price premium for organic beer compared to conventional beer) is confirmed by our analysis. There seems to be no significant effect of the organic label on the willingness-to-pay (WTP) for organic beer. As beer can be considered a vice product, this result is in line with previous research. For example, Van Doorn and Verhoef [33] and Rousseau [4] show that consumers are unwilling to pay high price premiums for organic vice products because of a negative association between organic products and products of lower quality.
Hypothesis 3. (Primary beer shoppers have a lower willingness-to-pay for organic beer than secondary shoppers) is not confirmed, on the contrary. We found a reverse effect. The primary beer shoppers had a WTP of zero, which was higher than the other shoppers whose WTP was negative. In line with previous research for other food products (e.g., [4,38]), we expected that primary beer shoppers would be more familiar with beer types and more aware of their own preferences regarding different beer characteristics. This higher awareness was then expected to result in lower WTP estimates for organic beer. However, our findings for beer seem to contradict these previous studies. This might be related to the observation that the primary shoppers for beer are not the same people as the primary shoppers for household groceries in supermarkets [38] or chocolate [4].
Hypothesis 4. (Members of nature protection organizations have a higher willingness-to-pay for organic beer than non-members) is not confirmed. Our analysis gives the correct sign—i.e., members of nature protection organizations are willing to pay more for organic food products—but our result is not statistically significant. Since the expectation that environmentally active consumers are more willing to consume organic food (e.g., [2,29]) does not seem to hold in all circumstances, it is interesting to test this connection further in other geographical settings and for other food products. It may be especially relevant to investigate whether a positive evaluation of organic production by environmentally conscious consumers is only relevant for virtue products such as vegetables and only to a lesser extent for vice products such as beer.
Besides the four hypotheses, we also investigated the impact of age and familiarity with the product. With regard to age, we found that younger respondents have a negative WTP for organic beer, and the WTP is even more negative for older people. As stated before, in the existing literature, both positive and negative attitudes have been found when the age of the respondents was considered. Frequent drinkers seem indifferent towards organic beer, while less frequent drinkers have a negative WTP for organic beer. In our opinion, an explanation for this result can be found in the observation that frequent beer drinkers may be more open to taste different types of beers than infrequent beer drinkers. Thus, frequent beer drinkers may also be more open towards beer with an organic label.
6. Conclusions
Based on an online survey we investigated whether Belgian consumers cared about an organic label when buying beer and whether they were prepared to pay a price premium for such a label. Most respondents were always (43%) or often (32%) responsible for the beer purchases of their household and 55% of the respondents drank beer every day (9%) or several times per week (46%). The three most important characteristics that respondents indicated to take into account when selecting beer were the taste, type and color of the beer. None of the 334 respondents considered the “environmental impact” as an important factor when selecting beer.
We found no statistical evidence that respondents were willing to pay a price premium for a beer with an organic label over a similar beer without an organic label. This is in line with previous research that stated that consumers are unwilling to pay price premiums for organic vice products. Beer can indeed be considered as a vice product. We find no statistically different preferences for male or female respondents, as well as for members or non-members of nature protection organizations. However, we find a positive interaction effect for primary beer shoppers and for frequent drinkers, while we find a negative interaction effect for respondents older than 40. These findings could stimulate further research. For instance, it could be worthwhile to check whether the results carry over to other unhealthy food products and whether similar research in other countries delivers comparable results. Moreover, this information may be interesting for beer producers in helping them to communicate more effectively with consumer groups that are more likely to be willing to buy organically produced beer.
In light of these results as well as those found by Hasselback and Roosen [6], we can conclude that the market potential for organic beers seems limited. While consumers may truly not care about organic agriculture, they may also be associating negative characteristics such as lower quality or worse taste with organically labeled beer. Although further research would be needed to prove this possibility for beer, previous research has found a significant influence of the presence of an organic label on consumers’ taste evaluations for chips and yogurt (positive effects [18]) as well as cookies and chocolate (negative effects [4,18]. These results suggest that “market pull” instruments such as labels may not be the most effective route towards a more sustainable market. To stimulate a greener market for such vice products, it may be advisable to consider other policy options such as taxes for unsustainably produced goods or product standards limiting the use of certain production methods or particular inputs.
Acknowledgments
We thank the editors and three anonymous reviewers for their comments on an earlier version of the manuscript.
Author Contributions
Eline Poelmans and Sandra Rousseau designed the structure of the study, conducted the research and discussed the findings. The paper is a result of a close collaboration between the authors. Both authors revised the manuscript based on the comments from the reviewers.
Conflicts of Interest
The authors declare no conflict of interest.
Appendix A. Estimation Results with Interaction between Organic Label and Country of Production Based on Conditional Logit Model

Table A1.
Estimation results with interaction between organic label and country of production (N = 334; p-values test if estimated coefficient is equal to zero).
Table A1.
Estimation results with interaction between organic label and country of production (N = 334; p-values test if estimated coefficient is equal to zero).
| Model 3: Main Effects and Interaction Between Organic Label and Country of Production | |||
|---|---|---|---|
| Choice | Coefficient | Robust Standard Errors | p > z |
| Table beer | 1.5044 | 0.2366 | 0.000 |
| Pilsner | 1.9020 | 0.2994 | 0.000 |
| Spontaneous fermentation | 2.4062 | 0.2068 | 0.000 |
| Fruit beer | 1.3006 | 0.2342 | 0.000 |
| Trappist beer | 2.4045 | 0.2280 | 0.000 |
| Abbey beer | 2.5086 | 0.2141 | 0.000 |
| Pale Ale | 1.5791 | 0.2129 | 0.000 |
| Small Local beer | 2.7821 | 0.2425 | 0.000 |
| Dark color | −0.0846 | 0.0878 | 0.335 |
| Pale color | 0.1389 | 0.0763 | 0.069 |
| UK | 0.0053 | 0.1339 | 0.968 |
| Belgium | 0.8904 | 0.1149 | 0.000 |
| Organic label | 0.1409 | 0.1274 | 0.269 |
| Organic label and Belgium | −0.1510 | 0.1738 | 0.385 |
| Organic label and UK | 0.0329 | 0.1500 | 0.827 |
| On tap | 0.7237 | 0.1647 | 0.000 |
| Bottle | 0.7475 | 0.1415 | 0.000 |
| Price | −0.0314 | 0.0044 | 0.000 |
| ASC1 | −1.9790 | 0.2704 | 0.000 |
| ASC2 | −1.8785 | 0.2685 | 0.000 |
| ASC3 | −1.9519 | 0.2676 | 0.000 |
References
- Shepherd, R.; Magnusson, M.; Sjödén, P.-O. Determinants of consumer behavior related to organic foods. Ambio 2005, 34, 352–359. [Google Scholar] [CrossRef] [PubMed]
- Nasir, V.A.; Karakaya, F. Consumer Segments in Organic Foods market. J. Consum. Mark. 2014, 31, 263–277. [Google Scholar] [CrossRef]
- Bublitz, M.G.; Peracchio, L.A.; Block, L.G. Why did I eat that? Perspectives on food decision making and dietary restraint. J. Consum. Psychol. 2010, 20, 239–258. [Google Scholar] [CrossRef]
- Rousseau, S. The role of organic and fair trade labels when choosing chocolate. Food Qual. Prefer. 2015, 44, 92–100. [Google Scholar] [CrossRef] [Green Version]
- Caporale, G.; Monteleone, E. Influence of information about manufacturing process on beer acceptability. Food Qual. Preference 2004, 15, 271–278. [Google Scholar] [CrossRef]
- Hasselbach, J.L.; Roosen, J. Consumer heterogeneity in the willingness to pay for local and organic food. J. Food Prod. Mark. 2015, 21, 608–625. [Google Scholar] [CrossRef]
- Webb, T.; Beaumont, S. The World Altlas of Beers; Mitchell Beazley: London, UK, 2012. [Google Scholar]
- Belgian Brewers (BB). Annual Report 2014. Available online: http://www.belgianbrewers.be/en/economy/article/employment-104 (accessed on 12 January 2015).
- Euromonitor International. Premiumization. Available online: www.euromonitor.com (accessed on 6 March 2016).
- Piron, E.; Poelmans, E. Beer, the Preferred Alcoholic Drink of All? Changes in the Global and National Beer Consumption since 1960 and Convergence and Trends since the 1990s. In Beer, Brewing and Pubs: A Global Perspective, Chapter 10; Cabras, I., Higgins, D., Preece, D., Eds.; Palgrave Macmillan: Hampshire, UK, 2016; pp. 205–227. [Google Scholar]
- Samborski, V.; Van Belleghem, L. De Biologische Landbouw in Vlaanderen: Stand van Zaken 2014; Departement Landbouw & Visserij: Brussel, Belgium, 2015. [Google Scholar]
- Colen, L.; Swinnen, J. Economic Growth, Globalisation and Beer Consumption. J. Agric. Econ. 2016, 67, 186–207. [Google Scholar] [CrossRef]
- Selvanathan, S.; Selvanathan, E.A. Demand for beer, wine and spirits (Chapter 9). In The Demand for Alcohol, Tobacco and Marijuana. International Evidence; Selvanathan, S., Selvanathan, E.A., Eds.; Ashgate Publishing: Hants, UK, 2005; pp. 211–242. [Google Scholar]
- Colen, L.; Swinnen, J. Beer-drinking nations: The determinants of global beer consumption. In The Economics of Beer; Swinnen, J.F.M., Ed.; Oxford University Press: Oxford, UK, 2011; pp. 123–140. [Google Scholar]
- Hughner, R.S.; McDonagh, P.; Prothero, A.; Shultz II, C.J.; Stanton, J. Who are organic food consumers? A compilation and review of why people purchase organic food. J. Consum. Behav. 2007, 6, 94–110. [Google Scholar] [CrossRef]
- Thøgersen, J. Consumer decision making with regard to organic food products. In Traditional Food Production Facing Sustainability: A European Challenge; Vaz, M.T.D.N., Vaz, P., Nijkamp, P., Rastoin, J.L., Eds.; Ashgate: Farnham, UK, 2007. [Google Scholar]
- Magnusson, M.K.; Arvola, A.; Koivisto Hursti, U.-K.; Aberg, L.; Sjoden, P.-O. Attitudes towards organic foods among Swedish consumers. Br. Food J. 2001, 103, 209–226. [Google Scholar] [CrossRef]
- Lee, W.C.; Shimizu, M.; Kniffin, K.M.; Wansink, B. You taste what you see: Do organic labels bias taste perceptions? Food Qual. Preference 2013, 29, 33–39. [Google Scholar] [CrossRef]
- Padel, S.; Foster, C. Exploring the gap between attitudes and behavior: Understanding why consumers buy or do not buy organic food. Br. Food J. 2005, 107, 606–625. [Google Scholar] [CrossRef]
- Goetzke, B.; Nitzko, S.; Spiller, A. Consumption of organic and functional food. A matter of well-being and health? Appetite 2014, 77, 94–103. [Google Scholar] [CrossRef] [PubMed]
- Thøgersen, J. Green shopping: For selfish reasons or the common good? Am. Behav. Sci. 2011, 55, 1052–1076. [Google Scholar] [CrossRef]
- Hanley, N.; Shogren, J.; White, B. Introduction to Environmental Economics; Oxford University Press: Oxford, UK, 2013. [Google Scholar]
- Aertsens, J.; Mondelaers, K.; Verbeke, W.; Buysse, J.; Van Huylenbroeck, G. The influence of subjective and objective knowledge on attitude, motivations and consumption of organic food. Br. Food J. 2011, 113, 1353–1378. [Google Scholar] [CrossRef]
- Davies, A.; Titterington, A.J.; Cochrane, C. Who buys organic food? A profile of the purchasers of organic food in Northern Ireland. Br. Food J. 1995, 97, 17–23. [Google Scholar] [CrossRef]
- Lockie, S.; Lyons, K.; Lawrence, G.; Mummery, K. Eating ‘Green’: Motivations behind organic food consumption in Australia. Sociol. Rural. 2002, 42, 23–40. [Google Scholar] [CrossRef]
- Yiridoe, E.K.; Bonti-Ankomah, S.; Martin, R.C. Comparison of consumer perceptions and preference toward organic versus conventionally produced foods: A review and update of the literature. Renew. Agric. Food Syst. 2005, 20, 193–205. [Google Scholar] [CrossRef]
- Zepeda, L.; Li, J. Characteristics of organic food shoppers. J. Agric. Appl. Econ. 2007, 39, 17–28. [Google Scholar] [CrossRef]
- OTA-Organic Trade Association (2009). US Families’ Organic Attitudes and Beliefs Study. Available online: www.ota.com/pics/documents/01b_FinalOTAKiwiExecutive Summary.pdf (accessed on 26 May 2017).
- Aertsens, J.; Verbeke, W.; Mondelaers, K.; Van Huylenbroeck, G. Personal determinants of organic food consumption, A review. Br. Food J. 2009, 111, 1140–1167. [Google Scholar] [CrossRef] [Green Version]
- Magnusson, M.K.; Arvola, A.; Koivisto Hursti, U.-K.; Aberg, L.; Sjoden, P.-O. Choice of organic foods is related to perceived consequences for human health and to environmentally friendly behavior. Appetite 2003, 40, 109–117. [Google Scholar] [CrossRef]
- Durham, C.A. The impact of environmental and health motivations on the organic share of purchases. Agric. Resour. Econ. Rev. 2007, 36, 304–320. [Google Scholar] [CrossRef]
- Schifferstein, H.N.J.; Oude Ophuis, P.A.M. Health-related determinants of organic food consumption in the Netherlands. Food Qual. Preference 1998, 9, 119–133. [Google Scholar] [CrossRef]
- Van Doorn, J.; Verhoef, P.C. Willingness to pay for organic products: Differences between virtue and vice foods. Int. J. Res. Mark. 2011, 28, 167–180. [Google Scholar] [CrossRef]
- List, J.A.; Gallet, C.A. What experimental protocol influence disparities between actual and hypothetical stated values? Environ. Resour. Econ. 2011, 20, 241–254. [Google Scholar] [CrossRef]
- Vossler, C.A.; Doyon, M.; Rondeau, D. Truth in consequentiality: Theory and field evidence on discrete choice experiments. Am. Econ. J. 2012, 4, 145–171. [Google Scholar] [CrossRef]
- Leggett, C.G.; Kleckner, N.S.; Boyle, K.J.; Dufield, J.W.; Mitchell, R.C. Social desirability bias in contingent valuation surveys administered through in-person interviews. Land Econ. 2003, 79, 561–575. [Google Scholar] [CrossRef]
- Carlsson, F.; Frykblom, P.; Lagerkvist, C.J. Using cheap talk as a test of validity in choice experiments. Econ. Lett. 2005, 89, 147–152. [Google Scholar] [CrossRef]
- Dholakia, R.R. Going shopping: Key determinants of shopping behaviors and motivations. Int. J. Retail Distrib. Manag. 1999, 27, 154–165. [Google Scholar] [CrossRef]
- Wood, W.; Neal, D.T. The habitual consumer. J. Consum. Psychol. 2009, 19, 579–592. [Google Scholar] [CrossRef]
- Gil, J.M.; Gracia, A.; Sanchez, M. Market segmentation and willingness to pay for organic products in Spain. Int. Food Agribus. Manag. Rev. 2000, 3, 207–226. [Google Scholar] [CrossRef]
- Louviere, J.J.; Hensher, D.A. On the design and analysis of simulated choice or allocation experiments in travel choice modelling. Transp. Res. Rec. 1982, 890, 11–17. [Google Scholar]
- Louviere, J.J.; Woodworth, G. Design and analysis of stimulated choice experiments or allocation experiments: An approach based on aggregate data. J. Mark. Res. 1983, 20, 350–367. [Google Scholar] [CrossRef]
- Amaya-Amaya, M.; Gerard, K.; Ryan, M. Discrete choice experiments in a nutshell. In Using Discrete Choice Experiments to Value Health and Health Care; Ryan, M., Gerard, K., Amaya-Amaya, M., Eds.; Springer: Berlin, Germany, 2008; pp. 13–46. [Google Scholar]
- Hanley, N.; Mourato, S.; Wright, R.E. Choice modeling approaches: A superior alternative for environmental valuation? J. Econ. Surv. 2011, 15, 435–462. [Google Scholar] [CrossRef]
- Deweer, H. All Belgian Beers—Alle Belgische Bieren—Toutes Les Bières Belges; Stichting Kunstboek: Oostkamp, Belgium, 2015. [Google Scholar]
- Vanrafelghem, S. Tournée Générale 3: Trends en Tradities; Uitgeverij Van Halewyck: Leuven, Belgium, 2013. [Google Scholar]
- Dighe, R.S. A taste for temperance: How American beer got to be so bland. Bus. Hist. 2016, 58, 752–784. [Google Scholar] [CrossRef]
- Cabras, I.; Bamforth, C. From reviving tradition to fostering innovation and changing marketing: The evolution of micro-brewing in the UK and US, 1980–2012. Bus. Hist. 2016, 58, 625–646. [Google Scholar] [CrossRef]
- Janssen, M.; Hamm, U. Product labelling in the market for organic food: Consumer preferences and willingness-to-pay for different organic certification logos. Food Qual. Preference 2012, 25, 9–22. [Google Scholar] [CrossRef]
- Pedersen, E.R.; Neergaard, P. Caveat emptor—Let the buyer beware! Environmental labelling and the limitations of ‘green’ consumerism. Bus. Strategy Environ. 2006, 15, 15–29. [Google Scholar] [CrossRef]
- Train, K.E. Discrete Choice Methods with Simulations, 1st ed.; Cambridge University Press: Cambridge, UK, 2003. [Google Scholar]
- Poelmans, E.; Swinnen, J. Belgium: Craft Beer nation? In Economic Perspectives on Craft Beer; Garavaglia, C., Swinnen, J., Eds.; Oxford University Press: Oxford, UK, 2017. [Google Scholar]
- Kim, R.; Yang, H.; Chao, Y. Effect of brand equity & country origin on Korean consumers’ choice for beer brands. Bus. Manag. Rev. 2016, 7, 398–403. [Google Scholar]
- Magnier, L.; Schoormans, J.; Mugge, R. Judging a product by its cover: Packaging sustainability and perceptions of quality in food products. Food Qual. Preference 2016, 53, 132–142. [Google Scholar] [CrossRef]
- Krystallis, A.; Chryssohoidis, G. Consumers’ willingness to pay for organic food: Factors that affect it and variation per organic product type. Br. Food J. 2005, 107, 320–343. [Google Scholar] [CrossRef]
Figure 1.
Characteristics that are important when selecting beer (Each of the 334 respondents could select at most five characteristics).
Figure 1.
Characteristics that are important when selecting beer (Each of the 334 respondents could select at most five characteristics).
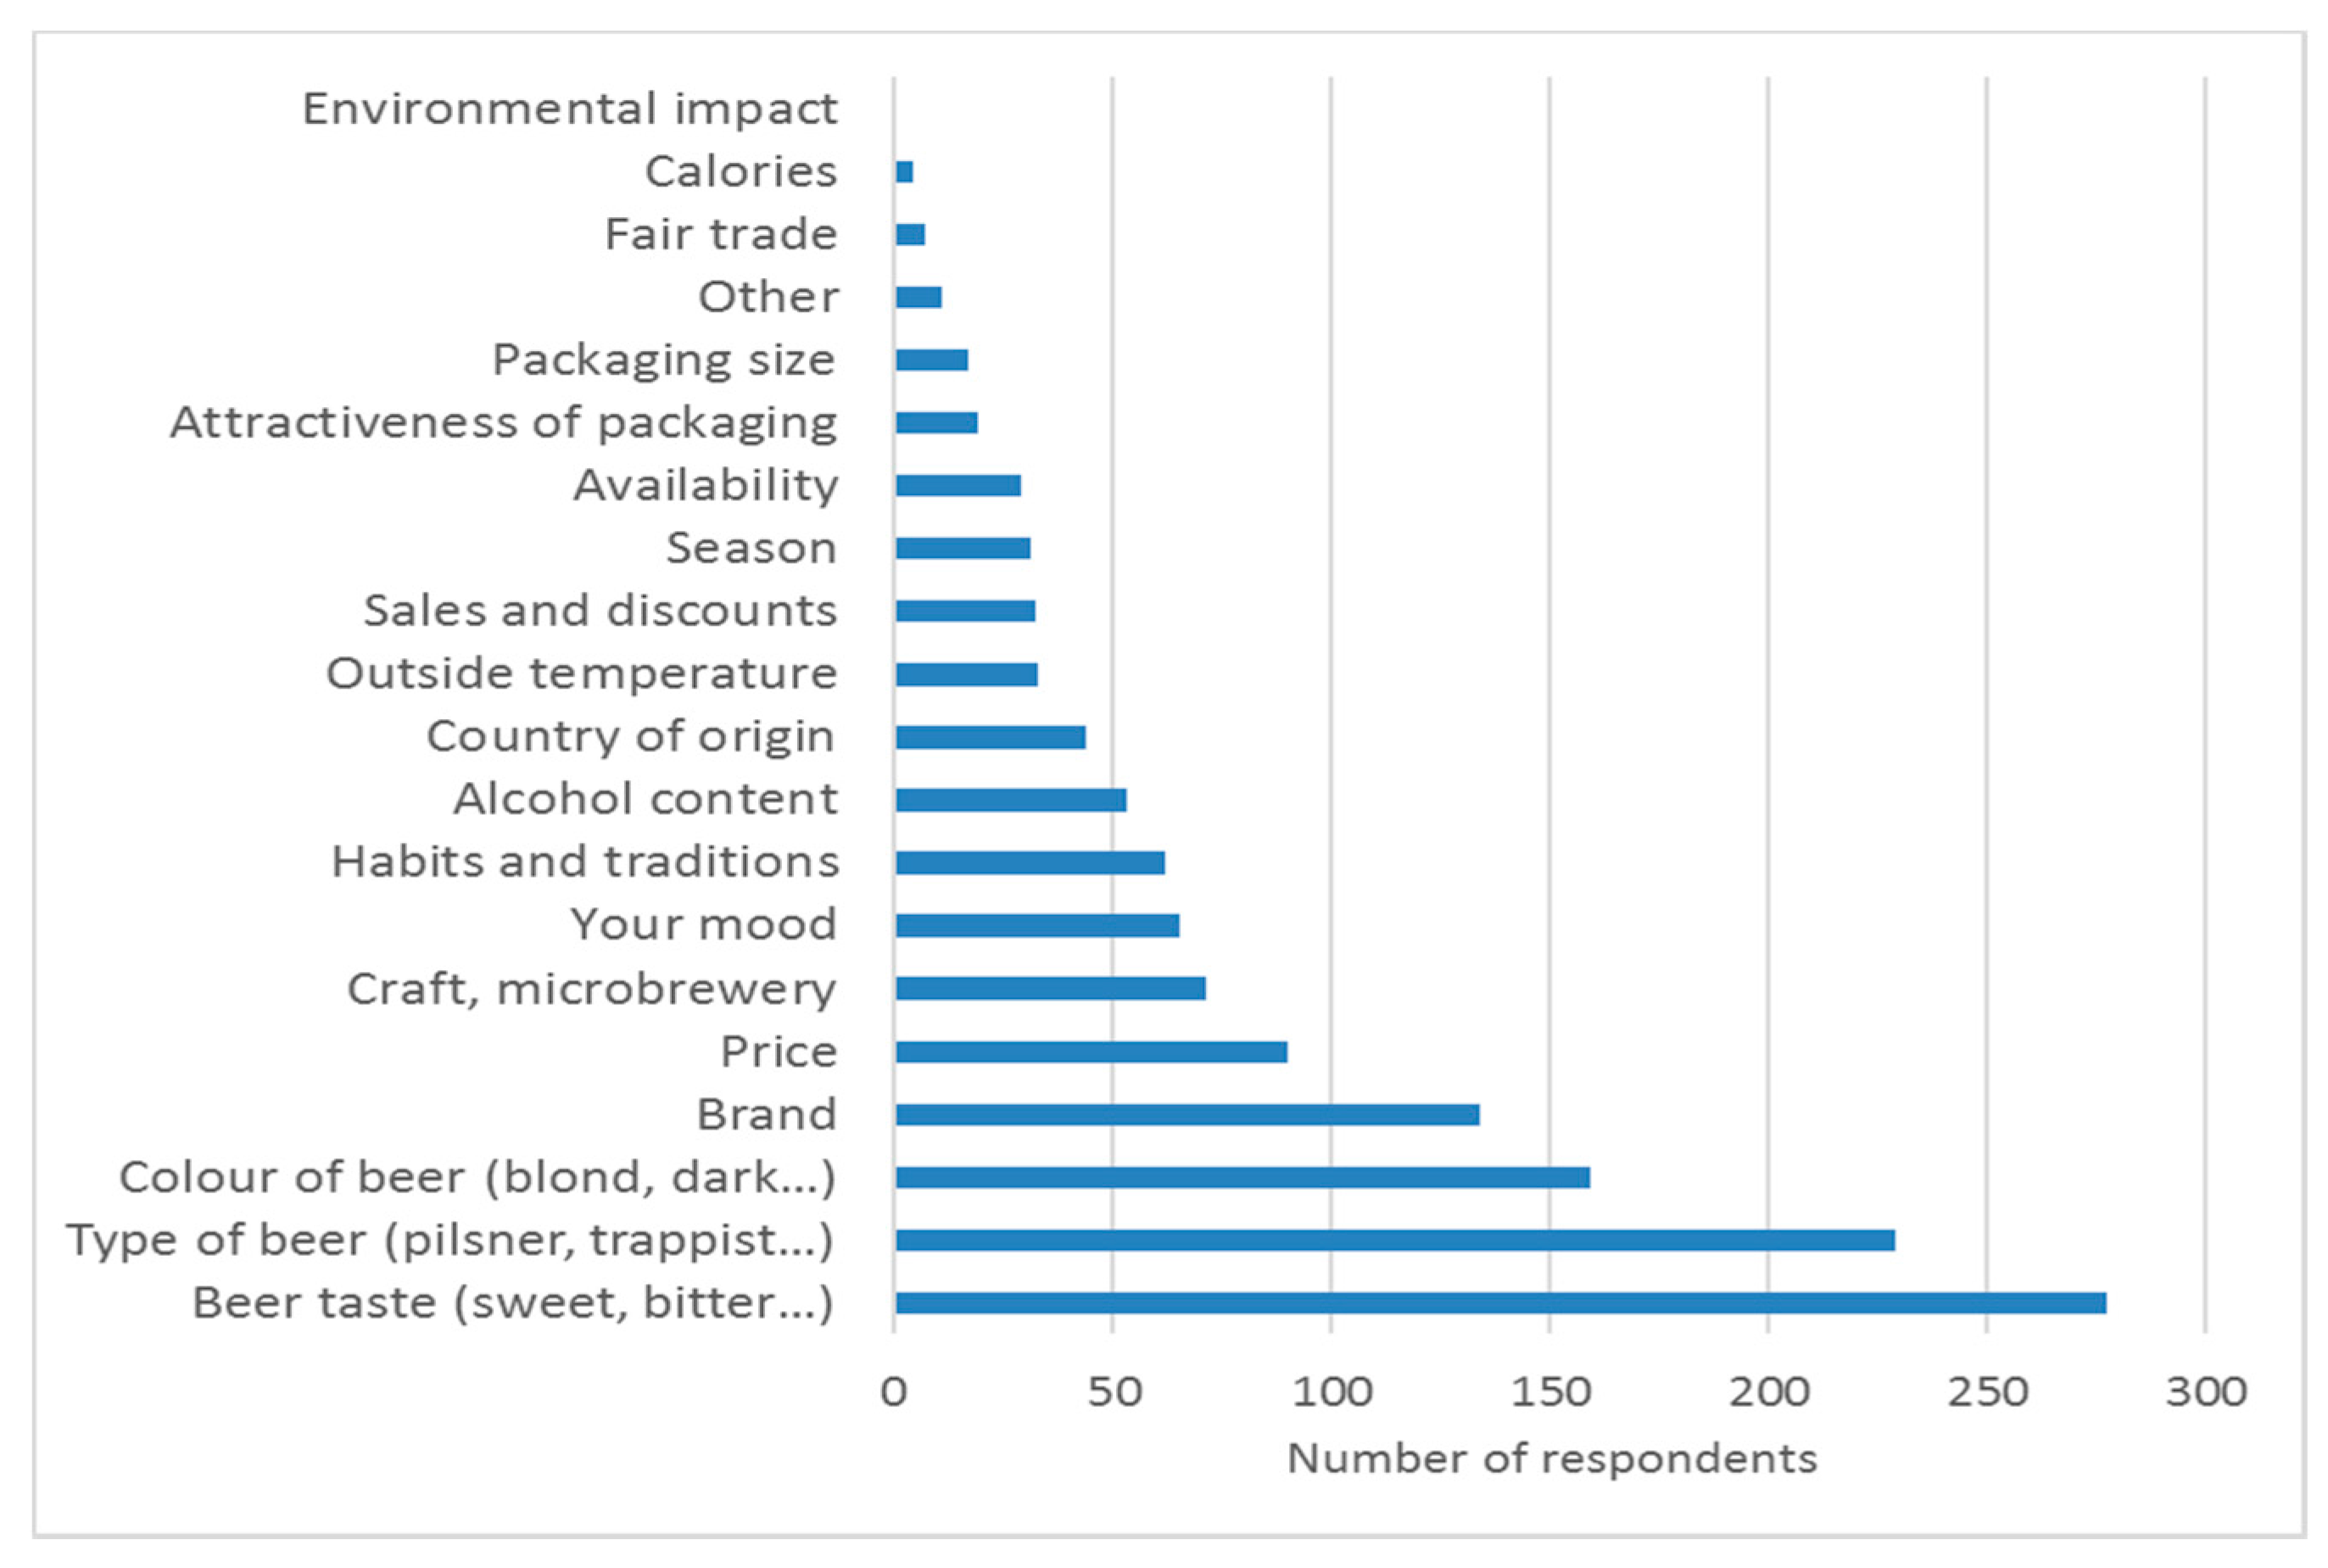
Table 1.
A listing of levels considered for each of six attributes of beers.
| Attributes | Attribute Levels |
|---|---|
| Type of beer | Alcohol free beer (reference category) |
| Table beer | |
| Pilsner beer | |
| Beer of spontaneous fermentation | |
| Fruit beer | |
| Trappist beer | |
| Abbey beer | |
| Pale ale | |
| Small scale local beer | |
| Color | Amber (reference category) |
| Dark | |
| Pale | |
| Country of production | USA (reference category) |
| UK | |
| Belgium | |
| Organic label | No organic label (reference category) |
| Organic label | |
| Packaging | Can (reference category) |
| On tap | |
| Bottle | |
| Price (continuous variable) | 2 Euro for 6 portions of 25 cL |
| 4 Euro for 6 portions of 25 cL | |
| 6 Euro for 6 portions of 25 cL | |
| 10 Euro for 6 portions of 25 cL | |
| 15 Euro for 6 portions of 25 cL | |
| 30 Euro for 6 portions of 25 cL |
Table 2.
Example of a choice card (translated from Dutch).
| Card 1.1 | Beer Variety A | Beer Variety B | Beer Variety C |
|---|---|---|---|
| Type of beer | Pale ale | Trappist | Pilsner |
| Color | Blond | Dark | Blond |
| Country of production | Belgium | United States | United Kingdom |
| Organic label | Without organic label | With organic label | Without organic label |
| Packaging | Bottle | On tap | Can |
| Price | 30 Euro for 6 bottles of 25 cL | 2 Euro for 6 glasses of 25 cL | 10 Euro for 6 cans of 25 cL |
| Which beer variety do you prefer? | |||
| ⚪ Beer variety A | |||
| ⚪ Beer variety B | |||
| ⚪ Beer variety C | |||
| ⚪ None of the three beer varieties | |||
Table 3.
Sample characteristics of the 334 respondents who provided usable submissions.
| Gender | Primary Beer Shopper (Do You Decide Which Beer to Buy in Your Household?) | ||||
|---|---|---|---|---|---|
| Male | 224 | 67% | Always | 142 | 43% |
| Female | 110 | 33% | Often | 106 | 32% |
| Age | Never | 40 | 12% | ||
| Average age | 39.82 | Missing | 2 | 1% | |
| Minimum age | 19 | ||||
| Maximum age | 71 | ||||
| Nature protection organization | Frequency of beer drinking | ||||
| Member | 54 | 16% | Every day | 30 | 9% |
| No member | 272 | 81% | Several times per week | 154 | 46% |
| Missing | 8 | 2% | Once per week | 35 | 10% |
| Several times per month | 35 | 10% | |||
| Once per month | 9 | 3% | |||
| Several times per year | 34 | 10% | |||
| Once per year | 1 | 0% | |||
| Never | 36 | 11% | |||
| Correct identification of the European Organic Label | |||||
| The respondent correctly recognizes the label | 57 | 17% | |||
| The respondent incorrectly recognizes the label | 252 | 75% | |||
| The respondent does not recognize the label | 27 | 8% | |||
Table 4.
Conditional logit estimation of choice probabilities (p-values test the null hypothesis that the estimated coefficient is equal to zero).
Table 4.
Conditional logit estimation of choice probabilities (p-values test the null hypothesis that the estimated coefficient is equal to zero).
| Choice | Model 1: Only Main Effects | Model 2: Interactions with Organic Label | ||||
|---|---|---|---|---|---|---|
| Coefficient | Robust Standard Errors | p-Value | Coefficient | Robust Standard Errors | p-Value | |
| Table beer | 1.5334 | 0.2350 | 0.0000 | 1.5733 | 0.2376 | 0.0000 |
| Pilsner | 1.8868 | 0.2972 | 0.0000 | 1.9164 | 0.2992 | 0.0000 |
| Spontaneous fermentation | 2.3780 | 0.2043 | 0.0000 | 2.4320 | 0.2077 | 0.0000 |
| Fruit beer | 1.2947 | 0.2323 | 0.0000 | 1.3257 | 0.2350 | 0.0000 |
| Trappist beer | 2.3869 | 0.2253 | 0.0000 | 2.4201 | 0.2267 | 0.0000 |
| Abbey beer | 2.4932 | 0.2071 | 0.0000 | 2.5386 | 0.2094 | 0.0000 |
| Pale Ale | 1.5557 | 0.2095 | 0.0000 | 1.5663 | 0.2112 | 0.0000 |
| Small scale local beer | 2.7920 | 0.2413 | 0.0000 | 2.8374 | 0.2437 | 0.0000 |
| Dark color | −0.1151 | 0.0817 | 0.1590 | −0.1205 | 0.0828 | 0.1460 |
| Pale color | 0.1293 | 0.0688 | 0.0600 | 0.1340 | 0.0695 | 0.0540 |
| UK | −0.0026 | 0.1048 | 0.9810 | 0.0112 | 0.1055 | 0.9160 |
| Belgium | 0.8186 | 0.0884 | 0.0000 | 0.8424 | 0.0897 | 0.0000 |
| Organic label | 0.0858 | 0.0644 | 0.1830 | −0.4406 | 0.2035 | 0.0300 |
| Female | −0.1116 | 0.1749 | 0.5230 | |||
| Primary beer shopper | 0.4102 | 0.1756 | 0.0190 | |||
| Older than 40 | −0.2694 | 0.1237 | 0.0290 | |||
| Frequent drinker | 0.6074 | 0.1545 | 0.0000 | |||
| Nature organization | 0.1853 | 0.1664 | 0.2650 | |||
| On tap | 0.7306 | 0.1636 | 0.0000 | 0.7429 | 0.1649 | 0.0000 |
| Bottle | 0.7577 | 0.1390 | 0.0000 | 0.7682 | 0.1400 | 0.0000 |
| Price | −0.0314 | 0.0044 | 0.0000 | −0.0322 | 0.0045 | 0.0000 |
| ASC1 | −1.9289 | 0.2628 | 0.0000 | −1.9671 | 0.2677 | 0.0000 |
| ASC2 | −1.8299 | 0.2627 | 0.0000 | −1.8766 | 0.2675 | 0.0000 |
| ASC3 | −1.9065 | 0.2601 | 0.0000 | −1.9524 | 0.2657 | 0.0000 |
Table 5.
Willingness-to-pay for beer with an organic label in terms of premiums (positive values) or discounts (negative values) for four groups of consumers.
Table 5.
Willingness-to-pay for beer with an organic label in terms of premiums (positive values) or discounts (negative values) for four groups of consumers.
| Willingness-to-Pay More or Less for a Beer with an Organic Label Compared to a Similar Non-Organic Reference Beer (Euro Per 6 Portions of 25 cL) | Standard Error | p-Value (Testing Whether Estimated WTP is Equal to Zero) | |
|---|---|---|---|
| Primary beer shopper | −0.94 | 5.12 | 0.853 |
| Frequent beer drinkers | 5.18 | 5.66 | 0.360 |
| Respondents older than 40 | −22.05 | 7.60 | 0.004 |
| Reference group consisting of non-primary beer shoppers, non-frequent beer drinkers and respondents younger than 40 | −13.68 | 6.75 | 0.043 |
© 2017 by the authors. Licensee MDPI, Basel, Switzerland. This article is an open access article distributed under the terms and conditions of the Creative Commons Attribution (CC BY) license (http://creativecommons.org/licenses/by/4.0/).
Share and Cite
MDPI and ACS Style
Poelmans, E.; Rousseau, S. Beer and Organic Labels: Do Belgian Consumers Care? Sustainability 2017, 9, 1509. https://doi.org/10.3390/su9091509
AMA Style
Poelmans E, Rousseau S. Beer and Organic Labels: Do Belgian Consumers Care? Sustainability. 2017; 9(9):1509. https://doi.org/10.3390/su9091509
Chicago/Turabian StylePoelmans, Eline, and Sandra Rousseau. 2017. "Beer and Organic Labels: Do Belgian Consumers Care?" Sustainability 9, no. 9: 1509. https://doi.org/10.3390/su9091509
Note that from the first issue of 2016, this journal uses article numbers instead of page numbers. See further details here.