Article

Break-Even Point Analysis of Sodium-Cooled Fast Reactor Capital Investment Cost Comparing the Direct Disposal Option and Pyro-Sodium-Cooled Fast Reactor Nuclear Fuel Cycle Option in Korea

1
Nuclear Fuel Cycle Analysis, Korea Atomic Energy Research Institute, 1045 Daedeokdaero, Yuseong-gu, Daejeon 305-353, Korea
2
Department of Nuclear and Quantum Engineering Korea Advanced Institute of Science and Technology, 291 Daehak-ro, Yuseong-gu, Daejeon 305-701, Korea
3
Department of Business and Technology Management, Korea Advanced Institute of Science and Technology, 291 Daehak-ro, Yuseong-gu, Daejeon 305-701, Korea
*
Author to whom correspondence should be addressed.
Sustainability 2017, 9(9), 1518; https://doi.org/10.3390/su9091518
Submission received: 14 July 2017 / Revised: 18 August 2017 / Accepted: 18 August 2017 / Published: 25 August 2017
(This article belongs to the Section Sustainable Engineering and Science)

Abstract

:
The purpose of this paper is to recommend a break-even point for the capital investment cost for a Sodium-cooled Fast Reactor (SFR) when choosing between a Pyro-SFR nuclear fuel cycle (recycling option via Pyro-processing) and a direct disposal option. This is because the selection of an alternative cannot be justified without a guarantee of economic feasibility. The calculation of a break-even point is necessary because SFR capital investment cost makes up the largest share of the cost for electricity generation. In other words, the cost of capital investment is an important cost driver, and the one that exerts the greatest effect on Pyro-SFR nuclear fuel cycle economics. In the end, the break-even point of the SFR capital investment cost between the Pyro-SFR nuclear fuel cycle and the direct disposal was calculated to be 4284 US$/kWe. In other words, it is possible to claim that the potential for the economic viability of the Pyro-SFR nuclear fuel cycle is greater (compared to investing in direct disposal) when the SFR capital investment cost is 4284 US$/kWe or less. In addition, Pyro-SFR technology will enable sustainable nuclear power generation.

1. Introduction

Korea is exerting efforts to ensure the sustainable use of nuclear power by reducing the substantial inventory of nuclear spent fuel in temporary repositories in nuclear power plants. Against this backdrop, Korea is considering the direct disposal of spent fuel and Pyro-processing, which offers high proliferation resistance. Since Korea’s national policy gives priority to high proliferation resistance, the PWR (Pressurized Water Reactor)-MOX (Mixed OXide (UO2 and PuO2) fuel) method with plutonium extraction is not being considered.
An analysis of economic feasibility, which is the most important factor, must be conducted when comparing direct disposal and Pyro-SFR (Sodium-cooled Fast Reactor). This is because the selection of an alternative cannot be justified without a guarantee of economic feasibility.
Pyro-processing technology is an electrochemical method used to recover uranium and TRU (TRansUranium) from nuclear spent fuel. Because the recovered uranium is utilized as a raw material of SFR fuel [1], not only does it reduce the inventory of spent fuel, it can also greatly increase the efficiency of disposal.
Therefore, Pyro-processing technology is a future nuclear technology that will generate a sustainable energy source in an economical and environmentally friendly way. Thus, it will enable sustainable nuclear power generation through the Pyro-SFR fuel cycle.
In addition, Pyro-processing economics should include all costs of the Pyro-SFR nuclear fuel cycle, including the cost of SFR capital investment, not just the costs directly related to the Pyro-processing facility [2]. The cost of capital investment is an important driver of the Pyro-SFR nuclear fuel cycle’s electricity generation cost. In other words, the capital investment cost makes up the largest share of the cost of the Pyro-SFR nuclear fuel cycle. Of course, the cost of SFR capital investment is also an important factor that determines the economics of the alternative to the Pyro-SFR nuclear fuel cycle. However, this capital investment cost relies on estimation because no SFR has yet been commercialized.
To determine Pyro-SFR nuclear fuel cycle economics, the capital investment cost required for SFR and Pyro-processing facility construction needs to be expensed, to factor into the cost of electricity generation [3]. Here, capital investment cost expensing refers to the process of converting economic resources included in the reactor and Pyro-processing facility, as cost.
For the engineering cost estimation method, it is assumed that the Pyro-processing facility construction period is approximately six to seven years [4]. The cost that is input every year during the construction period is allocated from the total invested economic resource according to expert judgement. For comparison, the accounting method recognizes the input capital investment cost as a tangible asset [5,6]. Then, it is expensed every year utilizing a depreciation cost. Each year, an adequate method is selected among various depreciation methods.
The engineering cost estimation method estimates the capital investment cost of a SFR and Pyro-processing facility that is not yet commercialized, based on the conceptual design. Moreover, in the case of a SFR, data published in the existing literature is utilized to estimate the capital investment cost of reactors with increased capacity using a “scale adjustment” [7].
According to previous research, the capital investment cost of a reactor makes up approximately 60% (or more) of the cost of generating electricity [8]. Moreover, the capital investment cost of a Pyro-processing facility makes up approximately 33% (or more) of the total Pyro-processing cost [9]. Accordingly, although the share of the Pyro-processing facility capital investment cost is small compared to the reactor cost, the former investment cost cannot be neglected.
In this paper, the following work was carried out to identify the effect of capital investment cost on the cost of electricity generation. First, a method for calculating the nuclear-fuel-cycle cost was introduced; and then the direct disposal option and Pyro-SFR nuclear-fuel-cycle electricity generation costs were calculated. Second, the break-even point of the capital investment cost for the Pyro-SFR nuclear fuel cycle and for direct disposal was calculated, and the economics of the Pyro-SFR nuclear-fuel-cycle was judged.
Among the 24 nuclear power plants in Korea, only 4 have CANDU (CANadian Deuterium Uranium)-PHWRs (Pressurised Heavy Water Reactor). This study focused on PWR (Pressurized Water Reactor) because of the poor economic feasibility of reprocessing by CANDU-PHWR [10].

2. Methods

2.1. Capital Investment Cost Expensing Method Based on Engineering Cost Estimation

The cost object needs to be set first, in order to expense the capital investment cost. Here, the Pyro-SFR nuclear-fuel-cycle cost object refers to the SFR and Pyro-processing facility with their economic resource inputs. The capital investment cost calculated using the engineering cost estimation method (for setting up the KAPF+ (Korea Advanced Pyroprocess Facility Plus) that the Korea Atomic Energy Research Institute (KAERI) designed conceptually as the cost object) entails conversion of the costs during seven years that were input during the early stage of the Pyro-processing facility construction as the present value [9].
The capital investment cost expensing method based on the engineering cost estimation method is as follows. First, the input cost is allocated during the construction period. Second, an adequate discount rate is applied to the cost by year, allocated using Equation (1), to discount to the base year [11]. Third, the discounted present value amount is added up.
T C I = t C I t ( 1 + r ) T 1 T 0
where T C I = total capital investment cost, C I t = capital investment cost at t year, r = discount rate, T1 = current year (the incurred cost year), T0 = base year.
The design criteria of KAPF+ is shown in Table 1. For reference, the share of the capital investment cost and capital investment cost by year needed for the construction of KAPF+ are shown in Table 2 [9]. The SFR cost estimation results are shown in Table 3 [12].

2.2. SFR Capital Investment Cost Expensing

SFR Capital Investment Cost Calculation

Because no SFR has yet been commercialized, the SFR capital investment cost was calculated using the engineering cost estimation method. Currently, the BOP (Balance of Plant) conceptual design is being carried out for the SFR [12]. Accordingly, the amount of cost increase or decrease of the SFR was estimated for each capital-investment-cost category based on the difference between the SFR design concept and existing PWR (pressurized water reactor) designs.
(1) Cost of the NSSS (Nuclear Steam Supply System)
The SFR NSSS (which includes the reactor) is the part that produces the most difference compared to a PWR design. Accordingly, the cost was estimated utilizing a scale adjustment for the output capacity as shown in Equation (2), and the calculation result is shown in Table 3 [12].
C N S S S = N S S S C S F R 1 u n i t ×    C f    ×    M F =    C S F R 1 u n i t ×    1.95    ×    ( C A S F R 800 C A S F R 150 ) m
where C N S S S = 2 unit NSSS cost of SFR800, N S S S C S F R 1 u n i t = SFR 1 unit NSSS cost of 150 MWe, C f = conversion factor of 2 unit, M F = modification factor for capacity, C A S F R 150 = capacity of SFR 150, C A S F R 800 = capacity of SFR 800, m = multiplier (0.5).
(2) Cost of the turbine-generator
The SFR turbine-generator cost was calculated with scale adjustment using procurement appropriation data on a recently commercialized nuclear facility (Advanced Power Reactor 1400 (APR 1400)), which is the basis shown in Equation (3). At this time, 0.62 (which is used generally for the turbine-generator) was applied as the adjustment factor, and calculation result is shown in Table 4 [12].
C T = T G C A P R 1400 2 u n i t s × ( C A S F R 800 C A A P R 1400 ) m
where C T = 2 unit turbine-generator cost, T G C A P R 1400 2 u n i t s = 2 unit turbine-generator cost of APR 1400, C A A P R 1400 = capacity of APR 1400, C A S F R 800 = capacity of SFR 800, m = multiplier (0.62).
(3) Other cost calculation results
Other costs were calculated with the scale adjustment method (as for the NSSS facility and turbine-generator cost calculation method). According to a report by KAERI, the construction of one unit of SFR 800 FOAK requires an overnight capital investment cost of 2952.9 million US$ and a capital unit cost of 3691 US$/kWe [12].

3. Electricity Generation Cost and Pyro-SFR Nuclear-Fuel-Cycle Cost Calculation

Electricity generation cost can be divided into two main parts: reactor cost and nuclear fuel cycle cost [13]. Here, reactor costs include capital investment cost for reactor construction, reactor operation and maintenance costs, decontamination & decommissioning (D & D) costs, and disposal cost [14]. Moreover, the nuclear fuel cycle cost can be classified into front-end nuclear fuel cycle cost and back-end nuclear fuel cycle cost [15].
Figure 1 and Figure 2 demonstrate the sequence for calculating the nuclear fuel cycle cost of direct disposal and Pyro-SFR recycling [2]. The nuclear fuel cycle cost can be calculated inversely, which is in the following order: fabrication, enrichment, conversion, and uranium cost, using the time to discharge the nuclear fuel from the reactor after use as the starting point [16]. This is because it is possible to calculate the uranium consumption amount needed during the fabrication process from the amount of nuclear fuel generated after use. As such, the sequence for calculating the nuclear fuel cycle cost is as follows: calculation of the front-end nuclear fuel cycle cost first, followed by the calculation of the back-end nuclear fuel cycle cost for storage, Pyro-processing, and disposal [17].

3.1. Reactor Cost Calculation

The amount of electricity generated from direct disposal (Once-through: OT) and the Pyro-SFR nuclear fuel cycle (for calculation of the electricity generation cost) is determined by Equations (4) and (5), respectively [13].
E O T = T i G T i p w r T i ( 1 + r ) T i T 0
where E O T = the amount of electricity generation for OT, G T i P W R (the amount of electricity generation from PWR at Ti) = P C × 365 × C f T i × 24 , PC = power capacity, C f T i = capacity factor at time Ti, Ti = current year, T0 = base year, r = discount rate.
E p y r o S F R = T i G T i p w r + T i G T i S F R T i ( 1 + r ) T i T 0
where E p y r o S F R = the amount of electricity generation for the Pyro-SFR fuel cycle, G T i S F R = the amount of electricity generation from the SFR.
The PWR capital investment cost for the direct disposal option is provided by Equation (6) [16].
C c a p i t a l O T = T i G T i p w r T i ( 1 + r ) T i T 0 × U C P W R   c a p i t a l
where C c a p i t a l O T = the capital investment cost of OT, U C P W R   c a p i t a l = the capital unit cost of PWR.
Moreover, the capital investment cost for the Pyro-SFR nuclear fuel cycle can be calculated using Equation (7) [18].
C c a p i t a l P y r o S F R = T i G T i p w r T i ( 1 + r ) T i T 0 × U C P W R   c a p i t a l + T i G T i S F R T i ( 1 + r ) T i T 0 × U C S F R   c a p i t a l
where C c a p i t a l P y r o S F R = the capital investment cost of Pyro-SFR fuel cycle, and U C S F R   c a p i t a l = the capital unit cost of the SFR.
The PWR operation and maintenance costs for direct disposal are provided by Equation (8) [15].
C O & M O T = T i G T i p w r T i ( 1 + r ) T i T 0 × U C P W R   O & M
where C O & M O T = operating and maintenance (O&M) cost of OT, U C P W R   O & M = operating and maintenance unit cost of PWR.
Moreover, the operation and maintenance costs for the Pyro-SFR nuclear fuel cycle can be expressed as in Equation (9) [15].
C O & M P y r o S F R = T i G T i p w r T i ( 1 + r ) T i T 0 × U C P W R   O & M + T i G T i S F R T i ( 1 + r ) T i T 0 × U C S F R O & M
where C O & M P y r o S F R = O&M cost of Pyro-SFR fuel cycle, and U C S F R   O & M = operating and maintenance unit cost of the SFR.
The PWR D&D cost for direct disposal is provided by Equation (10).
C D & D O T = T i G T i p w r T i ( 1 + r ) T i T 0 × U C P W R   D & D
where C D & D O T = D&D (decommissioning and disposal) cost of OT, and U C P W R   D & D = D&D unit cost of the PWR.
Moreover, the disposal cost for the Pyro-SFR nuclear fuel cycle can be expressed by Equation (11) [19].
C D & D P y r o S F R = T i G T i p w r T i ( 1 + r ) T i T 0 × U C P W R   D & D + T i G T i S F R T i ( 1 + r ) T i T 0 × U C S F R   D & D
where U C S F R   D & D = D&D unit cost of the SFR.

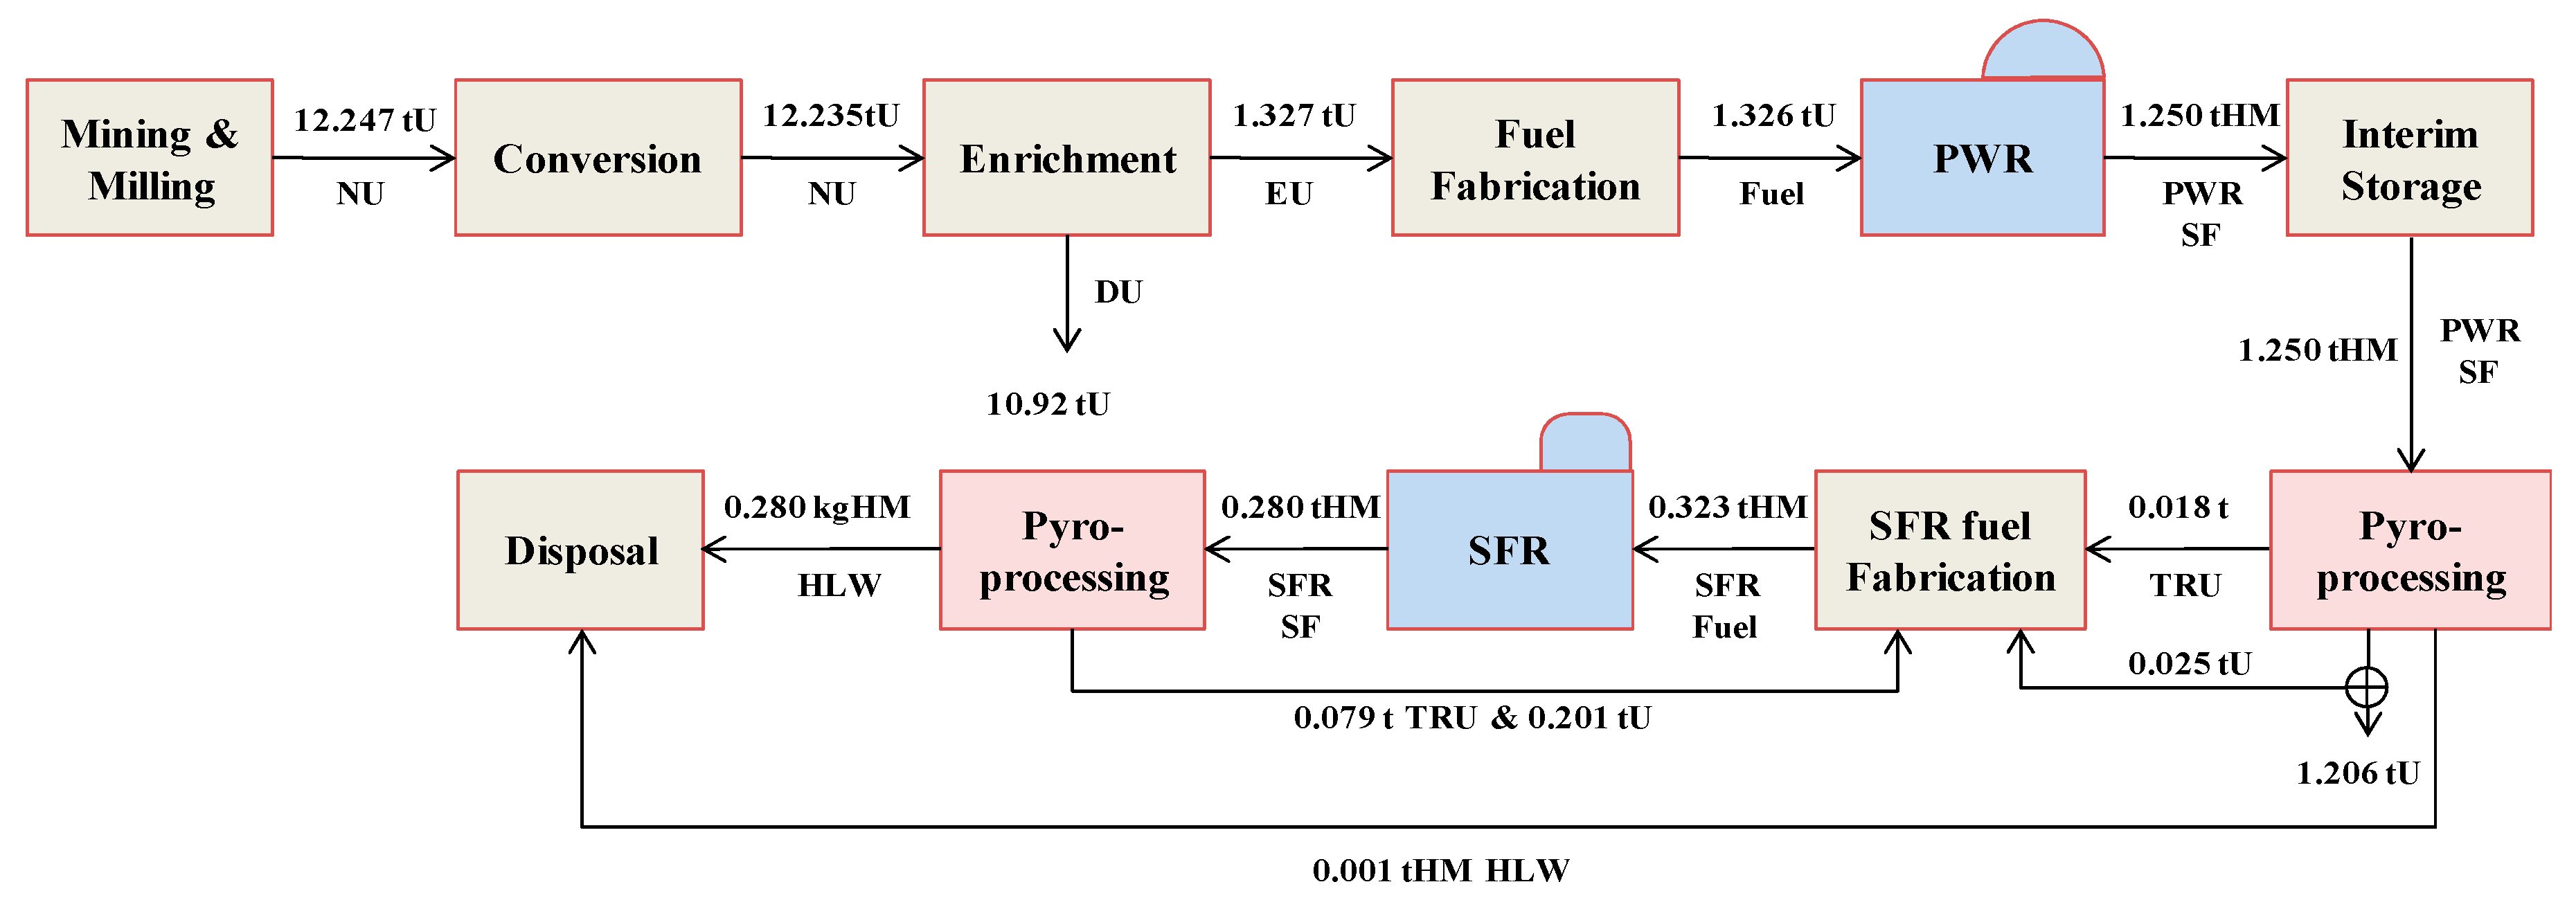
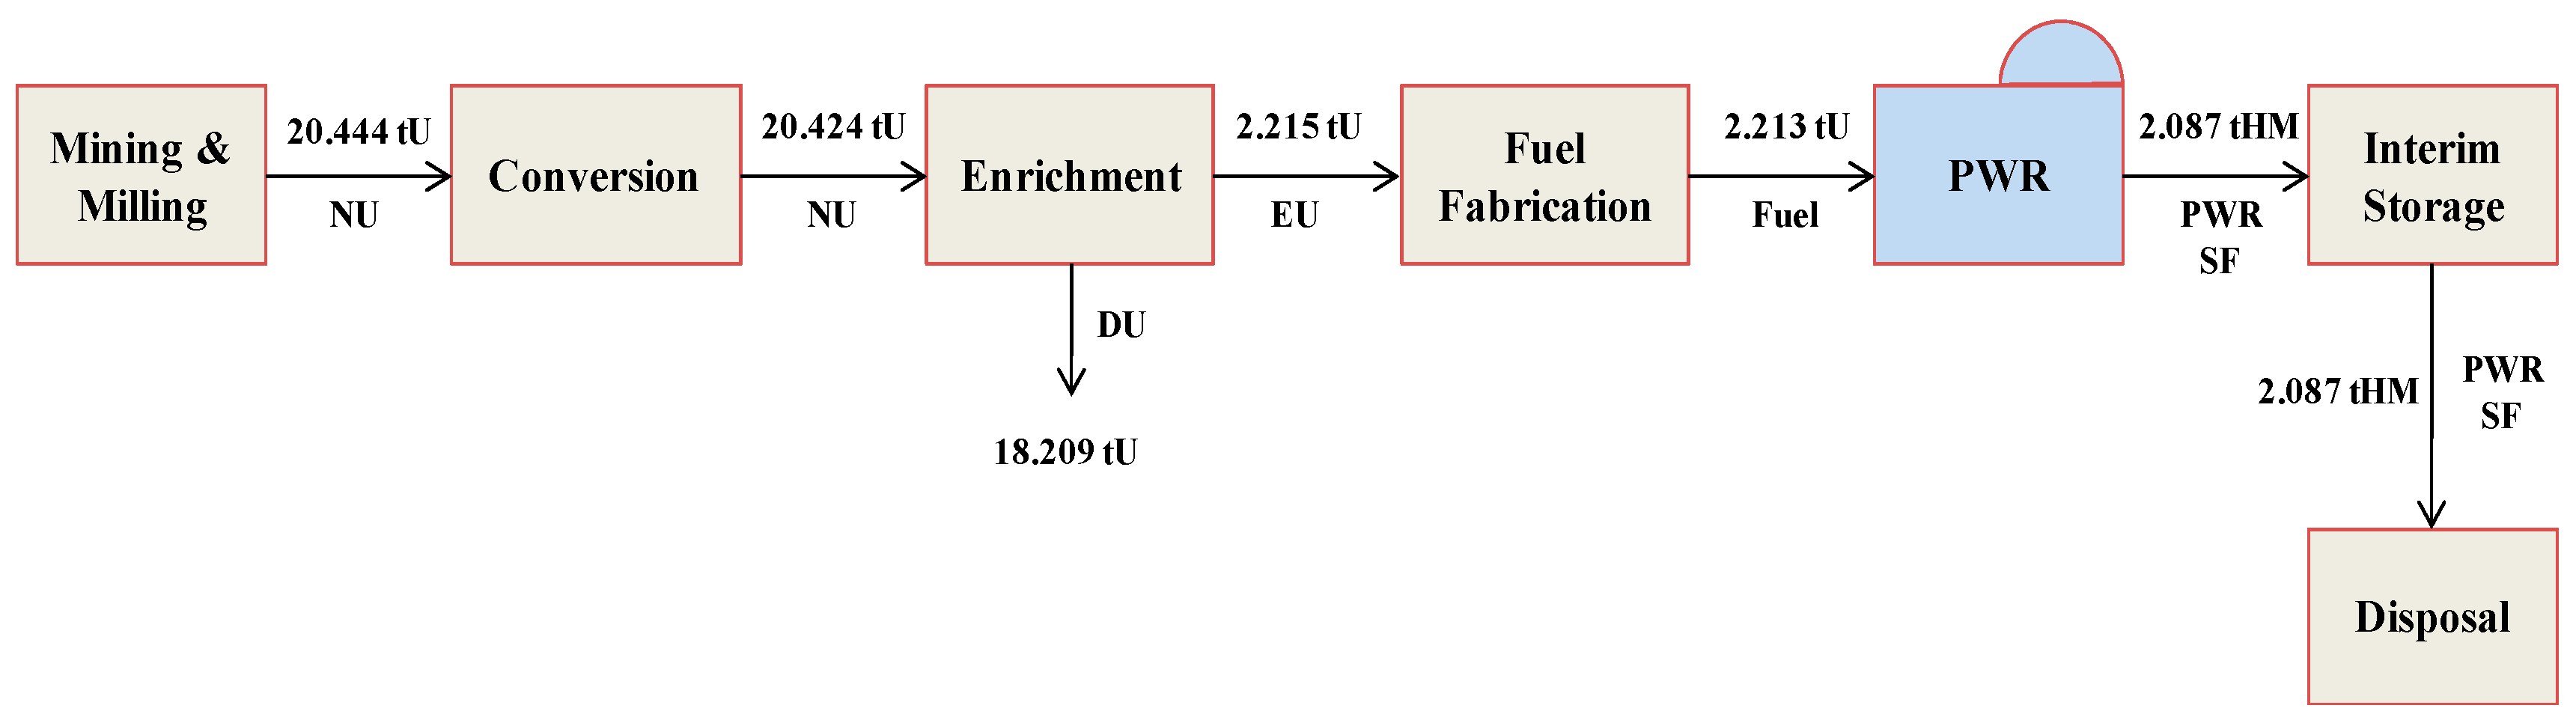
3.2. Nuclear Fuel Cycle Cost Calculation

The cost of uranium for the direct disposal option can be obtained using Equation (12) [15].
C u r a n i u m O T = U C u r a n i u m × F E E D e n r i c h m e n t × L
where C u r a n i u m O T = uranium cost of OT, U C u r a n i u m = unit cost of uranium, F E E D e n r i c h m e n t = feed for PWR fuel enrichment ( F A B P W R   f u e l × i n i t i a l   e n r i c h m e n t ( % ) t a i l   a s s a y ( % ) n a t u r a l   U   e n r i c h m e n t ( % ) t a i l   a s s a y ( % ) ), F A B P W R   f u e l = the amount of PWR fuel fabrication (= S F A P W R ), S F A P W R = the amount of PWR SF Arising ( C A P P W R × 365 × C f b u r n u p × e f f i c i e n c y × ( 1 a n n u a l   U   c o n s u m e   r a t e ) ), C A P P W R = capacity of PWR, C f = capacity factor, L = loss rate.
The uranium cost for the Pyro-SFR nuclear fuel cycle is calculated using Equation (13).
C u r a n i u m P y r o S F R = U C u r a n i u m × A U N P W R × L
where C u r a n i u m P y r o S F R = uranium cost of Pyro-SFR fuel cycle, A U N P W R = Annual U needed for PWR in SFR cycle.
Equation (14) demonstrates the direct disposal conversion cost calculation method.
C c o n v e r s i o n O T = U C c o n v e r s i o n × F E E D e n r i c h m e n t × L
where C c o n v e r s i o n O T = conversion cost of OT, U C c o n v e r s i o n = unit cost of conversion.
Enrichment cost for Pyro-SFR nuclear fuel cycle can be calculated using Equation (15) [18].
C e n r i c h m e n t P y r o S F R = U C e n r i c h m e n t × E N R I C H P W R × L
where E N R I C H P W R = enrichment (ktSWU) (PWR fuel fabrication (kt) × (2 × initial enrichment 1 ) × log i n i t i a l e n r i c h m e n t 1 i n i t i a l e n r i c h m e n t + t a i l s × ( 2 × t a i l   a s s a y 1 ) × log t a i l   a s s a y 1 t a i l   a s s a y a n n u a l   U   n e e d e d   f o r   P W R i n   S F R   c y c l e   × ( 2 × n a t u r a l   U   e n r i c h m e n t 1 ) × log n a t u r a l   U   e n r i c h m e n t 1 n a t u r a l   U   e n r i c h m e n t ), t a i l s = annual U needed for PWR in SFR cycle (kt) PWR fuel fabrication (kt), annual U needed for PWR in SFR cycle = feed for PWR fuel enrichment.
The PWR fuel fabrication cost for direct disposal can be obtained using Equation (16).
C f a b r i c a t i o n O T = U C f a b r i c a t i o n × F A B P W R   f u e l × L
where C f a b r i c a t i o n O T = fabrication cost of OT, U C f a b r i c a t i o n = unit cost of fabrication, F A B P W R f u e l = the amount of fabrication for the PWR fuel.
Fabrication cost for the Pyro-SFR nuclear fuel cycle is calculated using Equation (17).
C f a b r i c a t i o n P y r o S F R = U C f a b r i c a t i o n × F A B S F R   f u e l
where C f a b r i c a t i o n P y r o S F R = fabrication cost of Pyro-SFR, U C f a b r i c a t i o n = unit cost of fabrication, F A B S F R   f u e l = the amount of Pyro-SFR metal fuel fabrication.
The PWR fuel dry transportation and storage cost for direct disposal can be calculated using Equation (18).
C T r a n s & s t o r a g e O T = U C T r a n s & s t o r a g e × S F A P W R
where C T r a n s & s t o r a g e O T = transportation and storage cost of OT, U C T r a n s & s t o r a g e = unit cost of transportation and storage, S F A P W R = PWR spent fuel arising.
The dry transportation and storage costs for the Pyro-SFR nuclear fuel cycle can be expressed as in Equation (19).
C T r a n s & d r y   s t o r a g e P y r o S F R = i f ( U C T r a n s & s t o r a g e × A N A F ) < 0 ,   C T r a n s & s t o r a g e ,   0 )
where C T r a n s & d r y   s t o r a g e P y r o S F R = transportation and storage cost of Pyro-SFR fuel cycle, U C T r a n s & s t o r a g e = unit cost of transportation and storage, ANAF = Annually newly added fuel for storage (fabrication quantity × (1 HM annual consumption rate) annually quantity of PWR Pyro treatment).
The PWR fuel Pyro-processing cost for the Pyro-SFR nuclear fuel cycle can be calculated by using Equation (20) [20].
C P y r o   t r e a t m e n t P y r o S F R = U C P y r o   t r e a t m e n t × P Y R P W R   SF
where P Y R P W R   SF = Pyro treatment of PWR SF ( a n n u a l   T R U   c o n s u m p i o n   i n   B N + a n n u a l   T R U   c o n s u m p i o n   i n   B E T R U   m a s s   f r a c t i o n   i n   P W R   S F ), annual TRU consumption in BN = TRU of initial burner core with 800 MWe (unit: kt) × input number of BN + input number of BN × annual TRU consumption of burner (unit: kt), TRU of initial burner core with 800 MWe (kt) = U of initial burner core (kt) × 0.3, annual TRU consumption in BE = TRU of initial breakeven core with 800 MWe (unit: kt) × input number of BE + input number of BE × annually TRU consumption in equilibrium core (unit: kt).
Equation (21) describes the cost of storage to allow for the decay of the Pyro-SFR nuclear fuel cycle cesium and strontium.
C d e c a y   storage P y r o S F R = U C d e c a y   s t o r a g e × D S Q C s & S r
where U C d e c a y s t o r a g e = unit cost of decay storage, D S Q C s & S r = decay storage quantity of Cs&Sr.
The PWR fuel encapsulation cost calculation for direct disposal is done using Equation (22).
C p a c k i n g O T = U C p a c k i n g × S F A P W R
where C p a c k i n g O T = PWR SF packing cost, U C p a c k i n g = unit cost of packing, S F A P W R = spent fuel arising of PWR.
Equation (23) is used to calculate the encapsulation cost of the Pyro-SFR nuclear fuel cycle Pyro-waste material.
C p a c k i n g P y r o S F R = U C p a c k i n g × D S × W P y r o   t r e a t m e n t
where C p a c k i n g P y r o S F R = disposal packing cost HLW from Pyro-processing, DS = the amount of decay storage, W P y r o t r e a t m e n t = produced waste from 1 ton PWR SF Pyro treatment
The PWR fuel disposal cost for direct disposal can be calculated from using Equation (24).
C d i s p o s a l O T = U C d i s p o s a l × S F A P W R × E V U
where C d i s p o s a l O T = disposal cost of OT, U C d i s p o s a l = disposal unit cost, EVU = excavation volume unit (m3/tHM).
The disposal cost for the Pyro-SFR nuclear fuel cycle is provided by Equation (25).
C d i s p o s a l P y r o S F R = U C d i s p o s a l × ( ( T B E   f u e l × M F F P s   i n   S F R ( 1.00 ) S F + T B N   f u e l × M F F P s   i n   S F R ( 0.70 ) S F ) × D H S F R   f u e l × E V U + P Y R O T P W R   S F × M F F P s   i n   P W R   S F × D H P W R   f u e l × E V U )
where C d i s p o s a l P y r o S F R = disposal cost of Pyro-SFR fuel cycle, T B E   f u e l = annual BE fuel treatment (kt), M F F P s   i n   S F R ( 1.00 ) S F = FPs mass fraction in SFR(1.00) SF, T B N   f u e l = annual BN fuel treatment (kt), M F F P s   i n   S F R ( 0.70 ) S F = FPs mass fraction in SFR(0.70) SF, D H S F R   f u e l = decay heat( W t M H ) of FPs from SFR SF 50 year cooling, P Y R O T P W R   S F = Pyro treatment of PWR SF (kt), M F F P s   i n   P W R   S F = FPs mass fraction in PWR SF, D H P W R   f u e l = PWR SF decay heat after 50 years.

3.3. Electricity Generation Cost Calculation

The levelized capital cost for the calculation of the electricity generation cost is provided by Equation (26) [15].
L C C = t [ C A P × U C c a p i t a l × ( 1 + r ) T 0 T 1 ] t [ C A P × C f × 365 × 24 × ( 1 + r ) T 0 T 1 ]
where LCC = levelized capital cost (mills/kWh), CAP = capacity, U C c a p i t a l = capital unit cost, C f = capital factor, T0 = base year, T1 = current year.
Equation (27) provides the levelized electricity generation cost [15].
L G C = t C ( 1 + r ) T T 0 t G ( 1 + r ) T T 1
where LGC = levelized generation cost (mills/kwh), T = T A + T B , T A = time for front-end fuel cycle ( T l o a d i n g T l e a d ), T l o a d i n g = nuclear fuel loading time, T l e a d = lead time, T0 = cost base year, T B = time for back-end fuel cycle ( T d i s c h arg i n g T l a g ), T d i s c h arg i n g = spent fuel discharging time, T l a g = lag time, T1 = starting reactor operation year.

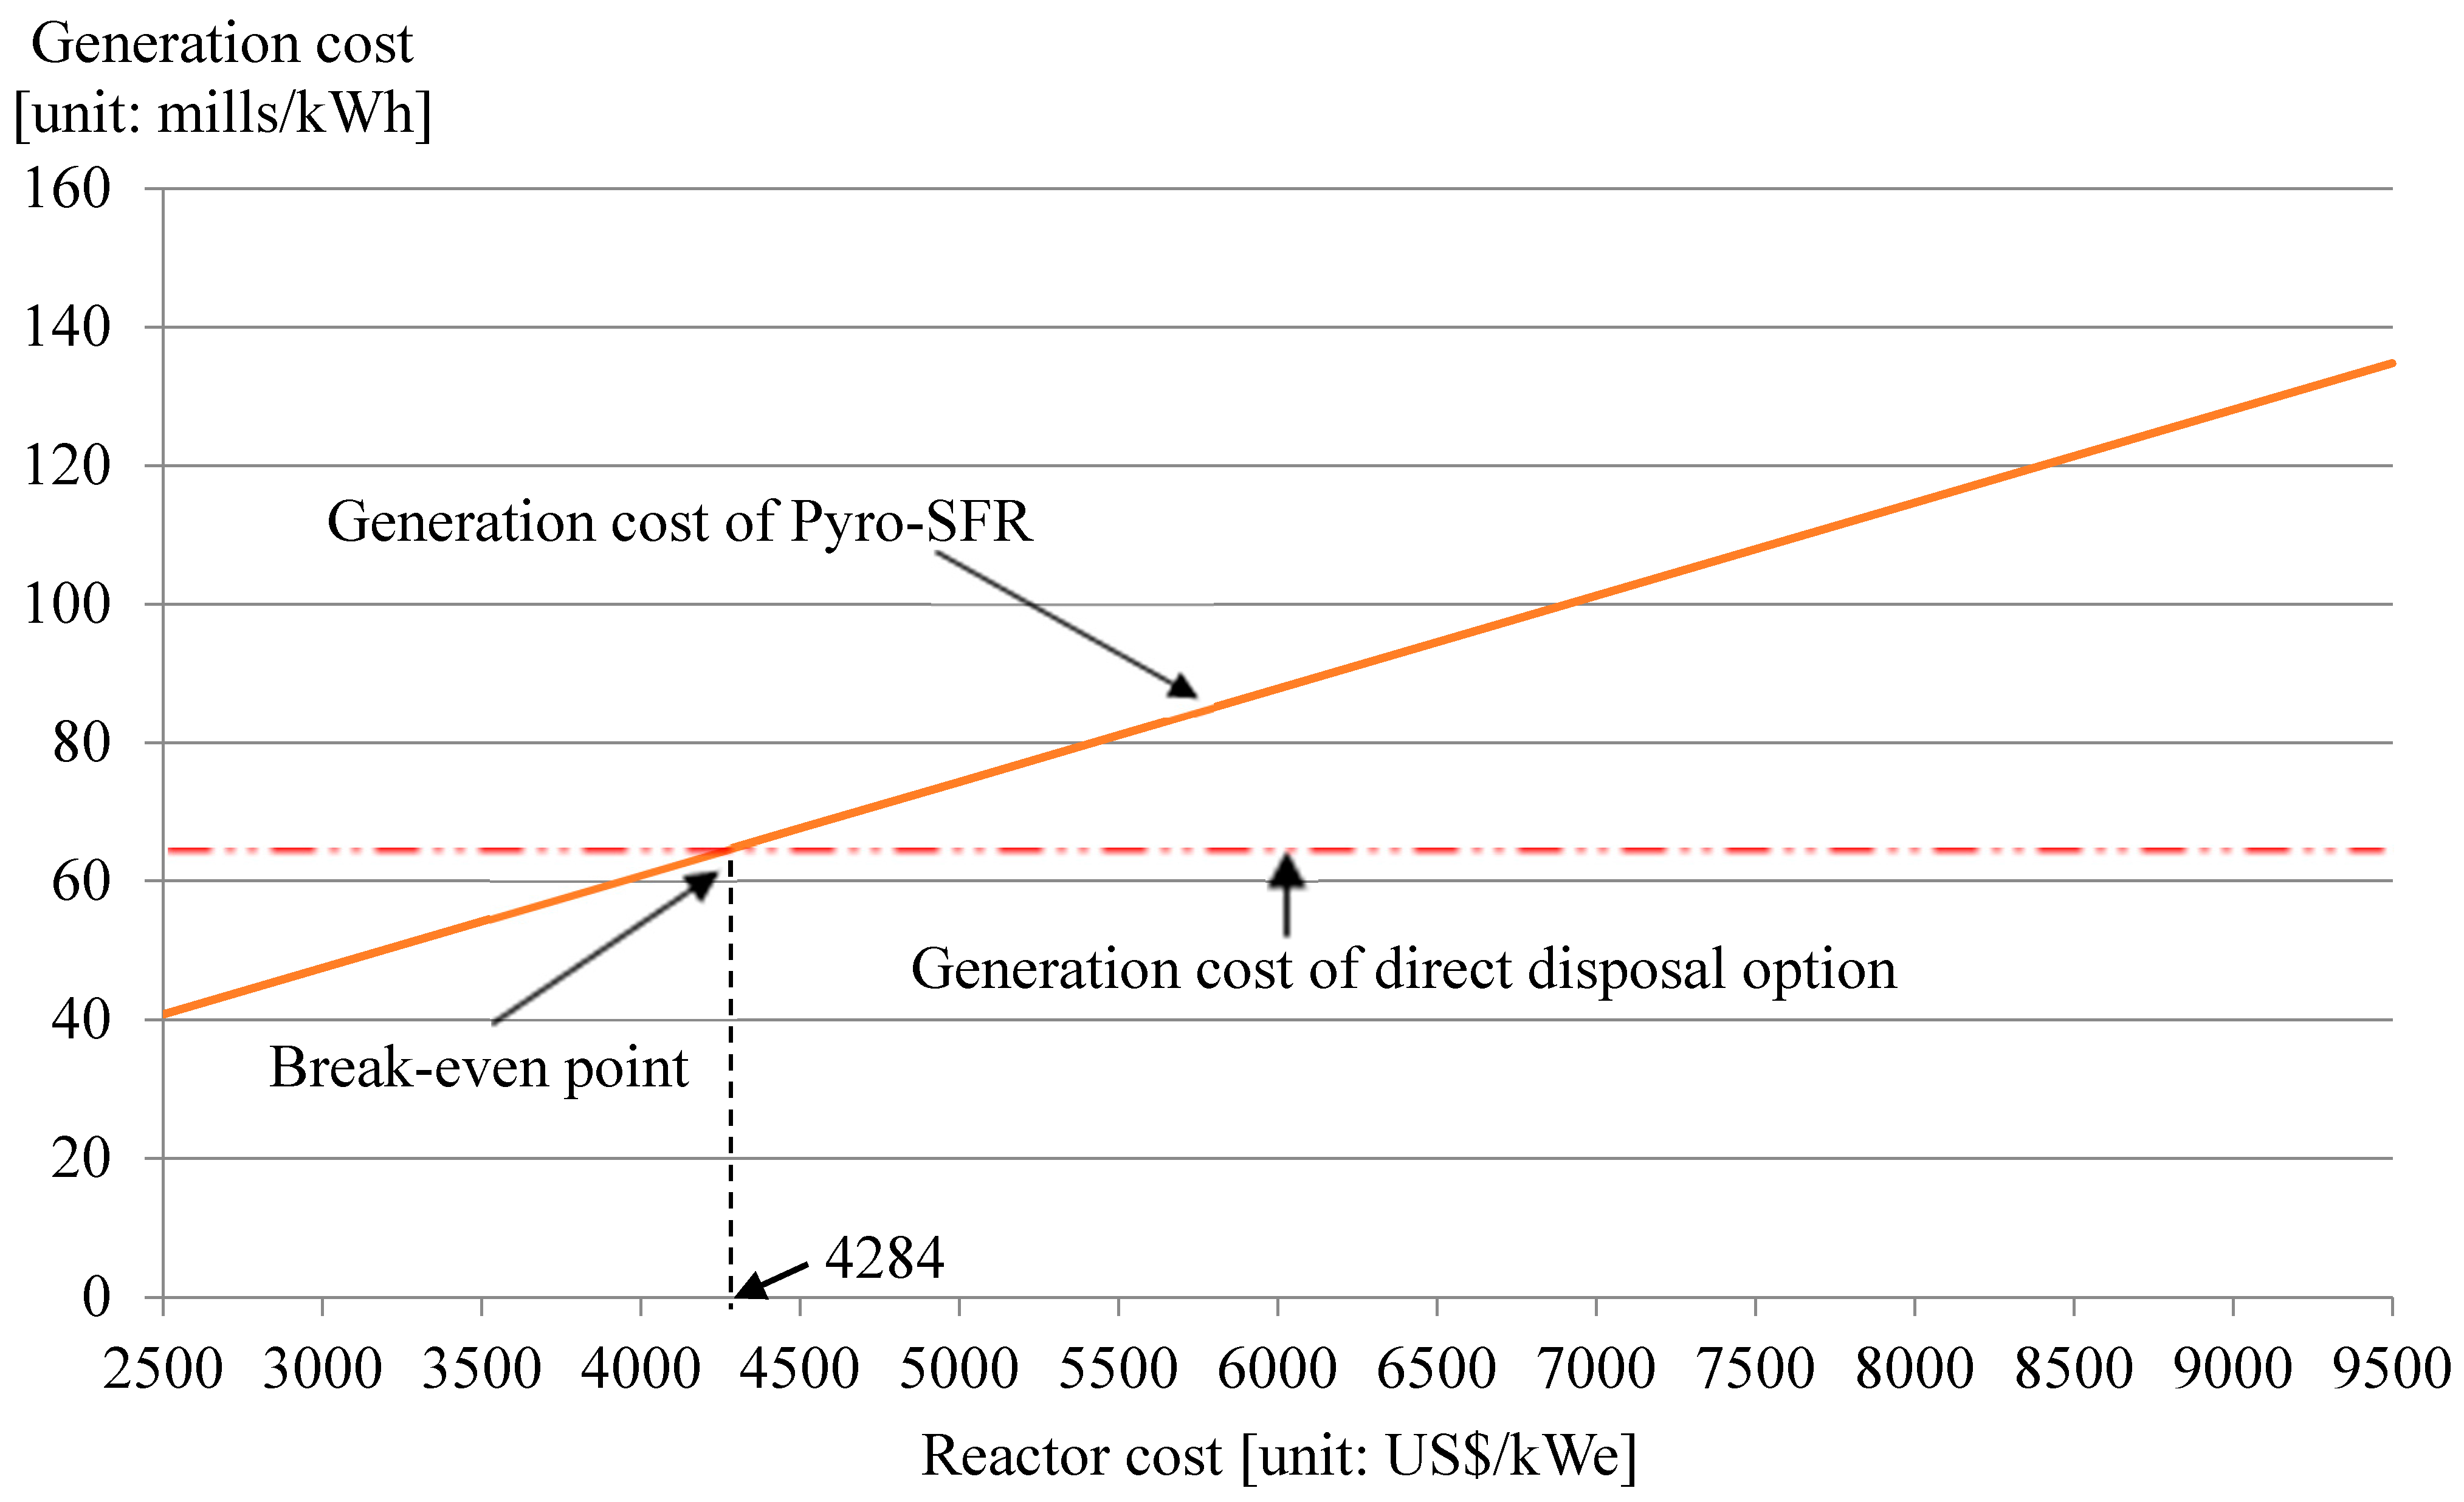
3.4. Break-Even Point Calculation

Equation (28) shows how to determine the break-even point of capital investment cost for choosing between the Pyro-SFR fuel cycle and direct disposal option [21,22].
B E P S F R c a p i t a l =    T C D ( R C S F R c a p i t a l + F C C P y r o S F R )
where B E P S F R c a p i t a l = a break-even point of the SFR capital investment cost, T C D = the total cost of direct disposal option, R C S F R c a p i t a l = the reactor (including the capital investment) cost of SFR, F C C P y r o S F R = the Pyro-SFR fuel cycle cost, including the Pyro-processing cost.
Both Equations (29) and (30) are used to calculate the break-even point using the accounting method [23,24,25].
B E P A c c o u n t i n g = F C U C M
where F C = the fixed cost = the reactor cost, and U C M = the unit contribution margin.
U C M = T R V C Q
where T R = the total revenue, V C = the variable cost, and Q = the output (the quantity of electricity generation).

3.5. Cost Calculation Results

Input data for the calculation of the direct disposal option and Pyro-SFR nuclear fuel cycle electricity generation cost is shown in Table 5, and the reactor cost input data is shown in Table 6 [11]. In addition, the nominal discount rate was used to calculate the generation costs, and TRU metal fabrication is employed because Korea is considering metal SFR fuel.
An equilibrium model was used to calculate the electricity generation cost for the direct disposal option and for the Pyro-SFR nuclear fuel cycle option. The results are shown in Table 7, and were calculated as (64.70 and 74.75) mills/kWh, respectively. Accordingly, the difference in the cost of electricity generation between the two options was approximately 10 mills/kWh.

4. Break-Even Point Analysis of the SFR Capital Investment Cost for the Pyro-SFR Nuclear Fuel Cycle Option and the Direct Disposal Option

The capital investment cost makes up the largest share of the Pyro-SFR nuclear fuel cycle electricity generation costs. In other words, the SFR capital investment cost is the most important factor affecting the Pyro-SFR nuclear fuel cycle economics. Accordingly, the break-even point of the SFR capital investment cost was calculated to inform the choice between the Pyro-SFR nuclear fuel cycle and direct disposal options.
It is necessary to consider the reactor cost intentionally in order to ensure sound economics for the Pyro-SFR nuclear fuel cycle. This is because the SFR capital investment cost is known to be higher than the PWR reactor cost [3].
The break-even point was calculated using the engineering method. As a result, when the SFR capital investment cost is 4284 US$/kWe or less, as shown in Figure 3, it was shown that the Pyro-SFR nuclear fuel cycle is comparatively economic compared to the direct disposal option. Here, only the SFR capital investment cost was input as a variable, in order to calculate the break-even point for the SFR capital investment cost, while other costs were assumed to be consistent [26].
According to the Hyundai Engineering Company’s SFR 800 MWe capital investment cost estimate (3691 US$/kWe) [2], is less than the break-even value (4284 US$/kWe). Accordingly, Pyro-SFR nuclear fuel cycle was proven to be more economical than the direct disposal option. However, the nominal value of the SFR capital investment cost reported in the NEA (Nuclear Energy Agency) report was 5032 US$/kWe, it was shown that the capital investment cost is larger than the break-even value (4284 US$/kWe).
One reason that the estimated values of the SFR capital investment cost were different (Hyundai vs. NEA) is because the economic environment (labor cost, price of raw material, construction period, and others) varies by nation. After construction of the first commercialized SFR, an increasingly more accurate normalized capital investment cost can be input for future evaluation of its economics.

5. Conclusions and Implication

The economics of the Pyro-SFR nuclear fuel cycle and direct disposal options was evaluated using the electricity generation cost as the standard. However, the reactor capital investment cost makes up the greatest share of the electricity generation cost. Accordingly, the break-even point of the reactor capital investment cost is important.
The reactor capital cost, accounting for more than 60% of the electricity generation cost [8], is an important cost driver. Sensitivity analysis was not carried out because the cost of uranium or SWU (Separate Work Unit) costs, which accounts for the highest proportion of nuclear fuel cycle cost, is less than 10% of the electricity generation cost [8].
An equilibrium model was used to calculate the electricity generation cost for the direct disposal option and for the Pyro-SFR nuclear fuel cycle option (64.70 and 74.75 mills/kWh, respectively). Accordingly, the difference in the cost of electricity generation between the two options was approximately 10 mills/kWh.
Moreover, the break-even point of the SFR capital investment cost between the Pyro-SFR nuclear fuel cycle and direct disposal option was calculated to be 4284 US$/kWe. Thus, when the SFR capital investment cost is 4284 US$/kWe or less, the analysis shows that the Pyro-SFR nuclear fuel cycle will be comparatively more economical than the direct disposal option.
Hyundai Engineering Company’s SFR 800 MWe capital investment cost estimate (3691 US$/kWe) is less than the break-even value (4284 US$/kWe). Accordingly, the Pyro-SFR nuclear fuel cycle was proven to be more viable economically than the direct disposal option.
However, the nominal SFR capital investment cost reported in the NEA report was 5032 US$/kWe, which is larger than the break-even value (4284 US$/kWe) calculated in this paper. Thus, further design development of the SFR technology is needed to lower the SFR capital investment cost.
The costs calculated in this study are the present costs after discounting for the relevant years. This study calculated the break-even point based on past resources, and compared economic feasibility using the different fast reactor capital costs calculated by Korea and NEA. The Pyro-SFR method has better economic feasibility than direct disposal when using the fast reactor capital cost calculated by Korea, but not so when using the cost calculated by NEA. This can be traced to the differences in economy and the level of construction technology, which determine the construction cost. For instance, Korea’s construction cost for light water reactors is the lowest in the world.
In making a decision between direct disposal and Pyro-SFR, the various factors to be taken into account include economic feasibility, public acceptance, international dynamics, national policy, and environmental pollution. Among these factors, this study focused on economic feasibility, which is regarded as the most important. The final outcome may be different if sustainability and other factors are included in the evaluation criteria, in addition to economic feasibility.
In addition, the aspect of economic feasibility is necessary to judge an optimized fuel cycle alternative. This is because the best fuel cycle option can be elicited through the evaluation of multi-criteria, such as safety and technology, environmental impact, economic feasibility, proliferation resistance, social factors (including public acceptance), etc.
To estimate the fuel cycle costs, the construction cost of a HLW (high-level waste) repository in the future and the disposal cost must be considered to estimate the fuel cycle costs. In Korea, the objects of disposal cost are limited to the deep geological repository covering PWR-spent fuel on the assumption that the PWR’s initial enrichment is 4.5% and its burn-up is 55 GWD/MTU. In addition, the cooling time is assumed to last for 10 years [14]. To decrease the uncertainty, the actual disposal cost of KRS (Korea Reference System) to dispose HLW (high-level waste) will be considered in the future.
Compared to direct disposal, the Pyro-SFR method presents the following advantages. First, the Pyro-SFR method is more likely to be accepted by the public. In Korea, it is difficult to acquire repositories for high-level radioactive waste because of the limited land and high population density. Second, Pyro-SFR is associated with high proliferation resistance, which is favorable in terms of international dynamics and national policy. Since Pyro-SFR cannot be used to extract plutonium during the recycling process, it has higher proliferation resistance than PUREX (Plutonium-URanium EXtraction), which involves easier reprocessing of plutonium. Third, this method is more environmentally friendly. Due to the significant decrease in disposal amount, Pyro-SFR does not require disposal sites to be as large, thus posing less of the environmental risks that may arise from earthquakes or leakage. Ultimately, the Pyro-SFR method is superior to direct disposal in terms of the sustainability of nuclear power. As such, Pyro-SFR is likely to be a feasible method even if factors other than economic feasibility are considered.
It should be noted that this analysis is limited in the sense that the value of the SFR capital investment cost estimated based on the conceptual design was used as the input data. After the first commercialized SFR is constructed, a more accurate analysis on the economics of the nuclear fuel cycle option should be possible.

Acknowledgments

This work was supported financially by the Ministry of Science, ICT, and Future Planning under the Nuclear R & D Project, and the authors express their sincere gratitude for supporting this important work.

Author Contributions

The main theme of this paper was developed by Sungki Kim and was coordinated by Sungsig Bang. Sungki Kim wrote the manuscript and Sungsig Bang prepared the submission process of this paper. Hong Jang, Ruxing Gao, and Chulmin Kim prepared the equations, tables, figures. Yanghon Chung commented on the results and conclusions, and all the authors reviewed the manuscript.

Conflicts of Interest

The authors declare no conflicts of interest.

References

  1. Cerullo, N.; Lomonaco, G. Generation IV reactor designs, operation and fuel cycle. In Nuclear Fuel Cycle Science and Engineering; Woodhead Publishing: Cambridge, UK, 2012; pp. 333–395. [Google Scholar]
  2. Kim, S.K.; Ko, W.I.; Youn, S.R.; Gao, R.; Bang, S.S. Advanced fuel cycle cost estimation model and its cost estimation results for three nuclear fuel cycles using a dynamic model in Korea. Nucl. Eng. Des. 2015, 293, 159–165. [Google Scholar] [CrossRef]
  3. Organization for Economic Cooperation and Development/Nuclear Energy Agency (OECD/NEA). Advanced Nuclear Fuel Cycles and Radioactive Waste Management; OECD Publishing: Paris, France, 2006; pp. 243–244.
  4. Kang, S.J. The Theory of Cost Estimation; Dunam Press: Seoul, Korea, 2010; pp. 25–33, 341–345. [Google Scholar]
  5. Korea Atomic Energy Research Institute (KAERI). Development of System Engineering Technology for Nuclear Fuel Cycle; KAERI/RR-3426: Daejeon, Korea, 2011; p. 186. [Google Scholar]
  6. Weygandt, J.J.; Kieso, D.E.; Kimmel, P.D. Accounting Principles; Wiley: Danvers, MA, USA, 2008; pp. 422–441. [Google Scholar]
  7. Amos, S.J. Skills & Knowledge of Cost Engineering; AACE International Press: Morgantown, WV, USA, 2004; p. 96. [Google Scholar]
  8. Organization for Economic Cooperation and Development/Nuclear Energy Agency (OECD/NEA). The Economics of the Back-End of the Nuclear Fuel Cycle; OECD Publishing: Paris, France, 2013; p. 65.
  9. Korea Atomic Energy Research Institute (KAERI). Preliminary Conceptual Design and Cost Estimation for Korea Advanced Pyroprocess Facility Plus (KAPF+); KAERI/CM-1382: Daejeon, Korea, 2010; pp. 103–104. [Google Scholar]
  10. Bang, S.; Chung, Y.; Chun, D.; Kwon, C.; Hong, S. Cost estimation and efficiency analysis of Korean CANDU spent fuel disposal alternatives in consideration of future price volatility. Sci. Technol. Nucl. Install. 2016, 2016. [Google Scholar] [CrossRef]
  11. Shropshire, D.E.; Williams, K.A.; Boore, W.B.; Smith, J.D.; Dixon, B.W.; Dunzik-Gougar, M.; Adams, R.D.; Gombert, D. Advanced Fuel Cycle Cost Basis; Idaho National Laboratory (INL): Idaho Falls, ID, USA, 2009; pp. 21–23.
  12. Yang, Y.J.; Park, G.J.; Jo, S.H.; Kim, S.C.; Kim, M.C.; Jong, Y.H.; Park, S.E. An Economic Feasibility Study on the Introduction Scenarios of Sodium-Cooled Fast Reactor; KAERI/CM-2007; KAERI: Daejeon, Korea, 2014; pp. 44–45. [Google Scholar]
  13. Bunn, M.; Fetter, S.; Holdren, J.P.; Van Der Zwaan, B. The Economics of Reprocessing vs. Direct Disposal of Spent Nuclear Fuel; Harvard University: Cambridge, MA, USA, 2003; pp. 13–17. [Google Scholar]
  14. Korea Atomic Energy Research Institute (KAERI). Geological Disposal System Development; KAERI/RR-2336; KAERI: Daejeon, Korea, 2002; pp. 660–663. [Google Scholar]
  15. Organization for Economic Cooperation and Development/Nuclear Energy Agency (OECD/NEA). The Economics of the Nuclear Fuel Cycle; OECD Publishing: Paris, France, 1993; pp. 95–97.
  16. Massachusetts Institute of Technology (MIT). The Future of the Nuclear Fuel Cycle; MIT: Cambridge, MA, USA, 2011; p. 72. [Google Scholar]
  17. Shimazu, Y. Fuel Cycle Cost Analysis on Molten-Salt Reactors. J. Nucl. Sci. Technol. 1976, 13, 190–198. [Google Scholar] [CrossRef]
  18. Kim, S.K.; Ko, W.I.; Lee, Y.H. Economic Viability of Metallic Sodium-Cooled Fast Reactor Fuel in Korea. Sci. Technol. Nucl. Install. 2013, 2013. [Google Scholar] [CrossRef]
  19. Hyundai Engineering Co., Ltd. The Development of Cost Estimation System for Nuclear Liability; Hyundai Engineering Co., Ltd.: Seoul, Korea, 2009; pp. 63–75. [Google Scholar]
  20. Korea Atomic Energy Research Institute (KAERI). Development of Head-End Pyrochemical Reduction Process for Advanced Oxide Fuels; KAERI/RR-2939; KAERI: Daejeon, Korea, 2007; p. 35. [Google Scholar]
  21. Xia, L.; Luo, D. A method for calculating economic critical depth of shale gas resources in China via break-even analysis. J. Nat. Gas Sci. Eng. 2014, 21, 1091–1098. [Google Scholar] [CrossRef]
  22. Keast, S.L.; Jacobs, E.; Harrison, D.; Farmer, K.; Thompson, D. Future economic outlook of Nebraska rural community pharmacies based on break-even analysis of community operational costs and county population. Res. Soc. Adm. Pharm. 2010, 6, 209–220. [Google Scholar] [CrossRef] [PubMed]
  23. Potkany, M.; Krajcirova, L. Quantification of the volume of products to achieve the break-even point and desired profit in non-homogeneous production. Procedia Econ. Financ. 2015, 26, 194–201. [Google Scholar] [CrossRef]
  24. Morano, P.; Tajani, F. The break-even analysis applied to urban renewal investments: A model to evaluate the share of social housing financially sustainable for private investors. Habitat Int. 2017, 59, 10–20. [Google Scholar] [CrossRef]
  25. Hatch, M.D.; Daniels, S.D.; Glerum, K.M.; Higgins, L.D. The cost effectiveness of vancomycin for preventing infections after shoulder arthroplasty: A break-even analysis. J. Shoulder Elbow Surg. 2017, 26, 472–477. [Google Scholar] [CrossRef] [PubMed]
  26. Kim, S.K.; Ko, W.I.; Kim, H.D.; Revankar, S.T.; Zhou, W.; Jo, D. Cost–benefit analysis of BeO–UO2 nuclear fuel. Prog. Nucl. Energy 2010, 52, 813–821. [Google Scholar] [CrossRef]
Figure 1. Direct disposal (Once-through: OT) cycle [2].
Sustainability 09 01518 g001
Figure 2. Pyro-SFR recycling [2].
Sustainability 09 01518 g002
Figure 3. The break-even point of capital investment cost between Pyro-SFR fuel cycle option and direct disposal option.
Sustainability 09 01518 g003
Table 1. The design criteria of KAPF+.
CategoryKAPF+
Site area272,000 m2 (680 m × 400 m)
CapacityFront-end: 400 tHM/year, Temporary storage: 400 tHM/year,
Pyroprocess: 200 tHM/year/module × 2 module
Capacity factor55% (200 day/year)
Life time60 year
Raw materialPWR spent fuel
ProductsU, U/TRU metal ingot
Waste (ceramic, metal, etc.)
Table 2. The capital investment cost of KAPF+.
Category5% Discounted Amount (Unit: kUS$)Ratio (%)
Capital Cost261,18033.5
O & M (Operation and Maintenance) Cost496,21963.7
D & D (Decommission and Disposal) Cost21,9882.8
Total779,386100
Table 3. The SFR cost estimation results [12] (unit: million US$).
CategorySFR1200 FOAK * × 2 UnitSFR800 FOAK × 2 Unit
NSSS1702.21389.9
* FOAK: First Of A Kind.
Table 4. The SFR turbine-generator cost estimation results [12] (unit: million US$).
CategorySFR1200 FOAK × 2 UnitsSFR800 FOAK × 2 Units
SFR turbine-generator386.9300.9
Table 5. Input data.
Cost ItemsValueUnitsRemarks
Uranium50US$/kgUSpot market price as of September in 2015
Conversion10US$/kgUSpot market price as of September in 2015
Enrichment120US$/SWUSpot market price as of September in 2015
Pyro-process for PWR S/FUO2 Pyro (reduction/refining)850US$/kgHMKAERI 2010, Ko et al., 2014 conceptual KAPF
Fuel fabricationUO2 Fuel270US$/kgHMAdvanced Fuel Cycle Cost Basis, INL (2009)
Pyro-process for SFR S/FPyro-process for SFR S/F1860US$/kgHMAdvanced Fuel Cycle Cost Basis, INL (2009)
TRU Metal Fabrication4070US$/kgHMAdvanced Fuel Cycle Cost Basis, INL (2009)
Transport/StorageUO2 S/F Dry Storage495US$/kgHMMinistry of Knowledge Economy 2012
Decay storage (Cs/Sr)131US$/kgHMAdvanced Fuel Cycle Cost Basis, INL (2009)
DisposalPacking CostSpent Fuel_UO2718US$/kgHMMinistry of Knowledge Economy 2012
HLW230,730US$/m3OECD/NEA (2006)
Geological disposal cost (Excavation)1384US$/m3OECD/NEA (2006)
PWR SF Transport76US$/kgHMHyundai Engineering Co. (2009),
PWR SF Transport, Seoul, Korea
Waste DataUnit volume for SF1.5m3/tHM1994 OECD-NEA
Unit volume of HLW from UOX Pyro0.115m3/tHMSame as UOX PUREX
Unit volume of HLW from SFR Pyro0.033m3/tHMno voloxidation/reduction process
Table 6. Reactor cost [11].
CategoryUnit Cost (US$/kWe, 2015 USD)Remarks
PWRCapital cost4266Advanced Fuel Cycle Cost Basis, INL (2009)
O&M cost, D&D cost72
Total4338
SFRCapita cost5032Advanced Fuel Cycle Cost Basis, INL (2009)
O&M cost, D&D cost77
Total5109
Table 7. Comparison of the generation cost between direct disposal and Pyro-SFR recycle.
CategoryDirect Disposal CyclePyro-SFR Recycle
Reactor cost (mills/kWh)58.2668.61
Nuclear fuel cycle cost (mills/kWh)6.446.14
Electricity generation cost (mills/kWh)64.7074.75

