Article

Influencing Factors of the Adoption of Agricultural Irrigation Technologies and the Economic Returns: A Case Study in Chaiyaphum Province, Thailand

1
Natural Resources Management, School of Environment, Resources and Development, Asian Institute of Technology, Pathumthani 12120, Thailand
2
Faculty of Career Development, Kyoto Koka Women’s University, Kyoko 615-0882, Japan
*
Author to whom correspondence should be addressed.
Sustainability 2017, 9(9), 1524; https://doi.org/10.3390/su9091524
Submission received: 5 June 2017 / Revised: 10 August 2017 / Accepted: 23 August 2017 / Published: 27 August 2017

Abstract

:
This empirical research investigates the factors influencing the adoption of three irrigation technologies using a probit statistical model: water wheel (WW), water pump (WP), and weir (WR) irrigation technologies as well as their economic returns per unit of rice cultivated area. The influencing factors were categorized into demographic, socioeconomic, topographical, institutional, and attitudinal factor groups by 207 rice-growers in the Chaiyaphum province in northeastern Thailand. The results revealed that the land holding size, farm income, and water use association (WUA) membership factors were highly positively associated with the WW adoption. Meanwhile, age, farm income, skills training, and WUA membership were negatively correlated with the WP adoption. Nevertheless, proximity to a water source and upstream farmland location were positively correlated with the WP adoption. The WR adoption was positively associated with age but negatively correlated with the land holding size, upstream farmland location, and group participation factors. The cost–benefit analysis indicated that the WW irrigation scheme generated the highest economic return with the benefit-to-cost ratio schemes. The findings suggest that the WW irrigation technology would be deployed in the water management of other agricultural areas in the region to overcome the unfavorable geography and alleviate the local farmers’ disadvantageous economic conditions.

1. Introduction

Irrigation technology allows for the control and distribution of water to meet varying needs within a water system, such as agricultural, industrial, and household needs [1,2]. According to Davivongs et al. [3], water is a vital economic resource—especially in agriculture, as it plays a crucial role in the fertility of agricultural lands. In addition, accessibility to water resources contributes to improving the livelihoods of small-scale farm households [4]. According to Namara et al. [5], agricultural water needs entail the provision of water to and channeling it from the growing areas as well as the conservation of water for dry seasons and ecological maintenance. In Thailand, agriculture provides rural employment, guarantees food security, and drives economic growth. Thus, successive governments have attached importance to agricultural and rural development through a series of development programs and agricultural reforms. In fact, the country has implemented numerous irrigation projects over the past five years in parallel with the agricultural and rural development.
Most of the country’s water resources development or irrigation projects were large-scale and constructed from the 1950s to the 1970s. However, only one-fifth (4.8 million ha) of the country’s total agricultural lands (21.1 million ha) benefited from the irrigation schemes. Thus, various small-scale development programs were launched in the 1980s to improve the economic well-being of the rural poor individuals, particularly rice farmers. The development of water resources was a part of these programs [6]. Despite the efforts, several agricultural areas in Thailand still experience shortages of water supply—especially those in the northeast (NE) region. The NE region has lower seasonal rainfalls, poorer soils, and a greater proportion of undulating terrain in comparison with other regions of the country. In this region, only 8% of the region was irrigated while the remaining 92% was either rain-fed or partially irrigated by the water harvested from high ground [7].
An irrigation scheme is a systematic approach to managing water in the farmland whereby the water is provided to and channeled away from the farmland, and also includes the conservation of water for dry seasons and ecological maintenance. Nevertheless, there is evidence of the lack of adoption of irrigation technology, giving rise to ineffective water resources management, perceived inequality in the water allocation, and low economic well-being [8,9]. The ultimate goal of an irrigation scheme is to enhance the economic performance with minimal water and energy consumption [8,10,11]. To that end, it is of great use to establish an understanding of the physical, social, economic, attitudinal, and ecological dimensions of agricultural water management (i.e., agricultural irrigation), in addition to their relationship to the irrigation technology choice. Specifically, having insight into the influencing factors or determinants of irrigation technology adoption helps in the formulation of effective water management strategies [8]. Moreover, the acceptance of water management technology for appropriate agricultural practices could further increase the capacity of agricultural production and improve the efficacy of water usage in farming. Accordingly, it is regarded as an important strategic approach for water conservation and management [12].
Nonetheless, the water resource management of a community relies on operational management for support. Because water resource management is a highly dynamic development process that must be adapted in accordance with the ecological condition of each region, sustainable management depends on the extensive consideration of major aspects, including the sustainability of the ecological system, the development of a community’s strength, and effective management practices. In order to achieve a sustainable coexistence with nature and the environment, it is important to prescribe regulations on the utilization of water resources, solutions to water resource issues through collaboration, exchange of knowledge, and the development of local communities to produce benefits.
This research investigates the factors influencing the adoption of three irrigation technologies by farmers in the NE of Thailand using a probit statistical model. These technologies include the water wheel (WW), water pump (WP), and weir (WR) irrigation technologies of a rice cultivation area (ha).

2. Materials and Methods

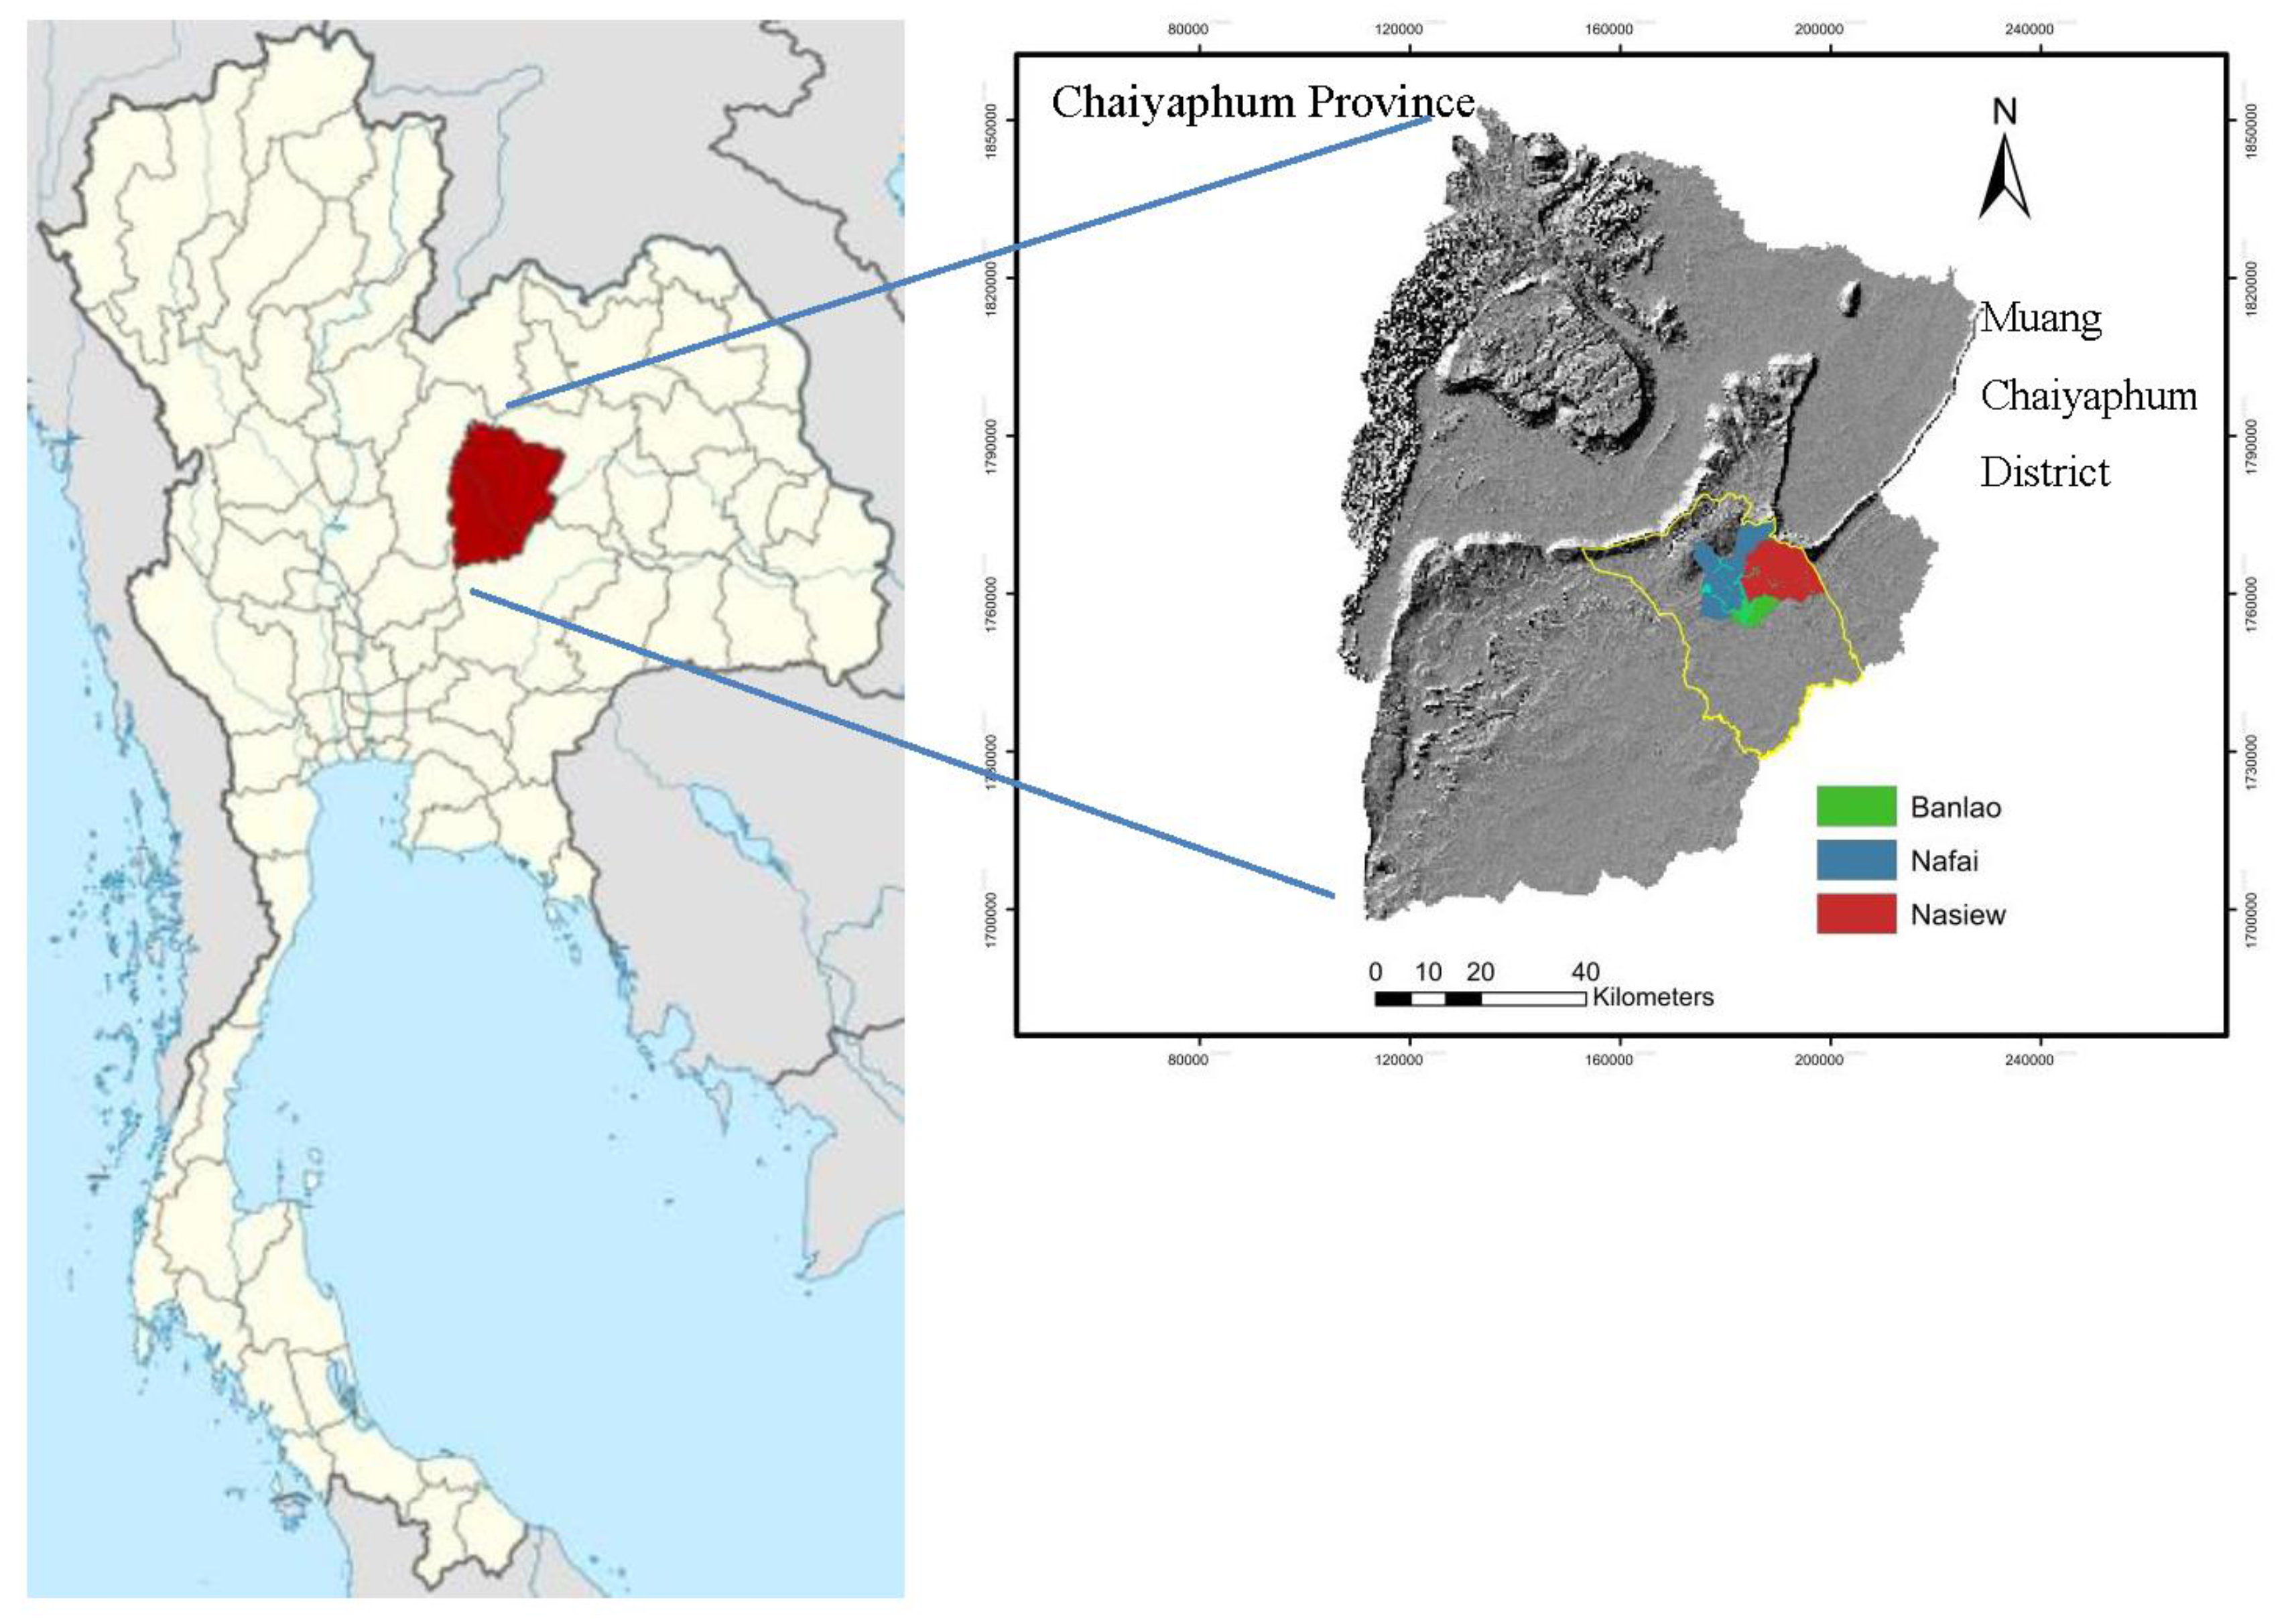
2.1. Study Area and Data Collection

This study focuses on the Muang district, Chaiyaphum Province of northeastern Thailand. The study area covered three rice-growing sub-districts along the Chi River basin in Thailand’s northeastern province of Chaiyaphum (Figure 1). The three sub-districts are Ban Lao, Na Fai, and Na Siew. Due to their geography, the annual rice cultivation was possible only in the wet season (May–October), with the Lam Pa Tow dam of the Chi River being the main source of irrigated water. In the Chaiyaphum province, the water from the Chi River basin was principally used for agriculture and household consumption purposes. According to [13], an estimated 60% of arable land along the Chi River basin was utilized for agriculture, 41% of which was for rice cultivation.
A field survey was carried out using a structured questionnaire to gather the quantitative data from the participating rice farming households in this study site. In addition, observations, in-depth interview sessions, focus-group discussions, and key informant interviews were undertaken for the background and qualitative data. Multi-stage sampling was utilized, whereby the Chaiyaphum province was first purposely selected. Following this, stratified sampling was applied to categorize the farming households by the irrigation technologies: the water wheel (WW), water pump (WP), and weir (WR). Finally, simple random sampling was used to obtain a total sample of 207 rice farming households, within which there are 30 WW, 130 WP, and 47 WR farmers.

2.2. Data Analysis

2.2.1. Household Characteristics

Both quantitative and qualitative data analyses were applied in this study. Descriptive statistics were used to describe the characteristics of the households by frequency, percentage, mean, and standard deviations. Chi-square and analysis of variance (ANOVA) were used to ascertain the differences in the demographics and socioeconomics of the participating rice farmers (207 sampled households) in relation to the various irrigation technologies (WW, WP, and WR). In addition, the ANOVA F-test was utilized to determine the statistical differences of the revenue and cost (financial) items among the variable irrigation schemes.

2.2.2. Factors Influencing Technology Adoption

A probit model [14,15,16] was used to investigate the factors influencing the adoption of diverse irrigation technologies (WW, WP, and WR) by the participating farming households.
Y i = β 0 + i = 1 14 β i X i + v
where Yi is the irrigation technology adoption (1 if adopted and 0 otherwise); β0 is the intercept; βi is a vector of the parameter estimates; Xi is a vector of the explanatory variables; and v is the random disturbance term.
Table 1 shows the explanatory (independent) variables (X1–X14), which are comprised of gender, age, education, farming experience, land holding size, farm income, labor, farmland location, proximity to water source, training, water use association (WUA) membership, information access, degree of participation, perceived equality of the water allocation, and the descriptions. The independent variables (X1–X14) were entered into the probit model to identify the determinants of the farmers’ adoption of the various irrigation technologies.
The influencing factors (X1–X14) were classified as demographic (X1–X4), socioeconomic (X5–X7), topographical (X8, X9), institutional (X10–X13), and attitudinal (X14) factors.

2.2.3. Economic Returns from Technology Adoption

Economic returns associated with the three irrigation technologies were analyzed using the cost and benefit method:
ER = R − PC
where R is revenues from the sale of rice based on the farm-gate price, and PC is the production cost. PC includes the costs of seeds, fertilizers, pesticides, fuel, and hired labor, while the benefit was the revenue.
In addition, the economic return per unit of input cost was determined using the benefit–cost ratio.

3. Results and Discussion

3.1. Demographic and Socioeconomic Factors

Table 2 shows the demographic and socioeconomic profiles of the participating rice farmers relative to the irrigation technologies (WW, WP, and WR), including gender (X1), age (X2), education (X3), rice farming experience (X4), land holding size (X5), and number of farm laborers (X7).

3.1.1. Gender

In Table 2, three-fifths (59.9%) of the participating farmers (207 farmers) were male and 40.1% were female. The Chi-square test result indicated that gender was not statistically significant (p > 0.05) with regard to the adopted irrigation technology.

3.1.2. Education Level
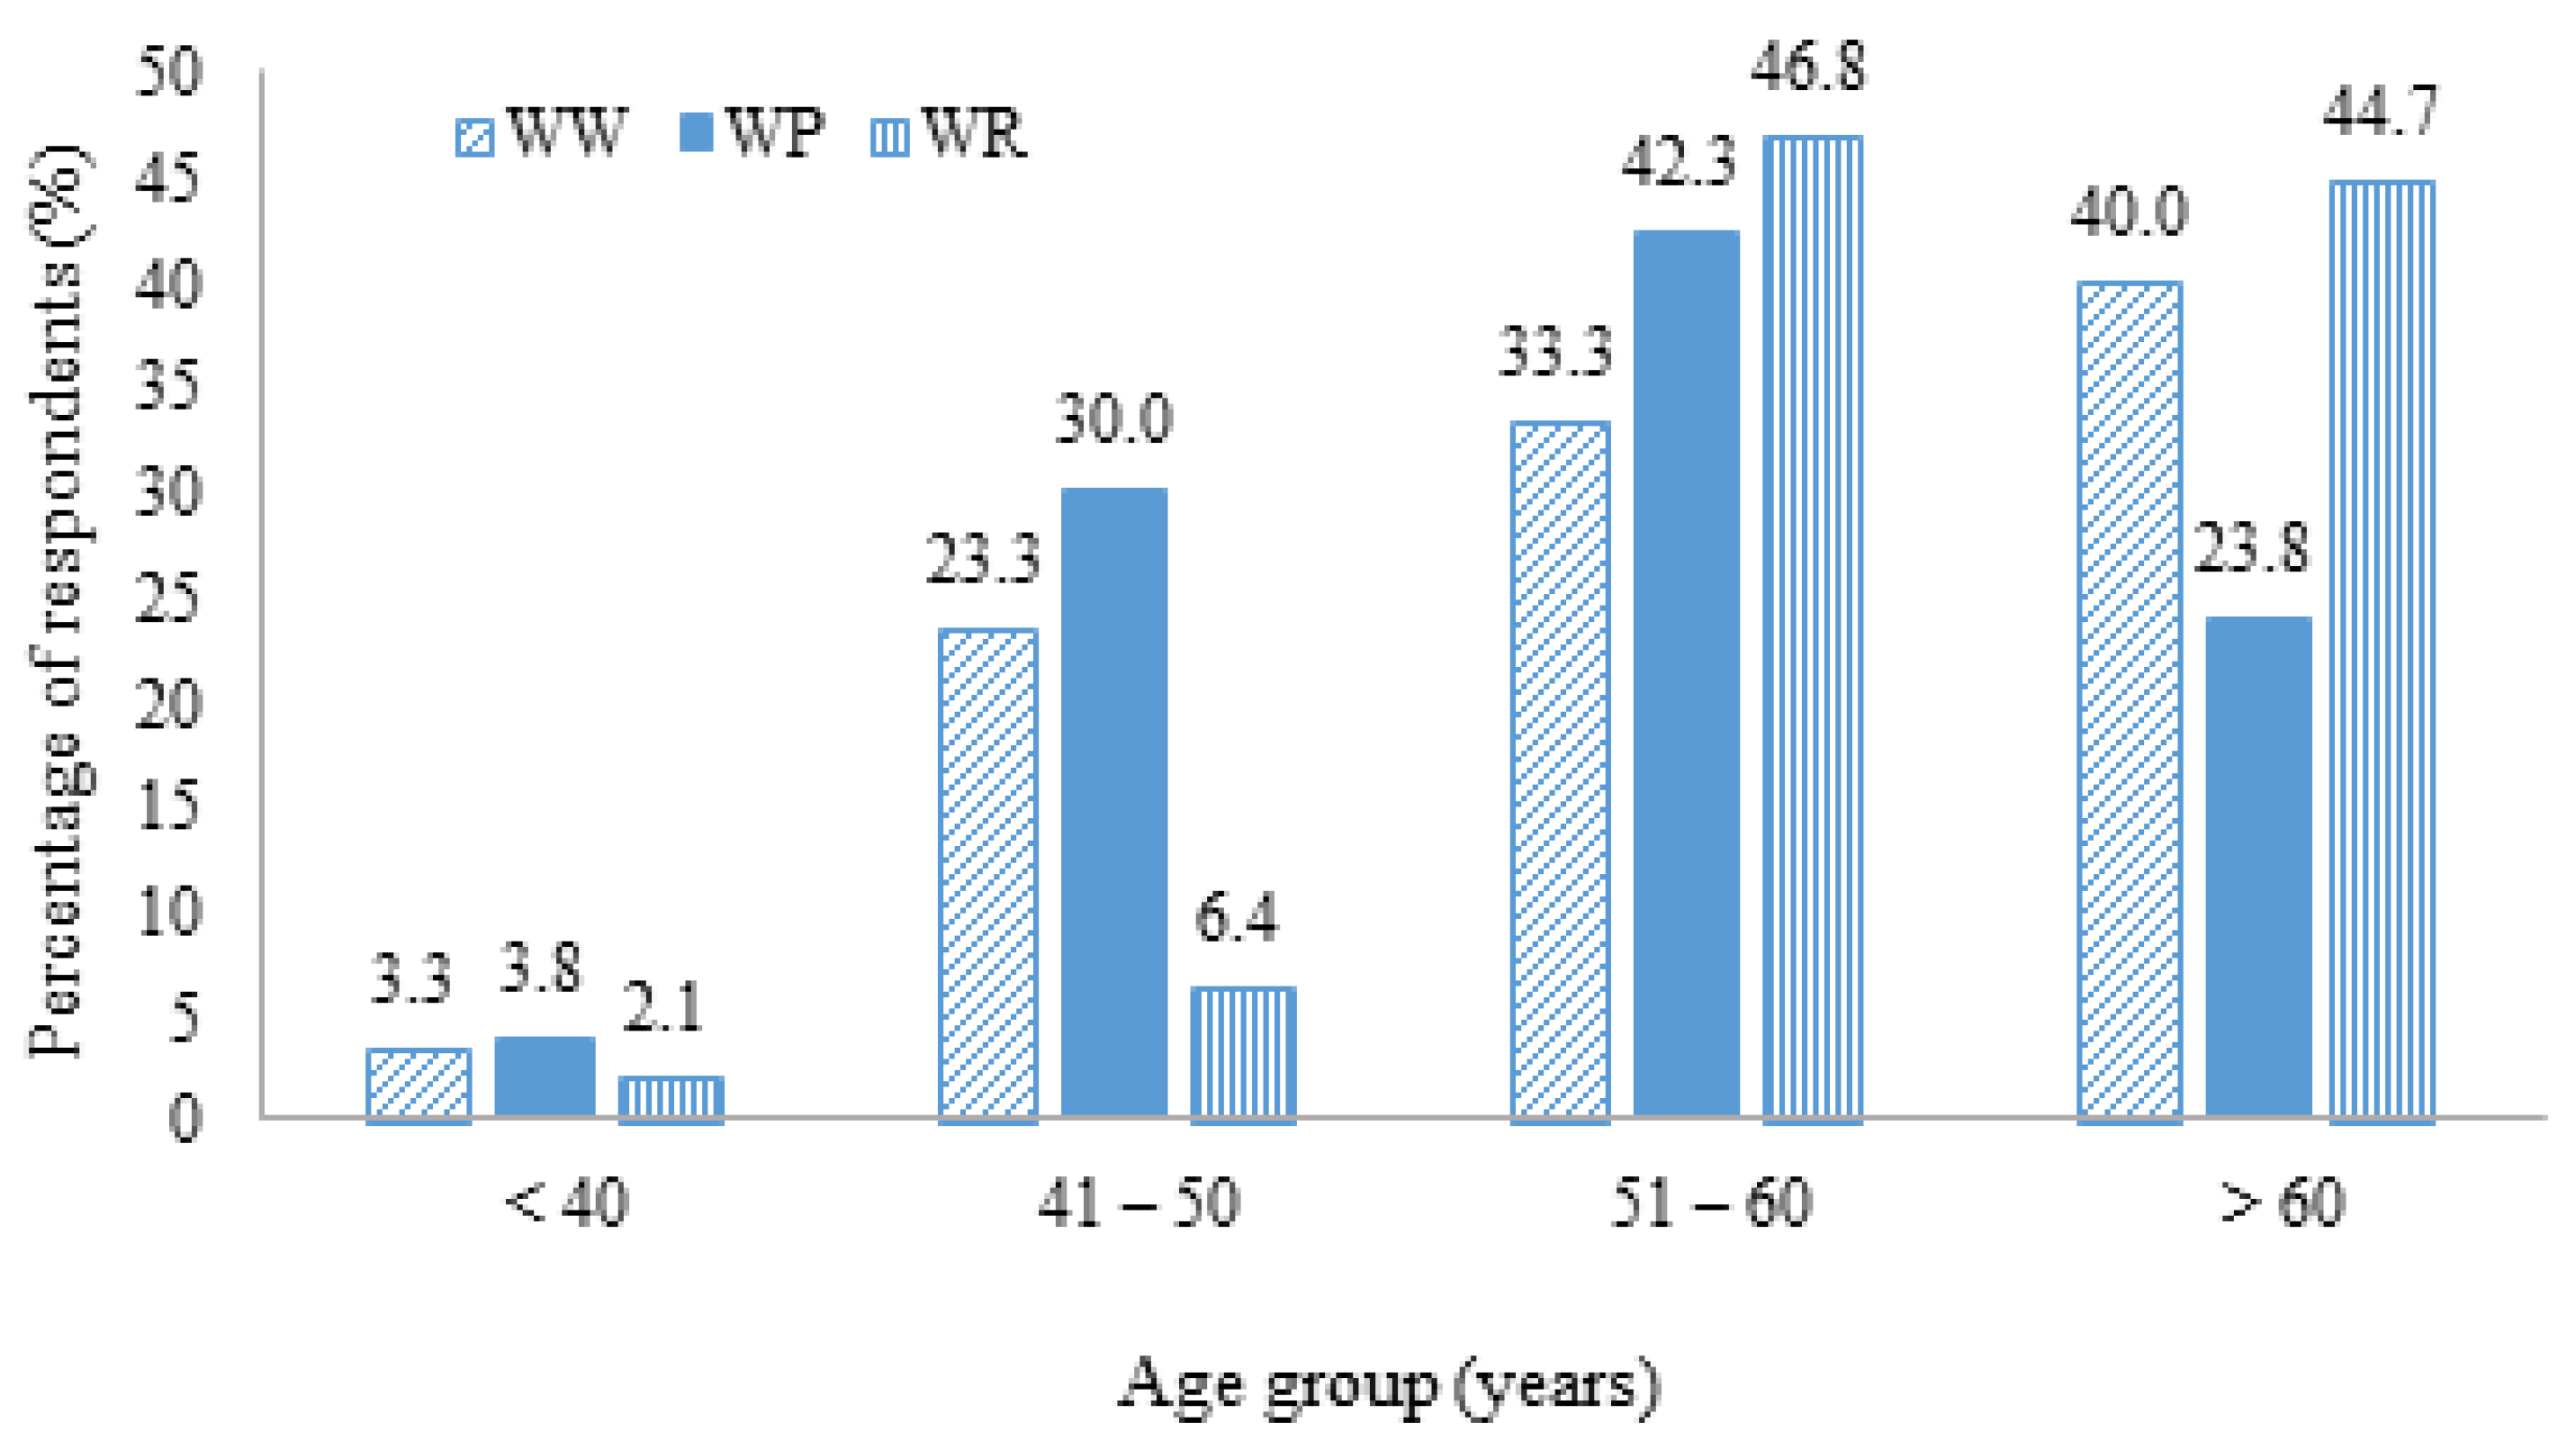
The participating farmers having only a primary school education accounted for 90.8%, followed by those with secondary school (6.3%) and tertiary (2.9%) education. The findings indicated that most of the farmers received little formal schooling. Nevertheless, the Chi-square test revealed that formal education was statistically insignificant with respect to the adopted irrigation schemes (p > 0.05).

3.1.3. Age

The respondents’ ages were classified into four age groups (Figure 2): below 40, 41–50, 51–60, and over 60, with the average age of 57.08 years. Overall, the 51–60 age group constituted the largest proportion (42.0%), followed by the 60-plus (30.9%), 41–50 (23.7%), and below 40 (3.4%) age groups. The findings suggested that younger generations are abandoning the rice farming profession for other employment due to the lack of capital to get into farming and the decline in the popularity of farming as a career choice following the societal values. As a consequence, the inheritance of the traditional technology of WW has declined in the young generation with group of 41–50 years of age. Currently, only a small proportion of the local people have knowledge of the management of WW irrigation technologies, and most of them are the old generation. Consequently, an absence of the inheritance of local knowledge and wisdom of water management to younger generations would contribute to the inability of local people to sustain the local knowledge regarding the use of water wheels. The use of water wheels is the traditional water management technology that is embedded in the rural community’s way of life. In terms of technology adoption for older generations of farmers, adoption rates of WR irrigation are high in the age group of 51–60 years, accounting for 46.8% of their corresponding group, 42.3% for WP, and 33.3% for WW (Figure 2).

3.1.4. Rice Farming Experience

The respondents’ years of rice farming experience were classified into five lengths of time: less than 10, 11–20, 21–30, 31–40, and over 40 years. The average length of rice farming experience was 33.21 years. Overall, the 21–30 group had the largest number of participants (32.9%), followed by the 31–40 (26.6%), 10–20 (22.2%), >40 (15.5%), and <10 (2.9%) groups. In fact, the findings were influenced by the factor of age, as the majority of the farmers were over 50 years old and thus had elongated rice farming experience. Nonetheless, the ANOVA result revealed that the length of farming experience was not statistically significant with regard to the adopted irrigation technology (p > 0.05).

3.1.5. Number of Farm Laborers

The number of farm laborers was categorized into three groups: 1–2, 3–4 and >4 laborers. Overall, the group with 3–4 laborers was the largest group (49.3%), followed by the 1–2 (44%) and >4 laborers (6.8%) groups. The findings were consistent with those of the land holding size, in that the majority of the farmers were small-scale farmers (<3.2 ha) and thus required few farm laborers. The ANOVA results indicated that the number of farm laborers was statistically insignificant with regard to the choice of the irrigation technology (p > 0.05).

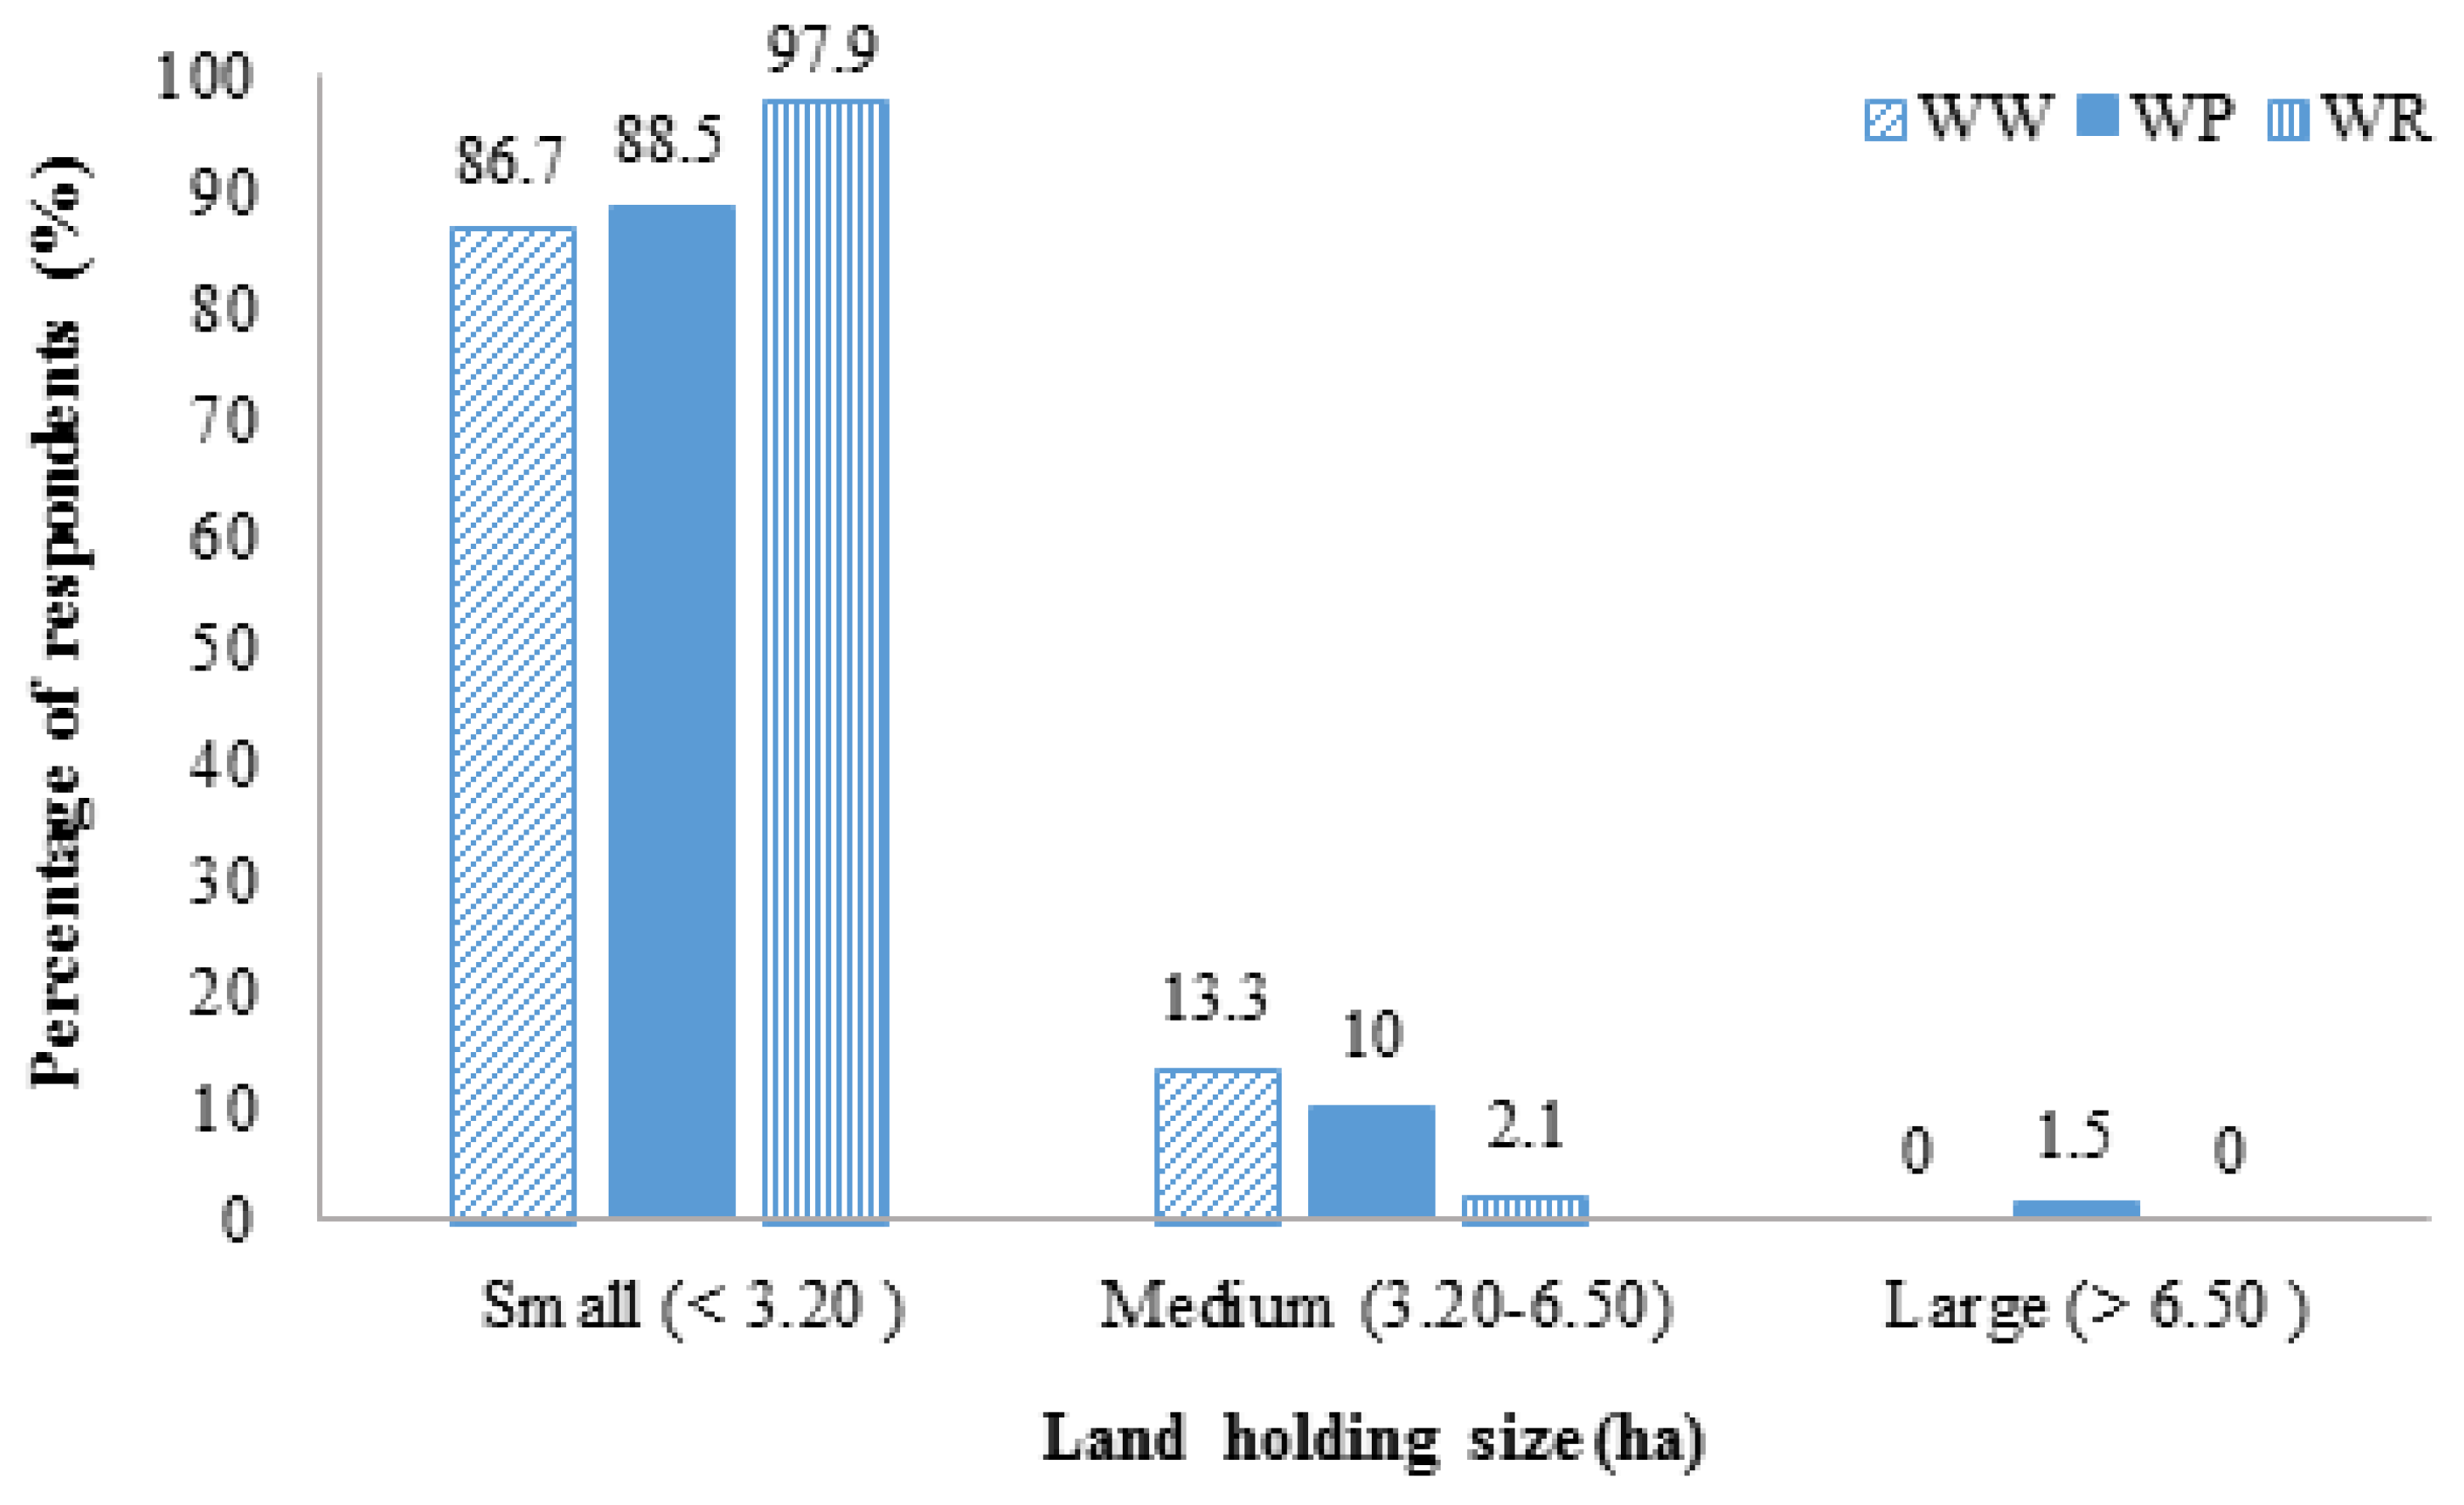
3.1.6. Land Holding Size

The land holding sizes were categorized into three sizes: small (<3.2 ha), medium (3.2–6.5 ha) and large (>6.5 ha) farms, with an average land holding size of 1.95 ha. The small-scale farmers (i.e., those with a small farming area) constituted the largest group (90.3%), of which the WW, WP, and WR-adopting farmers accounted for 86.7%, 88.5%, and 97.9% of their respective groupings (Figure 3).

3.2. Influencing Factors of the Adoption of Variable Irrigation Technologies

Table 3 tabulates the probit model results of the factors (X1–X14) influencing the adoption of the various irrigation technologies of the rice farmers in the study area. Specifically, the WW adoption was statistically associated with the land holding size (β = 0.556), farm income (0.002), and WUA membership (2.437) factors. The adoption of the WP irrigation technology was statistically associated with age (−0.089), farm income (−0.001), farmland location (3.089), proximity to the water source (2.017), skills training (−1.382), and WUA membership (−3.524). The determinants of the weir (WR) adoption were age (0.105), land holding size (−0.608), farmland location (−3.043), and the degree of community participation (−2.802).

3.2.1. Age

The WP adoption and age had a significant negative correlation with each other (β = −0.089, p < 0.05), while this association was significantly positive between the WR adoption and age (β = 0.105, p < 0.05). The findings indicated that the older farmers were more receptive to the WR irrigation technology due to its ease of use, while their younger counterparts preferred the WP technology probably due to their familiarity with the motorized machinery and pumps as well as their great distance from the water source. This is consistent with He et al. [17], who documented that the likelihood to adopt a modern irrigation technology was negatively correlated with the age of the household head. Our further in-depth interviews revealed that the discontinuity of traditional irrigation technology (WW) transfer could lead a new (modern) generation of farmers shifting to using new technology (WP) because it is easier to use and easily accessible.

3.2.2. Land Holding Size

Land holding size was significantly positively associated with the WW adoption (β = 0.556, p < 0.01). Thus, an increase in the land holding size contributed to an increased probability of the WW adoption in rice cultivation of the study area. This is consistent with a previous study [18], which reported that farm size and the adoption of the traditional irrigation technology (i.e., the water wheel) were positively correlated. On the other hand, the adoption of WR technology and land holding size were significantly negatively correlated (β = −0.608, p < 0.01), which suggests that the large-scale farmers opted against the WR irrigation technology.

3.2.3. Farm Income

The WW adoption and farm income were significantly positively correlated (β = 0.002, p < 0.01), which suggested that the increased income from the sales of rice contributed to the greater likelihood of the WW adoption. Meanwhile, the WP adoption was significantly negatively associated with farming income (β = −0.001, p < 0.01). This finding could partly be attributed to a circular logic in which the WP farmers had adopted the water pump scheme hoping that a larger volume of irrigated water would lead to higher rice yields and economic returns. This is consistent with a previous study [19], which noted that economic incentives play an important role in the adoption of modern technologies. However, the farmers tended to overlook the higher operational and maintenance costs accompanying the WP irrigation system, which thereby amounted to a negligible increase or even lower farm income. Additionally, one study [20] noted that farming households with alternative sources of income exhibited a greater tendency to adopt modern irrigation technologies (e.g., the motor pumps). Interestingly, two studies [20,21] reported that farmers with limited incomes or assets are reluctant to adopt unfamiliar technologies due to the risks of possible low crop yields. Regardless, based on the obtained data and in-depth interview, the motivation factors of farmers regarding the acceptance of water management technology in the aspect of income involved increasing the rice yield and decreasing the cost of production. Meanwhile, the case study found that farmers who used the water pump were faced with expenses in terms of equipment, maintenance, and fuel. Hence, these farmers still had a low income after deducting expenses of farming using the water pump. As such, the integration of technology in water management in combination with appropriate production management would enable some farmers to adopt new methods of water utilization to increase the returns from this investment. For instance, the use of water wheel requires initial investment for the installation, but it decreases the cost of production in the long run, making it worth the investment.

3.2.4. Farmland Location (Upstream)

The WP adoption was significantly positively correlated with an upstream farmland location (β = 3.089, p < 0.01). On the other hand, the upstream location of farmlands was significantly negatively associated with the WR adoption (β = −3.043, p < 0.01). The findings revealed that despite the advantageous farmland location, the upstream rice farmers still deployed the WP technology to exploitatively irrigate their rice fields, giving rise to the downstream farmers’ perceived unfairness of the water allocation. Further investigation also revealed that despite the advantageous location of their farmlands, the WR irrigation technology was an unattractive option because most upstream farmers preferred not to lose out in the “water competition” as other upstream farmers deployed the water pumps.
It is particularly true that upstream communities have better access to water resources compared to downstream communities in terms of water availability, quality, and timing. Likewise, farmers in the plain area have better access to water than those in the elevated area. Farmers’ acceptance of technology is also affected by distance from the water sources (such as rivers) to the farming locations, as the adoption and implementation of the appropriate technology depends on the water availability for the nearby farming areas. Farmers with a larger area of land need to pump water quickly in order to meet the requirements for water for their farming need. Thus, the significant challenge for farming in the area near the river source is to identify the most effective scheme that can increase crop production while reducing water usage. Furthermore, farming needs to use water in a reasonable and appropriate manner in response to the water requirement of each crop.
This partly explains the negative association between the WR adoption and the upstream farmland location. In the case of farmers who adopted the WR by a focus group discussion, through the support of the government’s irrigation project, they are faced with the problem pertaining to the proximity of the plantation to the water resource. Those who are further away from the water resource may experience water shortages or infrequent supply of water for farming, which further affect rice production. Likewise, the use of WR reduces the number of farmers who previously adopted the use of WW in their agricultural practice. This is consistent with previous studies [22,23], which reported that weak institution leads to competition in the utilization of water and unsettled downstream effects from upstream irrigation. Regardless of the decrease in water demand amongst users who utilize water by upstream water users, farmers are likely to be able to allocate water equally if there is a strong institution facilitating effective communication.

3.2.5. Proximity to Water Source

The WP adoption and the distance from the water source were significantly positively correlated (β = 2.017, p < 0.01), which indicates that a greater distance from the irrigation system meant a greater likelihood of adopting WP, irrespective of the upstream or downstream location of the farmland. However, the finding is inconsistent with a previous study [24], which documented that greater distance from the irrigation system resulted in lower rates of WP adoption. Moreover, a previous study [25] reported that distance had no influence on the WP adoption in Ethiopia. Meanwhile, the relationships of the proximity to the water source with the WW and WR adoption were inconclusive.

3.2.6. Training on Agricultural Practices

The WP adoption was significantly negatively associated with the amount of training on agricultural practices (β = −1.382, p < 0.05), which suggested that the farmers with knowledge of efficient and sustainable agricultural practices would shun the WP irrigation technology due to the high costs and long-term environmental impacts. This is consistent with previous studies [26,27,28], which reported that increasing farmers’ knowledge and skills through various training and extension programs contributed to enhanced water use efficiency. Farmers who have access to training in agricultural water management will take the principles of agricultural production under the sustainability of limited natural resources into consideration. For instance, the use of water for farming at appropriate times, the implementation of technology to reduce cost, and environmentally friendly concepts for integrated water resources management is required in order to achieve maximum efficiency, which is based on the acquired knowledge of farmers.

3.2.7. WUA Membership

The WUA membership and the WW adoption were significantly positively correlated (β = 2.437, p < 0.01), while the WUA membership was significantly negatively associated with the WP adoption (β = −3.524, p < 0.01). The positive association between the membership and the adoption of the WW irrigation technology was attributable to “peer pressure”, as the members are required to comply with the rules and restrictions for the collective benefit of the organization (i.e., WUA), with violations possibly resulting in expulsion. In addition, the enrolment into the water user group plays an important role in terms of increasing the awareness of the issues of the lack of water and co-utilization of water resources to allocate adequate water resources for members in the group. As a consequence, water allocation will be more efficient and effective. The allocation of water will be in accordance with the needs of all farmers in a fair and economical manner. Therefore, this reduces the issues of disputes between farmers, public sector, and private sector. Accordingly, farmers and related organizations will feel as though they are the co-owners of water resources, which subsequently leads to practical and sustainable water management. According to previous studies [29,30], the establishment of water user associations (WUAs) and the transfer of responsibility for operation and maintenance of irrigation systems to the farmers plays an important role in encouraging users to adopt technologies for more efficient water use and increased crop production.

3.2.8. Group Participation

The farmers’ participation in community projects was significantly negatively correlated with the adoption of the WR irrigation technology (β = −2.802, p < 0.05). The finding could be attributed to the fact that the active participation has made the local farmers aware of the negative impacts of the WR construction on the natural watercourses and the ecological system. As a result, this discouraged WR adoption among the local farmers. According to previous studies [17,31,32,33,34,35,36], membership and participation in farmer groups or associations contributed to the adoption of environmentally-friendly, operationally-viable, and economically-viable irrigation schemes (e.g., the water wheel irrigation techology). Moreover, participation in community projects or action groups offers farmers access to training, information, inputs, credit, and communal agricultural equipment [37,38].

3.3. Economic Returns under Variable Irrigation Schemes

The economic returns associated with these three irrigation technologies of the participating farming households were analyzed and compared using the conventional cost–benefit method. According to previous studies [32,39,40], the measures of farmers’ economic conditions encompass the adoption cost, operational cost, productivity, profitability, and farm efficiency. Such measures can be directly garnered from the farmers through household surveys or any other means.
Table 4 tabulates and compares the investment costs and economic returns per unit area of rice cultivation (ha) of the participating rice farmers under the three irrigation schemes (WW, WP, and WR). By comparison, the farm revenue per ha (item 1) of the WW farmers was largest (THB 28,007.50), followed by the WR (THB 25,262.50) and WP (THB 21,264.38) farmers (1 USD = THB 35). This indicates that the greatest rice yields per unit area of cultivation occurred under the WW irrigation scheme. Meanwhile, the WW farmers incurred the smallest total cost per ha (item 4) of THB 10,588.13, followed by the WR (THB 12,778.75) and WP (THB 14,617.50) farmers, suggesting the relatively minimal operational cost of the WW irrigation technology. This contributed to the highest net income or economic return (item 7) per ha under the WW irrigation scheme of THB 17,419.38, followed by THB 12,483.13 and THB 6646.88 for the WR and WP schemes. The low economic return of the WP scheme was largely attributable to the fuel costs to operate the pumps. The findings also revealed that the farm revenue, total cost, and net farm income were statically different between the three irrigation technologies (p < 0.01).
The research findings revealed that the lowest operating expense ratio (item 8)—which is a measure of what percentage of farm revenue is allocated to the variable operating expenditures—was achieved under the WW irrigation scheme (35.7%), followed by the WR (48%) and WP (64.2%) irrigation technologies. This is consistent with a previous study [41], which documented that farms with higher proportions of rented land and machinery or hired labor tended to exhibit higher operating expense ratios. In addition, the depreciation expense ratio (item 9) was highest under the WP irrigation technology (4.6%), followed by 2.6% and 2.1% under the WR and WW schemes. Further investigation revealed that despite the high depreciation cost and environmental pollution, the adoption of the WP irrigation scheme was common in the study area due to its ease of deployment, the proximity to water sources, and the lack of concerted efforts to preserve the water wheel irrigation practice.
As the highest farm revenue and lowest total cost per ha occurred under the WW irrigation scheme, its net farm income ratio (item 10) was the largest (62.2%) when compared to those of the WP (31.3%) and WR (49.4%) irrigation technologies. Likewise, the benefit–cost ratio (item 11) of the WW scheme was the highest (2.6), suggesting that one dollar (or Thai baht) of investment generates 2.60 dollars (or THB) of revenue. This was followed by the WR (2.0) and WP (1.5) schemes.
Specifically, the highest economic return associated with the traditional WW technology could be attributed to the regular and consistent irrigation, which helps minimize soil moisture loss and retain soil nutrients and thus lowers the use of chemical fertilizers. The nutrient-rich soil also promotes the fully-developed rice grains and subsequently results in higher crop yields per unit of cultivation area. In addition, we also found that the soil conditions in the WW-adopted farm were better than those in the WP-adopted farm. The differences between paddy fields that use the WW irrigation scheme and those that use the WP irrigation scheme were often found to be related to the lack of water that may occur during a certain period. Some farmers have to hire workers to pump the water, and sometimes they do not have enough time to pump the water, so they inevitably have to let it dry. Paddy fields that use the WP irrigation scheme are not as good as those that use WW irrigation scheme, which are always abundant in water. Undoubtedly, rice in the latter type of paddy field have a higher growth rate and require less pesticide use. Rice in the paddy fields that are irrigated by WW irrigation scheme has a strong structure, with a relatively higher resistance to diseases and insects. Meanwhile, rice in the paddy fields that use water from the WR irrigation scheme are faced with the same issue as those that use WP due to the irregular supply of water. The selection of irrigation technology adoption for the agricultural water management of farmers does not depend on theoretical concepts. In contrast, it depends on the choice that is most appropriate for each particular farm. The most apparent instance is the local wisdom regarding the innovation and development of basic technology for the utilization of water resources for agricultural purposes. This reflects the traditional culture of the community that is attached to the continuous and extensive use of water from the river (Lampatow). The inheritance of local wisdom adheres to the agricultural practices and solely emphasizes a group of direct water resource users living near the river, because it is a technology that depends on the physical condition of the riverbank that facilitates diversions from the WW irrigation scheme.
Hence, in order to increase efficiency in terms of technique and crop yield, farmers should be encouraged to grow rice according to their capacity. Likewise, they should be provided with knowledge pertaining to the factors of production, such as the proper use of fertilizers and pesticides, as such factors affect rice yield. By applying an appropriate quantity, rice yields will increase while the cost of production will decrease. For instance, farmers who use the WP irrigation scheme should reduce the use of fertilizers in order to lower the farming costs while increasing rice yields.
Moreover, the operation of the WW irrigation scheme incurs no fuel costs and requires minimal maintenance. The strategic approach of water management to improve the efficiency of water usage in agriculture may be impeded depending on the objectives of farmers emphasizing the increase in profitability or crop production [42].

4. Conclusions and Recommendations

This research has investigated the influencing factors of the adoption of the three irrigation technologies using a probit statistical model: the water wheel (WW), water pump (WP), and weir (WR) irrigation technologies, as well as their economic returns per unit of rice cultivation area (ha). The influencing factors included demographic, socioeconomic, topographical, institutional, and attitudinal factors. This study was conducted in three rice-growing sub-districts in Thailand’s northeastern province of Chaiyaphum. Specifically, the research aimed to identify the irrigation technology (WW, WP, WR) that is most environmentally sustainable and economically inclusive.
The probit regression results revealed that the land holding size, farm income, and WUA membership factors were significantly positively associated with the water wheel (WW) adoption of the participating farmers. The correlation between the WUA membership and the WW adoption (β = 2.437, p < 0.01) is of particular interest, whereby the members are “peer-pressured” to comply with the rules for the collective benefit of the organization with violations possibly resulting in expulsion. Meanwhile, age, farm income, skills training, and WUA membership were significantly negatively correlated with water pump (WP) adoption. The negative correlation between WUA membership and WP adoption (β = −3.524, p < 0.01) is of special interest. This suggests that in order to avoid being subjected to peer pressure and rules, the WP farmers were less likely to be a WUA member, given that the WP operation causes environmental pollution and could lead to the downstream farmers’ perceived unfairness of the water allocation. On the other hand, the proximity to the water source and upstream farmland location were significantly positively correlated with the adoption of the WP technology. Surprisingly, despite the advantageous farmland location, the upstream farmers preferred not to lose out in the “water competition” as other upstream farmers deployed the water pumps. This partly explains the positive association between the WP adoption and the upstream farmland location.
The probit model also indicated that the weir (WR) adoption was significantly positively associated with age but negatively correlated with the land holding size, upstream farmland location, and group participation factors. Interestingly, the WR irrigation technology (β = −3.043, p < 0.01) was an unattractive irrigation option despite the advantageous farmland location, because most upstream farmers opted for the water pumps (WP) for maximum water harvest. This contributed to the negative association between the upstream farmland location and the WR adoption.
The cost–benefit analysis revealed that by comparison, the WW irrigation technology yielded the highest economic returns per unit of rice cultivation area (ha) with a benefit-to-cost ratio of 2.6, suggesting that one Thai baht of investment generates 2.60 Thai baht of revenue, followed by the WR (2.0) and WP (1.5) irrigation schemes. The highest economic return associated with the traditional WW technology was attributable to the regular and consistent irrigation, which helps minimize soil moisture loss and retain soil nutrients and thus lowers the use of chemical fertilizers. The nutrient-rich soil also promotes the full development of rice grains and subsequently resulted in higher crop yields per unit of cultivation area. The WW irrigation scheme requires no petroleum-based fuels and minimal maintenance to operate in addition to being an environmentally-friendly irrigation option.
In light of the research findings, the water wheel technology is the most operationally-viable, economically-sustainable, and environmentally-friendly irrigation option compared to the water pump and weir irrigation schemes. Thus, the water wheel technology could be deployed in the water management of other agricultural areas in Thailand’s northeast region to mitigate the unfavorable geography and the local farmers’ disadvantageous economic conditions. Moreover, to enhance the water wheel adoption and successful implementation, training in efficient agricultural practices should be provided, while the active participation in community projects and the membership of a local irrigation group are to be encouraged.
According to the area of study, factors that are regarded as obstacles to the use and technological development of a water wheel technology include the site characteristics for installing a water wheel system, which must take the depth of the riverbank into consideration. If the riverbank is high and the water is considerably deep, the water wheel system cannot be installed. In addition, it requires a consistent flow of water and the canal must not be too wide, since the system is dependent on the water pressure from the currents. Furthermore, young generations have shifted their career paths to work in other places, following societal values. As a consequence, the inheritance of the local wisdom of water wheels has declined and some farmers have to adapt to the methods of supplying water through water pumps. Based on the perspectives of farmers using weir irrigation technology, it can be observed that the construction of weirs and irrigation canals contribute to the reduction in the use of water wheels. This implicitly diminishes the naturalness of the Lampatao canal and changes the means of water allocation. However, the increase of WW irrigation schemes’ efficiency under the limitations of the characteristics of the landform could be achieved through the installation of a barrier around the front of the waterproof equipment to prevent water passing through. This method could increase the rotation speed of WW irrigation schemes, regardless of the water volume in the river. Regarding construction materials of WW irrigation schemes, materials such as bamboos can be found and are grown by the local community along the riverbank to prevent soil erosion. Further, it is important to promote the dissemination, inheritance, and conservation of the local wisdom of WW irrigation schemes through the establishment of the conservation organization to preserve, rehabilitate, and disseminate the local wisdom of WW irrigation schemes. The methods for using WW irrigation schemes should also be promoted through training, research, and education.
Consequently, the factors contributing to the success of water resource management through water wheel technology include governmental support through the implementation of policies addressing energy and the utilization of water energy as a source of renewable energy. Some of the equipment required in the process are easily accessible and with a low cost. Likewise, water wheels are regarded as a significant selling point in terms of ecotourism.
The vision and strategic plan needs to be shared in order to create an integrated agricultural water management that includes an emphasis on the conservation of forest and soil-water; increase in water use efficiency and water distribution; the development of WUA; and the promotion of the use of renewable energy.
This is related to the principle of sustainable development, which supports the development of the economy, society, and the environment in response to the needs of the population without affecting the opportunities of natural resources and the environment for future generations. Such development emphasizes the balance between the conservation of natural resources and the sustainable use of resources, which can be applied in community management. This development can be used to strengthen and improve community organizations, the economy, and society to achieve sustainable development goals. The sustainable development goals include water management to increase the efficiency of water usage in all regions; the management of water resources at all levels; the conservation and restoration of ecological systems pertaining to water resources for the efficient use of water; as well as the encouragement of community participation in the sustainable development of water management. This study can provide guidance to promote the development and extension of appropriate agricultural water management technologies, water allocation, and the sustainable maintenance of irrigation systems from these divisions and eventually the whole river basin.

Acknowledgments

This research was sponsored by Thailand’s Ministry of Agriculture and Cooperatives and the Asian Institute of Technology (AIT). The authors would like to extend deep gratitude to the Department of Agriculture (DOA) and the Department of Water Resources (DWR) for relevant data and assistance. Sincere appreciation is also extended to Clemens Grünbühel, adjunct faculty of NRM at AIT and Damien Jourdain, visiting assistant professor of NRM at AIT for their guidance on the conceptual framework for this research. Special thanks go to the participating farmers. This manuscript would not have been improved without constructive comments from the journal editor and reviews; we thank for their time and valuable comments.

Author Contributions

Ratchaneewan Chuchird designed research, collected and analyzed the data and drafted the manuscript. Nophea Sasaki and Issei Abe contributed equally to improving the clarity of the research and revising the manuscript.

Conflicts of Interest

The authors declare no conflict of interest.

References

  1. Gregg, N.S. Integrated water resources management: Balancing views and improving practice. Water Int. 2008, 33, 272–292. [Google Scholar] [CrossRef]
  2. Lenton, R.; Muller, M. Integrated Water Resources Management in Practice: Better Water Management for Development; Earthscan Publication Ltd.: London, UK, 2009; Volume 38, p. 249. [Google Scholar]
  3. Davivongs, V.; Yokohari, M.; Hara, Y. Neglected canals: Deterioration of indigenous irrigation system by urbanization in the West Peri-Urban area of Bangkok Metropolitan Region. Water 2012, 4, 12–27. [Google Scholar] [CrossRef]
  4. Kitchaicharoen, J.; Ekasingh, B.; Dithaprayoon, S.; Chaiwinit, W. Linkages between access to irrigation water and livelihood strategies using. In Proceedings of the The 4th National Agricultural Conference Agriculture for the Environment and the Environment and Recognization Global Warming, Chiang Mai, Thailand, 27–28 May 2008; Research Center for Agricultural Productivity: Chiang Mai, Thailand, 2008; pp. 225–235. [Google Scholar]
  5. Namara, R.; Awulachew, S.B.; Merrey, D.J. Review of agricultural water management technologies and practices. In Best Practices and Technologies for Small Scale Agricultural Water Management in Ethiopia, Proceedings of the MoARD/MoWR/USAID/IWMI Symposium and Exhibition, Addis Ababa, Ethiopia, 7–9 March, 2006; Awulachew, S.B., Menker, M., Abesha, D., Atnafe, T., Wondimkum, Y., Eds.; International Water Management Institute: Colombo, Sri Lanka, 2006. [Google Scholar]
  6. Sethaputra, S.; Thanopanuwat, S.; Kumpa, L.; Pattanee, S. Thailand’s water vision: A case study. In From Vision to Action: A synthesis of Experiences in Southeast Asia; FAO—Office of the National Water Resources Committee, ESCAP: Bangkok, Thailand, 2000. [Google Scholar]
  7. Senanarong, N.; Cheuwchoom, P.; Lusanandana, C.; Tangpoonpol, S.; Atichart, S.; Pongkanjana, A.; Srihaban, P.; Singhapong, T.; Patanothai, A.; Toomsan, B.; et al. Improving management of natural resources for sustainable rainfed agriculture in northeastern Thailand. In Proceedings of the ADB-ICRISAT-IWMI Project Review and Planning Meeting, Hanoi, Vietnam, 10–14 December 2001. [Google Scholar]
  8. Samian, M.; Mahdei, K.N.; Saadi, H.; Movahedi, R. Identifying factors affecting optimal management of agricultural water. J. Saudi Soc. Agric. Sci. 2014, 14, 11–18. [Google Scholar] [CrossRef]
  9. Forrest, T.I. Principles of On-Form Water Management; University of Florida: Gainesville, FL, USA, 2002. [Google Scholar]
  10. Pandy, R.K.; Maranville, J.W.; Admou, A. Deficit irrigation and nitrogen effects on maize in a Sahelian environment. I. Grain yield and yield components. Agric. Water Manag. 2000, 46, 1–13. [Google Scholar] [CrossRef]
  11. Panda, R.K.; Behera, S.K.; Kashyap, P.S. Effective management of irrigation water for maize under stressed conditions. Agric. Water Manag. 2004, 66, 181–203. [Google Scholar] [CrossRef]
  12. Liu, Y.; Hu, X.; Zhang, Q.; Zheng, M. Improving agricultural water use efficiency: A quantitative study of Zhangye City using the static CGE model with a CES water-land resources account. Sustainability 2017, 9, 308. [Google Scholar] [CrossRef]
  13. Srichaiwong, P.; Kwawjai, L.; Kroeksakul, P. Guidelines for natural food conservation for the community around the upstream forest of the Chi River Basin. Asian Soc. Sci. 2014, 10, 132–139. [Google Scholar] [CrossRef]
  14. Dandedjrohoun, L.; Diagne, A.; Biaou, G. Determinants of diffusion and adoption of improved technology for rice parboiling in Benin. Rev. Agric. Environ. Stud. 2012, 93, 171–191. [Google Scholar] [CrossRef]
  15. Oladeji, O.O.; Okoruwa, V.O.; Ojehomon, V.E.T.; Diagne, A.; Obasoro, O.A. Determinants of awareness and adoption of improved rice varieties in north central, Nigeria. Rice Genom. Genet. 2015, 6, 1–10. [Google Scholar] [CrossRef]
  16. Tetteh Anang, B. Factors influencing pesticide use in smallholder rice production in northern Ghana. Agric. For. Fish. 2015, 4, 77–82. [Google Scholar] [CrossRef]
  17. He, X.; Cao, H.; Li, F. Econometric analysis of the determinants of adoption of rainwater harvesting and supplementary irrigation technology (RHSIT) in the semiarid Loess Plateau of China. Agric. Water Manag. 2007, 89, 243–250. [Google Scholar] [CrossRef]
  18. Mittal, S.; Mehar, M. Socio-economic factors affecting adoption of modern informationand communication technology by farmers in India: Analysis using multivariate probit model. J. Agric. Educ. Ext. 2016, 22, 199–212. [Google Scholar] [CrossRef]
  19. Lee, D.R. Agricultural sustainability and technology adoption: Issues and Policies for Developing Countries. Am. J. Agric. Econ. 2005, 87, 1325–1334. [Google Scholar] [CrossRef]
  20. Gebregziabher, G.; Giordano, M.A.; Langan, S.; Namara, R.E. Economic analysis of factors influencing adoption of motor pumps in Ethiopia. J. Dev. Agric. Econ. 2014, 6, 490–500. [Google Scholar]
  21. Mourshed, M. Rethinking Irrigation Technology Adoption: Lessons from the Egiptian Desert: Working No. 23, Program in Sciency, Technology and Society; Massachusetts Institute of Technology Moyo: Cambridge, MA, USA, 1995. [Google Scholar]
  22. Mutambara, S.; Darkoh, M.B.K.; Atlhopheng, J.R. A comparative review of water management sustainability challenges in smallholder irrigation schemes in Africa and Asia. Agric. Water Manag. 2016, 171, 63–72. [Google Scholar] [CrossRef]
  23. Bastakoti, R.C.; Shivakoti, G.P. Context and Institutions in Irrigation Management: Applicability of Design Principles in Nepal and Thailand; Chiang Mai University: Chiang Mai, Thailand, 2009. [Google Scholar]
  24. Sithole, N.L.; Lagat, J.K.; Masuku, M.B. Factors influencing farmers participation in smallholder irrigation schemes: The case of Ntfonjeni rural development area. J. Econ. Sustain. Dev. 2014, 5, 159–168. [Google Scholar]
  25. Aseyehegu, K.; Yirga, C.; Rajan, S. Effect of small-scale irrigation on the income of rural farm households: The case of Laelay Maichew District, Central Tigray, Ethiopia. J. Agric. Sci. 2012, 7, 208–215. [Google Scholar] [CrossRef]
  26. Panahi, F.; Malek-Mohammadi, I.; Chizari, M.; Samani, J. The role of optimizing agricultural water resource management to livelihood poverty abolition in rural Iran. Aust. J. Basic Appl. Sci. 2009, 3, 3841–3849. [Google Scholar]
  27. Rezadoost, B.; Allahyari, M.S. Farmers’ opinions regarding effective factors on optimum agricultural water management. J. Saudi Soc. Agric. Sci. 2014, 13, 15–21. [Google Scholar] [CrossRef]
  28. Mohammadi, Y.; Shabanali Fami, H.; Asadi, A. Analysis of effective components on agricultural water management in Zarin- dasht County from farmers viewpoint. J. Agric. Sci. Nat. Resour. 2009, 16, 9–18. [Google Scholar]
  29. Buyukcangaz, H.; Korukcu, A. Integrated approach for water resources and irrigation management in Turkey. Water Int. 2007, 32, 710–719. [Google Scholar] [CrossRef]
  30. Smith, M.; Munoz, G. Irrigation Advisory Services for Effective Water Use: A Review of Experiences; FAO–ICID: Montreal, QC, Canada, 2002; pp. 1–16. [Google Scholar]
  31. Abdulai, A.; Owusu, V.; Bakang, J.A. Adoption of safer irrigation technologies and cropping patterns: Evidence from Southern Ghana. Ecol. Econ. 2011, 70, 1415–1423. [Google Scholar] [CrossRef] [Green Version]
  32. Ndunda, E.N.; Mungatana, E.D. Determinants of farmers’ choice of innovative risk-reduction interventions to wastewater-irrigated agriculture. Afr. J. Agric. Res. 2013, 8, 119–128. [Google Scholar]
  33. Willy, D.K.; Holm-Müller, K. Social influence and collective action effects on farm level soil conservation effort in rural Kenya. Ecol. Econ. 2013, 90, 94–103. [Google Scholar] [CrossRef]
  34. Zhou, S.; Herzfeld, T.; Glauben, T.; Zhang, Y.; Hu, B. Factors affecting Chinese farmers’ decisions to adopt a water-saving technology. Can. J. Agric. Econ. 2008, 56, 51–61. [Google Scholar] [CrossRef]
  35. Lampayan, R.M.; Bouman, B.A.; de Dios, J.L.; Lactaoen, A.T.; Espiritu, A.J.; Norte, T.M. Adoption of Water Saving Technologies in Rice Production in the Philippines. Available online: http://agnet.org/htmlarea_file/library/20110808151231/eb548.pdf (accessed on 27 February 2017).
  36. Masuki, K.; Mutabazi, K.; Mattee, A.; Tumbo, S.; Rwehumbiza, F.; Mowo, J. Factors influencing intensity of adoption of integrated water management innovation in the semi-arid areas of Northeastern Tanzania. Int. J. Environ. Eng. Nat. Resour. 2014, 1, 227–234. [Google Scholar]
  37. Sidibé, A. Farm-level adoption of soil and water conservation techniques in northern Burkina Faso. Agric. Water Manag. 2005, 71, 211–224. [Google Scholar] [CrossRef]
  38. Azizi Khalkheili, T.; Zamani, G.H. Farmer participation in irrigation management: The case of Doroodzan Dam Irrigation Network, Iran. Agric. Water Manag. 2009, 96, 859–865. [Google Scholar] [CrossRef]
  39. Getacher, T.; Mesfin, A.; Gebre-Egziahber, G. Adoption and impacts of an irrigation technology: Evidence from household-level data in Tigray, Northern Ethiopia. Afr. J. Agric. Res. 2013, 8, 4766–4772. [Google Scholar]
  40. Namara, R.E.; Uphadyay, B.; Nagar, R.K. Adoption and Impacts of Microirrigation Technologies: Empirical Results from Selected Localities of Maharashtra and Gujarat States of India; Research Report No. 93; International Water Management Institute: Colombo, Sri Lanka, 2005. [Google Scholar]
  41. Kay, D.R.; Edwards, W.M. Farm Management, 4th ed.; McGraw-Hill Companies: New York, NY, USA, 1999. [Google Scholar]
  42. Greaves, G.E.; Wang, Y.M. Identifying irrigation strategies for improved agricultural water productivity in irrigated maize production through crop simulation modelling. Sustainability 2017, 9, 630. [Google Scholar] [CrossRef]
Figure 1. Location of the study area.
Sustainability 09 01524 g001
Figure 2. Percentage of respondents regarding adoption of irrigation technologies by age group. Note: the ANOVA result (as shown in Figure 2 and Table 2) showed that age was statistically significant with regard to the adopted irrigation technology (p < 0.01). WP: water pump; WR: weir; WW: water wheel.
Sustainability 09 01524 g002
Figure 3. Percentage of respondents regarding adoption of irrigation technologies by land holding size. Note: The ANOVA results (Figure 3/Table 2) indicated that the farmers’ land holding size was statistically significant with regard to the adopted irrigation technology (p < 0.01).
Sustainability 09 01524 g003
Table 1. Variables of the probit model used to determine the influencing factors of the adoption of irrigation technologies.
NotationVariable NameDescriptionVariable Type/Criteria
YAdoption (Dependent variable)Farmer’s adoption of irrigation technologyDummy: 1 if adopted, 0 otherwise
X1GenderRespondent’s gender Dummy: 1 = male, 0 = otherwise
X2AgeRespondent’s age Continuous variable
X3Education Level of formal education Independent variable: 1 = Primary, 2 = Secondary, 3 = Tertiary
X4Farming experienceYears of rice farming experienceContinuous variable
X5Land holding size Total rice cultivation area in hectare (ha)Continuous variable
X6Farm incomeAmount of rice farming income (Thai Baht/ha)Continuous variable
X7LaborNumber of farm workersContinuous variable
X8Farmland location Location of farmland (upstream or downstream)Dummy: 1 if upstream, 0 otherwise
X9Proximity to water sourceProximity to the irrigation systemDummy: 1 if ≤1 km, 0 otherwise
X10TrainingFamer’s training in agricultural practicesDummy: 1 if yes, 0 otherwise
X11WUA membershipMember of the community’s water use association (WUA)Dummy: 1 if yes, 0 otherwise
X12Information accessFrequency of information accessA 5-point Likert scale, ranging from rarely to constantly.
X13Degree of participationActive participation in community projects and activity (other than WUA)A 5-point Likert scale, ranging from rarely to constantly.
X14Perceived equalityThe level of perceived fairness of the water allocation A 5-point Likert scale, ranging from very low to very high.
Table 2. Demographics and socioeconomics of the participating farmers by the irrigation technology.
Water Wheel (n = 30)Water Pump (n = 130)Weir (n = 47)Total (n = 207)
f(%)f(%)f(%)f(%)
Gender
 Male23(76.7)75(57.7)26(55.3)124(59.9)
 Female7(23.3)55(42.3)21(44.7)83(40.1)
χ2 = 4.186, df = 2, Sig = 0.123
Education Level
 Primary28(93.3)116(89.2)44(93.6)188(90.8)
 Secondary2(6.7)10(7.7)1(2.1)13(6.3)
 Tertiary--4(3.1)2(4.3)6(2.9)
χ2 = 2.990, df = 4, Sig = 0.559
Age (Year)
 <401(3.3)5(3.8)1(2.1)7(3.4)
 41–507(23.3)39(30.0)3(6.4)49(23.7)
 51–6010(33.3)55(42.3)22(46.8)87(42.0)
 >6012(40.0)31(23.8)21(44.7)64(30.9)
 Mean (SD)58.07 (9.71) 55.38 (9.04) 61.1 (8.67) 57.08
(9.33)
F = 7.241, Sig = 0.001 **
Rice Farming Experience (Year)
 <10--5(3.8)1(2.1)6(2.9)
 10–205(16.7)33(25.4)8(17.0)46(22.2)
 21–308(26.7)41(31.5)19(40.4)68(32.9)
 31–4011(36.7)29(22.3)15(31.9)55(26.6)
 >406(20.0)22(16.9)4(8.5)32(15.5)
 Mean (SD)36.16
(11.57)
32.68
(12.37)
32.76
(9.76)
33.21
(11.73)
F = 1.118, Sig = 0.329
Number of farm workers
 1–216(53.3)52(40.0)23(48.9)91(44.0)
 3–412(40.0)69(53.1)21(44.7)102(49.3)
 >42(6.7)9(6.9)3(6.4)14(6.8)
 Mean (SD)2.90
(1.06)
2.86
(0.99)
2.72
(0.88)
2.84
(0.97)
F = 0.423, Sig = 0.655
Land Holding Size (ha)
 Small (<3.20 ha)26(86.7)115(88.5)46(97.9)187(90.3)
 Medium (3.20–6.50) 4(13.3)13(10.0)1(2.1)18(8.7)
 Large (>6.50 ha)--2(1.5)--2(1.0)
 Mean (SD)2.48
(1.10)
1.98
(1.32)
1.54
(0.84)
1.95
(1.23)
F = 5.695, Sig = 0.004 **
** Denotes Significant at 99%confidence level (p < 0.01).
Table 3. The probit model results of the factors influencing the adoption of variable irrigation technologies.
FactorsWater Wheel (WW)Water Pump (WP)Weir (WR)
CoefficientStd. Err.CoefficientStd. Err.CoefficientStd. Err.
Gender0.4910.551−0.5870.4160.2800.456
Age−0.0320.046−0.089 **0.0350.105 **0.044
Education1.7641.038−0.0840.710–0.3730.901
Experience0.0270.0370.0180.026–0.0210.037
Land holding size0.556 ***0.1970.1430.162–0.608 ***0.229
Farm income0.002 ***0.000−0.001 ***0.0000.0000.000
Labor0.3880.221−0.3120.1790.1160.226
Location−0.6510.7673.089 ***0.641–3.043 ***0.600
Proximity to water−0.1690.6972.017 ***0.597–3.5871.867
Training1.1310.777−1.382 **0.680--
WUA membership2.437 ***0.678−3.524 ***0.6770.8340.557
Information access0.4330.721−0.8620.6071.2830.720
Participation 2.1374.5470.9750.577–2.802 **1.245
Perceived fairness of water allocation−0.2740.664−0.8840.722--
Constant−16.2606.47411.6763.018–1.1522.702
Log likelihood −27.635−36.488−26.694
LR (likelihood ratio) test Chi2115.73199.33167.87
Prob > Chi20.00000.00000.0000
Pseudo R-squared0.67680.73200.7587
** Significant at the 0.05 level; *** significant at the 0.01 level.
Table 4. The farm revenue, costs, and net farm income per unit area of rice cultivation under various irrigation schemes (Thai baht/ha; 1 USD = THB 35).
ItemWater WheelWater PumpWeirOverall AverageF-Test (Sig)
1. Farm revenue28,007.50 a21,264.38 c25,262.50 b23,149.380.000 **
2. Total variable cost9985.63 c13,649.38 a12,127.50 b12,772.500.000 **
 2.1 Seed1525.00 a,b1551.25 a1520.00 b1540.000.012 *
 2.2 Fertilizer1795.63 b2412.50 a2516.88 a2346.880.000 **
 2.3 Pesticide574.38 b841.88 a992.50 a837.500.027 *
 2.4 Fuel-2499.38---
 2.5 Hired labor6090.00 b6343.75 a,b7097.50 a6478.130.083
3. Fixed cost (Depreciation)601.88 b968.75 a651.88 b843.130.000 **
4. Total cost = (2) + (3)10,588.13 c14,617.50 a12,778.75 b13,616.250.000 **
5. Yield (kg/ha)2306.88 a1772.31 c2105.19 b1925.360.000 **
6. Gross margin = (1) − (2)18,021.88 a7435.00 c13,135.00 b10,263.130.000 **
7. Net farm income (crop value per ha) = (1) − (4)17,419.38 a6646.88 c12,483.13 b11,103.130.000 **
8. Operating expense ratio = (2)/(1) × 10035.764.248.048.4
9. Depreciation expense ratio = (3)/(1) × 1002.14.62.63.6
10. Net farm income ratio = (7)/(1) × 10062.231.349.448.0
11. Benefit-to-cost ratio = (1)/(4)2.61.52.01.9
*, ** Denote the 5% (p < 0.05) and 1% (p < 0.01) significance levels, respectively. The letters (a, b, c) indicate significant differences.

