Some Results on the Vulnerability Assessment of HAWTs Subjected to Wind and Seismic Actions
by

Alberto Maria Avossa
1, 
Cristoforo Demartino
2, 
Pasquale Contestabile
1,
Francesco Ricciardelli
1 and
Diego Vicinanza
1,*
1
Department of Civil Engineering, Design, Building and Environment, DICDEA, University of Campania “Luigi Vanvitelli”, Aversa 81031, Italy
2
College of Civil Engineering, Nanjing Technology University, Nanjing 211816, China
*
Author to whom correspondence should be addressed.
Sustainability 2017, 9(9), 1525; https://doi.org/10.3390/su9091525
Submission received: 21 July 2017
/
Revised: 14 August 2017
/
Accepted: 22 August 2017
/
Published: 27 August 2017
(This article belongs to the Section Energy Sustainability)
Abstract
:The spread of the wind energy industry has caused the construction of wind farms in areas prone to high seismic activity. Accordingly, the analysis of wind turbine loading associated with earthquakes is of crucial importance for an accurate assessment of their structural safety. Within this topic, this paper presents some preliminary results of a probabilistic framework intended to be used for the estimation of the probability of failure of Horizontal Axis Wind Turbine-supporting structures when subjected to the wind and seismic actions. In particular, the multi-hazard fragility curves of the wind turbine-supporting structure were calculated using Monte Carlo simulations. A decoupling approach consisting of aerodynamic analysis of the rigid rotor blade model and subsequent linear dynamic Finite Element analyses of the supporting structure, including aerodynamic damping, was used. The failure condition of the tower structure was estimated according to the stress design procedure proposed by EC3 for the buckling limit state assessment. Finally, the vulnerability assessment of HAWTs to wind and seismic actions was evaluated in terms of fragility curves describing the probability of failure of the supporting tower structure as a function of the Peak Ground Acceleration (PGA) for each parked and operational wind condition. In particular, the results highlight a probability of failure larger than 50% for high levels of seismic action (PGA greater than 0.7 g) combined with the rotor in parked condition (wind speed of 3 m/s) or in operational rated condition (wind speed of 11.4 m/s).
1. Introduction
The seismic response of Horizontal Axis Wind Turbines (HAWTs) has recently attracted growing interest, as the wind energy industry has increased its size, globally. As is well known, the power produced from wind is proportional to the third power of wind speed and to the second power of the rotor radius. Accordingly, to produce more electricity, one has to increase the rotor diameter and hub height. In these cases, the nacelle and rotor mass increase, therefore increasing the tower base moment due to the combined effect of wind thrust and seismic loads.
Experience shows that, for high-rise buildings, a good design for wind action generally results in a reliable seismic retrofit [1]. In this case, the lateral loads are rather distributed along the height, and the effects of the wind are generally dominant with respect to those of the earthquake. On the other hand, for HAWTs, wind and seismic loads are mainly concentrated at the top of the tower support structure. Consequently, the effects of seismic loads can become dominant when the turbine increases in size, as in the case of multi-megawatt HAWTs.
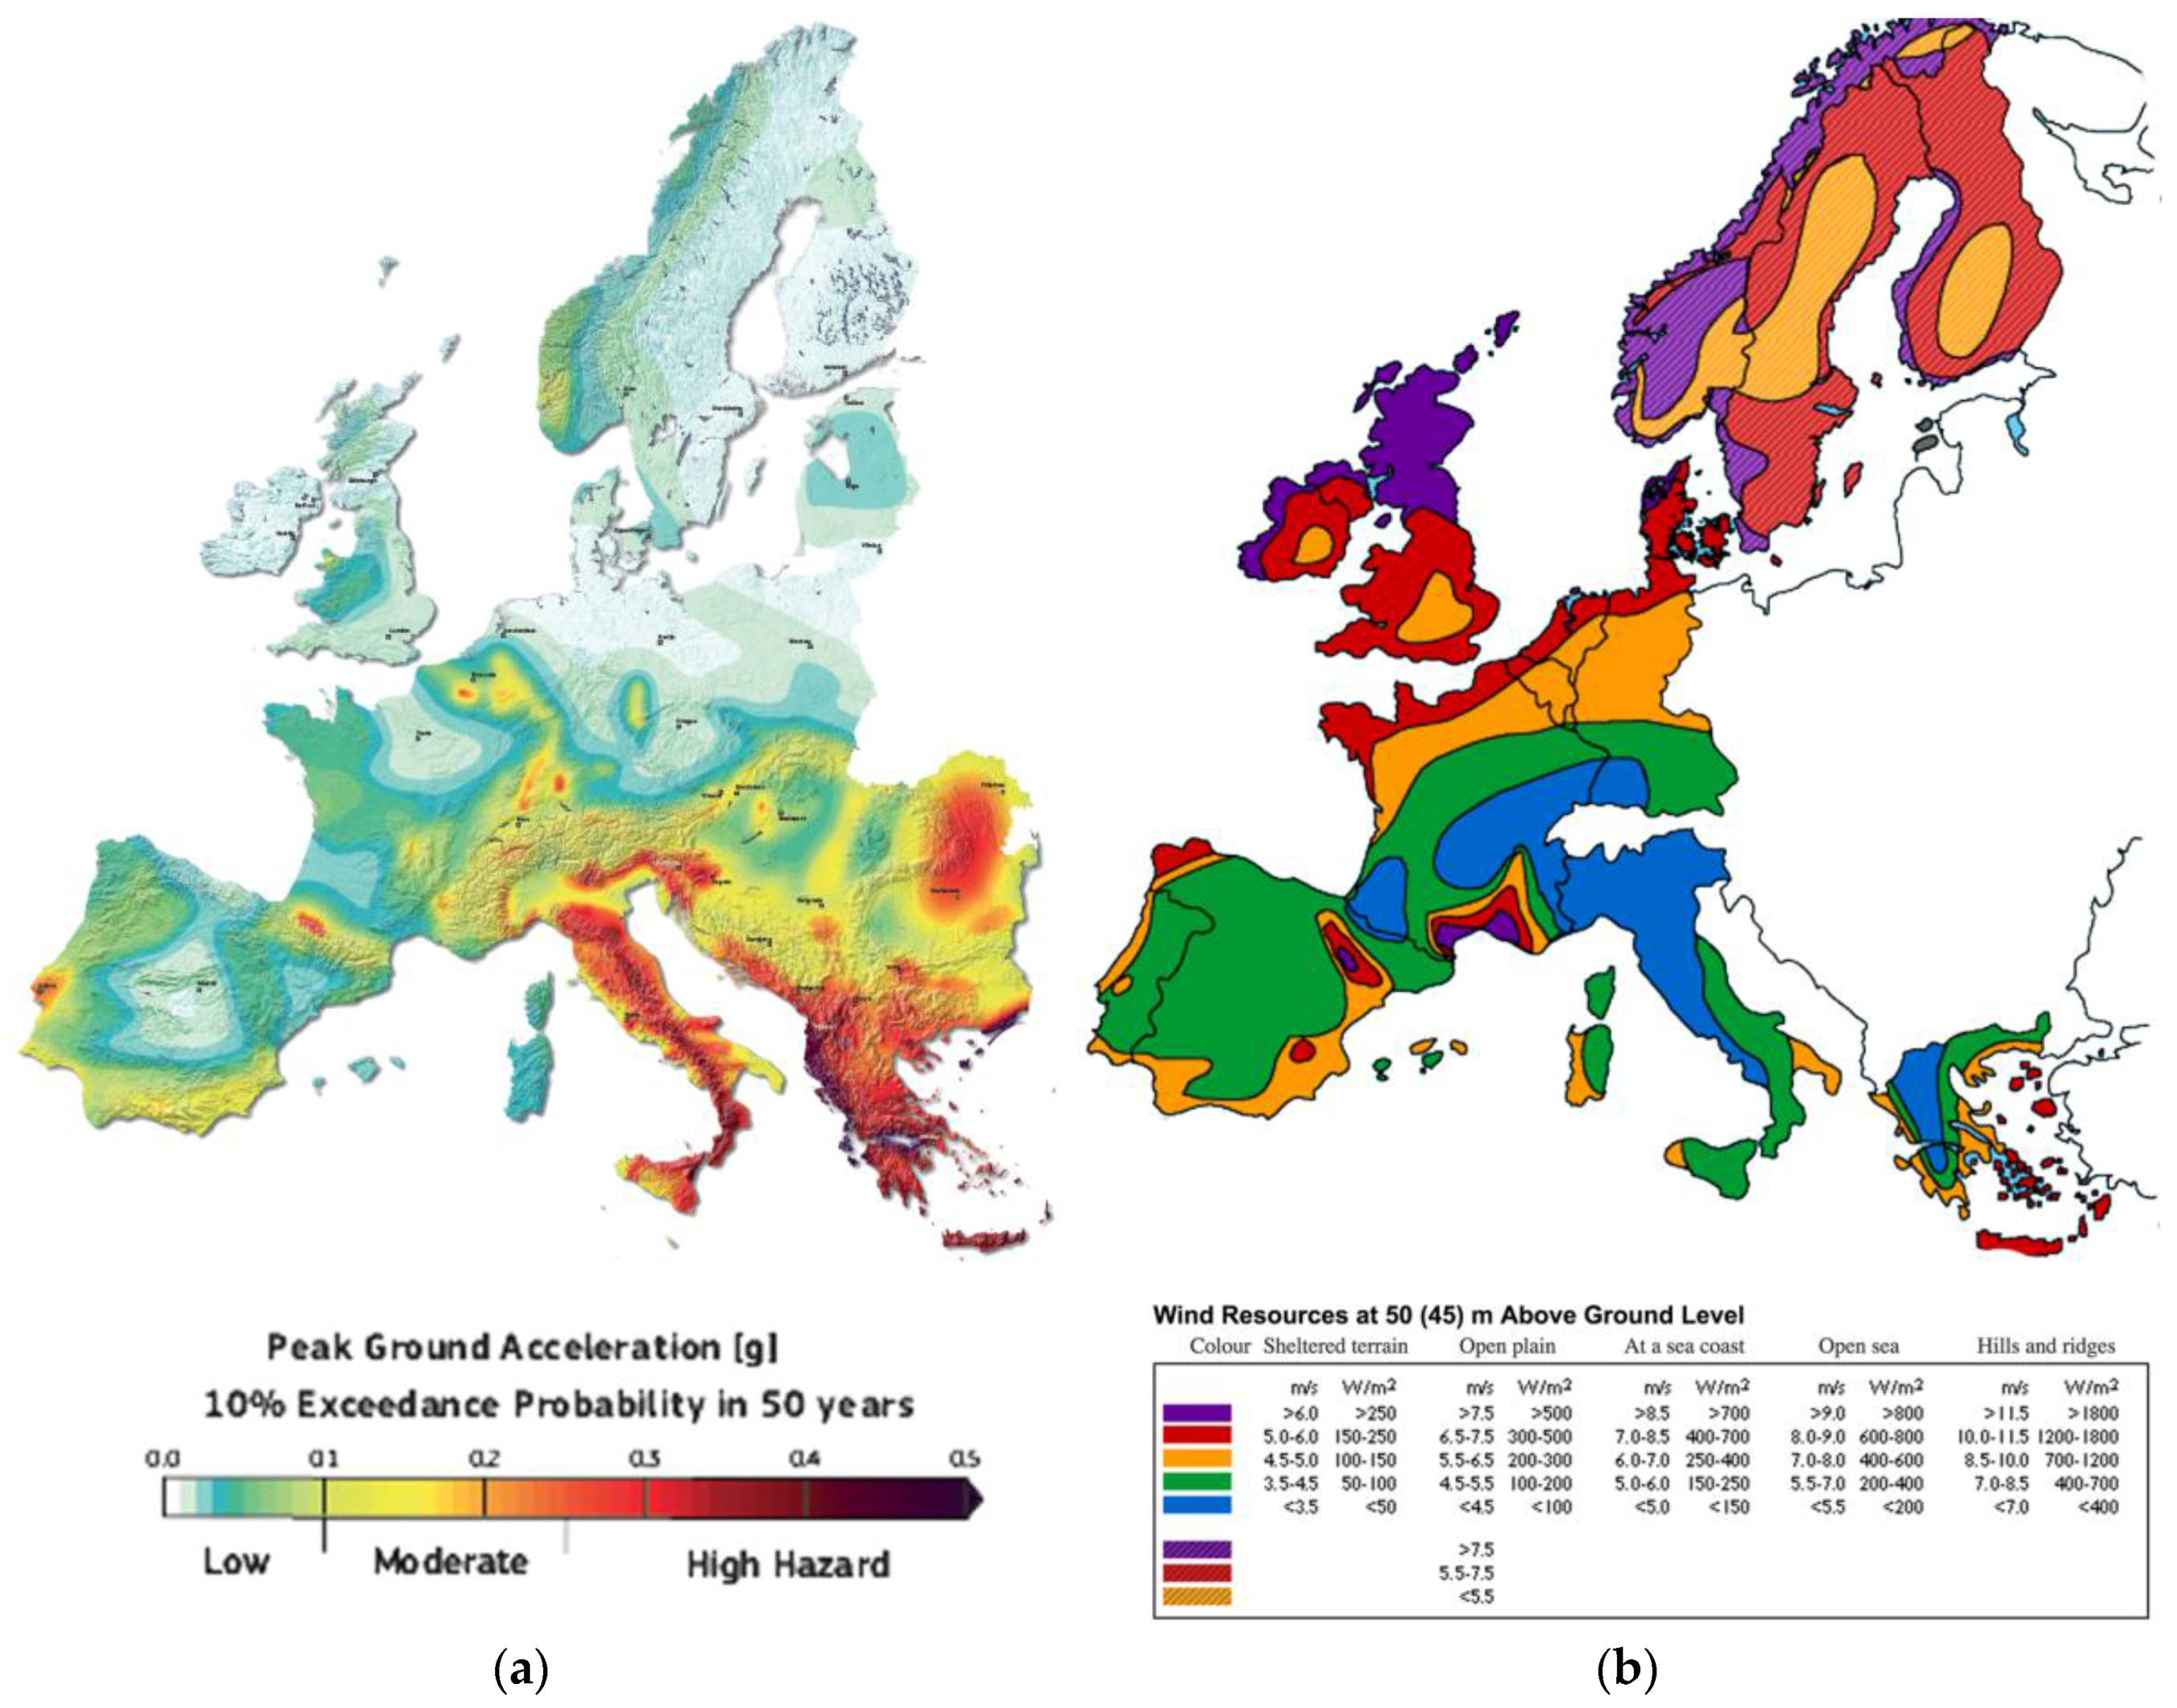
In this context, it is important to consider that many areas with high wind resources also have a high level of seismic hazard. These include the west coast of the US, the coasts of Japan and China, and some countries of Europe. In particular, Figure 1 shows the European maps of the peak ground acceleration for 10% exceedance probability in 50 years (a), and the mean wind speed and mean wind power density at 50 m above ground level for 5 different topographical conditions (i.e., sheltered terrain, open plain, sea coast, open sea and hills and ridges) (b). It can be seen that regions characterized by high wind resources are often seismic areas. In particular, this can be observed in the southern European countries. The interested reader is referred to the COST action RELY for information on the distribution of wind turbines throughout European territory.
In the past few years, researchers have tried to incorporate seismic loads into the structural assessment of wind turbines, and yet the work is limited. Early publications by Bazeos et al. and Lavassas et al. [4,5] speculate that seismic design could become critical in regions with higher seismic hazard and less favorable soil conditions. Witcher [6] calculated the seismic response of a 2 MW upwind turbine with an 80 m diameter rotor and 60 m tower height in different loading scenarios (parked, operational and induced emergency shutdown), emphasizing the significance of time domain analysis and the effects of aerodynamic damping. The author stated that operational wind turbines can experience total damping (aerodynamic plus structural) of close to 5%, and noted that, conveniently, this is the same value commonly prescribed by the seismic design spectra within many building codes. However, this is clearly a mere coincidence as, though similar in value, the two damping mechanisms are quite different. Subsequently, Prowell and Veers [7] performed a comprehensive study on the assessment of wind turbine seismic risk. Results showed that wind-driven loads could grow faster than seismic-driven loads in the absence of control systems. However, for modern turbines with a blade pitch control system, the dominant loads would be the seismic ones, as the turbine increased in size. Then, Prowell et al. [8] conducted experimental work on a 65 kW Nordtank wind turbine, applying earthquake motions in two horizontal directions, and concluding that the importance of considering seismic demand increases as the turbine grows in capacity. Again, Prowell et al. [9,10] showed that earthquakes can produce, in the NREL 5 MW HAWT, a bending-moment demand at the tower base well above the one from extreme wind events in operational, emergency shutdown and parked simulations.
Moreover, an extensive investigation into the seismic response of a 1.65 MW Vestas turbine was conducted using ANSYS by Nuta [11]. The author developed fragility curves by performing incremental dynamic analyses and considering different intensity measures, damage measures, and damage states. However, aerodynamic loading was not considered in the analyses.
In order to study the earthquake response under operational wind loads, full models, including the rotor-nacelle assembly (RNA) component, have generally been preferred over simplified models. Recently, full system models have been used in conjunction with fully-coupled, nonlinear time-domain simulations capable of accounting for inherent coupling between aerodynamic and seismic response [12]. Based on this approach, a complete Finite Element model that accounts for flexibility of the blades in the flapping direction, the bending and twisting flexibility of the tower, and the gyroscopic effects of the rotor has been proposed by Diaz and Suarez [13]. They investigated the seismic response of a 76 m high, 1.65 MW HAWT, and showed that stresses at some tower sections may exceed those from extreme winds. Moreover, a Finite Element model of the NREL 5 MW HAWT involving shell elements with nonlinear material behavior for the tower, beam elements for the blades, and a coupling joint between rotor and rigid nacelle has been developed by Asareh [14] for fragility analyses under operational loads.
Although fully-coupled, nonlinear time-domain simulations are certainly most suitable to carry out a numerical solution for seismic assessment, the main disadvantage is that computational costs may be significant. As an alternative, an uncoupled approach, where the response to simultaneous wind and earthquake loads is obtained by combining two uncoupled analyses, one under wind and another under earthquake only, can be applied [15]. In this manner, the response to a given wind state, once computed, could be combined with the response to different potential earthquake events, with a significant reduction of computational costs with respect to fully-coupled time-domain simulations.
International Standards such as IEC 61400-1 [16] and Guidelines such as ASCE-AWEA RP2011 [17] allow the combination of uncoupled analyses, instead of performing fully-coupled, nonlinear time-domain simulations. To address these issues, uncoupled analyses, where separate wind and earthquake responses are both computed in the time domain would be desirable, as they would allow nonlinearities, such as those deriving from foundation or structural modelling, to be considered directly in the structural model. It is apparent that the implementation of the uncoupled approach requires an appropriate level of aerodynamic damping, for which there is only little data available in the literature. Recently, Valamanesh et al. [18] presented a closed-form solution for the longitudinal and transversal aerodynamic damping of HAWTs. The formulation was intended as a convenient method to include the effect of aerodynamic damping in the seismic analysis of HAWTs through multibody dynamic analysis.
While there is extensive analytical and empirical information on the seismic response and vulnerability of buildings and other common structures, similar data are not available for wind turbines. In fact, wind turbine installations have not yet experienced severe ground shaking, given their recent installation in highly seismic regions; the analytical tools for the design also seem to be sparse, with more focus on operational aspects than their seismic performance.
Within this topic, this paper presents some results on the multi-risk structural response assessment of a 5-MW land-based HAWT subjected to wind and seismic actions, to be used in a probabilistic framework. First, the specifications of the HAWT considered are presented. Then, the numerical tools used to generate random wind and seismic loadings are introduced. Subsequently, a decoupled approach to solving the coupled equations of the motion of an aeroelastic model of HAWTs under wind and seismic loading is presented and discussed. To this aim, the concept of aerodynamic damping is used. Again, numerical Monte Carlo simulations are performed to estimate the distribution of the maximum bending moment generated at the HAWT tower base in random loadings and in different operation modes. Finally, a failure state is determined allowing fragility curves to be plotted and vulnerability assessment to be carried out.
2. Case Study of 5 MW NREL Land-Based HAWT
The impact of the combined wind and seismic action effects on the structural response of a HAWT is evaluated on a dynamic model of 5 MW land-based turbine developed by NREL, whose main specifications are provided in Table 1. This wind generator is an upwind, three-bladed, variable-speed and variable-pitch machine. Each blade of the land-based turbine is composed of eight segments, each with a different airfoil designation (17 sections with three cylinders—see Table 1); the maximum chord is 4.652 m, and the maximum twist angle θ is 13.08°. The turbine has a rotor diameter of 126 m and a tower height of 87.60 m with cut-in, rated, and cut-out wind speeds of 3 m/s, 11.4 m/s and 25 m/s, respectively. The pitch and rotor speed are controlled to optimize power output for any wind speed. Cut-in speed is associated with near zero torque on the generator, with no generation of power. Rated wind speed is the point where the pitch control system is activated, and the blades start to be rotated so that the torque and generated power remain at a constant at higher wind speeds. Cut-out wind speed is when the turbine shuts down in high wind speeds to prevent the structure from being damaged. For steady-state conditions, the dependence of rotor speed and blade pitch on wind speeds between cut-in and cut-out is shown in Figure 2, where the trend of the angular velocity of the rotor Ω and of the Tip Speed Ratio TSR (ratio between the blade tip velocity and the wind speed) as a function of the wind speed are depicted. All the results shown for the operational conditions are based on combinations of wind speed, rotor speed, and blade pitch as specified in Figure 2, whereas the results presented for parked conditions are based on a stationary rotor with feathered blades.
The tower is the main structural component of a HAWT structure; it is composed of a steel tubular cantilever beam with a hollow circular cross-section. Specifically, the tower structure has a total height of 87.60 m, with an external diameter of 6.00 m at the base and 3.87 m at the top. Shell thicknesses vary from 27 mm at the base to 19 mm at the top. Steel density was taken to be 8500 kg/m3 to account for paint, bolts, welds, and flanges that are not included in the tower thickness data. Further specifications of this HAWT are given in Jonkman et al. [19].
3. Wind and Seismic Actions
The assessment of the structural response of a HAWT requires the definition of wind loads and seismic loads. To calculate the wind loads on the blade, random wind field velocity time histories must be defined. Generally, wind velocity can be decomposed into mean and fluctuating parts. Given that the wind can be treated as a random process, its mean velocity can be obtained by probabilistic wind climate studies, and the fluctuating wind can be defined by a power spectral density and a coherence function. Different values of the mean wind velocity are here considered; these are the cut-in (3 m/s), the rated (11.4 m/s) and the cut-out (25 m/s) velocities, evaluated at the hub height (equal to 87.60 m). The vertical wind profile, U(z), is assumed to be a logarithmic profile in atmospherically neutral conditions:
where z0 is the roughness length, U(zr) is the mean velocity at the reference height, corresponding to the hub height zr. A value for z0 equal to 0.05 m for all the scenarios is assumed, characterizing farmland with boundary edges and occasional buildings. For each value of the mean wind speed, fifteen turbulent wind fields (grid 20 × 20 with a step of 6.68 m) were generated using the Sandia Method [20] implemented in Q-Blade [21], setting the minimum value of 10% for the turbulence intensity. The mean wind speed profile for the three conditions considered and a sample of the instantaneous turbulent wind field for the rated wind speed condition are represented in Figure 3.
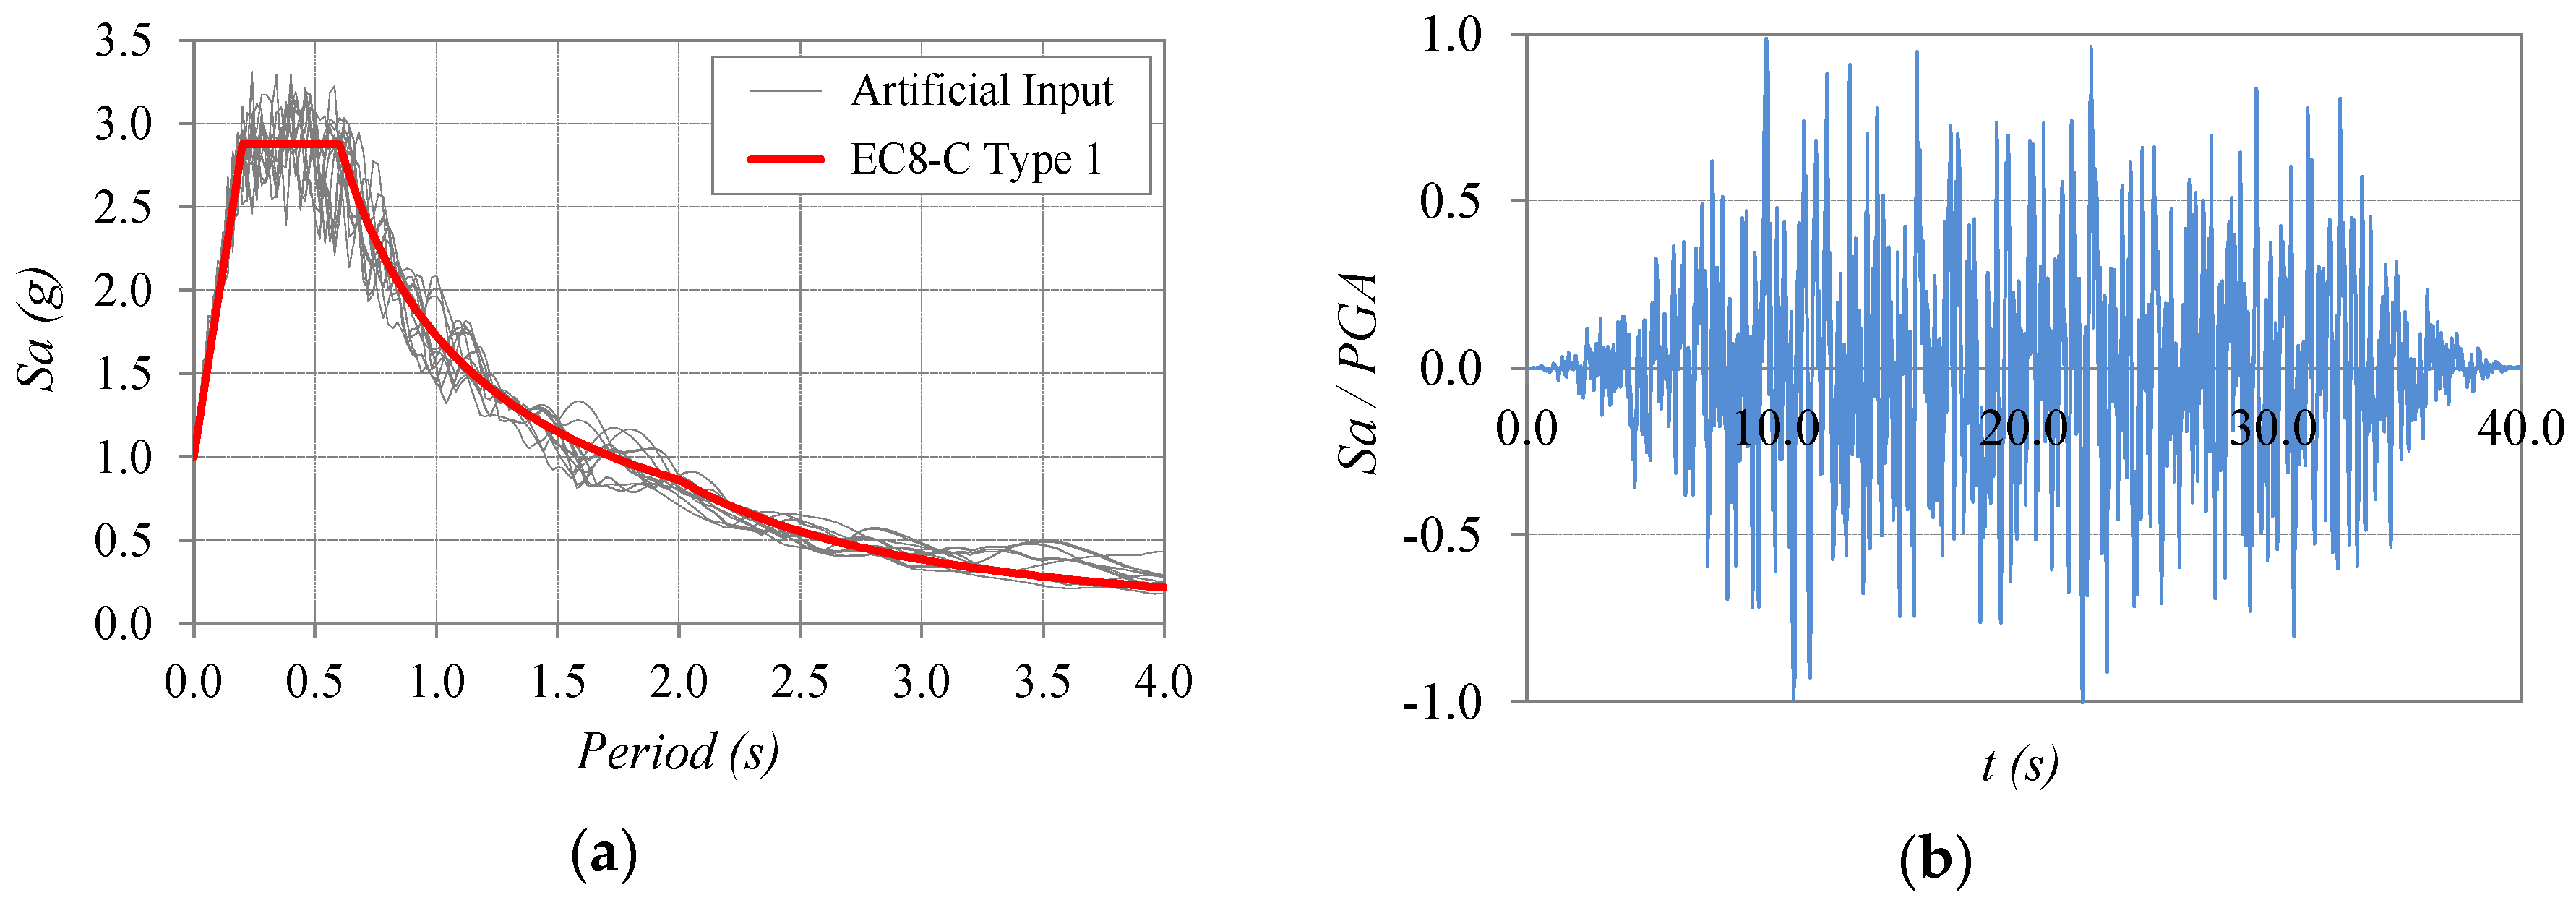
On the other hand, the seismic input action is represented by fifteen artificial accelerograms. Specifically, the input signals were generated using the SeismoSignal software [22] with a total duration of 40 s, and a strong motion duration of 20 s, according to EC8 [23]. The accelerograms were selected such that their mean spectrum was never lower than 90% of the corresponding EC8 elastic spectrum for type C soil with a 5% damping ratio. In Figure 4, the acceleration spectra of the generated artificial input and the EC8 target spectrum are reported. These input signals were scaled to a peak ground acceleration ranging from 0 to 1 g, with a step of 0.05 g. The scaling of the signals was done varying only the amplitude, and leaving the same frequency content (i.e., the same shape of the response spectrum).
4. Aeroelastic Model and Decoupled Approach
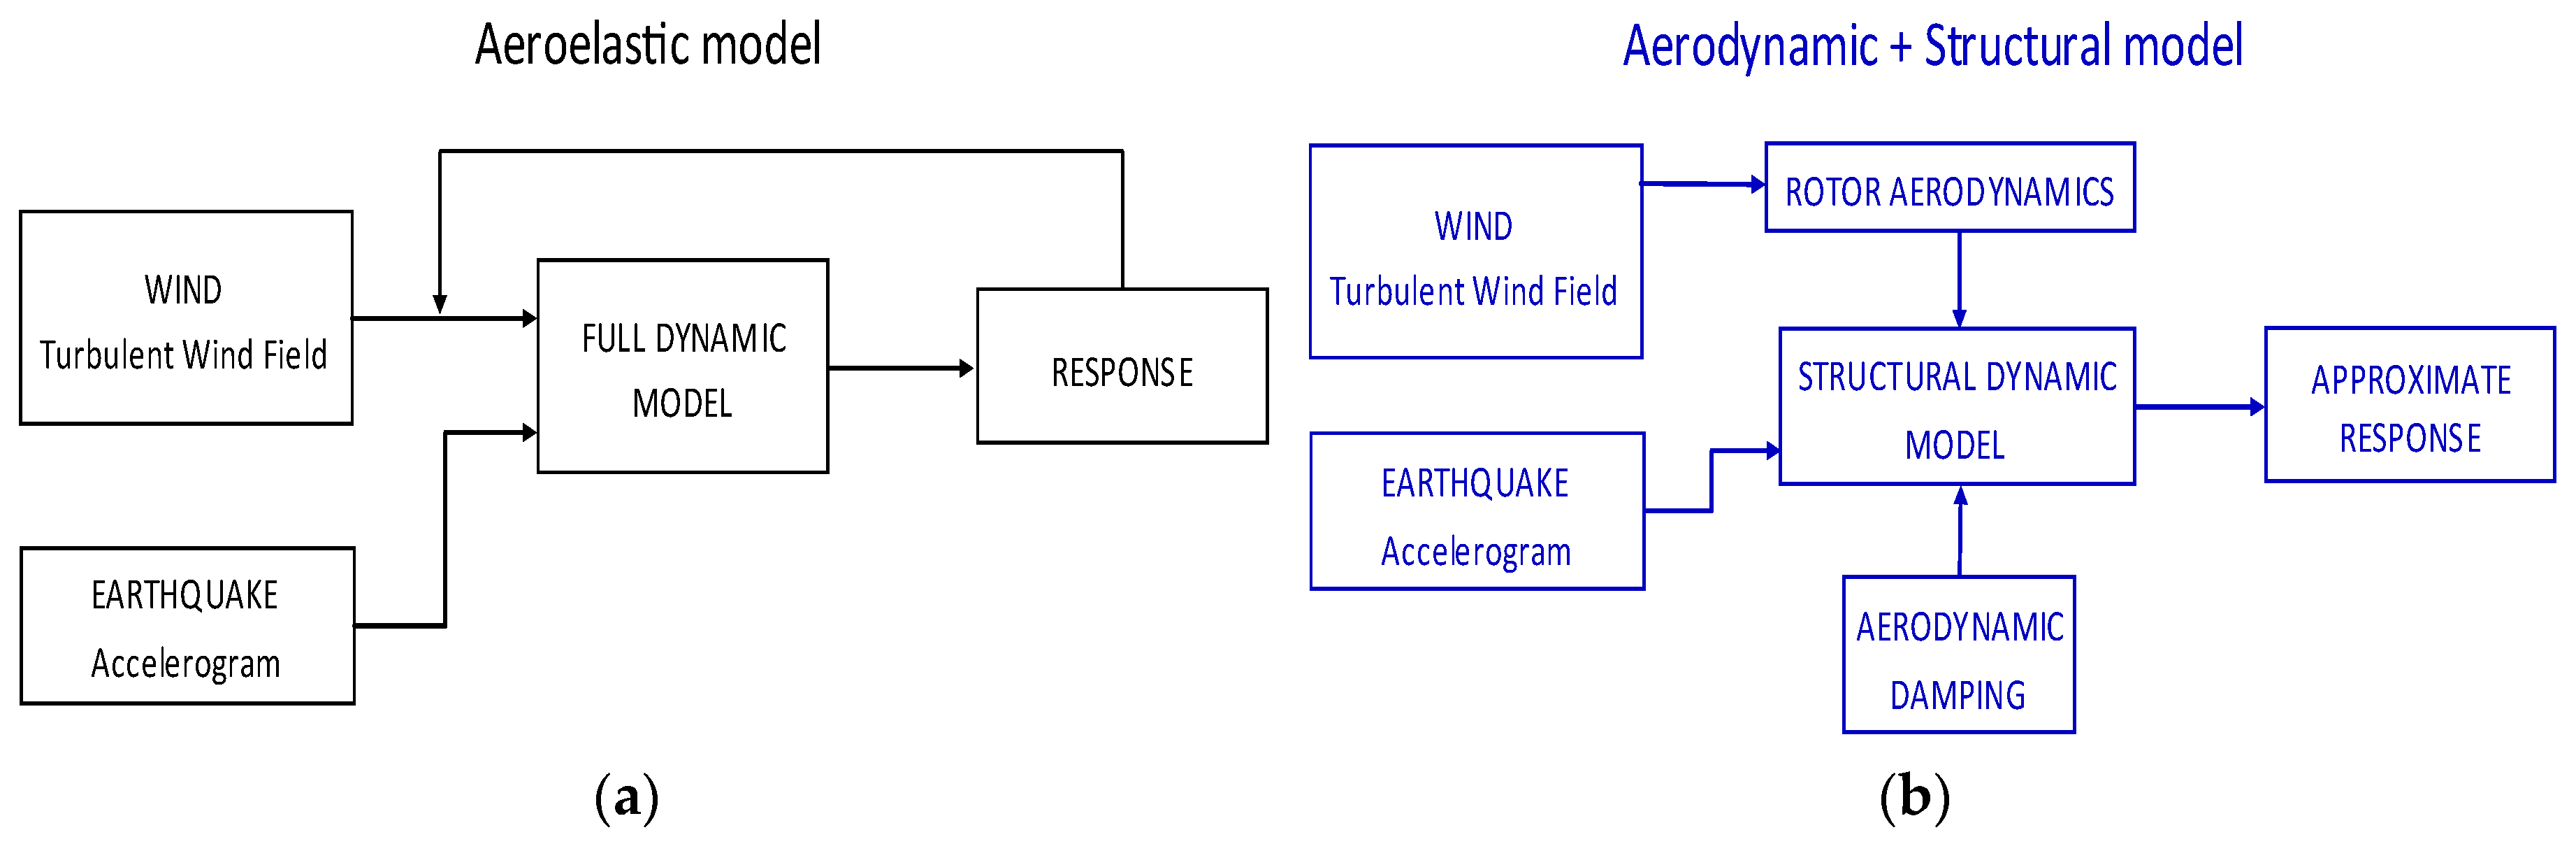
Wind turbines are highly dynamic and tightly coupled systems that characterize a multiphysics problem, and their structural design and assessment pose specific challenges [24,25]. The rotor of a wind turbine is subject to aeroelastic effects that result in feedback of the rotor motion on the forces acting on the supporting structure.
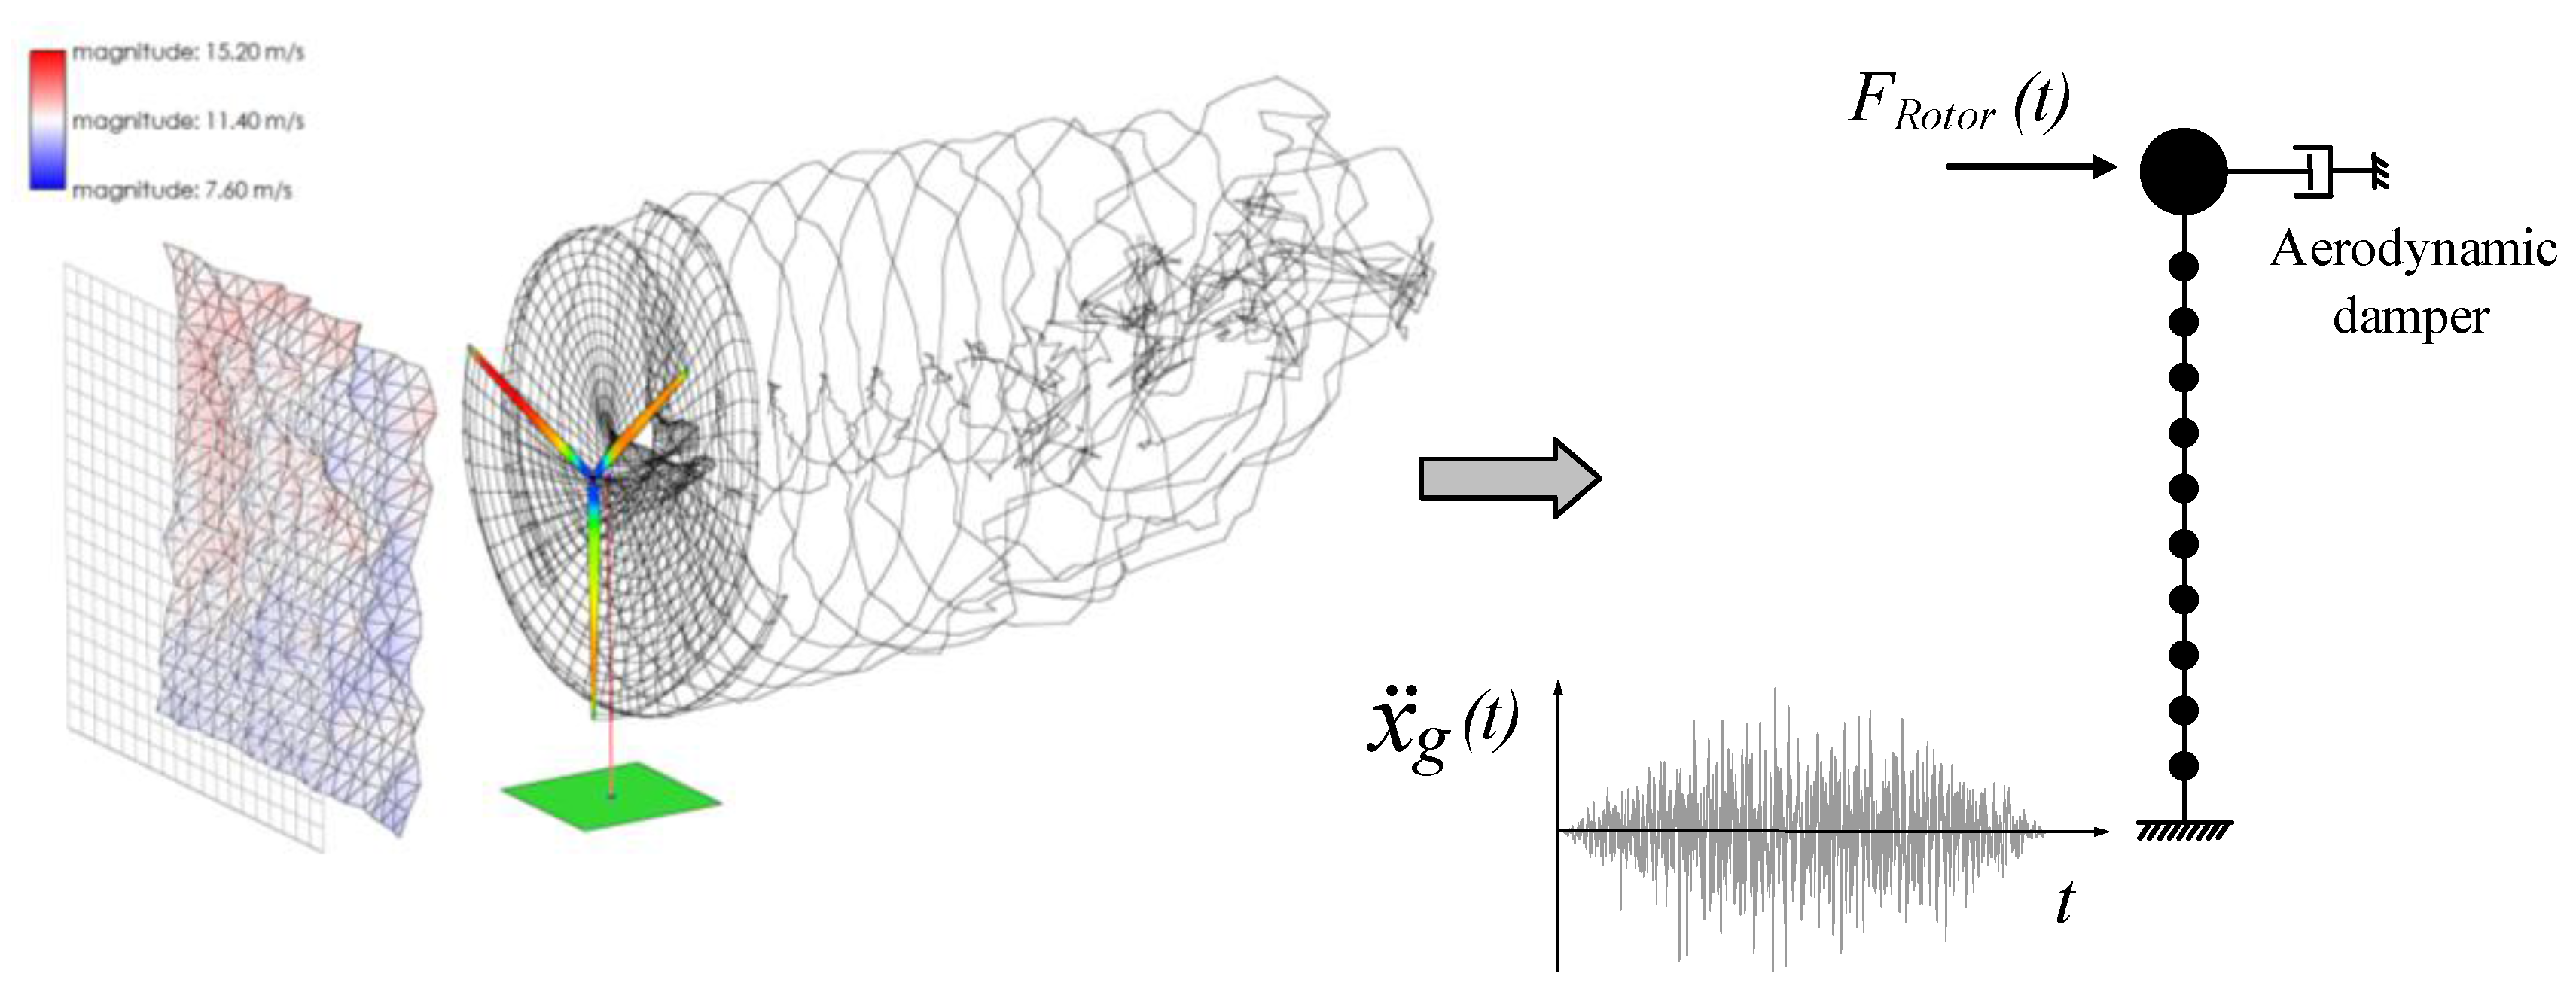
The aerodynamic forces strongly depend on the wind speed field experienced by the blades, which is an irregular environmental condition characterized by turbulence. Moreover, the aerodynamic forces also depend on the dynamic response of the HAWT support structure when subjected to wind and seismic excitation. In fact, the tower top oscillations due to ground motion affect the rotor aerodynamics, and in particular the relative wind speed at the blades, depending on which the aerodynamic loads, i.e., lift and drag forces on the blades, are calculated. An essential outline of an aeroelastic model for the study of the dynamic response of the HAWT structure is depicted in Figure 5a (black lines and text), while the general equation of motion can be expressed as:
where MHAWT, CHAWT and KHAWT are the structural mass, damping and stiffness matrices, respectively; ẍ, ẋ and x are the time-dependent acceleration, velocity, and displacement vectors, respectively; Faerodyn (U, ẍ, ẋ, x) is the load vector due to the aerodynamic forces on the rotor blades, MHAWT I ẍg(t) is the seismic force vector, wherein I is the influence coefficient vector and ẍg(t) is the input ground acceleration. Therefore, in general, the aerodynamic force vector Faerodyn is dependent on the wind action and on the dynamic response of the overall system. According to this equation of motion, full system models have to be used in conjunction with fully-coupled, nonlinear time-domain simulation capable of accounting for the inherent coupling between aerodynamic and seismic responses. Although fully-coupled time-domain simulations are the most suitable choice to carry out a numerical solution for seismic assessment, their disadvantage is their high computational cost, which is quite prohibitive when several analyses have to be implemented for different environmental states and system parameters.
MHAWT ẍ + CHAWT ẋ + KHAWT x = Faerodyn (U, ẍ, ẋ, x) - MHAWT I ẍg(t)
In this study, the aerodynamic and seismic loads acting on the structural model of the HAWT were evaluated by decoupling the aerodynamic behavior of the rotor from the dynamic response of the support structure. Using this assumption, the aerodynamic force is expressed as:
where the load vector due to the aerodynamic forces on the rotor blades depends only on the wind speed U, and Ca is the aerodynamic damping matrix.
Faerodyn (U, ẍ, ẋ, x) = Faerodyn (U) – Ca (U) · ẋ
First, the response of the rotor with rigid blades neglecting the dynamic behavior of the tower structures is evaluated. Then, the loads derived from the first step are applied to the structural dynamic model of the tower considering the aerodynamic damping. The structural approximate response of the HAWT was calculated by applying the wind thrust of the rotor and the seismic excitation to a structural dynamic model of the tower neglecting any feedback (see Figure 6). In particular, the HAWT support structure is modelled using the SAP2000 Finite Element software, and two different time-history analyses are carried out, applying the wind action as a time-dependent rotor thrust to the tower top, and the seismic action as a tower base excitation, respectively.
Within this decoupled approach, the aeroelastic interaction was taken into account through a proper definition of aerodynamic damping [26]. When the wind turbine moves into the wind (tower motion in the along-wind direction), the relative wind velocity experienced by the blades changes, and the aerodynamic force in the opposite direction increases. In contrast, moving out of the wind results in a decrease of the force in that direction. This results in an apparent additional damping force that reduces the horizontal motion of the wind turbine. The aerodynamic force signals are thereby explicitly dependent on the motions of the turbine, and this means an accurate structural analysis of a wind turbine has to be coupled with an aerodynamic rotor simulation, in order to take tower motions into account. This decoupled pattern divided in rotor aerodynamic model and structural dynamic model with aerodynamic damping is also depicted in Figure 5b.
The use of the uncoupled approach was validated for NREL 5MW land-based HAWTs by Santangelo et al. [15]. In particular, comparative analyses in the time domain between the results obtained by fully-coupled simulation performed in GH BLADED [27] and those obtained by linear combination of separate wind and earthquake responses, the latter computed by adding different levels of aerodynamic damping, are carried out. The results show that errors in bending moment and shear forces are within engineering margins, which is encouraging for the use of the uncoupling approach, and confirm that a value of 4% for the aerodynamic damping, recommended by ASCE-AWEA RP2011 [17] and in previous studies [6,7,8,9,10,11,12,13,14,15,16,17,18], can reasonably also be used in time-domain uncoupled analyses.
5. Aerodynamic Model
The aerodynamic analyses of the rotor subjected to wind loads is here carried out in the time domain by means of the Lifting Line–Free Vortex Wake algorithm implemented in Q-Blade [28], generally following the work of Van Garrel [29], and considering a rigid behavior of the rotor blades and of the tower structure. The lifting line simulation method belongs to the family of the so-called “vortex methods”. Using vortex methods, the flow field is modelled as inviscid, incompressible and irrotational; vortex elements are introduced in the form of straight or curved line segments to model both the rotor blades and the wake. The vortex lattice method models rotor blades with a lattice of horseshoe vortices, which are located on the blade mid-surface. The panel method models the blades with a single line of vortices, located at the quarter chord points of the blade. Nonlinearity exists in the fact that the circulation, computed for the bound vortices on the lifting line, is obtained from nonlinear lift and drag polars. One large advantage of vortex methods, compared to BEM methods, is that, due to the sound modelling of the macroscopic flow physics, only very few empirical models related to microscopic fluid dynamics, where boundary layer effects play an important role (such as dynamic stall or stall delay), need to be added. Additionally, vortex methods not only provide simulation results concerning the rotor performance and the blade loads but also result in the unsteady velocity field around the rotor and wake at every time step.
6. Structural Model of the Tower and Aerodynamic Damping
The structural dynamic model of the HAWT is an Euler-Bernoulli cantilever discretized by 11 nodes into 10-beam tapered elements, connected to a rigid foundation; hence the elasticity of the pile and of the soil was not considered in this paper. The mass of the nacelle and rotor are concentrated at the top node, while the tower mass is concentrated at each corresponding node of the cantilever beam, representing the flexible model of the tower. A pattern of the tower structural model and of the external loads applied to it, consisting of rotor thrust and seismic input is shown in Figure 5. The equation of motion for the tower can be expressed as:
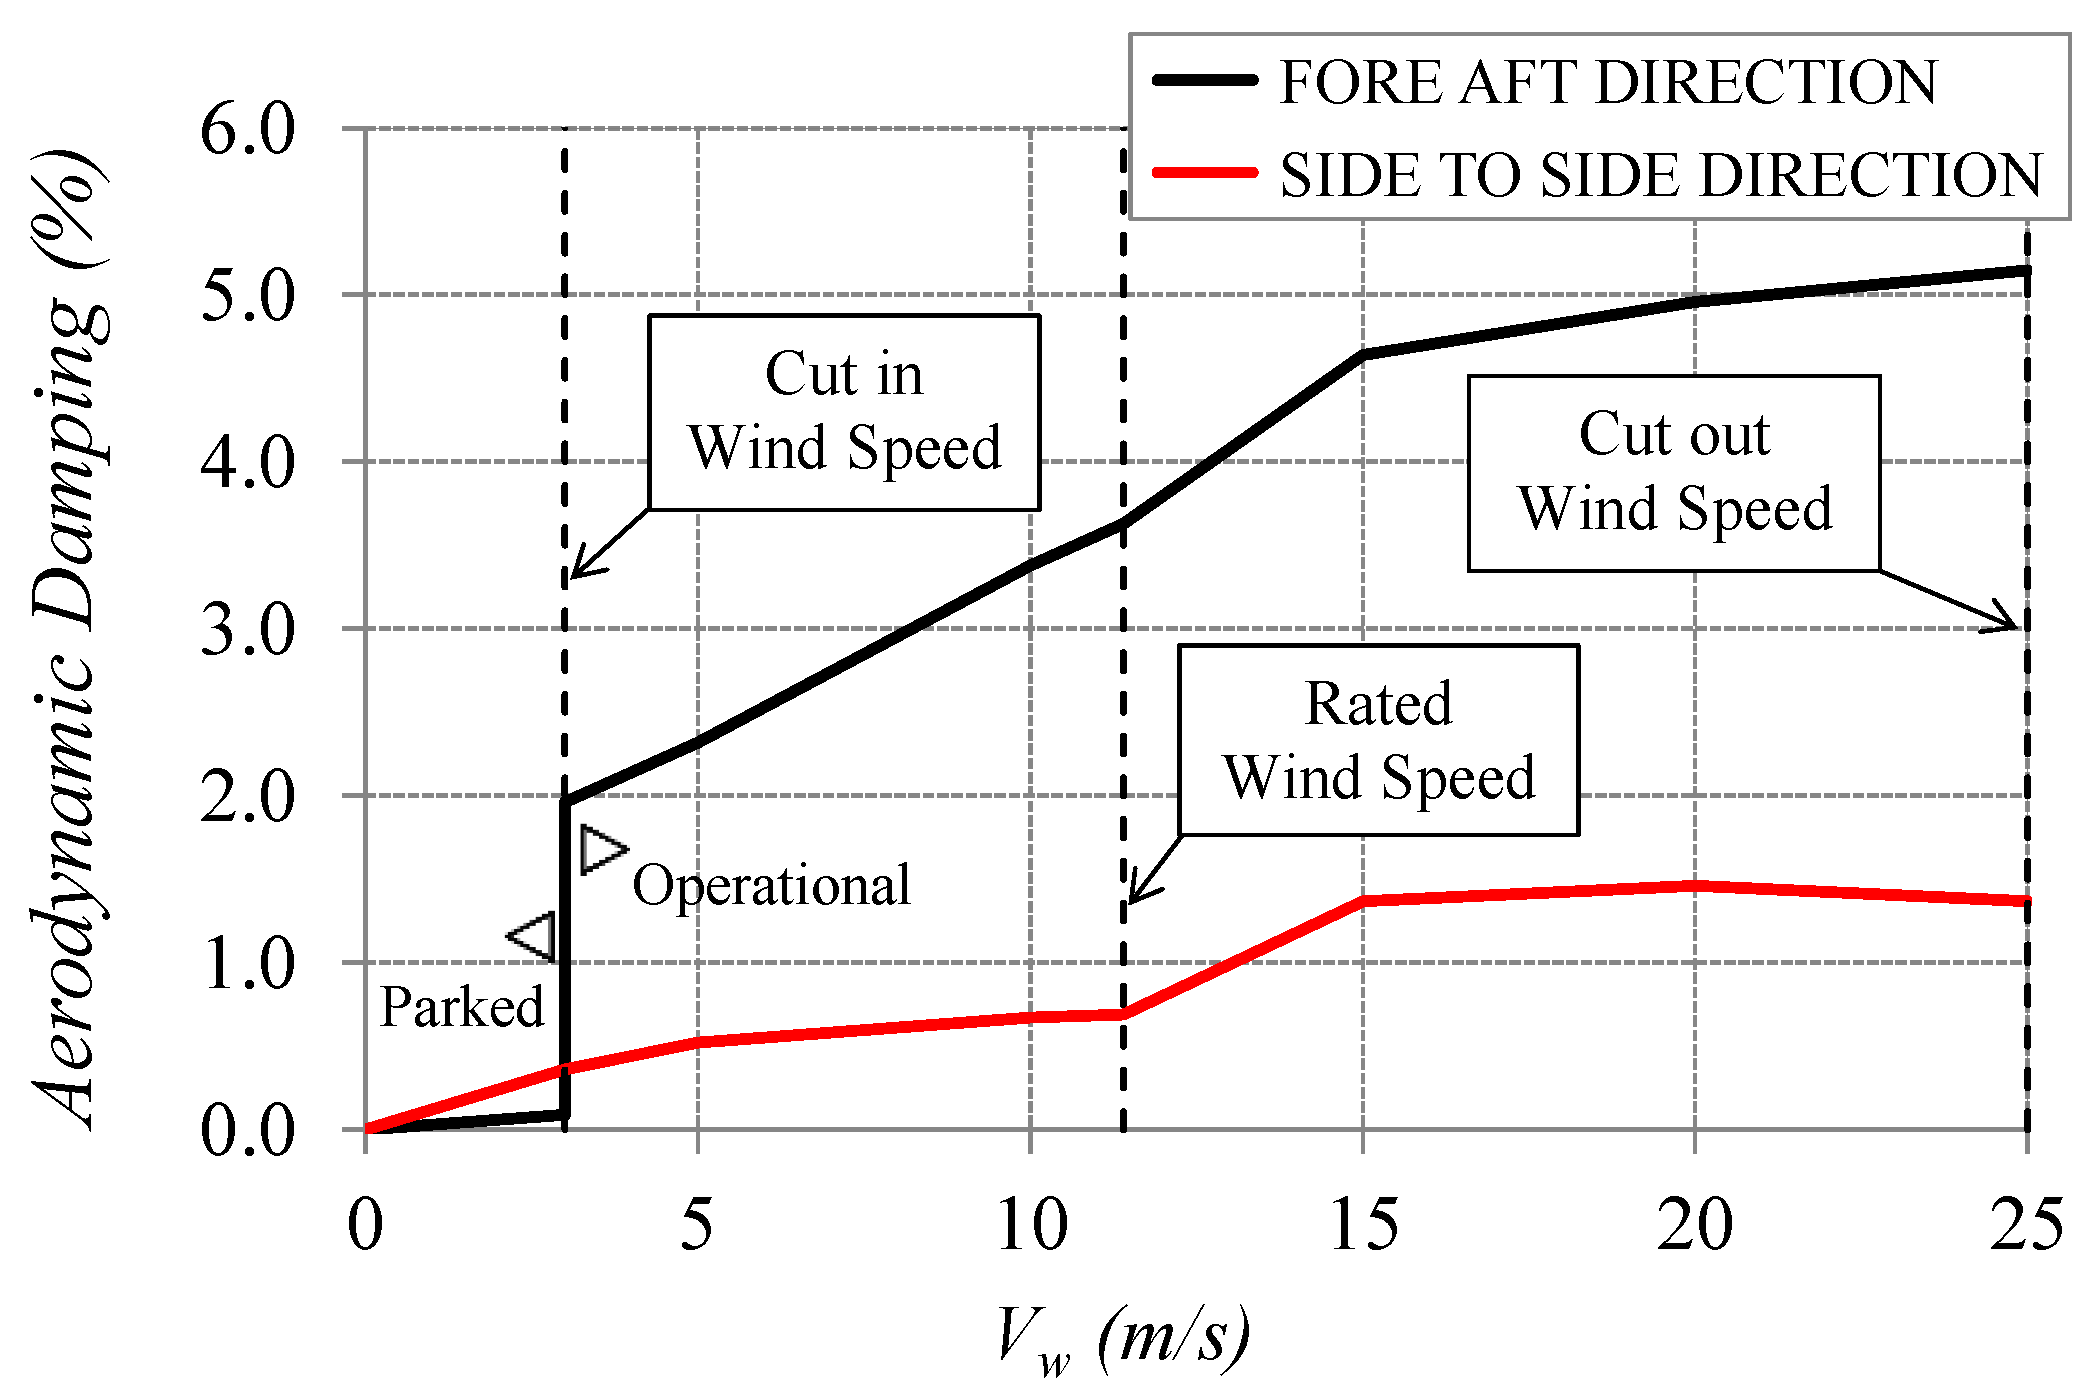
where MTF, CTF and KTF, are the tower mass, damping and stiffness matrices, respectively; ẍ, ẋ and x are the time-dependent acceleration, velocity, and displacement vectors, respectively; FRotor (t) is the rotor thrust load vector, whose only non-nil component is that applied at the top node, MTF I ẍg(t) is the seismic force vector, wherein I = [1,1,1,…..,1]T is the influence coefficient vector and ẍg(t) the ground acceleration time history. The total damping in the model is the sum of structural damping, assumed to be 1% of critical, and aerodynamic damping calculated for each parked/operational condition using the closed form solution proposed by Valamanesh and Myers [18]. As mentioned above, this decoupling approach can be applied because wind loads and seismic excitation can be seen as independent phenomena. Aerodynamic damping is accounted for as an additional structural damping in the Finite Element (FE) model of the supporting structure (see Figure 6). An accurate estimation of the fore-aft and side-to-side aerodynamic damping was carried out here using the closed-form solution proposed in [18]. This solution, starting from the blade BEM theory, bases its derivation on several simplifying assumptions, most notably a rigid rotor and a steady, uniform wind oriented perpendicular to the rotor plane. This approach permits the accurate consideration of aerodynamic damping within software with more refined structural analysis features. The trends of the aerodynamic damping ratio, here estimated for the case of the NREL 5-MW HAWT in fore-aft direction and in side-to-side direction, using the above-mentioned approach and assuming air density values of 1.25 kg/m3, are presented in Figure 7. These estimates are provided as a function of wind speed for both parked and operational conditions. In the fore-aft direction, the predictions of the aerodynamic damping result in a maximum value of 0.1% for the parked condition, and in a mean value of 3.7% (range between 2.0% and 5.2%) for operational conditions. The predictions for the side-to-side direction result in lower aerodynamic damping, with a mean value of 1% (range between 0.3% and 1.5%) for the operational condition.
MTF ẍ + CTF ẋ + KTF x = FRotor (t) - MTF I ẍg(t)
These values are quite consistent with the recommendations by ASCE/AWEA RP2011, which state that the total damping should be set to 1% during parked conditions and 5% during operational conditions, regardless of the direction of vibration. Given the aerodynamic damping in the fore-aft and side-to-side direction of the HAWT, the aerodynamic damping in any direction can be obtained using a transformation matrix.
7. Aerodynamic and Seismic Response of Wind Turbine
The aerodynamic response of the HAWT rotor blades was evaluated in the time domain calculating the time histories of the thrust at the rotor using Q-Blade for each mean wind speed considered (parked and operational conditions), producing fifteen rotor thrust time histories. An example of the rotor thrust time history for each operational and parked condition is depicted in Figure 8. Each thrust time history is then applied to the top of the tower structural model, so as to evaluate the corresponding tower-base bending moment time-history in the fore-aft direction.
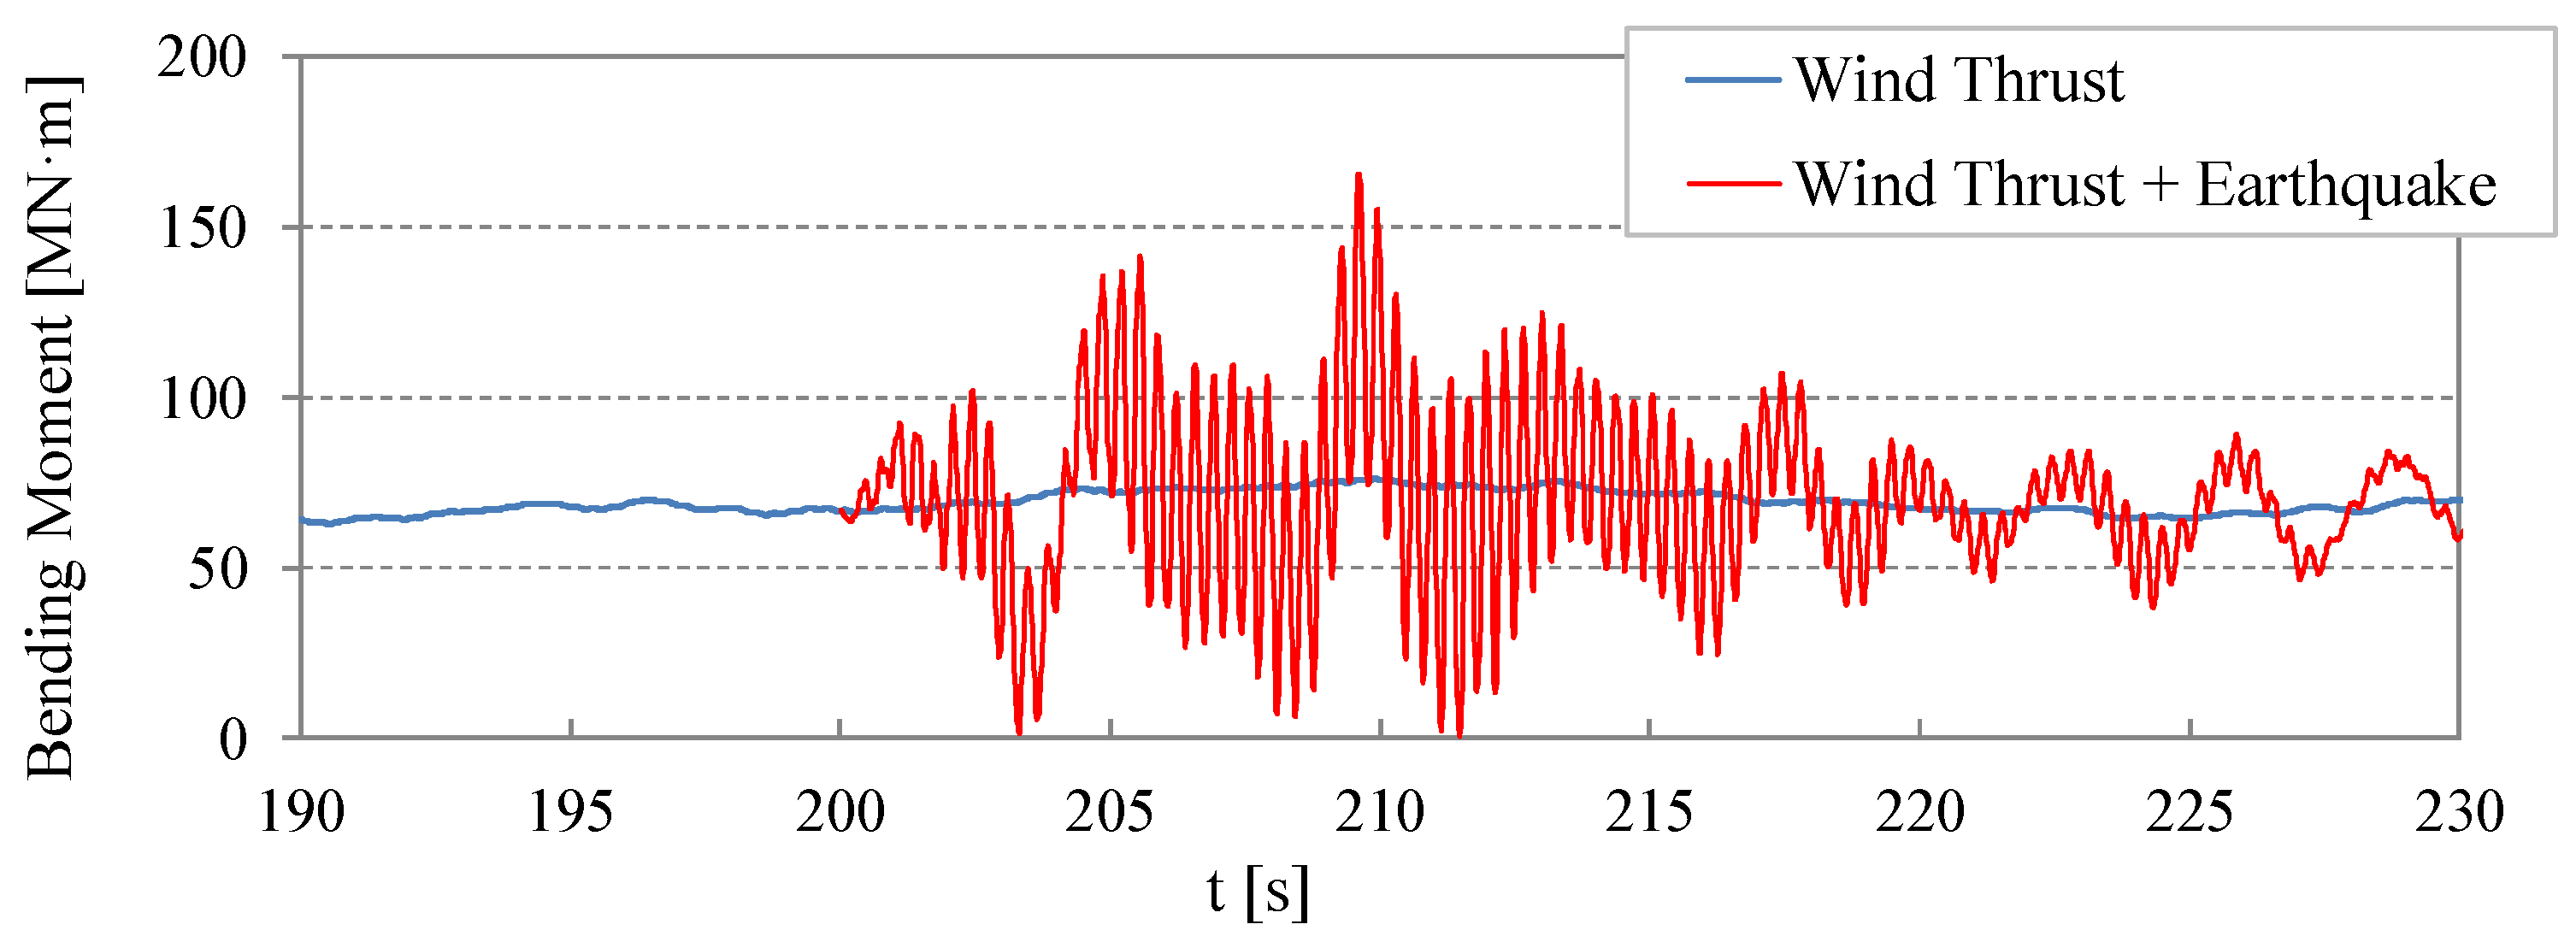
The structural model was then analyzed under the fifteen artificial accelerograms mentioned above. Each ground motion is applied either as a fore-aft or a side-to-side acceleration boundary condition at the base of the tower, and linear dynamic time-history analyses are carried out to evaluate the corresponding seismic response. The magnitude of the aerodynamic damping for the time-history analyses was set for each parked and operational condition at values calculated here for the fore-aft and side-to-side directions using the closed-form solution proposed by Valamanesh (Figure 7), while the structural damping is assumed to be equal to 1% of critical for all directions. The time-history response to wind was calculated for 300 s, and the ground motion was applied after 200 s of simulation. In so doing, the transient behavior of the turbine at the beginning of the simulation did not affect the seismic response. The impact of the seismic effects on the operational wind turbine was analyzed in terms of bending moment fluctuations at the tower base section. For example, the results in terms of tower base bending moment in operational conditions at 11.4 m/s with and without the seismic effects are shown in Figure 9. In particular, the blue line indicates the tower base bending moment without considering the seismic effects, while the red line incorporates the seismic loads due to an artificial seismic input scaled to a peak ground acceleration of 0.4 g. In this case, the maximum bending moment of 166 MN·m corresponds to an increase of 118% with respect to the maximum value due to the wind action alone.
8. Probabilistic Assessment of Peak Response
According to the methodology presented, the structural response of the 5 MW HAWT tower against the combined effects of wind and seismic actions was evaluated. In particular, for every working condition (parked/operational) the maximum value of the bending moment at the tower base cross-section was evaluated for each combination of wind load (acting in fore-aft direction) and seismic load acting in fore-aft direction or in side-to-side one. The probabilistic assessment of peak response of the wind turbine supporting structure was evaluated using Monte Carlo simulations. Specifically, each wind response time history was then combined with each seismic response time-history, so to obtain a total of 2 × 225 response time histories for each scenario (1 parked and 3 operational wind speed levels). The method adopted for the combination of the aerodynamic and seismic response of wind turbine was described in Section 7.
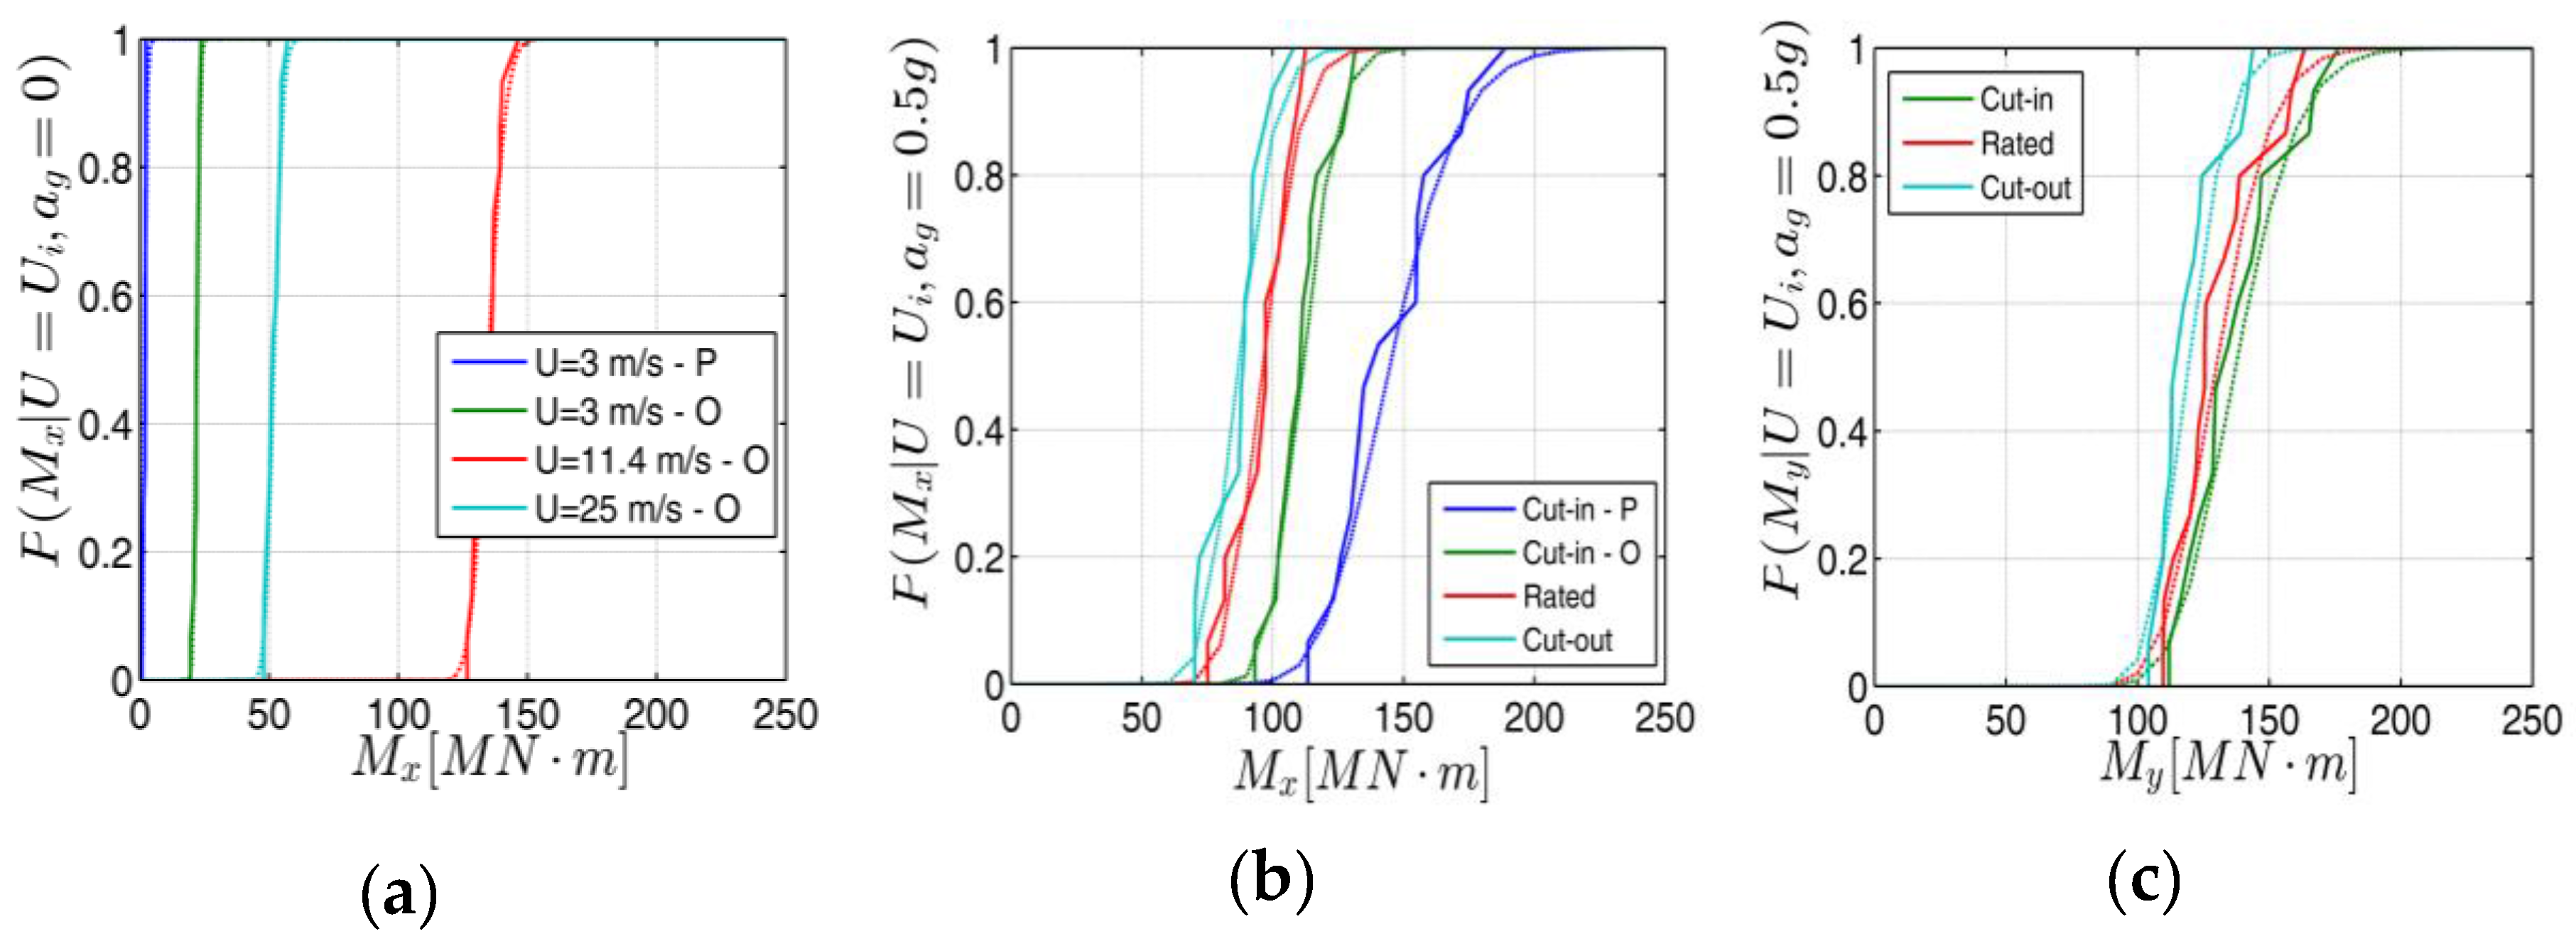
In Figure 10a, the empirical cumulative density function (CDF) of the tower base absolute maximum bending moment M is fitted to the Lognormal distribution for all parked and operational wind conditions without seismic actions. As expected, the values of the tower base bending moment increase with the operational wind speed up to the rated value, where the maximum bending moments are reached (mean value of 134.82 MN·m), and then decrease with further increase in the wind speed up to the cut-out condition (mean value of 51.94 MN·m). Moreover, for the wind speed value of 3 m/s, the difference between the tower base absolute maximum bending moment values observed in the parked and operational conditions (mean value of 1.89 MN·m and 22.05 MN·m, respectively) is due to the much lower rotor thrust calculated for the parked scenario with respect to the operational scenario.
The empirical cumulative density function (CDF) of the tower base absolute maximum bending moment is again fitted to a Lognormal distribution for the tower model subjected to the seismic action, scaled to a peak ground acceleration of 0.5 g, acting in fore-aft direction (Figure 10b) or in side-to-side direction (Figure 10c), without considering the wind action. The operational condition stated in the legend of Figure 10b refers to the aerodynamic damping value assumed for the seismic analyses. In these cases, it is observed that the tower base bending moment values decrease as the wind speed increases, due to the increasing value of the corresponding aerodynamic damping ratio. For a wind speed of 3 m/s and the seismic action in the side-to-side direction, the seismic effects for the parked and operational conditions are the same, because the aerodynamic damping is the same. In Figure 11, the empirical and fitted CDF of the tower base absolute maximum bending moment are shown for the combination of the wind and seismic action. Also in this case, the accelerograms were scaled to a peak ground acceleration of 0.5 g. When the seismic action is in the fore-aft direction, the operational rated scenario brings the largest values of the tower-base bending moment (mean value of 163.53 MN·m and standard deviation of 11.9 MN·m). For a wind speed of 3 m/s, the combined effect of wind and seismic loads are larger for the parked condition if compared to the operational one, due to the lower aerodynamic damping. The parameters of the CDF (mean μ and standard deviation σ) estimated for the wind load conditions (fore-aft direction), the seismic load conditions (fore-aft and side-to-side direction) and the combinations of wind and seismic loads presented here are listed in Table 2.
9. Prediction of the Tower Failure Condition
Globally, the wind turbine tower behaves as a simple cantilever beam. Locally, however, it behaves as a thin-walled cylindrical shell, and the local buckling condition needs to be considered in safety evaluation. In this paper, the buckling limit state condition assessment was carried out deterministically by means of the stress design procedure proposed in Section 8.5 of EN 1993-1-6 [22], which is also allowed within ASCE/AWEA RP2011 [17]. To this end, an S355 steel was considered of fabrication tolerance quality Class C. Moreover, fixing an axial force value of 6.88 MN acting on the tower base section, due to the gravity loads, and assuming that the tangential stress associated with the shear force has a negligible effect on the maximum von Mises stress, an ultimate bending moment value of 205.8 MN·m for the buckling condition was assessed. This latter condition is reached when the maximum meridional compressive stress equals the elastic critical meridional buckling stress. In particular, a partial safety factor for material γm equal to 1.2 was assumed, according to IEC [16] and ASCE/AWEA RP2011 [17]. It should be mentioned that this type of analysis generally results in rather conservative values, whereas more accurate calculations can be obtained through global numerical analysis (e.g., using Linear Buckling Analysis and Materially Nonlinear Analysis) on a more refined FE model, according to the Section §8.6 of EN 1993-1-6.
10. Fragility Curve Derivation
Fragility analyses are commonly used in earthquake engineering for assessing the vulnerability of structures through the probability of damage over a range of potential loading intensities. Some specific research has already been developed for onshore HAWT, considering the variability of ground motion intensity [30,31] and wind speed [32] separately, and for offshore HAWT under the combination of extreme wind and wave conditions [33]. Fragility is defined as the conditional probability of a damage measure (DM) attaining or exceeding a damage limit state for a given intensity measure (IM) of the combined environmental conditions. The conditional probability of failure Pf,i can be evaluated as (e.g., [32,34]):
where DMi refers to damage measure according to the ith damage state and EDP is the engineering demand parameter. Lower-case symbols indicate the values of the random variables. P [DMi|EDP = edp] is the probability that the structures reaches the ith damage state, given the EDP value, i.e., the fragility curve. The EDP value in turn comes from the IM, probabilistically as P [EDP = edp|IM = im]. The fragility function is then obtained by calculating Pf for a convenient number of intensity values.
In this paper, the achievement of the tower base ultimate bending moment Mu (equal to 205.8 MN·m), corresponding to the buckling failure condition, is considered to be the only damage limit state; therefore, it is the only EDP considered. Thus, the fragility curves are defined as follows:
where Mu is the structural capacity corresponding to the above-mentioned failure limit state, M is the demand corresponding to the intensity measure of the combined wind scenario and earthquake intensity. Thus, the fragility curves are calculated for the four different wind scenarios (parked and operational, defined as U = Ui) combined with the seismic loads acting in fore-aft or side-to-side direction (Table 3 and Figure 12). The most common form of a seismic fragility function is the lognormal cumulative distribution function (CDF), and can be also expressed as:
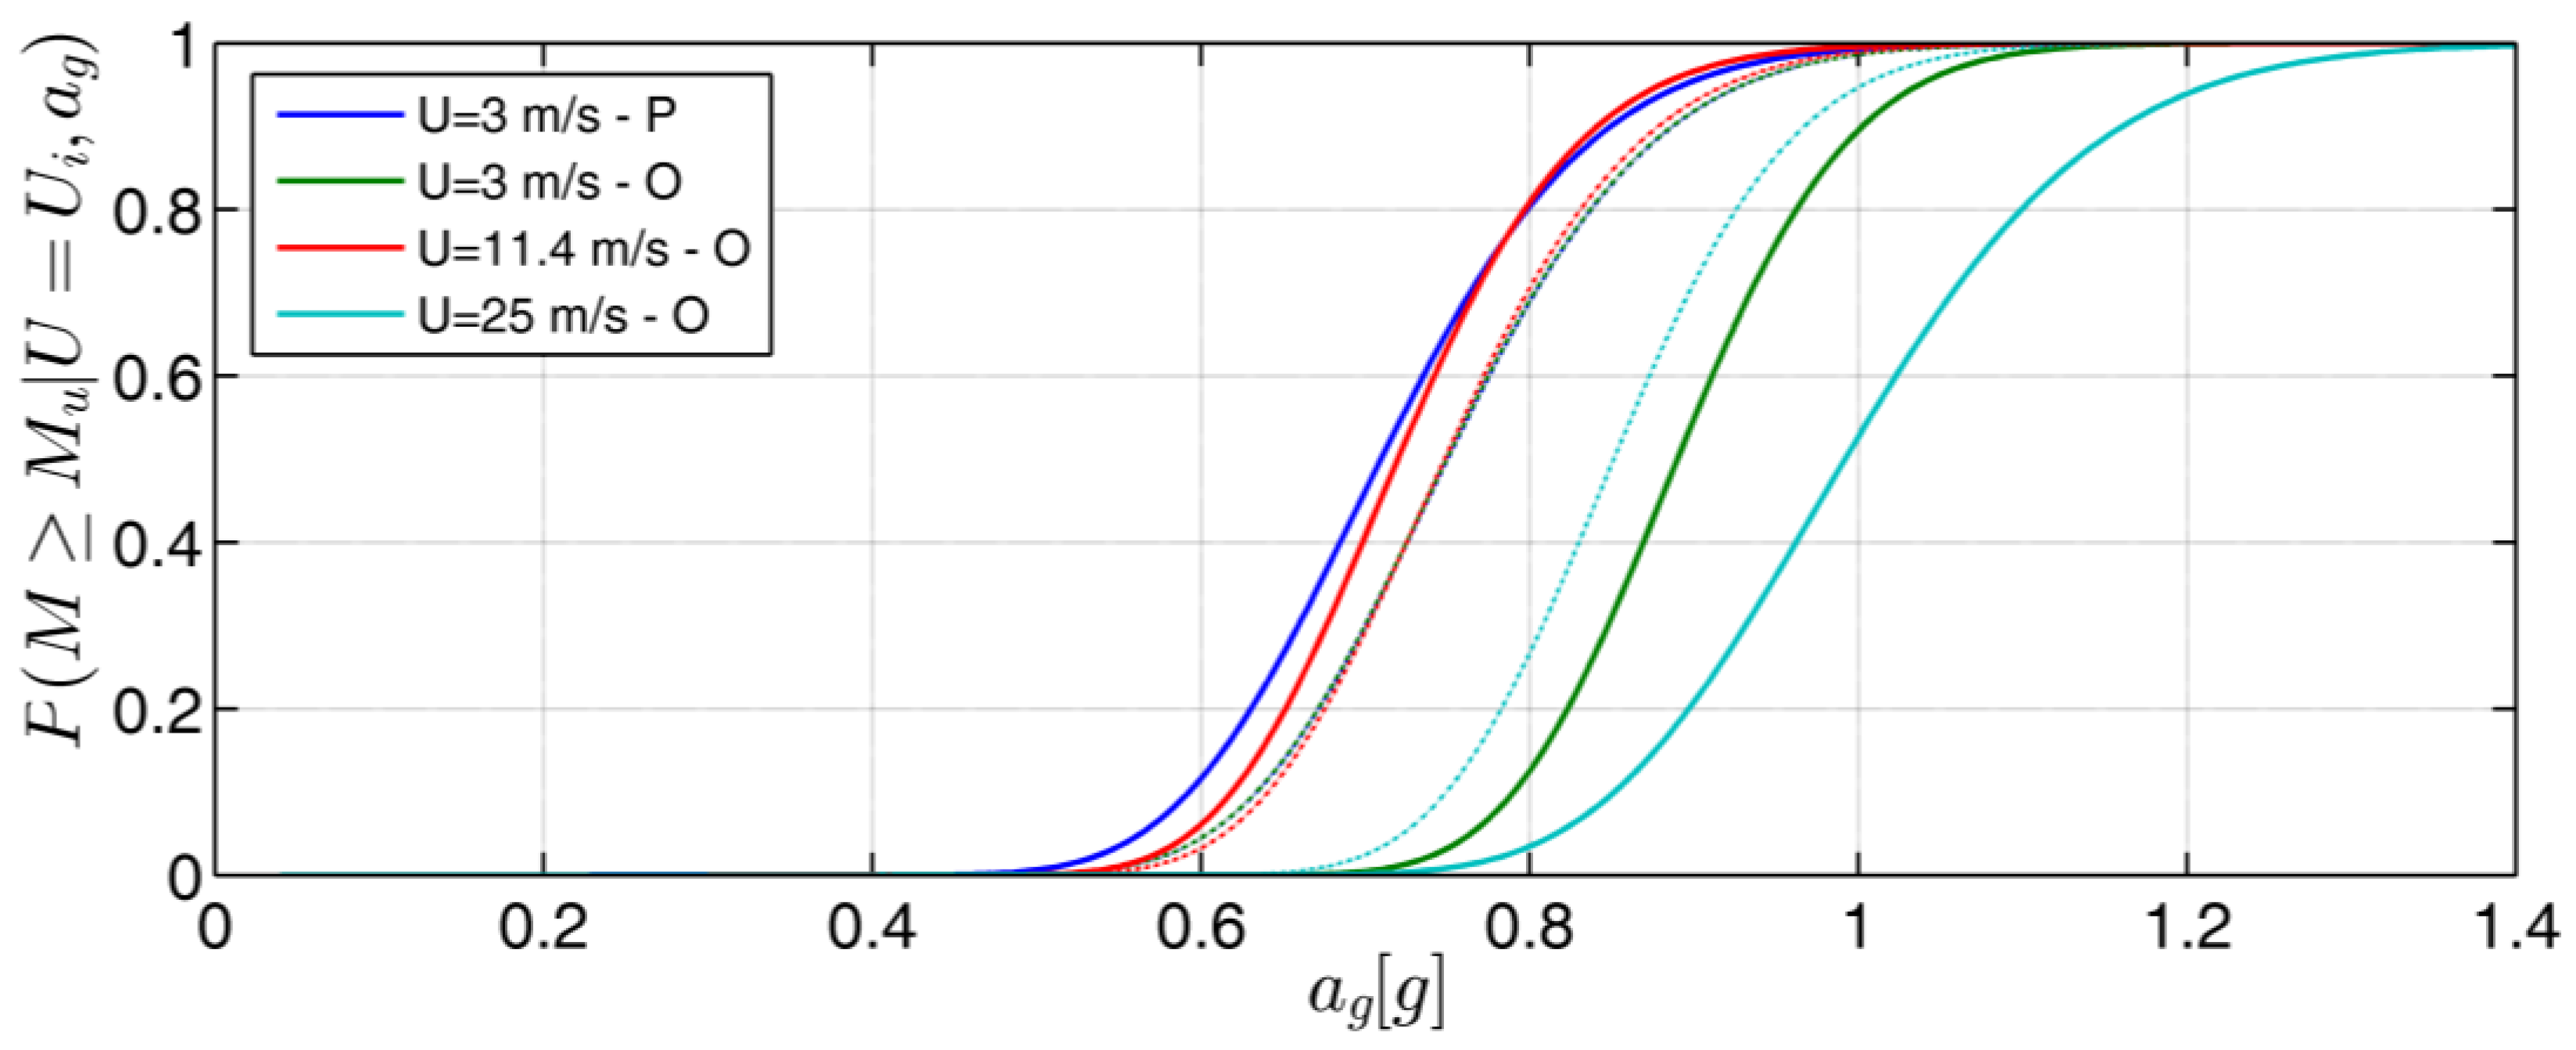
where Φ is the standardized normal distribution function; μ and σ are the natural logarithm of the mean and logarithmic standard deviation, respectively. The results obtained for the seismic loads acting in the fore-aft direction show that fragility increases with increasing operational wind speed up to the rated condition and decrease for further increase of wind speed up to the cut-out condition.
The results obtained for the seismic loads acting in fore-aft direction show that the multi-hazard fragility is higher for the parked condition, whose fragility curve is very close to that corresponding to the operational rated speed condition. This is due to the lowest value of the aerodynamic damping being related to the fore-aft parked condition. In these cases, the probability of failure is equal to 50% for Peak Ground Acceleration (PGA) values of 0.71 g and 0.72 g. Moreover, these conditions show the same PGA value of 0.78 g for a probability of failure of 76%.
On the other hand, the fragility curves carried out for the seismic loads acting in the side-to-side direction for cut-in and rated conditions are very close to one another. In particular, these conditions show the same peak ground acceleration value of 0.73 g for a probability of failure of 41%. While a minor fragility is observed for the operational cut-out condition due to the highest value of the aerodynamic damping. Finally, for the parked and cut-in operational conditions the fragility curves in the side-to-side direction are coincident since for both cases the same value of aerodynamic damping is used.
11. Conclusions
The preliminary results of a probabilistic framework for the design and assessment of land-based horizontal axis wind turbines (HAWTs) subjected to combined wind and seismic actions are presented. The aerodynamic and seismic effects on the structural model of the HAWT were assessed by decoupling the aerodynamic behavior of the rotor from the dynamic response of the support structure. This was first achieved by evaluating the aerodynamic response of a rotor with rigid blades when subjected to wind loads through the nonlinear Lifting Line Free Vortex Wake algorithm implemented in Q-Blade software. Then, the structural response of the HAWT was assessed by applying the wind thrust of the rotor and the seismic excitation to the tower FE model, thereby neglecting aeroelastic feedback. The aeroelastic interaction was taken into account through the addition of aerodynamic damping to the model; the latter was evaluated using the closed-form solution proposed by Valamanesh and Myers (2014). The probabilistic assessment of the peak response of the tower structure, against the combined effect of wind and seismic actions, was evaluated by calculating the maximum value of the bending moment at the tower base for each combination of wind load (fifteen wind time histories for each operational/parked condition) and seismic load (fifteen artificial accelerograms) acting in both fore-aft and side-to-side directions. In particular, the empirical and the estimated CDFs of the tower base maximum bending moment are evaluated for the combination of the wind and seismic action.
The fragility curves for the tower buckling limit state were finally obtained from Monte Carlo simulations of the tower subjected to different wind and seismic load scenarios, and using the tower base bending moment as a deterministic limit state parameter representative of the structural capacity. For this purpose, the failure condition of the tower structure was estimated according to the stress design procedure proposed by EC3 for buckling limit state assessment. Consequently, the vulnerability assessment of HAWTs to wind and seismic actions is carried out in terms of probability of failure of the supporting tower structure as a function of the PGA for both parked and operational conditions. The results highlight a probability of failure of over 50% for values of PGA greater than 0.7 g when the rotor is in parked or operational rated conditions, and for seismic loads acting in the fore-aft direction. The fragility is slightly lower for parked, cut-in and rated conditions combined with seismic loads acting in the side-to-side direction.
Author Contributions
Alberto Maria Avossa, Cristoforo Demartino and Francesco Ricciardelli proposed the main idea of the paper; Alberto Maria Avossa and Cristoforo Demartino have constructed the numerical model, made the calculation and analyzed the results; All authors contributed to the writing and revising of the article; All authors approved the paper final version.
Conflicts of Interest
The authors declare no conflict of interest.
References and Notes
- Aly, A.M.; Abburu, S. On the design of high-rise buildings for multihazard: Fundamental differences between wind and earthquake demand. Shock. Vib. 2015. [CrossRef]
- Woessner, J.; Danciu, L.; Giardini, D.; Crowley, H.; Cotton, F.; Grünthal, G.; Valensise, G.; Arvidsson, R.; Basili, R.; Demircioglu, M.B.; et al. The 2013 European Seismic Hazard Model: key components and results. Bull. Earthquake Eng. 2015, 13, 3553–3596. [Google Scholar] [CrossRef] [Green Version]
- Troen, I.; Lundtang Petersen, E. European Wind Atlas; Risø National Laboratory: Roskilde, Denmark, 1991. [Google Scholar]
- Bazeos, N.; Hatzigeorgiou, G.D.; Hondros, I.D.; Karamaneas, H.; Karabalis, D.L.; Beskos, D.E. Static, seismic and stability analyses of a prototype wind turbine steel tower. Eng. Struct. 2002, 24, 1015–1025. [Google Scholar] [CrossRef]
- Lavassas, I.; Nikolaidis, G.; Zervas, P.; Efthimiou, E.; Doudoumis, I.; Baniotopoulos, C. Analysis and design of the prototype of a steel 1-MW wind turbine tower. Eng. Struct. 2003, 25, 1097–1106. [Google Scholar] [CrossRef]
- Witcher, D. Seismic analysis of wind turbines in the time domain. Wind Energy 2005, 8, 81–91. [Google Scholar] [CrossRef]
- Prowell, I.; Veers, P. Assessment of Wind Turbine Seismic Risk: Existing Literature and Simple Study of Tower Moment Demand; Sandia National Laboratories: Albuquerque, NM, USA, 2009.
- Prowell, I.; Veletzos, M.; Elgamal, A.; Restrepo, J. Experimental and numerical seismic response of a 65 kW wind turbine. J. Earthq. Eng. 2009, 13, 1172–1190. [Google Scholar] [CrossRef]
- Prowell, I. An Experimental and Numerical Study of Wind Turbine Seismic Behavior; University of California: San Diego, CA, USA, 2011. [Google Scholar]
- Prowell, I.; Elgamal, A.; Uang, C.; Luco, J.E.; Romanowitz, H.; Duggan, E. Shake table testing and numerical simulation of a utility-scale wind turbine including operational effects. Wind Energy 2014, 17, 997–1016. [Google Scholar] [CrossRef]
- Nuta, E. Seismic Analysis of Steel Wind Turbine Towers in the Canadian Environment. Master’s Thesis, University of Toronto, Toronto, ON, Canada, 2010. [Google Scholar]
- Asareh, M.A.; Shonberg, W.; Volz, J. Effects of seismic and aerodynamic load interaction on structural dynamic response of multi-megawatt utility scale horizontal axis wind turbine. Renew. Energy 2016, 86, 49–58. [Google Scholar] [CrossRef]
- Diaz, O.; Suarez, L.E. Seismic analysis of wind turbines. Earthq. Spectr. 2014, 30, 743–765. [Google Scholar] [CrossRef]
- Asareh, M.A. Dynamic behaviour of operational wind turbines considering aerodynamic and seismic load interation. Ph.D. Dissertation, Missouri University of Science and Technology, Rolla, MO, USA, 2015. [Google Scholar]
- Santangelo, F.; Failla, G.; Santini, A.; Arena, F. Time-domain uncoupled analyses for seismic assessment of land-based wind turbines. Eng. Struct. 2016, 123, 275–299. [Google Scholar] [CrossRef]
- International Electrotechnical Commission. Wind Turbines e Part 1: Design Requirements; IEC 61400e1 Ed, 3; International Electrotechnical Commission: Geneva, Switzerland, 2005. [Google Scholar]
- American Society of Civil Engineering. Recommended Practice for Compliance of Large Land-Based Wind Turbine Support Structures; ASCE/AWEA RP2011; American Society of Civil Engineering: Reston, VA, USA, 2011. [Google Scholar]
- Valamanesh, V.; Myers, A.T. Aerodynamic Damping and Seismic Response of Horizontal Axis Wind Turbine Towers. J. Struct. Eng.-ASCE 2014, 140. [Google Scholar] [CrossRef]
- Jonkman, J.; Butterfield, S.; Musial, W.; Scott, G. Definition of a 5-MW Reference Wind Turbine for Offshore System Development. Available online: https://www.nrel.gov/docs/fy09osti/38060.pdf (accessed on 14 August 2017).
- Veers, P.S. Three Dimensional Wind Simulation; Sandia National Laboratories: Albuquerque, NM, USA, 1988.
- Marten, D.; Wendler, J.; Pechlivanoglou, G.; Nayeri, C.N.; Paschereit, C.O. QBlade: An Open Source Tool for Design and Simulation of Horizontal and Vertical Axis Wind Turbines. Int. J. Emerg. Technol. Adv. Eng. 2013, 3, 264–269. [Google Scholar]
- Seismosoft. Earthquake Engineering Software Solution; Seismosoft: Chalkida, Greece, 2011. [Google Scholar]
- CEN. Design of Structures for Earthquake Resistance, Part 1: General Rules, Seismic Actions and Rules for Buildings; EN 1998–1, Eurocode 8; European Committee for Standardization: Brussels, Belgium, 2004. [Google Scholar]
- Quarton, D.C. The Evolution of Wind Turbine Design Analysis—A Twenty-Year Progress Review. Wind Energy 1988, 1, 5–24. [Google Scholar] [CrossRef]
- Vorpahl, F.; Schwarze, H.; Fischer, T.; Seidel, M.; Jonkman, J. Offshore Wind Turbine Environment, Loads, Simulation, and Design. WIREs Energy Environ. 2013, 2, 548–570. [Google Scholar] [CrossRef]
- Salzmann, D.J.C.; Van der Tempel, J. Aerodynamic Damping in the Design of Support Structures for Offshore Wind Turbines. In Proceedings of the Copenhagen Offshore Conference, Copenhagen, Denmark, 10–12 March 2015. [Google Scholar]
- Bossanyi, E. Bladed for Windows User Manual; Garrad Hassan and Partners: Bristol, UK, 2000. [Google Scholar]
- Van Garrel, A. Development of a Wind Turbine Aerodynamics Simulation Module; Tec. Report; Energy Research Centre of the Netherlands: Petten, The Netherlands, 2003. [Google Scholar]
- CEN. Design of Steel Structures—General Strength and Stability of Steel Structures; EN 1993–1-6, Eurocode 3; European Committee for Standardization: Brussels, Belgium, 2007. [Google Scholar]
- Myers, A.; Gupta, A.; Ramirez, C.; Chioccarelli, E. Evaluation of the Seismic Vulnerability of Tubular Wind Turbine Towers. In Proceedings of the 15th World Conference on Earthquake Engineering, Lisbon, Portugal, 24–28 September 2012. [Google Scholar]
- Kim, D.H.; Lee, S.G.; Lee, I.K. Seismic fragility analysis of 5 MW offshore wind turbine. Renew. Energy 2014, 65, 250–256. [Google Scholar] [CrossRef]
- Quilligan, A.; O’Connor, A.; Pakrashi, V. Fragility analysis of steel and concrete wind turbine towers. Eng. Struct. 2012, 36, 270–282. [Google Scholar] [CrossRef]
- Mardfekri, M.; Gardoni, P. Multi-hazard reliability assessment of offshore wind turbines. Wind Energy 2015, 18, 1433–1450. [Google Scholar] [CrossRef]
- Miranda, E.; Aslani, H. Probabilistic Response Assessment for Building-Specific Loss Estimation; Report PEER, 3; Pacific Earthquake Engineering Research Center: Berkeley, CA, USA, 2003.
Figure 1.
(a) European Seismic Hazard Map showing the 10% exceedance probability in 50 years for Peak Ground Acceleration [2]; (b) European Wind Atlas [3].

Figure 2.
Values of rotor speed Ω, blade pitch, and tip speed ratio (TSR) versus wind speed for operational conditions between cut-in (3 m/s) and cut-out (25 m/s) for the 5-MW land-based turbine.
Figure 2.
Values of rotor speed Ω, blade pitch, and tip speed ratio (TSR) versus wind speed for operational conditions between cut-in (3 m/s) and cut-out (25 m/s) for the 5-MW land-based turbine.
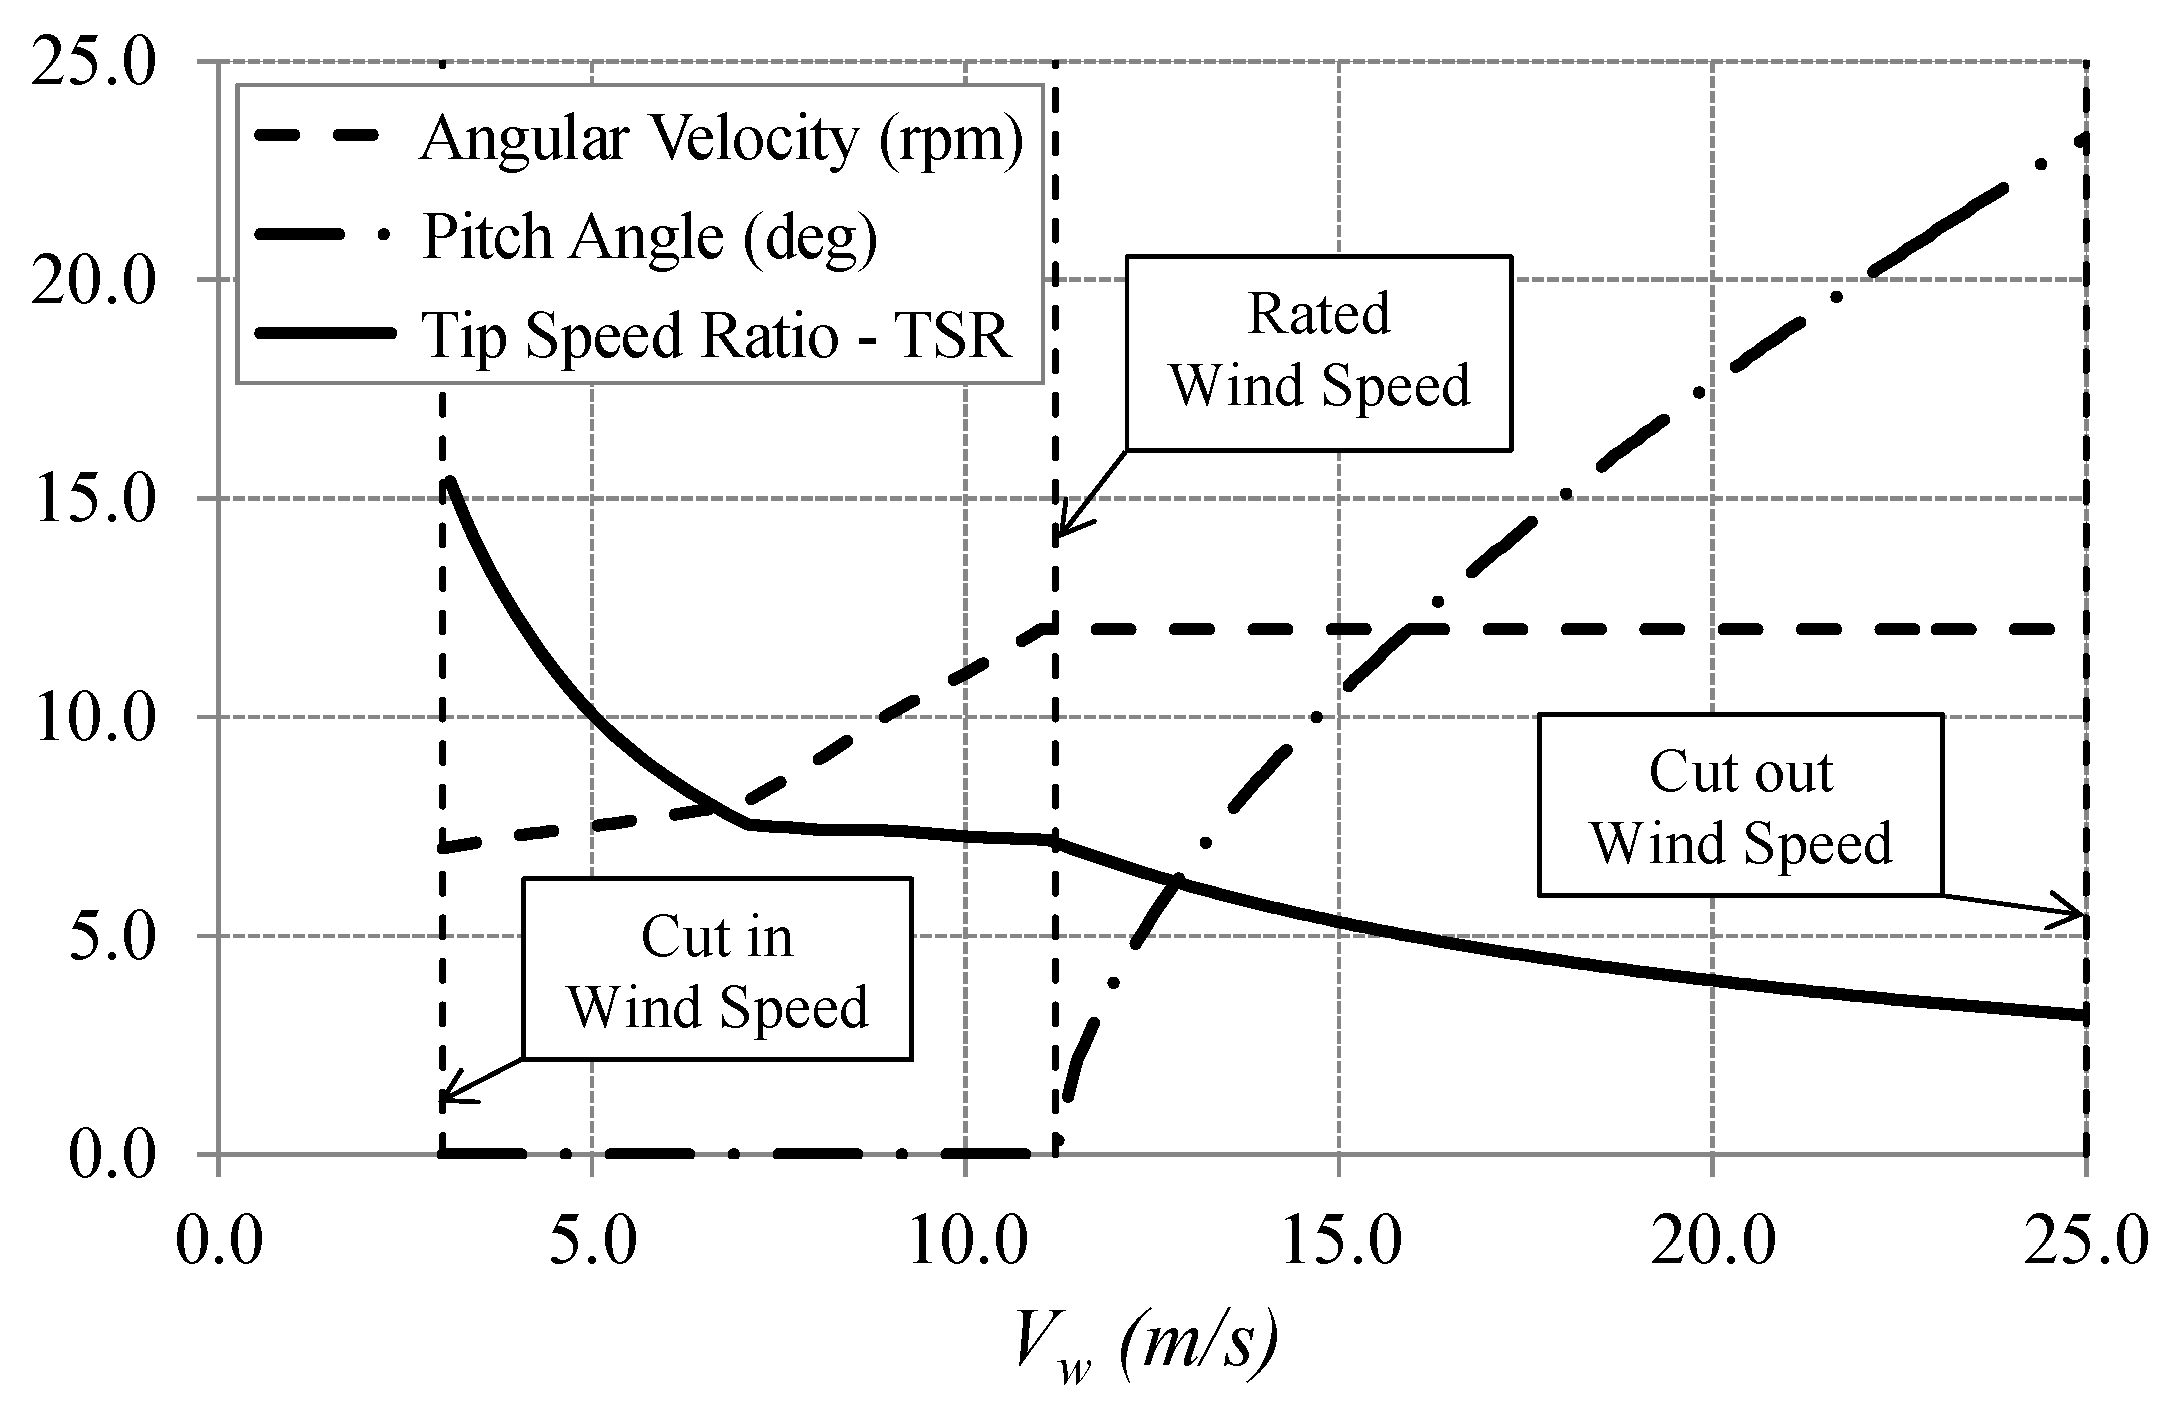
Figure 3.
(a) Vertical mean wind speed profiles; (b) Example of the instantaneous turbulent wind field for rated wind speed condition and centered on hub axis.
Figure 3.
(a) Vertical mean wind speed profiles; (b) Example of the instantaneous turbulent wind field for rated wind speed condition and centered on hub axis.
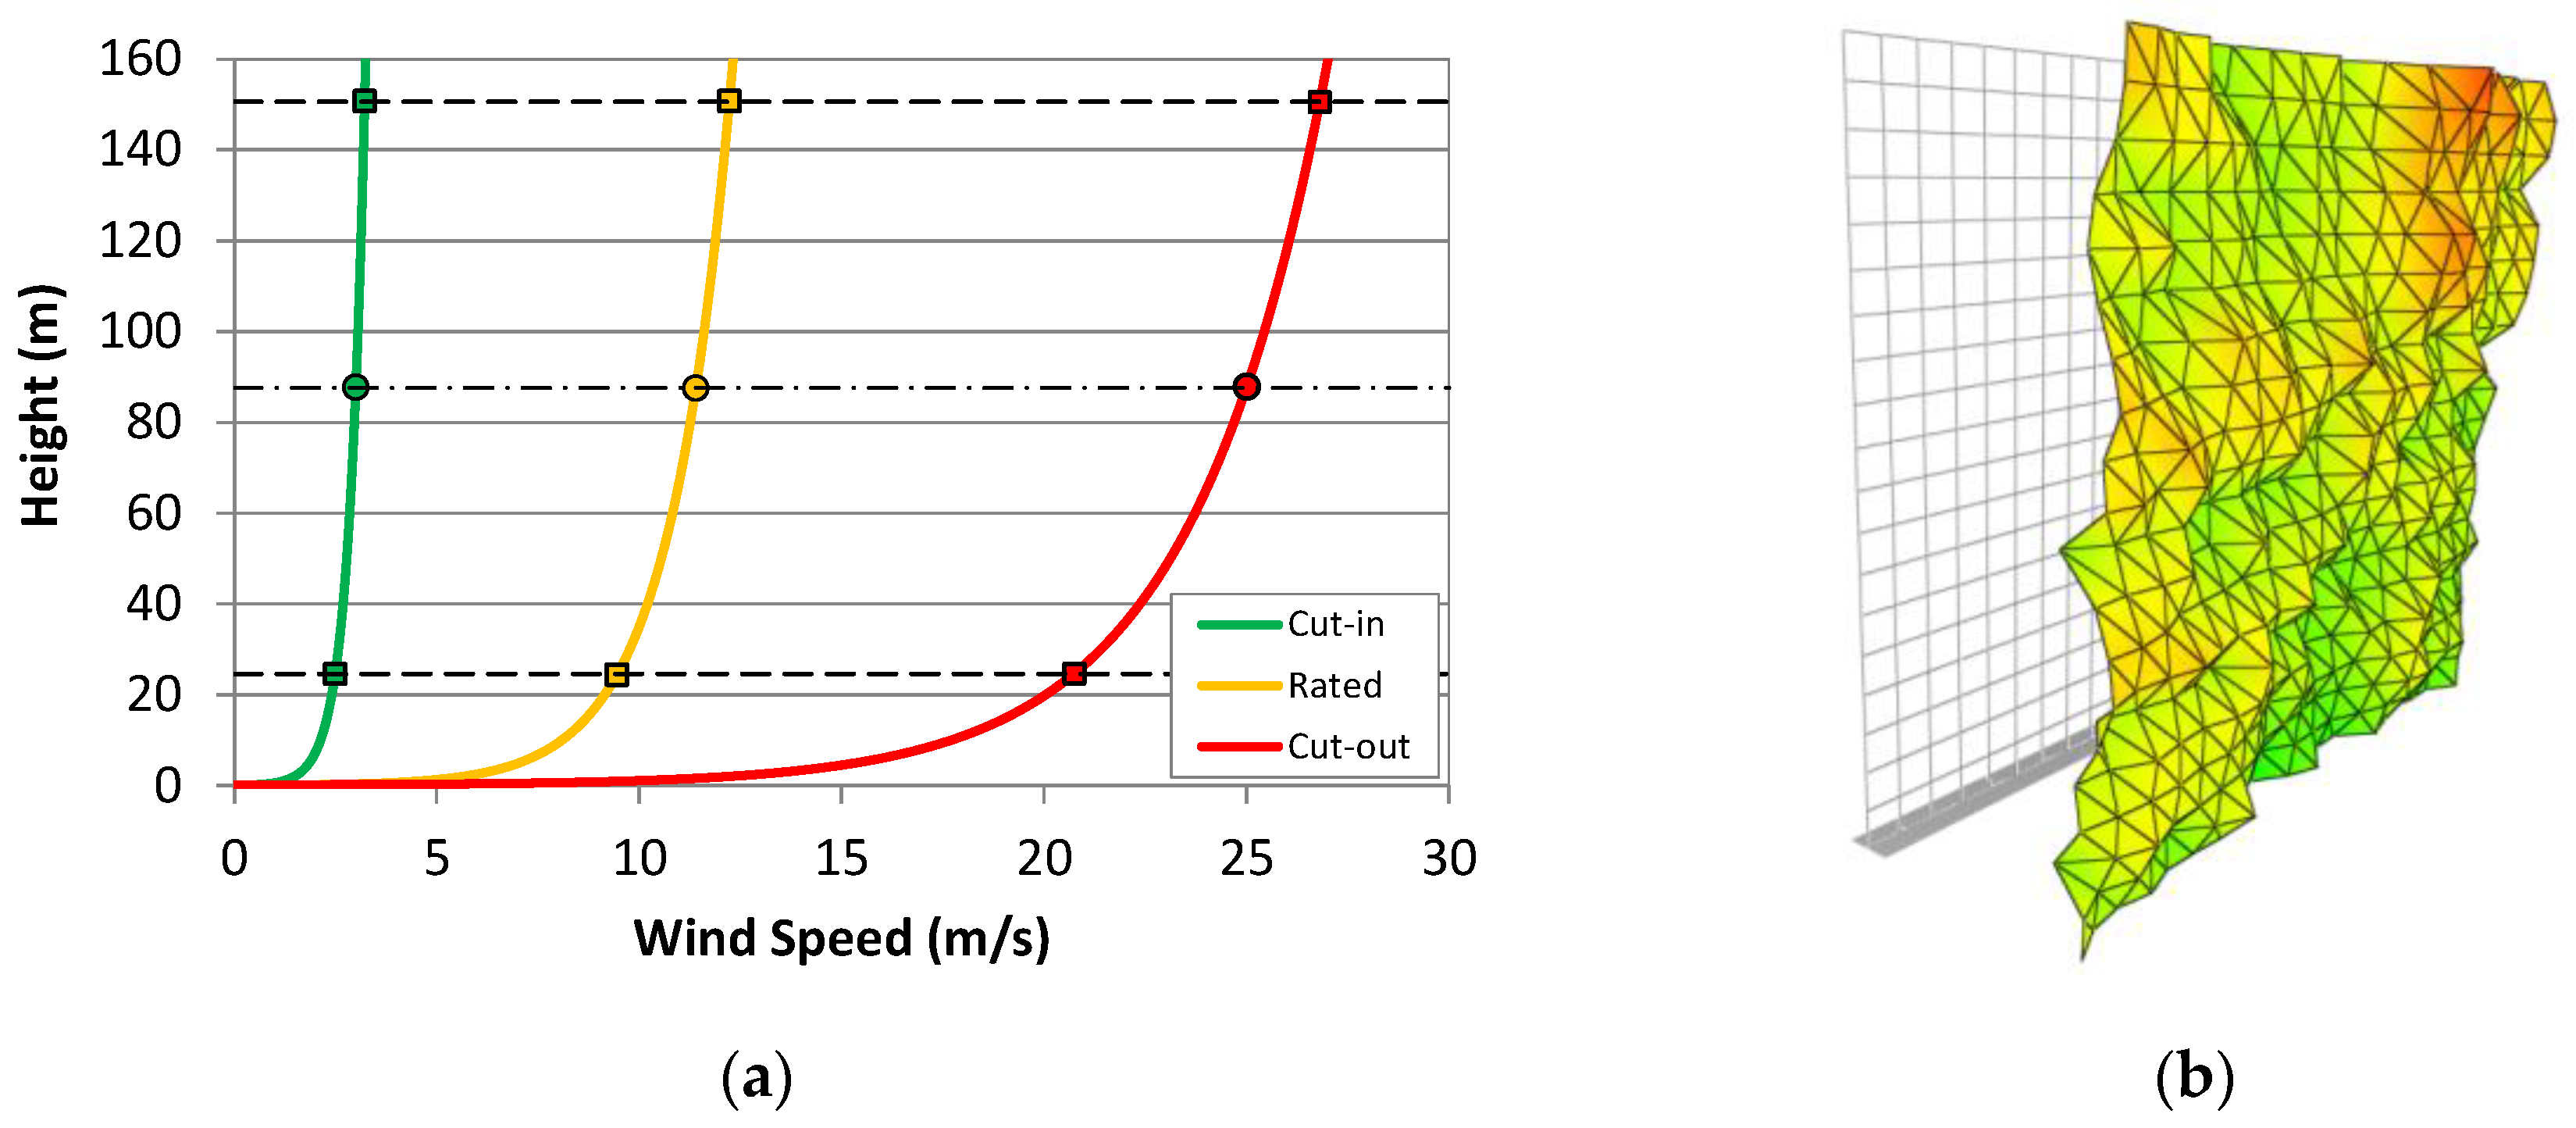
Figure 4.
(a) Acceleration response spectra diagram and comparison with EC8 elastic target spectrum; (b) Sample of an artificial earthquake input signal.
Figure 4.
(a) Acceleration response spectra diagram and comparison with EC8 elastic target spectrum; (b) Sample of an artificial earthquake input signal.

Figure 5.
(a) Aeroelastic model and its decoupling into (b) aerodynamic model, structural model, and aerodynamic damping.
Figure 5.
(a) Aeroelastic model and its decoupling into (b) aerodynamic model, structural model, and aerodynamic damping.

Figure 6.
Aerodynamic model and structural model with aerodynamic damping of land-based HAWT.

Figure 7.
Aerodynamic damping in the fore-aft and side-to-side directions during parked and operational conditions for 5-MW land-based HAWT.
Figure 7.
Aerodynamic damping in the fore-aft and side-to-side directions during parked and operational conditions for 5-MW land-based HAWT.

Figure 8.
Samples of thrust force in fore-aft direction for operational and parked conditions.
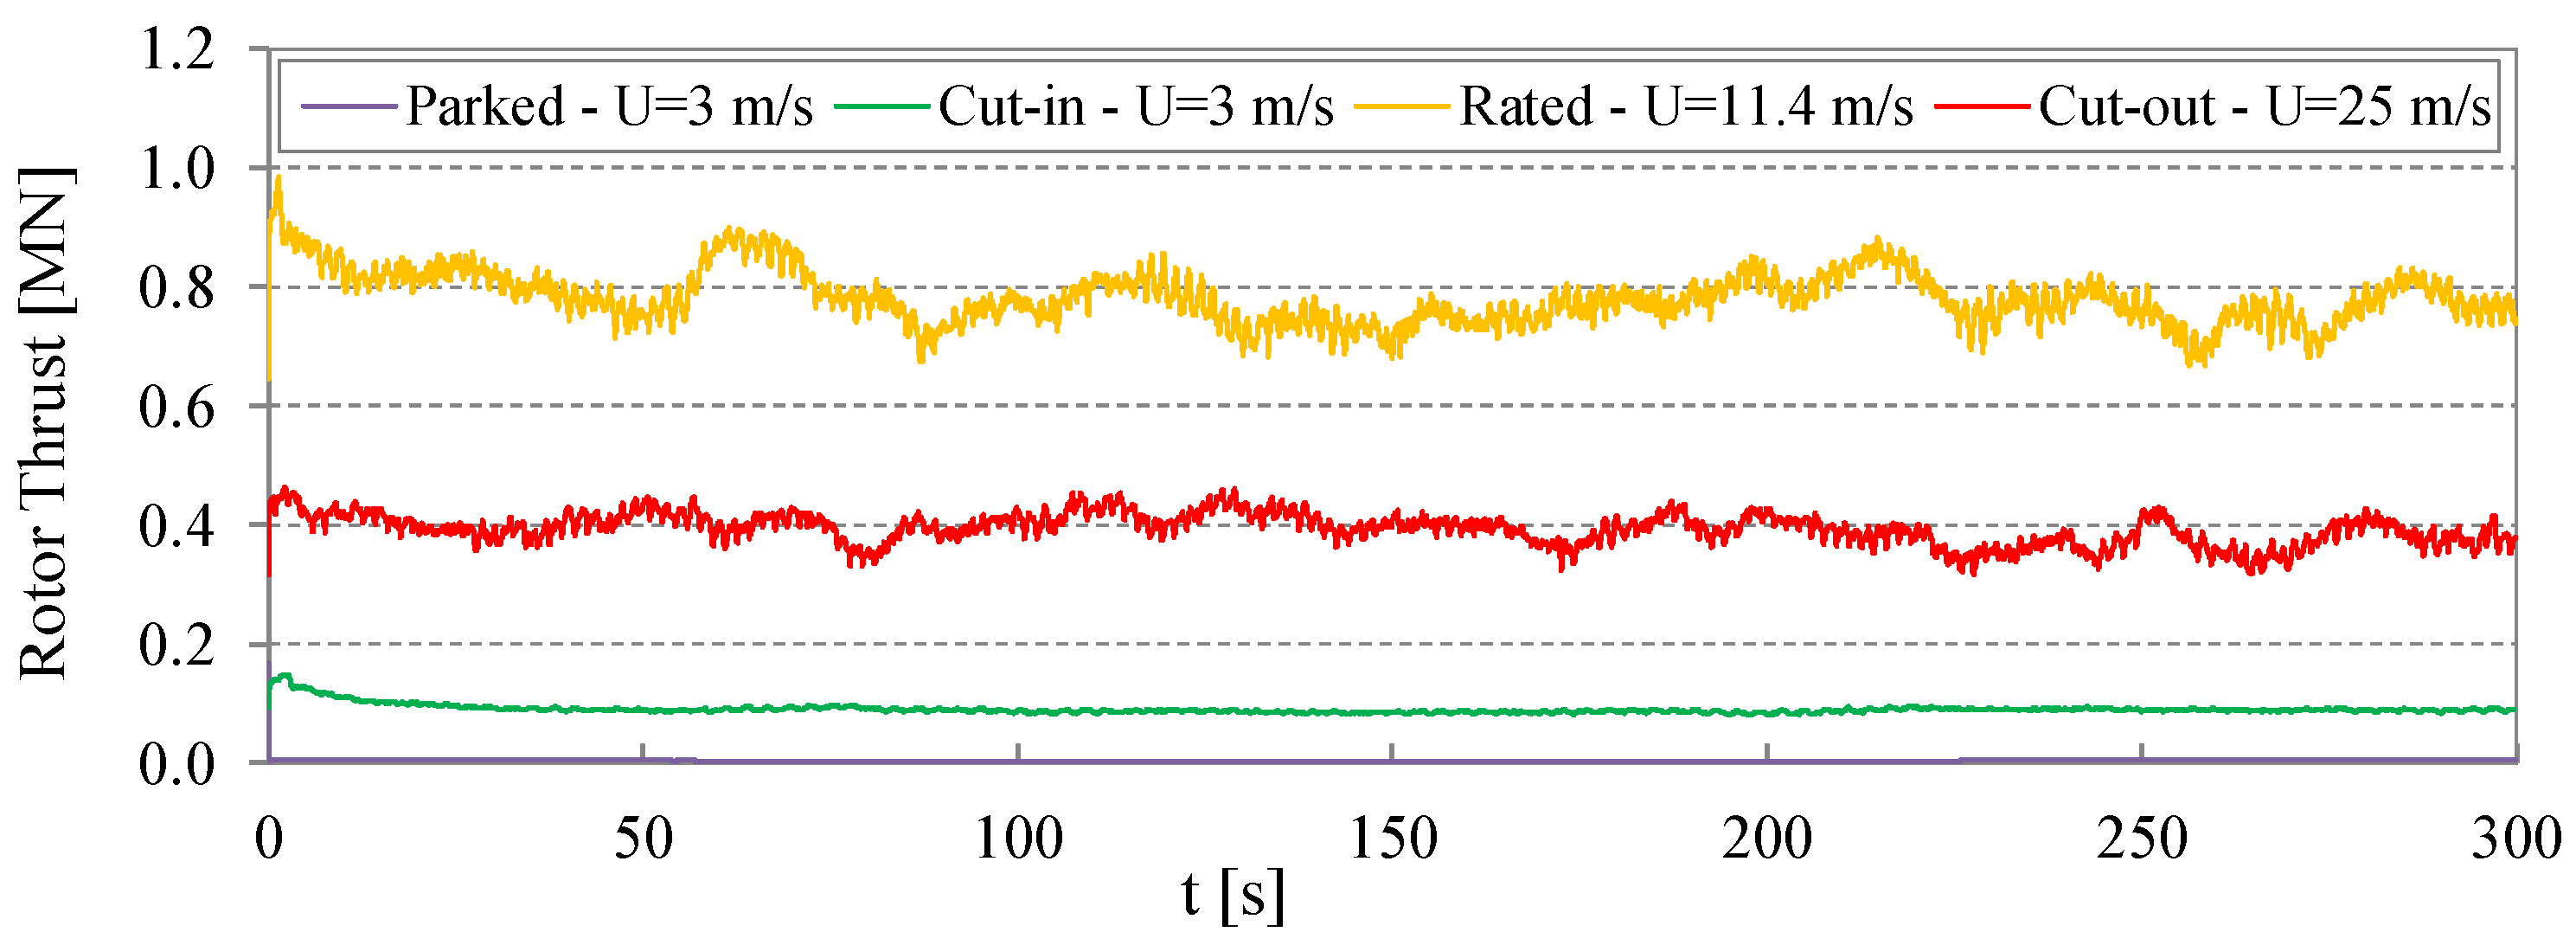
Figure 9.
Bending moment variations at the tower base section: thrust force in operational conditions due to wind speed of 11.4 m/s with and without seismic load (scaled to a PGA of 0.4 g).
Figure 9.
Bending moment variations at the tower base section: thrust force in operational conditions due to wind speed of 11.4 m/s with and without seismic load (scaled to a PGA of 0.4 g).

Figure 10.
Cumulative density function estimation of the HAWT base section maximum bending moment: (a) for wind parked and operational conditions without earthquake; for earthquake condition scaled to 0.5g without wind action; (b) fore-aft direction; (c) side-to-side direction; (continuous line—empirical; dashed line—Lognormal).

Figure 11.
Cumulative density function estimation of the HAWT base section maximum bending moment for parked and operational conditions with earthquake scaled to 0.5g: (a) fore-aft direction; (b) side-to-side direction; (continuous line—empirical; dashed line—Lognormal).
Figure 11.
Cumulative density function estimation of the HAWT base section maximum bending moment for parked and operational conditions with earthquake scaled to 0.5g: (a) fore-aft direction; (b) side-to-side direction; (continuous line—empirical; dashed line—Lognormal).
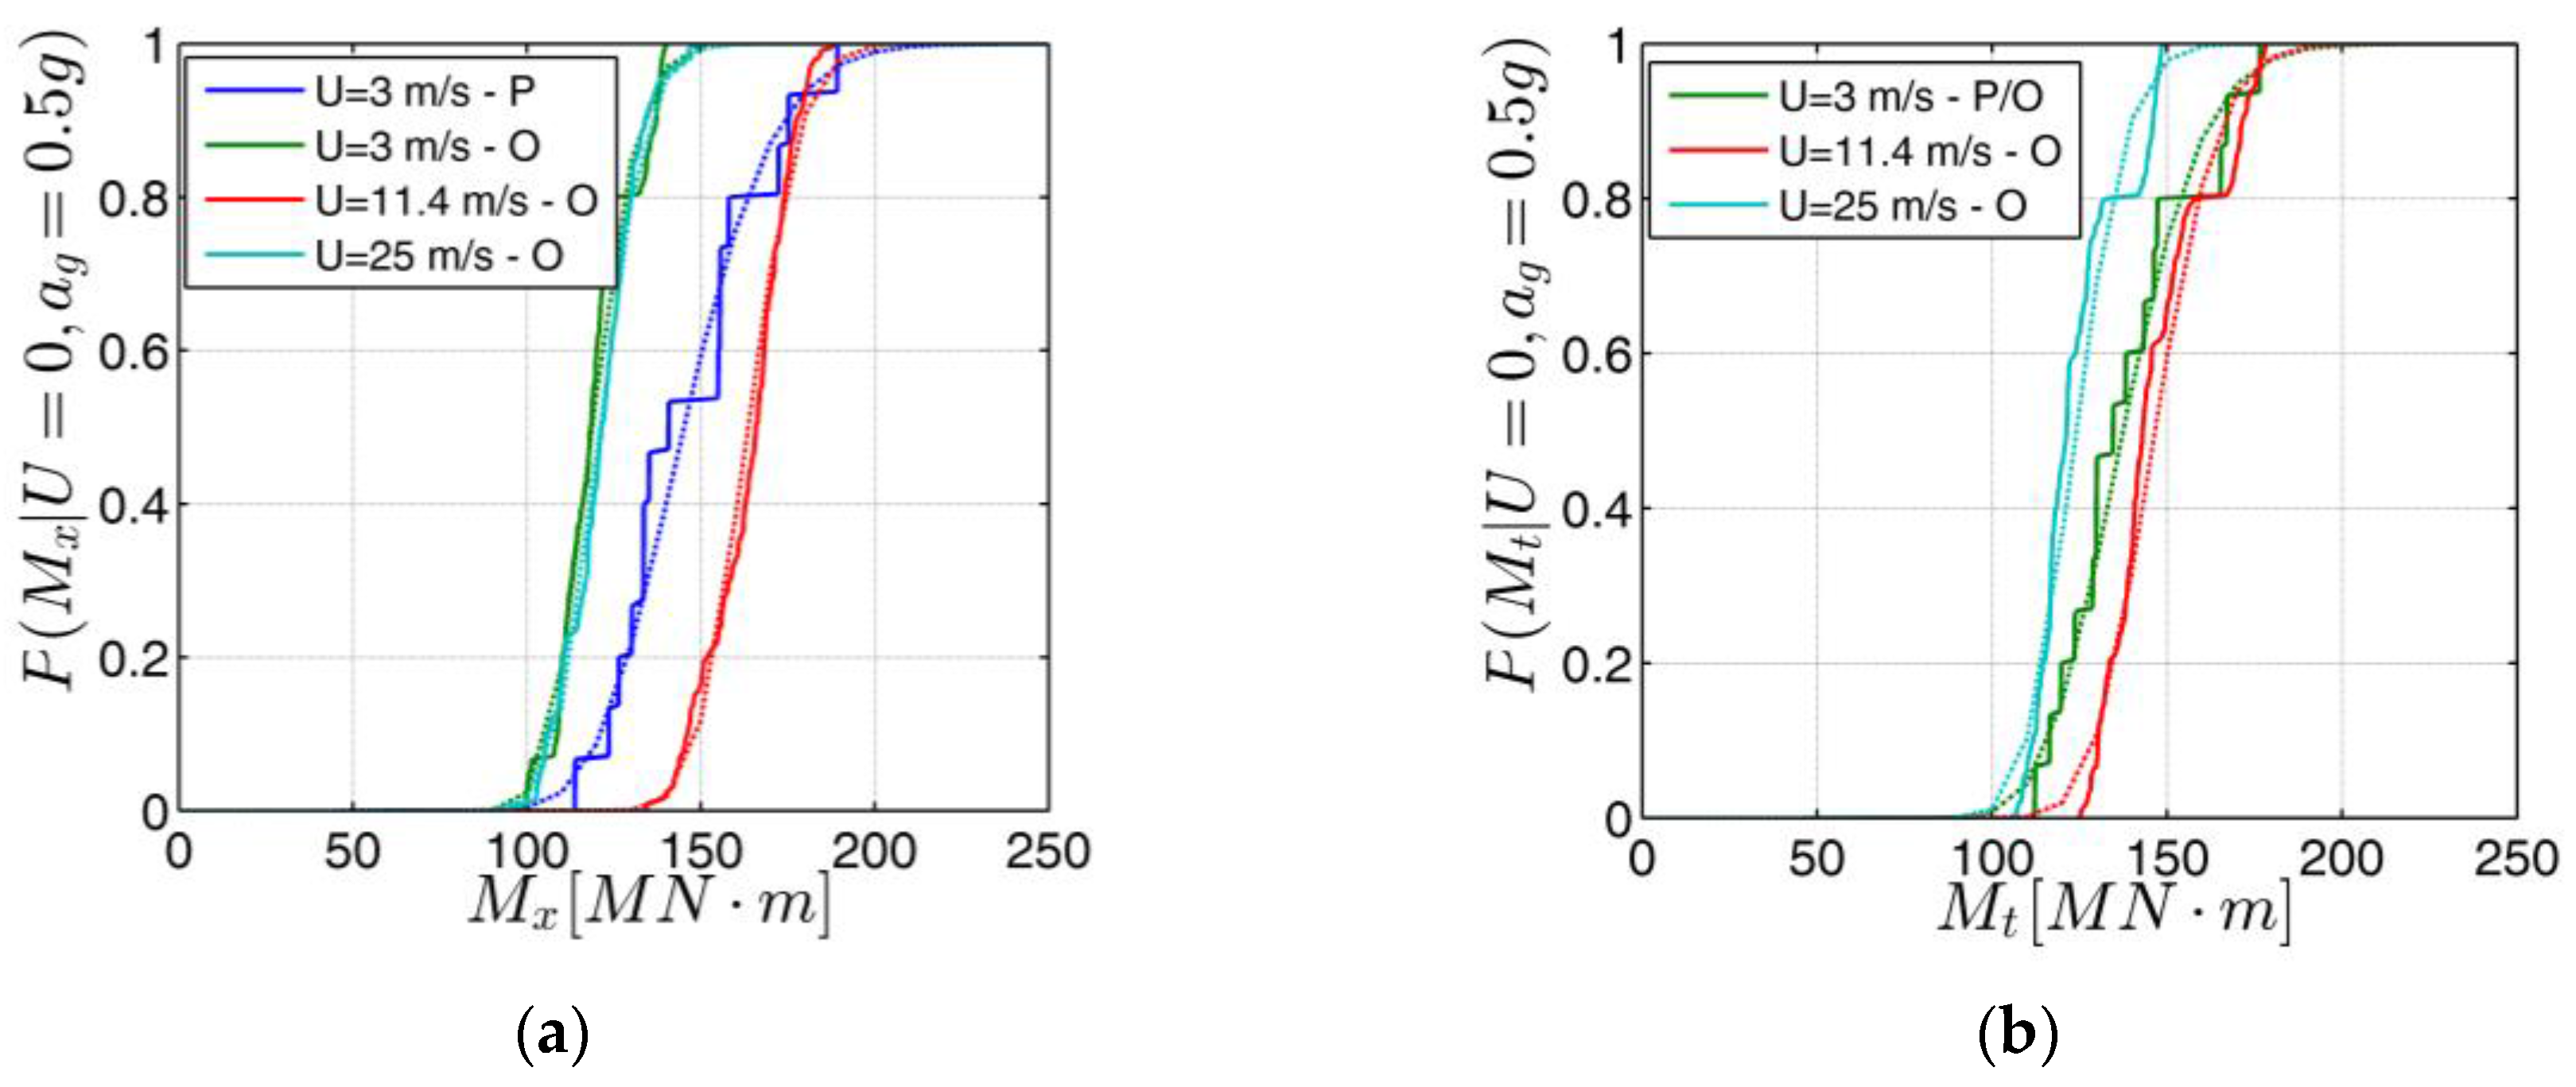
Figure 12.
Fragility curves for parked and operational conditions with earthquake: fore-aft direction–continuous line; side-to-side direction – dashed line.
Figure 12.
Fragility curves for parked and operational conditions with earthquake: fore-aft direction–continuous line; side-to-side direction – dashed line.

Table 1.
Specifications and blade sections of 5 MW HAWT.
| Characteristic | Value | Section | r (m) | Airfoil Type | Twist Angle (°) | Chord (m) |
|---|---|---|---|---|---|---|
| Power Output | 5 MW | 1 | 2.86 | Cylnder 1 | 13.080 | 3.542 |
| Rotor diameter | 126 m | 2 | 5.60 | Cylnder 1 | 13.080 | 3.854 |
| Hub height | 87.60 m | 3 | 8.33 | Cylnder 2 | 13.080 | 4.167 |
| Cut in wind speed | 3 m/s | 4 | 11.75 | DU40_A17 | 13.080 | 4.557 |
| Rated wind speed | 11.4 m/s | 5 | 15.85 | DU35_A17 | 11.480 | 4.652 |
| Cut out wind speed | 25 m/s | 6 | 19.95 | DU35_A17 | 10.162 | 4.458 |
| Rated Tip Speed | 80 m/s | 7 | 24.05 | DU30_A17 | 9.011 | 4.249 |
| Cut-in rotor speed | 6.9 rpm | 8 | 28.15 | DU25_A17 | 7.795 | 4.007 |
| Rated rotor speed | 12.1 rpm | 9 | 32.25 | DU25_A17 | 6.544 | 3.748 |
| Overhang—Shaft Tilt—Precone | 5 m—5°—2.5° | 10 | 36.35 | DU21_A17 | 5.361 | 3.502 |
| Number of blades | 3 | 11 | 40.45 | DU21_A17 | 4.188 | 3.256 |
| Nacelle Mass | 240,000 kg | 12 | 44.55 | NACA64_A17 | 3.125 | 3.010 |
| Hub Mass | 56780 kg | 13 | 48.65 | NACA64_A17 | 2.319 | 2.764 |
| Rotor Mass | 53220 kg | 14 | 52.75 | NACA64_A17 | 1.526 | 2.518 |
| Tower Mass | 347460 kg | 15 | 56.16 | NACA64_A17 | 0.863 | 2.313 |
| Tower top diameter—wall thickness | 3.87 m—0.019 m | 16 | 58.90 | NACA64_A17 | 0.370 | 2.086 |
| Tower base diameter—wall thickness | 6.00 m—0.027 m | 17 | 61.63 | NACA64_A17 | 0.106 | 1.419 |
Table 2.
Estimated parameters of the cumulative function Lognormal distribution.
| Working Condition | Wind Action | Earthquake | Earthquake | Wind + Earthquake | Wind + Earthquake | |||||
|---|---|---|---|---|---|---|---|---|---|---|
| Fore-Aft | Fore-Aft | Side-to-Side | Fore-Aft | Side-to-Side | ||||||
| μ | σ | μ | σ | μ | σ | μ | σ | μ | σ | |
| Parked | 0.591 | 0.344 | 4.975 | 0.145 | 4.921 | 0.135 | 4.978 | 0.140 | 4.923 | 0.131 |
| Operational cut-in | 3.093 | 0.046 | 4.714 | 0.095 | 4.921 | 0.135 | 4.778 | 0.087 | 4.923 | 0.131 |
| Operational rated | 4.904 | 0.040 | 4.567 | 0.119 | 4.866 | 0.127 | 5.097 | 0.073 | 4.987 | 0.097 |
| Operational cut-out | 3.950 | 0.054 | 4.465 | 0.126 | 4.782 | 0.102 | 4.796 | 0.087 | 4.820 | 0.094 |
Table 3.
Estimated parameters of the Lognormal distribution for fragility curves.
| Working Condition | Wind + Earthquake | Wind + Earthquake | ||
|---|---|---|---|---|
| Fore-Aft | Side-to-Side | |||
| μ | σ | μ | σ | |
| Parked | −0.343 | 0.140 | −0.288 | 0.131 |
| Operational cut-in | −0.117 | 0.093 | −0.288 | 0.131 |
| Operational rated | −0.328 | 0.120 | −0.289 | 0.123 |
| Operational cut-out | −0.008 | 0.121 | −0.161 | 0.100 |
© 2017 by the authors. Licensee MDPI, Basel, Switzerland. This article is an open access article distributed under the terms and conditions of the Creative Commons Attribution (CC BY) license (http://creativecommons.org/licenses/by/4.0/).
Share and Cite
MDPI and ACS Style
Avossa, A.M.; Demartino, C.; Contestabile, P.; Ricciardelli, F.; Vicinanza, D. Some Results on the Vulnerability Assessment of HAWTs Subjected to Wind and Seismic Actions. Sustainability 2017, 9, 1525. https://doi.org/10.3390/su9091525
AMA Style
Avossa AM, Demartino C, Contestabile P, Ricciardelli F, Vicinanza D. Some Results on the Vulnerability Assessment of HAWTs Subjected to Wind and Seismic Actions. Sustainability. 2017; 9(9):1525. https://doi.org/10.3390/su9091525
Chicago/Turabian StyleAvossa, Alberto Maria, Cristoforo Demartino, Pasquale Contestabile, Francesco Ricciardelli, and Diego Vicinanza. 2017. "Some Results on the Vulnerability Assessment of HAWTs Subjected to Wind and Seismic Actions" Sustainability 9, no. 9: 1525. https://doi.org/10.3390/su9091525
Note that from the first issue of 2016, this journal uses article numbers instead of page numbers. See further details here.