Types, Indications and Impact Evaluation of Sand and Dust Storms Trajectories in the Arabian Gulf


1
Environment and Life Sciences Research Center, Kuwait Institute for Scientific Research (KISR), P.O. Box: 24885, Safat, Kuwait City 13109, Kuwait
2
Institute of Earth Sciences “Jaume Almera”, Consejo Superior de Investigaciones Cientificas (CSIC), Barcelona 08028, Spain
*
Author to whom correspondence should be addressed.
Sustainability 2017, 9(9), 1526; https://doi.org/10.3390/su9091526
Submission received: 10 August 2017
/
Revised: 21 August 2017
/
Accepted: 24 August 2017
/
Published: 27 August 2017
(This article belongs to the Special Issue Dust Events in the Environment)
Abstract
:Dust is a common weather phenomenon in the Arabian Gulf, which has severely affected economy and health. Sand and dust storms (SDS) trajectories in the Arabian Gulf were temporally and spatially monitored from March 2000 to March 2017. Eight major SDS trajectories were detected from satellite images. The dust storms trajectories were categorized according to shape and size into three main types with 12 subtypes in the region. The annual transported dust amount into the Arabian Gulf was estimated by 89.1 million metric tons, which is about 10,330 metric tons per cubic kilometer of water volume. In comparison to other seas and oceans, the amount of dust deposited into the Arabian Gulf water body volume is the highest. Dust deposited in the coastal regions within the Arabian Gulf are originated from Mesopotamian Flood Plain (MFP), Ahwaz (HZ), Ahwar (HR) and Baluchistan Desert (BSH) and characterized by physical parameters and composition. Such physical characterization of the trajectories of SDS, and of the properties of particles transported in the Arabian Gulf can be helpful to assess and mitigate the environmental impact of future similar events.
1. Introduction
Sand and dust storms (SDS) are considered to be most common phenomena in the Arabian Gulf regions [1]. Dust is a part of, and a key player in, the earth’s ecological systems [2,3,4]. Dust events can be meteorologically categorized into four types depending on visibility, namely: suspended dust, dust storms and haze [5]. The Arabian Gulf is surrounded by desert ecosystem characterized by active aeolian conditions [6,7]. Land degradation and extended drought periods act as a major activator of SDS in deserts [8]. There are substantial amounts of dust grains that may be driven thousands of kilometers from their origin [9], and it has been valued that aeolian dust derived from soil erosion gives annually around 500 million tons of particulates into the atmosphere [10]. Up to two billion tons of dust blows into the atmosphere in a single year within major SDS trajectories [11]. Frequent occurrences of SDS in the Arabian Gulf cause an acute environmental problem that can affect the health, safety and economic well-being of society [12]. The SDS passing over the Arabian Gulf is considered to be the major sources of sediments [13]. There are major SDS trajectory areas in northern Arabian Gulf were identified, namely; Mesopotamian Flood Plain (MFP), Western Desert-Iraq (WD), Nafud Desert (NFD), Ahwar (HR) and Ahwaz (HZ) [14]. Another interesting aspect is the possible effects of draining the Ahwar marshland which acts later as a new source area for dust [15]. Empty Quarter (EQ), Nafud [16] and Baluchistan (BSH) [17] deserts act as major sources of SDS within southern Arabian Gulf region. Quartz-poor fine sediment is a characteristic of soil sediments in MFP, HR, HZ, and BSH, while quartz-rich coarse sediment found in WD, NFD and EQ [18,19].
The reduction of the adverse impact of SDS in the Arabian Gulf environment requires a full understanding of dust phenomena both physically and mineralogically, toward improvement in future effective control measures. Thus, it is essential for global and regional aspects to put appropriate classification for SDS trajectories and their indications.
Therefore, the aim of this study is to establish a suitable classification for SDS trajectories focusing on its indications in the Arabian Gulf by passing through chemical and physical characteristics of some deposited dust samples on areas within a pathway of these SDS trajectories. The physical characterization of SDS trajectories, and of their particle properties, as provided here with an integrated approach, can be helpful to mitigating the impact of future similar events in the environment (agriculture, infrastructures and air quality).
2. Materials and Methods
Four methods were used in this study to characterize SDS in the Arabian Gulf:
- Remote sensing methodology as it is effective tool for monitoring dust storms and aerosol layers trajectories. This is valid especially for regional scales. Brightness measurements from NOAA/AVHRR- LAC (Local Area Coverage) and GAC (Global Area Coverage) archives, Terra/Aqua MODIS (The moderate-resolution imaging spectroradiometer) and TOMS (The Total Ozone Mapping Spectrometer) aerosol images of dust phenomena are good operational middle resolution indicator over the cloudless Arabia Gulf region. Low resolution meteorological images were used from METEOSAT are supporting the real time synoptic view of major dust storms over the Region. Old SeaWifs image archive (LAC and GAC) is additional support for delineation of dust trajectories in early 2000th. Analysis of true-color composition of three bands MODIS 1(645 nm), 4(555 nm) and 3(469 nm) gave excellent opportunity for relatively high resolution of intensive dust jets over the Arabian Gulf and the Gulf of Oman. The collected images from these satellite data related to SDS days (using visibility and wind direction) were used in tracing major trajectories. SDS images were also collected from these satellites NASA web sites such as (http://earthobservatory.nasa.gov/NaturalHazards/event), (http://visibleearth.nasa.gov) and http://modis.gsfc.nasa.gov).
- Dust fallout was monitored using a modified dust trap with 20 cm aperture and fixed at 240 cm above ground level and filled with marbles following the design by Al-Dousari and Al-Awadhi [14] (Figure 1) modified from Reheis [20] and Al-Awadhi [21] dust trap. There were 40 dust traps installed within coastal and terrestrial areas (20 traps for each) in Kuwait at the northern part of Arabian Gulf (Figure 2). The samples were monthly collected between 1 January 2011 and 31 October 2011 from all dust traps.
- Deposited dust was also collected from smooth surfaces on building at 5 m or more above ground level within major paths of SDS in the Arabian Gulf region. This sampling method were also used to cover surrounding global and regional areas to identify the dust properties in the Arabian Gulf in relation to other samples that include south Ahwar-Iraq, Manama-Bahrain, Riyadh and Walamen-south Arabia, Dubai and Ain-UAE and Cairo-Egypt.
- All collected samples (from both above methods) were analyzed to detect the physical and mineralogical properties of dust using the following techniques:
- Scanning electron microscope (SEM) and the Brunauer, Emmett, and Teller (BET) surface area were used to analyze all collected samples in the second method, in addition to terrestrial and coastal areas samples from Kuwait. The BET-surface area is stated as values for a particular weight of loose particles concerning meter square per gram (m2 g−1) measured via isotherm plot diagrams of volume against pressure and using the BET equation was devised [22].
- Dust fallout particle size percentages for 20 samples collected during 10 months from desert and coastal areas within Kuwait (January to October) were determined using Shumadzu, SA-CP3 Centrifugal Particle Analyzer.
- The whole components of the dust samples collected from the Arabian Gulf region in addition to March, June, September and December samples from desert and coastal dust traps in Kuwait were softly milled and analyzed using Philips PW-1830 X-ray diffraction (XRD) to semi-quantitative analysis.
These methods allow for the establishing of a decent classification for SDS trajectories in the Arabian Gulf, highlighting dust physical and chemical properties within these trajectories.
3. Results and Discussion
3.1. Dust Regional Trajectories
The SDS sizes and shapes within main trajectories are predominantly controlled by two main factors; topography and the wind (speed and direction). SDS trajectories can be classified in the region in reference to size and shape into three forms (Figure 3), namely,
- Extensive (SDS averaged width more than 300 km),
- Contains 6 subtypes (Agglomerated–Dense, Agglomerated–Dispersed, Wavy, Hook–Single head, Hook–Multiple heads, and Spiral),
- Intermediate (width 300–100 km),
- Contains 3 subtypes (Straight, Curved and Hook), and
- Small (width less than 100 km) SDS.
- Contains 3 subtypes (Needle like, Arrow shape-straight, and Arrow shape-curved).
In this study, the main SDS trajectories were identified, and satellite derived data were used to delineate temporal and spatial variations in their emission intensities (Figure 4). Eight major SDS trajectories were detected from these satellite images originating from:
- The Mesopotamian Flood Plain (MEP),
- The western desert of Iraq (WD),
- Ahwar marshes (HR),
- Nafud Desert (NFD)
- Ahwaz-Iran (HZ)
- Empty Quarter Desert (EQ) and
- Bandar Lenga (BLG), Iran.
- Hurmuz (HRZ)
Some of these eight SDS trajectories were also identified by other investigators [23,24,25,26,27]. Major SDS trajectories are initiated in southern Iraq [25]. Therefore, WD, MFP, HR, BLG and HZ are the most active sources of SDS trajectories in the Arabian Gulf region during the period from January to October. The EQ and NFD are mostly energetic trajectories during February, March, May, July, August, September and October (Figure 4a).
Among the three major types, there are 12 subtypes of SDS trajectories. The extensive SDS in the northern part of the Arabian Gulf is dominantly originated from the MFP or the WD or the HZ or the EQ desert or by a combination of multiple sources.
The Arabian Gulf total area is around 226,000 km2 with 900 km long and width 56–338 km as width range [28] with 7000 to 8400 km3 as a total water volume [29]. There are more SDS trajectories in northern Arabian Gulf in comparison to the southern portion (Figure 4b). The northern parts of Arabian Gulf receive annually about 373 t km−2 of deposited dust. The number of SDS days and annual average within northern Arabian Gulf are about five times more in comparison to the south (Table 1). The amount of fallen dust into the Arabian Gulf originated from the eight major trajectories represents the highest in the world (about 10,330 metric tons of dust for each cubic kilometer volume of water) (Table 2).
3.2. Particle Size Characteristics
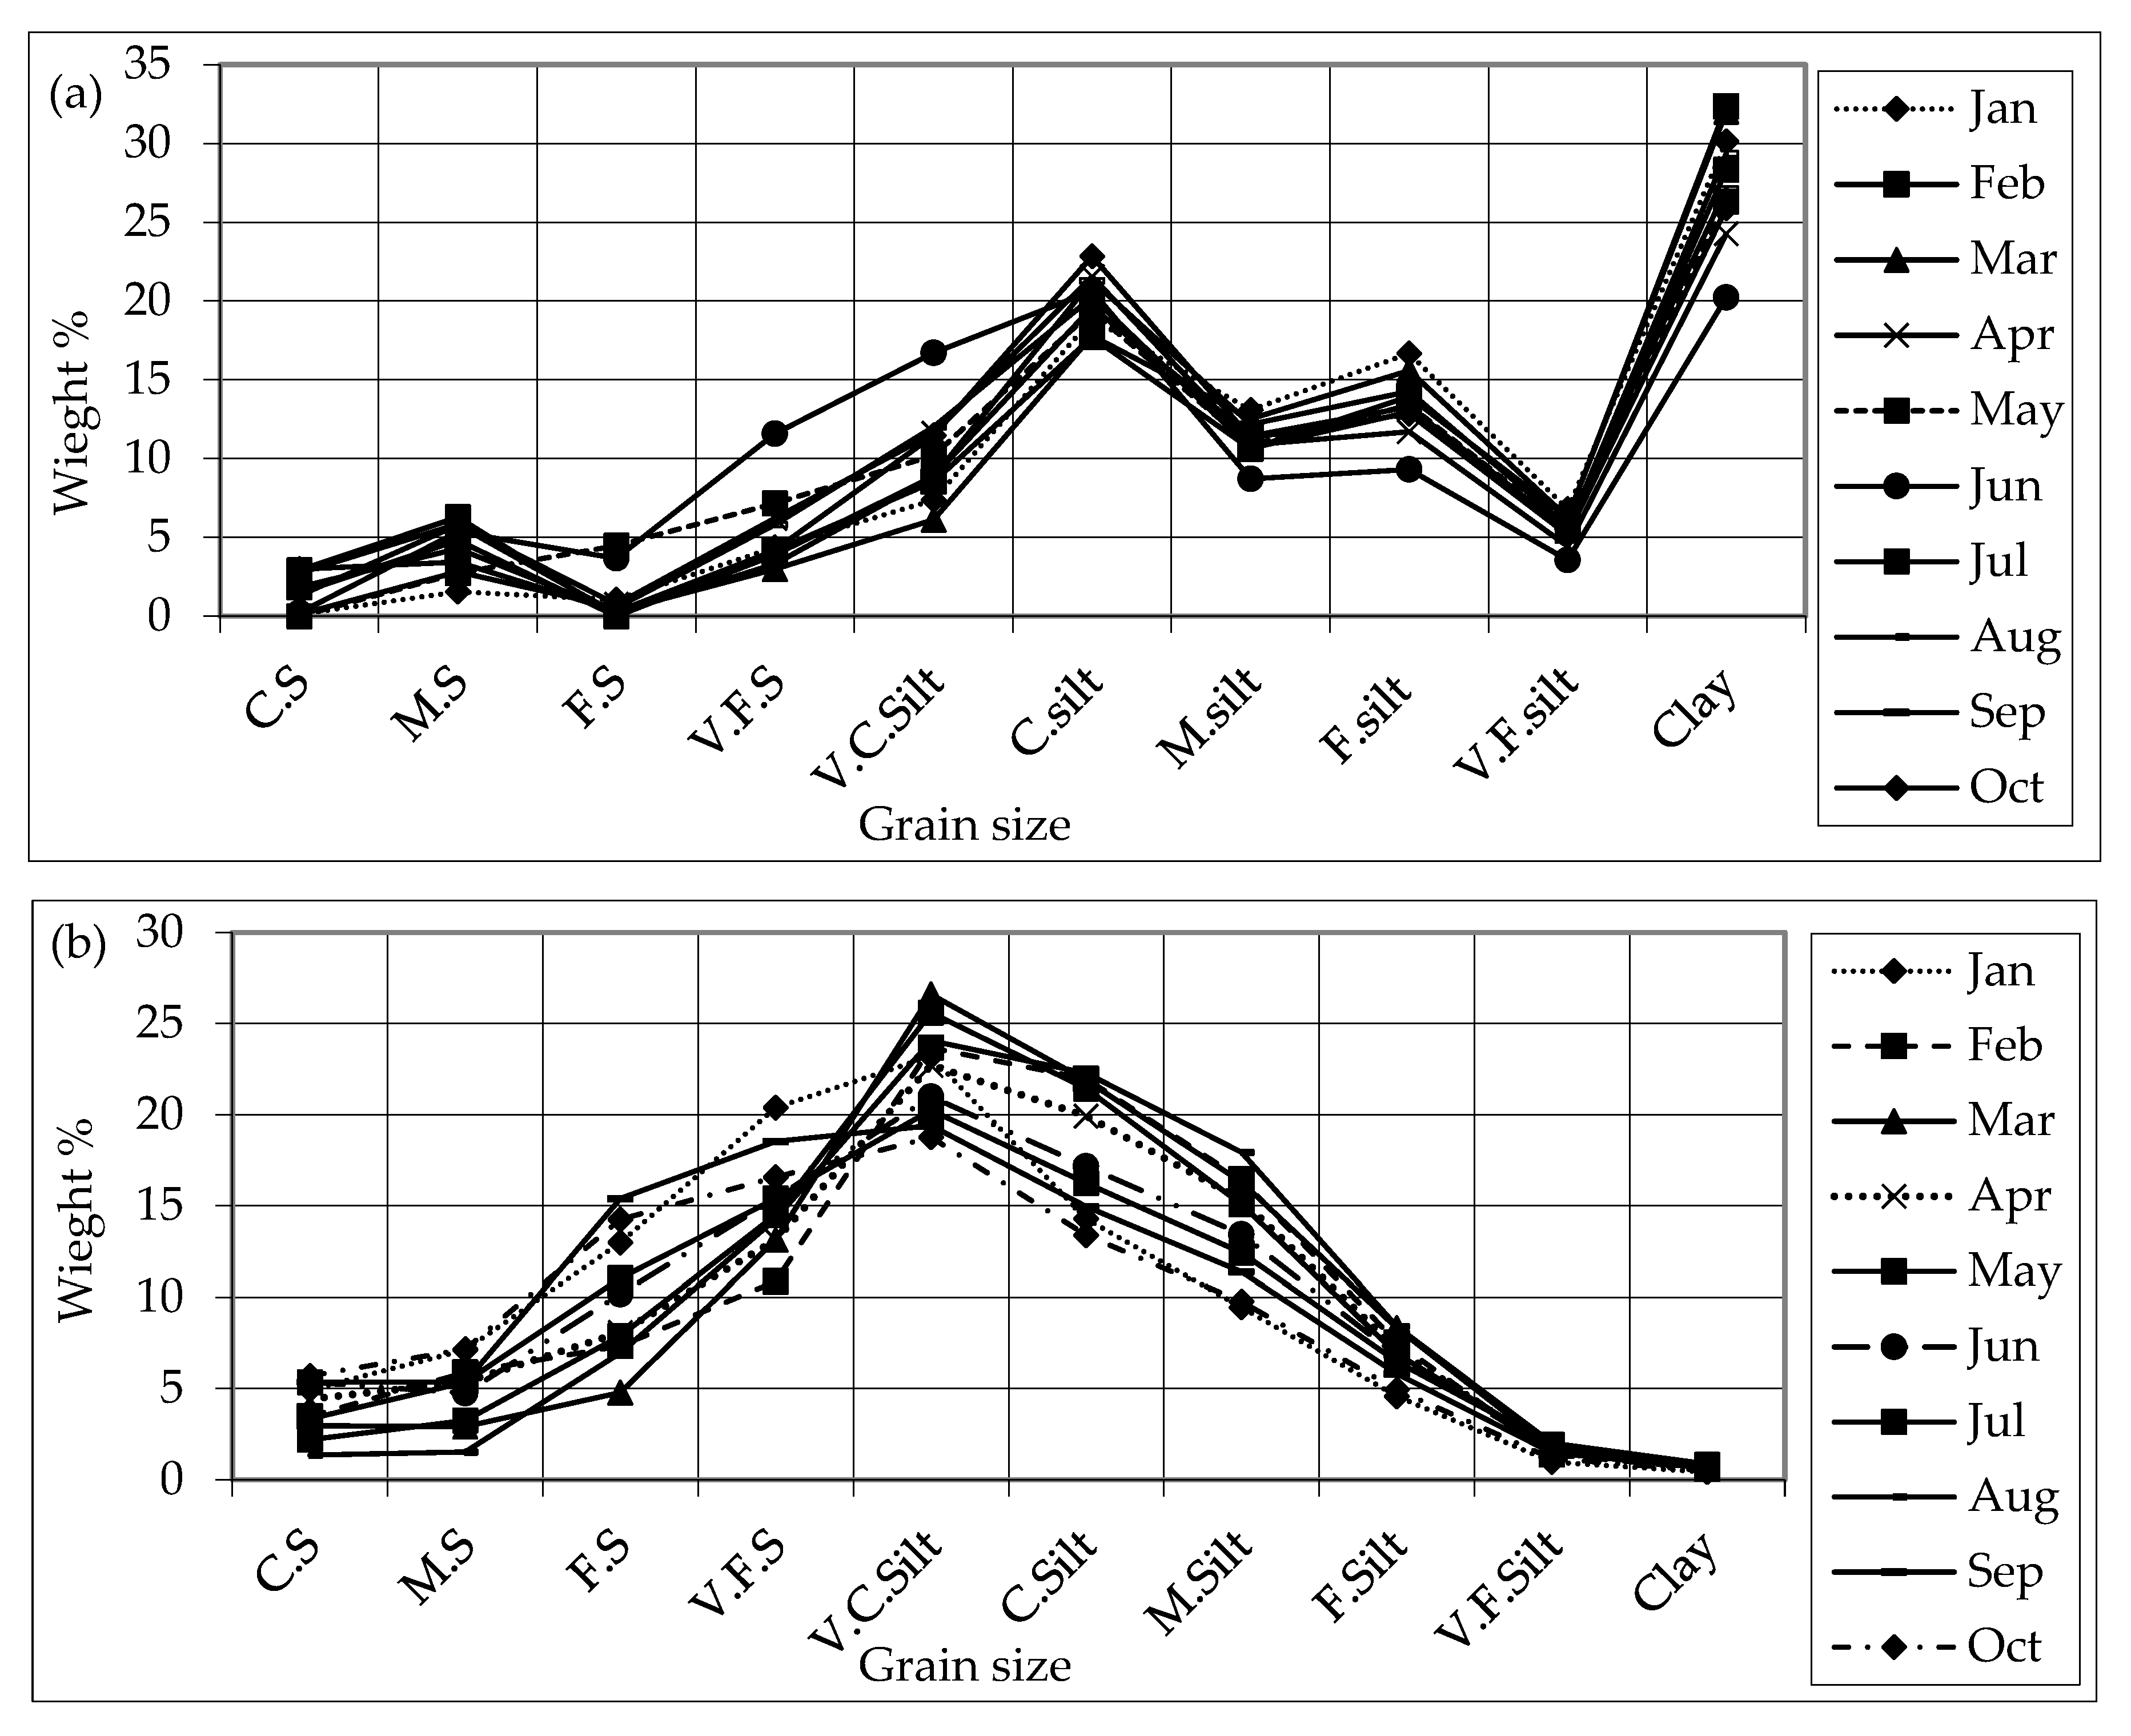
The sedimentological significance of the distribution between bedload and suspend load lies in the distance are carried by wind [36]. Two main mud size fractions of dust were identified; these are: short (diameter ranges between 20–63 μm) and long (diameter less than 20 μm) term suspended particles [36]. In addition to local dust source areas that comparatively produce coarse dust particles greater than 63 μm particle size diameters. The average mud (silt and clay) percentages represent 76%, while the mean percentages for sand particles are 24% from the whole collected dust samples in this study area. The particle size percentages are varying between those collected in the open desert (Kuwait, Nufud, and Ain) and others in the coastal areas (Bahrain, Dubai and Kuwait). The clay percentages are much more in dust within coastal areas (21%) (Table 3). Dust from coastal areas is negatively skewed, trimodal with dominance of clay, coarse and fine silt size fractions showing slight seasonal variations (Figure 5a). The trimodality of the distribution curves for dust samples within coastal areas indicated multiple sources (Figure 5b). On the other hand, open desert dust samples are negatively skewed and unimodal.
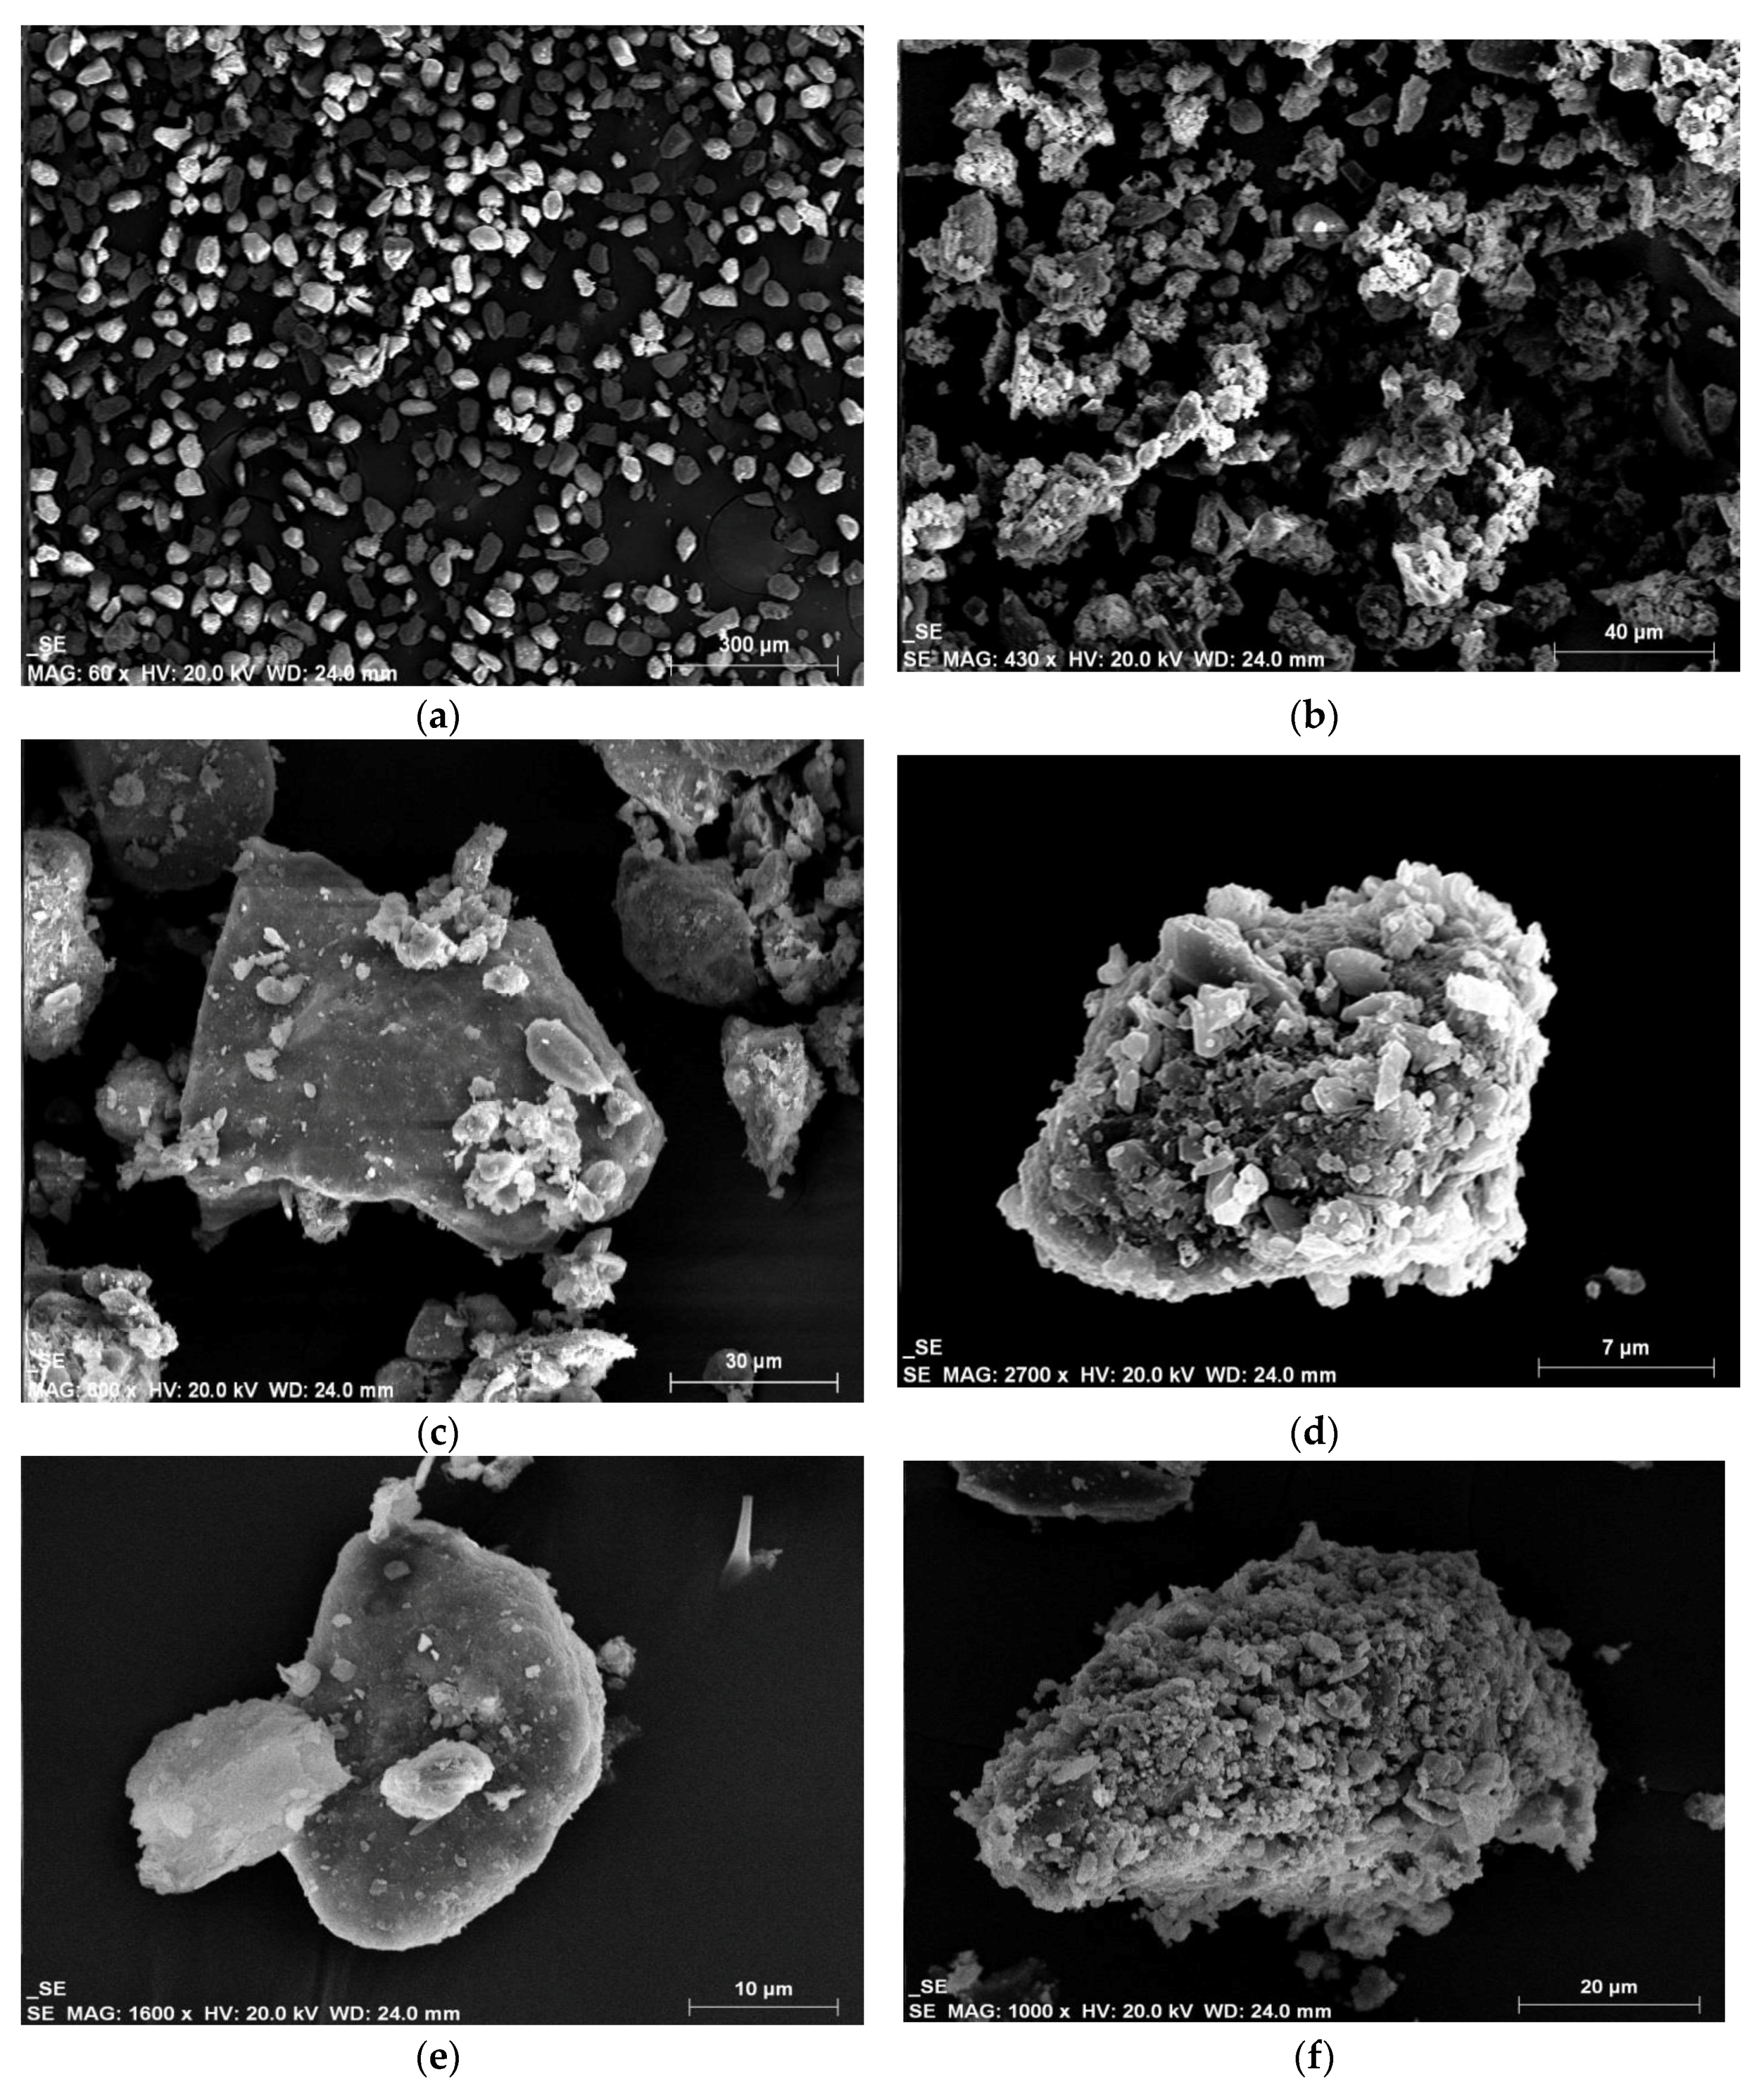
A closer view of dust particles using scanning electron microscope confirms that dust in desert areas contains loose, sub angular and dominantly composed of quartz particles (Figure 6a). In contrast, coastal dust contains consolidated angular particles with more carbonates and evaporites compared to desert dust (Figure 6b). The collected dust sampled show different chemical and physical properties.
3.3. Mineralogical Analysis
The semi-quantitative results confirm that carbonates (38%) and quartz (34%) are the major components in the deposited dust samples within the study area. Feldspars are found in appreciable quantities (14% in average), while other minerals with lesser ratios (3%). Quartz percentages vary from 31% to 62% (Table 4). Commonly, due to the increase in aeolian activities during summer time, quartz percentages increase slightly with a drop in carbonates. Other minerals are mainly evaporites (bassonite, gypsum and anhydrite) increase toward coastal areas. The dust from Rub Al-Khali is dominantly quartz grains carrying on top of it adhering particles of feldspars, mica and carbonates (Figure 6c). The coastal dust samples such as Dubai show more carbonates and evaporites such as bassonite (CaSO4·5H2O) (Figure 6d) and gypsum (CaSO4·2H2O) (Figure 6e). In contrast, dust particles from the Northern Desert of Africa composed of quartz with minute adhering particles of different minerals (Figure 6f).
3.4. BET Surface Area
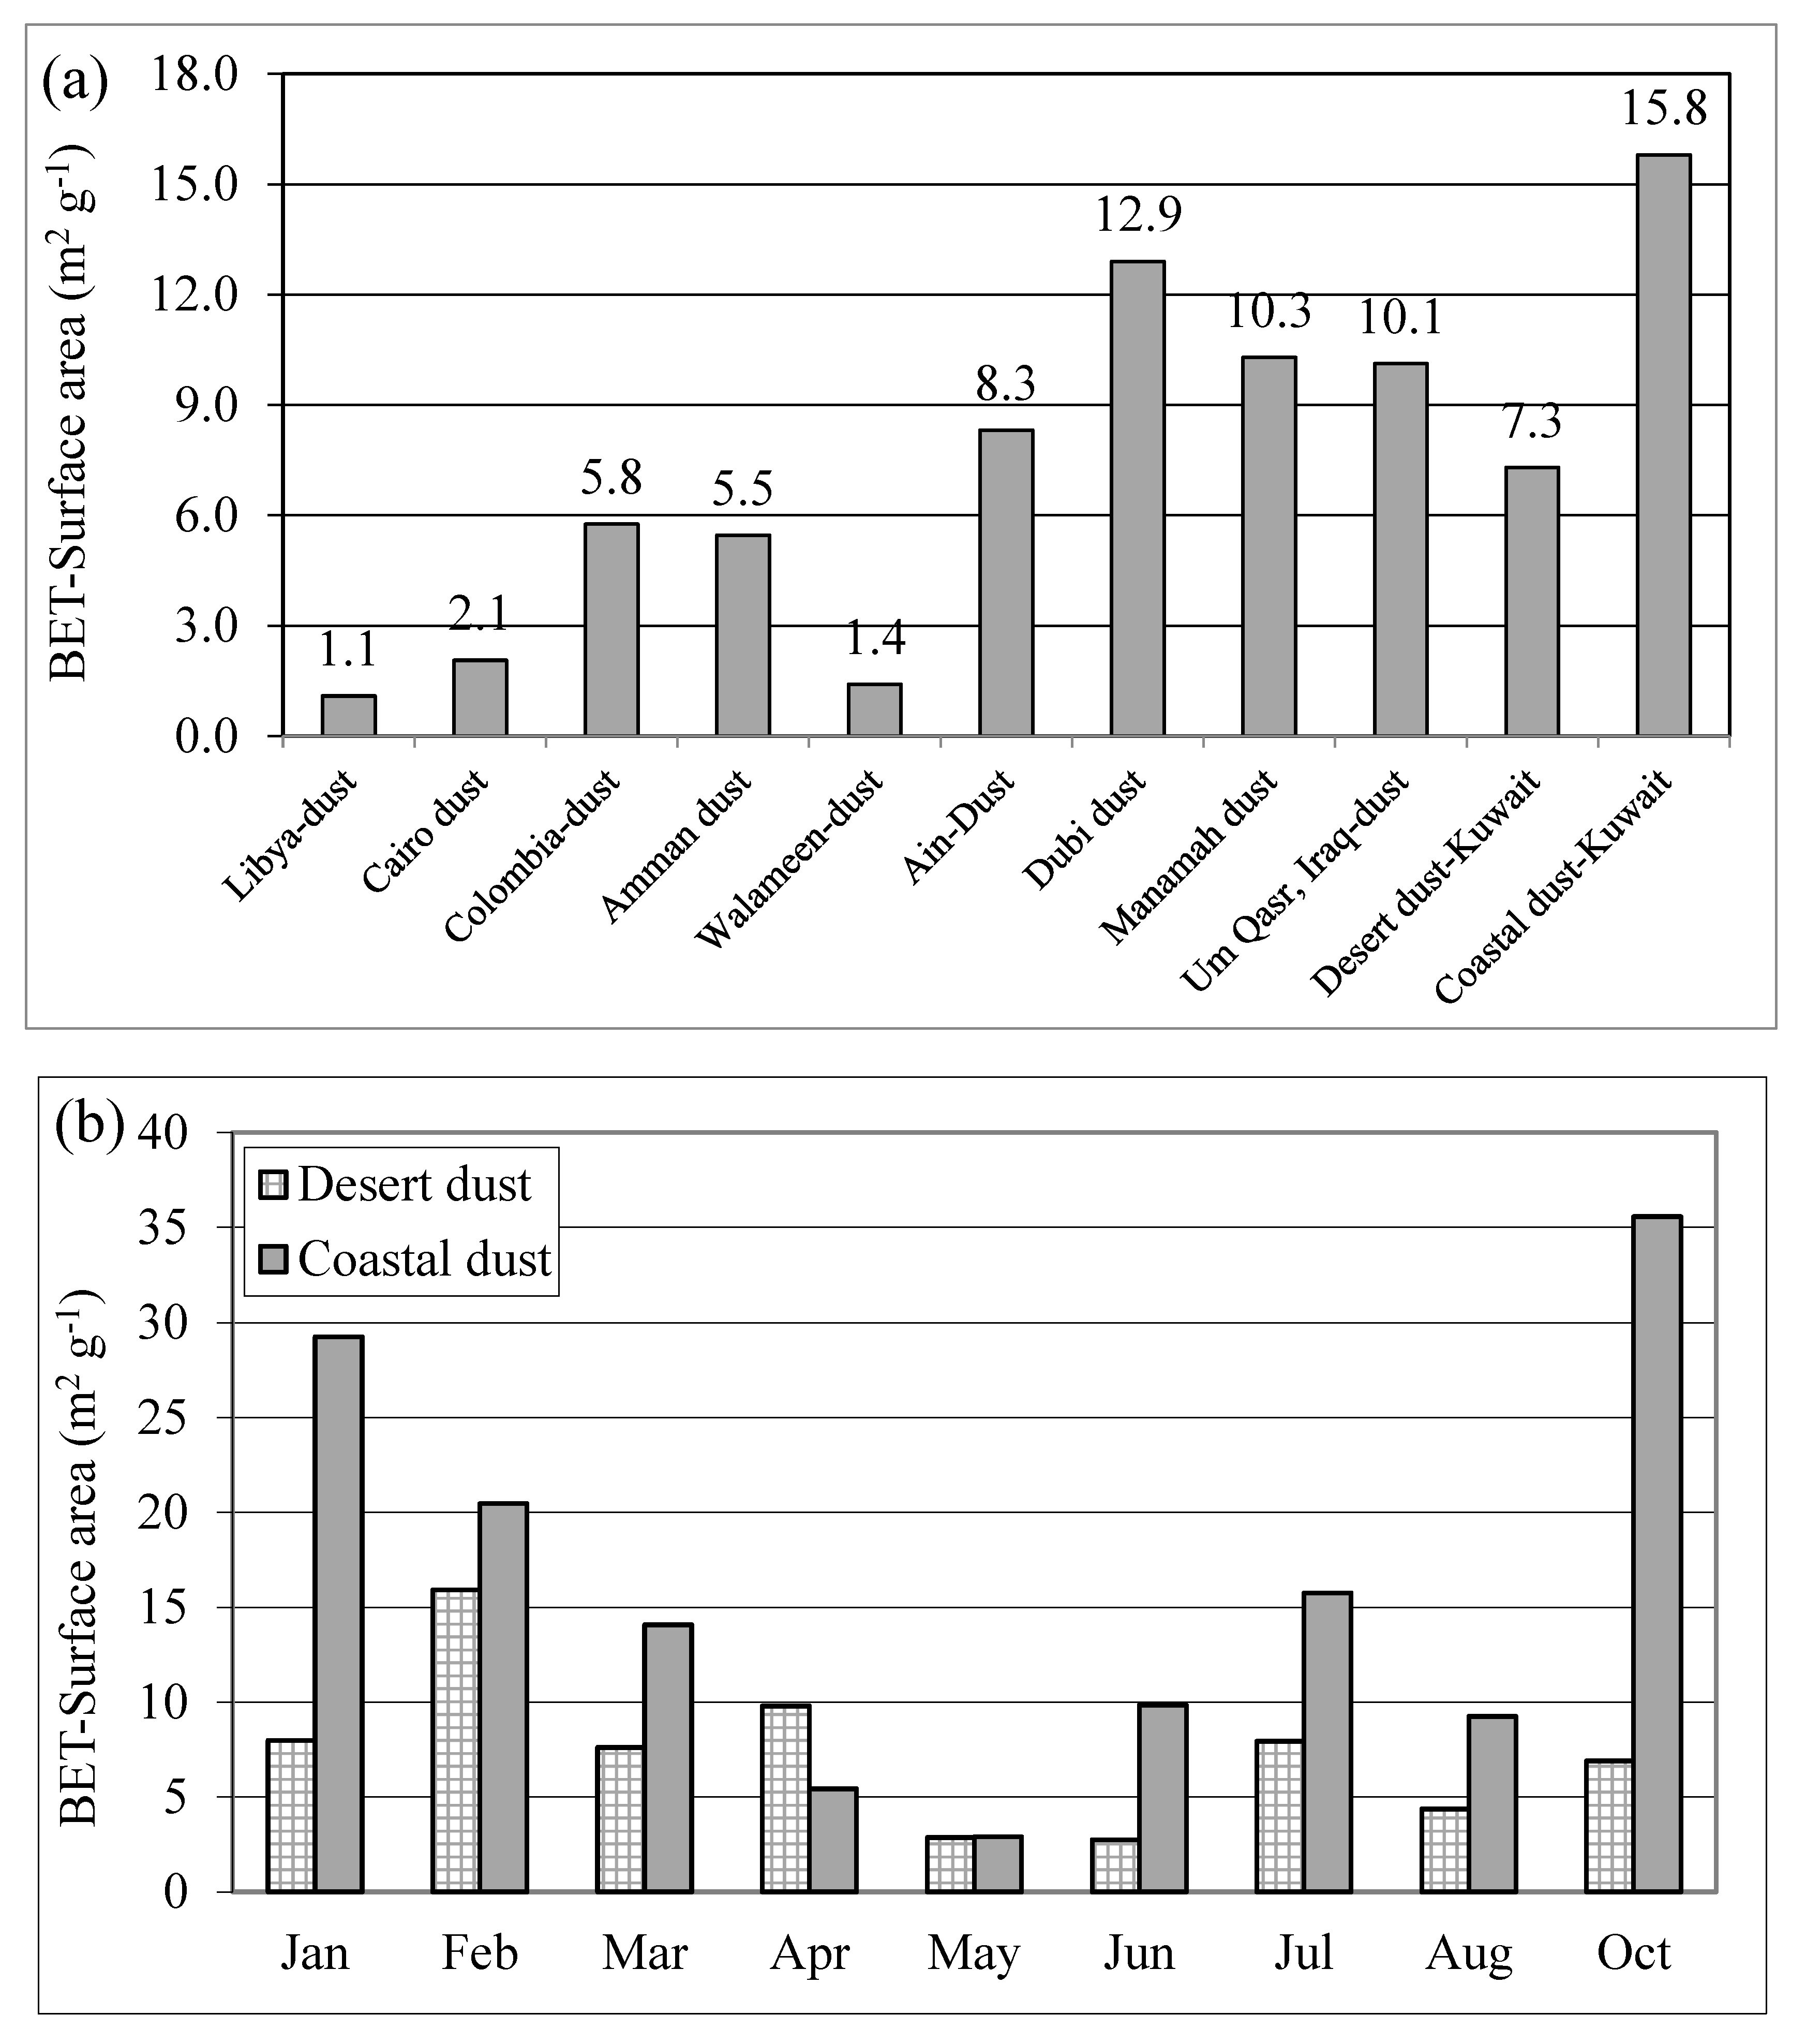
BET surface area is a useful physical tool for determining the source areas of sediments [35]. The dust samples from the coastal areas which are dominantly affected by SDS trajectories from MFP, HZ, HR and BSH show notable variations when compared to the desert dust samples which mainly affected by trajectories from WD, NFD and EQ. The Ain dust surface area in mid of WQ shows low BET Surface area, while Kuwait coastal dust affected dominantly by MFP, HZ, HR trajectory shows the maximum values. The overall trend for upwind samples shows a slight decrease compared to downwind samples (Figure 7a). The BET surface area of dust particles varies with time with maximum values during October until March and lowest values during May (Figure 7b).
3.5. Summary
The fallen dust into the Arabian Gulf coastal regions are originated from MFP, HZ, HR and BSH and characterized by finer mean size fractions with trimodal particle size distribution, higher values of particles surface area and containing more carbonates and less quartz compared to dust deposited in terrestrial areas, which is dominantly originated from WD, NFD and EQ. Poor Quartz sediment are a characteristic of soil sediments in MFP, HR, HZ, and BSH areas, while quartz-rich coarse sediment found in WD, NFD and EQ [18,19]. Therefore, the physical and mineralogical properties of dust particles illustrate resemblances within coastal dust fallout samples in the Arabian Gulf, but with remarkable differences, if compared to deposited dust in terrestrial areas. In Kuwait at northern Arabian Gulf, the temperature data shows the overall positive rate of 4.7 degrees per century [39]. Regionally, a positive correlation was observed between annual and seasonal maximum temperature and dust storm frequency in Iran [40]. Therefore dust storms intensity and frequency in future decades are expected to be more. The hospital admissions in Iran [41] and Kuwait [42] for cardiovascular and respiratory diseases grew more with the increase in dust storms intensity and frequency in the Arabian Gulf and expected to rise in the future perspective. The socioeconomic effect of dust in Kuwait was noted in traffic accident rates, oil export loss due to close out of marine terminals, airlines delays and agricultural degradation [43]. Therefore, passive and active control measures should be applied in the region to minimize the negative effect of SDS.
4. Conclusions
The present study on SDS in the Arabian Gulf leads to the following conclusions:
- There are 8 major SDS trajectories were identified in the Arabian Gulf using satellite images and weather data.
- The dust storms trajectories were classified in accordance to shape and size into three major types namely, Extensive, Intermediate and Small dust storms with 12 subtypes in the region.
- The dust particles originated dominantly from SDS trajectories in WD, EQ and NFD are coarser, lower values of BET surface area, higher in quartz and low carbonate contents compared to dust from MFP, HZ, HR and BS.
- The very fine (V.F.S.) and fine (F.S.) sand grains (diameter above 0.063 mm) originate commonly from local sources representing around 58% of the average deposited dust ratios in desert areas, while it represents only 11% within coastal area of the Arabian Gulf.
- The deposited dust particles are fining towards the Arabian Gulf and getting coarser towards the desert areas.
- Quartz and carbonates are the main constituents of dust in the Arabian Gulf. Feldspars are found in considerable quantities, but it was observed that quartz percentages increases and carbonates decrease towards the desert area dust.
- Gypsum, anhydrite, bassanite and heavy minerals represent other minerals with 3% as minor components of dust.
The physical characterization of the trajectories of sand and dust storms in the Arabian Gulf, along with the mineralogical, grain size and BET analyses of the particles transported provide an integrated contribution toward indicating the environmental impact of such events, including the effect on agriculture, infrastructures and air quality. In particular, the grain size and mineralogical distribution of dust particles as a function of the different storm trajectories and source areas (from land to sea) are given here, with application to the Arabian Gulf. On the other hand, such integrated approach is applicable for characterizing sand and dust storms in other regions.
Acknowledgments
This work was funded by the Kuwait Foundation for the Advancement of Science (KFAS) for the project (2008-1401-01) and the Kuwait Institute for Scientific Research (KISR) for (ECO41K and EC063C). Acknowledgments are extended to Mr. Rodel Dela Costa for his assistance in superimposing storms trajectories. This paper has been assisted by two reviewers’ comments and an academic editor.
Author Contributions
Al-Dousari, Doronzo and Modi conceived this paper; Al-Dousari wrote the bulk of it, with critical input from Doronzo and Modi.
Conflicts of Interest
The authors declare no conflict of interest.
References
- Middleton, N.; Kang, U. Sand and dust storm: Impact mitigation. Sustainability 2017, 9, 1053. [Google Scholar] [CrossRef]
- Knippertz, P.; Stuut, J.B.W. Chapter 1: Introduction. In Mineral Dust: A Key Player in the Earth System; Peter, K., Stuut, J.B.W., Eds.; Springer: Berlin/Heidelberg, Germany, 2014; pp. 1–14. ISBN 978-94-017-8978-3. [Google Scholar]
- Doronzo, D.M.; Al-Dousari, A.; Folch, A.; Waldhauserova, P.D. Preface to the Dust Topical Collection. Arab. J. Geosci. 2016, 9, 468. [Google Scholar] [CrossRef]
- Al-Dousari, A.M.; Aba, A.; Al-Awadhi, S.; Ahmed, M.; Al-Dousari, N. Temporal and spatial assessment of pollen, radionuclides, minerals and trace elements in deposited dust within Kuwait. Arab. J. Geosci. 2016, 9, 95. [Google Scholar] [CrossRef]
- Al-Kulaib, A.A. Climate of Arabian Gulf; That Alsalasil Press: Kuwait City, Kuwait, 1990; p. 87. [Google Scholar]
- Al-Dousari, A.M. Recent studies on dust fallout within preserved and open areas in Kuwait. In Desertification in Arid Lands: Causes, Consequences and Mitigation; Bhat, N., Al-Nasser, A., Omar, S., Eds.; Kuwait Institute for Scientific Research: Kuwait City, Kuwait, 2009; pp. 137–147. ISBN 978990641998. [Google Scholar]
- Al-Dousari, A.M.; Al-Hazza, A. Physical properties of aeolian sediments within major dune corridor in Kuwait. Arab. J. Geosci. 2013, 6, 519–527. [Google Scholar] [CrossRef]
- Strong, C.L.; Parsons, K.; McTainsh, G.H.; Sheehan, A. Dust transporting wind systems in the lower Lake Eyre Basin, Australia. Aeolian Res. 2011, 2, 205–214. [Google Scholar] [CrossRef]
- Meng, Z.; Lu, B. Dust events as a risk factor for daily hospitalization for respiratory and cardiovascular diseases in Minqin, China. Atmos. Environ. 2007, 41, 7048–7058. [Google Scholar] [CrossRef]
- Peterson, J.T.; Junge, C.E. Sources of particulate matter in the atmosphere. In Mans Impact on the Climate; Mathew, W., Kellogg, W., Robinson, G., Eds.; MIT Press: Cambridge, MA, USA, 1971; pp. 310–320. ISBN 9780444601575. [Google Scholar]
- Griffin, D.W.; Kellogg, C.A.; Garrison, V.H.; Shinn, E.A. The global transport of dust. Am. Sci. 2002, 90, 228–235. [Google Scholar] [CrossRef]
- Khalaf, F.I.; Al-Kadi, A.; Al-Saleh, S. Dust Fallout in Kuwait; Final Report No. KISR/PPI 108/EES-RF-8016; Kuwait Institute for Scientific Research: Kuwait City, Kuwait, 1980; p. 45. [Google Scholar]
- Al-Bakri, D.; Khalaf, F.; Al-Ghahdban, A.N. Mineralogy, genesis and sources of surficial sediments in Kuwait marine environment, northern Arabian Gulf. J. Sediment. Petrol. 1984, 54, 1266–1279. [Google Scholar]
- Al-Dousari, A.M.; Al-Awadhi, J. Dust fallout in northern Kuwait, major sources and characteristics. Kuwait J. Sci. Eng. 2012, 39, 171–187. [Google Scholar]
- Boloorani, A.D.; Nabavi, S.O.; Bahrami, H.A.; Mirzapour, F.; Kavosi, M.; Abasi, E. Investigation of dust storms entering Western Iran using remotely sensed data and synoptic analysis. J. Environ. Health Sci. Eng. 2014, 12, 124. [Google Scholar] [CrossRef] [PubMed]
- Al-Dabbas, M.; Ayad, A.M.; Al-Khafaji, R. Dust storms loads analyses—Iraq. Arab. J. Geosci. 2012, 5, 121–131. [Google Scholar] [CrossRef]
- Cau, H.; Liu, J.; Wang, G.; Luo, L. Identification of sand and dust storm source areas in Iran. J. Arid Land 2016, 7, 567–578. [Google Scholar] [CrossRef]
- Garzanti, E.; Al-Juboury, A.I.; Zoleikhaei, Y.; Vermeesch, P.; Jotheri, J.; Akkoca, D.B.; Obaid, A.K.; Allen, M.B.; Andó, S.; Limonta, M.; et al. The Euphrates-Tigris-Karun river system: Provenance, recycling and dispersal of quartz-poor foreland-basin sediments in arid climate. Earth-Sci. Rev. 2016, 162, 107–128. [Google Scholar] [CrossRef]
- Bogemans, F.; Janssens, R.; Baeteman, C. Depositional evolution of the Lower Khuzestan plain (SW Iran) since the end of the Late Pleistocene. Quat. Sci. Rev. 2017, 171, 154–165. [Google Scholar] [CrossRef]
- Reheis, M.C. Dust deposition in southern Nevada and California, 1984–1989: Relation to climate, source area, and source lithology. J. Geophys. Res. 1995, 100, 8893–8918. [Google Scholar] [CrossRef]
- Al-Awadhi, J. Dust fallout characteristics in Kuwait: A case study. Kuwait J. Sci. Eng. 2005, 32, 135–152. [Google Scholar]
- Brunauer, S.; Emmett, P.H.; Teller, E. Adsorption of gases in multimolecular layers. J. Am. Chem. Soc. 1938, 60, 309–319. [Google Scholar] [CrossRef]
- Purser, B.; Seibold, E. The principal environmental factors influencing Holocene sedimentation and diagenesis in the Persian Gulf. In The Persian Gulf: Holocene Carbonate Sedimentation and Digenesis in a Shallow Epicontinental Sea; Purser, B., Ed.; Springer: Berlin/Heidelberg, Germany, 1973; pp. 1–9. [Google Scholar]
- Khalaf, F.; Al-Ajmi, D. Aeolian processes and sand encroachment problems in Kuwait. Geomorphology 1993, 6, 111–134. [Google Scholar] [CrossRef]
- Al-Majed, N.; Mohammadi, H.; Al-Ghadhan, A. Regional Organization for the Protection of the Marine Environment; Regional Organization for the Protection of Marine Environment (ROPME): Kuwait City, Kuwait, 2000; p. 30. [Google Scholar]
- Hamza, W.; Enan, M.R.; Al-Hassini, H.; Stuut, J.; de-Beer, D. Dust storms over the Arabian Gulf: A possible indicator of climate change consequences. Aquat. Ecosyst. Health Manag. 2011, 14, 260–268. [Google Scholar] [CrossRef]
- Al-Dousari, A.M.; Al-Awadhi, J.; Ahmed, M. Dust fallout characteristics within global dust storms major trajectories. Arab. J. Geosci. 2013, 6, 3877–3884. [Google Scholar] [CrossRef]
- Al-Yamani, F.; Bishop, J.; Ramadhan, E.; Al-Husaini, M.; Al-Ghadban, A. Oceanographic Atlas of Kuwait’s Waters; Kuwait Institute for Scientific Research: Kuwait City, Kuwait, 2004; p. 49. [Google Scholar]
- El-Gindy, A.; Hegazi, M. Atlas on Hydrographic Conditions in the Arabian Gulf and the Upper Layer of the Gulf of Oman; University of Qatar: Doha, Qatar, 1996; p. 170. [Google Scholar]
- Al-Tayeb, N.T.; Jarrar, B.M. Dust fall in the city of Riyadh. In Proceedings of the Industrial Air Pollution Symposium, Riyadh, Saudi Arabia, 15–17 November 1993; pp. 66–74. [Google Scholar]
- Badawy, M.I.; Hernandez, M.D.; Al-Harthy, F. Sources of pollution at Mina al Fahal coastal area. Bull. Environ. Contam. Toxicol. 1992, 49, 813–820. [Google Scholar] [CrossRef] [PubMed]
- Yaalon, D.H.; Ganor, E. Rates of aeolian dust accretion in the Mediterranean and desert fringe environments of Israel. In Proceedings of the Transitions of the Ninth International Congress of Sedimentology, Nice, France, 6–13 July 1975; pp. 169–174. [Google Scholar]
- Khiri, F.; Ezaidi, A.; Kabbachi, K. Dust deposits in Souss–Massa basin, South-West of Morocco: Granulometrical, mineralogical and geochemical characterization. J. Afr. Earth Sci. 2004, 39, 459–464. [Google Scholar] [CrossRef]
- Pye, K. Aeolian dust transport and deposition over Crete and adjacent parts of the Mediterranean Sea. Earth Surf. Process. Landf. 1992, 17, 271–288. [Google Scholar] [CrossRef]
- Rott, C. Saharan Sand and Dust-Characterisation, Deposition Rates and Implications. Master’s Thesis, Royal Holloway University of London, Egham, UK, 2001; p. 5. [Google Scholar]
- Pye, K. Aeolian Dust and Dust Deposits; Academic Press: London, UK, 1987; p. 334. ISBN 0-12-568690-0; 0-12-568691-9. [Google Scholar]
- Modaihsh, A.S. Characteristics and composition of the fallen dust sediments on in the of Riyadh city, Saudi Arabia. J. Arid Environ. 1997, 36, 211–223. [Google Scholar] [CrossRef]
- Modaihsh, A.; Ghoneim, A.; Al-Barakah, F.; Mahjoub, M.; Nadeem, M. Characterizations of Deposited Dust Fallout in Riyadh city, Saudi Arabia. Pol. J. Environ. Stud. 2017, 26, 1599–1605. [Google Scholar] [CrossRef]
- Ramadan, A. Rizing temperature in Kuwait; a clear evidence of climate change. In World Renewable Energy Congress (WRECX); Sayigh, A., Ed.; Kuwait Institute for Scientific Research: Kuwait City, Kuwait, 2008; pp. 2681–2685. [Google Scholar]
- Broomandi, P.; Dabir, B.; Bonakdarpour, B.; Rashidi, Y. Identification of dust storm origin in South -West of Iran. J. Environ. Health Sci. Eng. 2017, 15, 16. [Google Scholar] [CrossRef] [PubMed]
- Khaniabadi, Y.O.; Fanelli, R.; De Marco, A.; Daryanoosh, S.M.; Kloog, I.; Hopke, P.K.; Conti, G.O.; Ferrante, M.; Mohammadi, M.J.; Babaei, A.A.; et al. Hospital admissions in Iran for cardiovascular and respiratory diseases attributed to the Middle Eastern Dust storms. Environ. Sci. Pollut. Res. 2017, 24, 16860–16868. [Google Scholar] [CrossRef] [PubMed]
- Thalib, L.; Al-Taiar, A. Dust storms and the risk of asthma admissions to hospitals in Kuwait. Sci. Total Environ. 2012, 433, 347–351. [Google Scholar] [CrossRef] [PubMed]
- Al-Hemoud, A.; Al-Sudairawi, M.; Neelamanai, S.; Naseeb, A.; Behbehani, W. Socioeconomic effect of dust storms in Kuwait. Arab. J. Geosci. 2017, 10, 18. [Google Scholar] [CrossRef]
Figure 1.
Dust trap design (left) and photo (right) in coastal area of Kuwait.
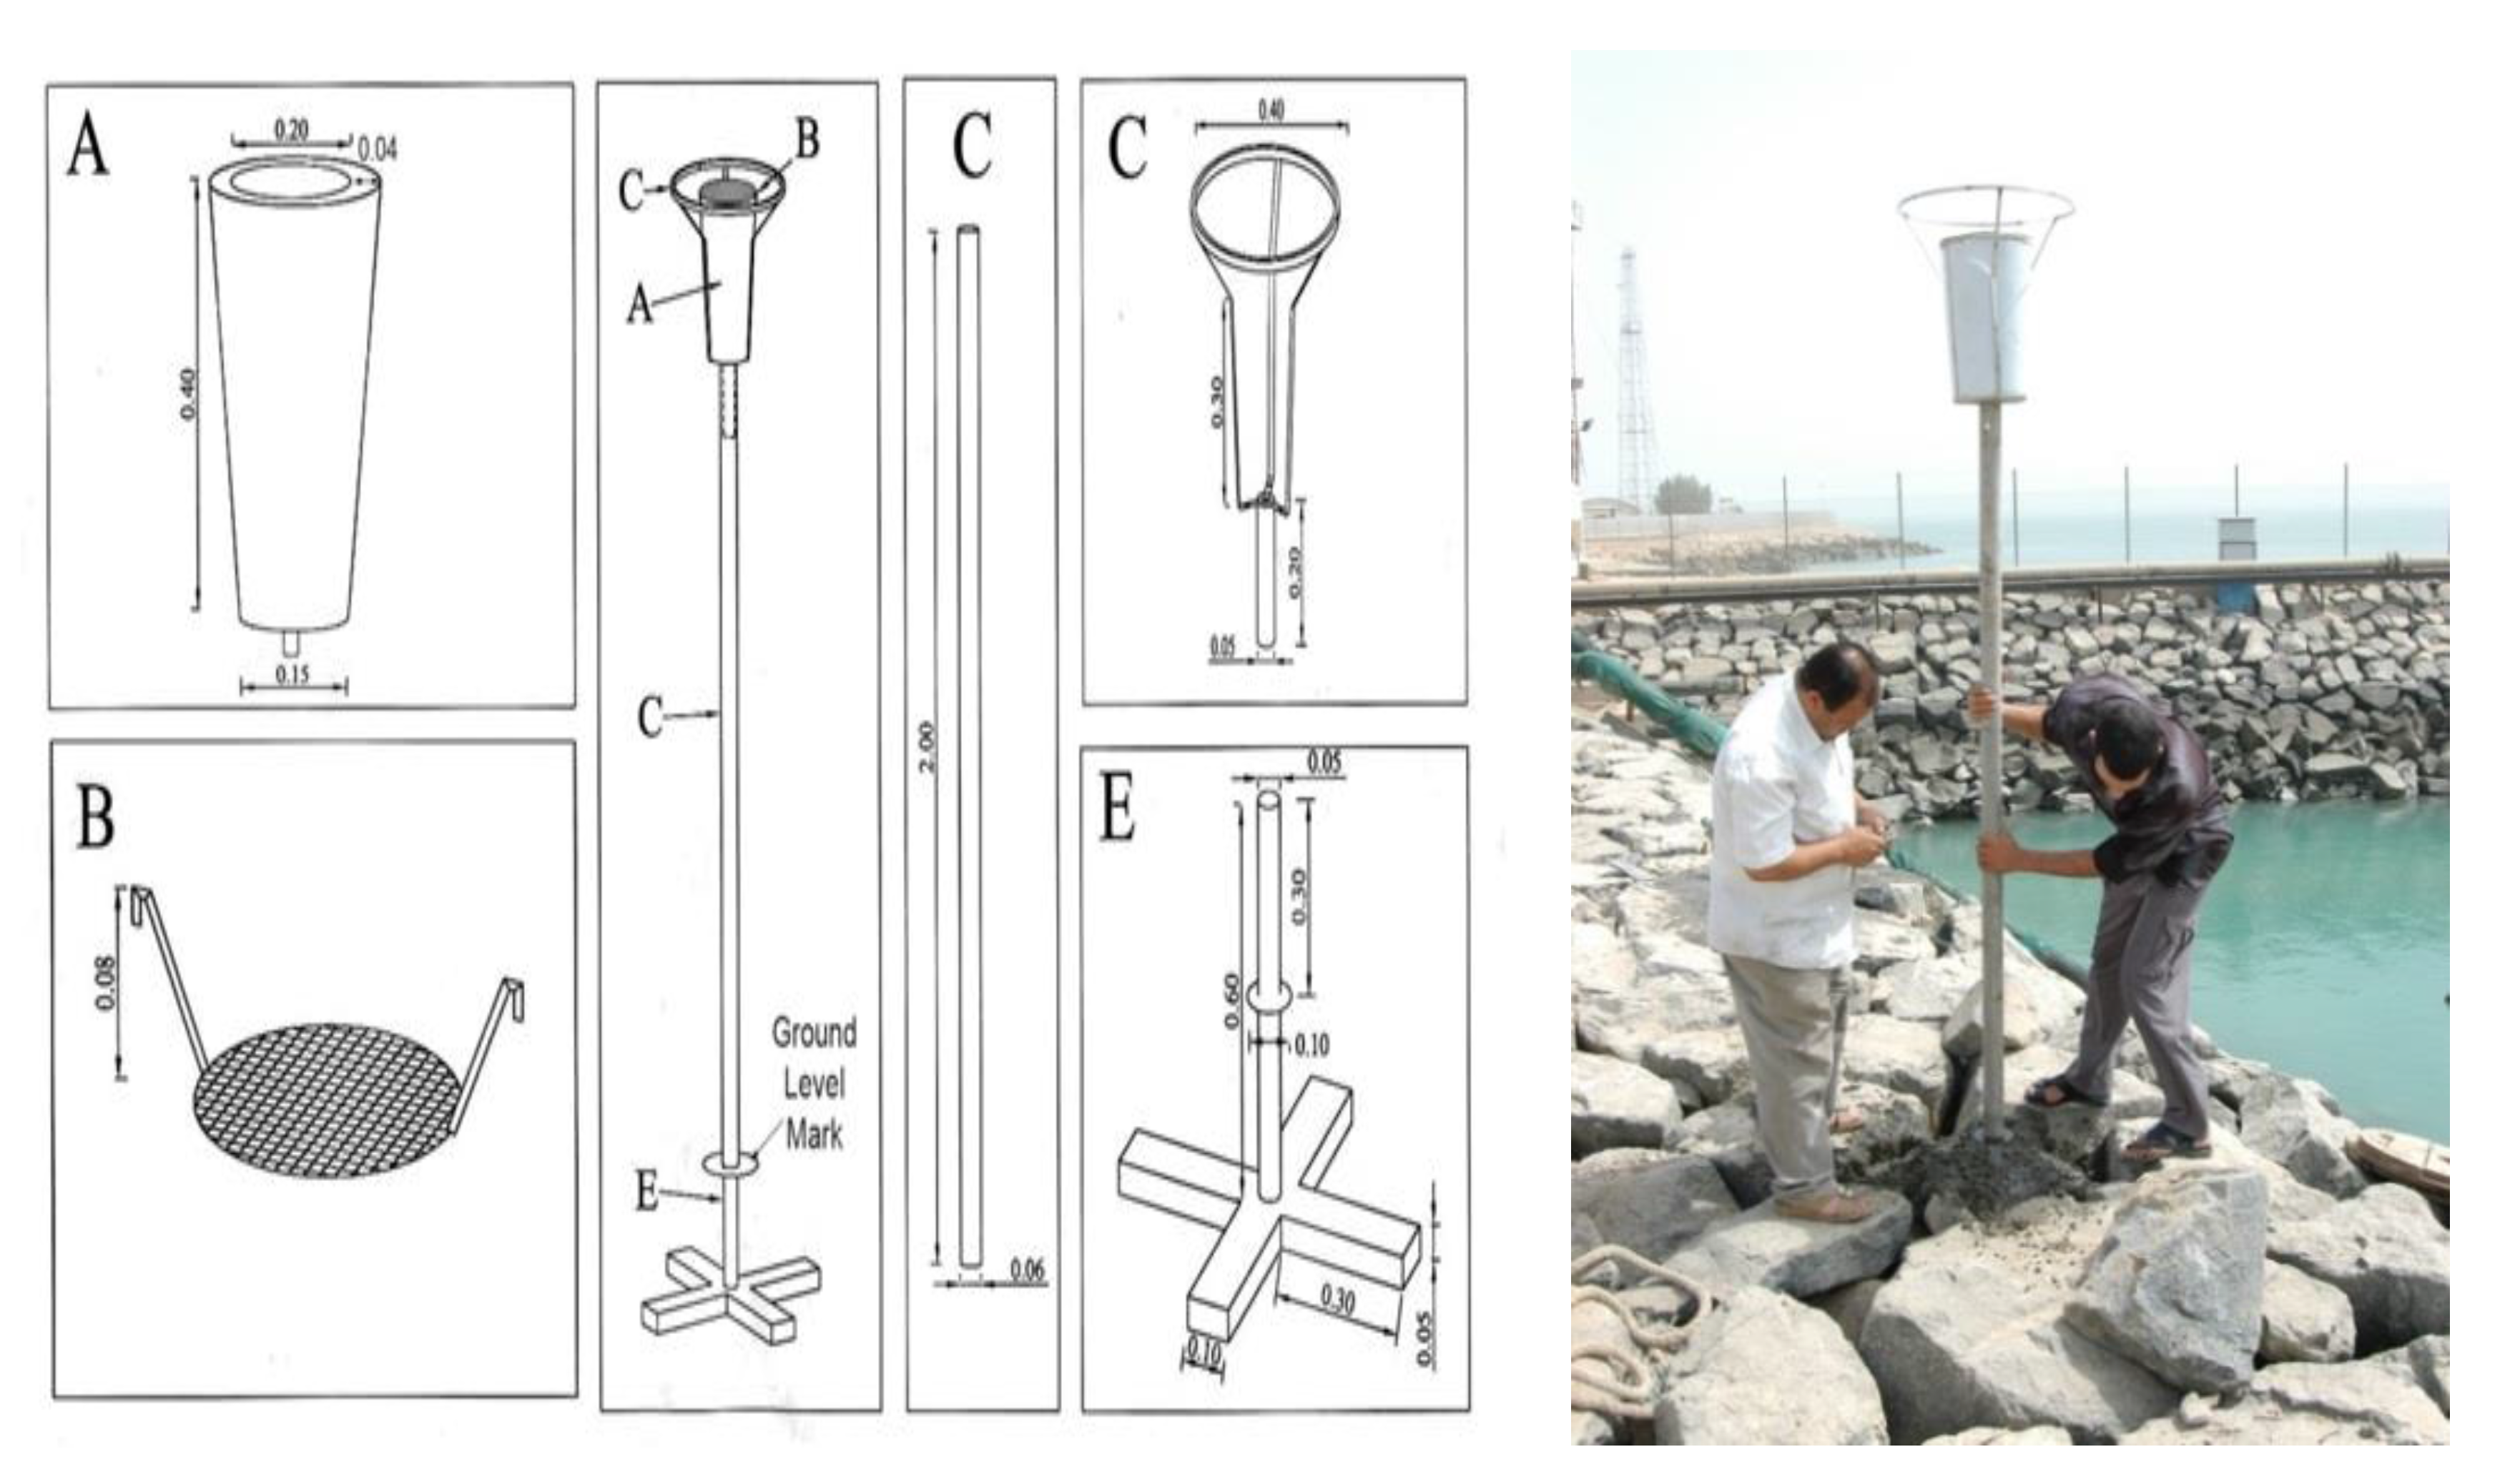
Figure 2.
Dust traps locations in terrestrial and coastal areas of Kuwait at northern Arabian Gulf.
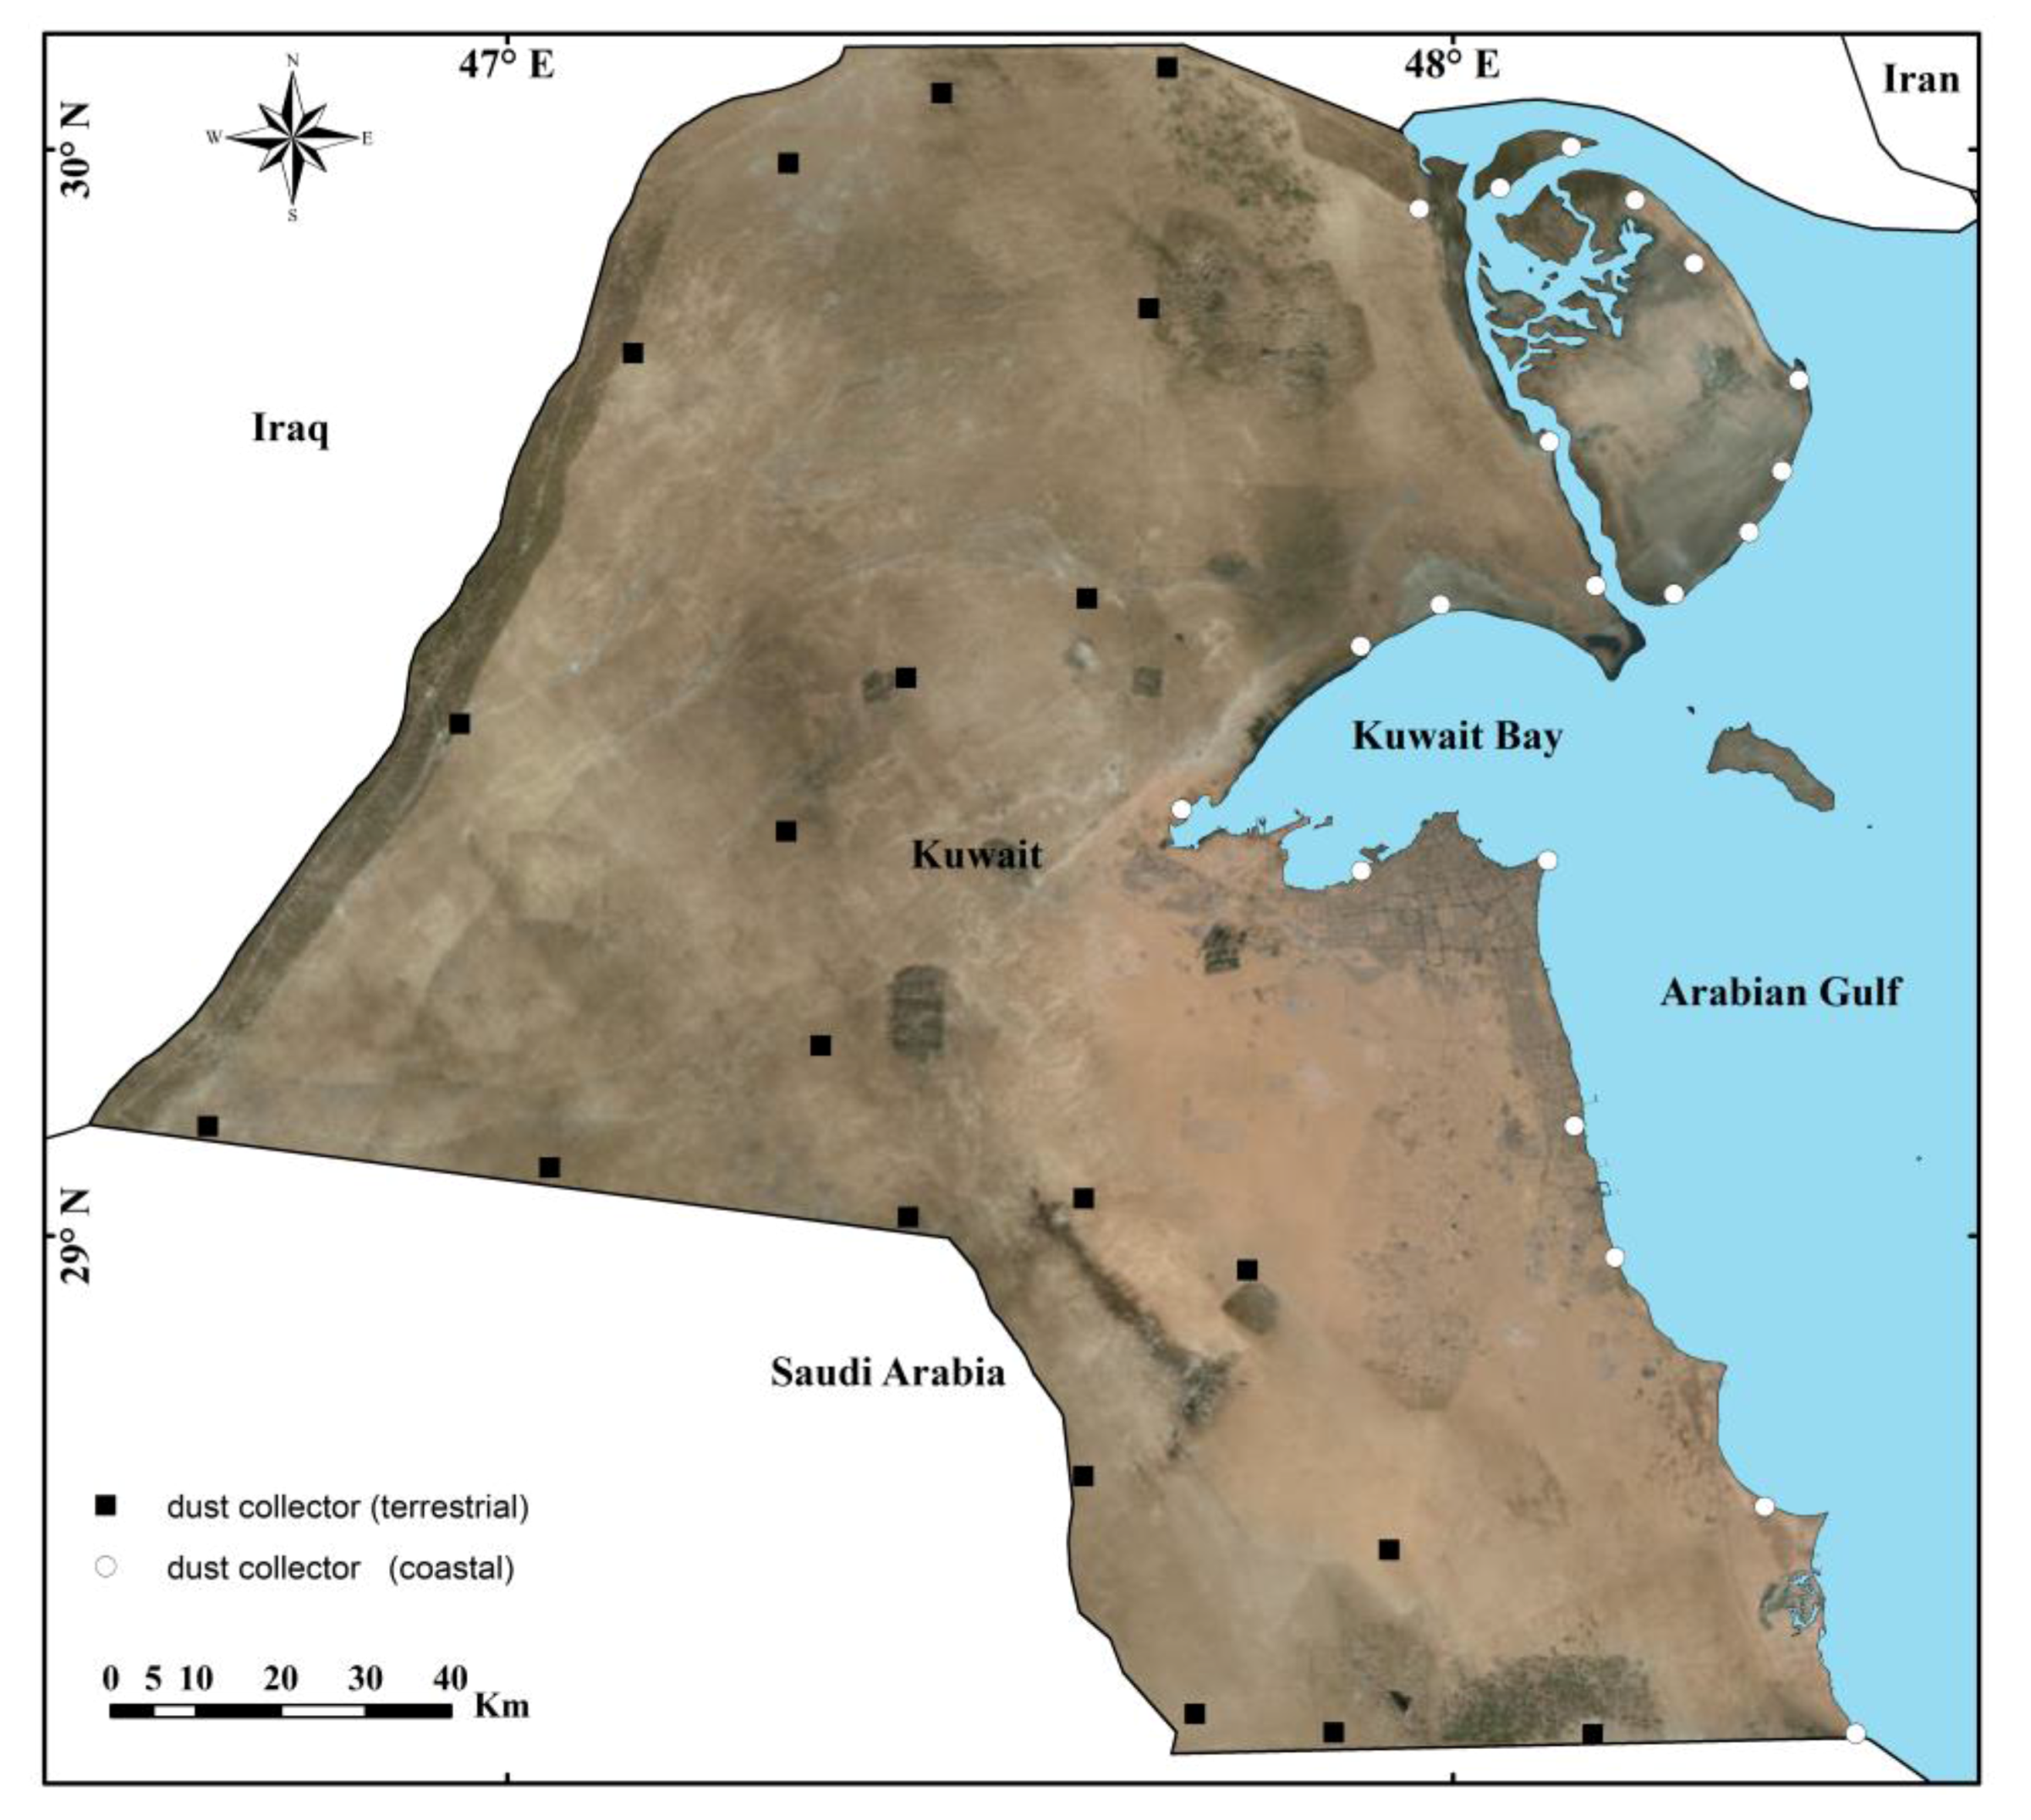
Figure 3.
Classification index of sand and dust storms (SDS) trajectories in the Arabian Gulf observed by MODIS images (3 major types and 12 sub types).
Figure 3.
Classification index of sand and dust storms (SDS) trajectories in the Arabian Gulf observed by MODIS images (3 major types and 12 sub types).
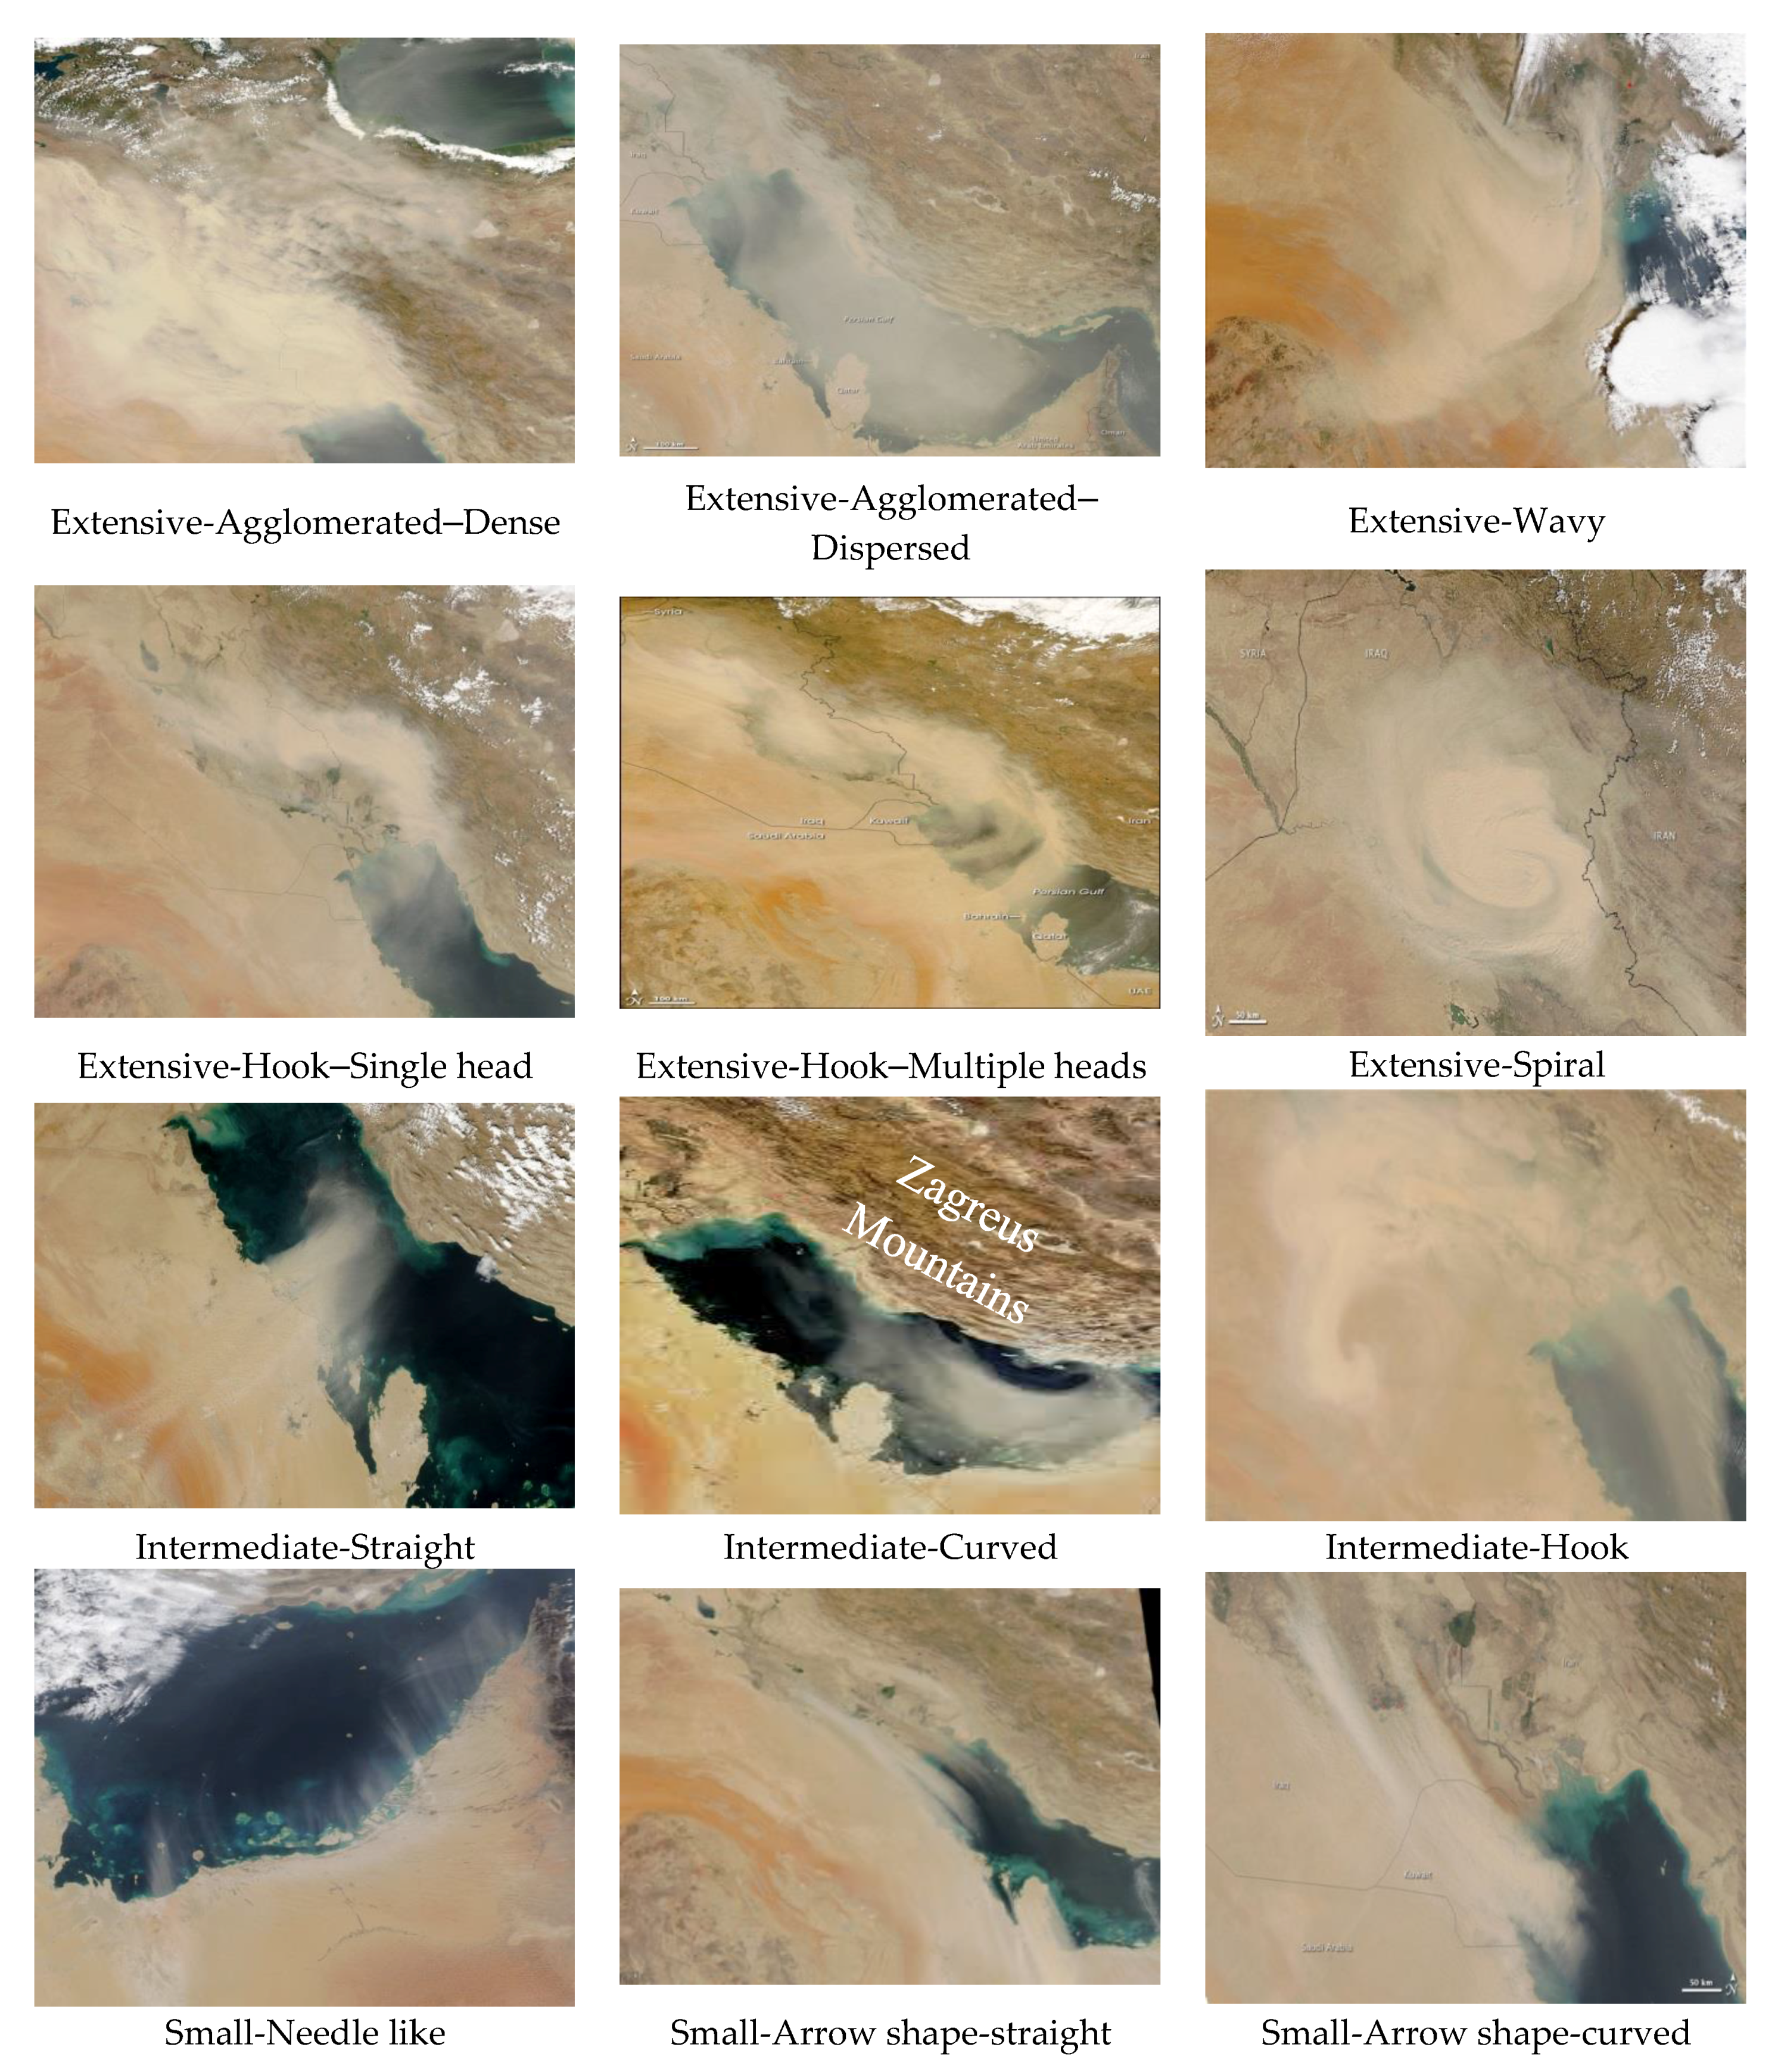
Figure 4.
Spatial and temporal distribution for multiple dominant SDS trajectories (2000–2017) superimposed images in northern (a) and southern (b) parts of the Arabian Gulf with sampling sites (dark dot).
Figure 4.
Spatial and temporal distribution for multiple dominant SDS trajectories (2000–2017) superimposed images in northern (a) and southern (b) parts of the Arabian Gulf with sampling sites (dark dot).
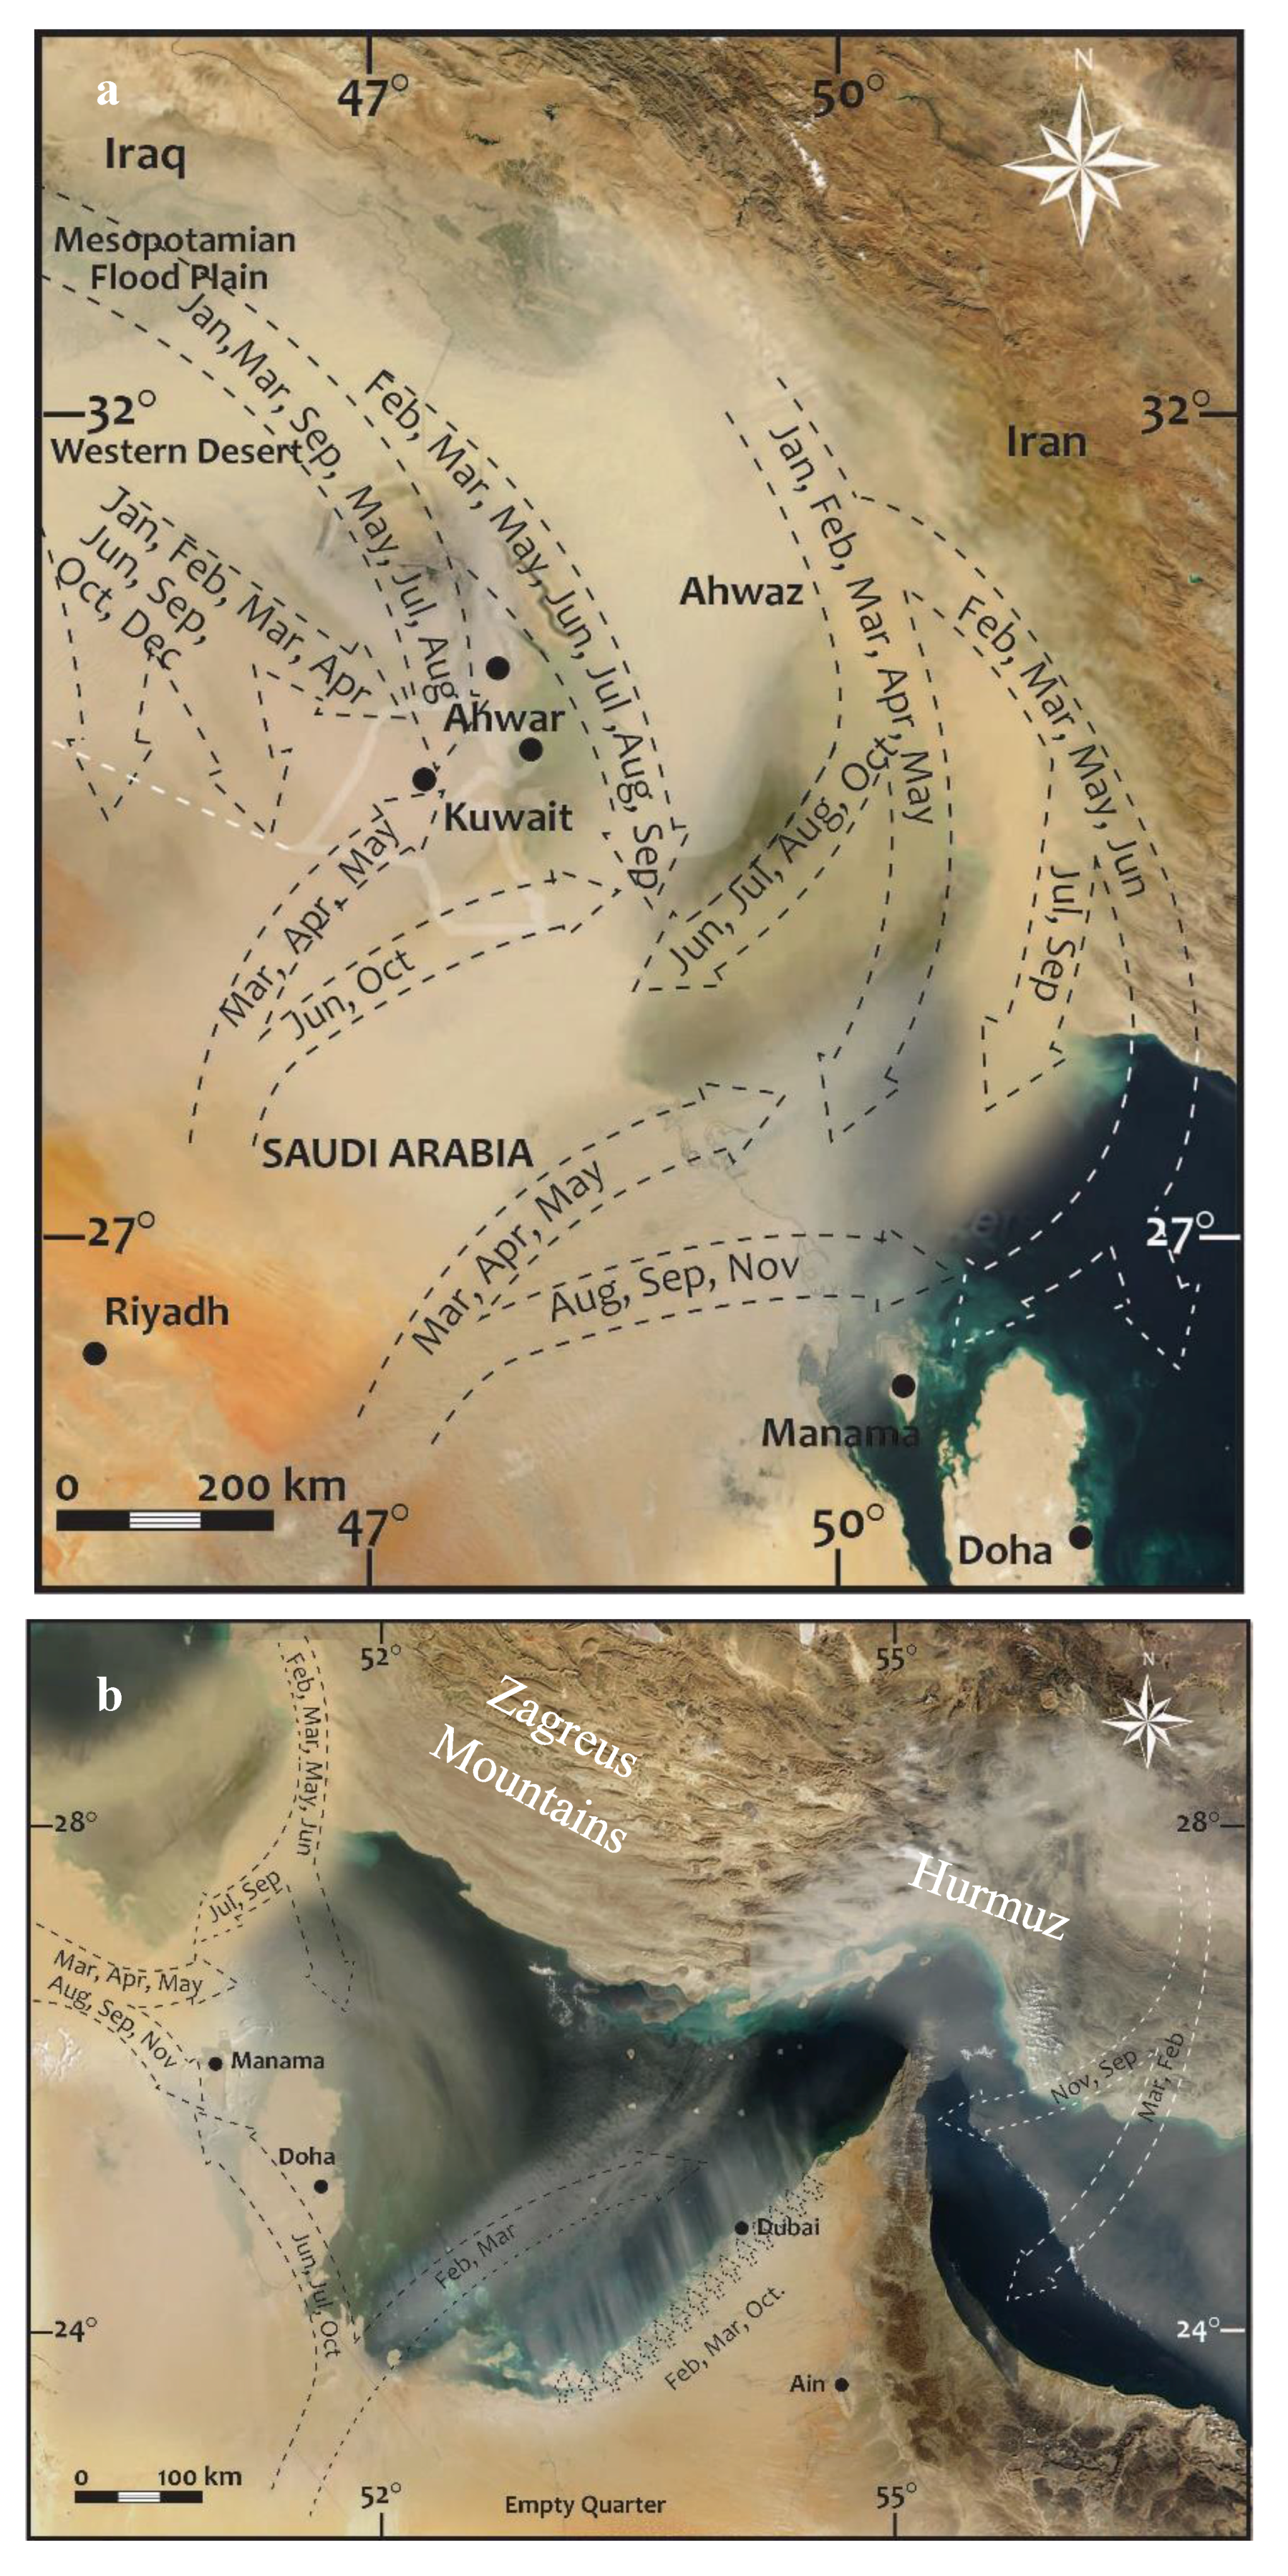
Figure 5.
Dust fallout particle size percentages from January to October coastal (a) and desert (b) areas in Kuwait.
Figure 5.
Dust fallout particle size percentages from January to October coastal (a) and desert (b) areas in Kuwait.

Figure 6.
Scanning electron micrograph for dust particles from Rub al-Khali-Walameen (a), and coastal environment in Dubai (b), closer view of sub angular quartz particle from Rub al-Khali-Walameen carrying smaller adhering particles (c), coastal bassonite (CaSO4·0.5H2O) (d) and gypsum (e) (CaSO4·2H2O) particles from Dubai dust, and quartz particle from dust collected from Cairo carrying many adhering particles (f).

Figure 7.
Spatial (a) and temporal (b) variations for Brunauer, Emmett, and Teller (BET)-Surface area values of collected from the desert and coastal dust samples in the Arabian Gulf compared to surrounding areas.
Figure 7.
Spatial (a) and temporal (b) variations for Brunauer, Emmett, and Teller (BET)-Surface area values of collected from the desert and coastal dust samples in the Arabian Gulf compared to surrounding areas.


Table 1.
The average number of SDS days in the Arabian Gulf.
| Cities | Year | Jan | Feb | Mar | Apr | May | Jun | Jul | Aug | Sep | Oct | Nov | Dec | Annual Average |
|---|---|---|---|---|---|---|---|---|---|---|---|---|---|---|
| Kuwait | 17 | 0.9 | 1.2 | 1.1 | 3.3 | 3.7 | 4.4 | 4.5 | 1.9 | 0.6 | 1.4 | 0.3 | 1.1 | 21 |
| Riyadh | 5 | 2.2 | 4.4 | 5.6 | 10 | 6.2 | 8.4 | 5.2 | 2.2 | 1.2 | 0.6 | 1.8 | 1.0 | 49 |
| Bahrain | 33 | 0.1 | 0.3 | 0.5 | 0.6 | 0.5 | 1.4 | 1.5 | 0.2 | 0.3 | 0.0 | 0.1 | 0.1 | 5.6 |
| Doha | 15 | 0.4 | 0.5 | 0.7 | 0.7 | 0.4 | 1.7 | 1.4 | 0.4 | 0.4 | 0.3 | 0.4 | 0.1 | 7.6 |
| Abu-Dhabi | 6 | 0.4 | 0.3 | 0.6 | 0.1 | 0.4 | 0.4 | 0.7 | 0.0 | 0.0 | 0.0 | 0.2 | 0.7 | 3.9 |
Table 2.
The annual fallen dust in major water bodies in the world.
| Ocean/Sea | Total Area (km2) | Annual Dust (t km−2) | Location-Political Region (Reference) | Annual Dust to Total Sea Area (Million Tons) * | Annual Dust in Water Volume (t km−3) ** |
|---|---|---|---|---|---|
| Arabian Gulf | 226,000 | 373 | Kuwait (present study) | 89 | 10,330 |
| 76 | Um Qasr-Iraq [12] | ||||
| 194 | Khur Zubir [12] | ||||
| 392 | Nufud [30] | ||||
| Arabian Sea | 3,862,000 | 89 | Oman [31] | 344 | 33 |
| Red Sea | 938,000 | 57 | Negev Desert [32] | 53 | 1.33 |
| Mediterranean Sea | 2,500,000 | 155 | Tripolli-Libya [33] | 185 | 49 |
| 10 | Crete-Greece [34] | ||||
| Atlantic Ocean | 106,400,000 | 114 | Agadir-Morocco [35] | 13,324 | 38 |
| 145 | Sidi Afni-Morocco [35] | ||||
| 175 | Tan Tan-Morocco [35] | ||||
| 111 | Smara-Morocco [35] Itguity- | ||||
| 40 | Morocco [35] | ||||
| 52 | Layoune-Morocco [35] | ||||
| 219 | Boujdour-Morocco [35] | ||||
| 191 | Dakhla-Mauritania [35] | ||||
| 80 | Noudhibou-Mauritania [35] |
* Calculated by multiplying the average annual amount of deposited dust with total area of water body; ** Calculated by dividing the average amount of deposited dust with water body volume.
Table 3.
Particle size percentages of fallen dust in the Arabian Gulf and surrounding areas.
| Location | Sand | V. C. Silt * | C. Silt * | M. Silt * | F. Silt * | V. F. Silt * | Clay |
|---|---|---|---|---|---|---|---|
| Desert dust around the Arabian Gulf | |||||||
| Walameen-Saudi | 40 | 8 | 21 | 15 | 11 | 2 | 4 |
| Ain, UAE | 97 | 0 | 1 | 1 | 1 | 1 | 0 |
| Kuwait desert | 37 | 22 | 18 | 14 | 7 | 2 | 0 |
| Coastal dust around the Arabian Gulf | |||||||
| Ahwar, Iraq | 3 | 12 | 20 | 25 | 15 | 5 | 20 |
| Kuwait coast | 12 | 10 | 20 | 11 | 13 | 5 | 28 |
| Bahrain | 12 | 10 | 20 | 11 | 13 | 5 | 28 |
| Dubai, Emirate | 17 | 3 | 14 | 24 | 23 | 10 | 8 |
| Mean (Desert) | 58 | 10 | 13 | 10 | 6 | 2 | 1 |
| Mean (Coastal) | 11 | 9 | 19 | 18 | 16 | 6 | 21 |
* V. C. Silt: Very coarse silt; C. Silt: coarse silt; M. Silt: Medium silt; V. F. Silt: Very fine silt.
Table 4.
The XRD mineralogical semi-quantitative percentages of deposited dust in the coastal and open desert around the Arabian Gulf.
Table 4.
The XRD mineralogical semi-quantitative percentages of deposited dust in the coastal and open desert around the Arabian Gulf.
| Sector | Area | Source | Quartz | Calcite | Dolomite | Carbonates | Feldspars | Clay | Others |
|---|---|---|---|---|---|---|---|---|---|
| Desert dust-Arabian Gulf | |||||||||
| Riyadh | Saudi | [37,38] | 68 | 32 | 0 | 32 | 0 | 0 | 0 |
| Walameen | Saudi | Present study | 62 | 13 | 0 | 13 | 24 | 1 | 0 |
| Doha | Qatar | Present study | 48 | 21 | 7 | 28 | 24 | 0 | 0 |
| Ain | Emirate | Present study | 26 | 34 | 19 | 52 | 20 | 1 | 0 |
| Desert | Kuwait | Present study | 39 | 26 | 11 | 37 | 12 | 5 | 6 |
| Coastal dust-Arabian Gulf | |||||||||
| Coastal | Kuwait | Present study | 28 | 20 | 14 | 34 | 18 | 5 | 14 |
| Ahwar | Iraq | Present study | 36 | 30 | 11 | 42 | 8 | 5 | 9 |
| Dubai | U.A.E | Present study | 21 | 25 | 21 | 45 | 6 | 0 | 27 |
| Manama | Bahrain | Present study | 32 | 25 | 16 | 41 | 10 | 3 | 15 |
| Mean (Desert) | 49 | 25 | 7 | 32 | 16 | 1 | 1 | ||
| Mean (Coastal) | 29 | 25 | 16 | 41 | 11 | 3 | 16 | ||
© 2017 by the authors. Licensee MDPI, Basel, Switzerland. This article is an open access article distributed under the terms and conditions of the Creative Commons Attribution (CC BY) license (http://creativecommons.org/licenses/by/4.0/).
Share and Cite
MDPI and ACS Style
Al-Dousari, A.; Doronzo, D.; Ahmed, M. Types, Indications and Impact Evaluation of Sand and Dust Storms Trajectories in the Arabian Gulf. Sustainability 2017, 9, 1526. https://doi.org/10.3390/su9091526
AMA Style
Al-Dousari A, Doronzo D, Ahmed M. Types, Indications and Impact Evaluation of Sand and Dust Storms Trajectories in the Arabian Gulf. Sustainability. 2017; 9(9):1526. https://doi.org/10.3390/su9091526
Chicago/Turabian StyleAl-Dousari, Ali, Domenico Doronzo, and Modi Ahmed. 2017. "Types, Indications and Impact Evaluation of Sand and Dust Storms Trajectories in the Arabian Gulf" Sustainability 9, no. 9: 1526. https://doi.org/10.3390/su9091526
Note that from the first issue of 2016, this journal uses article numbers instead of page numbers. See further details here.