Driving Force Analysis of the Temporal and Spatial Distribution of Flash Floods in Sichuan Province


1
State Key Laboratory of Hydraulic Engineering Simulation and Safety, Tianjin University, Tianjin 300072, China
2
China Institute of Water Resources and Hydropower Research, Beijing 100038, China
3
Institute of Geographical Sciences and Natural Resources Research, Chinese Academy of Sciences, Beijing 100101, China
*
Author to whom correspondence should be addressed.
Sustainability 2017, 9(9), 1527; https://doi.org/10.3390/su9091527
Submission received: 8 June 2017
/
Revised: 21 August 2017
/
Accepted: 24 August 2017
/
Published: 28 August 2017
(This article belongs to the Collection Risk Assessment and Management)
Abstract
:Flash floods are important natural disasters in China that can result in casualties and property losses. In this paper, we present a quantitative approach to examine the driving factors of the spatiotemporal distribution of flash floods based on a geographical detector. The environmental background condition (elevation, slope, etc.), precipitation, and human activity factors, as well as changes in these factors, are investigated in Sichuan Province via a driving force analysis. The results show that heavy precipitation is the most important driver, with power of determinant (PD) values of 0.71 and 0.77 for the spatial distributions of flash floods from 1995 to 2004 and from 2005 to 2014, respectively. The PDs of population density are 0.65 and 0.78 in the same two periods, while those of elevation are 0.59 and 0.73. Precipitation variability is the most important driver of the spatiotemporal variability of flash floods, followed by GDP density and population density, with PDs of 0.48, 0.29, and 0.27, respectively. The results show that human activities and precipitation are the primary driving forces of the spatiotemporal variability of flash floods and should be the focus of flash flood prevention and forecasting.
1. Introduction
China is a mountainous country, and flash floods are the primary natural disaster that causes casualties. Statistics show that the proportions of deaths caused by flash floods to those caused by all flood disasters from 2004 to 2010 were 78%, 84%, 71%, 75%, 80%, 80%, and 90%, per year respectively, with 3887 people dead or missing in 2010 [1,2]. Notably, 560 million residents are scattered throughout hilly areas of China, where flash floods are likely to cause casualties during the rainy months. Understanding the temporal-spatial patterns of flash floods and the associated driving factors can prevent flash flood-induced casualties [3].
Previous studies have indicated that a flash flood is the combined result of various spatiotemporal factors [4,5,6]. Both qualitative and quantitative methods have been applied in flash flood research. Qualitative methods have primarily focused on evaluating the risk of flash flood and danger zone division, including the main factors that affect the distribution of flash floods. These qualitative methods can provide guidance for the prevention and control of flash floods, but their results are subjective, and the accuracy of the conclusions is difficult to verify [7,8,9]. Therefore, several researchers have assigned quantitative weights to risk factors by establishing an analytical hierarchy and expert scoring methods [10,11,12]. Such methods can be used to assess the driving forces of flash flood distributions. This method can be considered a semi-quantitative method. However, qualitative and semi-quantitative methods are objective, and they are not sufficiently accurate. Quantitative methods have focused on the impact of precipitation or vegetation on flash flood occurrence in a local area, such as a small gully or a large watershed [13,14,15]. However, the temporal evolution of factors was not considered in these studies, which used static indices to reflect dynamic factors such as the population distribution, vegetation, land use, and precipitation [16,17,18,19,20]. Furthermore, the spatial heterogeneity of the factors is not considered; therefore, the factors cannot be sufficiently evaluated, and the applicability of such methods is severely limited. Since a flash flood has significant spatial and temporal characteristics, the results from only a spatial or temporal perspective will not be sufficiently objective [21,22]. Therefore, it is necessary to quantitatively assess the environmental background condition factors and the dynamic factors associated with flash floods.
In this manuscript, we applied a geographical detector based on classification and grading to quantitatively analyze the driving factors of flash floods: precipitation, environmental background conditions and human activities. The results revealed that the spatial distribution of flash flood is comprehensively affected by these factors.
2. Study Area
Sichuan Province is located in southwestern China, between 97°21′ E to 108°33′ E and 26°03′ N to 34°19′ N. The area of the province is 486,000 km2, and the population was 82.62 million at the end of 2016. The altitude of Sichuan Province varies from east to west, increasing from 220 m to 7556 m, respectively, Additionally, the landform of the province is complex and includes the Sichuan Basin (SB); low-, middle-, and high-altitude areas; and high mountain areas [23]. The SB is one of the most densely populated areas in China. Additionally, large differences in precipitation exist across Sichuan Province. The annual precipitation ranges from 1200 to 1600 mm, 900 to 1200 mm, and 500 to 900 mm in the SB, southwest, and northwest, respectively, and the maximum daily precipitation ranges from 40 to 300 mm. As shown in Figure 1, 11% of the 6000 flash floods that resulted in casualties in China occurred in Sichuan Province [24].
3. Data and Methods
3.1. Data
In 2013 to 2015, the National Flash Flood Investigation and Evaluation Project (NFFIEP) was launched to investigate the historical flash floods that occurred from 1949 to 2015 at the county level [25,26,27]. The flash flood data used in this study are from the NFFIEP dataset. The driving factors of flash floods include precipitation, environmental background conditions, and human activities, and these data are shown in Table 1.
- (1)
- The flash flood data for Sichuan Province from 1949 to 2014 were derived from the FFIEDC, and these data include the location, time, and number of casualties.
- (2)
- Small watershed (10 to 50 km2) data are from the FFIEDC.
- (3)
- A digital elevation model (DEM) was obtained from the Bureau of Surveying and Cartography (SBSC). The DEM included elevation and slope.
- (4)
- Soil type data were provided by the RESDC. The soil types included silt, sandy loam, sandy clay, loam, clay, and rock.
- (5)
- Daily precipitation data from the meteorological stations in Sichuan Province and the surrounding areas were obtained from the National Weather Service of China.
- (6)
- The GDPs for 1 km × 1 km grid population data were obtained from the RESDC. These spatially distributed data were transformed from census data based on a specialized model.
- (7)
- The fractional coverage of vegetation was calculated from the 1 km × 1 km grid MOD13A2 of NASA, as shown in Equation (2).
3.2. Methodology
3.2.1. Factor Acquisitions
Small watersheds of 10 to 50 km2 are basic management units for flash flood control planning in China and are defined in the FFIEDC [27]. In this study, Sichuan Province is divided into 30,878 small watersheds, as shown in Figure 2. The average watershed area is 15.3 km2, wherein the number of sub-basins of 0 to 10 km2 occupied 21%, those of 10 to 20 km2 occupied 52%, those of 20 to 30 km2 occupied 20%, those of 30 to 40 km2 occupied 5%, and those of 40 to 50 km2 occupied 2%. The various factors and parameters investigated in this paper, listed in Table 2, were extracted from each watershed.
(1) Flash flood intensity
The flash floods in Sichuan Province during the 20-year period of 1995 to 2014 were divided into two periods: 1995 to 2004 (D95–04) and 2005–2014 (D05–14). The flash flood points were converted into continuous raster data using Getis-Ord Gi* based on the density of points of flash flood, and the map of statistically significant hot and cold spots was detected [28]. An area weighting method was used to calculate the flash flood intensity of each small watershed [29].
The flash flood points were converted to continuous raster data using the Getis-Ord Gi* statistic (Figure 2) [29]. Using the flash flood points, a map of statistically significant hot and cold spots using the Getis-Ord Gi* statistic was retrieved. The Getis-Ord Gi* statistic evaluates the characteristics of the input feature class to produce the optimal results as a fishnet map [29].
(2) Ele and Slp
Ele and Slp are the mean values in a small watershed, which are extracted from a 1:50,000 digital elevation model with a spatial resolution of 25 m × 25 m.
(3) Soil
‘Soil’ is the soil type that accounts for the largest proportion of the total area of a small watershed.
(4) P5, P50, and P100
The precipitation characteristics that influence flash floods include the duration, intensity, and total quantity such as the sub-daily precipitation and sub-daily extremes. However, the sub-daily precipitation is not available in the study area. Daily precipitation data were obtained from the meteorological stations in Sichuan Province and the surrounding areas, and three precipitation indices were calculated for each meteorological station, as shown in Equation (1). The spatial distribution of each index was obtained using ANUSPLIN software (Australian National University, Canberra, Australia) [30]. Finally, the area weighting method was used to calculate the three precipitation indices of each small watershed:
where m is the number of years, n is the number of rainy days, is the daily precipitation on day d, and = 5, 50, or 100, which is the threshold of the ith precipitation index of daily precipitation. Pi was classified into five classes with the ‘natural breaks’ method in ArcGIS software, which are ordered from highest value to the lowest; namely, 1, 2, 3, 4, and 5.
(5) VFC (Vegetation Fractional Cover)
VFC is calculated from normalized difference vegetation index (NDVI) grid data [31], as shown in Equation (2).
where VFC is the fractional coverage of vegetation, NDVIi is the NDVI value of the ith grid, NDVImax is the largest NDVI value in the study area, and NDVImin is the smallest NDVI value in the study area.
(6) POP, Pcul, and GDP
In China, the GDP and population data are collected at the county level. The POP, Pcul, and GDP values of a small watershed are assigned the value of the county in which the watershed is located.
(7) Variation in the flash flood intensity
To analyze the effects of dynamic factors on the distribution of the flash flood intensity in different periods, the rate of change in flash flood intensity was calculated as a function of environmental and human factors, as shown in Equations (3) to (5).
is index of change in the ith small watershed:
where is the flash flood intensity of the ith small watershed in D05–14 and is the flash flood intensity of the ith small watershed in D95–04.
(8) Changes in precipitation and human activity factors
is the change in the jth precipitation index in the ith small watershed:
where is the jth precipitation index of the ith small watershed in D05–14 and is the jth precipitation index of the ith small watershed in D95–04.
is the change in the jth human activity factor in the ith small watershed:
where is the jth human activity factor of the ith small watershed in D05–14 and is the jth human activity factor of the ith small watershed in D95–04.
3.2.2. Geographical Detector-Based Assessment
The geographical detector is a new tool to test and to search for the spatial stratified heterogeneity of a variable Y, which tests the association between two variables Y and X according to the consistency of their spatial distributions (overlaying Y and X) [32,33]. The geographical detector is designed by Wang and his colleague and has been very popular in spatial analysis fields [32,33]. The geographical detector includes a factor detector and an interaction detector [32,33], the detailed description of which and the free tools can be found on the website (http://www.geodetector.org/).
(1) Factor detector
As a novel spatial analysis method, the geographical detector does not require any assumptions or restrictions with respect to explanatory and response variables. The theory of the geographical detector is that variable Y is associated with variable X if their spatial distributions are identical [32,33]. The association between Y and X is measured by the power of the determinant (PD), which is given by Equation (6) [32,33]:
where PD indicates the degree of spatially stratified heterogeneity of flash floods or how much of the flash flood distribution is accounted for by one factor. Additionally, , where PD = 0 indicates that Y is not heterogeneously stratified in space or there is no association between Y and X, and PD = 1 indicates that Y is perfectly heterogeneously stratified or Y is completely determined by X. Moreover, h = 1, …, L is the number of strata for a given factor; Nh and N are the number of units in partition h and in the whole region, respectively; and and are the variances in the flash flood intensity of partition h and the entire region, respectively.
(2) Interaction detector
The interaction detector reflects whether risk factors X1 and X2 (and more X factors) have an interactive influence on a target Y. We used geographic information system (GIS) software (ArcGIS version 10.3.1, Redlands, CA, USA) to stack the geographical layers X1 and X2 and obtained a new geographical layer E. By comparing the power of determinant (PD) values of X1, X2, and layer E, we are able to determine the influence of the interaction [32,33].
(3) Flowchart of geographical detector-based assessment
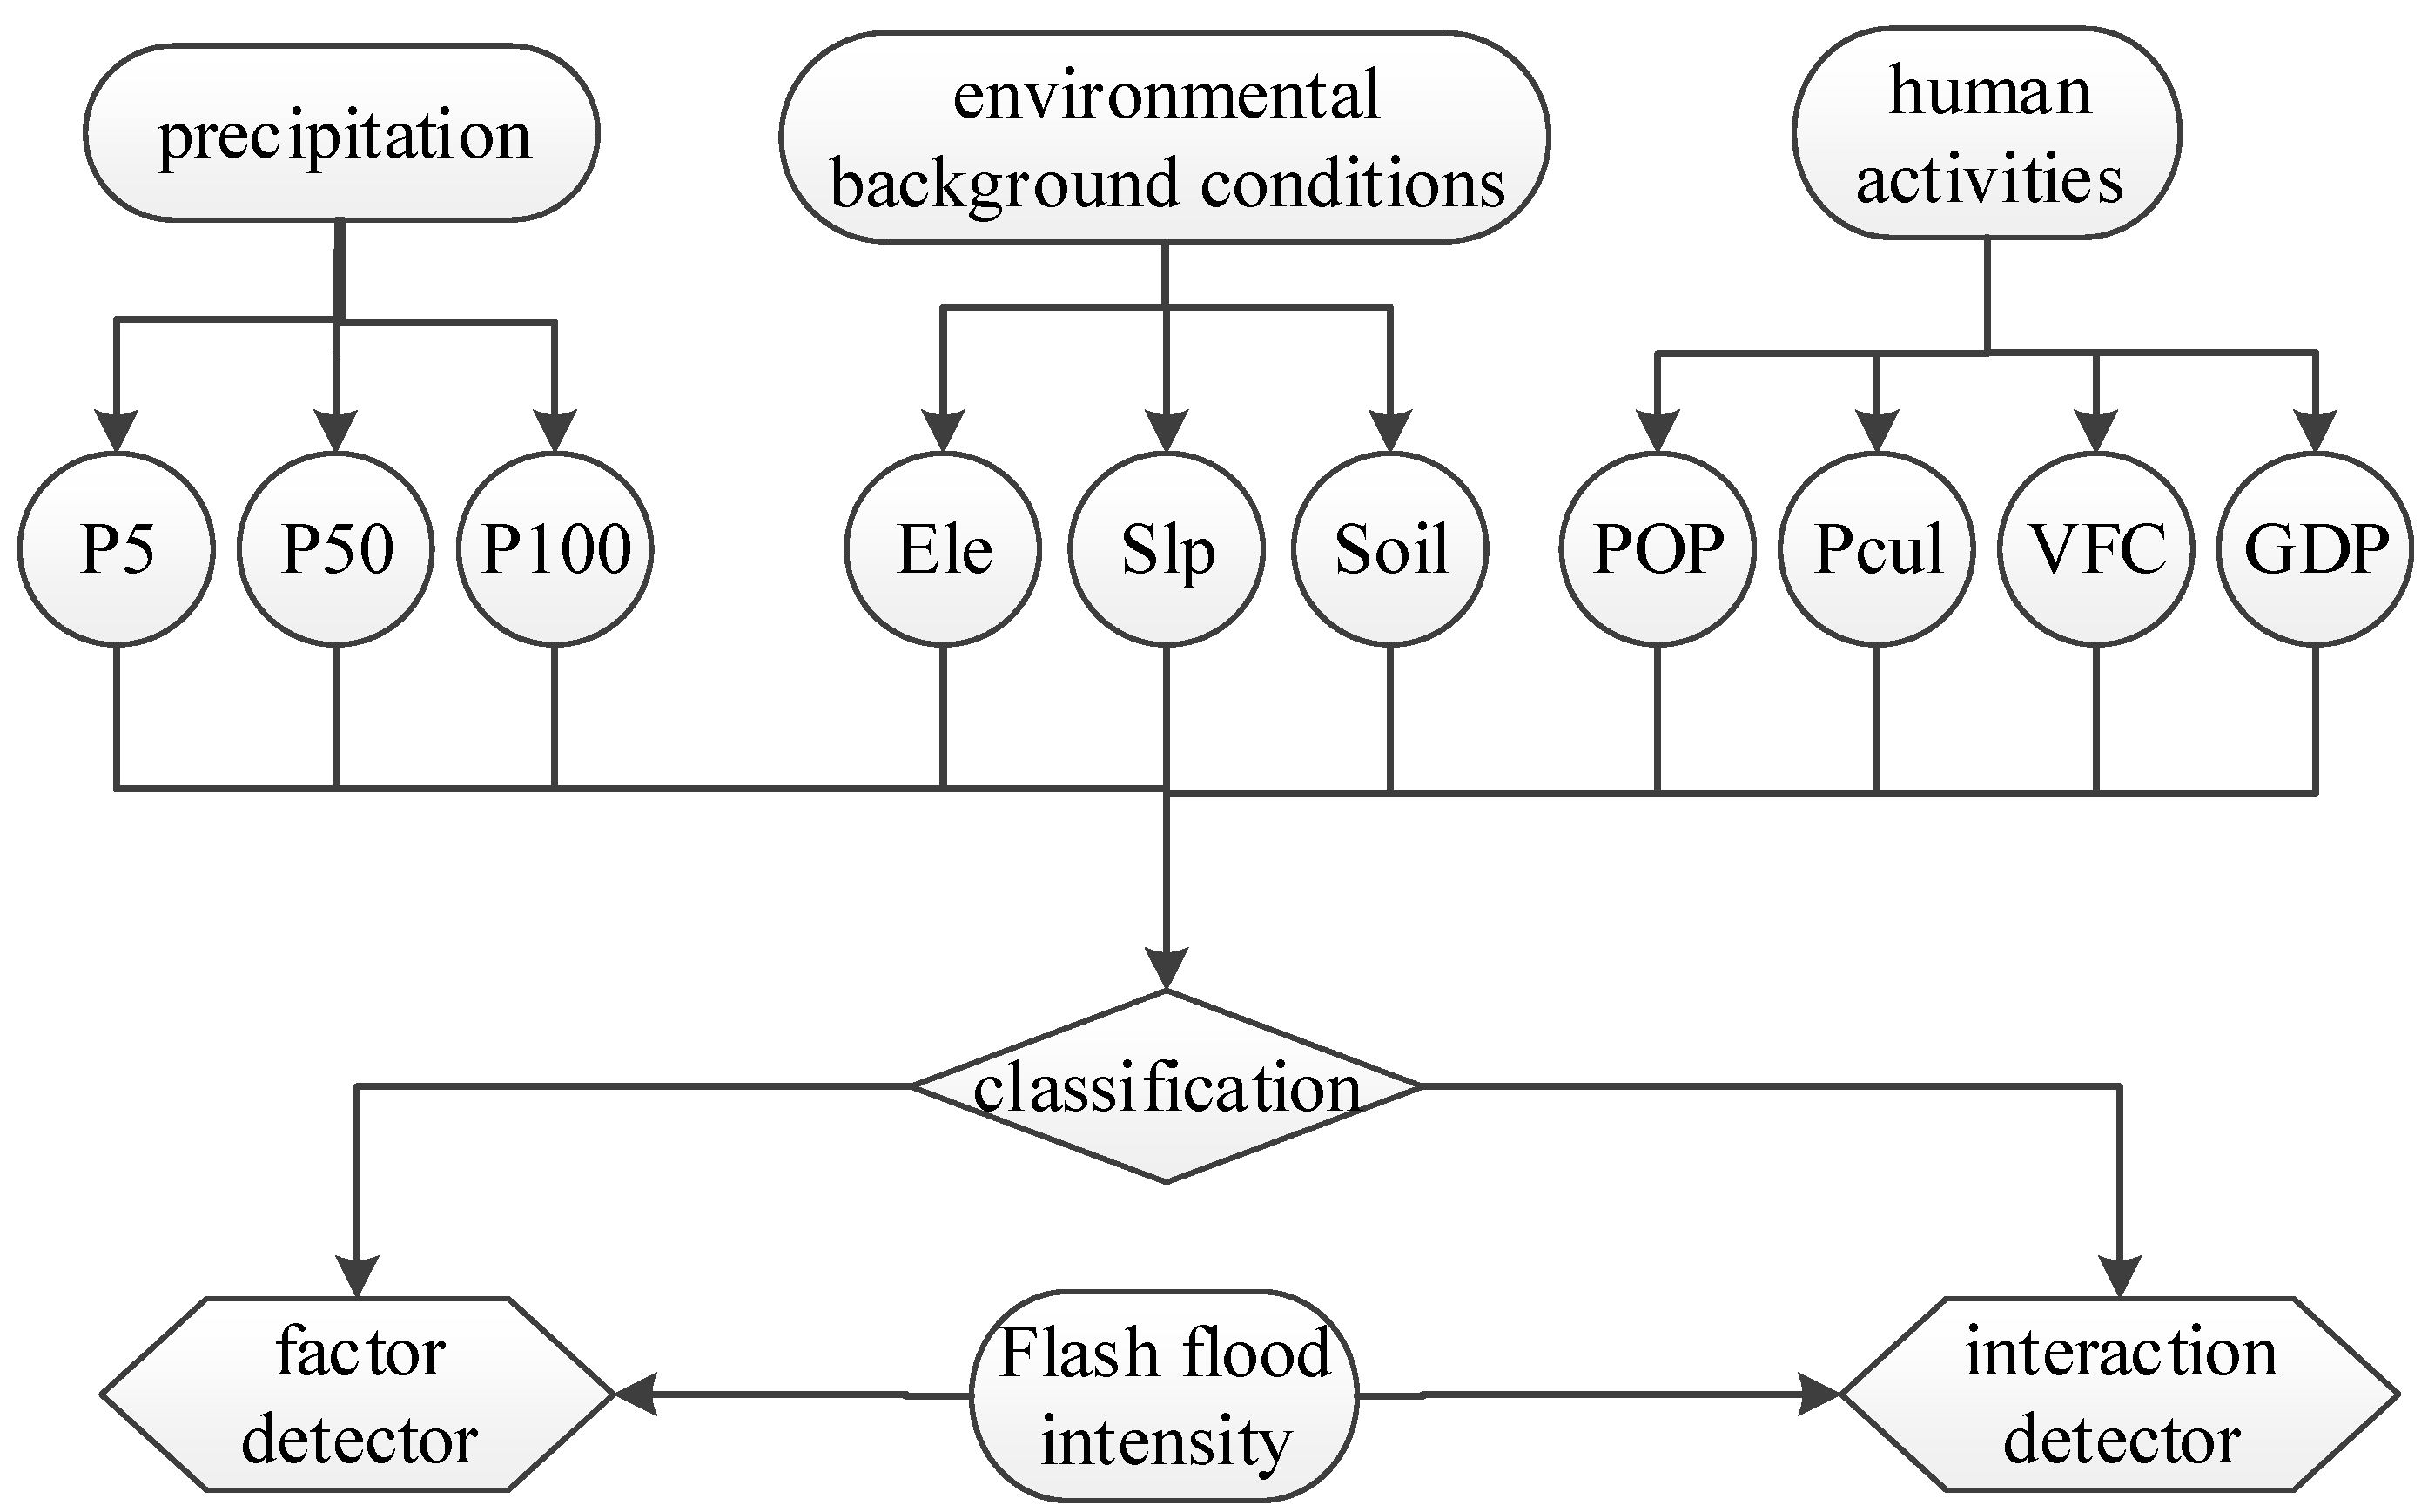
As shown in Figure 3, the continuous numerical factors are classified into several types according to industry regulations and specifications [34,35,36,37]. Next, the factor detector and interaction detector of the geographical detector method are used to calculate the PD of each factor for the distribution of the flash flood intensity and the interactions between different factors in two periods.
4. Results and Discussion
4.1. Temporal and Spatial Distribution of Flash Floods
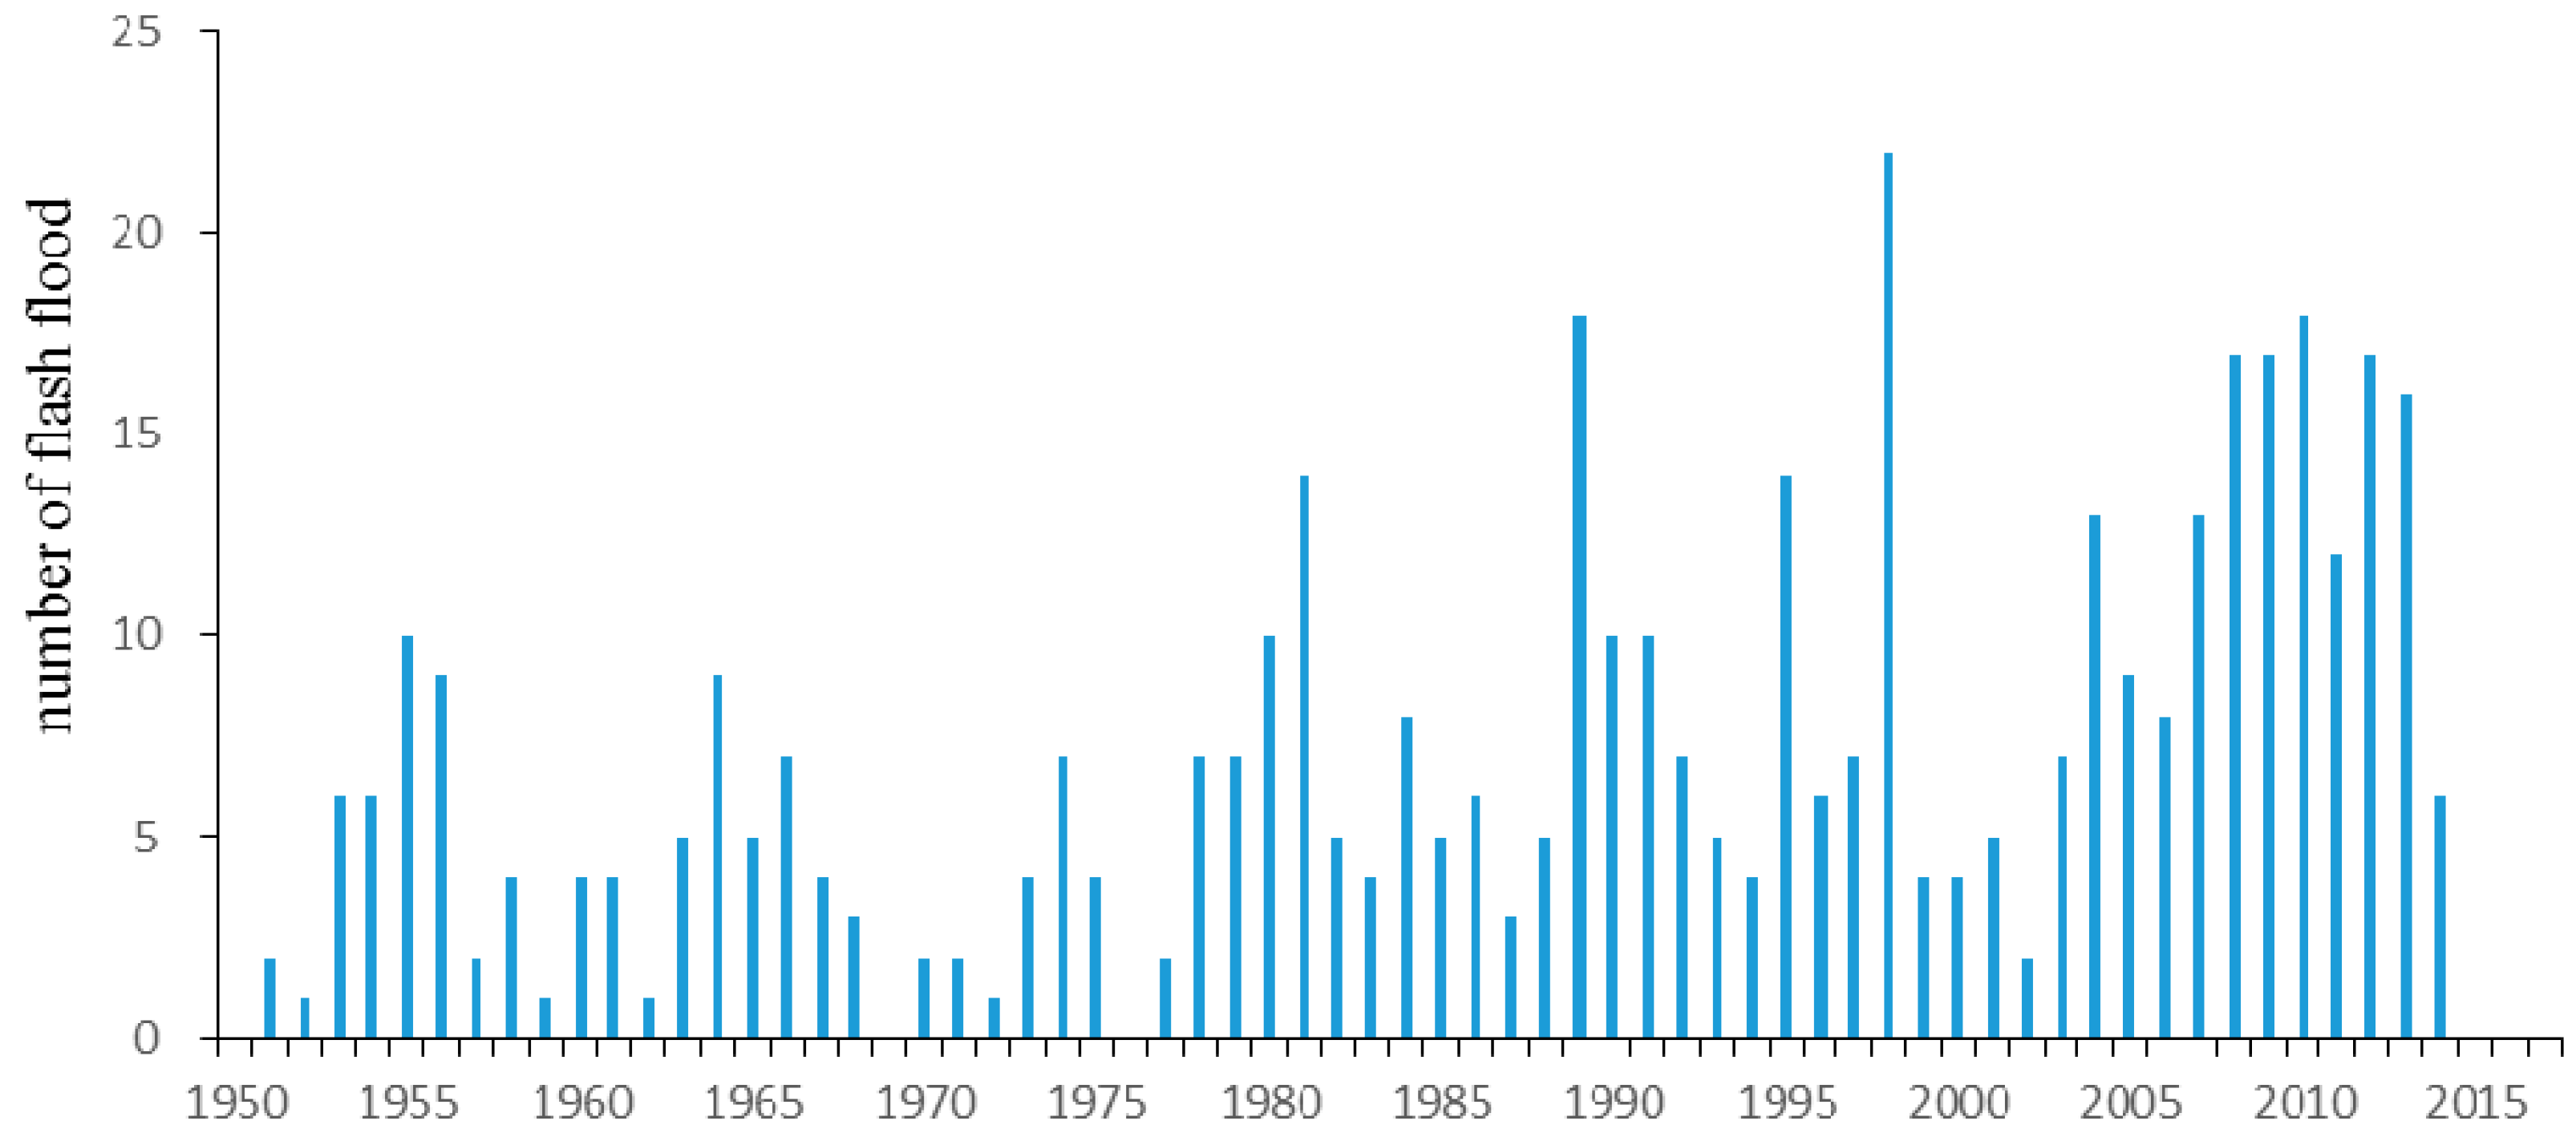
Flash floods are closely related to the population distribution in China, and 94% of flash floods occurred to the east of the population line (HU Line) [38,39], as shown in Figure 1. Figure 4 shows that flash floods in Sichuan Province are serious and exhibit considerable annual variability. The total count of flash floods that caused casualties was 450 between 1950 and 2015, and the greatest number of floods occurred in 1998, when the Yangtze River Basin flood occurred. The comparison of D95–04 and D05–14 shows that more flash floods occurred annually in Sichuan Province in D05–14 than in D95–04, the rates of which were 13.3 flash floods/year and 5.9 flash floods/year, respectively.
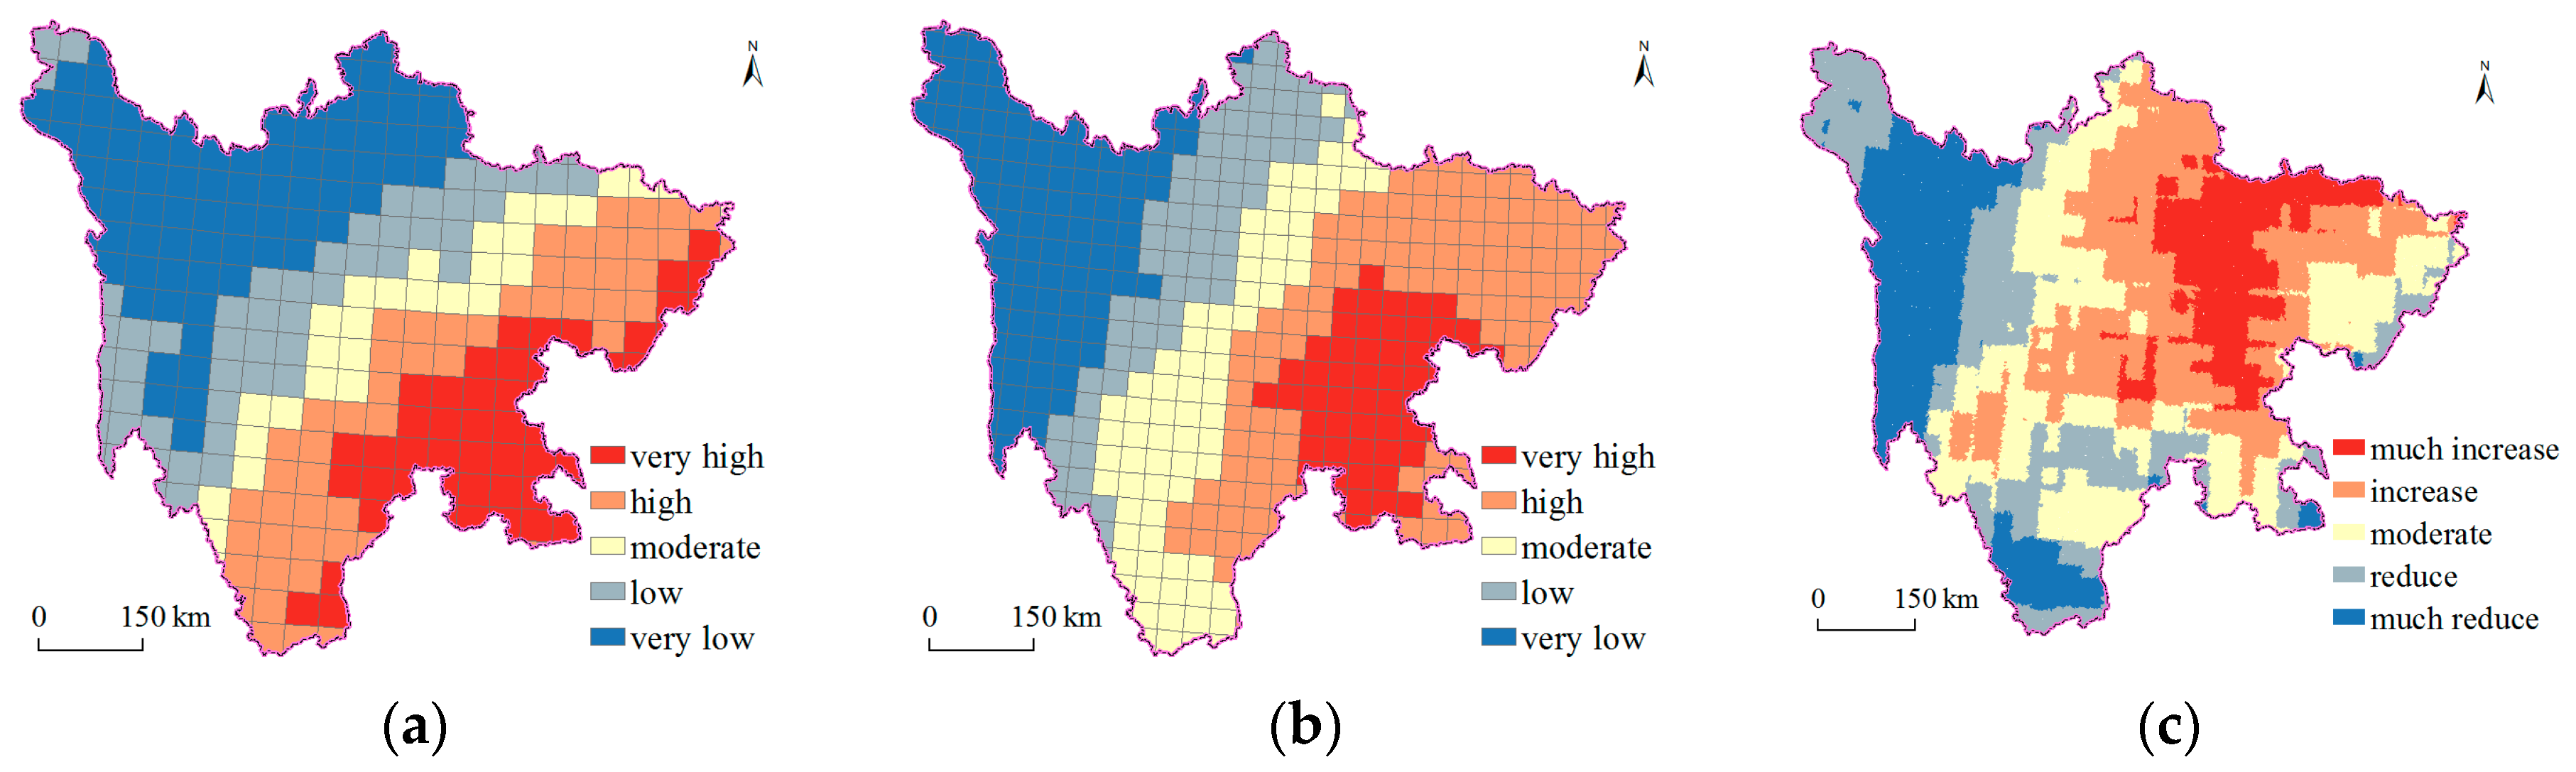
Figure 5 shows that the highest concentrations of flash floods in the two periods are linked to low hilly areas of southeastern Sichuan Province. Additionally, flash floods in D05–14 are more concentrated around the SB. Moreover, the number of flash floods has notably increased in the northeastern part of Sichuan Province.
4.2. Factor Distributions
4.2.1. Environmental Background Conditions
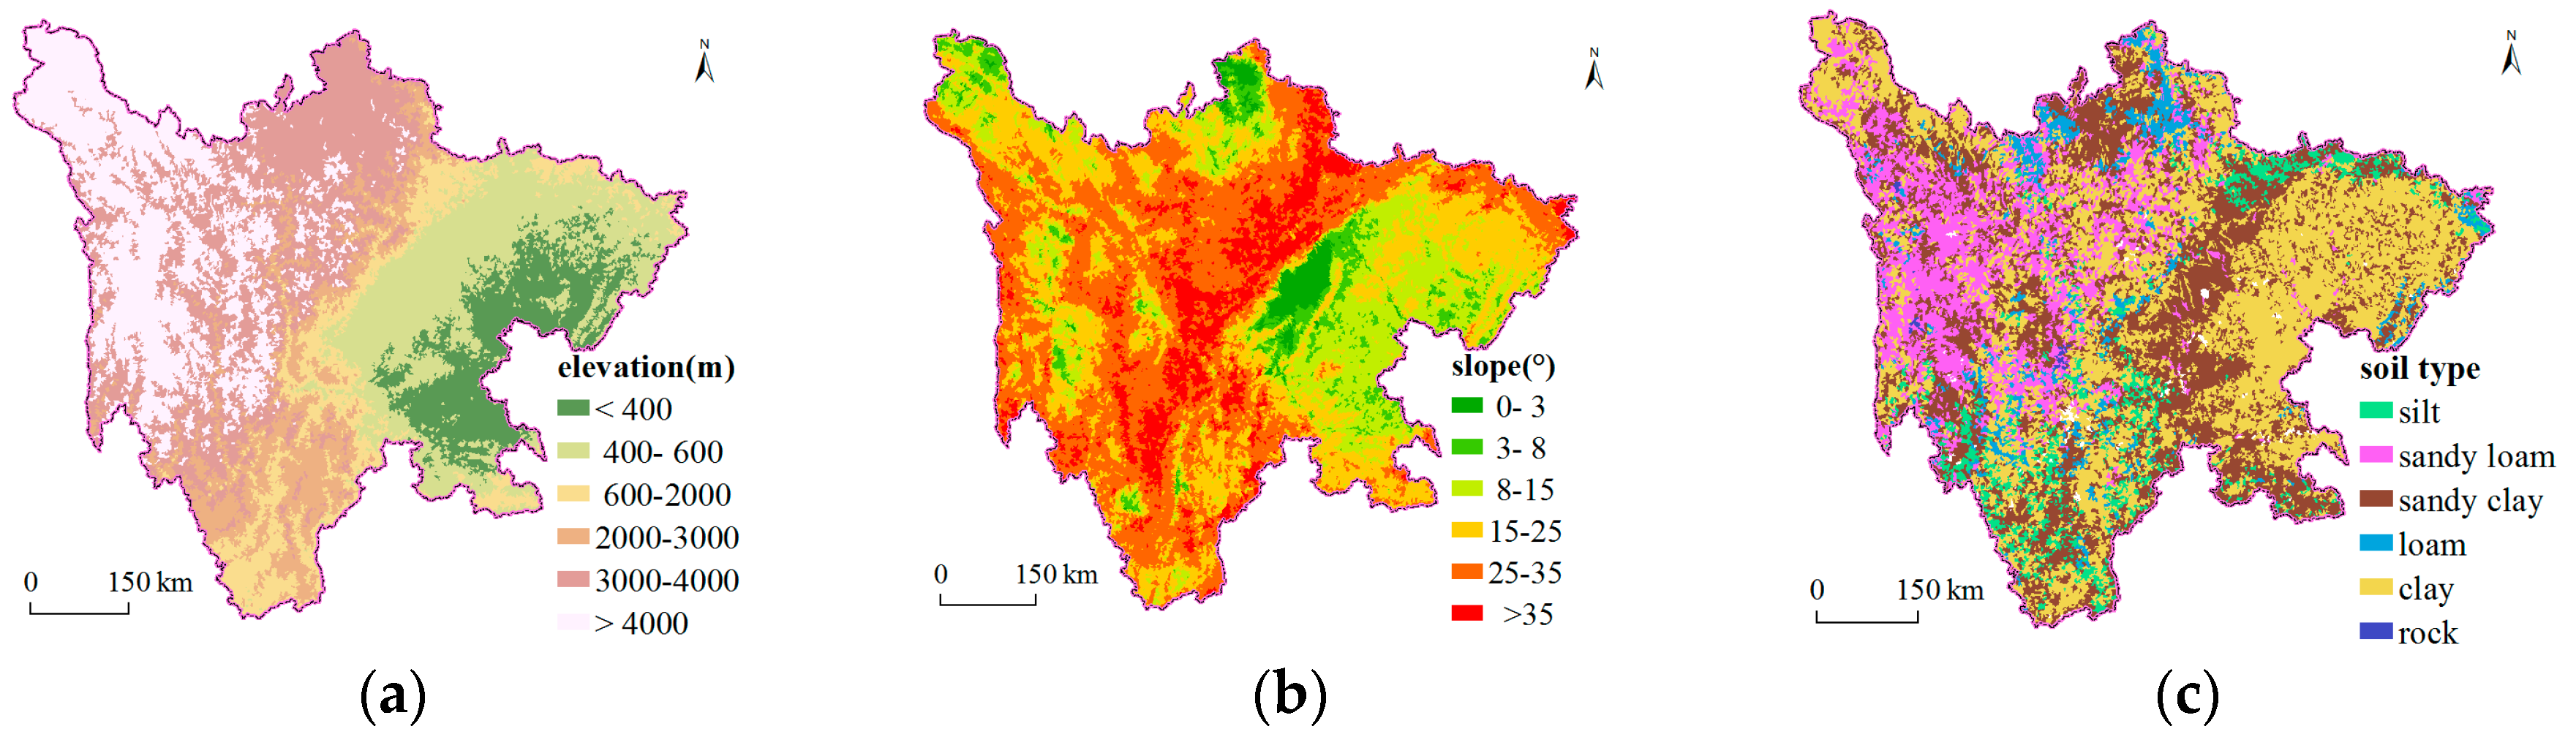
The environmental background condition factors, i.e., elevation, slope, and soil type, can be considered static factors, as shown in Figure 6. The elevation varies greatly in Sichuan Province, with moderate and low elevations in the East (SB), moderate and high elevations in the Southwest, and high mountains in the Northwest. Additionally, the East is characterized by low slopes, while the West is characterized by high slopes. The soil type is primarily clay in the East, sandy clay in the center of the province, and sandy loam in the West.
4.2.2. Precipitation
Precipitation is significant for flash floods [40]. Figure 7 shows the three precipitation factors (P5, P50, and P100) in D95–04 and D05–14 and a comparison of the two periods. During the two periods, the precipitation factors gradually decreased from Southeast to Northwest, and the high precipitation rates are expanded in D05–14. The increased areas of the three factors are concentrated in the Northeast, and the increased areas of P5 and P50 extend further northward than does P100. Similarly, the concentrated areas of the variability of flash floods from D05–14 and D95–04 are located in the northeast of Sichuan Province, which contributed to the primary increase of flash floods from D95–04 to D05–14, as shown in Figure 4.
4.2.3. Human Activity
Human activity factors, including VFC, POP, GDP, and Pcul, vary regionally, and the most concentrated areas of human activities and development are mainly located in the Southeast, especially in the SB as shown in Figure 8. The concentration of Pcul increased, indicating that agricultural activities are concentrated in low elevation areas that are suitable for agricultural cultivation. The concentration of POP decreased because densely populated areas became saturated, and the population migrated from densely populated areas to sparsely populated areas as the population grew. In addition, the GDP increased rapidly, but the spatial distribution did not significantly change, indicating that the industrial structure of the economy has not changed much. VFC decreased in the eastern and northwestern areas of the province, and the decrease in the East was broadly consistent with the cultivated area.
4.3. Risk Factors for the Spatial Distribution of Flash Floods
A risk factor analysis was performed for various factors based on the spatial distribution of flash floods in D95–04 and D05–14, as shown in Table 3. Additionally, an interaction detector analysis was performed, and the results are presented in Table 4. These findings revealed that the entire spatial distribution of flash floods is affected by environmental background conditions, precipitation, and human activities, and the highest PD value of each group was greater than 0.7.
The PD values of the three precipitation factors exhibit the following ranking: P100 > P50 > P5. These values are 0.771, 0.699, and 0.465 in D95–04 and 0.711, 0.673, and 0.582 in D05–14, respectively, indicating that heavy precipitation is the main factor that causes casualties in flash floods. During D05–14, the PD of P100 decreased from 0.771 to 0.711; however, the PD of P5 significantly increased from 0.465 to 0.582. This result indicates that, in D05–14, the daily precipitation value that causes flash floods decreased, and the vulnerability of hazard-bearing bodies increased. This transition likely occurred because the ecological system was damaged and economic activities expanded to steeper hillsides as the population increased; thus the critical value of precipitation required for flash flooding decreased.
Of the environmental background condition factors, elevation is the most important driving factor, with PDs of 0.59 and 0.73 in D95–04 and D05–14, respectively. The highest intensity of flash floods was associated with the first level of elevation classification (lower than 400 m). This elevation class mainly comprises the lower hilly area of the SB, which has the highest population density. In addition, the slope influences the distribution of flash floods, with PDs of 0.169 and 0.191 in the two periods. The highest densities of flash floods were associated with the second and third grade slopes between 6° and 25°. These slopes are mainly located in the low hilly area of the SB. Although high slope areas are more likely to produce flash floods, the population density is low in these areas, as shown in Figure 9. Additionally, these regions experience little flash flooding due to ecological protection projects such as the reforestation of formerly cultivated land, which decreases runoff generation and improves flow routing conditions. Thus these projects reduce the impacts of heavy precipitation. The soil type has lower PDs than the other two factors, with values of 0.156 and 0.197 in the two respective periods. The clay soil type is associated with the highest intensity of flash floods, and it is primarily located in farming areas with high population densities and low vegetation coverage.
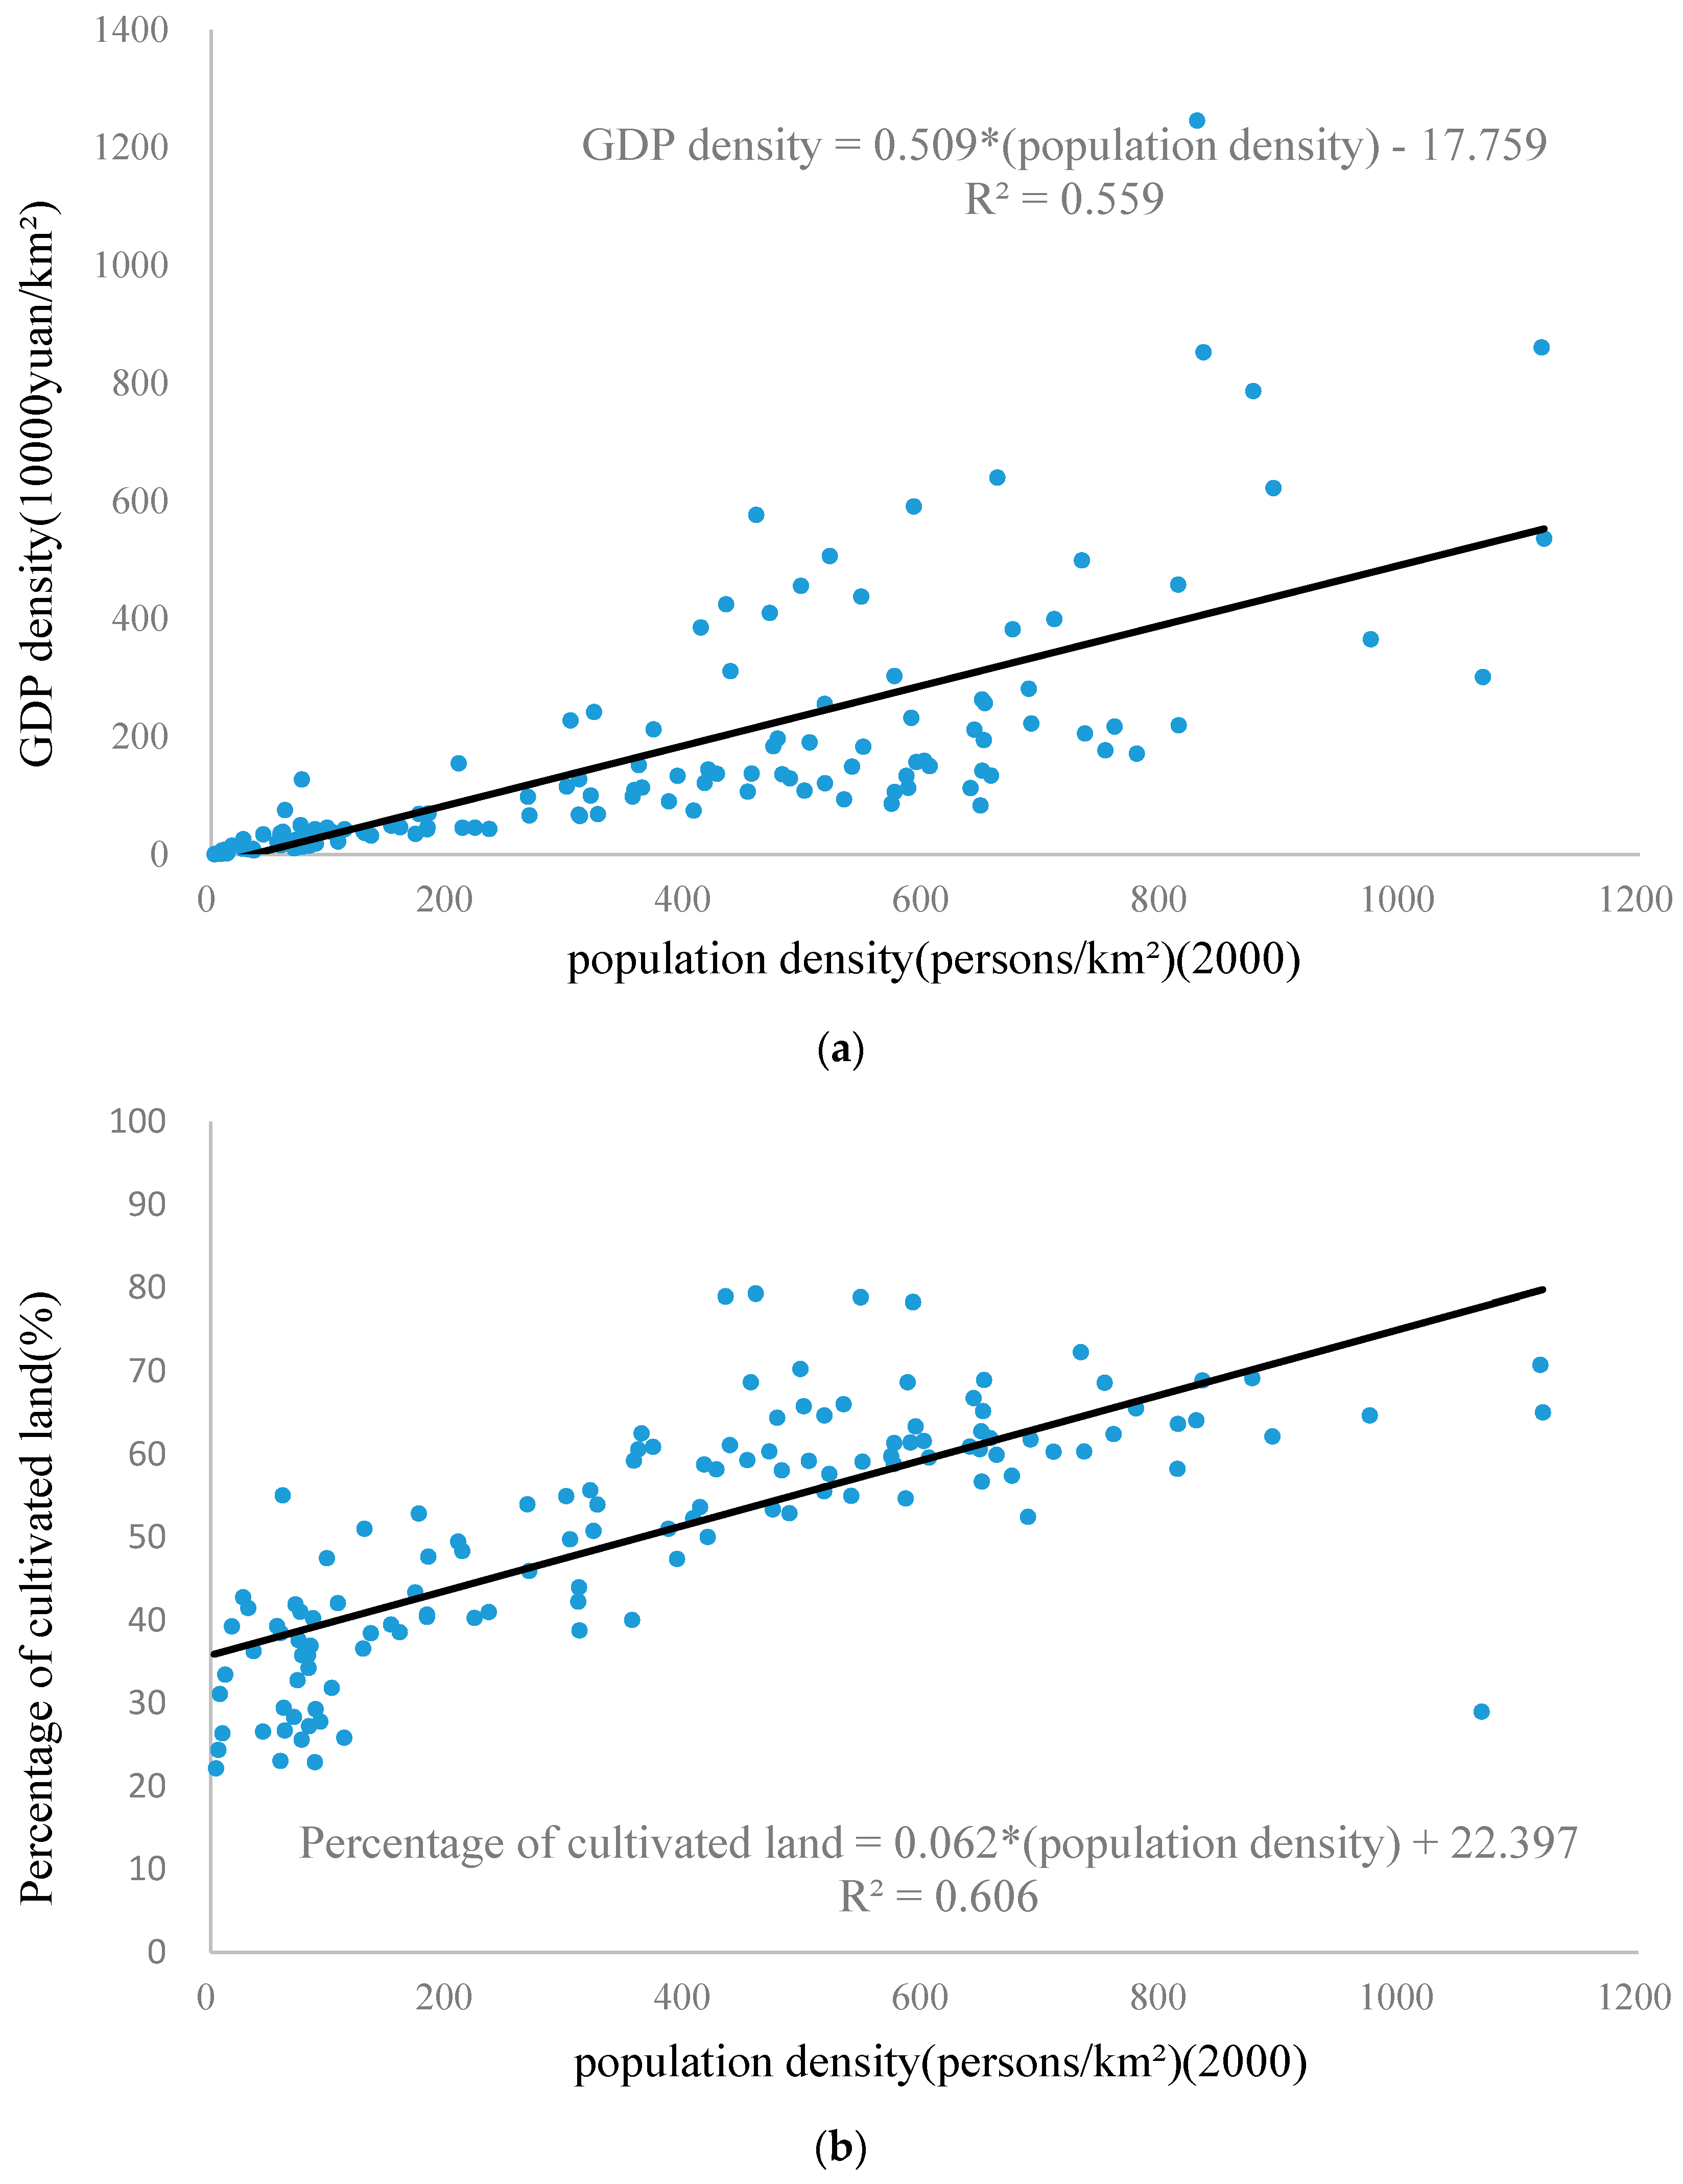
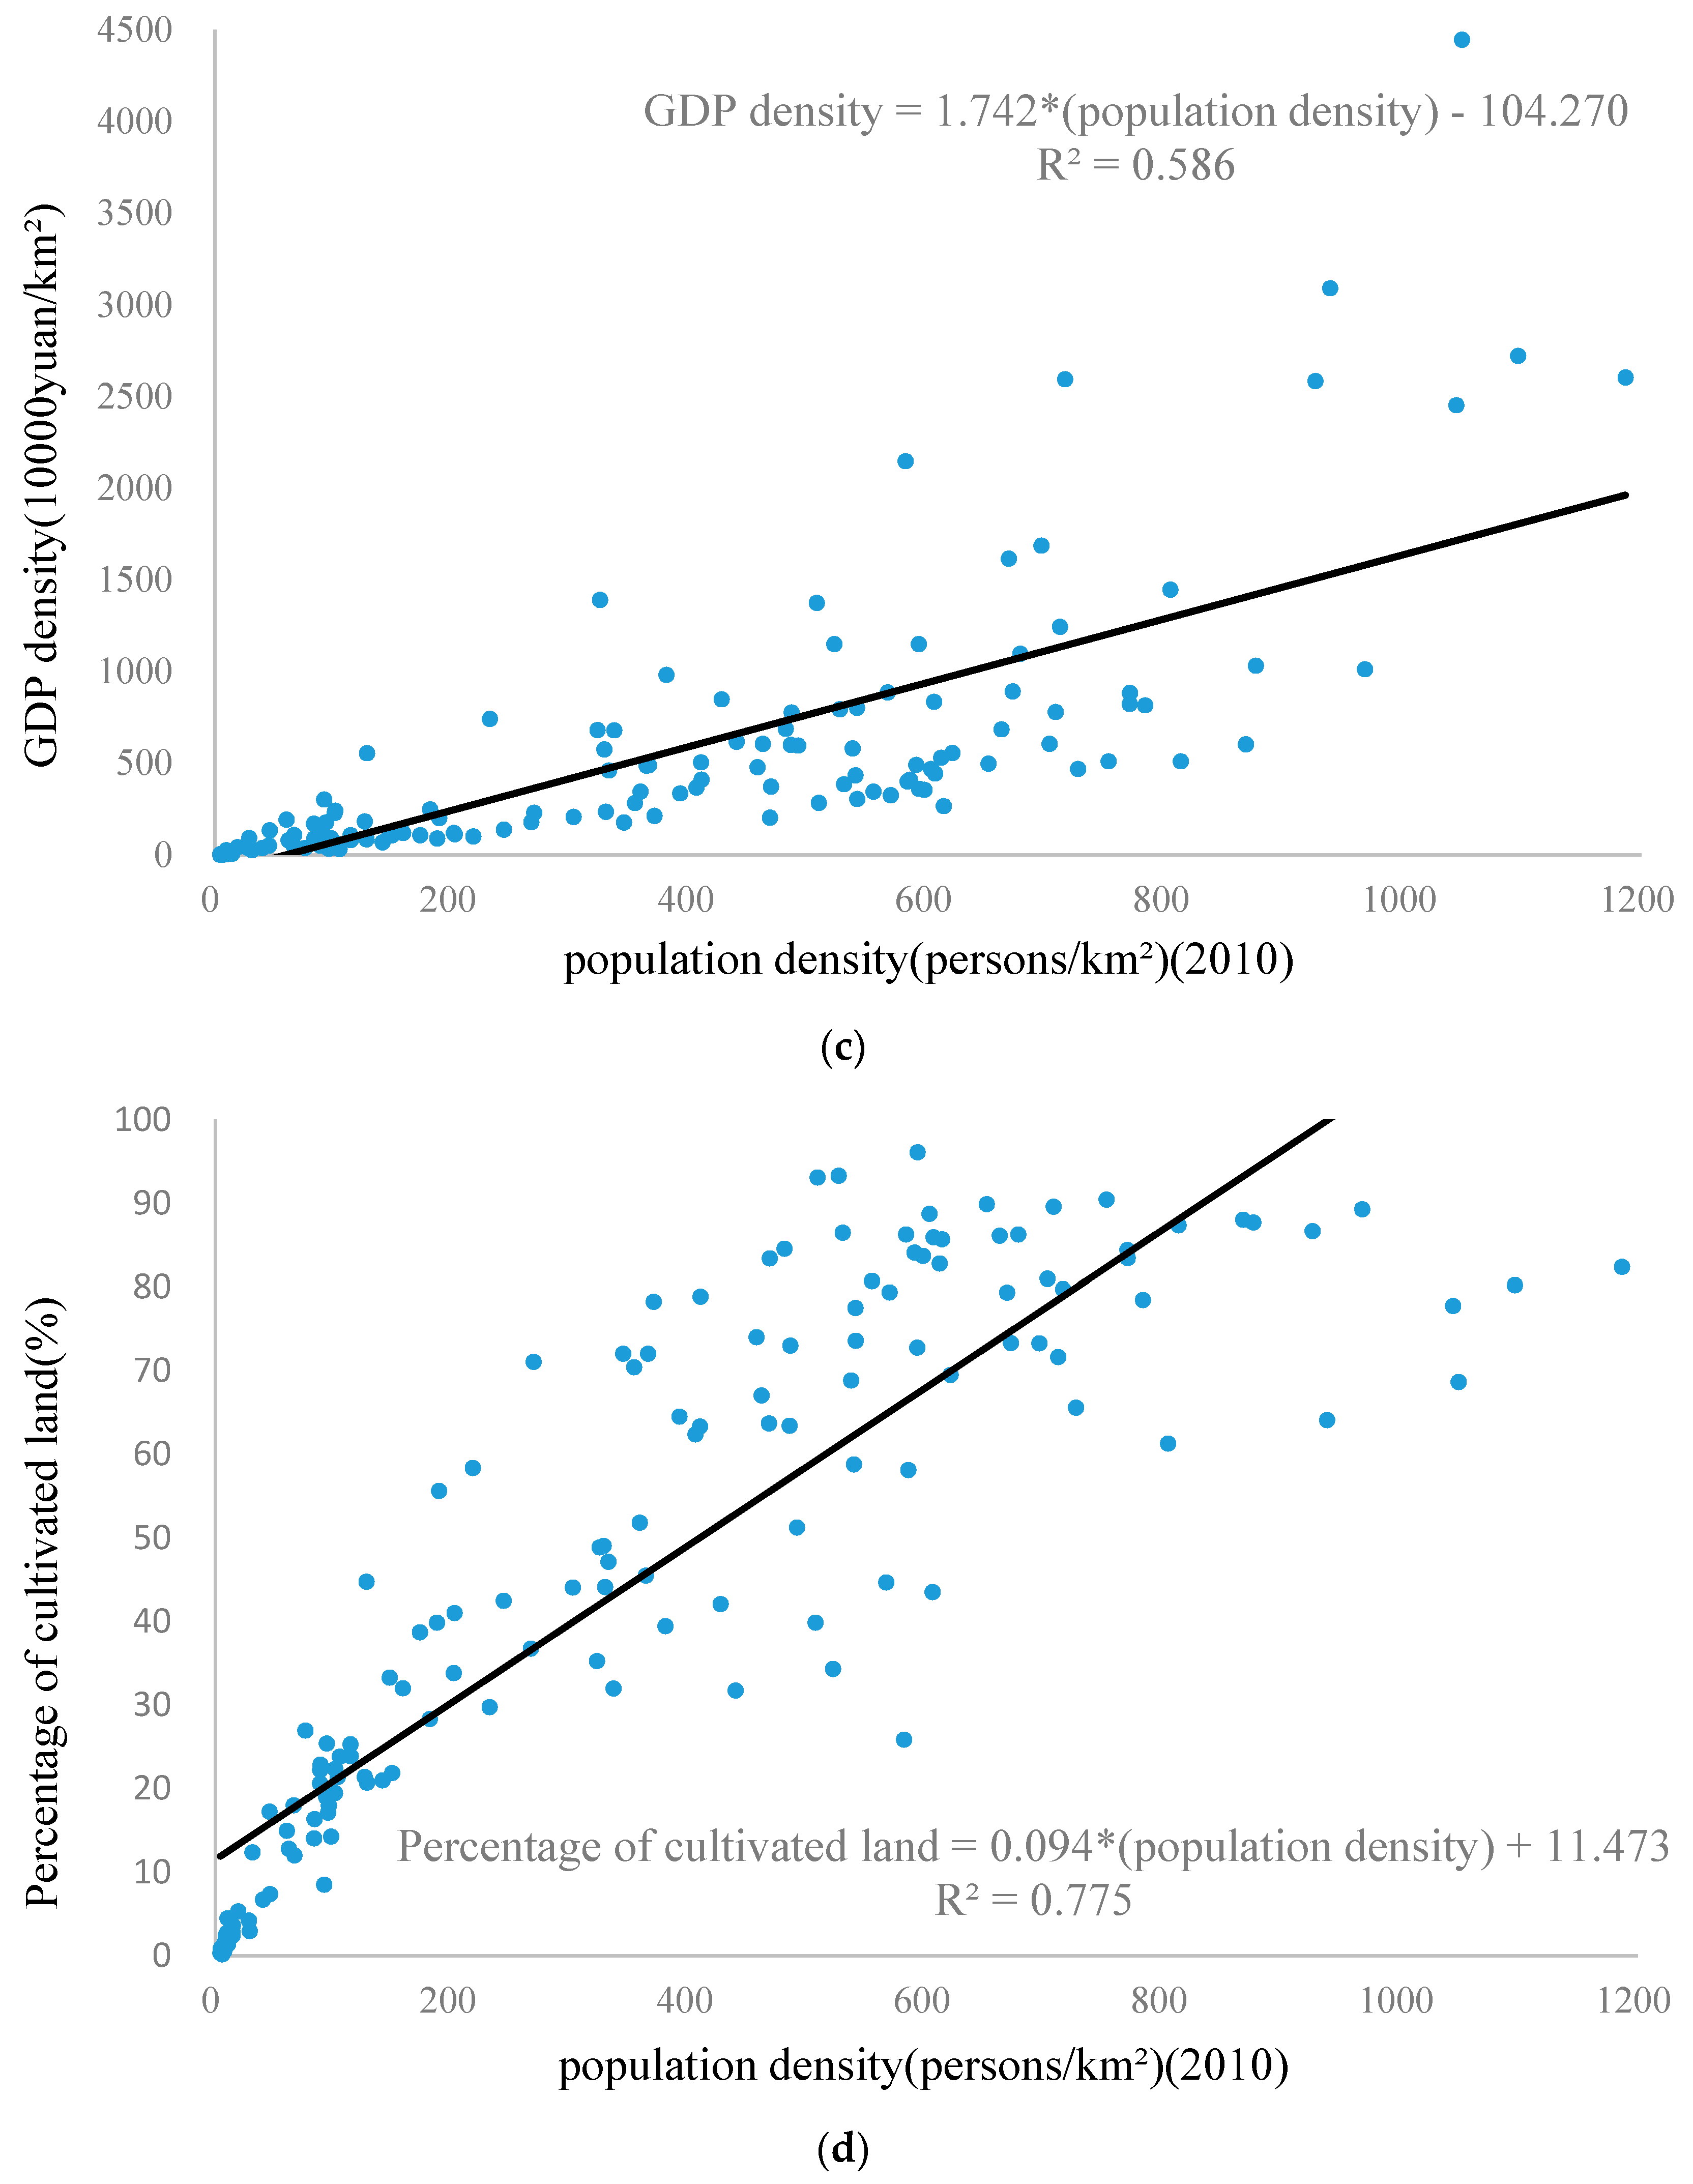
POP, Pcul, and GDP exhibit high PDs related to the distribution of flash floods, with values of 0.646, 0.565, and 0.614 in D95–04 and 0.776, 0.670, and 0.729 in D05–14, respectively. These high values are mainly tied to population growth, and there is a strong correlation between the population density, GDP density, and cultivated land density, as shown in Figure 10. Human activities are concentrated in the eastern low mountain area, which is called the ‘Heavenly Land of Plenty’ and has been a densely populated area of China throughout history. In D05–14, the PD of human activities increased, indicating that the impact of human activities on flash floods increased; therefore, human activities should be considered in flash flood prevention and control. VFC is associated with low PDs, 0.077 and 0.098 in the two respective periods, because it cannot fully reflect the influence of human activities on spatially heterogeneous vegetation cover.
4.4. Driving Forces of Temporal and Spatial Variability
The analysis of flash floods and dynamic factors showed that the PD between D95–04 and D05–14 was lower than those of the two individual periods. The driving forces of the variability in flash floods are complex because they are interconnected. The main driving factors of flash flood variability in the two periods are precipitation, with PDs of 0.483, 0.453, and 0.441 for P5, P50, and P100, respectively, and GDP and POP, which exhibited PD values of 0.293 and 0.274, respectively. The environmental background condition factors with low PDs of 0.218, 0.071, and 0.096 were Ele, Soil, and Slp, respectively. These environmental background condition factors were mainly stable in the two periods; therefore, they do not reflect the observed flash flood variability.
Table 4 shows the interaction detector analysis for the temporal and spatial variability of flash floods. The PDs of the three precipitation factors vary between 0.4 and 0.6, which are higher than those of the other factors, indicating that precipitation variability is the main driving force of the temporal and spatial variability of flash floods. The PD of P5 is close to that of P100, suggesting that the prevention and control of flash floods should focus not only on heavy precipitation but also low intensity precipitation. The interaction PDs of precipitation factors and human activity factors are greater than those of environment condition factors, as shown in Figure 11. This result occurs because disaster-bearing objects are more likely to be influenced by precipitation when human activities alter the runoff generation and flow routing conditions as the population grows.
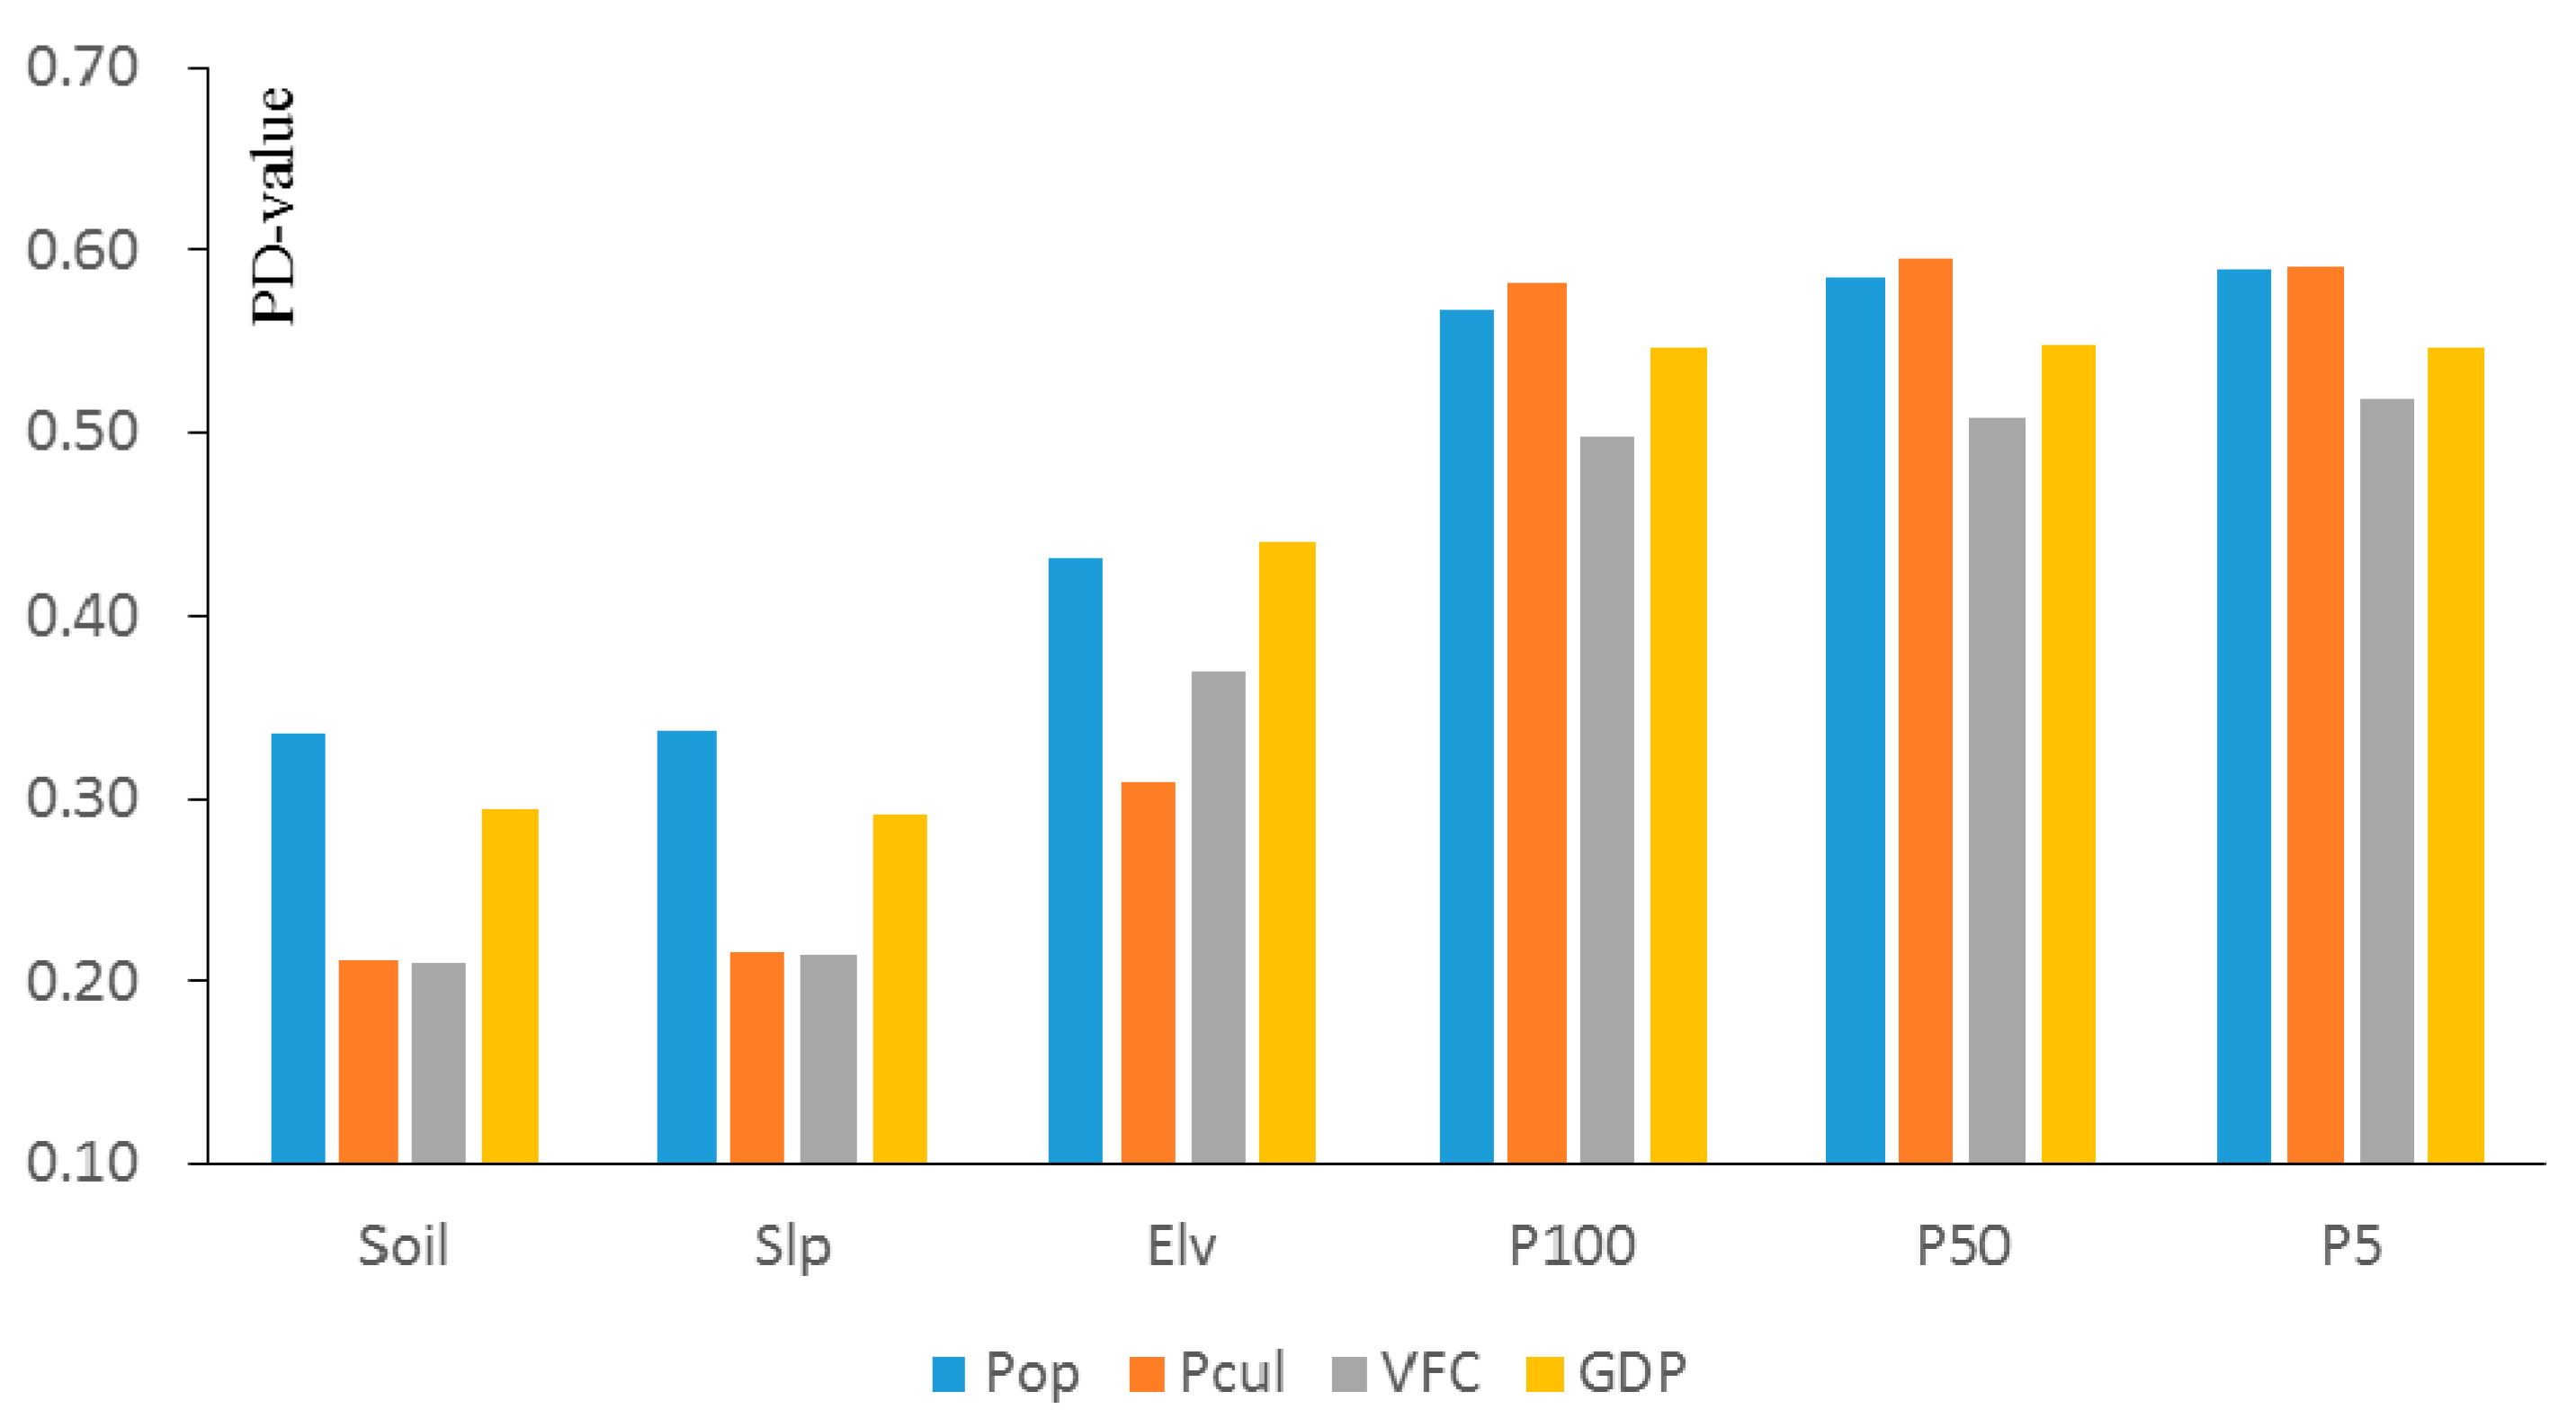
POP and GDP have obvious influences on the temporal and spatial variability of flash floods because the population is the main source of influence for disaster-prone objects. The interaction PDs of human activities factors and precipitation factors are greater than 0.5, and the precipitation factors exhibit the following ranking: P5 > P50 > P100. The PD of the human activity factors decreases as the precipitation factors increase, as shown in Figure 12, which indicates that the probability of casualties caused by low intensity precipitation increases as human activities intensify. Therefore, these dynamic changes must be considered in early warning indicators of flash floods.
5. Conclusions
In this paper, we present a quantitative approach to examine the driving factors of the spatiotemporal variability of flash floods based on a geographical detector model. The quantitative analysis of two periods from 1995 to 2004 and from 2005 to 2014 shows that heavy precipitation is the primary driving factor of the spatial distribution of flash floods. The PDs of heavy precipitation in these two periods are 0.771 and 0.711, respectively. The PDs of elevation in the two periods are 0.593 and 0.734, respectively, and the PDs of population density are 0.646 and 0.776, respectively. The analysis shows that the influence of daily precipitation on flash floods decreased from 2005 to 2014, and the effect of human activities on the spatial distribution of flash floods increased in the same period. The analysis of the temporal and spatial variability of flash floods during the two periods shows that precipitation is the main factor that causes temporal and spatial variability. The PDs of daily precipitation factors P5, P50, and P100 are 0.483, 0.453, and 0.441, respectively. The PDs of the human activities factors are clearly higher than those of the environmental background condition factors, with population density growth rate and GDP density growth rate PDs of 0.293 and 0.274, respectively. The changes in human activities, population density, vegetation cover, economic layout, and other conditions have exacerbated the fragility of the environment and influenced the spatial distribution of flash floods, thereby lowering the critical value of precipitation associated with casualties.
A quantitative method is established to perform a driving factor analysis of the temporal and spatial distributions of flash floods. The method is more objective than the existing qualitative methods. Based on the results of this manuscript, the most important measure is early warning prior to heavy precipitation events. Additionally, we should attempt to reduce the environmental vulnerability caused by the destruction of vegetation and population growth to effectively prevent and control flash floods.
Acknowledgments
This study was supported by the National Key R&D Program of China (No. 2017YFC0405601), the National Key Research and Development Program of China (Grant No. 2017YFB0503005), the Fund for Key Research Area Innovation Groups of China of the Ministry of Science and Technology (No. 2014RA4031), the Science Fund for Creative Research Groups of the National Natural Science Foundation of China (No. 51621092), and the Program of Introducing Talents of Discipline to Universities (No. B14012).
Author Contributions
Y.L. and X.Y. conceived and designed the study; L.G. and X.Z. collected and analyzed the data; Y.H. contributed analysis tools; Y.L. and Y.H wrote the paper.
Conflicts of Interest
The authors declare no conflicts of interest.
References
- Zhang, Z. Characters of flash floods in China and prevention methods. China Water Resour. 2007, 14, 14–15. [Google Scholar]
- Yuan, X.; Liu, Y.; Huang, Y.; Tian, F. An approach to quality validation of large-scale data from the Chinese Flash Flood Survey and Evaluation (CFFSE). Nat. Hazards 2017, 2, 1–12. [Google Scholar] [CrossRef]
- Cui, P.; Zou, Q. Theory and method of risk assessment and risk management of debris flows and flash floods. Prog. Geogr. 2016, 35, 137–147. [Google Scholar] [CrossRef]
- Bajabaa, S.; Masoud, M.; Al-Amri, N. Flash flood hazard mapping based on quantitative hydrology, geomorphology and GIS techniques (case study of Wadi Al Lith, Saudi Arabia). Arab. J. Geosci. 2014, 7, 2469–2481. [Google Scholar] [CrossRef]
- Shi, P.; Lv, L.; Wang, M.; Wang, J.A.; Chen, W.F. Disaster system: Disaster cluster, disaster chain and disaster compound. J. Nat. Dis. 2014, 23, 1–12. [Google Scholar]
- Zhong, D.; Xie, H.; Wei, F. Discussion on mountain hazards chain. J. Mt. Sci. 2013, 31, 314–326. [Google Scholar]
- Chuan, T.; Jing, Z. A GIS based regional torrent risk zonation. Acta Geogr. Sinica 2005, 60, 87–94. [Google Scholar]
- Du, J.; Ren, H.; Zhang, P.; Zhang, C. Comparative study of the hazard assessment of mountain torrent disasters in macro scale. J. Catastrophol. 2016, 31, 66–72. [Google Scholar]
- Guihua, L.; Ling, Z.; Zhiyong, W.; Hai, H. Zoning of mountain torrent hazards in medium-small river basions. Earth Sci. J. China Univ. Geosci. 2014, 39, 1438–1444. [Google Scholar]
- Zhao, G.; Pang, B.; Xu, Z.; Wang, Z.; Shi, R. Assessment on the hazard of flash flood disasters in China. J. Hydraul. Eng. 2016, 47, 1133–1142. [Google Scholar]
- Terti, G.; Ruin, I.; Anquetin, S.; Gourley, J.J. Dynamic vulnerability factors for impact-based flash flood prediction. Nat. Hazards 2015, 79, 1481–1497. [Google Scholar] [CrossRef]
- Rodgers, W.N. Land Cover Change and Its Impacts on a Flash Flood-Producing Rain Event in Eastern Kentucky. Master’s Thesis, Western Kentucky University, Bowling Green, KY, USA, 2014. [Google Scholar]
- Huang, G.; Chen, Z. Research on critical rainfall of mountain torrent disasters based on effective antecedent rainfall. J. Nat. Dis. 2014, 23, 192–197. [Google Scholar]
- Tao, Y.; Tang, C. Influence of human activity and precipitation change on middle-long term evolution of landslide and debris flow disasters. Plateau Meteorol. 2012, 31, 1454–1460. [Google Scholar]
- Blöschl, G.; Ardoin-Bardin, S.; Bonell, M.; Dorninger, M.; Goodrich, D.; Gutknecht, D.; Matamoros, D.; Merz, B.; Shand, P.; Szolgay, J. At what scales do climate variability and land cover change impact on flooding and low flows? Hydrol. Process. 2007, 21, 1241–1247. [Google Scholar] [CrossRef]
- Zhao, S. A Preliminary Study on the Spatial and Temporal Scales of Natural Disaster Risk Analysis. J. Catastrophol. 2012, 27, 1–6. [Google Scholar]
- Pollak, D.A. Flash Floods: A Spatial and Temporal Analysis A Case Study of the Flash Floods in Southwestern Missouri. In Proceedings of the AGU Fall Meeting, San Francisco, CA, USA, 14–18 December 2009. [Google Scholar]
- Chen, G.; Xie, P.; Xiong, L. Spatial and Temporal Prediction of Flash Floods in Ungauged Area Based on GIS. In Advances in Water Resources and Hydraulic Engineering; Springer: Berlin/Heidelberg, Germany, 2009; pp. 1219–1227. [Google Scholar]
- Tramblay, Y.; Bouvier, C.; Crespy, A.; Arthur, M. Improvement of flash flood modelling using spatial patterns of precipitation: A case study in southern France. Ecology 2010, 92, 1936–1947. [Google Scholar]
- Vennari, C.; Parise, M.; Santangelo, N.; Santo, A. A database on flash flood events in Campania, southern Italy, with an evaluation of their spatial and temporal distribution. Nat. Hazards Earth Syst. 2016, 16, 2485–2500. [Google Scholar] [CrossRef]
- Cui, P. Progress and prospects in research on mountain hazards in China. Prog. Geogr. 2014, 33, 145–152. [Google Scholar]
- Billi, P.; Alemu, Y.T.; Ciampalini, R. Increased frequency of flash floods in Dire Dawa, Ethiopia: Change in precipitation intensity or human impact? Nat. Hazards 2015, 76, 1373–1394. [Google Scholar] [CrossRef]
- Fan, J.; Zhang, Z.; Li, L. Mountain demarcation and mountainous area divisions of Sichuan Province. Goegr. Res. 2015, 34, 65–73. [Google Scholar]
- National flood prevention and Control Project Group. The Report for National Flash Flood Investigation and Evaluation Project; National Flash Flood Disaster Project Group: Beijing, China, 2016. [Google Scholar]
- Guo, L.; Liu, C.J.; Ding, L.Q.; Sun, D.Y. Working plan for mountain flood investigation and evaluation in China. China Water Resour. 2012, 23, 10–12. [Google Scholar]
- Huang, X.L.; Chu, M.H.; Shi, J.S. Analysis on flash flood investigation and assessment in China. China Water Resour. 2015, 9, 17–18. [Google Scholar]
- Sun, D.; Zhang, D.; Cheng, X. Framework of national non-structural measures for flash flood disaster prevention in China. Water 2012, 4, 272–282. [Google Scholar] [CrossRef]
- Ord, J.K.; Getis, A. Local Spatial Autocorrelation Statistics: Distributional Issues and an Application. Geogr. Anal. 1995, 27, 286–306. [Google Scholar] [CrossRef]
- Li, H.W.; Wang, Q. Study on precipitation index selection for hazard analysis of mountain torrents disaster of small watersheds. J. Geo-Inf. Sci. 2017, 19, 425–435. [Google Scholar]
- Michael, F.H.; Xu, T.B. Anusplin Version 4.4 User Guide; The Australian National University, Fenner School of Environment and Society: Canberra, Australia, 2013. [Google Scholar]
- Quarmby, N.A.; Townshend, J.R.G.; Settle, J.J.; White, K.H.; Milnes, M.; Hindle, T.L.; Silleos, N. Linear mixture modelling applied to AVHRR data for crop area estimation. Int. J. Remote Sens. 1992, 13, 415–425. [Google Scholar] [CrossRef]
- Wang, J.F.; Li, X.H.; Christakos, G.; Liao, Y.L.; Zhang, T.; Gu, X.; Zheng, X.Y. Geographical detectors-based health risk assessment and its application in the neural tube defects study of the Heshun region, China. Int. J. Geogr. Inf. Sci. 2010, 24, 107–127. [Google Scholar] [CrossRef]
- Wang, J.F.; Zhang, T.L.; Fu, B.J. A measure of spatial stratified heterogeneity. Ecol. Indic. 2016, 67, 250–256. [Google Scholar] [CrossRef]
- Qiao, L.; Li, Y.X.; Fu, J.L. Grade of Precipitation, GB/T 28592–2012; Standards Press of China: Beijing, China, 2012. [Google Scholar]
- Guo, T.F. Comprehensive Control of Soil and Water Conservation-General Rule of Planning, GB/T 15772–2008; Standards Press of China: Beijing, China, 2009. [Google Scholar]
- Institute of Geography, Chinese Academy of Science (Ed.) 1:100000000 Geomorphological Mapping Specification (Trial); Science Press: Beijing, China, 1987; pp. 1–44. [Google Scholar]
- Liu, Y.; Yang, R. The spatial characteristics and formation mechanism of the county urbanization in China. Acta Geogr. Sinica 2012, 67, 1011–1020. [Google Scholar]
- Li, J.; Lu, D.; Xu, C.; Li, Y.; Chen, M. Spatial heterogeneity and its changes of population on the two sides of Hu Line. Acta Geogr. Sinica 2017, 1, 148–160. [Google Scholar]
- Du, J.; Ding, W.F.; Ren, H. Relationships between different types of flash flood disasters and their main impact factors in the Sichuan Province. Resour. Environ. Yangtzw Basin 2015, 24, 1977–1983. [Google Scholar]
- Cui, Y.; Kong, J.; Tian, S. The critical role for heavy rainfall in the evolution of the mountain hazards chains. J. Mt. Sci. 2011, 29, 87–94. [Google Scholar]
Figure 1.
Study area and historical flash floods.
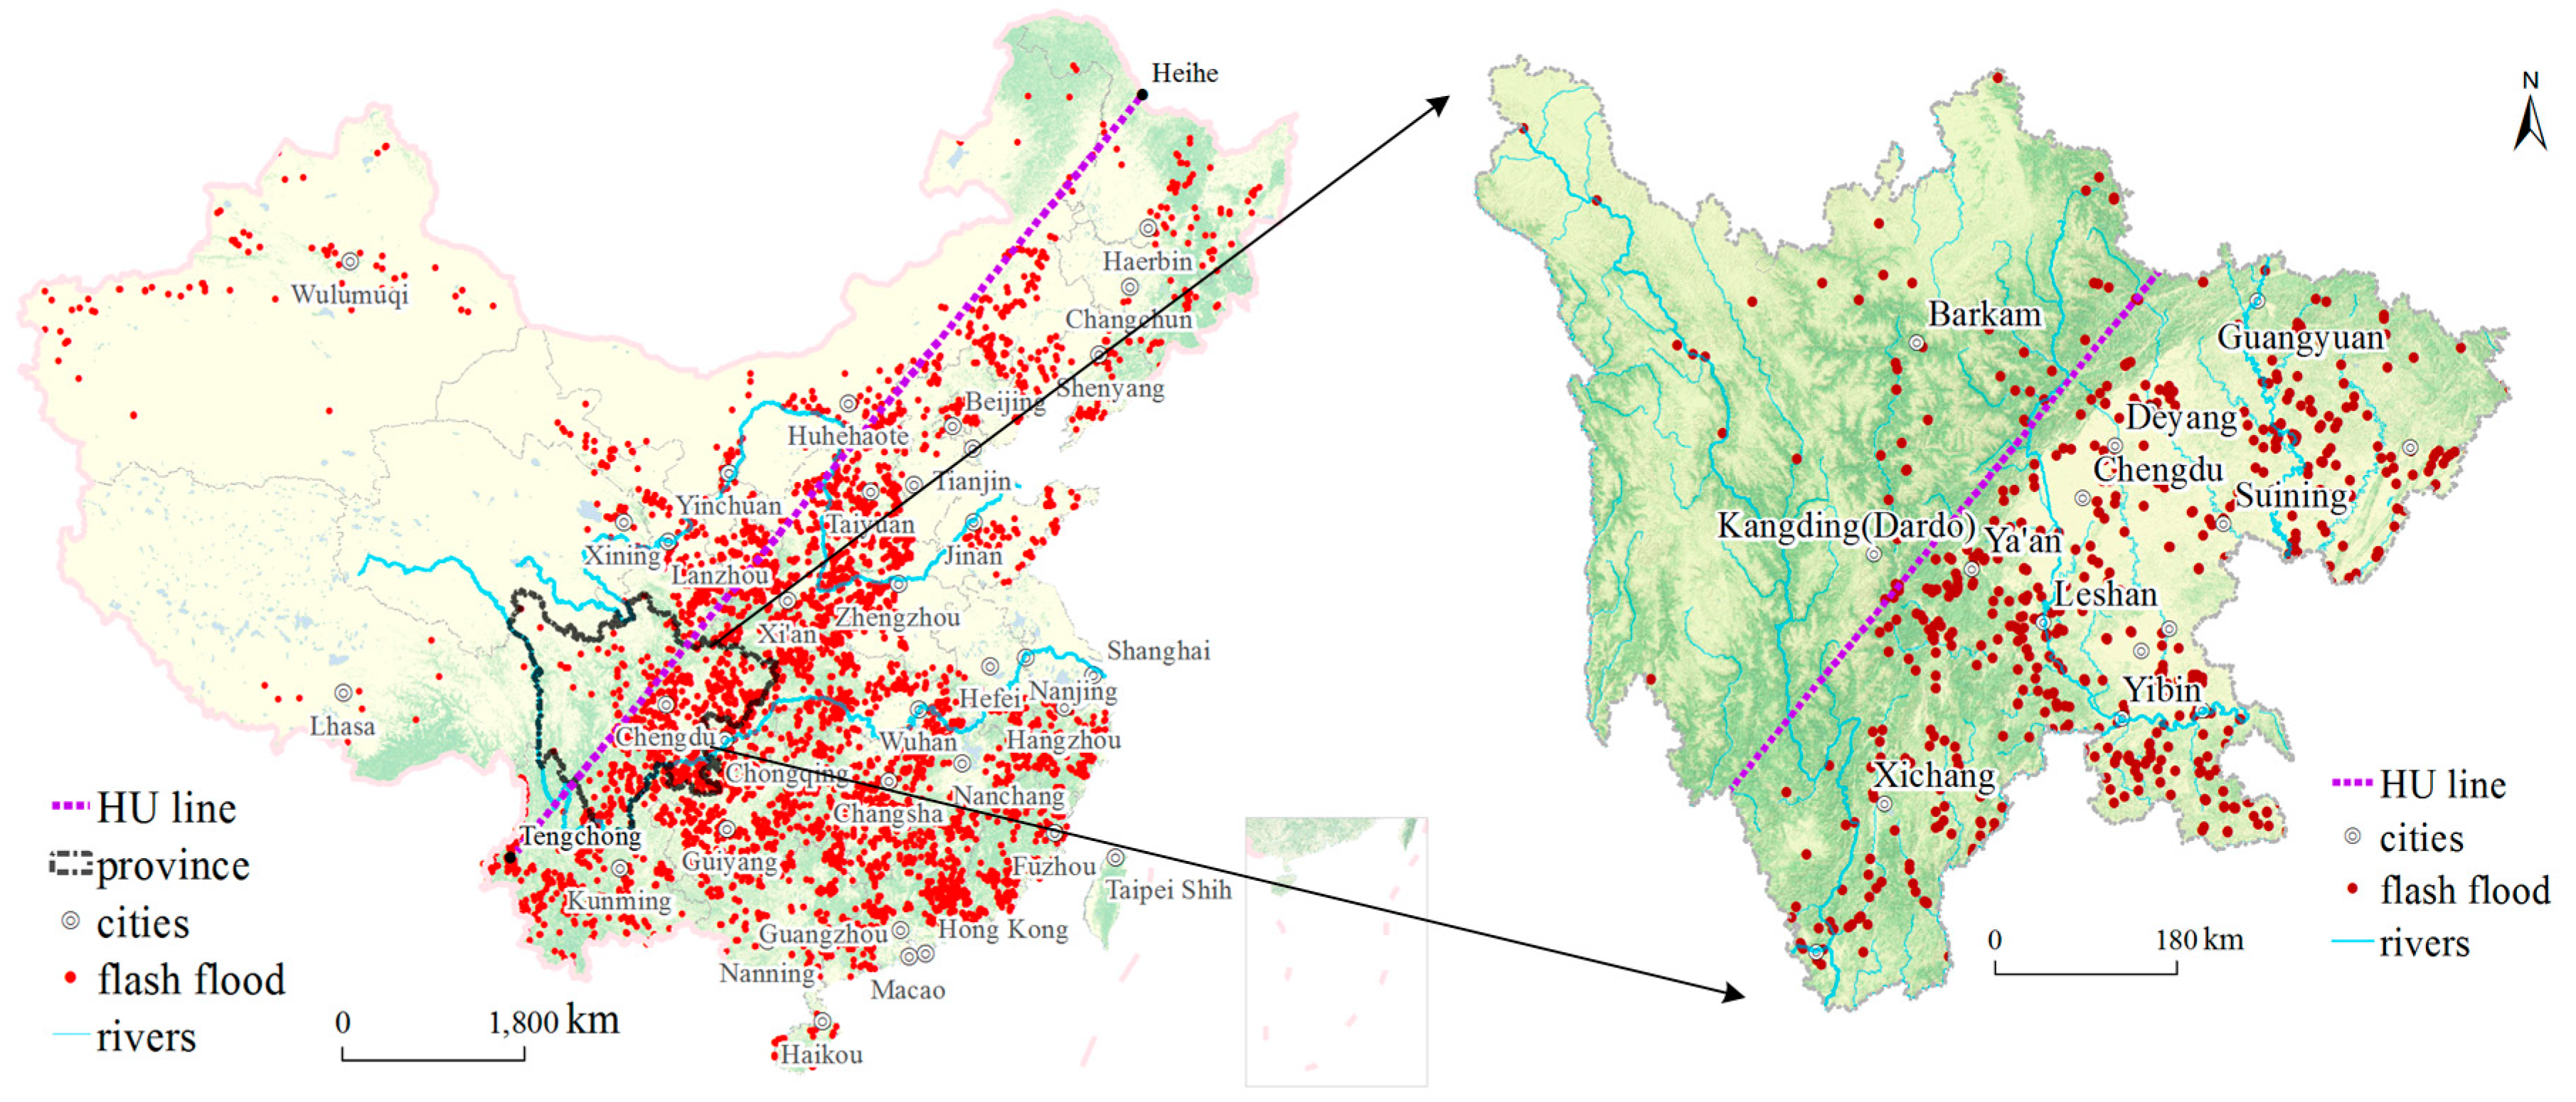
Figure 2.
Small watersheds of Sichuan Province.
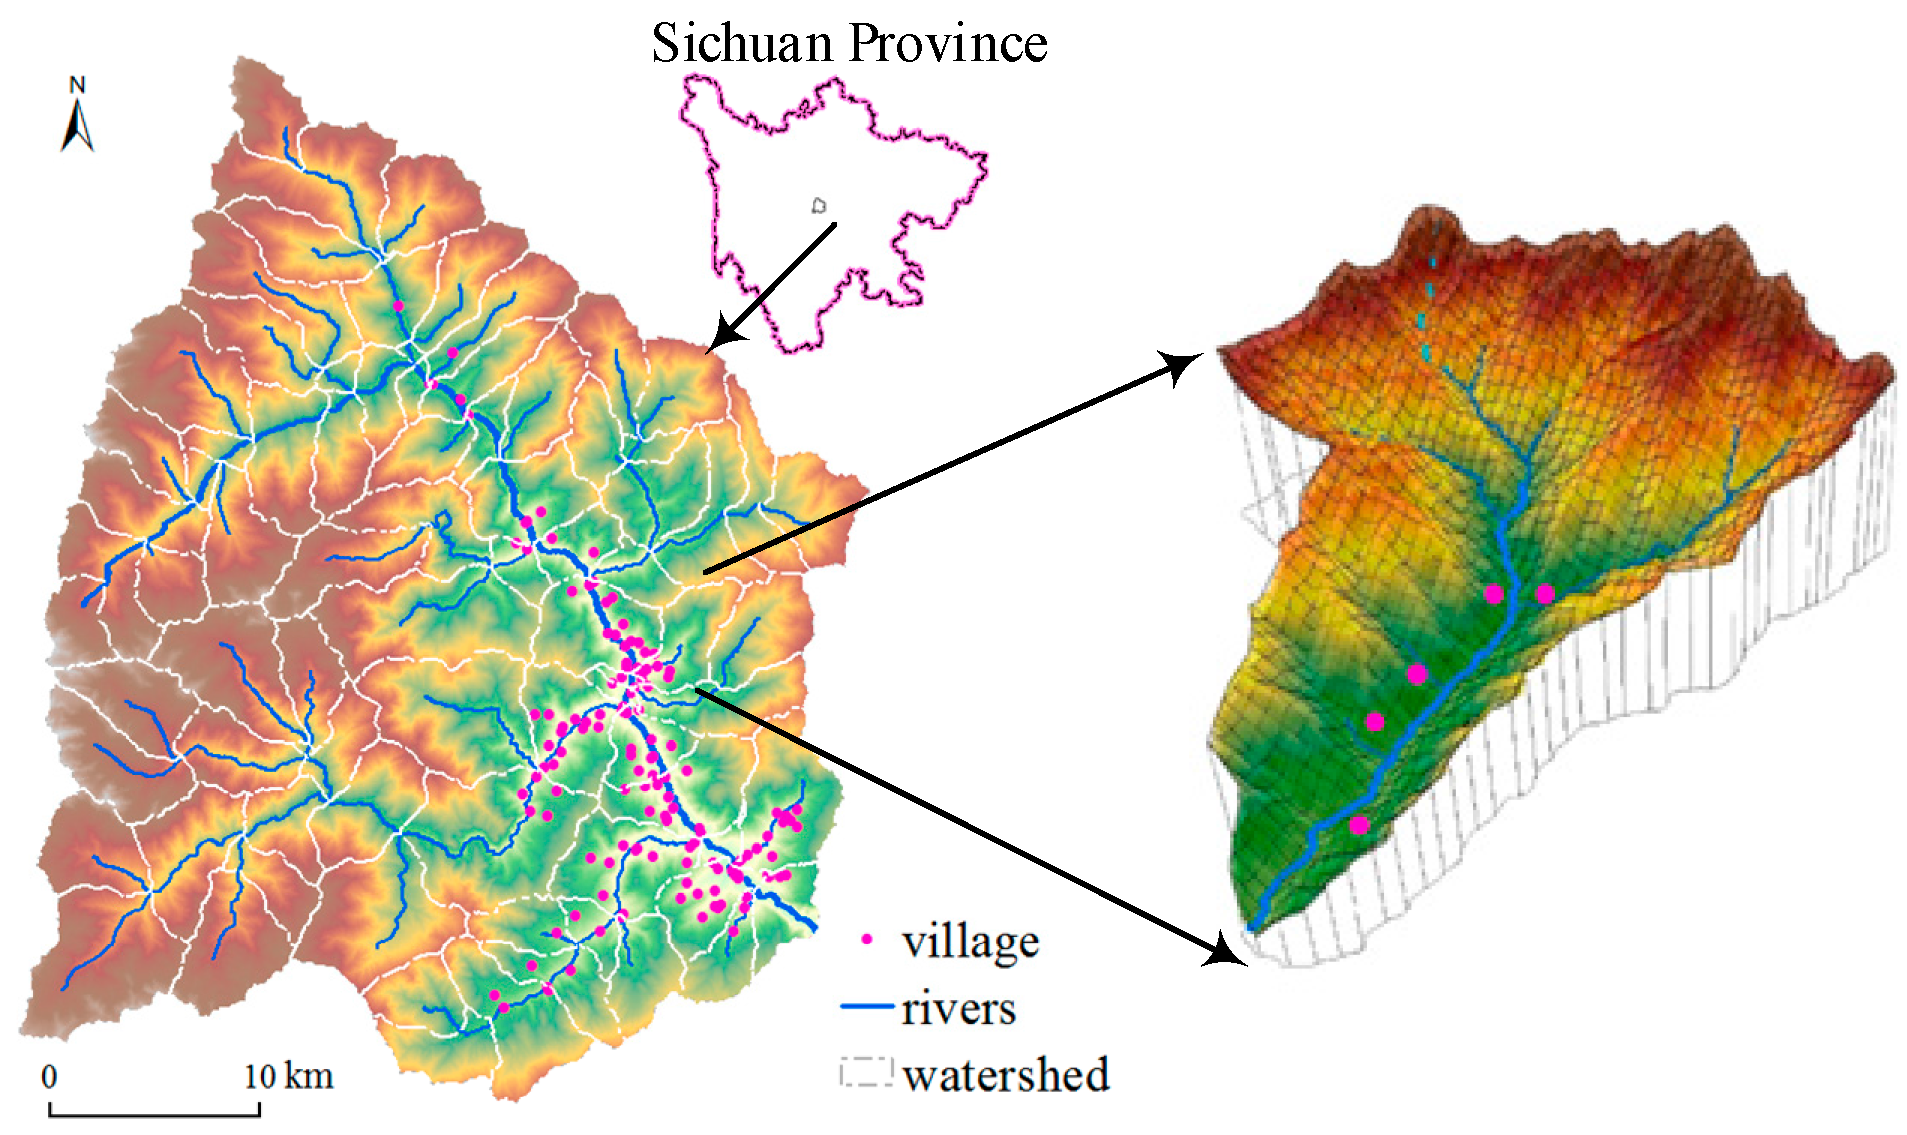
Figure 3.
Flowchart of the geographical detector-based assessment.

Figure 4.
The annual number of flash floods in Sichuan Province from 1950 to 2015.

Figure 5.
Spatial analysis of flash floods: (a) Flash flood intensity in D95–04 (1995 to 2004); (b) flash flood intensity in D05–14 (2005 to 2014); (c) Flash flood intensity change from D95–04 and D05–14.
Figure 5.
Spatial analysis of flash floods: (a) Flash flood intensity in D95–04 (1995 to 2004); (b) flash flood intensity in D05–14 (2005 to 2014); (c) Flash flood intensity change from D95–04 and D05–14.

Figure 6.
Classification of environmental background conditions factors: (a) elevation; (b) slope; and (c) soil type.
Figure 6.
Classification of environmental background conditions factors: (a) elevation; (b) slope; and (c) soil type.

Figure 7.
Classification of precipitation factors from 1995 to 2004 and 2005 to 2014. D1: the period from 1995 to 2004; D2: the period from 2005 to 2014. (a) 1995 to 2004; (b) 2005 to 2014; (c) variability from (1995 to 2004) to (2005 to 2014); (d) 1995 to 2004; (e) 2005 to 2014; (f) variability from (1995 to 2004) to (2005 to 2014); (g) 1995 to 2004; (h) 2005 to 2014; (i) variability from (1995 to 2004) to (2005 to 2014).
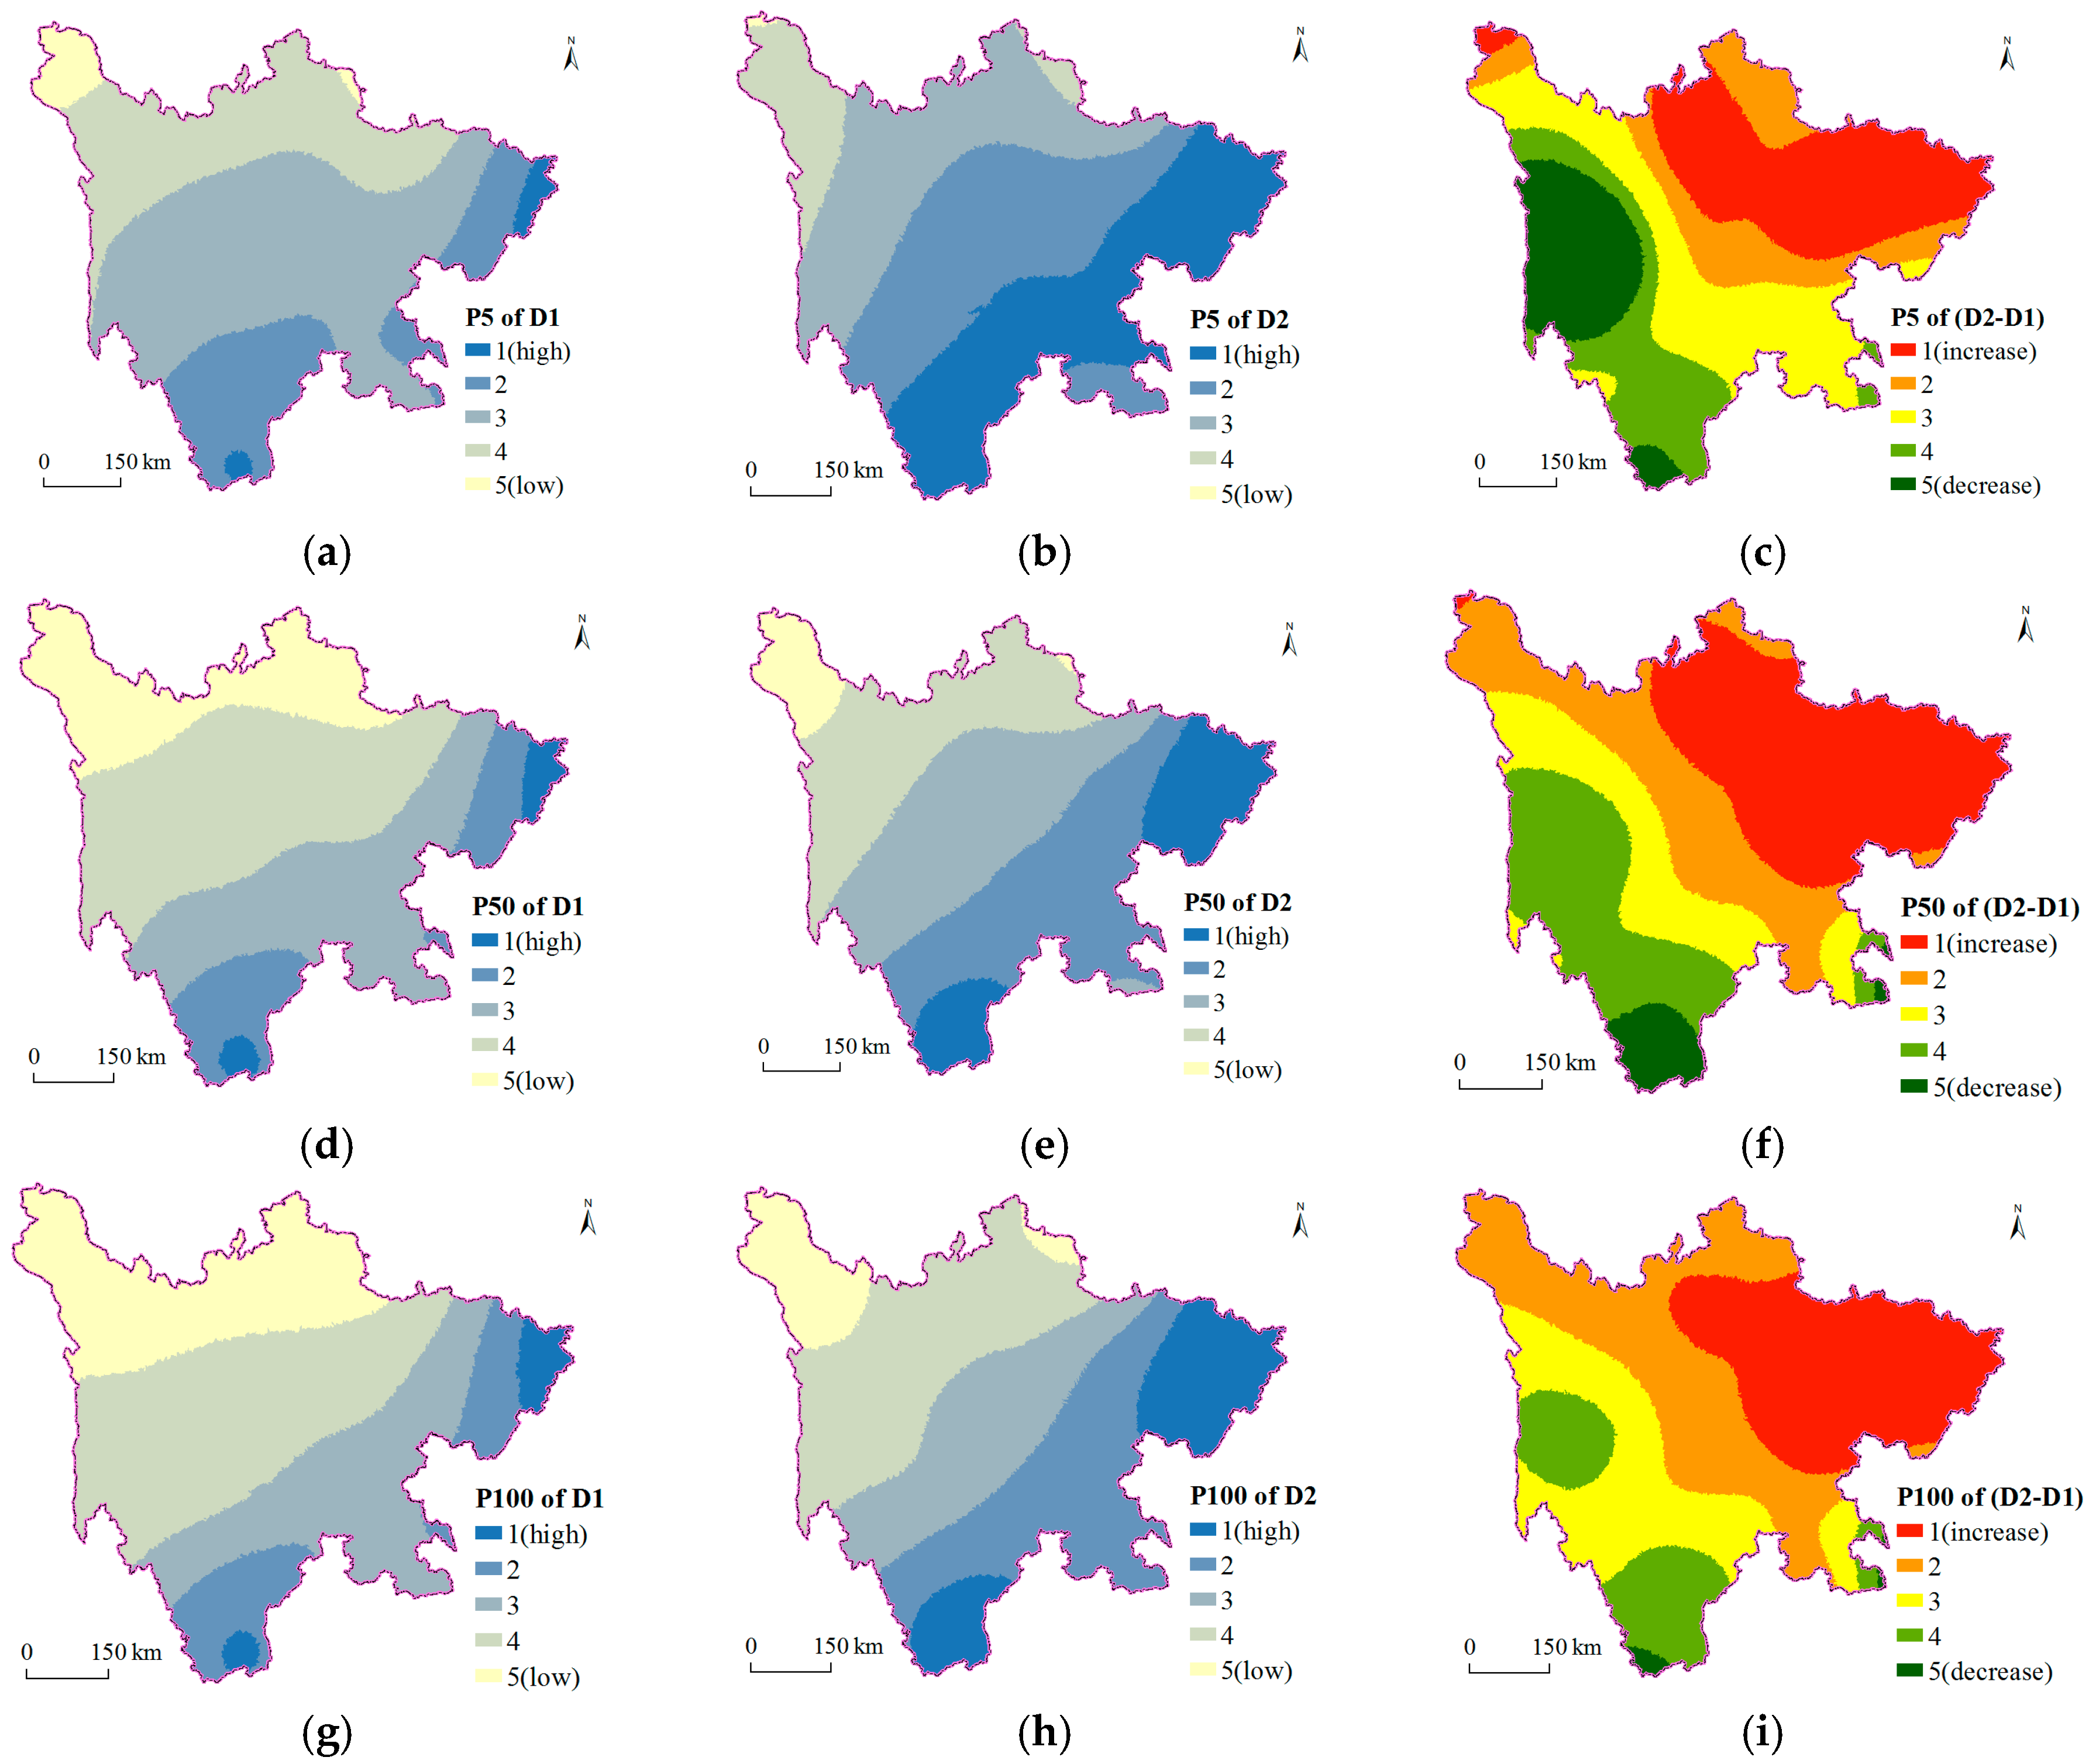
Figure 8.
Classification of human activity factors in 2000 and 2010. (a) VFC (2000); (b) VFC (2010); (c) variability of VFC from (2000) to (2010); (d) POP (2000); (e) POP(2010); (f) variability of POP from (2000) to (2010); (g) Pcul (2000); (h) Pcul (2010); (i) variability of Pcul from (2000) to (2010); (j) GDP (2000); (k) GDP (2010); (l) variability of GDP from (2000) to (2010).
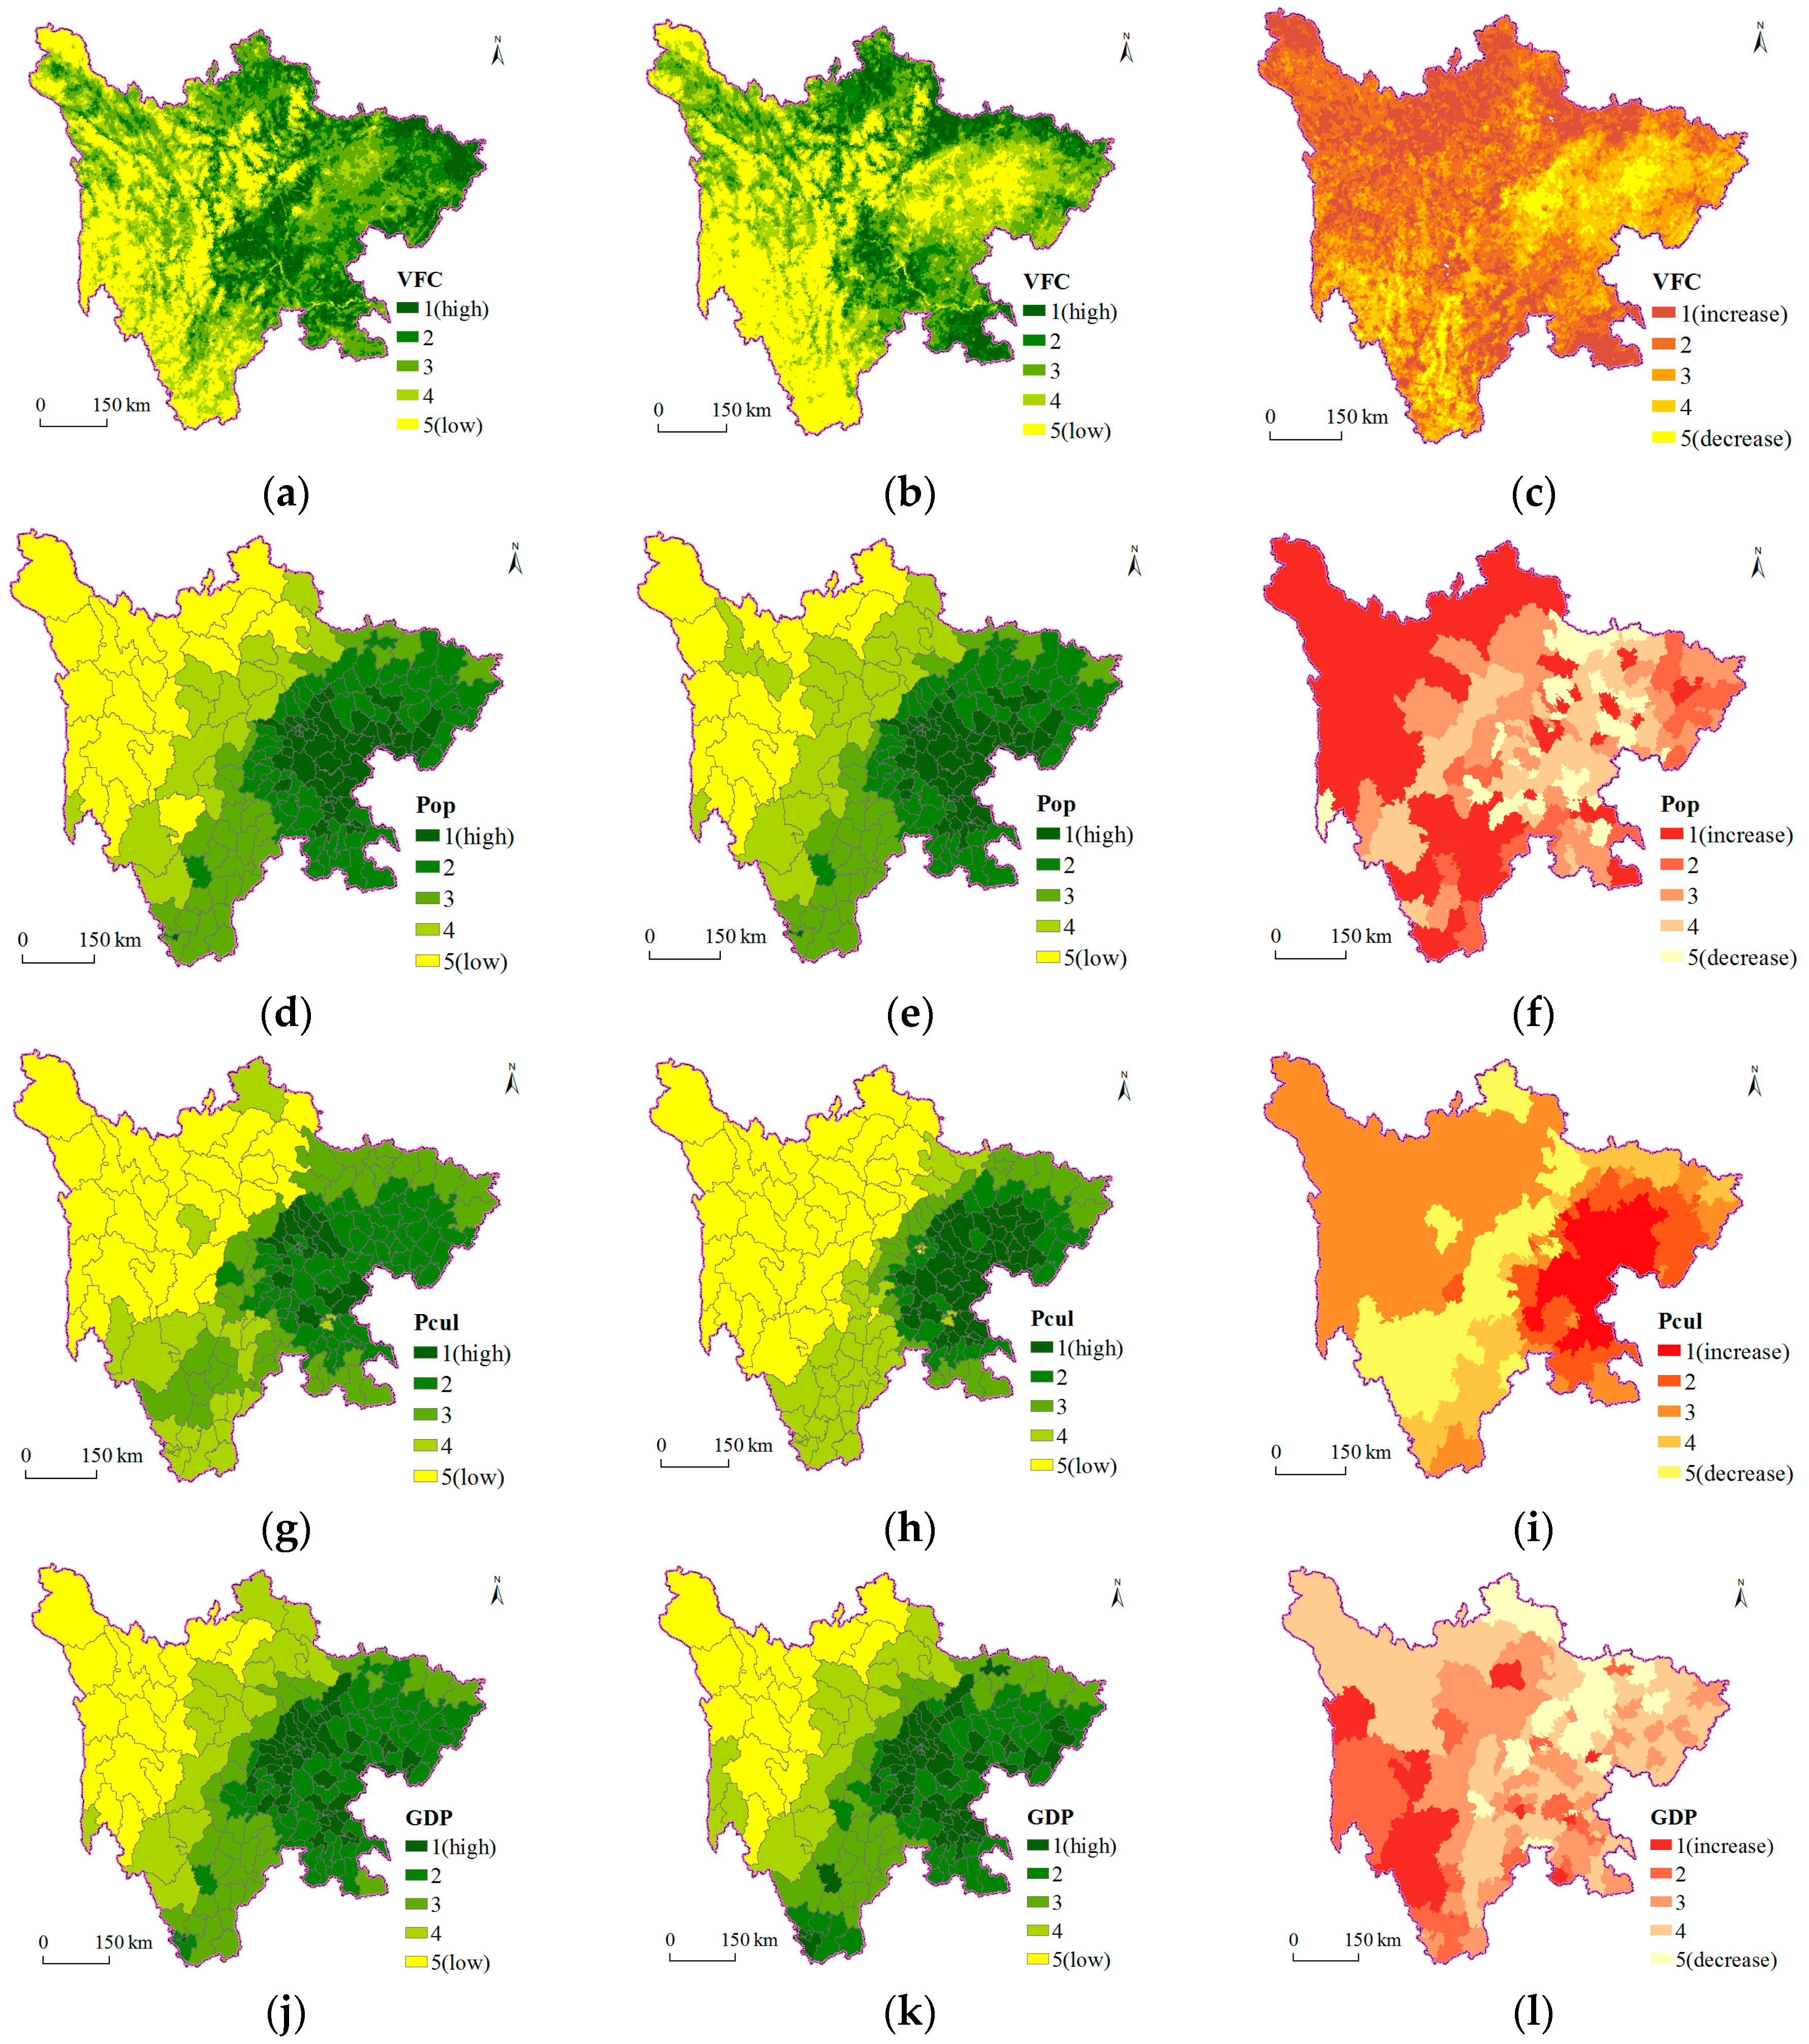
Figure 9.
Comparison of the population density and flash flood density: (a) the correlation at different elevation; (b) the correlation at different slope.
Figure 9.
Comparison of the population density and flash flood density: (a) the correlation at different elevation; (b) the correlation at different slope.
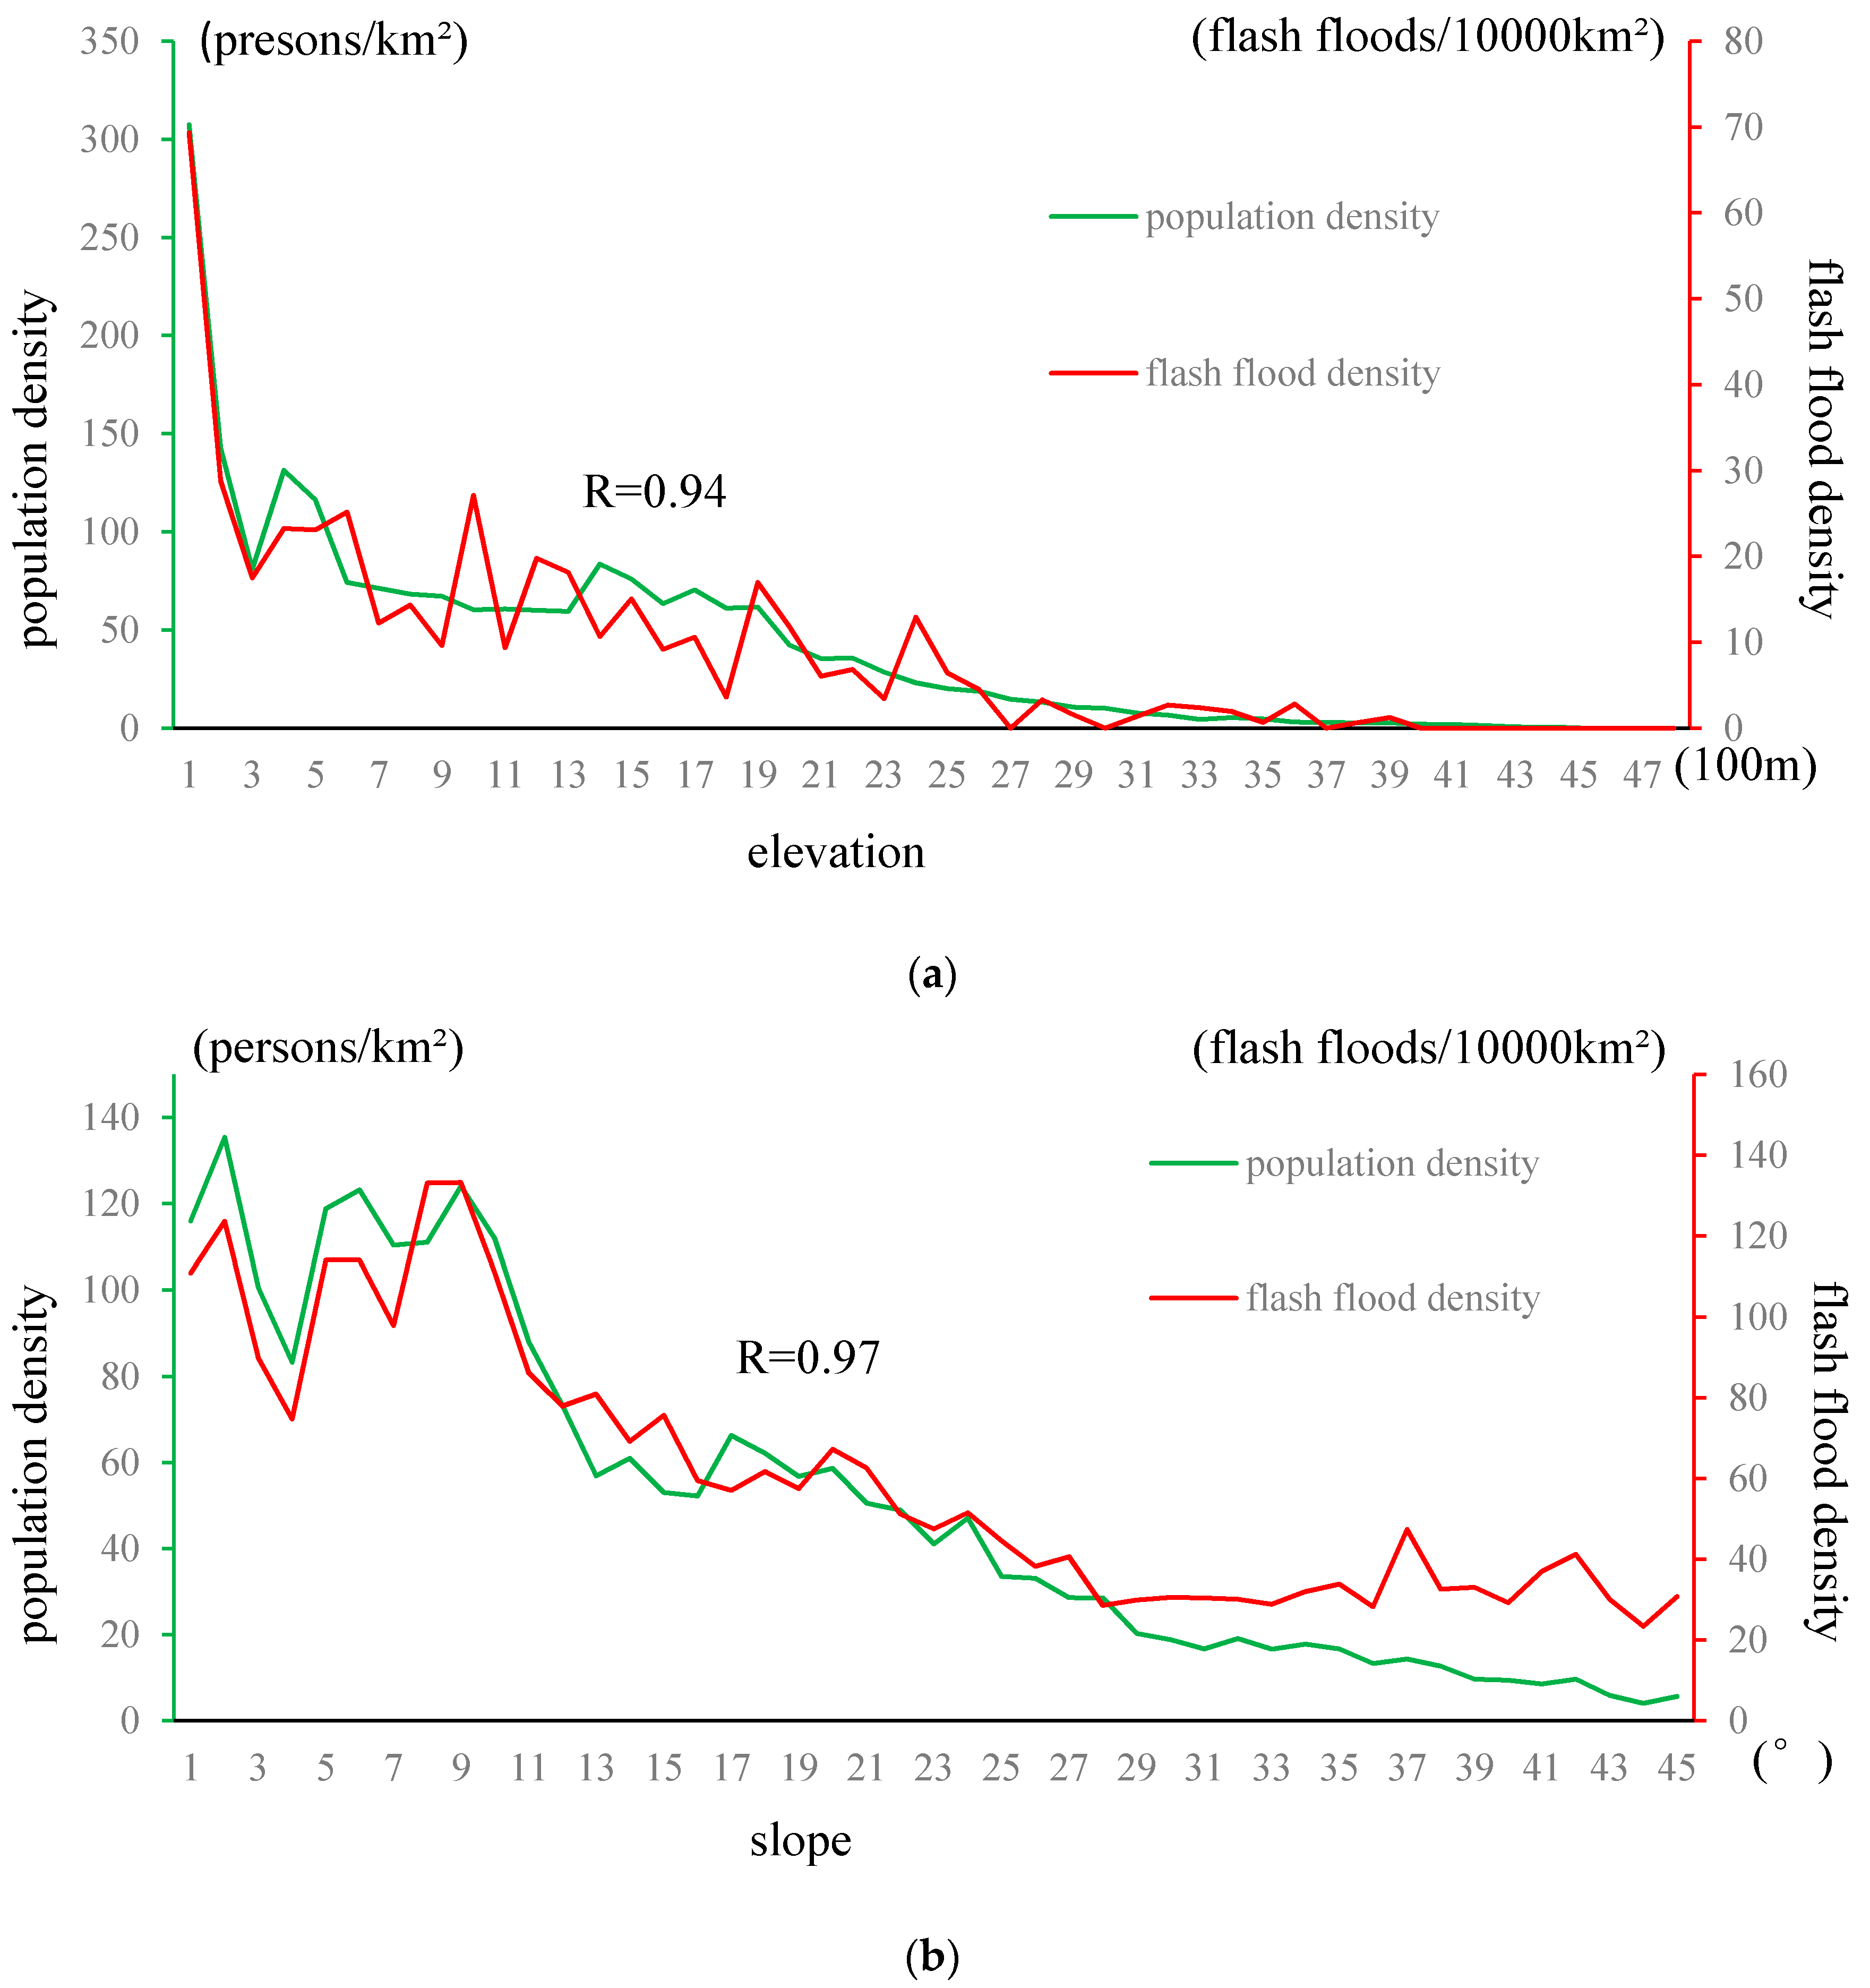
Figure 10.
Correlation of human activities factors (2000 and 2010): (a) Correlation of population density and GDP density in 2000; (b) Correlation of population density and cultivated land in 2000; (c) Correlation of population density and GDP density in 2010; (d) Correlation of population density and cultivated land in 2000.


Figure 11.
Interaction power of determinants (PDs) of the precipitation factors.
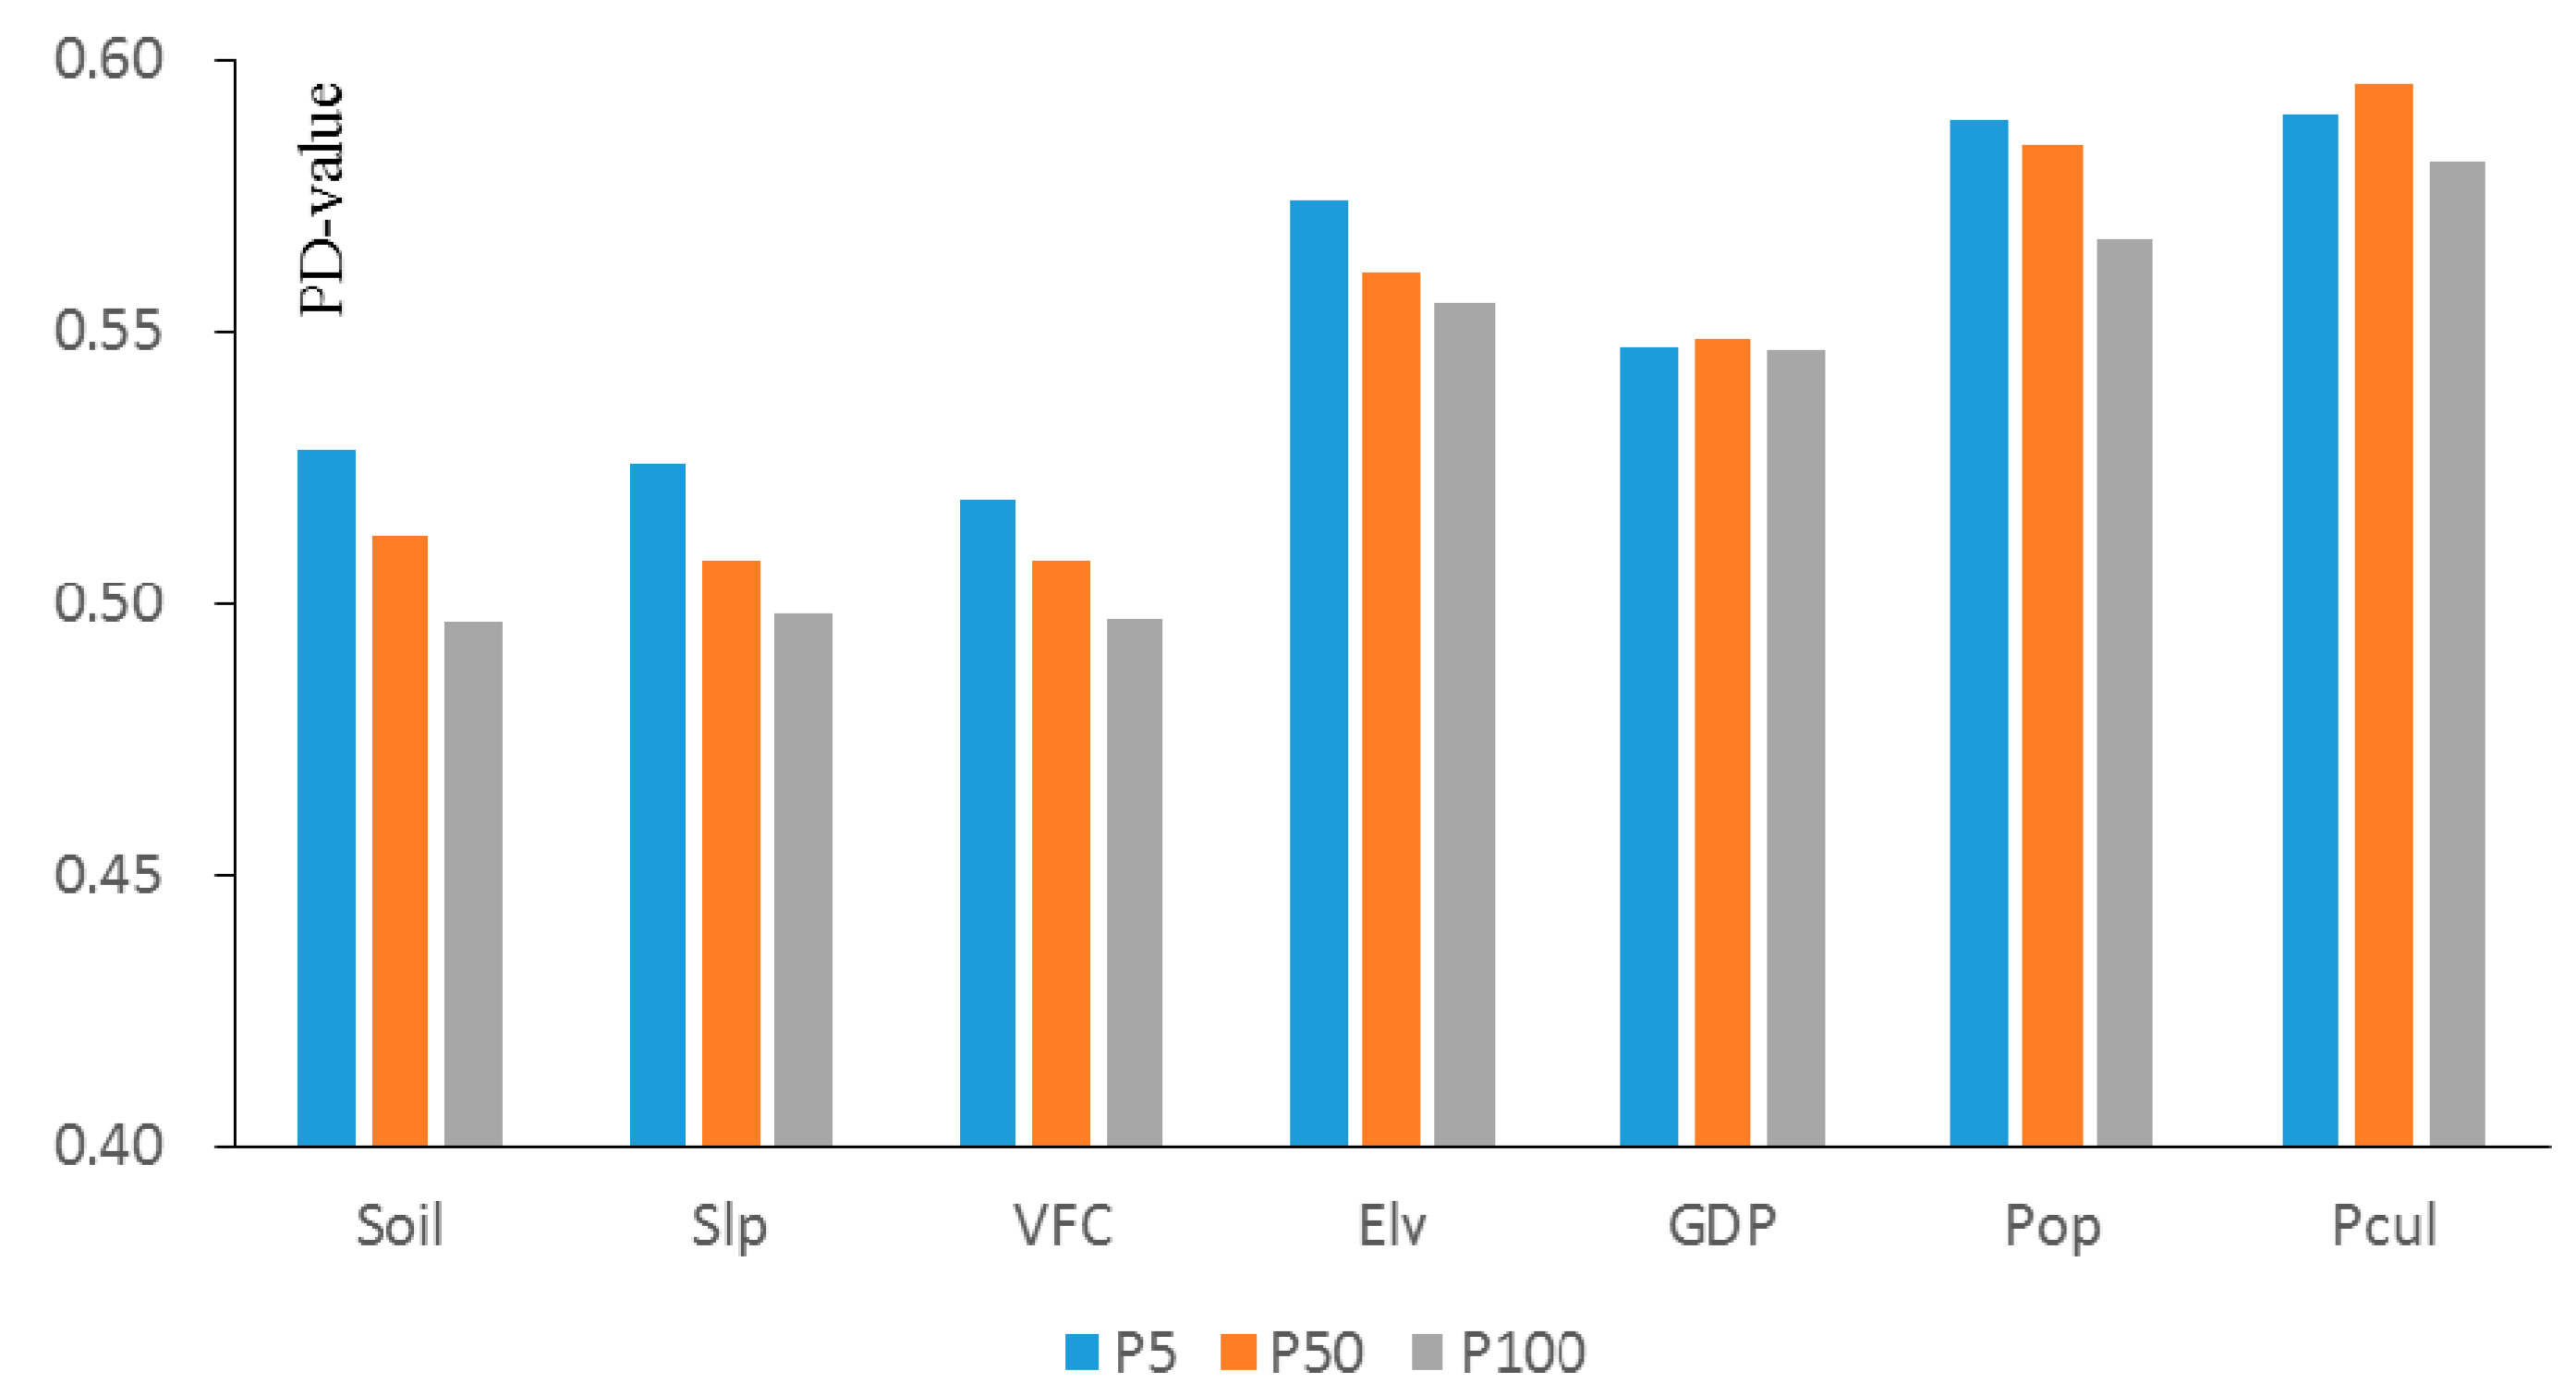
Figure 12.
Interaction PDs of the human activity factors.

Table 1.
List of data used.
| Factors | Parameters | Scale or Resolution | Time | Data Sources |
|---|---|---|---|---|
| Flash floods | flash floods | 1:50,000 | 1949–2014 | Flash Flood Investigation and Evaluation Dataset of China (FFIEDC) |
| small watershed | 1:50,000 | 2014 | FFIEDC | |
| Environmental background conditions | elevation | 1:50,000 | 2014 | SBSC |
| slope | 1:50,000 | 2014 | SBSC | |
| soil type | 1:100,000 | 2014 | RESDC * | |
| Precipitation | daily precipitation | - | 1995–2014 | CMA |
| Human activities | population density | 1 km × 1 km | 2000, 2010 | RESDC * |
| farm land | 1 km × 1 km | 2000, 2010 | RESDC * | |
| vegetation fractional coverage of vegetation | 1 km × 1 km | 2000, 2010 | NASA, MODIS | |
| GDP density | 1 km × 1 km | 2000, 2010 | RESDC * |
* The dataset is provided by the Resources and Environmental Sciences Data Center (RESDC), Chinese Academy of Sciences (http://www.resdc.cn).
Table 2.
Factors and parameters.
| Type | Factor Name | Description |
|---|---|---|
| Flash flood intensity | F(95-04) | Disaster intensity index of a small watershed from 1995 to 2004 |
| F(05-14) | Disaster intensity index of a small watershed from 2005 to 2014 | |
| Environmental background conditions | Ele | Average elevation of a small watershed (m) |
| Slp | Average slope of a small watershed (°) | |
| Soil | Soil type that accounts for the largest proportion of the total area in a small watershed | |
| Precipitation | P5 | Index of days with daily precipitation greater than 5 mm |
| P50 | Index of days with daily precipitation greater than 50 mm | |
| P100 | Index of days with daily precipitation greater than 100 mm | |
| Human activities | POP | Population density (persons/km2) |
| Pcul | Percentage of the total area of cultivated land (%) | |
| VFC | fractional coverage of vegetation (calculated from NDVI(Normalized Difference Vegetation Index) data) | |
| GDP | GDP density (10,000 yuan/km2) |
Table 3.
The results of factor detection for D95–04 and D05–14.
| Environmental Background Conditions | Precipitation | Human Activities | ||||||||
|---|---|---|---|---|---|---|---|---|---|---|
| PD value | Ele | Soil | Slp | P5 | P50 | P100 | POP | Pcul | VFC | GDP |
| D95–04 | 0.593 | 0.156 | 0.169 | 0.465 | 0.699 | 0.771 | 0.646 | 0.565 | 0.077 | 0.614 |
| D05–14 | 0.734 | 0.197 | 0.191 | 0.582 | 0.673 | 0.711 | 0.776 | 0.670 | 0.098 | 0.729 |
| D05–14–D95–04 | 0.218 | 0.071 | 0.096 | 0.483 | 0.453 | 0.441 | 0.274 | 0.163 | 0.112 | 0.293 |
Table 4.
Interaction detector analysis for D05–14–D95–04.
| Ele | Soil | Slp | P5 | P50 | P100 | POP | Pcul | VFC | GDP | |
|---|---|---|---|---|---|---|---|---|---|---|
| Ele | 0.218 | |||||||||
| Soil | 0.274 | 0.071 | ||||||||
| Slp | 0.306 | 0.173 | 0.096 | |||||||
| P5 | 0.574 | 0.528 | 0.526 | 0.483 | ||||||
| P50 | 0.561 | 0.513 | 0.508 | 0.545 | 0.453 | |||||
| P100 | 0.555 | 0.496 | 0.498 | 0.535 | 0.476 | 0.441 | ||||
| POP | 0.432 | 0.336 | 0.337 | 0.589 | 0.584 | 0.567 | 0.274 | |||
| Pcul | 0.310 | 0.212 | 0.216 | 0.590 | 0.596 | 0.581 | 0.427 | 0.163 | ||
| VFC | 0.370 | 0.211 | 0.215 | 0.519 | 0.508 | 0.497 | 0.391 | 0.302 | 0.112 | |
| GDP | 0.440 | 0.294 | 0.291 | 0.547 | 0.549 | 0.546 | 0.418 | 0.451 | 0.504 | 0.201 |
© 2017 by the authors. Licensee MDPI, Basel, Switzerland. This article is an open access article distributed under the terms and conditions of the Creative Commons Attribution (CC BY) license (http://creativecommons.org/licenses/by/4.0/).
Share and Cite
MDPI and ACS Style
Liu, Y.; Yuan, X.; Guo, L.; Huang, Y.; Zhang, X. Driving Force Analysis of the Temporal and Spatial Distribution of Flash Floods in Sichuan Province. Sustainability 2017, 9, 1527. https://doi.org/10.3390/su9091527
AMA Style
Liu Y, Yuan X, Guo L, Huang Y, Zhang X. Driving Force Analysis of the Temporal and Spatial Distribution of Flash Floods in Sichuan Province. Sustainability. 2017; 9(9):1527. https://doi.org/10.3390/su9091527
Chicago/Turabian StyleLiu, Yesen, Ximin Yuan, Liang Guo, Yaohuan Huang, and Xiaolei Zhang. 2017. "Driving Force Analysis of the Temporal and Spatial Distribution of Flash Floods in Sichuan Province" Sustainability 9, no. 9: 1527. https://doi.org/10.3390/su9091527
Note that from the first issue of 2016, this journal uses article numbers instead of page numbers. See further details here.