The Relationship between Waste Management Expenditure and Waste Reduction Targets on Selected JSE Companies


1
Africa Centre for Sustainability Accounting and Management (ACSAM), School of Accountancy, University of Limpopo, Sovenga 0727, South Africa
2
Department of Financial Accounting, School of Accountancy, University of Limpopo, Sovenga 0727, South Africa
*
Author to whom correspondence should be addressed.
Sustainability 2017, 9(9), 1528; https://doi.org/10.3390/su9091528
Submission received: 25 July 2017
/
Revised: 23 August 2017
/
Accepted: 24 August 2017
/
Published: 28 August 2017
(This article belongs to the Section Economic and Business Aspects of Sustainability)
Abstract
:Waste generation and waste management are critical environmental issues faced by countries all over the world. Furthermore, there are greater environmental, economic, and social demands on firms to reduce the environmental impacts due to environmental problems brought about by their operating activities. There is a current debate as to the financial implications of waste management expenditure on waste reduction targets. This study examines the relationship between waste management expenditure on waste reduction targets, and the impact of waste reduction targets on firms’ profitability. This study used the quantitative method that utilizes the multiple regressions method to analyses data from selected South African Johannesburg Stock Exchange’s (JSE) Socially Responsible Index (SRI) listed manufacturing and mining firms for ten years (2007–2016). The study tests if there is a relationship between waste management expenditure and waste reduction targets, as well as the impact of waste reduction targets on firms’ profitability. Results show that waste reduction targets have a positive, but insignificant, correlation on the profitability of firms, and also indicate that there is a relationship between waste management expenditure and waste reduction targets. The study recommends that firms should focus more on minimizing waste generation to reduce costs.
1. Introduction
In developing countries, a huge amount of waste is not reused or properly disposed of by firms (Gunasekaran & Spalanzani, 2012) [1]. This practice has led to the problem of hazardous waste management, and locating new landfills, as a result of depletion of raw material (Gunasekaran & Spalanzani, 2012) [1]. Periathamby et al. (2011) state that solid waste generation and its implications for society and environment are global issues, with the complexity of waste composition and ever-increasing per capita waste generation becoming a challenge for managers, particularly in developing countries [2]. Due to the lack of effort by authorities, the management of waste has become a persistent problem, despite that the largest part of municipal expenditure is allotted to it (Das & Bhattacharyya, 2015) [3]. However, the collection of waste generated has not yet solved the issue of hazardous waste management; it requires disposing of waste in an environmentally safe and economically sustainable manner (Das & Bhattacharyya, 2015) [3]. It is, therefore, noted that the issue of waste management needs serious attention.
Environmental and waste management related research in South Africa have focused more on disclosure (Fienh & Ball, 2005; Mitchell & Hill, 2011; Raufflet et al., 2014; Costantini et al., 2013; Du Toit, 2016) but none of these prior researchers has looked into the effect of waste management expenditure and waste reduction in South Africa [4,5,6,7,8]. Researchers such as Lopez-Gamero et al. (2012), Guerrero Maas and Hogland (2013), Clor-Proell and Maines (2014), conducted studies that examine the effect of environmental practices and firm performance in other countries [9,10,11]. Therefore, this study becomes necessary to address the issue of waste management among selected stakeholders within the manufacturing sector in South Africa, since they are considered substantial contributors to waste generation.
Notwithstanding, there are greater social demands on firms to reduce their environmental impact because of the related environmental problems caused by firms’ operations (Contantini et al., 2013) [7]. Shaw (2012) states that many environmental issues have accompanied the growth in the South Africa economy [12]. Fienh and Ball (2005) mentioned that in the past poor waste management, as one of the key environmental issue in South Africa has been uncoordinated and poorly funded [4]. Barcena-Ruiz and Casado-Izaga (2015) reiterate that production and distribution of goods result in waste and rubbish that firms must plan to dispose of, and the disposal of waste material is expensive, as waste must be transported to collection points [13].
A cornerstone of sustainability of any business is the establishment of an affordable, efficient, and truly sustainable waste practice at the operational level (Kulkarni et al., 2014) [14]. However, waste management activities, like segregation, collection, treatment, and disposal, still need to be done (Shalini et al., 2012) [15]. Implementation of appropriate waste management practices requires reliable waste statistics (Metin et al., 2013) [16]. The data should represent a sufficiently long time frame, with relatively short measurement frequencies, to be statistically acceptable (Gow et al., 2016) [17]. In the waste management process, segregation practice needs to be practised more strictly, and by the waste generators themselves (Shalini et al., 2012) [15]. There may be many aspects of waste management practices as can be noted from the literature (Metin et al., 2013; Shalini et al., 2012; Kulkarni et al., 2014 and Gow et al., 2016) [14,16,17]. In their study, waste management practices refer to the action taken by companies to remedy issues of the environment. Among other environmental problems, the study focuses on the waste reduction.
Society is facing several environmental challenges, due to a massive increase in production services aspects (Kulkarni et al., 2014) [14]. Challenges, such as carbon emissions, increase negative environment impacts (Mihai & Ingrao, 2016) [18]. These challenges are the result of bad practices, which represent a threatening factor for both the local environment and public health, and cause major losses regarding compositing recycling or energy recovery potential (Mihai & Ingrao, 2016) [18]. According to Hornsby et al. (2016), environmental challenges surrounding the effect of the current waste management practices have received a high level of public attention, due to the continuous problems in establishment and implementation of effective waste management since the mid-1990s [19]. Researchers such as Caspersen (2015), and Qian and Schneider (2016), found that practices had positive influences on the financial performance [20,21]. Therefore, firms need to consider proper waste management practices to perform well financially.
According to Gangolells et al. (2014), most commonly implemented waste management practices were found to be on the side of cleanliness and correct storage of raw materials; such practices encourage prevention of waste and waste diversion from wild dumps (Mihai & Ingrao, 2016) [18,22]. Bisschop (2006) and Hafeez et al. (2016) also found that a common practice to reduce the volume and to recover metals and plastics, is dumping waste in an open ground and burning of waste [23,24]. From the above literature, the importance of sound waste management practices cannot be ignored. Moreover, it is plausible that firms need to maintain sound financial performance through proper waste management.
This study examines whether waste management expenditure has an impact on waste reduction targets, and also considers the impact of waste reduction targets on firm’s profitability. There is relevance for this study, given the importance attached to environmental protection by the South African government. From the arguments above, there is little previous research evidence about waste reduction targets and their effect on waste management expenditure, and profitability of the manufacturing sector in South Africa.
The following section describes the theoretical framework used, and the identified literature.
2. Materials and Methods
2.1. Waste Management Theory
According to Pongracz et al. (2004), and Pongracz (2006), waste management theory (WMT) is founded on the expectation that waste management is meant to prevent waste from causing harm to both human health and the environment [25,26]. WMT evolves from industrial ecology, which focuses much on manufacturing, and the design of processes and products of firms, from a view point of product competitiveness and interaction with the environment (Pongracz, 2006) [27]. Moreover, moving towards waste reduction requires that firms commit themselves to increase the proportion of non-waste leaving the process (Pongracz, 2006) [26]. Garcia et al. (2004) state that waste represents a loss of valuable resources both in the form of materials and energy, many of which are scarce [27]. Furthermore, WMT aims at encouraging the conservation of resources by applying waste management and avoidance of resources loss (Pongrácz & Pohjola, 2004) [28]. Hence, this theory is relevant to explaining the results of this study, which focuses on waste reduction and management.
2.2. Stakeholder Theory
A firm cannot maximise value if it ignores the interests of its stakeholders, including not only financial claimants, but also customers, employees, government officials, and communities (Jo et al., 2015) [29]. The firm is characterised by the relationship with many individuals and groups “stakeholders”, each with the power to affect the performance of the company (Lafreniere et al., 2013) [30]. According to Park and Ghauri (2015), customers are important primary stakeholders that appear to be particularly influential for the firm in view of their corporate citizenship [31]. Customers become aware of the ethical implications of a firm’s behaviour; they develop a trust in the belief that the firm will maintain its quality standards to enhance corporate reputation (Park & Ghauri, 2015) [31].
Avetisyan and Ferrery (2013) argue that a firm’s attention should not only focus on consumers, since each stakeholder is equally important in its economic progress [32]. For example, suppliers as a stakeholder create benefits over time, through their engagement with the firm (Chen et al., 2015) [33]. Mishra and Suar (2010) suggest that the stakeholder theory helps firms to understand values, and offer a way to promote organizational responsibility [34]. As such, stakeholders have the legal or moral right to expect a firm to satisfy their interest (Lafreniere et al., 2013) [30]. Hence, the amount spent on waste management by firms to reduce waste generation is relevant to this study.
2.3. Legitimacy Theory
Suchman (1995) and Trevino et al. (2014) define legitimacy as “an assumption or perception that generalize the action of an entity to be desirable, proper or appropriate within some socially constructed system of norms and values” [35,36]. On the other hand, Reisig and Bain (2016) defines legitimacy as “an organisation seeking to justify its actions to stakeholders” [37]. According to Reisig and Bain (2016), this definition implies that organizational legitimacy is socially constructed, and is not necessarily an objective judgement [38]. Suchman (1995) proclaims that organizational legitimacy leads to continual support from stakeholders, because the organization appears desirable, proper, or appropriate, as it continually acts out its organizational beliefs. From the above definition of the legitimacy theory, firms and other organizations are encouraged to take care of the waste generated, to act in the best interest of norms and values of society [35].
Humpheys and Latour (2013) state that in a context where firms need to behave in a socially appropriate way and fulfil their obligations to the society, goes beyond profit-making activities [38]. Thus, manufacturing firms in South Africa have a duty to legitimize their operations by engaging in efficient waste management practices. The theories mentioned above indicated that firms could not operate alone without engaging social and environmental issues. For manufacturing firms to be legitimate, firms must recognize the role of the community in which they operate. Furthermore, the above review indicated that the role of all stakeholders could not be taken for granted in a firm’s operating activities. Lastly, firms may need to apply the above-discussed theories to get greater benefits.
3. Related Literature
3.1. Waste Management
Recovery, collection and removal of waste, which includes the administration of such an operation, is useful for waste management (Jerie & Tevera, 2014) [39]. Therefore, how waste is managed directly affects local and global environmental quality (Fischer, 2011; Olsen, 2017) [40,41]. Researchers such as Gunsilius et al. (2011), and Masood and Barlow (2013), indicate that from the start of human history, disposal of waste has been problematic [42,43]. The matter has gained more and more importance over the years, with increasing quantities of waste and awareness of the environmental impacts of poorly managed waste (Fienh & Ball, 2015) [4]. Brunner and Rechberger (2015), in support of the study of Gunsilius et al. (2011), indicate that the rapidly growing volume of waste has become the main issue of waste management in today‘s societies [42,44]. They note that waste management practices have grown over many centuries. From the above-cited studies, waste management has been a long-standing challenge that has increased in recent years. Therefore, the challenge needs to be dealt with, to achieve a sustainable environment.
An effective waste management strategy is currently a key target in environmental policies worldwide, and awareness of the environmental impacts of waste has continued to grow (Gow et al. 2016) [17]. It has been understood that growth in waste generation, unrestrained by correct reduction and management techniques, can damage natural systems (Banchmann & Ingenhoff, 2016) [45]. Waste is not environmentally friendly by nature; the waste produced contributes significantly to environmental degradation (Olsen, 2017) [41]. De Besi and McCormick (2015), and Mihai and Ingrao (2016), indicate that sustainable waste management is essential for optimising the use of waste in the economy, and that proper management is a key issue in the near future [18,46]. Waste and its management are about demand for resources, development, human behavior, finance, and much more (Horsonby et al., 2016) [19]. Aleluia and Ferrao (2016), and Hafeez et al. (2016), state that in managing waste, one needs to consider the suitable approaches and pay attention to the characteristics and properties of the waste that is generated [24,47]. Developing countries have a shortage of state of the art facilities for proper and stable waste management, and even some countries lack proper regulatory guidelines for waste management, while production is increasing day by day, mostly in urban areas (Hafeez et al., 2016) [24]. Adomako and Danso (2014) argue in favor of the study of Hafeez et al. (2016), indicating that further efforts should be made available, particularly the waste management facilities database [24,48]. It is plausible to encourage waste generators to put more efforts to manage the waste generated effectively.
According to Gangolells et al. (2014), the increasing waste amount needs more attention to the sector of waste management [22]. Bhattachayya (2012), Gangolells et al. (2014), and Hornsby et al. (2016) note that waste management is affecting the public domain, and it is also becoming increasingly apparent that there is no decision that can be taken without considering the pressure of compliance with new regulations on waste management [19,22,49]. Proper waste management can only be achieved if those who generate waste, such as manufacturing businesses, individuals, and households, are aware of waste separation (Aleluia & Ferrao, 2016) [47]. However, debris separation involves integrated waste management, which employs several waste control methods based on the waste hierarchy, which includes avoidance reduction, reuse, and disposal (Kulkarni et al., 2014) [14]. According to Kulkarni et al. (2014), the waste hierarchy is aimed at minimising the environmental impact of waste [14]. However, it is important for those who participate in waste generation to be informed on how to manage waste, such as different types of waste, and how to separate them.
3.2. Relationship between Waste Reduction Targets and Waste Management Expenditure
The projection of future waste volumes and expenses can be done with limited accuracy, due to population dynamics (Phiri & Godfrey, 2012) [50]. In the industrial age, resource extraction and production of goods have consistently expanded to satisfy the ever-growing consumption culture (Lopes, 2014) [51]. Waste collection is a highly visible service that involves significant expenditure and challenging operational issues. Additionally, it is expensive to operate, regarding investment costs, operational costs, and environmental costs (Faccio et al., 2011) [52]. Fullerton et al. (2014) found that while overall business spending and business investment are positively related to waste and environmental management, and current period expenditure is not related to waste and environmental management [53]. The production processes have transformed into a complex that mainly uses the opposite. As a result, the waste products are from a mixed source, environmentally damaging and expensive to manage sustainably (Schwartz, 2013; Pearse & Crocker, 2013) [54,55]. Hence, firms are likely to face significant expenditure to meet their waste reduction targets.
It is therefore important and essential to have estimated future trends and environments, for planning purposes in line with economic development (Phiri & Godfrey, 2012) [50]. According to Scardamalia and Bereiter (2013), waste information is necessary for proper management planning, and data on waste generation and management are sometimes not reliable enough [56]. This is due to the high number of waste types and flows, and actors; that is, procedure, administration, and managers, who make data collection and treatment difficult.
Manufacturing firms must be able to manufacture at low production cost with minimum resource usage, the approach would lead to the reduction of costs, and the adoption of recycling could result in positive environmental impact (Lacarriere et al., 2015) [57]. The study of Gangollells et al. (2014), and Sukholthaman and Sharp (2016), state that the development of a waste management plan for each production activity involves a significant extra cost [22,58]. In their study, Gangollells et al. (2014), and Sukholthaman and Sharp (2016), found that for firms to handle a significant amount of waste, they should opt to outsource the waste treatment, especially the disposal and transportation of waste, which leads to a high waste management cost [22,58].
Gangollells et al. (2014) indicate that government should provide support for small firms, because they are unaware of some fundamental aspects relating to waste management, such as waste information to achieve waste reduction at minimum cost, and identification of the nearest waste management facilities [22]. According to Sukholthaman and Sharp (2016), waste reduction involves the process of waste collection and transportation, that involves a significant amount of expenditure, and has dynamic and very complex operational problems [58]. D’onza et al. (2016) indicate that waste collection and disposal increases the complexity of the waste management operation, and also it is difficult to evaluate and track the cost [59]. Moreover, Debnath, and Bose (2014) state that the selection of the most appropriate and reasonable waste allocation and collection could become more complex [60]. Therefore, support may be required to help firms deal with waste separation and waste expenditure.
Waste reduction has continued to be a significant problem in the current century, and it is not surprising to observe that financial managers worldwide consider the reduction of these costs to be a critical sustainability driver (Wilburn & Wilburn, 2013; Henri et al., 2016; Hornsby et al., 2016) [19,61,62]. Wang et al. (2014) indicate that companies with environmental expenditures were significantly more productive than companies without environmental expenditure [63]. The objective of reducing waste can be achieved through waste prevention and waste recycling projects, by yielding higher economic and environmental value (van Hoof & Lyon, 2013; Wang et al., 2014) [63,64]. It can be argued that firms are facing the challenge of waste management expenditure due to the complicity of waste reduction management. Moreover, it is likely that firms with expenditure relating to waste reduction targets are more productive than those without. Hence, we examined the following hypothesis:
Hypothesis 1 (H1).
There is no relationship between waste reduction targets and waste management expenditure in selected JSE listed firms.
3.3. Firm Financial Performance
Firms will maintain a sound financial performance if their environmental management depends less on end-of-pipe control, and rely on the firm’s capability to facilitate environmentally sustainable economic activity (Chen et al., 2016) [65]. Rokhmawati et al. (2015) indicate that for firms to be successful in the long run, they should address their environmental issues, and manage their business efficiently by incorporating climate change into their strategic decisions [66]. In their study, Rokhmawati et al. (2015) also suggested that firms must pay attention to the interest of stakeholders, because ignoring their interest will make it difficult for the firm to achieve its financial goals, as the negative reaction of stakeholders is likely to increase costs [66]. Hence, firm financial performance is likely to be affected, if firms are not engaged in sustainable waste management.
According to the study of Lucas and Noordewier (2016), the firm should guide their managers in understanding the conditions that lead to the greatest performance benefits when taking good care of the environment [67]. Failing to support environmental issues would make it difficult for the firms to achieve their targets (Rokhmawati et al., 2015) [66]. Song et al. (2017) state that management of waste, and other environmental related issues, has externality effects, and most companies regard them as a cost with no clear benefit [68]. Song et al. (2017) state that provided the investment leads to extra cost, firms will not take the initiatives to achieve long term environmental protection [68]. Good behavior towards the environment can produce benefits that include improved financial performance through sustainable resource use, and can enhance the firm’s reputation (Wiggill, 2014; Song et al., 2017) [68,69]. Feng et al. (2016) found that a firm’s competitive advantage and performance gained from proper environmental practice may also be influenced by the reactions of its customers and competitors [70]. Similarly, Zhou and Li (2010) indicate that society is likely to affect the performance effects of the firm’s strategic choice [71]. Hence, it is probable that environmental issues affect firms’ finances and reputation.
3.4. Relationship between Waste Reduction Targets and Firms’ Profitability
Nowadays, environmental consequences are considered strategically essential for business operations, with the aim to reduce cost and develop quality products (Yang et al., 2011) [72]. Waste management practices alone are negatively related to market and financial performances (Wong et al., 2012) [73]. However, improved environmental performance substantially reduces the adverse impact of waste management practices on the market and financial performance (Iwata & Okada, 2011) [74]. Laurence (2011) states that environmental management practices could directly or indirectly influence financial performance [75]. Wong et al. (2012) contend that direct or indirect influence can happen if a firm violates an environmental regulation; the firm does not only have to pay fines and penalties, but will also suffer the loss of trust and reputation [73]. Therefore, waste reduction targets may have an inverse relationship with firms’ profitability.
While promoting a sustainable society, in the way of reducing the amount of waste to be treated and disposed of, firms should also have economic gain (Sukholthaman & Sharp, 2016) [58]. In their study, Sukholthaman and Sharp (2016) indicate that firms spend a very high amount of their monthly expenses on the collection and treatment of waste, with an adverse effect on firm’s profitability [58]. Businesses are currently facing environmental pressure; they need to implement strategies to manage and reduce cost, not only on a short term basis, but also over the long term (Henri et al., 2016) [62]. Wellens and Jegers (2014), and Henri et al. (2016), found that environmental issues are a fundamental part of a firm’s strategies, and also state that environmental costs represent an important portion of the manufacturing and operation costs [62,76]. On the other hand, Li et al. (2017) found that neglecting environment issues could result in short term gains or profitability, but in the long term, looking specifically at public goods, most notably, the environment and natural materials are likely to be lost, due to selfish incentives [77]. It is likely that firms are expending an enormous amount of money on waste management, and it may affect their profit negatively.
Wang et al. (2014) found that firms committed to environmental expenditures have better efficiency and productivity [63]. They encourage companies to put more effort into protecting the environment through cleaner production initiatives, to create better benefits in the long run. Moreover, the study of van Ewijk and Stegemann (2014), and Wang et al. (2014), found that the success of firms is based on the amount of attention given to environmental and society-related issues that are integrated to achieve financial benefits [63,78]. There is a positive relationship between economic gain and environmental performance (Wang et al. 2014) [63]. In their study of the impact of environmental expenditures on performance in the United States chemical industry, Wang et al. (2014) identified unexpected earnings, and business growth opportunities, in so much as the company is taking care of the environment [63]. Similarly, López-Gamero et al. (2012) found that companies make more profit, or achieve better financial performance, when they promote good environmental practices [9]. The above-cited studies suggest that manufacturing companies should pay attention to environmental issues, which may likely result in better financial performance.
Henri et al. (2016) also found a direct relationship between the tracking of environmental expenditures and financial performance [62]. They suggest that greater transparency and accuracy of waste and environmental information, in turn, improve managerial decision making, and leads to improved financial performance. Other researchers suggest that reduction in waste and firm financial performance have no association (Fullerton et al., 2014) [53]. The argument is that the link is difficult to ascertain, because of the chances of many influences, which pose a challenge for controls (Nyirenda et al., 2013) [79]. Firms invest funds in the projects that maximize their stock value, and tend to ignore the environment (Khan et al., 2012) [80]. Some managers consider waste management expenditure as a waste of funds (Cooray et al., 2014) [81]. However, contrary to these negative findings, Iwata and Okada (2011) found that waste management investment and profit of the company are strongly associated. They further indicated that when there is a huge amount of waste expenditure, the profit is affected negatively [74]. Pearse and Crocker (2013) found that companies perform well when they obey environmental issues, and they also avoid paying unnecessary fines and penalties [55].
A comprehensive study investigating the role of expenditure on waste for profitability was carried out by Apergis and Sorrows (2014) [82]. They investigated this role in United States firms for five years; their empirical findings show that waste reduction targets have a strong impact on profitability in the group of firms that sell a renewable product using their waste. From above-cited studies, it is likely that waste reduction targets are negatively related to firms’ profitability. As such, we posit that:
Hypothesis 2 (H2).
There is no relationship between waste reduction targets and firm’s profitability in selected JSE listed firms.
4. Method
The study sampled 30 firms consistently listed on the Johannesburg Securities Exchange Socially Responsible Investment (JSE SRI) Index for a period of 10 years (2007 to 2016). The study used a combination of firms from both the mining and manufacturing sectors, because these sectors are considered to be high on waste generation, and they are consistently listed on the JSE SRI Index for the period under consideration. The use of a sample of 30 firms from more than one sector is believed to enhance the study and give robustness to the analysis. Moreover, the JSE SRI Index is a reputable source of reliable financial and non-financial information.
The causal research design was adopted because it measures the correlation between variables and the impact a specific change will have on existing assumptions. Scholars like Cohenet al. (2013); De Franco et al. (2013); Clor-Proell and Maines (2014); Heckman and Pinto (2015); and Gow et al. (2016); have used the causal research design [11,83,84,85].
Information available on the JSE SRI Index is valid and reliable. However, JSE listed firms are expected to comply with the strategic framework governing waste management in South Africa, such as the Air Quality Act (Act 39 of 2004) and the National Environmental Management (Waste Act, 2008 (59 of 2008) [86,87]. The study used the quantitative method to determine the correlation between two variables. The panel data method of analysis was considered appropriate for this study. The regression equation is as follows:
where:
WRTit = αi+ βWMEit1 + βFPit2 + β∆TURNOVERit3 + βLEVERAGEit4
- WRTit = Waste Reduction Targets
- αi = Intercept
- β = Slope
- WMEit1 = Waste Management Expenditure
- FPit2 = Firm’s Profitability
- ∆TURNOVERit3 = Change in Tunrover
- LEVERAGEit4 = Leverage
In this study, waste reduction targets (WRT) was used as a dependent variable, and independent variables are waste management expenditure (WME) and firm’s profitability (FP). Change in turnover and leverage are control variables since different characteristics of a firm can affect both a company’s waste management expenditure and waste reduction target in various ways. The analysis of the effect between waste management expenditure and waste reduction target alone does not justify the findings from this study. Previous researchers used to control variables in their studies to justify their findings (Galbreathe & Shum, 2012; Saeidi et al., 2015; Henri et al., 2016; Chen et al., 2016) [62,65,88,89]. The objective of using control variables is to control for factors that may influence the regression result. Therefore, this study considered leverage, and change in turnover, to be control variables. Prior studies, such as Danso and Adomako (2014), and Fosu et al. (2016), used leverage as a control variable, and the study of Chen et al. (2016) used change in turnover, among others, as a control variable, in their study of understanding the relationships between environmental management practices and financial performances of multinational construction firms [65,90,91]. In line with prior studies, such as Nyirenda et al., 2013, and Panagiotidou et al. (2015), the study used two-panel data techniques, namely, fixed-effects model, and random-effects model [79,92]. The Hausman test is used to identify if the individual effects are random.
5. Results
This section presents and discusses the findings of the study.
Table 1 above shows 300 observations for 10 years for 7 manufacturing firms and 21 mining firms listed on JSE SRI Index. The mean of the dependent variable, waste reduction targets (WRT) was 5.4812, while those for the independent variables, waste management expenditure (WME) and firm’s profitability (FP), were 0.9763 and 2.811257, respectively. Moreover, the mean of the control variables change in turnover and leverage, were 4.36147 and 1.8838, respectively.
The standard deviation measures the dispersion of variables; for this research, it shows the standard deviation for waste reduction targets of 12.33445, waste management expenditure has a deviation of 2.587124, and firms’ profitability has a deviation of 64.54298. While on the other hand, the control variables change in turnover and leverage, have a deviation of 11.90228 and 11.52015, respectively.
As seen in Table 1 above, the minimum and maximum for waste reduction targets are 0 and 87.34, waste management expenditure is 0 and 12.38, and for firm’s profitability, −493.51 and 815.48. However, change in turnover, as one of the control variables, has a minimum and maximum of −36 and 50. The other control variable leverage has a minimum and maximum of −32.47 and 155.65. Table 2 presents the results of the independent t-test of the study variables.
Table 2 shows an independent t-test using a sample of 600 combined obs of independent variables (IVs) (change in turnover and leverage) to determine if they influence waste reduction targets differently. This test determines whether the means of the population are equal or not. In this case, it is appropriate to test the control variables, as they are independent, and of a different population. Both IVs consists of 600 randomly-assigned observations. The results indicate that leverage had a statistically significantly lower influence on waste reduction targets compared to the change in turnover . Therefore, change in turnover and leverage were not statistically significant to influence waste reduction targets. Table 3 shows the correlation between individual variables.
As seen from Table 3 above, the correlation between dependent variable waste reduction targets and itself is a perfect 1.0000. The same applies to the independent variables, waste management expenditure and firms’ profitability, which were also 1.0000. Table 3 also shows a positive correlation between waste reduction targets and waste management expenditure of 0.0919. Table 4 below presents the multiple linear regression of the variables.
From Table 4 above, the significant statistics to note is the adjusted R-squared. As the significant levels have been set to 95% confidence, the adjusted R-squared shows −0.11% level. This renders the regression as insignificant. A further analysis tested the variables for significant factors that could affect the regression, multicollinearity (see Table 5) and auto-correlation below. The results below present the autocorrelation test.
Autocorrelation test (Durbin–Watson statistics)
Durbin–Watson d-statistic (5, 300) = 0.7106506
Source: author’s results of Durbin–Watson test from Stata.
The Durbin–Watson test was performed to test the autocorrelation within the panel data. It is appropriate to enhance the reliability of the regression results, as the number of observations may give rise to the effect of autocorrelation, which may affect the authenticity of the panel regression. The Durbin–Watson statistic is between 0 and 2; if the results are close to 2, it means there is autocorrelation, and if the results are close to 0, it means there is no autocorrelation.
From the results in Table 5, show the Durbin–Watson of 0.7106506, which is closer to 0. This means that there is no autocorrelation within the variables of the study. Figure 1 presents the scatter plots for the variables.
For enhancement of the regression validity, the multicollinearity test was performed. Multicollinearity can create a problem in regression, as it can lead to a situation where the independent variables are closely correlated with one another, leading to a bias in the probability values (p-values). In testing for the presence of multicollinearity, the variance inflation factors (VIF) test was performed in Stata. This test measures how the standard errors inflate the coefficients in the regression model, leading to a bias in the p-values. An ideal VIF should not be more than four times the square of the standard errors. Therefore, based on the mean VIF (1.03) and the individual VIF of the independent variables as shown in Table 5, no multicollinearity is present.
The result below shows the results for heteroscedasticity test.
Breusch–Pagan/Cook–Weisberg test for heteroscedasticity
Ho: Constant variance
chi2(4) = 11.84
Prob > chi2 = 0.0186
Source: Author’s results of heteroscedasticity from Stata.
According to Williams (2015), if error terms do not have constant variance, they are said to be heteroscedastic, on the other side, when the variance of the error term is constant, it is called homoscedasticity [93]. A large chi-square would indicate heteroscedasticity (Williams, 2015) [93]. In this study, the chi-square is 0.0186. Therefore, heteroscedasticity is not present. Table 6 presents the correlation matrix of coefficients of regress model.
Table 6 above shows the correlations between the variables. All variables are perfectly correlated with each other (1.0000). However, the correlation between waste management expenditure and firm profitability is shown as −0.1010. Overall, results show a correlation closer to 0.000, hence no multicollinearity is present. Table 7 and Table 8 present the panel data results using the fixed effects model for waste reduction targets.
From Table 8 above, the relevant results to take note of are the p-values and the coefficient of the regressors. The significance level is set at 95% levels, with p-values greater than 0.05 considered to be insignificant, similar to other waste management studies (Worku & Muchie, 2012; Licy et al., 2013; Kishore et al., 2014; Richter et al., 2017) [94,95,96,97]. The result above shows that there is a positive, but insignificant, relationship between waste reduction targets and waste management expenditure represented by a coefficient of 0.373839 and a p-value of 0.207. Therefore, the result reveals that waste management expenditure has a negative and insignificant association on waste reduction targets. A positive and insignificant relationship between waste reduction targets and firms’ profitability is also reported from the results.
Moreover, the results show that there is a negative correlation between change in turnover and waste reduction targets, indicated by −0.02779 coefficient and a p-value of 0.610. Lastly, Table 8 also shows that there is a negative correlation between leverage and waste reduction targets, represented by a coefficient of −0.00204 and p-value of 0.971. Table 9 and Table 10 below show the results for the random effects model for waste reduction targets.
From Table 10 above, the relevant statistics to take note of are the coefficient and the p-values. The significance level is set at 95% levels, with p-values greater than 0.05 interpreted to be insignificant. The results show the coefficient of 0.389756 and p-value of 0.164. The findings show that there is a positive, but insignificant, association between waste reduction targets and waste management expenditure. This indicates that any increase in waste management expenditure will lead to an increase in waste reduction targets by 38.98%.
Moreover, the results show that there is a negative correlation between change in turnover and waste reduction targets, demonstrated by the coefficient of −0.03061 and p-value of 0.565. Furthermore, the results also show that there is a negative correlation between leverage and waste reduction targets, represented by a coefficient of −0.00634 and p-value of 0.909.
In deciding between the fixed effects model and random effects model for waste reduction targets, the Hausman test is appropriate, where the null hypothesis confirms that the preferred model is the random effects model, while the alternative is the fixed effects model. Table 11 below presents Hausman test results for waste reduction targets.
The results from Table 11 above from the Hausman test run, indicate the use of random effects model, since prob > chi2 = 0.9899 is greater than 0.05. Therefore, the study used the results from random effects model to establish the relationship between waste reduction targets (dependent variable) and the independent variables (waste management expenditure and firms’ profitability). The following section discusses the findings.
6. Discussion
The aim of this study was to determine whether there is a link between waste reduction targets and waste management expenditure. Therefore, one of the objectives is to examine the relationship between waste management expenditure on waste reduction target in selected JSE listed mining and manufacturing firms for the period of 10 years (2007–2016).
The study performed the Hausman test to decide the appropriate model, between the fixed effects and the random effects models. The random effects model was the appropriate model chosen, since the statistical prob > chi2 was greater than 0.05, hence, the fixed effects model was rejected.
6.1. Random Effects Model: Relationship between Waste Reduction Targets and Waste Management Expenditure
As seen from Table 10 above, the results from the random effects model shows a positive, but insignificant, correlation between the two variables, since the confidence interval was set at 95%, and p-values less than 5% are considered to be statically significant in this study. The random effects model was accepted, as the probability of chi2 is 0.9899, which is more than the 0.05. The results, therefore, revealed that there is a positive, but insignificant, association between waste reduction targets and waste management expenditure, demonstrated by the coefficient of 0.389756 and p-value of 0.164. This indicates that any increase in waste management expenditure will lead to an increase in waste reduction targets by 38.98%. The statistical results led to the rejection of the hypothesis (H1) of the study.
These results are similar to the results of Yang et al. (2011), Molina-Azorin et al. (2015), and Richter et al. (2017) [72,97,98]. Yang et al. (2011) focused on the elimination of waste within the company’s production process through continuous development, and changes for reducing non-value added activities [72]. The statistical results of their study showed an estimated coefficient of 0.223, t-value of 2.527, and a p-value of greater than 0.05, which made the researchers conclude that there is a positive, but insignificant, influence on waste elimination targets and waste management investments. The study further indicated that increasing resource requirements for the establishment, and implementation of waste elimination, might lead to increase in waste reduction costs for firms. Moreover, Yang et al. (2011) suggest that good environmental practice regarding waste prevention, reduced emission, and less waste treatment, are associated with high financial resources [72].
6.2. Random Effects Model: Relationship between Waste Reduction Targets and Firms’ Profitability
The hypothesis (H2) indicates that waste reduction targets do not have any impact on firm’s profitability in selected JSE listed manufacturing companies. From the results in Table 10, there is a positive relationship between waste reduction targets and firm’s profitability, demonstrated by 0.004134 of coefficient and the p-value of 0.656. This finding has led to the rejection of the hypothesis (H2). This implies that an increase in waste reduction targets leads to an increase in firm’s profitability.
These results are consistent with those of Lopez-Gamero et al. (2012) [9], but inconsistent with the findings of Mathuva and Kiweu (2016) [99]. The study of Lopez-Gamero et al. (2012) had an objective of examining the whole relationship between environmental variables and firm financial performance [9]. The p-value of the study of Lopez-Gamero et al. (2012) was set at 5% for significance [9]. The study found a statistical significance between two variables, and the finding supported their research hypothesis (H1). Mathuva and Kiweu (2016), on the other hand, reported a negative association between environmental and waste management, and financial performance of the companies [99]. The significance of the results was set at 5%, of which the probability value 0.05 was reported. Therefore, it was regarded as a positive association between two variables. Among other statistical methods applied, the study showed the coefficient of 0.004134, the z-value of 0.45, and p-value of 0.656.
7. Conclusions
The overall results of this study showed that there is a significant link between waste management expenditure and waste reduction targets in the waste management systems for improved environmental performance of companies. As evidenced from existing literature, no prior studies regarding the impact of waste reduction targets on waste management expenditure and companies’ profitability have been carried out within mining and manufacturing firms in South Africa. The results, thus, are important in adding to the waste management/financial performance debate, particularly in the context of an emerging African economy, like South Africa. Three theories, namely the waste management theory, stakeholder, and legitimacy theories, provided insights into the thinking of scholars in this study area. The WMT confirms the relevance of setting waste reduction targets, which are influenced in this study by waste management. This shows that in achieving the desired waste reduction target, firms need to invest in its management. The study noted that when firms manage their waste effectively, it leads to good ethical behavior and a consideration of their stakeholders’ interest. Waste management theory indicates that moving towards waste reduction requires that the firms commit themselves to increase the proportion of non-waste leaving the process. Moreover, legitimacy theory encourages firms to take care of the waste generated, to act in the best interest considering norms and values of society; this is true because it is the legitimate thing to do. Moreover, the stakeholder confirms that by investing more in waste management, firms are responsive to the needs of its stakeholder by reducing the volume of waste that ends up in the landfill.
The study explained the adoption of quantitative methods, which helped the researcher to address the objectives of this study. The study adopted a causal research design. With the casual research design, the study was able to address the impact of waste management expenditure on waste reduction targets, and the relationship between waste reduction targets and firms’ profitability. The study used the mixed method approach. The approach was appropriate for this study because it enabled the researcher to test for possible relationships between waste management expenditure (measured in Rand) and waste reduction targets (measured in tons), and also, to examine the impact of waste reduction targets on firm’s profitability (measured in Rand).
Data was sourced from published integrated financial and sustainability reports of the selected mining and manufacturing firms. The researchers firmly believe that the adoption of the methods mentioned above is appropriate to fulfil the objective of this study.
The study used the South African mining and manufacturing sectors as the population, because it was easy to obtain valid and comparable sustainability reports and integrated annual financial statements from the JSE and the companies’ websites. The mining and manufacturing sectors were chosen, among other sectors, because firms within these sectors have the most influence on waste generation in both the environment and society.
The control variables were described. The objective of using control variables is to control for factors that may influence the result of the regression analysis. Leverage and change in turnover were used as control variables in the study. The panel data analysis was discussed.
The results revealed that there is a positive association between waste management expenditure and waste reduction targets. Moreover, results show an insignificant positive association between firm’s profitability and waste reduction targets. On the other hand, the study used legislative documents to explain the data, to ensure consistency with the results of the statistical analysis. From the explanations, the study shows an overview of South African manufacturing firms’ waste reduction strategies, compliance with mandatory legislation, and voluntary waste management guidelines and the ISO 14001 were also explained, about the practices of the firms.
South Africa has its regulations, like other countries in the world, to protect the environment, health, and well-being of those who live in it. The study found that firms in the study are fully compliant with the legislations. In doing so, the firms avoided possible penalties by protecting their reputation from the various stakeholders. Lastly, firms in this study are voluntarily engaging with their stakeholder. Results indicate that most firms are working towards reducing the amount of waste produced in their production processes with the objective of achieving a sustainable environment.
The results of this study added to the existing knowledge and literature on the waste reduction and waste management. The study has paved the way for further research in the field of waste and waste management.
This study has limitations. The paper used sustainability reports for analysis; therefore, our results cannot be generalized. The study used those mining and manufacturing firms that were consistently listed on the JSE SRI, and these were 30 in total. Other researchers may use other sectors, and they can also use a larger sample. Many firms that are operating in South Africa are not listed under the sectors mentioned above, and as a result, the findings of this study, therefore, may not be fully representative of the mining and manufacturing sectors in South Africa.
From the study, one can note that waste information and waste management are of critical environmental concerns. This study paved the way for other future researchers in the waste reduction and waste management area. Future researchers may opt for other sectors, and may use an increased number of firms.
Acknowledgments
We wish to express our gratitude to the Africa Centre for Sustainability Accounting and Management (ACSAM) for making funds available to cover the costs to publish our paper in open access.
Author Contributions
Thabo Gerald Maleka is a graduate student under the supervision of Gibson Nyirenda and Michael Bamidele Fakoya. This manuscript is the output from the dissertation both authors have worked on.
Conflicts of Interest
The authors declare no conflict of interest. The founding sponsors had no role in the design of the study; in the collection, analyses, or interpretation of data; in the writing of the manuscript, and in the decision to publish the results.
References
- Gunasekaran, A.; Spalanzani, A. Sustainability of manufacturing and services: Investigations for research and applications. Int. J. Prod. Econ. 2012, 140, 35–47. [Google Scholar] [CrossRef]
- Periathamby, A.; Hamid, F.S.; Khidzir, K. Evolution of solid waste management in Malaysia: Impacts and implications of the solid waste bill, 2009. J. Mater. Cycl. Waste Manag. 2011, 11, 96–103. [Google Scholar] [CrossRef]
- Das, S.; Bhattacharyya, B.K. Optimization of municipal solid waste collection and transportation routes. Waste Manag. 2015, 43, 9–18. [Google Scholar] [CrossRef] [PubMed]
- Fiehn, H.; Ball, J. Background Research Paper: Waste. South Africa Environment Outlook; National State of the Environment Project; Department of Environmental Affairs and Tourism: Pretoria, South Africa, 2005.
- Mitchell, C.G.; Hill, T.R. An exploratory analysis of stakeholders’ expectations and perceptions of corporate social and environmental reporting in South Africa. S. Afr. J. Acc. Res. 2011, 24, 49–78. [Google Scholar] [CrossRef]
- Raufflet, E.; Cruz, L.B.; Bres, L. An assessment of corporate social responsibility practices in the mining and oil and gas industries. J. Clean. Prod. 2014, 84, 256–270. [Google Scholar] [CrossRef]
- Costantini, V.; Mazzanti, M.; Montini, A. Environmental performance, innovation and spill overs. Evidence from a regional NAMEA. Ecol. Econ. 2013, 89, 101–114. [Google Scholar] [CrossRef]
- Du Toit, A.S.A. Using environmental scanning to collect strategic information: A South African survey. Int. J. Inf. Manag. 2016, 36, 16–24. [Google Scholar] [CrossRef]
- López-Gamero, M.D.; Molina-Azorín, J.F.; Claver-Cortes, E. The whole relationship between environmental variables and firm performance: Competitive advantage and firm resources as mediator variables. J. Environ. Manag. 2012, 90, 3110–3121. [Google Scholar] [CrossRef]
- Guerrero, L.A.; Maas, G.; Hogland, W. Solid waste management challenges for cities in developing countries. Waste Manag. 2013, 33, 220–232. [Google Scholar] [CrossRef] [PubMed]
- Clor-Proell, S.M.; Maines, L.A. The impact of recognition versus disclosure on financial information: A preparer’s perspective. J. Acc. Res. 2014, 52, 671–701. [Google Scholar] [CrossRef]
- Shaw, W. Will Emerging Economies Repeat the Mistakes of Their Rich Cousins? International Economic Bulletin 2012. Available online: http://carnegieendowment.org/2012/03/01/will-emerging-economies-repeat-environmental-mistakes-of-their-rich-cousins/c9eb (accessed on 7 May 2015).
- Bárcena-Ruiz, J.C.; Casado-Izaga, F.J. Regulation of waste management under spatial competition. J. Clean. Prod. 2015, 92, 216–222. [Google Scholar] [CrossRef]
- Kulkarni, S.; Rao, P.; Patil, Y. Are the non-renewable resource utilization and waste management practices employed in Indian automobile sector sustainable? Procedia Soc. Behav. Sci. 2014, 133, 364–371. [Google Scholar] [CrossRef]
- Shalini, S.; Harsh, M.; Mathur, B.P. Evaluation of bio-medical waste management practices in a government medical college and hospital. Natl. J. Community Med. 2012, 3, 80–84. [Google Scholar]
- Metin, E.; Eröztürk, A.; Neyim, C. Solid waste management practices and review of recovery and recycling operations in Turkey. Waste Manag. 2013, 23, 425–432. [Google Scholar] [CrossRef]
- Gow, I.D.; David, F.L.; Peter, C.R. Causal inference in accounting research. J. Acc. Res. 2016, 54, 477–523. [Google Scholar] [CrossRef]
- Mihai, F.C.; Ingrao, C. Assessment of biowaste losses through unsound waste management practices in rural areas and the role of home composting. J. Clean. Prod. 2016. [Google Scholar] [CrossRef]
- Hornsby, C.; Ripa, M.; Vassillo, C.; Ulgiati, S. A roadmap towards integrated assessment and participatory strategies in support of decision-making processes. The case of urban waste management. J. Clean. Prod. 2016, 142, 157–172. [Google Scholar] [CrossRef]
- Caspersen, N. Degrees of legitimacy: Ensuring internal and external support in the absence of recognition. Geoforum 2015, 66, 184–192. [Google Scholar] [CrossRef]
- Qian, X.; Schneider, I.E. Waste minimization practices among tourism businesses: A multi-year comparison. Tour. Manag. Perspect. 2016, 19, 19–23. [Google Scholar] [CrossRef]
- Gangolells, M.; Casals, M.; Forcada, N.; Macarulla, M. Analysis of the implementation of effective waste management practices in construction projects and sites. Resour. Conserv. Recycl. 2014, 93, 99–111. [Google Scholar] [CrossRef] [Green Version]
- Bisschop, L. How e-waste challenges environmental governance. Int. J. Crime Justice Soc. Democr. 2016, 3, 82–96. [Google Scholar]
- Hafeez, S.; Mahmood, A.; Syed, J.H.; Li, J.; Ali, U.; Malik, R.N.; Zhang, G. Waste dumping sites as a potential source of POPs and associated health risks in perspective of current waste management practices in Lahore city, Pakistan. Sci. Total Environ. 2016, 562, 953–961. [Google Scholar] [CrossRef] [PubMed]
- Pongrácz, E.; Phillips, P.S.; Keiski, R.L. Evolving the theory of waste management-implications to waste minimization. In Proceedings of the Waste Minimization and Resources Use Optimization Conference, Oulu, Finland, 10 June 2004; pp. 61–67. [Google Scholar]
- Pongrácz, E. Industrial ecology and waste management: From theories to applications. Prog. Ind. Ecol. Int. J. 2006, 3, 59–74. [Google Scholar] [CrossRef]
- García, V.; Pongrácz, E.; Keiski, R. Waste minimization in the chemical industry: From theory to practice. In Proceedings of the Waste Minimization and Resources Use Optimization Conference, Oulu, Finland, 10 June 2004; pp. 93–106. [Google Scholar]
- Pongrácz, E.; Pohjola, V.J. Re-defining waste, the concept of ownership and the role of waste management. Resour. Conserv. Recycl. 2004, 40, 141–153. [Google Scholar] [CrossRef]
- Jo, H.; Kim, H.; Park, K. Corporate environmental responsibility and firm performance in the financial services sector. J. Bus. Ethics 2015, 131, 257–284. [Google Scholar] [CrossRef]
- Lafreniere, K.C.; Deshpande, S.; Bjornlund, H.; Hunter, M.G. Extending stakeholder theory to promote resource management initiatives to key stakeholders: A case study of water transfers in Alberta, Canada. J. Environ. Manag. 2013, 129, 81–91. [Google Scholar] [CrossRef] [PubMed]
- Park, B.I.; Ghauri, P.N. Determinants influencing CSR practices in small and medium sized MNE subsidiaries: A stakeholder perspective. J. World Bus. 2015, 50, 192–204. [Google Scholar] [CrossRef]
- Avetisyan, E.; Ferrary, M. Dynamics of Stakeholders’ Implications in the Institutionalization of the CSR Field in France and in the United States. J. Bus. Ethics 2013, 115, 115–133. [Google Scholar] [CrossRef]
- Chen, J.L.; Liu, H.H.; Chuang, C.T.; Lu, H.J. The factors affecting stakeholders’ acceptance of offshore wind farms along the western coast of Taiwan: Evidence from stakeholders’ perceptions. Ocean. Coast. Manag. 2015, 109, 40–50. [Google Scholar] [CrossRef]
- Mishra, S.; Suar, D. Does corporate social responsibility influence firm performance of Indian companies? J. Bus. Ethics 2010, 95, 571–601. [Google Scholar] [CrossRef]
- Suchman, M.C. Managing legitimacy: Strategic and institutional approaches. Acad. Manag. Rev. 1995, 20, 571–610. [Google Scholar]
- Treviño, L.K.; Nieuwenboer, N.A.; Kreiner, G.E.; Bishop, D.G. Legitimating the legitimate: A grounded theory study of legitimacy work among Ethics and Compliance Officers. Organ. Behav. Hum. Decis. Proc. 2014, 123, 186–205. [Google Scholar] [CrossRef]
- Reisig, M.D.; Bain, S.N. University legitimacy and student compliance with academic dishonesty codes a partial test of the process-based model of self-regulation. Crim. Justice Behav. 2016, 43, 83–101. [Google Scholar] [CrossRef]
- Humphreys, A.; Latour, K.A. Framing the game: Assessing the impact of cultural representations on consumer perceptions of legitimacy. J. Consum. Res. 2013, 40, 773–795. [Google Scholar] [CrossRef]
- Jerie, S.; Tevera, D. Solid Waste Management Practices in the Informal Sector of Gweru, Zimbabwe. J. Waste Manag. 2014, 20, 1–8. [Google Scholar] [CrossRef]
- Fischer-Cripps, A.C. Contact Mechanics. In Nanoindentation; Springer: New York, NY, USA, 2011. [Google Scholar]
- Olsen, T.D. Political Stakeholder Theory: The State, Legitimacy, and the Ethics of Microfinance in Emerging Economies. Bus. Ethics Q. 2017, 27, 212–256. [Google Scholar] [CrossRef]
- Gunsilius, E.; Chaturvedi, B.; Scheinberg, A. The Economics of the Informal Sector in Solid Waste Management; CWG/GIZ: Eschborn, Germany, 2011. [Google Scholar]
- Masood, M.; Barlow, C.Y. Framework for integration of informal waste management sector with the formal sector in Pakistan. Waste Manag. Res. 2013, 2, 1–13. [Google Scholar] [CrossRef] [PubMed]
- Brunner, P.H.; Rechberger, H. Waste to energy–key element for sustainable waste management. Waste Manag. 2015, 37, 3–12. [Google Scholar] [CrossRef] [PubMed]
- Bachmann, P.; Ingenhoff, D. Legitimacy through CSR disclosures? The advantage outweighs the disadvantages. Public Relat. Rev. 2016, 42, 386–394. [Google Scholar] [CrossRef]
- De Besi, M.; McCormick, K. Towards a bioeconomy in Europe: National, regional and industrial strategies. Sustainability 2015, 7, 10461–10478. [Google Scholar] [CrossRef]
- Aleluia, J.; Ferrão, P. Characterization of urban waste management practices in developing Asian countries: A new analytical framework based on waste characteristics and urban dimension. Waste Manag. 2016, 58, 415–429. [Google Scholar] [CrossRef] [PubMed]
- Adomako, S.; Danso, A. Regulatory environment, environmental dynamism, political ties, and performance: Study of entrepreneurial firms in a developing economy. J. Small Bus. Enterp. Dev. 2014, 21, 212–230. [Google Scholar] [CrossRef]
- Bhattacharyya, S. Trade liberalization and institutional development. J. Pol. Model. 2012, 34, 253–269. [Google Scholar] [CrossRef]
- Phiri, A.; Godfrey, L. Modelling the generation of domestic waste for supporting the planning of municipal waste services. Int. J. Water Resour. Environ. Eng. 2012, 4, 171–191. [Google Scholar]
- Lopes, A. Environmental, economic and social costs and benefits of a packaging waste management system: A Portuguese case study. Resour. Conserv. Recycl. 2014, 85, 67–78. [Google Scholar]
- Faccio, M.; Persona, A.; Zanin, G. Waste collection multi objective model with real time traceability data. Waste Manag. 2011, 31, 2391–2405. [Google Scholar] [CrossRef] [PubMed]
- Fullerton, R.R.; Kennedy, F.A.; Widener, S.K. Lean manufacturing and firm performance: The incremental contribution of lean management accounting practices. J. Oper. Manag. 2014, 32, 414–428. [Google Scholar] [CrossRef]
- Schwartz, M.S. Developing and sustaining an ethical corporate culture: The core elements. Bus. Horiz. 2013, 56, 39–50. [Google Scholar] [CrossRef]
- Pearse, I.H.; Crocker, L.H. The Peckham Experiment: A Study of the Living Structure of Society; Routledge: Abingdon, UK, 2013. [Google Scholar]
- Scardamalia, M.; Bereiter, C. Knowledge building environments: Extending the limits of the possible in education and knowledge work. Encyclopaed. Distr. Learn. 2013, 2, 269–272. [Google Scholar]
- Lacarrière, B.; Deutz, K.R.; Jamali-Zghal, N.; Le Corre, O. Emergy assessment of the benefits of closed-loop recycling accounting for material losses. Ecol. Model. 2015, 315, 77–87. [Google Scholar] [CrossRef]
- Sukholthaman, P.; Sharp, A. A system dynamics model to evaluate effects of source separation of municipal solid waste management: A case of Bangkok, Thailand. Waste Manag. 2016, 52, 50–61. [Google Scholar] [CrossRef]
- D’Onza, G.; Greco, G.; Allegrini, M. Full cost accounting in the analysis of separated waste collection efficiency: A methodological proposal. J. Environ. Manag. 2016, 167, 59–65. [Google Scholar] [CrossRef] [PubMed]
- Debnath, S.; Bose, S.K. Exploring full cost accounting approach to evaluate cost of MSW services in India. Resour. Conserv. Recycl. 2014, 83, 87–95. [Google Scholar] [CrossRef]
- Wilburn, K.; Wilburn, R. Using Global Reporting Initiative indicators for CSR programs. J. Glob. Responsib. 2013, 4, 62–75. [Google Scholar] [CrossRef]
- Henri, J.F.; Boiral, O.; Roy, M.J. Strategic cost management and performance: The case of environmental costs. Br. Acc. Rev. 2016, 48, 269–282. [Google Scholar] [CrossRef]
- Wang, W.K.; Lu, W.M.; Wang, S.W. The impact of environmental expenditures on performance in the US chemical industry. J. Clean. Prod. 2014, 64, 447–456. [Google Scholar] [CrossRef]
- Van Hoof, B.; Lyon, T.P. Cleaner production in small firms taking part in Mexico’s Sustainable Supplier Program. J. Clean. Prod. 2013, 41, 270–282. [Google Scholar] [CrossRef]
- Chen, P.H.; Ong, C.F.; Hsu, S.C. Understanding the relationships between environmental management practices and financial performances of multinational construction firms. J. Clean. Prod. 2016, 139, 750–760. [Google Scholar] [CrossRef]
- Rokhmawati, A.; Sathye, M.; Sathye, S. The Effect of GHG Emission, Environmental Performance, and Social Performance on Financial Performance of Listed Manufacturing Firms in Indonesia. Procedia Soc. Behav. Sci. 2015, 211, 461–470. [Google Scholar] [CrossRef]
- Lucas, M.T.; Noordewier, T.G. Environmental management practices and firm financial performance: The moderating effect of industry pollution-related factors. Int. J. Prod. Econ. 2016, 175, 24–34. [Google Scholar] [CrossRef]
- Song, H.; Zhao, C.; Zeng, J. Can environmental management improve financial performance: An empirical study of A-shares listed companies in China. J. Clean. Prod. 2017, 141, 1051–1056. [Google Scholar] [CrossRef]
- Wiggill, M.N. Communicating for organisational legitimacy: The case of the Potchefstroom Fire Protection Association. Public Relat. Rev. 2014, 40, 315–327. [Google Scholar] [CrossRef]
- Feng, T.; Cai, D.; Wang, D.; Zhang, X. Environmental management systems and financial performance: The joint effect of switching cost and competitive intensity. J. Clean. Prod. 2016, 113, 781–791. [Google Scholar] [CrossRef]
- Zhou, K.Z.; Li, C.B. How strategic orientations influence the building of dynamic capability in emerging economies. J. Bus. Res. 2010, 63, 224–231. [Google Scholar] [CrossRef] [Green Version]
- Yang, M.G.M.; Hong, P.; Modi, S.B. Impact of lean manufacturing and environmental management on business performance: An empirical study of manufacturing firms. Int. J. Prod. Econ. 2011, 129, 251–261. [Google Scholar] [CrossRef]
- Wong, C.W.; Lai, K.H.; Shang, K.C.; Lu, C.S.; Leung, T.K.P. Green operations and the moderating role of environmental management capability of suppliers on manufacturing firm performance. Int. J. Prod. Econ. 2012, 140, 283–294. [Google Scholar] [CrossRef]
- Iwata, H.; Okada, K. How does environmental performance affect financial performance? Evidence from Japanese manufacturing firms. Ecol. Econ. 2011, 70, 1691–1700. [Google Scholar] [CrossRef] [Green Version]
- Laurence, D. Establishing a suitable mining operation: An overview. J. Clean. Prod. 2011, 19, 278–284. [Google Scholar] [CrossRef]
- Wellens, L.; Jegers, M. Effective governance in nonprofit organizations: A literature based multiple stakeholder approach. Eur. Manag. J. 2014, 32, 223–243. [Google Scholar] [CrossRef]
- Li, D.; Zheng, M.; Cao, C.; Chen, X.; Ren, S.; Huang, M. The impact of legitimacy pressure and corporate profitability on green innovation: Evidence from China top 100. J. Clean. Prod. 2017, 141, 41–49. [Google Scholar] [CrossRef]
- Van Ewijk, S.; Stegemann, J.A. Limitations of the waste hierarchy for achieving absolute reductions in material throughput. J. Clean. Prod. 2016, 132, 122–128. [Google Scholar] [CrossRef]
- Nyirenda, G.; Ngwakwe, C.C.; Ambe, C.M. Environmental Management Practice and Firm Performance in a South African Mining Firm. Manag. Glob. Trans. 2013, 11, 243–2260. [Google Scholar]
- Khan, A.; Kaleem, A.; Nazir, M.S. Impact of financial leverage on agency cost of free cash flow: Evidence from the manufacturing sector of Pakistan. J. Basic Appl. Sci. Res. 2012, 2, 6694–6700. [Google Scholar]
- Cooray, N.; Murshidha, F.; Senanayake, N.; Prashanty, R.; Rathnasinghe, U.; Dharmika, J. Adopting and Implementing Waste Management Practices in the Printing Industry- A Sri Lankan Case. J. Acc. Panor. 2015, 1, 100–102. [Google Scholar]
- Apergis, N.; Sorros, J. The Role of R&D Expenses for Profitability: Evidence from US Fossil and Renewable Energy Firms. Int. J. Econ. Financ. 2014, 6, 8–9. [Google Scholar]
- Cohen, J.R.; Hoitash, U.; Krishnamoorthy, G.; Wright, A.M. The effect of audit committee industry expertise on monitoring the financial reporting process. Acc. Rev. 2013, 89, 243–273. [Google Scholar] [CrossRef]
- De Franco, G.; Vasvari, F.P.; Vyas, D.; Wittenberg-Moerman, R. Debt analysts’ views of debt-equity conflicts of interest. Acc. Rev. 2013, 89, 571–604. [Google Scholar] [CrossRef]
- Heckman, J.; Pinto, R. Causal analysis after Haavelmo. Econom. Theory 2015, 31, 115–151. [Google Scholar] [CrossRef] [PubMed]
- South Africa. Integrated Pollution and Waste Management 2000. Available online: http://www.wastepolicy.environment.gov.za/book/export/html/80 (accessed on 3 May 2015).
- South Africa. National Environmental Management Act, No. 59, 2008, Government Gazette No: 32000 Cape Town. Available online: http://www.environment.gov.za/documents/384 (accessed on 6 May 2015).
- Galbreath, J.; Shum, P. Do customer satisfaction and reputation mediate the CSR–FP link? Evidence from Australia. Aust. J. Manag. 2012, 37, 211–229. [Google Scholar] [CrossRef]
- Saeidi, S.P.; Sofian, S.; Saeidi, P.; Saeidi, S.P.; Saaeidi, S.A. How does corporate social responsibility contribute to firm financial performance? The mediating role of competitive advantage, reputation, and customer satisfaction. J. Bus. Res. 2015, 68, 341–350. [Google Scholar] [CrossRef]
- Danso, A.; Adomako, S. The financing behaviour of firms and financial crisis. Manag. Financ. 2014, 40, 1159–1174. [Google Scholar] [CrossRef]
- Fosu, S.; Danso, A.; Ahmad, W.; Coffie, W. Information asymmetry, leverage and firm value: Do crisis and growth matter? Int. Rev. Financ. Anal. 2016, 46, 140–150. [Google Scholar] [CrossRef]
- Panagiotidou, N.; Stavrakakis, G.S.; Diakaki, C. Sustainable urban solid waste management planning with the use of an advanced interactive decision support system based on the PROMETHEE II method. Int. J. Decis. Support Syst. 2015, 1, 294–324. [Google Scholar] [CrossRef]
- Williams, R. 2015 Hereroskedasticity. Available online: http://www3.nd.edu/~rwilliam/ (accessed on 17 June 2017).
- Worku, Y.; Muchie, M. An attempt at quantifying factors that affect efficiency in the management of solid waste produced by commercial businesses in the city of Tshwane, South Africa. J. Environ. Public Health 2012, 1, 89–126. [Google Scholar] [CrossRef] [PubMed]
- Licy, C.D.; Vivek, R.; Kamath Saritha, T.K.; Josphina, C.T. Awareness, attitude and practice of school students towards household waste management. J. Environ. 2013, 2, 147–150. [Google Scholar]
- Kishore, J.; Agarwal, R.; Kohli, C.; Sharma, P.K.; Kamat, N.V.; Tyagi, S.C. Status of biomedical waste management in nursing homes of Delhi, India. J. Clin. Diagn. Res. 2014, 8, 56–59. [Google Scholar] [CrossRef] [PubMed]
- Richter, A.; Bruce, N.; Ng, K.T.; Chowdhury, A.; Vu, H.L. Comparison between Canadian and Nova Scotian waste management and diversion models—A Canadian case study. Sustain. Cities Soc. 2017, 30, 139–149. [Google Scholar] [CrossRef]
- Molina-Azorín, J.F.; Tarí, J.J.; Pereira-Moliner, J.; López-Gamero, M.D.; Pertusa-Ortega, E.M. The effects of quality and environmental management on competitive advantage: A mixed methods study in the hotel industry. Tour. Manag. 2015, 50, 41–54. [Google Scholar] [CrossRef]
- Mathuva, D.M.; Kiweu, J.M. Cooperative social and environmental disclosure and financial performance of savings and credit cooperatives in Kenya. Adv. Acc. 2016, 35, 197–206. [Google Scholar] [CrossRef]
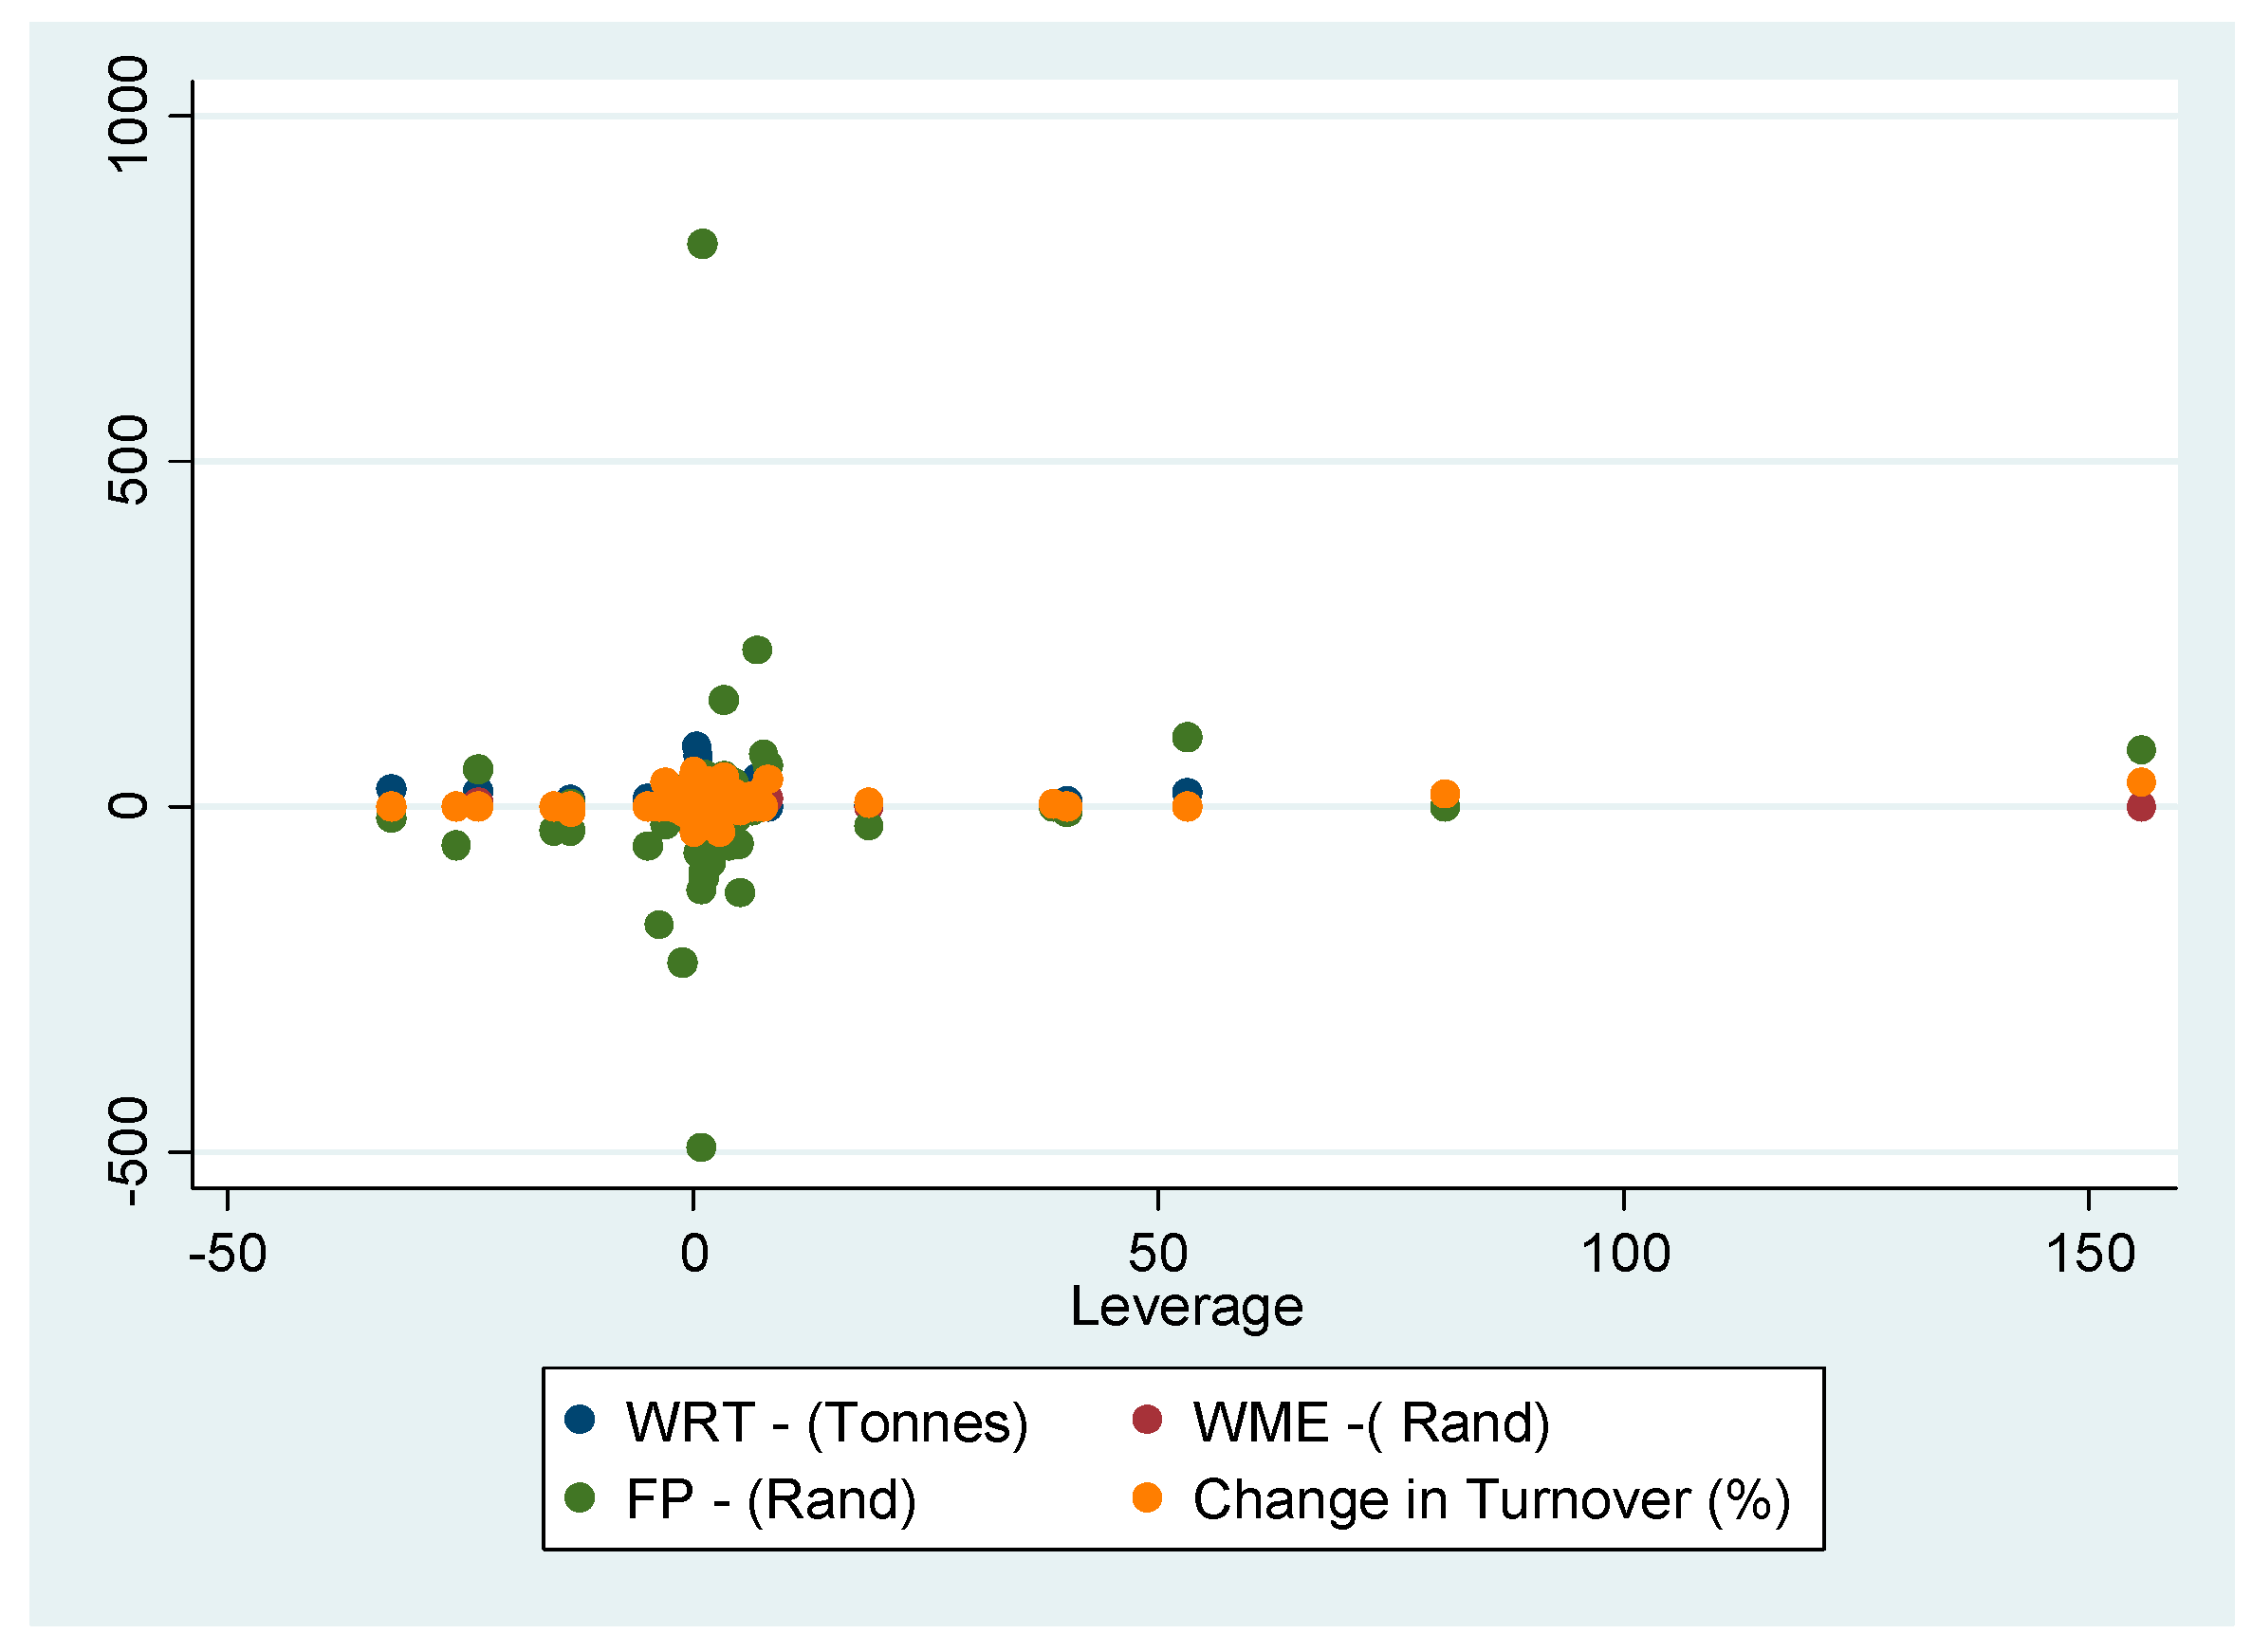
Figure 1.
Above shows the scatter plots for all variables for all firms for ten years. The variables are similar for all firms except for firm profitability. Where: WRT = Waste Reduction Targets; WME = Waste Management Expenditure; FP = Firm’s Profitability; ∆TURNOVER = Change in Tunrover; LEVERAGE = Leverage. The multicollinearity test is presented in Table 5.


Table 1.
Summary of descriptive statistics.
| Variable | Obs | Mean | Std. Dev. | Min | Max |
|---|---|---|---|---|---|
| Waste reduction targets | 300 | 5.4812 | 12.33445 | 0 | 87.34 |
| Waste management expenditure | 300 | 0.9763 | 2.587124 | 0 | 12.38 |
| Firms’ profitability | 300 | 2.811257 | 64.54298 | −493.51 | 815.48 |
| Change in turnover | 300 | 4.3614 | 11.90228 | −36 | 50 |
| Leverage | 300 | 1.8838 | 11.52015 | −32.47 | 155.65 |
Source: Authors’ results of descriptive statistics from Stata.
Table 2.
Two-sample t-test with equal variances (t-test change in turnover = leverage, unpaired).
| Variable | Obs | Mean | Std. Err. | Std. Dev. | [95% Conf. | Interval] |
|---|---|---|---|---|---|---|
| Change in turnover | 300 | 4.3614 | 0.687179 | 11.90228 | 3.009081 | 5.713719 |
| Leverage | 300 | 1.8838 | 0.665116 | 11.52015 | 0.574898 | 3.192702 |
| Combined | 600 | 3.1226 | 0.480447 | 11.76849 | 2.179036 | 4.066164 |
| Diff | 2.4776 | 0.956344 | 0.599398 | 4.355802 |
Note: diff = mean (changeinturnover)—mean (leverage); t = 2.5907; Ho: diff = 0; degrees of freedom = 598; Ha: diff < 0; Ha: diff != 0; Ha: diff > 0; Pr(T < t) = 0.9951; Pr(|T| > |t|) = 0.0098; Pr(T > t) = 0.0049. Source: author’s results of t-test from Stata.
Table 3.
Correlation between individual variables.
| Variables | Waste Reduction Targets | Waste Management Expenditure | Firms’ Profitability | Change in Turnover | Leverage |
|---|---|---|---|---|---|
| Waste reduction targets | 1 | ||||
| Waste management expenditure | 0.0919 | 1 | |||
| Firms’ profitability | 0.0351 | 0.0993 | 1 | ||
| Change in turnover | −0.0383 | 0.1115 | 0.0214 | 1 | |
| Leverage | −0.0333 | −0.0130 | 0.0976 | 0.1572 | 1 |
Source: author’s results of correlation matrix from Stata.
Table 4.
Multiple linear regression of the variables.
| Source | SS | df | MS | Number of obs = 300 | ||
|---|---|---|---|---|---|---|
| Model | 558.93907 | 4 | 139.734768 | F(4, 295) = 0.92 | ||
| Residual | 44930.5127 | 295 | 152.306823 | Prob > F = 0.4540 | ||
| Total | 45489.4518 | 299 | 152.138635 | R-squared = 0.0123 | ||
| Adj R-squared = −0.0011 | ||||||
| Root MSE = 12.341 | ||||||
| Waste Reduction Targets | Coefficient | Std. Err. | t | P > t | 95% Conf. | Interval |
| Waste management expenditure | 0.446387 | 0.279164 | 1.6 | 0.111 | −0.10302 | 0.995793 |
| Firms’ profitability | 0.00563 | 0.011168 | 0.5 | 0.615 | −0.01635 | 0.02761 |
| Change in turnover | −0.04662 | 0.061126 | −0.76 | 0.446 | −0.16692 | 0.073679 |
| Leverage | −0.02982 | 0.063074 | −0.47 | 0.637 | −0.15395 | 0.094316 |
| _cons | 5.289051 | 0.801009 | 6.6 | 0 | 3.712636 | 6.865466 |
Table 5.
Multicollinearity test: VIF- Multicollinearity test.
| Variable | VIF | 1/VIF |
|---|---|---|
| Change in turnover | 1.04 | 0.96237 |
| Leverage | 1.04 | 0.964792 |
| Waste management expenditure | 1.02 | 0.976548 |
| Firms’ profitability | 1.02 | 0.980324 |
| Mean VIF | 1.03 |
VIF= variance inflation factors. Source: author’s results of multicollinearity from Stata.
Table 6.
Correlation matrix of coefficients of regress model.
| e(V) | Waste Management Expenditure | Firm Profitability | Change in Turnover | Leverage | _cons |
|---|---|---|---|---|---|
| Waste management expenditure | 1.0000 | ||||
| Firm profitability | −0.1010 | 1.0000 | |||
| Change in turnover | −0.1149 | 0.0055 | 1.0000 | ||
| Leverage | 0.0408 | −0.0990 | −0.1594 | 1.0000 | |
| _cons | −0.3041 | 0.0080 | −0.2703 | −0.1053 | 1.0000 |
Source: author’s results of the correlation matrix of coefficients of regress model from Stata.
Table 7.
Fixed effects model variables and observations on waste reduction targets.
| Fixed-Effects (within) Regression | Number of obs = 300 |
|---|---|
| Group variable: cocode | Number of groups = 30 |
| R-sq: within = 0.0072 | Obs per group: min = 10 |
| between = 0.0187 | avg = 10.0 |
| overall = 0.0114 | max = 10 |
| F(4, 266) = 0.48 | |
| corr (u_i, Xb) = 0.0346 | Prob > F = 0.7502 |
Note: number of obs = 300: total number of observations (rows); number of groups = 30: total number of groups (firms); if this is <0.05, then the model is ok. F(4, 266) = 0.48; prob > F = 0.7502: this is a test (F) to see whether all the coefficients in the model are different than zero; corr (u_iXb) = 0.0346: the errors u_i are correlated with the regressors in the fixed effects model. Source: author’s results of fixed effects model variables and observations from Stata.
Table 8.
Fixed effects model results.
| Waste Reduction Targets | Coef. | Std. Err. | t | P > |t| | [95% Conf. | Interval] |
|---|---|---|---|---|---|---|
| Waste management expenditure | 0.373839 | 0.29572 | 1.26 | 0.207 | −0.20841 | 0.956088 |
| Firm profitability | 0.003844 | 0.009418 | 0.41 | 0.683 | −0.0147 | 0.022388 |
| Change in turnover | −0.02779 | 0.054425 | −0.51 | 0.610 | −0.13494 | 0.079373 |
| Leverage | −0.00204 | 0.056477 | −0.04 | 0.971 | −0.11324 | 0.109156 |
| _cons | 5.230449 | 0.671974 | 7.78 | 0.000 | 3.907386 | 6.553513 |
| sigma_u | 8.122837 | |||||
| sigma_e | 9.859828 | |||||
| rho | 0.4043 | (fraction of variance due to u_i) | ||||
Note: sigma_u = sd of residuals within groups ui; sigma_e = sd of residuals (overall error term) ei; Rho = 40.43% of the variance is due to differences across panels; ‘rho’ is known as the intra-class correlation; t = t-values test the hypothesis that each coefficient is different from 0. In rejecting this, t-value has to be higher than 95% confidence. If this is the case, then the variable has a significant influence on the dependent variable (y). The higher the t-value, the higher the relevance of the variable; P > |t|= two-tail p-values test the hypothesis that each coefficient is different from 0. In rejecting this, the p-value has to be lower than 0.05 (95%, or choose an alpha of 0.10), if this is the case, then the variable has a significant influence on the dependent variable (y). Source: author’s results of fixed effects model from Stata.
Table 9.
Random effects model variables and observations on waste reduction targets.
| Random-Effects (within) Regression | Number of obs = 300 |
|---|---|
| Group variable: cocode | Number of groups = 30 |
| R-sq: within = 0.0071 | Obs per group: min = 10 |
| between = 0.0197 | avg = 10.0 |
| overall = 0.0117 | max = 10 |
| Wald chi2(4) = 2.37 | |
| corr (u_i, Xb) = 0 (assumed) | Prob > chi2 = 0.6673 |
Note: number of obs = 300: total number of observations (rows); number of groups = 30: total number of groups (firms); if this is <0.05, then the model is ok. Wald chi2(4) = 2.37; prob > chi2: this is a test (chi2) to see whether all the coefficients in the model are different than zero; corr (u_iXb) = 0 (assumed). Source: author’s results of random effects model from Stata.
Table 10.
Random effects model results for waste reduction targets.
| Waste Reduction Targets | Coef. | Std. Err. | z P > z | [95% Conf. | Interval] |
|---|---|---|---|---|---|
| Waste management expenditure | 0.389756 | 0.280251 | 1.39 0.164 | −0.15953 | 0.939038 |
| Firm profitability | 0.004134 | 0.009288 | 0.45 0.656 | −0.01407 | 0.022339 |
| Change in turnover | −0.03061 | 0.05326 | −0.57 0.565 | −0.135 | 0.073774 |
| Leverage | −0.00634 | 0.055219 | −0.11 0.909 | −0.11457 | 0.101885 |
| _cons | 5.234532 | 1.610561 | 3.25 0.001 | 2.077891 | 8.391172 |
| sigma_u | 8.091588 | ||||
| sigma_e | 9.859828 | ||||
| Rho | 0.402445 | (fraction | of variance due | to | u_i) |
Source: author’s results of random effects model from Stata.
Table 11.
Hausman test result for waste reduction targets.
| Independent Variable | (b) | (B) | (b-B) | Sqrt (diag (V_b-V_B)) |
|---|---|---|---|---|
| Fixed | Random | Difference | S.E. | |
| Waste management expenditure | 0.373839 | 0.3897555 | −0.0159165 | 0.943897 |
| Firms’ profitability | 0.0038442 | 0.0041339 | −0.0002897 | 0.0015585 |
| Change in turnover | −0.027783 | −0.0306147 | 0.0028287 | 0.0111983 |
| Leverage | −0.0020435 | −0.0063427 | 0.0042992 | 0.0118543 |
B = consistent under Ho and Ha; obtained from xtreg; B = inconsistent under Ha, efficient under Ho; obtained from xtreg.
Test: Ho: difference in coefficients not systematic.
chi2(4) = (b-B)’ [(V_b-V_B) ˆ (−1)](b-B)
= 0.30
Prob > chi2 = 0.9899
Source: author’s results of Hausman test from Stata.
© 2017 by the authors. Licensee MDPI, Basel, Switzerland. This article is an open access article distributed under the terms and conditions of the Creative Commons Attribution (CC BY) license (http://creativecommons.org/licenses/by/4.0/).
Share and Cite
MDPI and ACS Style
Maleka, T.G.; Nyirenda, G.; Fakoya, M.B. The Relationship between Waste Management Expenditure and Waste Reduction Targets on Selected JSE Companies. Sustainability 2017, 9, 1528. https://doi.org/10.3390/su9091528
AMA Style
Maleka TG, Nyirenda G, Fakoya MB. The Relationship between Waste Management Expenditure and Waste Reduction Targets on Selected JSE Companies. Sustainability. 2017; 9(9):1528. https://doi.org/10.3390/su9091528
Chicago/Turabian StyleMaleka, Thabo Gerald, Gibson Nyirenda, and Michael Bamidele Fakoya. 2017. "The Relationship between Waste Management Expenditure and Waste Reduction Targets on Selected JSE Companies" Sustainability 9, no. 9: 1528. https://doi.org/10.3390/su9091528
Note that from the first issue of 2016, this journal uses article numbers instead of page numbers. See further details here.