Article

Adsorption Kinetics and Breakthrough of Carbon Dioxide for the Chemical Modified Activated Carbon Filter Used in the Building

1
Department of Energy and Refrigerating Air-Conditioning Engineering, National Taipei University of Technology, Taipei 10608, Taiwan
2
Department of Molecular Science and Technology, National Taipei University of Technology, Taipei 10608, Taiwan
3
Airrex Co., Ltd., New Taipei City 23148, Taiwan
*
Author to whom correspondence should be addressed.
These authors contributed equally to this work.
Sustainability 2017, 9(9), 1533; https://doi.org/10.3390/su9091533
Submission received: 6 August 2017 / Revised: 24 August 2017 / Accepted: 25 August 2017 / Published: 29 August 2017

Abstract

:
We studied different face velocity and carbon dioxide (CO2) initial concentration to examine the adsorption behavior of calcium oxide (CaO) impregnated activated carbon (AC) filter and also to discuss pseudo-first-order, pseudo-second-order and intra-particle diffusion three kinetic models. The experimental results show that saturation time and saturation capacity were decreased and increased with higher inlet concentration at the same face velocity, respectively. Simulation results show that pseudo-second-order correlation coefficient (r22 = 0.921) is higher than pseudo-first-order (r12 = 0.7815) and intra-particle diffusion (ri2 = 0.905). Therefore, the adsorption process of CO2 onto CaO impregnated AC filter media is appropriate for the pseudo-second-order kinetic model.

1. Introduction

Generally, people spend more than 90% of their time in indoor environments and therefore, there is concern regarding indoor pollutants [1]. Nowadays, buildings are being constructed with significantly stricter leak tightness requirements, as demanded by Building Regulations. There is increasing concern regarding emissions of CO2 and the impact on health and well-being [2,3,4] and comfort [5,6] of occupants in air-tight housing. CO2 is the representative pollutant of indoor air quality and its concentration is associated with human activity of about 650–700 ppm [7,8]. High concentrations of CO2 are known to have various adverse effects such as headaches, drowsiness, and dizziness for residents [9,10,11]. Ventilation is one of the easiest ways to reduce CO2 concentration, and the modern practice of completely insulating buildings to retain or send back heat also brings on reductions of IAQ (Indoor Air Quality).
Current and updated research on how to remove CO2 effectively and economically from indoor air has become necessary. A few usual ways are being utilized to clean polluted air, including compromising adsorption, absorption, membrane, and cryogenic gas cleaning manners [12,13,14]. Adsorption has been shown to be a technique for conducting low concentrations of CO2 [15,16,17] because of its simplification, low energy demands, and cost effectiveness [18]. Impregnated activated carbon as media for the sorption-type filter adsorption is another functional method for removal of CO2 in a building [19]. Song et al. [16] investigated CaO modified silica adsorbents to have basic locations on their surfaces, and thus, have created a raised affinity for CO2 molecules. Jensen et al. [20] carried out a comparable quantum chemical study of CO2 adsorption on MgO and CaO, CO2 adsorption onto CaO as single dentate geometry on both sides and angle sites. Lahuri et al. [21] evaluated CaO impregnated on iron (III) oxide bimetal adsorbent system as a possible source of base sites for CO2 capture.
This study aims to examine the performance of CaO impregnated coconut shell AC adsorbent-loaded nonwoven fabric filter by adsorption characteristics, as well as the breakthrough curves and pressure drops under various testing conditions. Adsorption capacity and these characteristics were decided as the functional of CO2 concentration and face velocities. We also examined adsorption kinetics, utilizing the pseudo-first-order, pseudo-second-order and intraparticle models and their kinetic constants, thus providing the basic data demanded for design and operation of equipment for air handling units of the building.

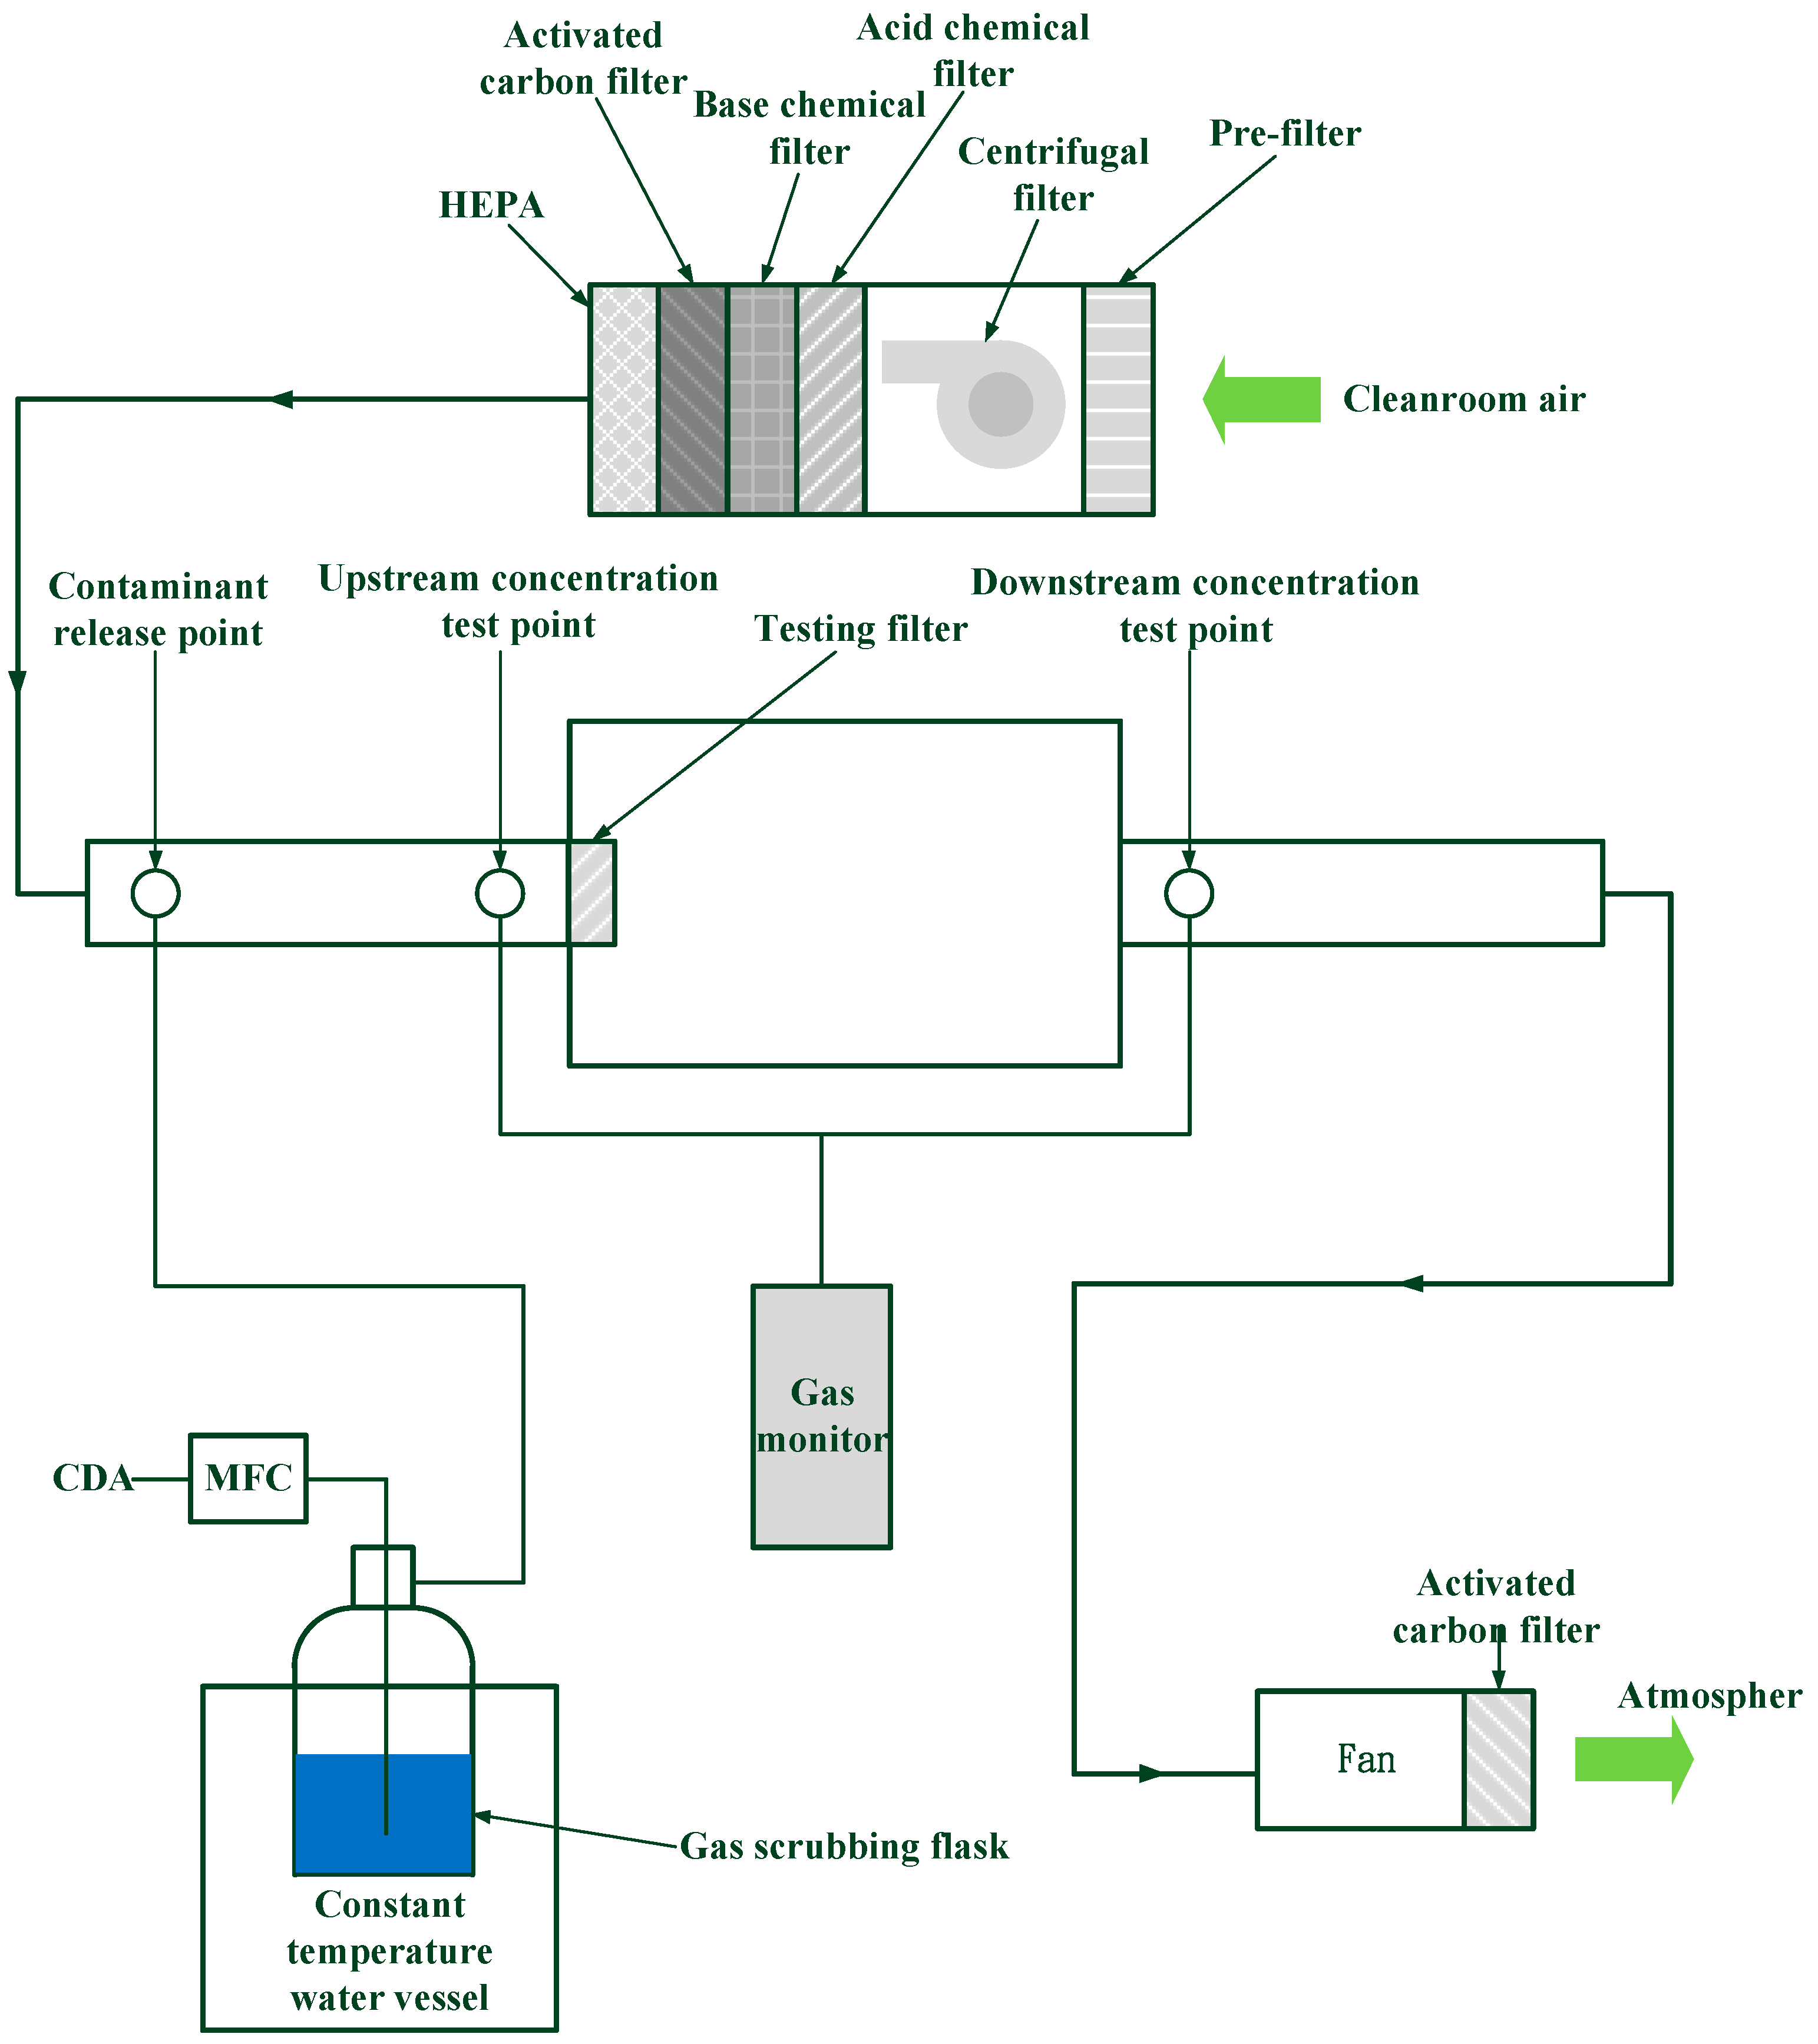
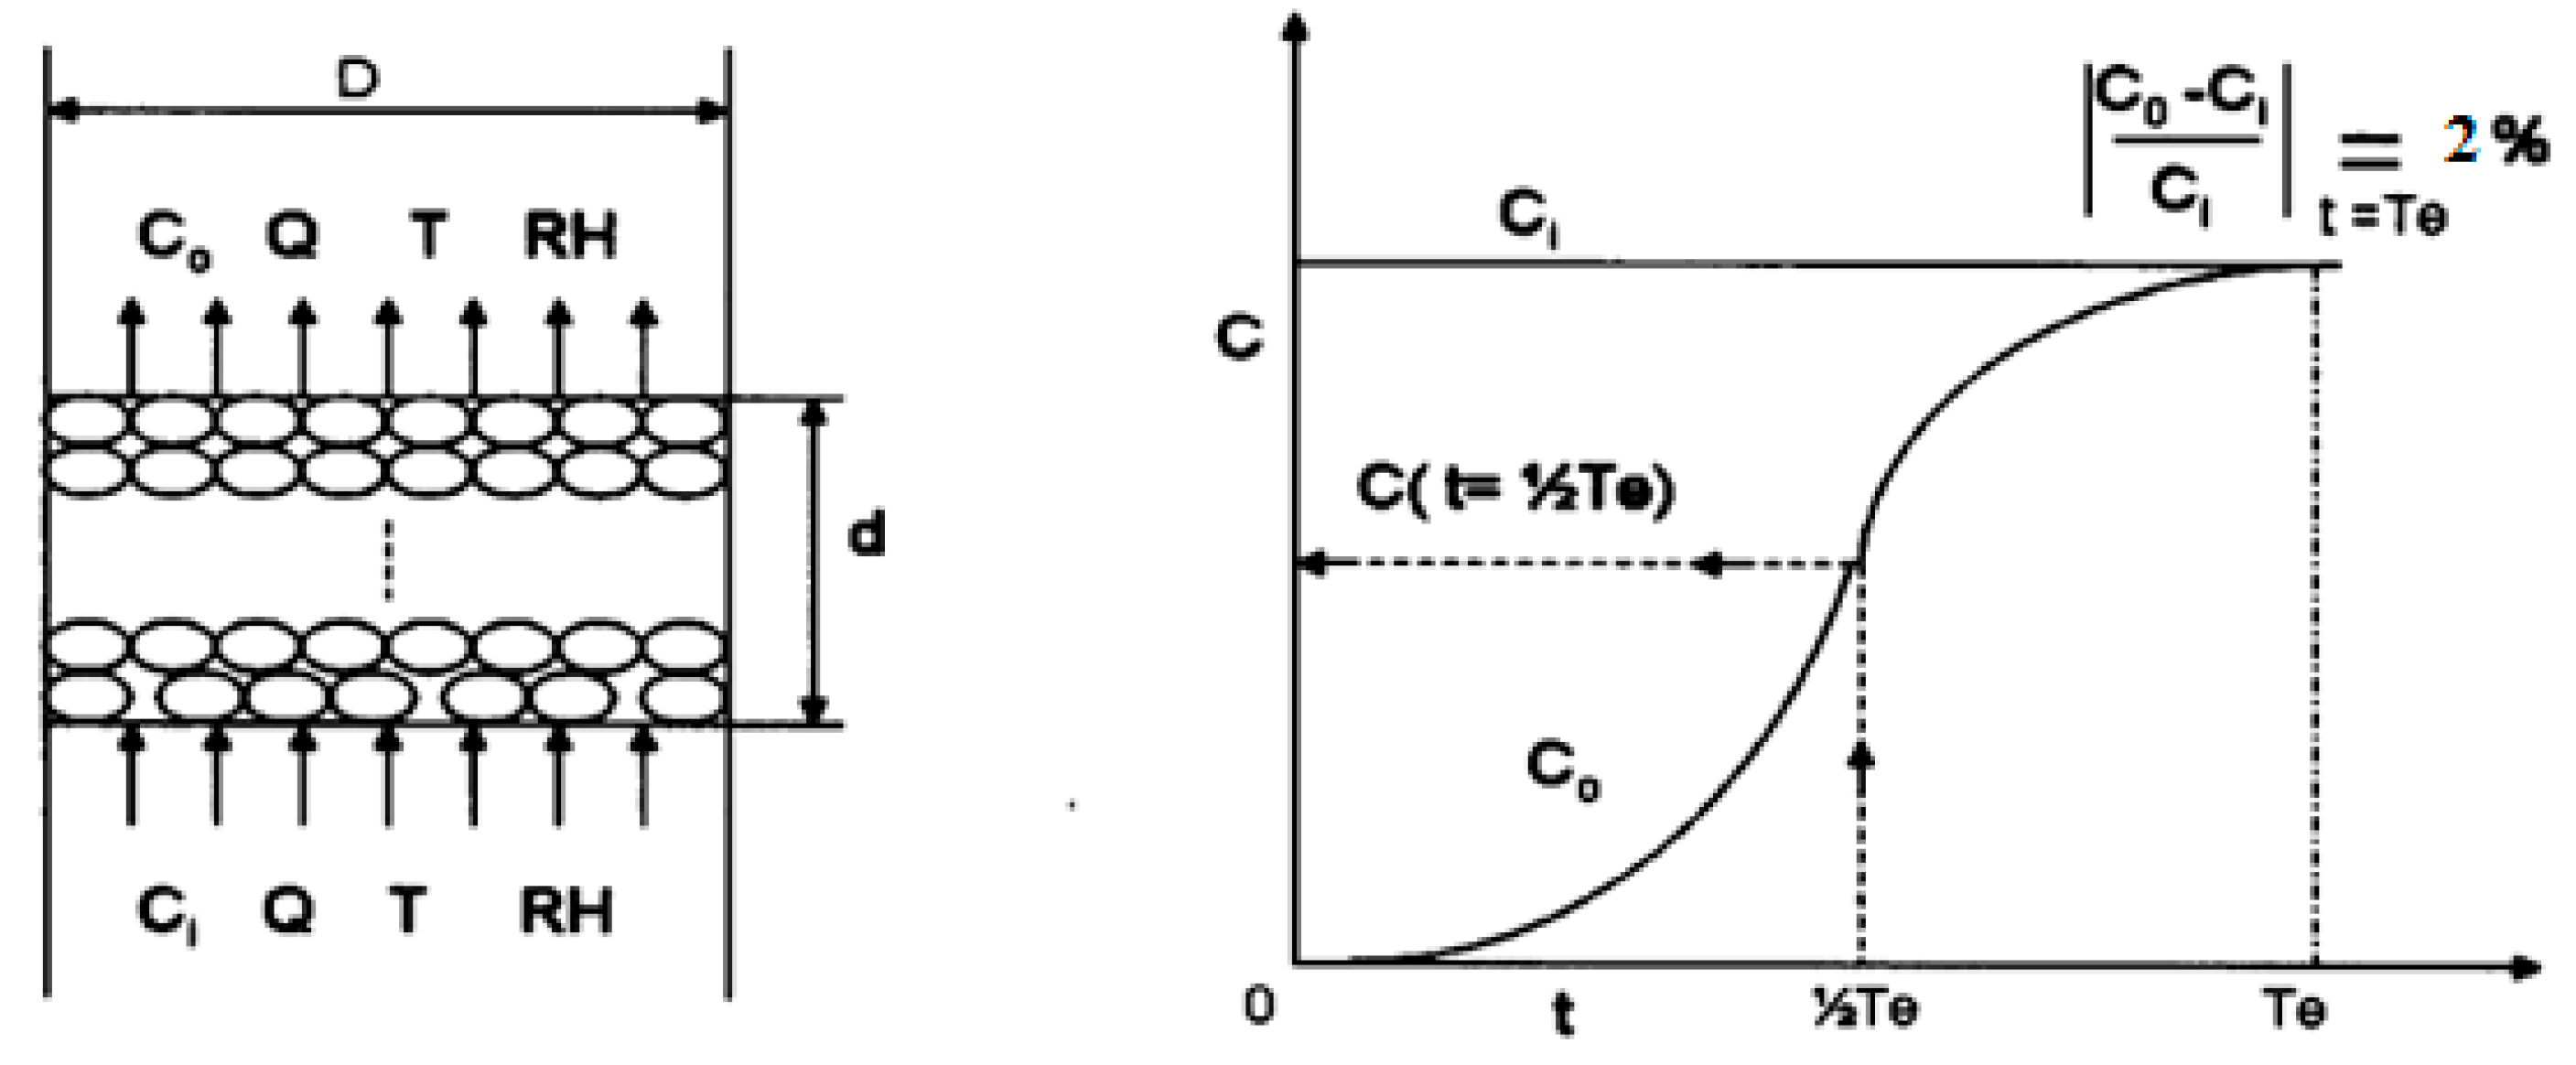
2. Experimental Method

Chemically modified activated carbon adsorbents were prepared by impregnation. Impregnation of CaO was performed as follows. Calcium acetate monohydrate (10 g) was mixed with 200 mL of deionized water by agitation for 5 h. Through vacuum and filtration processes remove undissolved salt to obtain saturated solution. One (1) g of support material was impregnated with this solution by agitation at 25 °C for 12 h, followed by suction filtration and drying at 80 °C for 12 h and then used vacuum drying at 120 °C for ~10 h. The impregnated support materials were finally calcined at 700 °C for 2 h by blowing rate of 1 L/min nitrogen. Table 1 summarizes the impregnation procedures employed.
Calcium acetate monohydrate was converted into calcium oxide through the following pathways during calcination.
Ca(CH3CO2)2·H2O → Ca(CH3CO2)2 → CaCO3 → CaO
Surface area, pore size distribution, and pore width of the completed sample sorbents were analyzed with an ASAP2020 (Micromeritics Instrument Corporation, GA, USA).
Figure 1 showed the schematic diagram of the experimental system. The CaO impregnated granular activated carbon (GAC)-loaded on nonwoven fabric filter media (supplied by AIRREX Co. Ltd., New Taipei City, Taiwan) was set in a designed 15 cm × 15 cm filter area. Two differential pressure gauges were utilized to monitor pressure drop before and after the filter. The testing rig was kept at 24 ± 1 °C temperature by air-conditioning environment control system in a cleanroom. The main testing airflow is from here which controlled at 22 ± 1 °C temperature and 40 ± 2% relative humidity. The face velocity of filter was measured and controlled from 0.3 m/s to 0.5 m/s (related with 0.7 to 1.0 m/s face velocity of a full-scale chemical filter actually operated) (the TSI 9535-A anemometer is ±3% of full-scale accuracy) with the invertor which connected to the three-phase air blower and flow damper. The compressed dry air with −40 °C dew point temperature passing through the impinger which produces the airflow with saturated contaminant (i.e., CO2) then becomes the challenge gas entering the upstream air duct. The impinger, filled with 99.9% grade CO2, is submerged in the brine water bath with adjustable water temperature from −15 °C to 25 °C. The upstream concentration in the testing rig is controlled by the flow rate passing thought the impinger, which is adjusted via a mass flow controller (LINTEC MC-700). The upstream concentrations were fixed at 800, 1000, and 1200 ppm with ±5% deviation. TES 1370 NDIR CO2 Meter.
The testing method followed ASHRAE Standard 145.2 [23] and is similar to the researcher works [24,25]. As shown in Figure 2, conditioned air pass through the adsorbent. The upstream concentrations and downstream concentrations are simultaneously measured to decide removal efficiency (η) [26]. Breakthrough time (tb) is defined as the time when the outlet concentration was 2% of the inlet concentration. Equilibrium time (tt) is defined as the time when the outlet concentration was 98% of the inlet concentration.
The removal efficiency (η) of CO2 decided and simultaneously monitored the upstream concentrations and downstream concentrations of test rig [26]:
Q = C 0 V η ( t ) d t × 1 0.082 × 1 ( 273 + k ) × M × 10 6
where Q is adsorption capacity; C0 is the inlet concentration; V is the airflow rate; t is testing time; η is removal efficiency (%); and M is testing gas molecular weight.

3. Results and Discussion

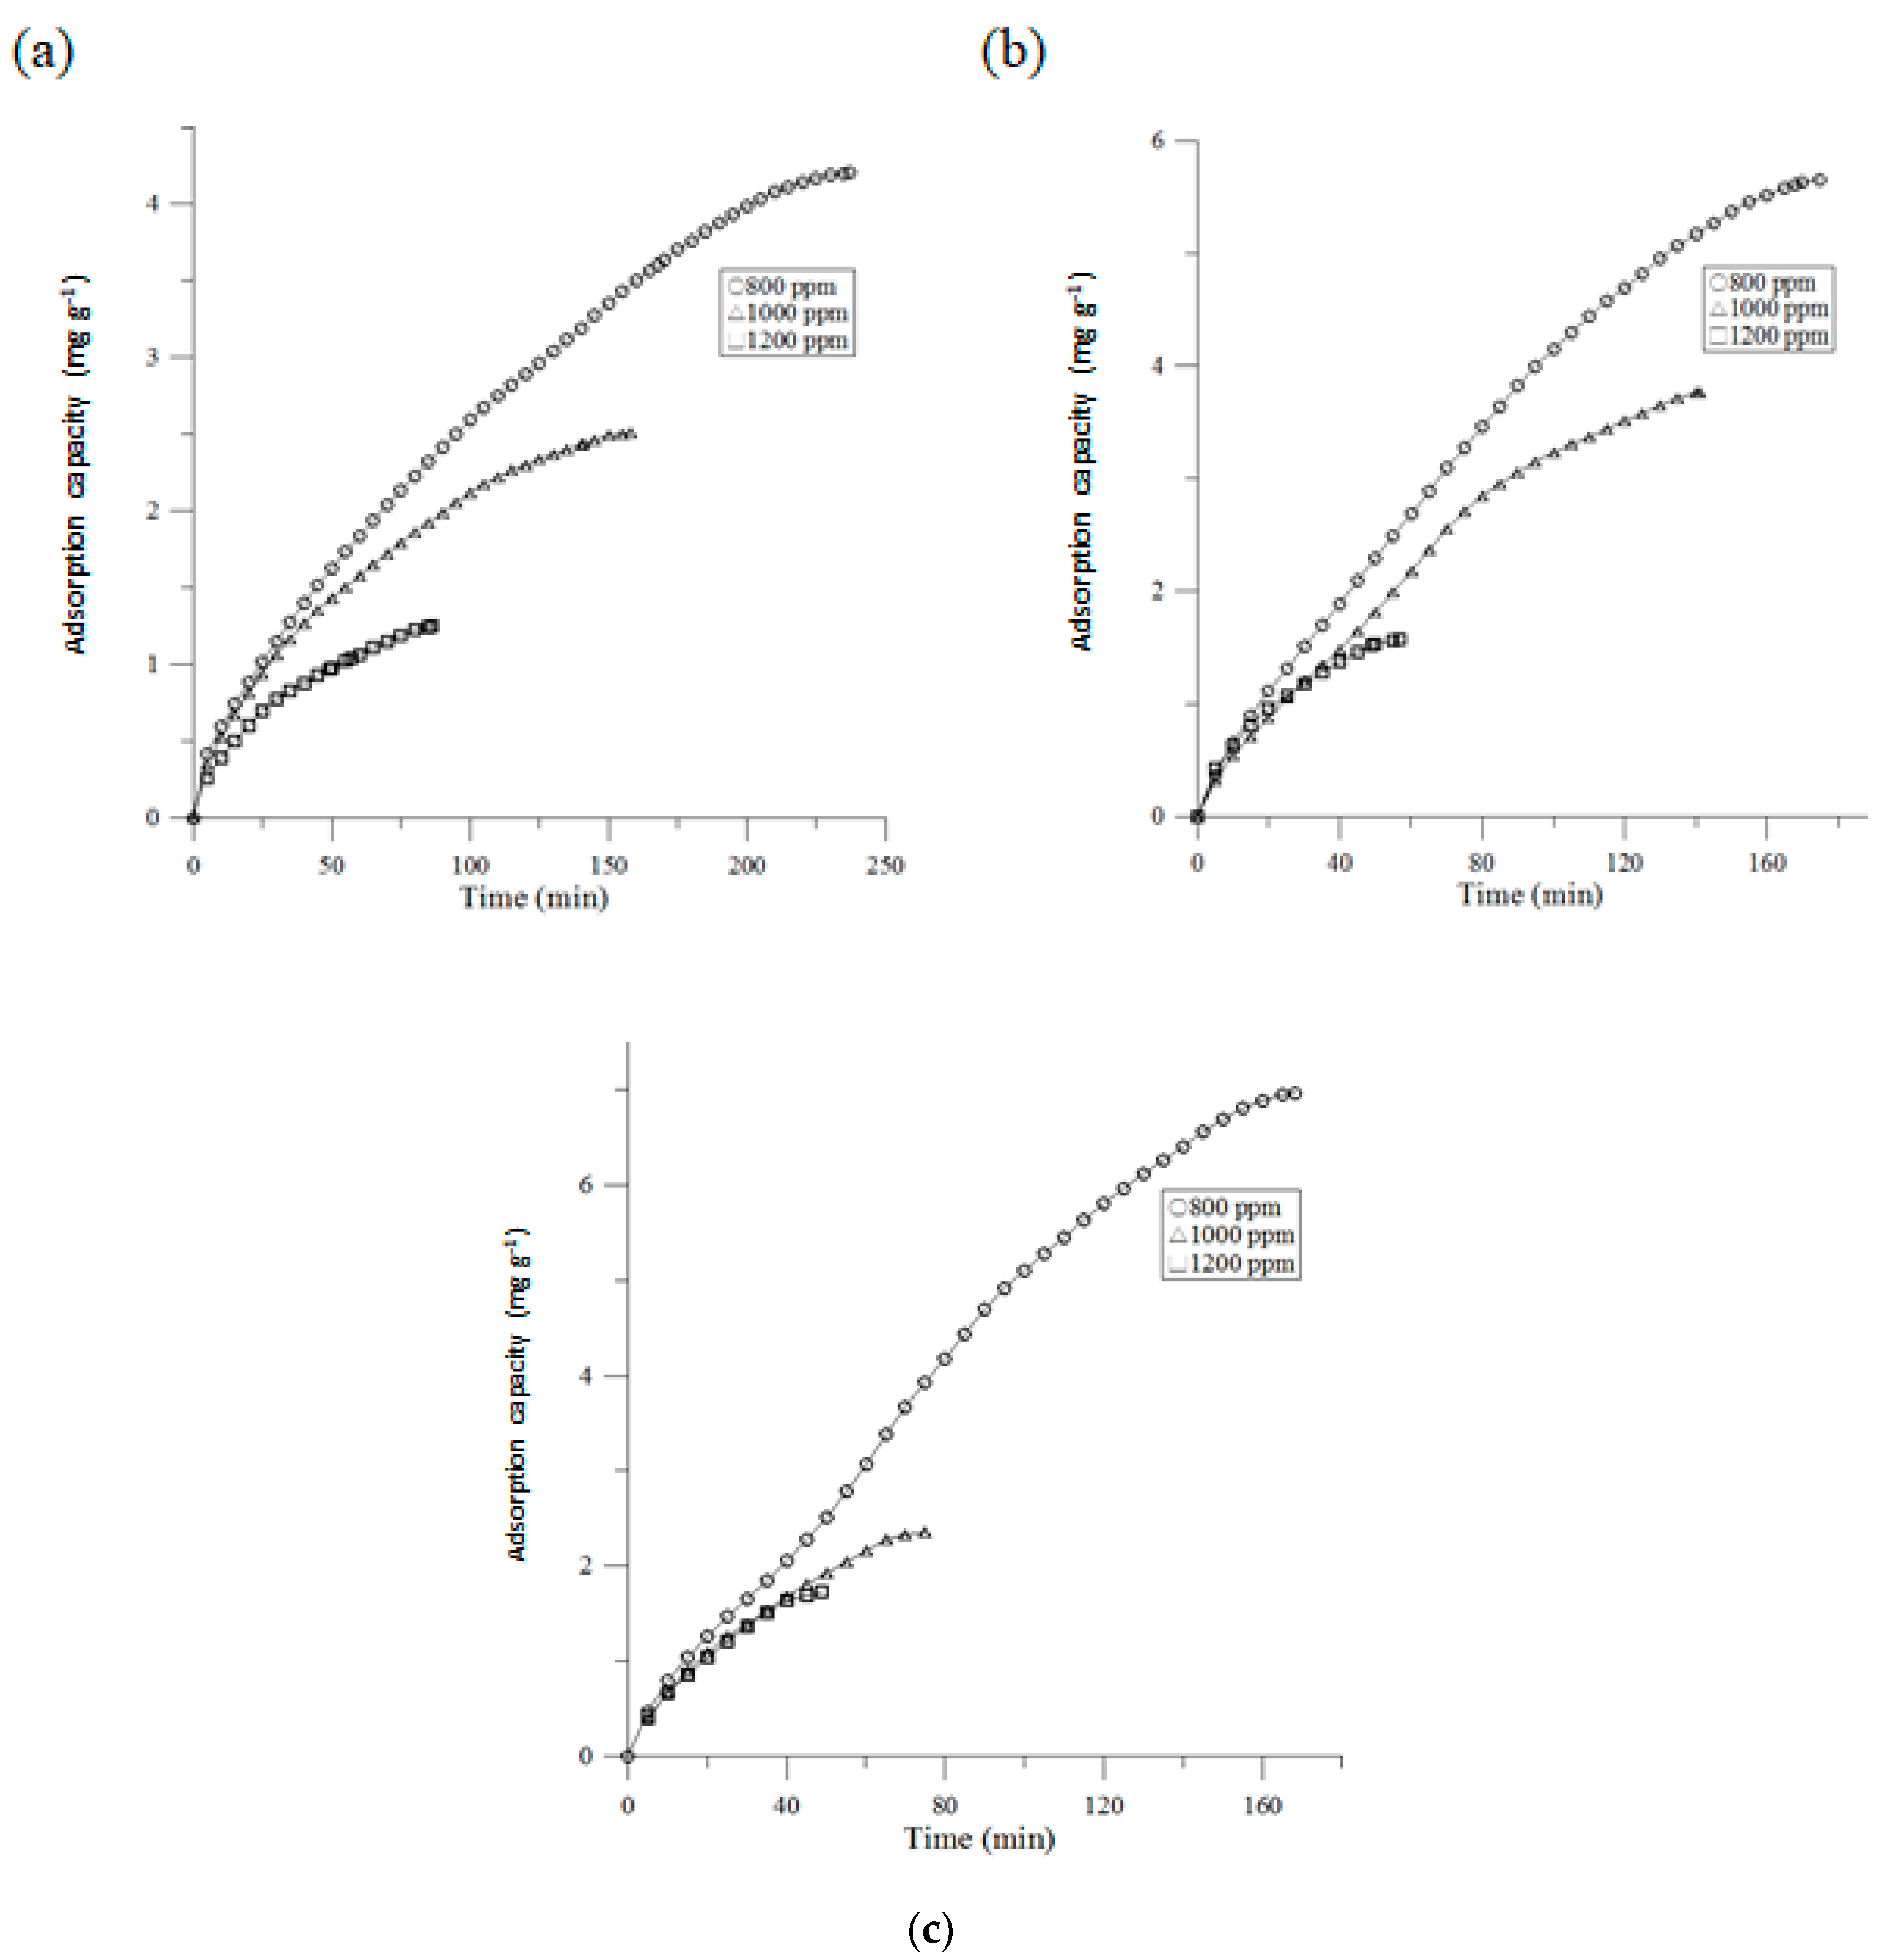
3.1. Adsorption Capacity
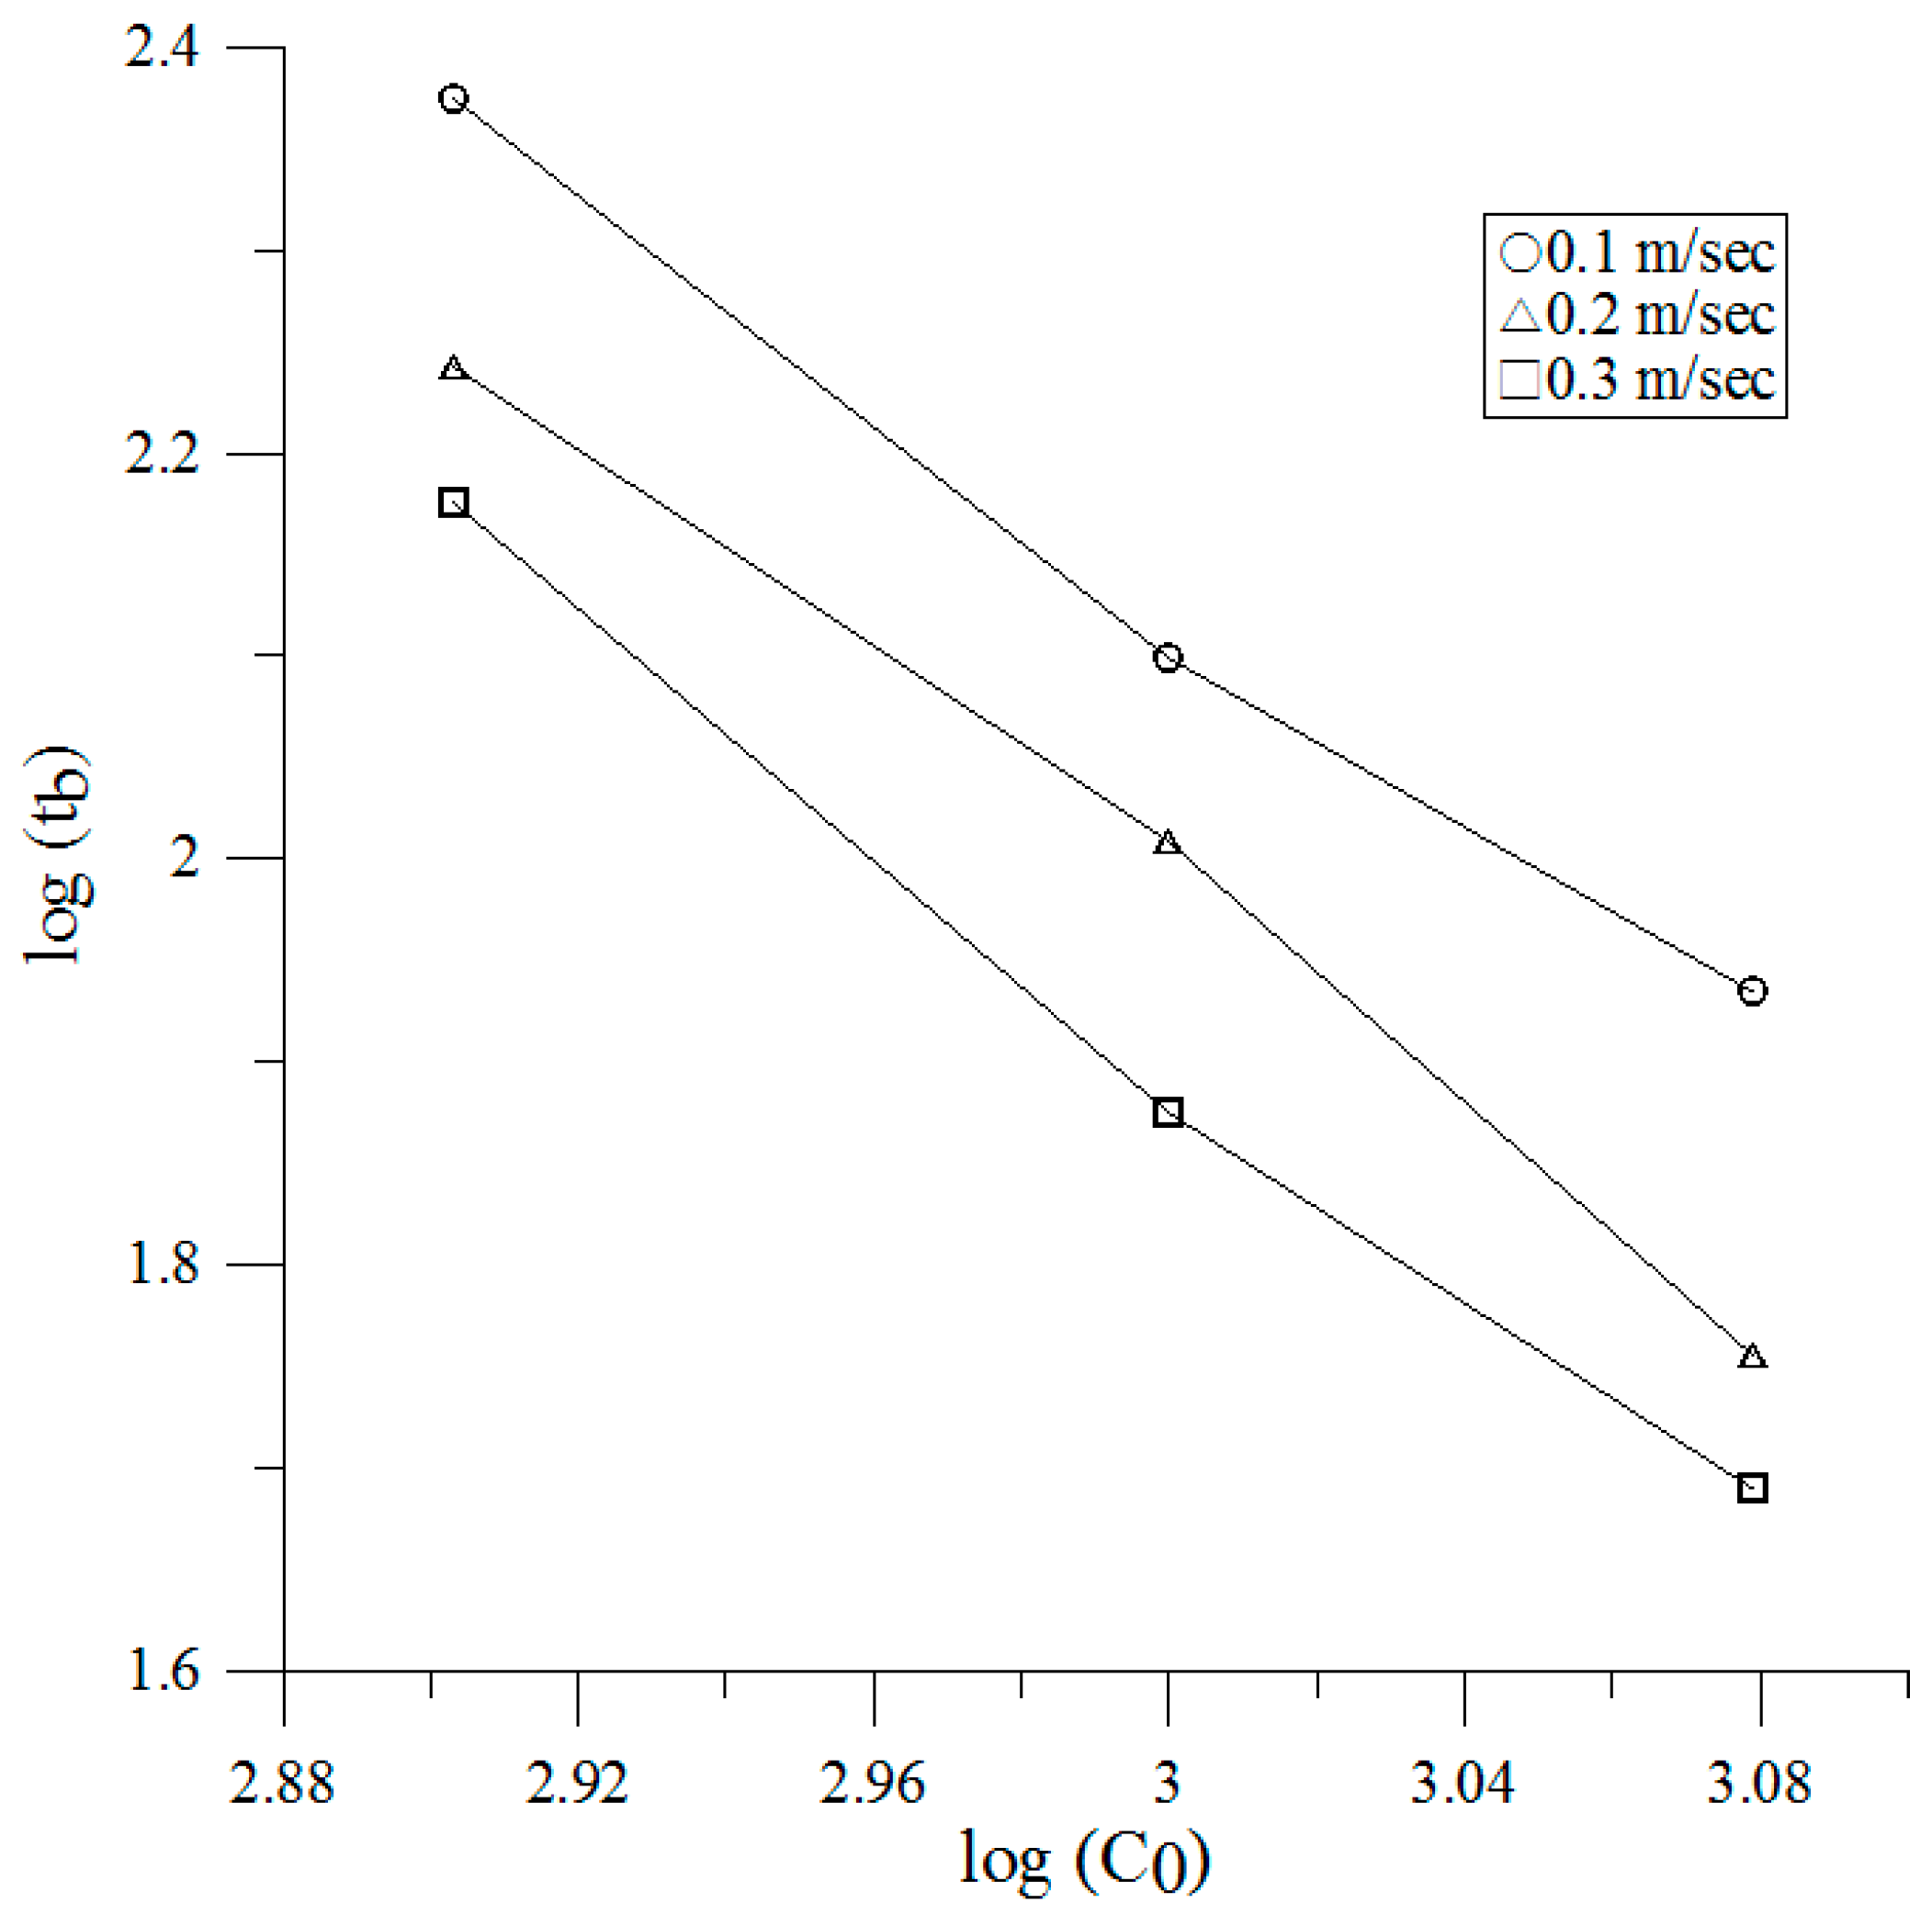
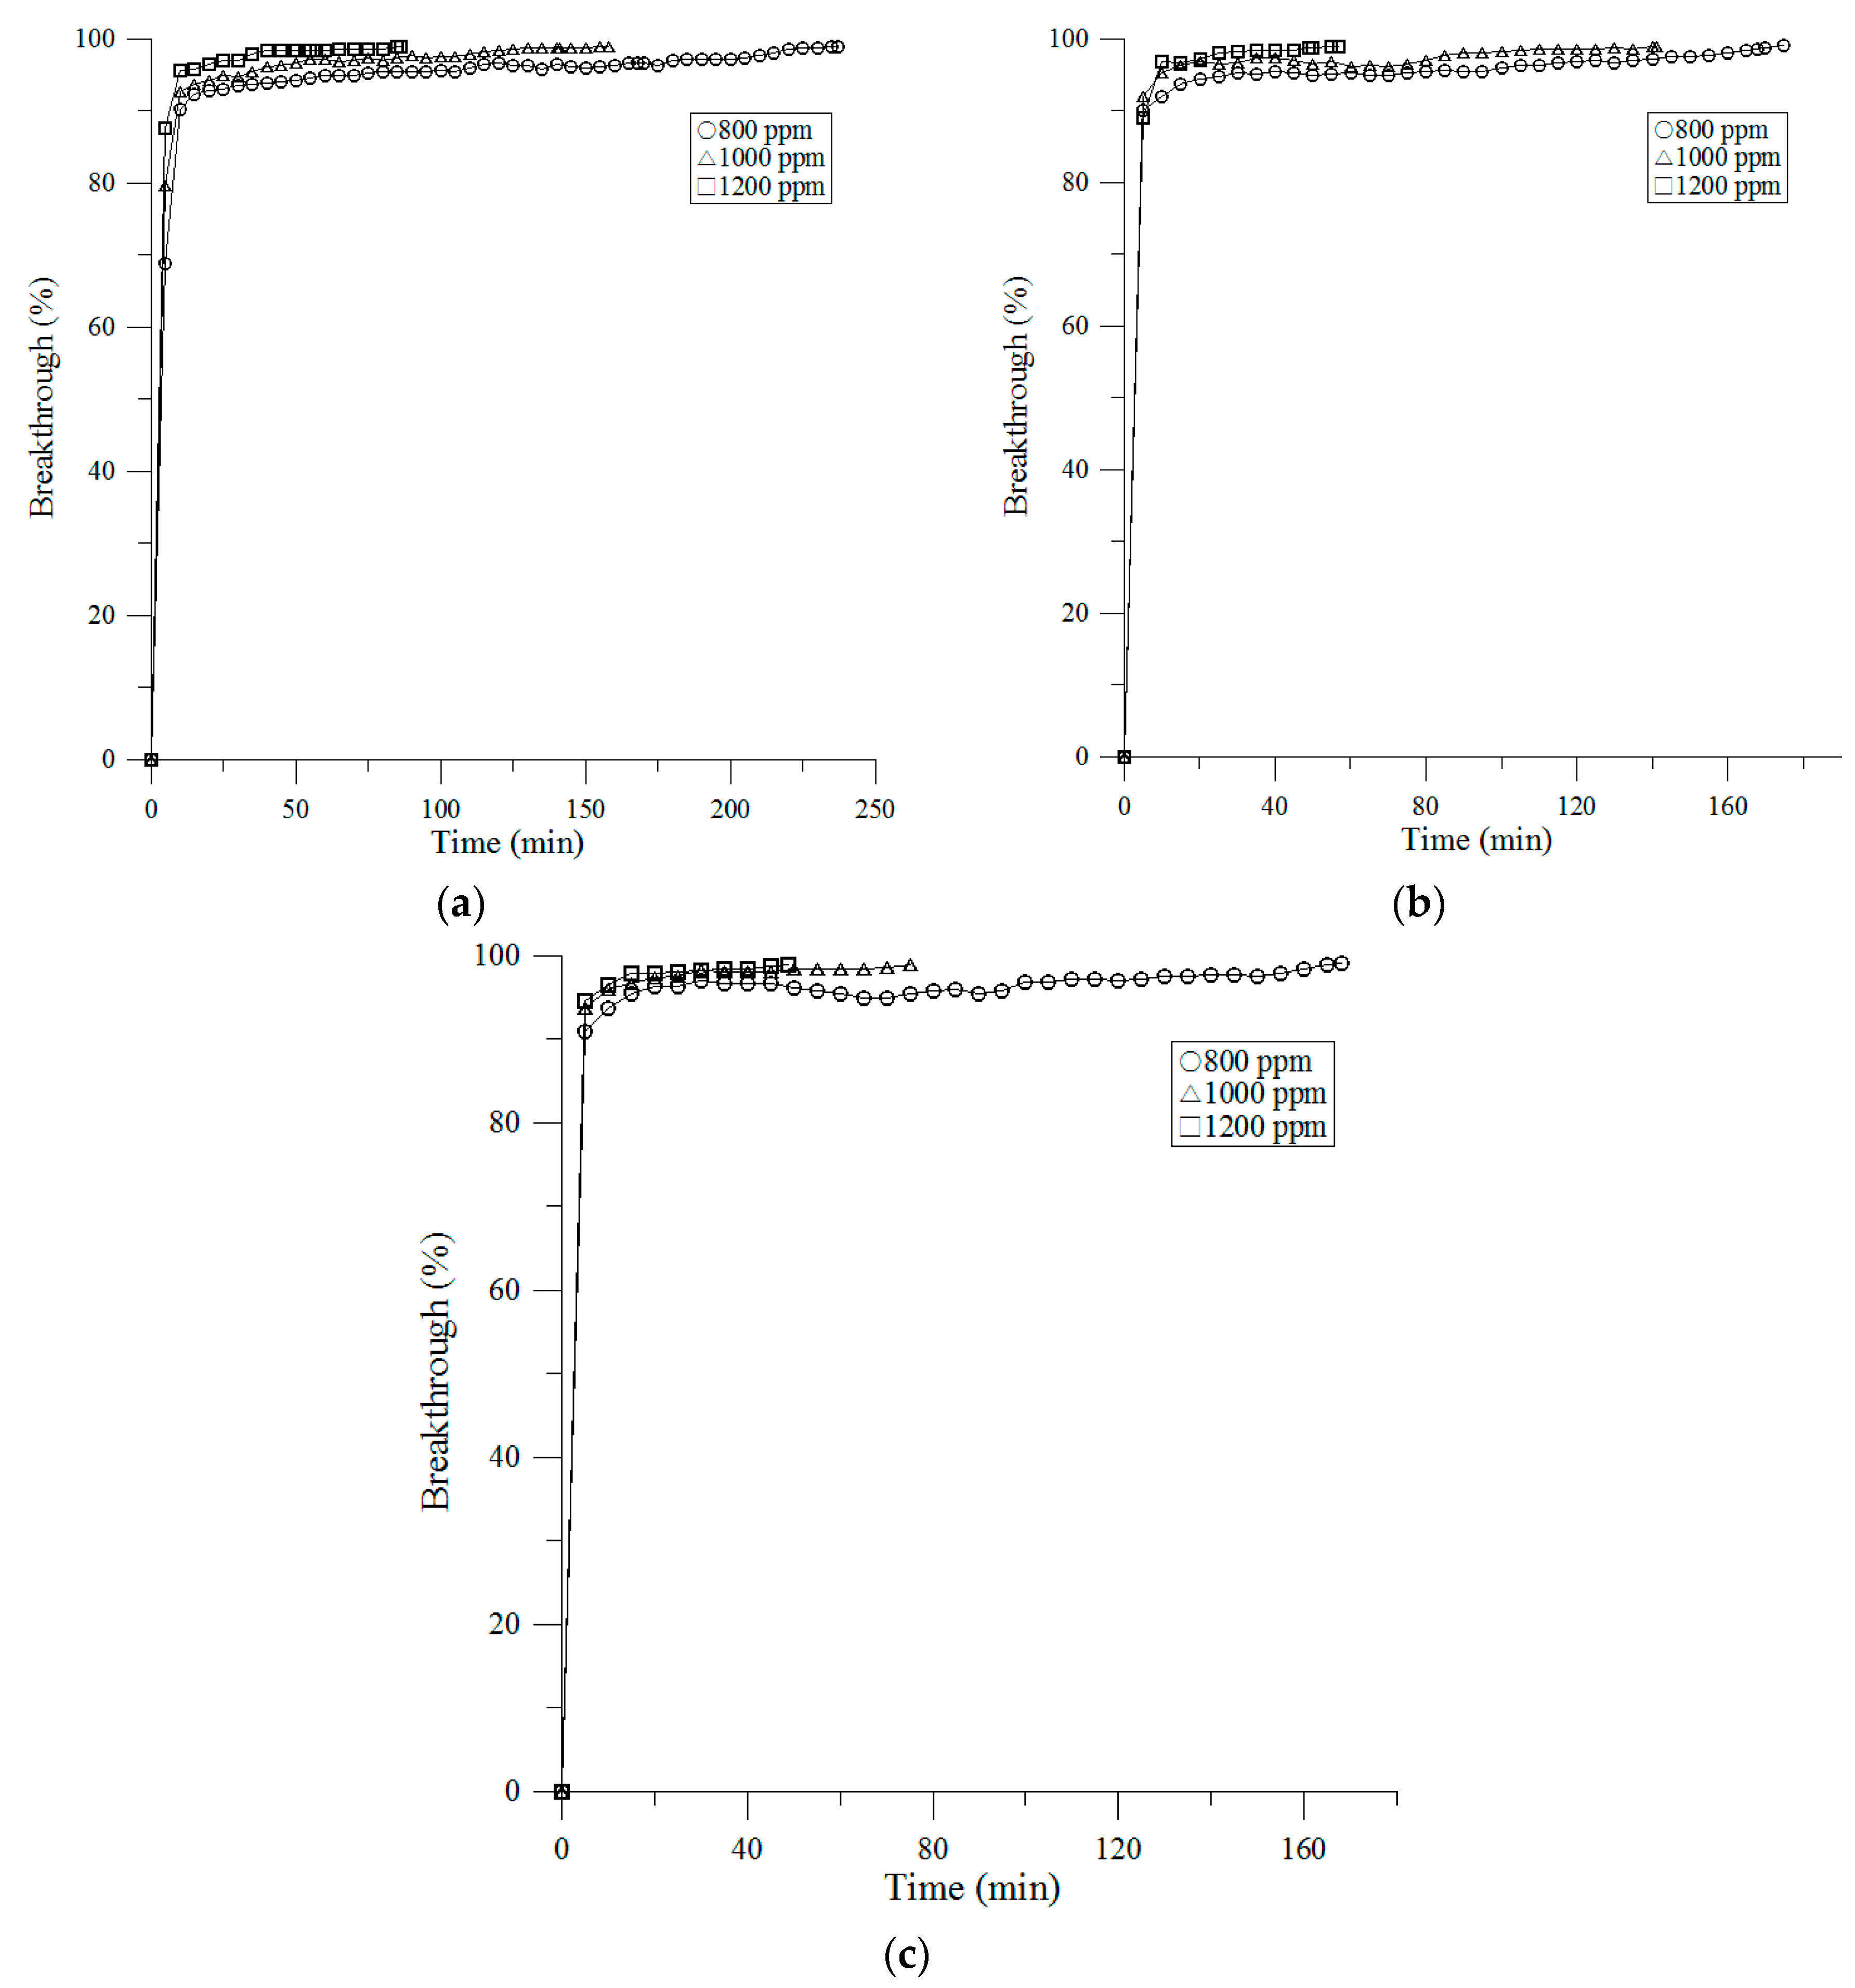
Figure 3 presents CO2 various adsorption capacity with various inlet concentrations and various face velocities. As shown in Figure 3, if the inlet concentration of the adsorbate is increased, resulting in increased diffusion velocity into the pores of the CaO impregnated AC filter, equilibrium adsorption may reach faster; the equilibrium time decreased from 237 to 86 min, 175 to 57 min and 168 to 49 min at 0.1, 0.2 and 0.3 m/s face velocities, respectively.

3.2. Breakthrough

Its determination was performed by various inlet concentration of CO2 from 800 to 1200 ppmv at the face velocity of 0.1 to 0.3 m/s (Figure 4). As shown in Figure 4, increased the inlet concentration of the adsorbate, the breakthrough time was reduced. Furthermore, the face velocity was increased, and the breakthrough time also became shorter.
Nelson and Harder [27] developed the relationship between two different initial concentrations of denoted VOC (Volatile Organic Compound) in terms of the breakthrough time:
t b , 1 t b , 2 = ( C 0 , 1 C 0 , 2 ) α
where α is the average value of slopes of breakthrough time versus different initial CO2 concentration curve plotted on logarithmic scales. We used it to predict the performance of CaO impregnated AC filter under indoor conditions. The relationship curves of different face velocities are shown in Figure 5 and Table 2. From the data of Figure 5 and Table 2, we can conclude that once the slope of one breakthrough time–concentration relationship is known, the slope of the other breakthrough percentages can be approximated. If the breakthrough time at one concentration is known, breakthrough time at other concentrations can be calculated accordingly. Nevertheless, best results are obtained if each individual slope for a given set of conditions is determined experimentally.

3.3. Adsorption Kinetics

The kinetics of CO2 adsorption onto CaO impregnated AC filter was investigated by using pseudo-first-order and pseudo-second-order models.

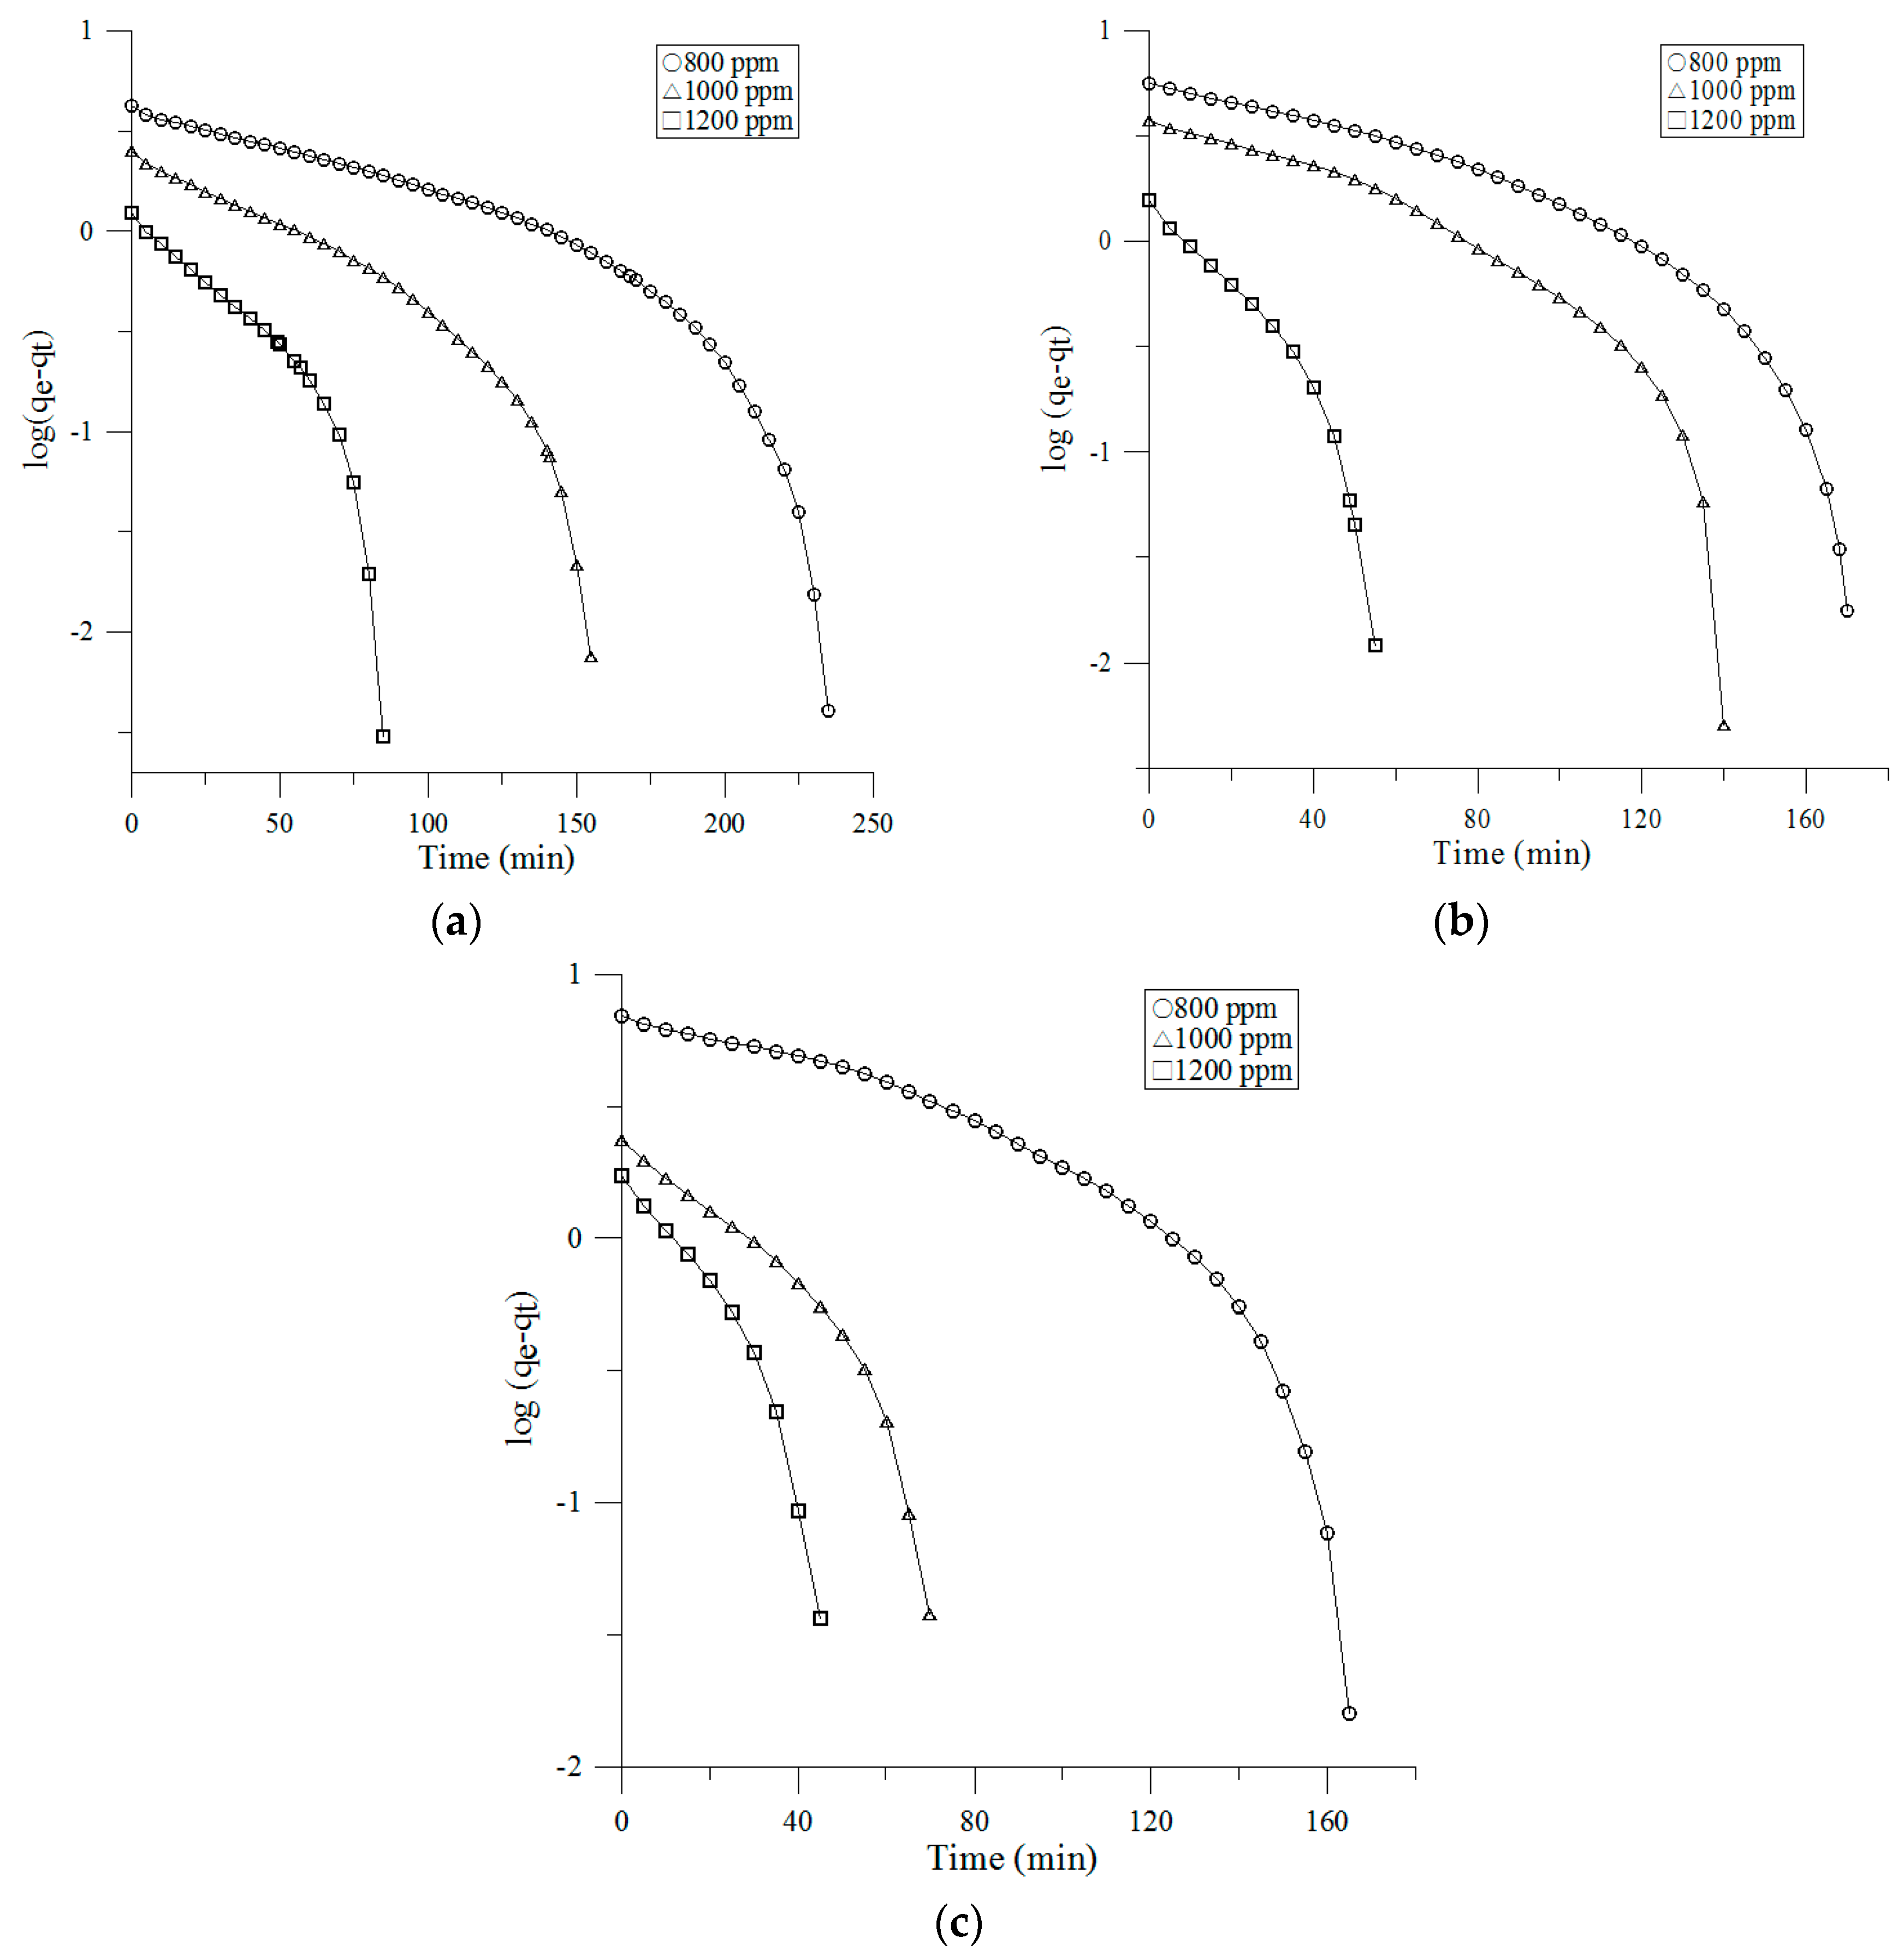
3.3.1. Pseudo-First-Order Model

The pseudo-first-order equation is given as [28]:
log ( q e q t ) = log q e k 1 2.303 t
Figure 6 presents log(qeqt) against t of the pseudo-first order equation plots at the adsorption of CO2. The sorption capacity, qe,1, the first-order rate parameters, k1, and correlation coefficients, r12 are showed in Table 3. The qe experimental values are also contained in Table 3 for comparison with those predicted. The equilibrium adsorption capacity of the experiment increased from 2.77 to 4.54, 2.28 to 3.21 and 2.1 to 2.77 mg g−1 at face velocity 0.1, 0.2, and 0.3 m/s, respectively during CO2 initial concentration increased from 800 to 1200 ppm, pointing out that CO2 removal is relying on initial concentration. The adsorption capacity of the equilibrium increased from 2.73 to 4.51, 2.24 to 3.16 and 2.1 to 2.75 mg g−1 at the initial concentration of CO2 800, 1000 and 1200 ppm, respectively when face velocity increased from 0.1 to 0.3 m/s, showing that the CO2 removal is based on face velocity too. Also, qe calculated values conform well with the experimental data. After all, k1 rate constant values were discovered to increase from 0.0082 to 0.0217, 0.011 to 0.0324 and 0.0108 to 0.0337 min−1 at face velocity 0.1, 0.2 and 0.3 m/s, respectively for an increase in the initial concentration from 800 to 1200 ppm. Since the adsorption kinetics follow pseudo-first-order, the rate constant k1 values should increase linearly with increasing initial concentration [29,30].

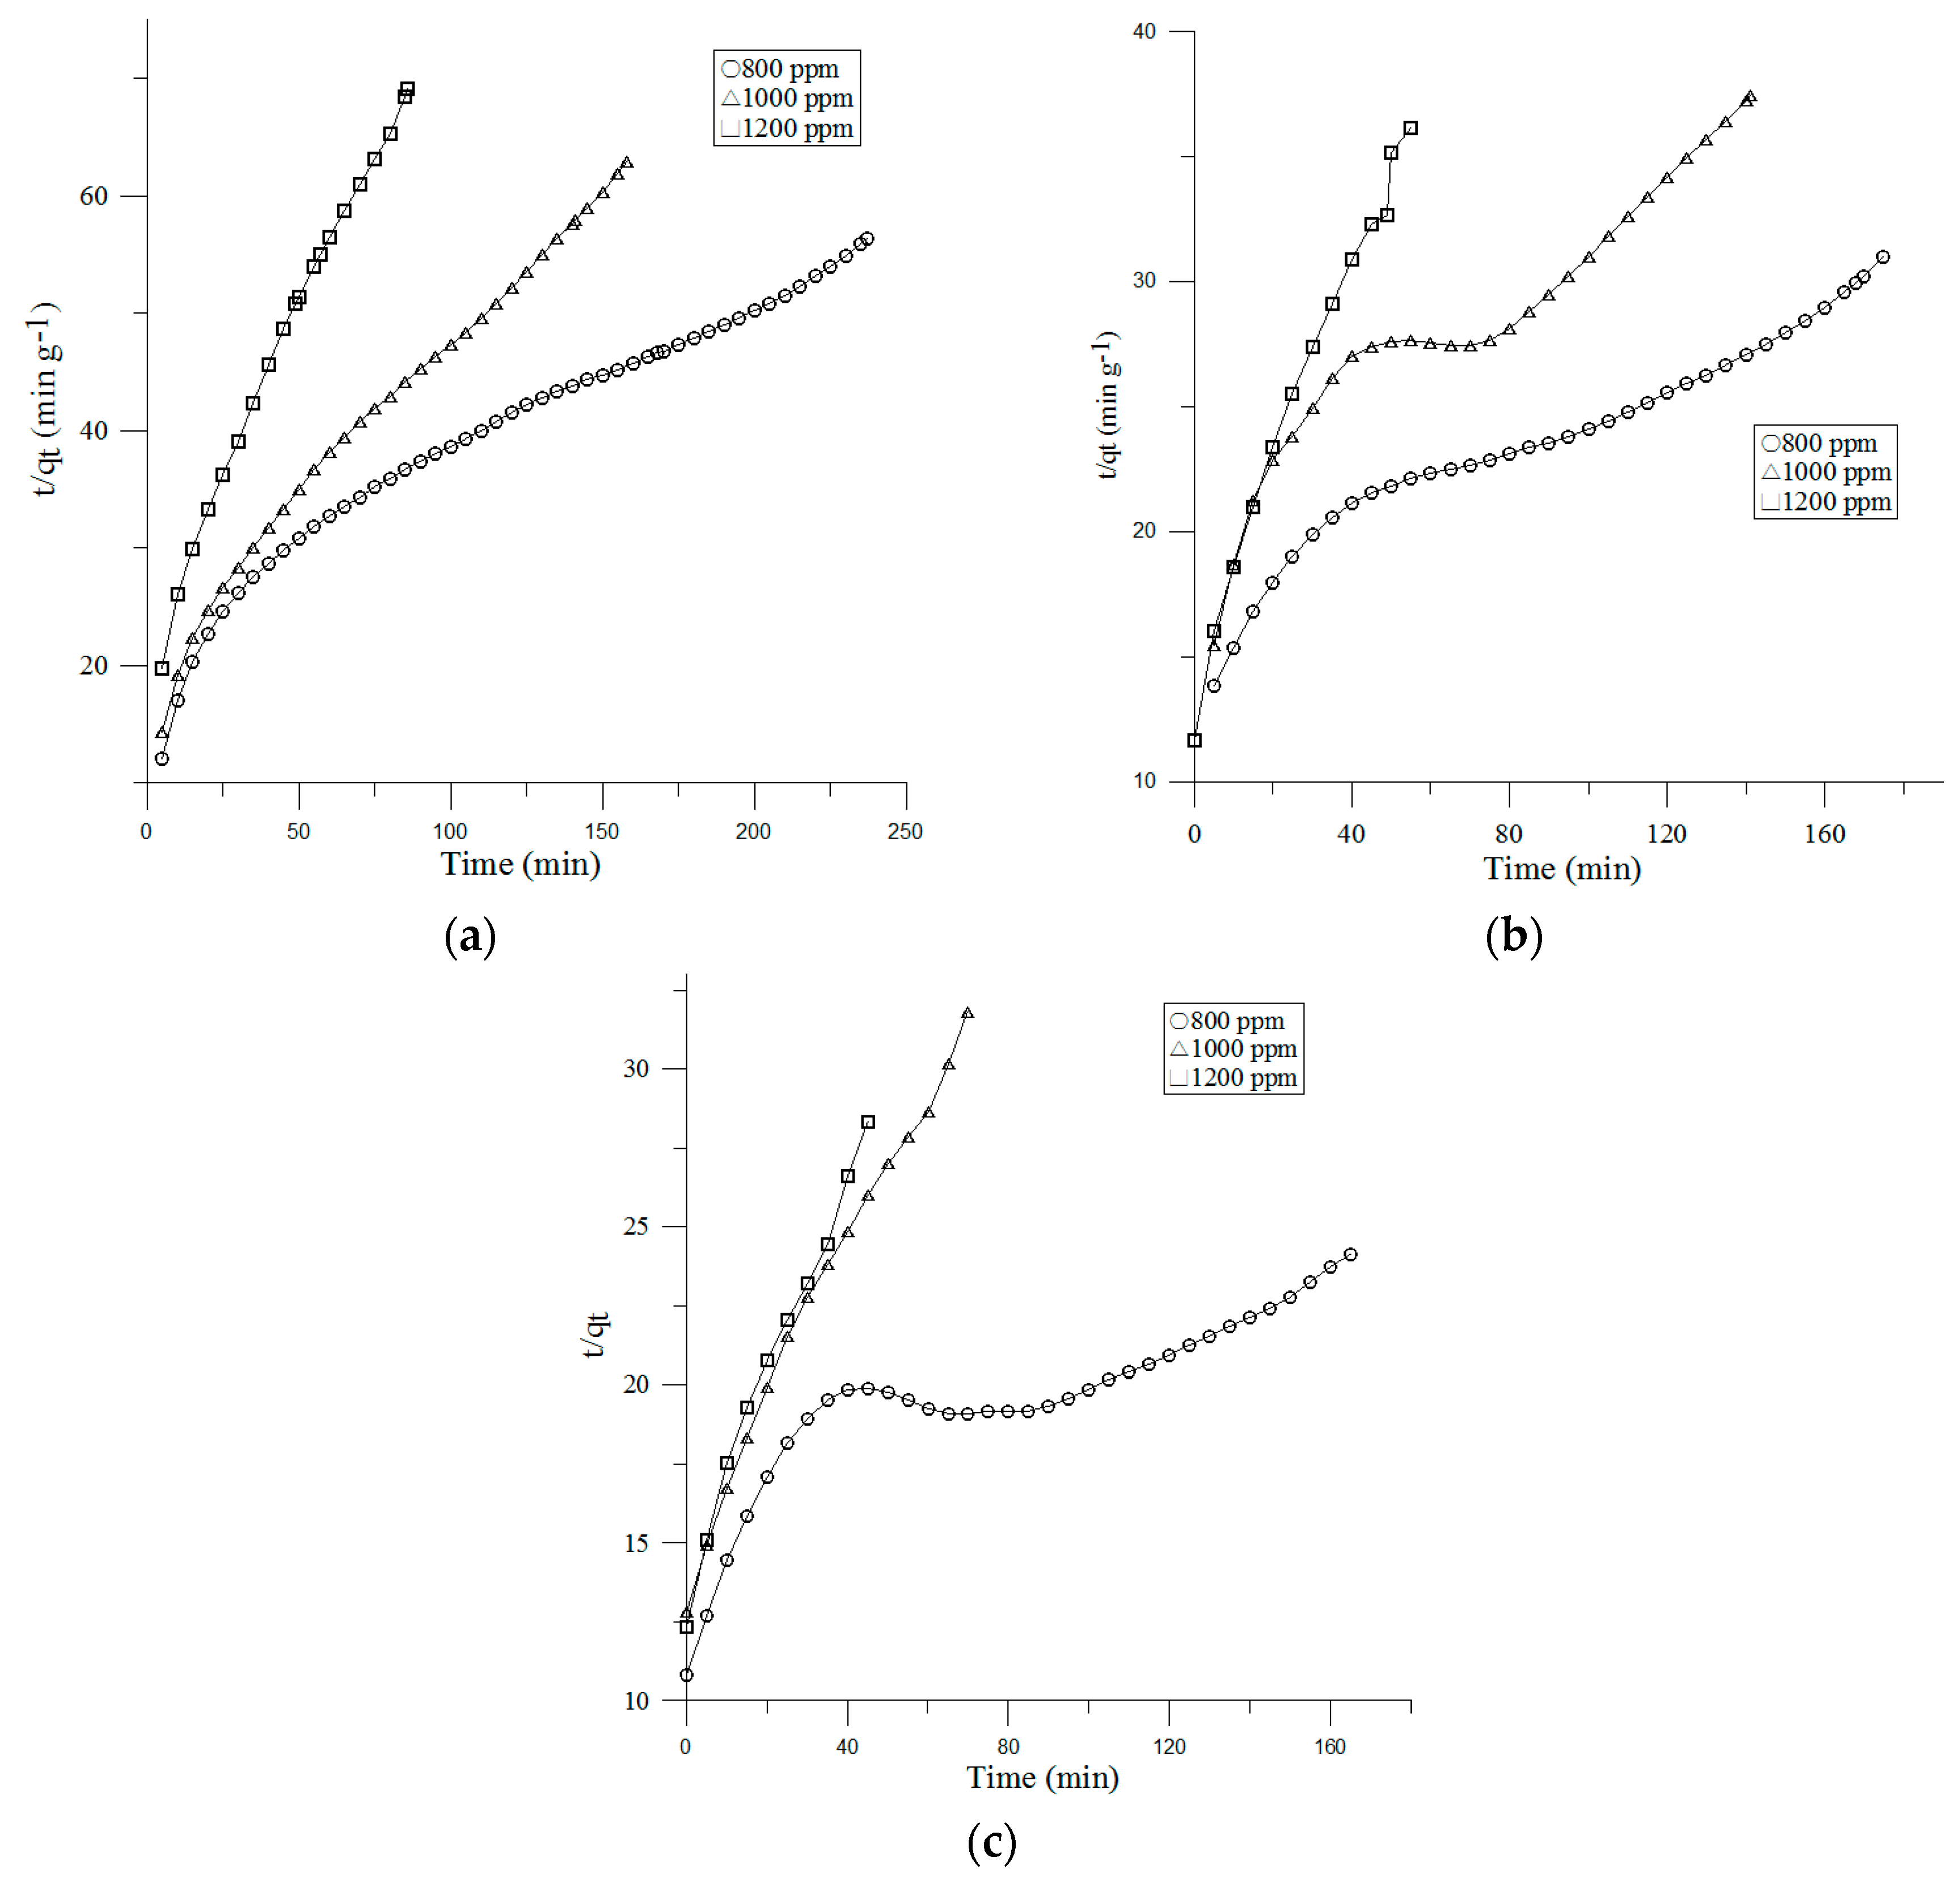
3.3.2. Pseudo-Second-Order Model

The pseudo-second-order model is showed as: [31]
t q t = 1 k 2 q e 2 + 1 q e t
Figure 7 presents plots of t/qt versus t of the pseudo-second order equation of CO2 adsorption. The pseudo-second order rate parameters k2 and the correlation coefficients r22 are presented then compared with r12, ri2, k1, and ki values for the pseudo-first order reaction mechanism and intraparticle model (Table 3). The adsorption capacity qe,2 of the equilibrium increased from 0.309 to 0.498, 0.329 to 0.785, and 0.715 to 0.721 mg g−1 at face velocity 0.1, 0.2, and 0.3 m/s, respectively. When CO2 initial concentration increased from 800 to 1200 ppm, showed the initial concentration effect on CO2 removal. The equilibrium adsorption capacity qe,2 decreased from 4.2 to 1.24, 5.65 to 1.58, and 6.96 to 1.73 mg g−1 at CO2 initial concentration 800, 1000 and 1200 ppm, respectively when face velocity increased from 0.1 to 0.3 m/s, pointing out that the CO2 removal is relying on face velocity too. k2 rate constant values were discovered to increase from 0.149 to 0.5714, 0.0777 to 0.4141 and 0.0496 to 0.33 g mg−1 min−1 for an increase from the initial concentration 800 to 1200 ppm at face velocity 0.1, 0.2 and 0.3 m/s, respectively. Also, qe calculated values conform well with the experimental data. The rate coefficient k2 of the pseudo-second-order rate model is figured versus CO2 initial concentration and is shown, the relation is not a simple function between k2 and C0 [29,30].

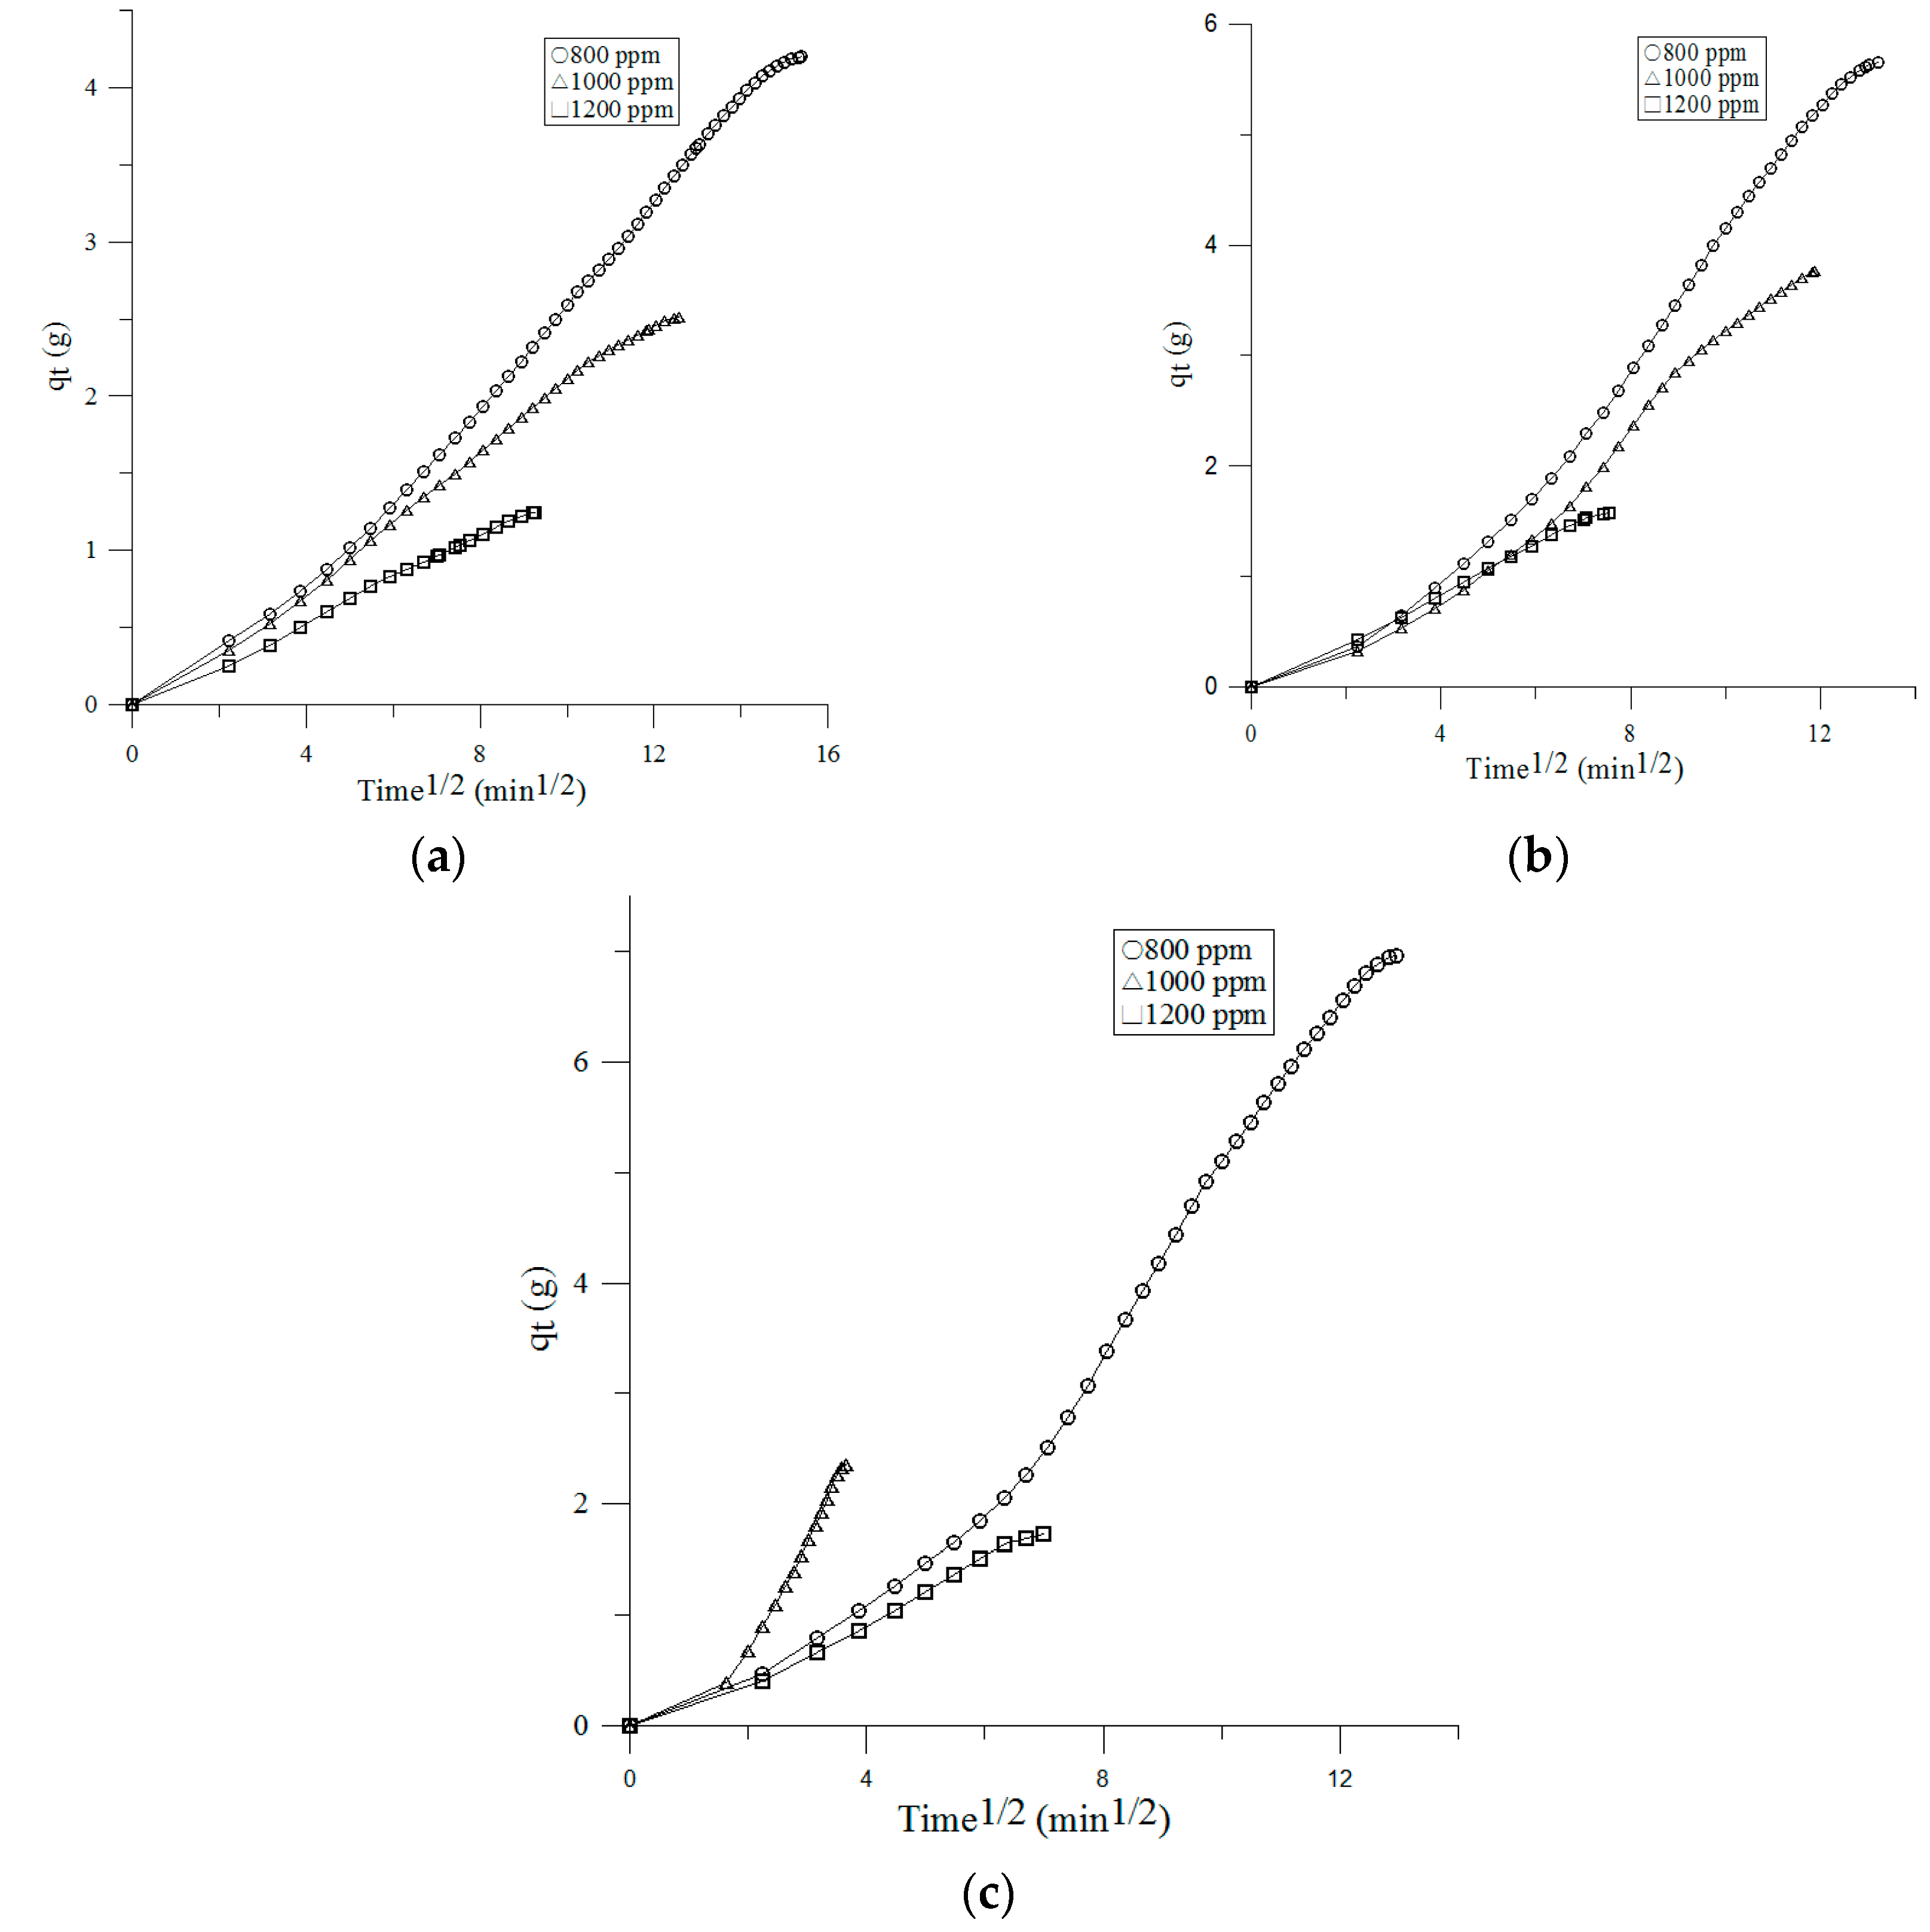
3.3.3. Intraparticle Diffusion Model

It was also shown that the intraparticle diffusion model [32,33] rate processes are generally presented in respect to square root of time. The following equation decided ki rate parameters of intraparticle diffusion at various initial concentrations.
q t = k i t 1 / 2
As presented the intraparticle diffusion model at a face velocity of 0.1 m/s in Figure 8a, the external surface adsorption (Stage 1) is out. Before 16 min, Stage 1 is finished and then intraparticle diffusion control of Stage 2 is obtained and it goes on from 25 min to 196, 144 and 64 min at 800, 1000 and 1200 ppm inlet concentration, respectively. Lastly, Stage 3 equilibrium adsorption begins after 225, 169 and 100 min at the inlet concentration of 800, 1000 and 1200 ppm, respectively [34]. The CO2 is slowly transferred with intraparticle diffusion into the particles and lastly stays in the micropores. Generally, intraparticle diffusion rate constant ki is the slope of the line in Stage 2. Table 3 also listed the rate parameter ki and its correlation coefficients. There was some control of boundary layer as it can be seen from the value of C.

4. Conclusions

The CaO impregnated AC filter system is suitable for reducing the CO2 indoor air concentration in buildings with air condition system. In CO2 single vapor adsorption measurements, the adsorption time decreased with inlet concentration of CO2 and face velocity increased. The adsorption capacity increased with increased initial concentration and decreased face velocity, too. To increase the inlet concentration of the adsorbate, the breakthrough time was reduced. Furthermore the face velocity was increased, and the breakthrough time also became shorter. Once the slope of one breakthrough time–concentration relationship is known, the slope of the other breakthrough percentages can be approximated. The pseudo-first- and second-order kinetics, and intraparticle diffusion model also performed kinetic analysis for the adsorption of CO2 onto CaO impregnated AC filter. The trend of adsorption of CO2 onto CaO impregnated AC filter for various initial CO2 concentrations over the complete range succeed the pseudo-second-order kinetic model of the test data fixed on the highest correlation coefficient of determination, R2(0.921) values which signifies a monolayer adsorption phenomenon exists between CaO impregnated AC filter and CO2. The CO2 is slowly transferred with intraparticle diffusion into the particles and is lastly kept in micropores.

Acknowledgments

The authors would like to acknowledge the supports from Air-rex Co., Ltd. in Taiwan. Thanks also for the editing service by Mike Barber, a retired academic faculty member of the University of Liverpool, UK.

Author Contributions

Shih-Cheng Hu and Arson Hsieh conceived and designed the experiments; Tzu-Yu Ko performed the experiments; Angus Shiue and Shu-Mei Chang analyzed the data; Andrew Chan contributed reagents/materials/analysis tools; Angus Shiue wrote the paper.

Conflicts of Interest

The authors declare no conflict of interest.

Nomenclature

Cintercept of intraparticle diffusion model, mg kg−1
Ceconcentration of free formaldehyde in air, mg L−1
C0the inlet concentration, ppm
k1the pseudo-first-order rate coefficient, min−1
k2the pseudo-second-order rate coefficient, g mg−1 min−1
kithe intraparticle diffusion rate constant, mg g−1 min−1/2
Mtesting gas molecular weight, g mole−1
Qadsorption capacity, mg g−1
qethe amount of adsorbed CO2, mg g−1
qtthe amount of adsorbate adsorbed at time t, mg g−1
ttesting time, min
Vthe airflow rate, L min−1

References

  1. Brunsgaard, C.; Heiselberg, P.; Knudstrup, M.A.; Larsen, T.S. Evaluation of the Indoor Environment of Comfort Houses: Qualitative and Quantitative Approaches. Indoor Built Environ. 2012, 21, 432–451. [Google Scholar] [CrossRef]
  2. Davis, I.; Harvey, V. Zero Carbon: What Does It Mean to Homeowners and House Builders? NHBC Foundation Report, NF9; London IHS BRE Press: London, UK, 2008. [Google Scholar]
  3. Morrell, P. HM Government, Innovation & Growth Team. 2010. Available online: http://www.bis.gov.uk/assets/biscore/business-sectors/docs/l/10-1266-low-carbon-construction-igtfinal-report.pdf (accessed on 4 November 2011).
  4. Yu, C.W.F.; Kim, J.T. Building Pathology, Investigation of Sick Buildings—VOC Emissions. Indoor Built Environ. 2010, 19, 30–39. [Google Scholar] [CrossRef]
  5. Chuck, W.F.; Kim, J.T. Photocatalytic Oxidation for Maintenance of Indoor Environmental Quality. Indoor Built Environ. 2013, 22, 39–51. [Google Scholar]
  6. Yao, R.; Yu, C.W.F. Towards “Zero-Carbon Homes”—Issues of Thermal Comfort. Indoor Built Environ. 2012, 21, 483–485. [Google Scholar] [CrossRef]
  7. Lee, S.C.; Hsieh, C.C.; Chen, C.H.; Chen, Y.S. CO2 Adsorption by Y-Type Zeolite Impregnated with Amines in Indoor Air. Aerosol Air Q. Res. 2013, 13, 360–366. [Google Scholar] [CrossRef]
  8. American Society of Testing and Materials (ASTM). Standard Guide for Using Indoor Carbon Dioxide Concentrations to Evaluate Indoor Air Quality and Ventilation; American Society for Testing and Materials International: West Conshohocken, PA, USA, 2012. [Google Scholar]
  9. Occupational Safety and Health Administration, Department of Labor. Indoor Air Quality in Commercial and Institutional Buildings; OSHA: Department of Labor: Washington, DC, USA, 2011.
  10. Ventilation for Acceptable Indoor Air Quality; ASHRAE Standard 62.1; American Society of Heating, Refrigerating and Air-Conditioning: Atlanta, GA, USA, 2016.
  11. What Is the Allowable Level of Carbon Dioxide in an Occupied Space? ASHRAE TC-04.03-FAQ-35. 2015. Available online: https://www.ashrae.org/FileLibrary/docLib/.../TC-04-03-FAQ-35.pd (accessed on 24 July 2017).
  12. Ogawa, M.; Nakano, Y. Separation of CO2/CH4 mixture through carbonized membrane prepared by gel modification. J. Membr. Sci. 2000, 173, 123–132. [Google Scholar] [CrossRef]
  13. Liao, C.H.; Li, M.H. Kinetics of absorption of carbon dioxide into aqueous solutions of monoethanolamine + N-methyldiethanolamine. Chem. Eng. Sci. 2002, 57, 4569–4582. [Google Scholar] [CrossRef]
  14. Cornelissen, R.L.; Hirs, G.G. Energy analysis of cryogenic air separation. Energy Convers. Manag. 1998, 39, 1821–1826. [Google Scholar] [CrossRef]
  15. Sarkar, S.C.; Bose, A. Role of activated carbon pellets in carbon dioxide removal. Energy Convers. Manag. 1997, 38, S105–S110. [Google Scholar] [CrossRef]
  16. Song, H.K.; Won, C.K.; Lee, K.H. Adsorption of carbon dioxide on the chemically modified silica adsorbents. J. Non-Cryst. Solids 1998, 242, 69–80. [Google Scholar] [CrossRef]
  17. Shin, D.H.; Cheigh, H.S.; Lee, D.S. The use of Na2CO3-based CO2 absorbent systems to alleviate pressure buildup and volume expansion of kimchi packages. J. Food Eng. 2002, 53, 229–235. [Google Scholar] [CrossRef]
  18. Ranjani, V.S.; Shen, M.S.; Edward, P.F. Adsorption of CO2 zeolites at moderate temperatures. Energy Fuel. 2005, 19, 1153–1159. [Google Scholar]
  19. Liu, B.T.; Shui, Y.H.; Zhu, G.Y. Adsorption of a Non-Woven Fabric with Activated Carbon for CO2. Adv. Mater. Res. 2012, 518, 683–686. [Google Scholar]
  20. Jensen, M.B.; Pettersson, L.G.M.; Swang, O.; Olsbye, U. CO2 Sorption on MgO and CaO Surfaces: A Comparative Quantum Chemical Cluster Study. J. Phys. Chem. B 2005, 109, 16774–16781. [Google Scholar] [CrossRef] [PubMed]
  21. Lahuri, A.H.; Yarmo, M.A.; Marliza, T.S.; Tahariri, M.N.A.; Samad, W.Z.; Yusop, N.D.M.R. Carbon Dioxide Adsorption and Desorption Study Using Bimetallic Calcium Oxide Impregnated on Iron (III) Oxide. Mater. Sci. Forum 2017, 888, 479–484. [Google Scholar]
  22. Hu, S.C.; Chang, A.; Angus Shiue, A.; Lin, T.; Song-Dun Liao, S.D. Adsorption characteristics and kinetics of organic airborne contamination for the chemical filters used in the fan-filter unit (FFU) of a cleanroom. J. Taiwan Inst. Chem. Eng. 2017, 75, 87–96. [Google Scholar] [CrossRef]
  23. American Society of Heating, Refrigerating and Air-Conditioning Engineers (ASHRAE). Laboratory Test Method for Assessing the Performance of Gas-Phase Air-Cleaning Systems: Air-Cleaning Devices; American Society of Heating, Refrigerating and Air-Conditioning Engineers: Atlanta, GA, USA, 2011. [Google Scholar]
  24. VanOsdell, D.W.; Owen, M.K.; Jaffe, L.B.; Sparks, L.E. VOC removal at low contaminant concentrations using granular activated carbon. J. Air Waste Manag. Assoc. 1996, 46, 883–890. [Google Scholar] [CrossRef] [PubMed]
  25. Guo, B.; Zhang, B.; Jianshun, S.; Nair, S.; Chen, W.; Smith, J. VOC removal performance of pellet/granular-type sorbent media-experimental results. ASHRAE Trans. 2006, 112, 430–440. [Google Scholar]
  26. Shiue, A.; Kang, Y.H.; Hu, S.C.; Jou, G.T.; Lin, C.H.; Hu, M.C.; Lin, S.I. Vapor adsorption characteristics of toluene in an activated carbon adsorbent-loaded nonwoven fabric media for chemical filters applied to cleanrooms. Build. Environ. 2010, 45, 2123–2131. [Google Scholar] [CrossRef]
  27. Nelson, G.O.; Harder, C.A. Respirator cartridge efficiency studies: VI. Effect of concentration. Am. Ind. Hyg. Assoc. J. 1976, 37, 205–216. [Google Scholar] [CrossRef] [PubMed]
  28. Lagergren, S. Zur Theorie der Sogenannten Adsorption Gelöster Stoffe, Kungliga Svenska Vetenskapsakademiens. Handlingar 1898, 24, 1–39. [Google Scholar]
  29. Shafeeyan, M.S.; Ashri, W.M.; Daud, W.; Shamiri, A.; Aghamohammadi, N. Modeling of Carbon Dioxide Adsorption onto Ammonia-Modified Activated Carbon: Kinetic Analysis and Breakthrough Behavior. Energy Fuels 2015, 29, 6565–6577. [Google Scholar] [CrossRef]
  30. Singh, V.K.; Kumar, E.A. Comparative Studies on CO2 Adsorption Kinetics by Solid Adsorbents. Energy Procedia 2016, 90, 316–325. [Google Scholar] [CrossRef]
  31. Ho, Y.S.; McKay, G. The kinetics of sorption of basic dyes from aqueous solution by sphagnum moss peat. Can. J. Chem. Eng. 1998, 76, 822–827. [Google Scholar] [CrossRef]
  32. Guibal, E. Metal-Anion Sorption by Chitosan Beads: Equilibrium and Kinetic Studies. Ind. Eng. Chem. Res. 1998, 37, 1454–1463. [Google Scholar] [CrossRef]
  33. Fungaro, D.A.; Borrely, S.I.; Carvalho, T.E.T. Surfactant Modified Zeolite from Cyclone Ash as Adsorbent for Removal of Reactive Orange 16 from Aqueous Solution. Am. J. Environ. Prot. 2013, 1, 1–9. [Google Scholar] [CrossRef]
  34. Shiue, A.; Hu, S.C. Adsorption Kinetics for the Chemical Filters Used in the Make-Up Air Unit (MAU) of a Cleanroom. Sep. Sci. Technol. 2012, 47, 577–583. [Google Scholar] [CrossRef]
Figure 1. Schematic diagram of the test system [22].
Sustainability 09 01533 g001
Figure 2. Schematic of the test principle [25].
Sustainability 09 01533 g002
Figure 3. Effect of concentration on CO2 adsorption capacity (a) 0.1 m/s; (b) 0.2 m/s; (c) 0.3 m/s.
Sustainability 09 01533 g003
Figure 4. Effect of inlet concentration of CO2 on the breakthrough (a) 0.1 m/s, (b) 0.3 m/s, (c) 0.5 m/s.
Sustainability 09 01533 g004
Figure 5. Effect of initial concentrations on the breakthrough time.
Sustainability 09 01533 g005
Figure 6. Pseudo-first order kinetics plot for adsorption of CO2 on CaO impregnated activated carbon (AC) filter (a) 0.1 m/s; (b) 0.2 m/s; (c) 0.3 m/s.
Sustainability 09 01533 g006
Figure 7. Pseudo-second order kinetic plot of CO2 adsorption onto CaO impregnated AC filter (a) 0.1 m/s; (b) 0.2 m/s; (c) 0.3 m/s.
Sustainability 09 01533 g007
Figure 8. Intra-particle mass transfer curve of CO2 adsorption on CaO impregnated AC filter (a) 0.1 m/s; (b) 0.2 m/s; (c) 0.3 m/s.
Sustainability 09 01533 g008
Table 1. Procedures for preparation of impregnants.
Reagent and AmountSolution (wt %)DI Water (mL)AC (g)
10 g Ca(CH3CO2)2·H2O4.80%20010
Table 2. Effect of initial concentrations on the breakthrough time.
Face Velocity (m/s)Breakthrough Time vs. Initial Concentration
0.1 t b C 0 0.4009 = 15 , 060.037 , R2 = 0.9982
0.2 t b C 0 0.3602 = 29 , 584.327 , R2 = 0.9963
0.3 t b C 0 0.3309 = 60 , 596.96 , R2 = 0.9909
Table 3. Comparison of the pseudo-first- and second-order adsorption, and intraparticle diffusion rate constants.
Face VelocityInlet Concentration Pseudo-First OrderPseudo-Second OrderIntra-Particle Diffusion
qe (exp, g)k1 (min−1)qe,1 (g)r12k2 (g−1 min−1)qe,2 (g)r22ki (g min−1/2)Cri2
0.1 m/s800 ppm2.770.00822.730.78150.1494.20.95190.3076−0.44870.9935
1000 ppm3.660.01193.640.8660.27832.510.98440.2153−0.09790.9958
1200 ppm4.540.02174.510.78430.57141.240.98880.1397−0.02660.9472
0.2 m/s800 ppm2.280.0112.240.82130.07775.650.95040.5096−1.01580.9811
1000 ppm3.010.01322.990.78270.12143.770.9210.3727−0.62310.9771
1200 ppm3.210.03243.160.88840.41411.580.98060.2182−0.02860.9975
0.3 m/s800 ppm2.100.01082.100.78740.04966.960.95650.6473−1.48210.9671
1000 ppm2.420.02142.410.88740.2532.360.98570.7353−0.51220.905
1200 ppm2.770.03372.750.90740.331.730.98470.2657−0.11270.9888

