Impact of Climate Change on the Preferred Season for Outdoor Water Activities


1
Tourism Policy Research Division, Korea Culture and Tourism Institute, Seoul 07511, Korea
2
Interdisciplinary Program in Landscape Architecture, Seoul National University, Seoul 08826, Korea
3
Department of Landscape Architecture, College of Agriculture and Life Sciences, Seoul National University, Seoul 08826, Korea
*
Authors to whom correspondence should be addressed.
Sustainability 2017, 9(9), 1535; https://doi.org/10.3390/su9091535
Submission received: 28 June 2017
/
Revised: 16 August 2017
/
Accepted: 24 August 2017
/
Published: 29 August 2017
Abstract
:The purpose of this study is to predict changes in the season for outdoor water activities due to climate change. Nine public outdoor swimming pools in three megacities of South Korea (Seoul, Daegu, and Busan) were selected as study sites. To determine the preferred weather conditions for outdoor water activities, the preference functions of weather elements for outdoor water activities were structured by finding the best-fitting lines with the Z-score of the number of visitors, which is calculated for each swimming pool each year, and the inflection points or the stabilized point of preference functions are set as thresholds for preferred weather conditions for outdoor water activities. To predict changes in the preferred season for outdoor water activities, future weather data for the 2030s, 2060s, and 2090s derived from RCP scenarios are adapted to the thresholds of preferred weather conditions. The results of this study show that the preferred temperature range for outdoor water activities is: 24.6 °C to 35.0 °C in Seoul, 25.5 °C to 35.5 °C in Daegu, and 27.4 °C to 34.4 °C in Busan, and that the maximum threshold for precipitation is: 36.5 mm in Seoul, 31.5 mm in Daegu, and 26.5 mm in Busan. The results of this study show that the preferred season for outdoor water activities will expand compared to its current duration due to warmer temperatures in the future, and the preferred period for these activities will shift from June to September to May to June and September to October due to extremely hot weather in July and August beginning in the 2030s. The results of this study imply that there will be major changes in the demand and operation of outdoor water activities due to climate change, making it necessary to begin preparations to combat and respond to climate change.
1. Introduction
As people naturally prefer comfortable weather, those who attempt to enjoy recreational activities prefer to visit places with more comfortable weather [1]. Thus, weather functions as a major factor when choosing a destination for recreation [1,2,3]. Weather plays an even more vital role in destinations where weather conditions are the main attraction, especially destinations for outdoor water activities [4].
There are three facets through which recreation participants perceive weather conditions: thermal, physical, and aesthetic. The thermal facet is participants’ perceived thermal sensations and comfort based on the atmospheric environment, which includes temperature, humidity, and wind speed. The physical facet concerns the existence of specific meteorological elements, such as rain, snow, and high winds, which directly affects or restricts participants’ activities. The aesthetic facet is scenic comfort based on visibility, sunshine, and cloudiness with prevailing synoptic conditions. Through these three facets, weather conditions influence the demand for or satisfaction from recreational activities [5].
Meanwhile, the temperature of the Earth’s surface has increased, and the frequency of extreme weather events, such as heat waves, heavy rain, and storms, has increased as well. According to a report from the Intergovernmental Panel on Climate Change (IPCC) in 2013, the temperature of the Earth’s surface has increased by approximately 0.85 °C (minimum 0.65 °C to maximum 1.06 °C) from 1880 to 2012, and the rate of global warming has gradually accelerated. Furthermore, it is expected that without efforts to mitigate the effects of climate change, the average surface temperature of the Earth will be 4.8 °C higher from 2080 to 2100 than it was from 1986 to 2005 [6].
Many researchers have stated that the phenomenon of climate change will have a significant impact on the recreation industry [1,3,7,8,9]. A direct impact of climate change is reflected in the way that climate change is believed to alter weather conditions at destinations, as well as cause changes in the thermal, physical, and aesthetic environment of a given location; this can, over time, lead to the geographic and seasonal redistribution of climate resources for destinations [10,11]. It is expected that locations that are largely dependent on certain weather conditions, such as those utilized for outdoor water activities, will experience these impacts more acutely [4].
Thus, many researchers have performed studies to predict the long-term impact of climate change on recreation and outdoor water activities to better prepare these locations to respond to unexpected changes in the future. These researchers examining outdoor water activities in this scenario have tried to find the preferred weather conditions for outdoor water activities. De Freitas et al. [12] conducted a survey with students at a university, which detailed their preferred climate conditions for sun, sea, and sand (3S) activities, and articulated optimal climate conditions. The findings of this study became the Climate Index for Tourism (CIT). Becker [13] developed the Beach Comfort Index (BCI) by analyzing thermal perception and stress to the human body and applied it to the beaches of South Africa. Scott, Gössling, and De Freitas [14] surveyed students from Canada, New Zealand, and Sweden, and found the ideal weather conditions for beach tourism. Morgan et al. [15] surveyed visitors on the beaches of the Mediterranean about the adequateness of the climate for their beach activities and developed the User Based BCI. Additionally, Ibarra [16] monitored attendance at a beach in Spain through the use of a webcam, conducted visitor surveys, and found suitable weather conditions for sun and beach tourism.
These studies commonly mentioned that the participants of outdoor water activities are more interested in going to locations as temperature increases once the temperature passes a specific threshold, which indicates that it is warm enough to engage in outdoor water activities, but this preference declines when the temperature reaches another, higher threshold because of extremely hot weather. In other words, the preferred temperature for outdoor water activities increases and then decreases at specific points [5,10]. Meanwhile, the suggested ideal weather conditions for outdoor water activities have varied by study. For example, Scott, Gössling, and De Freitas [14] based their work on student surveys in Canada, New Zealand, and Sweden, and suggested 24.9 to 28.5 °C as the ideal temperature range for outdoor water activities, Morgan et al. [15] based their study on a survey conducted at Mediterranean beaches and suggested 32.5 °C to 35.5 °C as an ideal temperature, and Ibarra [16] used webcam observations, as well as a visitor survey at a beach in Spain, and suggested an ideal temperature of 35 °C to 41 °C. The reason for these differences can be explained by differences in the selected study sites, study methods, and survey targets. For example, the preferred temperature for outdoor activities may naturally differ by region and environment. It is also possible that visitors, most of whom presumably live relatively close to these regions, have different preferences for or tolerances to certain temperatures. Furthermore, it is possible that because these studies are based on preference surveys, which rely on opinions rather than actual observed behavior, the respondents might say that they prefer certain weather conditions based on their general perceptions rather than actual preference.
Studies predicting changes over time in the recreation industry due to climate change have also been previously conducted. Research in this regard has focused on how preferred seasons and destinations for outdoor water activities will be affected by climate change using the suggested preferred weather conditions from previous studies. For example, Moreno and Amelung [17] analyzed the BCI of European beaches and predicted future changes in the climate comfort provided by the beaches when the long-term effects of climate change are accounted for. The results of this study showed that areas with comfortable weather conditions will move north due to global temperature increases. Amelung and Viner [18] and Scott, McBoyle, and Schwartzentruber [7] analyzed the TCI (Tourism Climatic Index) of popular recreation destinations, such as the Mediterranean and Florida, and predicted the change in preferred seasons for these cities as a result of climate change in the future. The results of this study showed that the preferred season at present, normally July and August, will be less preferable in the future because of extremely hot weather conditions, while seasons that are less preferable now, such as June and September, will become more popular because of generally warmer weather during these months.
These past studies are meaningful in that they have attempted to discover weather conditions that participants of outdoor water activities prefer. However, these studies have their limitations. First, these studies were conducted on very popular recreational destinations, such as world-class beaches. Because visitors plan and book visitation to these popular beaches in advance, they may visit the locations as planned, regardless of weather conditions. This means there is a possibility that they express satisfaction with the weather conditions during their visit even if the actual weather is not very satisfactory as a means of justifying their expenses. In addition, because these beaches have other noteworthy attractions, including landscape and nearby facilities, the satisfaction provided by the diversity of attractions (e.g., the beach itself, accommodations, and landscapes) may outweigh the dissatisfaction from weather conditions [19]. At these destinations, weather-related satisfaction is difficult to separate from the satisfaction provided by other nearby attractions. Second, because survey-based studies rely on opinions rather than actual behaviors, it is hard to believe the participants’ stated preferred temperatures are the same as their actual preferred temperatures. Even though there has been a study that conducted webcam observation [16], because this study roughly divided the level of occupation of the beach as null, low, medium, and high, it is difficult to accurately calculate the preferred weather conditions based on the level of occupation. These limitations mean that the weather conditions for outdoor water activities that are based on world-class beaches and which utilize survey methods are ineffective for determining the actual preferred weather conditions for outdoor water activities, and future changes in the preferred season for outdoor water activities due to climate change using these calculated weather conditions are also subject to inaccuracies.
The purpose of this study is to predict the impact of climate change on outdoor water activities in a way that takes things a step further than past studies. To overcome the limitations of previous studies, this study employs several strategies. First, to better focus on the effect weather has on outdoor water activities, this study selected public urban outdoor swimming pools as study sites. Because public pools offer limited attractions and services, unlike beaches or pools managed by private companies that offer diverse attractions, such as rides, non-weather-related influences are minimized. Second, the selected pools are in urban areas, which offer good accessibility, so visitors can decide to visit the pools on the day of visitation with consideration for contemporary weather conditions, unlike popular beaches, which visitors plan to visit in advance, leaving little room for alterations to their plans if the weather conditions are unsatisfactory. Third, this study is based on actual data analysis, the number of visitors according to weather conditions, rather than an opinion survey. As the quality of data is the most important component in a data-based study, this study tries to control for non-weather factors that are able to influence the number of visitors, such as differences between peak and off-seasons, differences between the swimming pools selected as study sites, and differences by year, through data treatment.
This article includes three parts: methods, results, and discussion and conclusion. In the methods section, the study sites, the data, and ways to calculate preferable weather conditions and predict future changes in the preferred season for outdoor water activities will be described. In the results section, the calculated preferred weather conditions and the projected future changes of the season for outdoor water activities will be described. In the discussion and conclusion section, the implications and limitations of this study and suggestions for future studies will be described.
2. Methods
2.1. Study Sites
To minimize the non-weather-related variables which may impact visitor demand in a particular setting, this study selected public outdoor swimming pools as study sites, which offer limited attractions and services. In addition, to ensure that visitors could decide to visit the sites the morning of their visitation, this study chose to focus on pools in megacities, which are easily accessible.
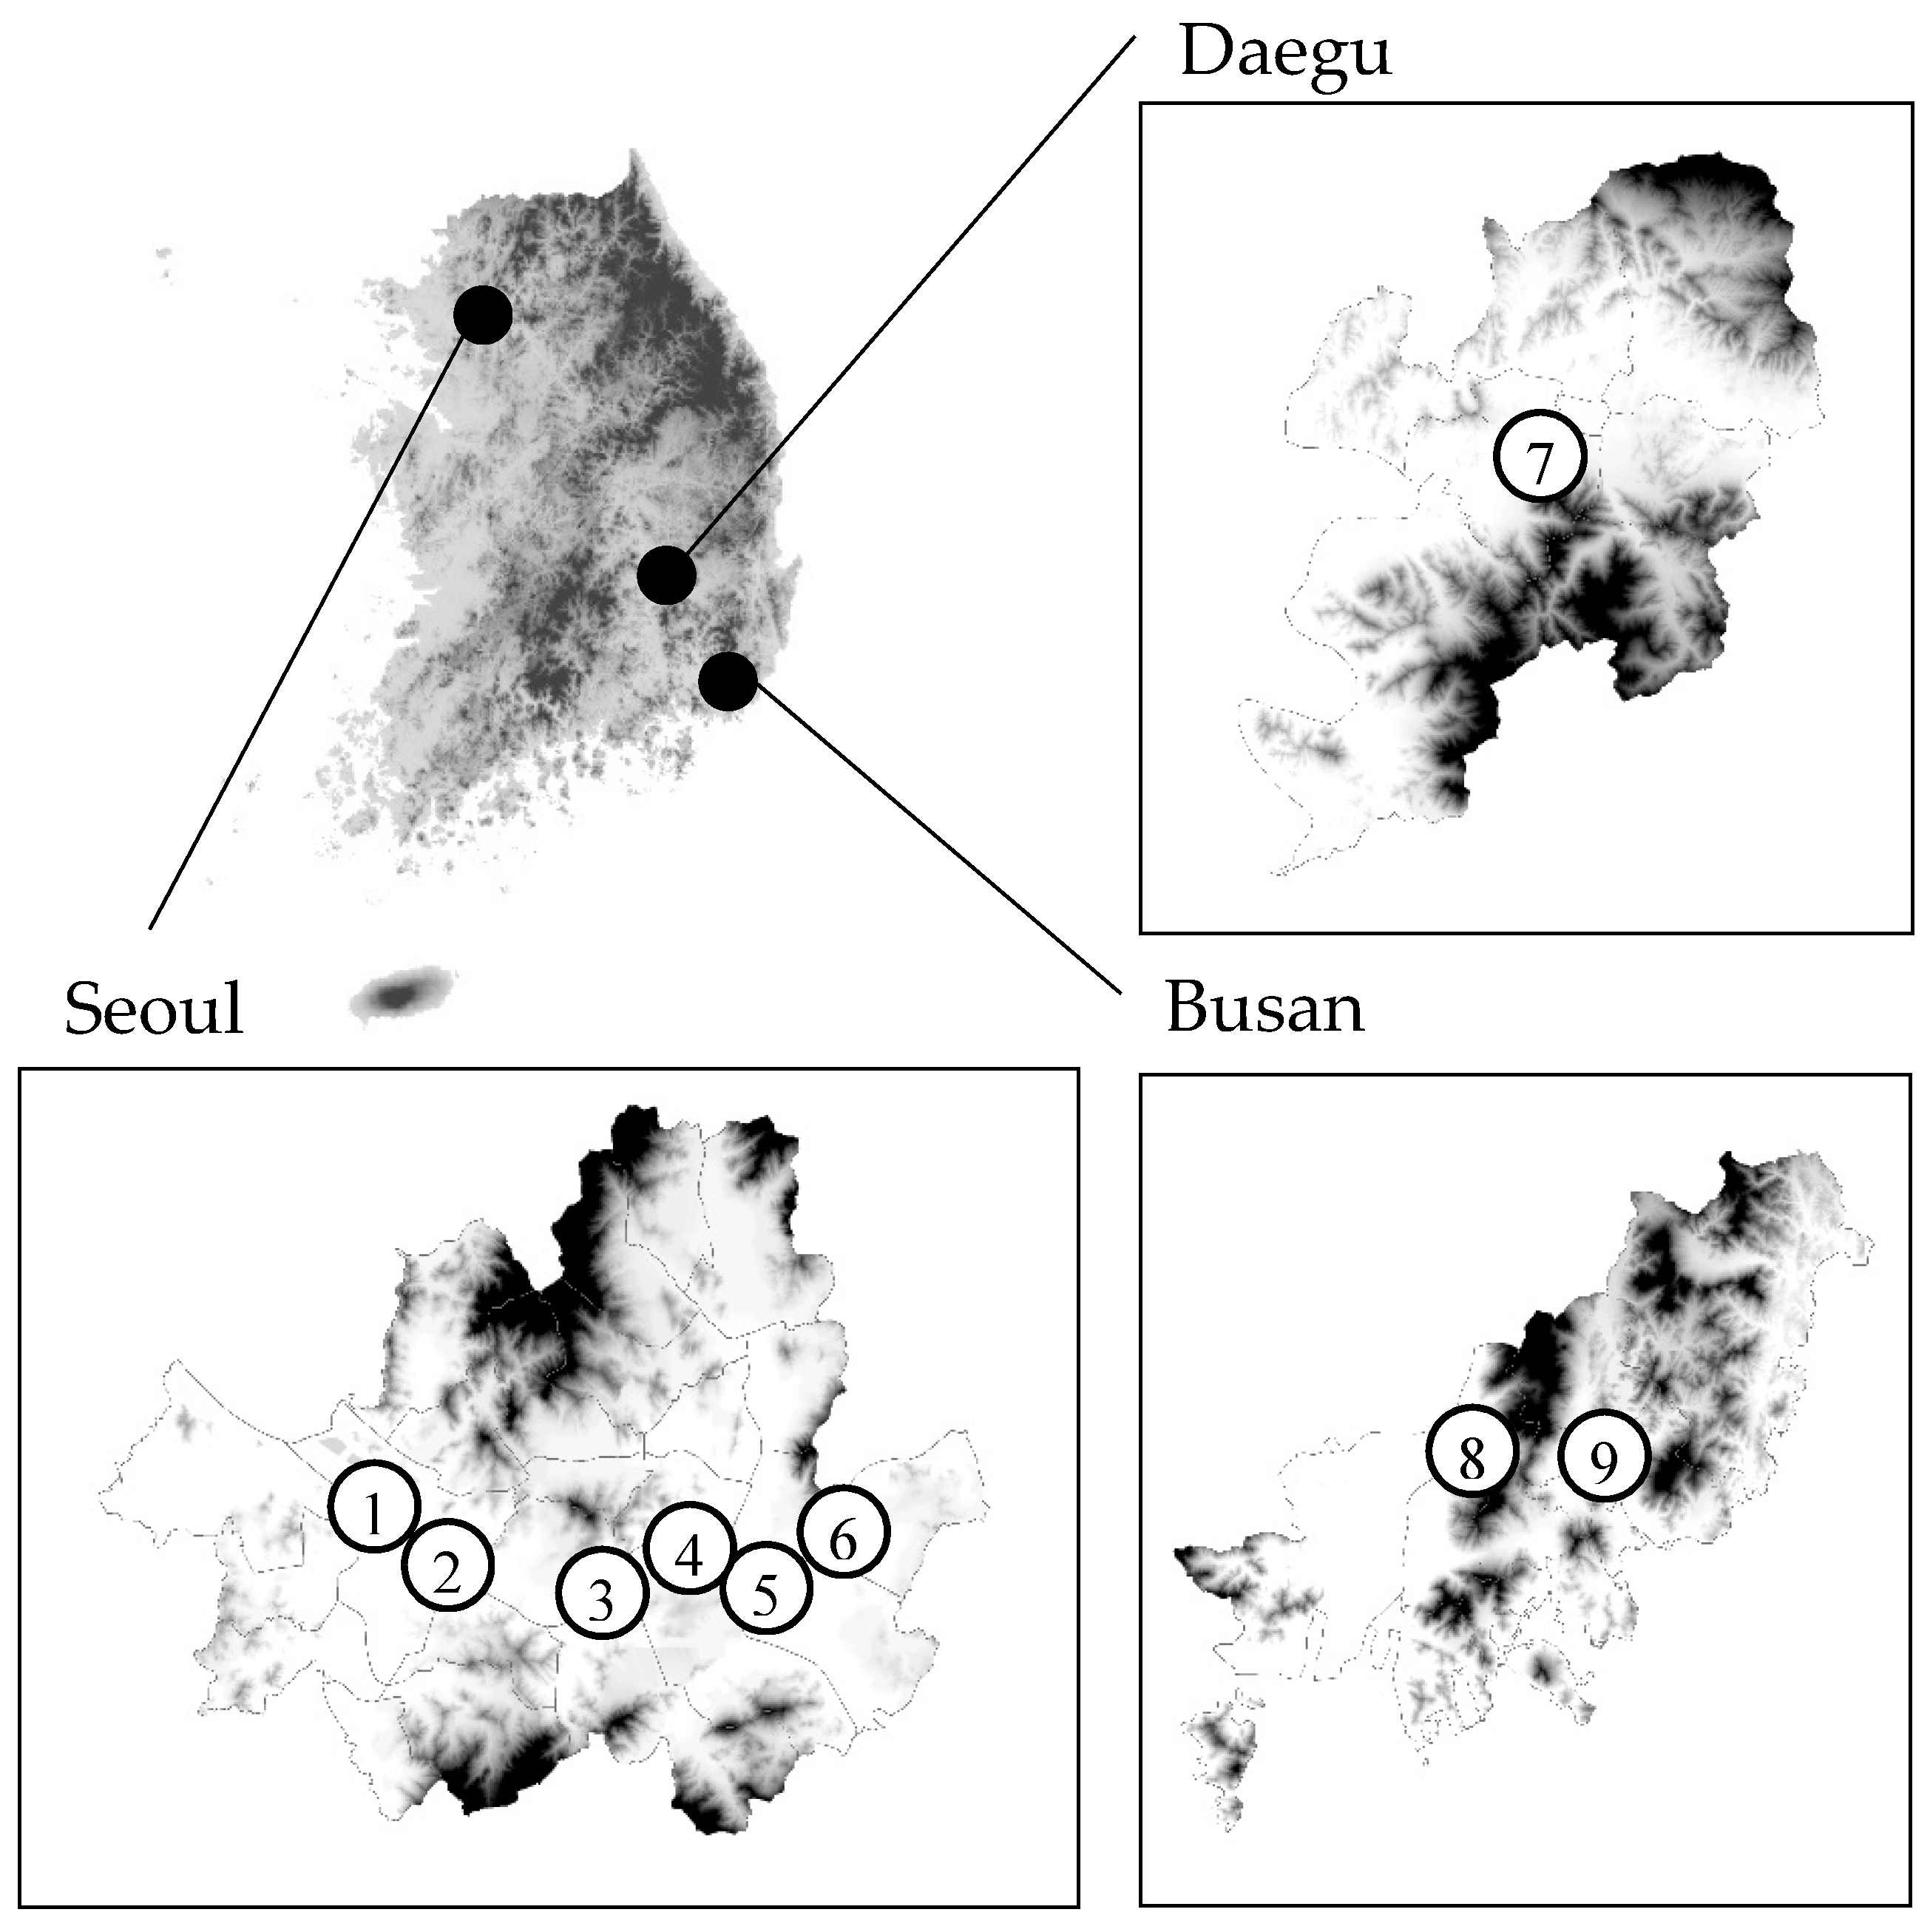
Thus, Seoul, Daegu, and Busan were selected from the seven megacities in South Korea, all of which have a population greater than 1 million, with consideration for geographical characteristics. Seoul is the capital of South Korea, and is located in the northwestern portion of the country, Daegu is basin-like, and so one of the hottest cities in South Korea, and Busan is a coastal city that is located at the far southeastern portion of South Korea.
According to the climatic data of the Korea Meteorological Administrator, the average daily temperatures in summer (July and August) during 2005 to 2014 were 25.57 °C in Seoul, 26.76 °C in Daegu, and 25.40 °C in Busan, and the averages for daily maximum temperatures were 29.18 °C in Seoul, 31.30 °C in Daegu, and 28.53 °C in Busan. The average of the daily average discomfort index (the impact of heat stress on the individual through the status of temperature and humidity) was 75.11 in Seoul, 76.47 in Daegu, and 75.29 in Busan, and the average daily maximum discomfort index was 80.62 in Seoul, 83.26 in Daegu, and 80.22 in Busan. The average of the daily precipitation during the summer was recorded as 20.70 mm in Seoul, 14.50 mm in Daegu, and 18.78 mm in Busan. The number of tropical nights for each city was 8.8 days in Seoul, 16.7 days in Daegu, and 14.2 days in Busan. (Table 1).
From these cities, all public outdoor swimming pools that collected data on the daily number of visitors were selected as study sites. Thus, six of six outdoor public pools (e.g., Yeouido, Thukseom, Mangwon, Gwangnaru, Ttukseom, and Jamsil) in Seoul, one of one outdoor public pool (e.g., Dooryu) in Daegu, and two (e.g., Hwamyung and Onchenoncheno) of three outdoor public pools in Busan were selected. The reason why there are more swimming pools included in the study from Seoul is that Seoul is the largest city in South Korea, as well as the nation’s capital, so it has a higher concentration of swimming pools than the other cities. All of the included outdoor swimming pools are located at the center of their respective cities, and so offer good accessibility (Figure 1).
The size of the outdoor swimming pools in Seoul ranges from 20,000 m2 to 28,000 m2 and their capacity averages 3000 to 3600 persons, with the exception of the Gwangnaru swimming pool (size: 9630 m2, capacity: 1200 persons). The size of the outdoor swimming pool in Daegu is 3625 m2 and its capacity is 5500 persons. The two pools in Busan are 9966 m2 and 210 m2, and their capacities are 5000 persons and 200 persons, respectively. Ticket prices for the swimming pools are 5000 KRW, except for the two pools in Busan, which charge 4000 KRW and no entry fee, respectively. As these pools are public, the ticket prices are typically cheaper than the ticket prices of private outdoor water parks, which are normally over 70,000 KRW. From 2009 to 2013, the average number of visitors per day to the six pools in Seoul was between 500 to 2500 persons. During the period from 2008 to 2014, the average number of visitors per day to the pool in Daegu was around 900 persons. From 2012 to 2014, the average number of visitors per day for the two pools in Busan was around 450 to 1500 persons (Table 2).
2.2. Data and Analysis
The data on the number of daily visitors were gathered from management organizations for each swimming pool. The gathered data covered 1384 days for the six pools in Seoul from 2009 to 2013, 300 days for the one pool in Daegu from 2008 to 2014, and 217 days for the two pools in Busan from 2012 to 2014. To better control the deviation in visitation between weekdays and weekends or national holidays, the data from the latter two were excluded. In addition, because the majority of Koreans’ summer vacation is concentrated around the first of August (52%) and distributed between the beginning of July and the end of August [20], in order to control the deviation between the peak and off-seasons, the data for the first week of August and all of June and September were excluded. Thus, data was used accounting for: 792 days for Seoul, 157 days for Daegu, and 96 days for Busan (Table 3). Because the data were gathered from different years and different swimming pools, the number of visitors was converted to a Z-score, representing standardized values for each pool each year. The calculation formula for the Z-score is below.
Meanwhile, in terms of weather data, in previous studies, precipitation and wind speed (physical factors), temperature and humidity (physiological factors), and cloudiness and duration of sunshine (psychological factors) were used [1,14,15,21,22]. However, wind speed, cloudiness and sunshine duration influence satisfaction at the on-site stage, rather than when making the decision to visit in the planning stage [23]. Thus, these three factors were excluded from the variables. In addition, humidity was replaced with discomfort index, because what humans practically feel is a complex discomfort status that is mixed with temperature and humidity, rather than separated humidity. Thus, the data for temperature and precipitation were gathered from regional meteorological stations, which are located near each outdoor swimming pool. In terms of data for temperature, the daily maximum temperature is used, because outdoor water activities occur during the daytime, when the temperature is high. The discomfort index is calculated using the gathered data of temperature and humidity. The formula that was developed by Thom in 1959 [24] and used by the Korean Metrological Administration was applied to the calculation.
The projected climate data for the changes in the preferred season for outdoor water activities were extracted from the RCP (Representative Concentration Pathway) scenarios that were developed by the Intergovernmental Panel on Climate Change (IPCC) in 2013 [6]. There are four scenarios presented by the RCPs: 2.6, 4.5, 6.0, and 8.5. The 2.6 scenario is the most positive scenario and assumes that climate change will be halted by mitigation efforts, the 4.5 scenario assumes the maintenance of the current climate change trend with the realization of mitigation efforts, the 6.0 scenario assumes the trend will continue despite mitigation efforts, and the 8.5 scenario is the most negative, which assumes climate change will intensify without any effort made to curtail its progress. The scenarios, which are based on the HadGEM2-AO climate change projection model, were provided by the Korean Metrological Administration and Climate Change Information Center. The data resolution was set to a 1 km × 1 km scale.
According to the RCP scenarios, it was estimated that the average of the daily maximum temperature during the summer will increase in Seoul, Daegu, and Busan. In the case of Seoul, the average daily maximum temperature is expected to increase from 29.18 °C at present to 31.43 °C in the 2090s in RCP 2.6, to 32.56 °C in RCP 4.5, to 33.26 °C in RCP 6.0, and to 34.89 °C in RCP 8.5. In the case of Daegu, the average daily maximum temperature is expected to increase from 31.30 °C at present to 31.90 °C in the 2090s in RCP 2.6, to 32.52 °C in RCP 4.5, to 33.42 °C in RCP 6.0, and to 35.13 °C in RCP 8.5. In the case of Busan, the average daily maximum temperature is expected to increase from 28.53 °C at present to 31.05 °C in the 2090s in RCP 2.6, to 31.20 °C in RCP 4.5, to 31.94 °C in RCP 6.0, and to 33.16 °C in RCP 8.5. When it comes to precipitation, it was determined that the average daily precipitation will change slightly in Seoul, Daegu, and Busan. In the case of Seoul, the average daily precipitation is expected to decrease from 20.70 mm at present to 11.63 mm in the 2090s in RCP 2.6, to 13.59 mm in RCP 4.5, to 12.57 mm in RCP 6.0, and to 14.30 mm in RCP 8.5. In the case of Daegu, the average daily precipitation is expected to decrease from 14.50 mm at present to 13.39 mm in the 2090s in RCP 2.6, to 13.55 mm in RCP 4.5, and to increase to 14.94 mm in RCP 6.0, and to 15.97 mm in RCP 8.5. In the case of Busan, the average daily precipitation is expected to decrease from 18.78 mm at present to 11.50 mm in the 2090s in RCP 2.6, 14.87 mm in RCP 4.5, 18.56 mm in RCP 6.0, and to increase to 20.50 mm in RCP 8.5 (Table 4).
The analysis of this study was conducted in two stages. The first step of the analysis involved determining the preferred weather conditions for outdoor water activities. To accomplish this, the correlation between the Z-score of number of visitors and weather conditions, including temperature, discomfort index, and precipitation, was verified through correlation analyses. In terms of the analysis of the correlation between number of visitors and precipitation, only the data for rainy days were included, and the Z-score of number of visitors was calculated separately, using only the data for rainy days. Through the correlation analysis, the weather elements that have strong relationships with the Z-score of number of visitors were defined and selected as variables for the next steps of the analyses. Then, preference functions to quantify the relationships between the Z-score of number of visitors and selected weather elements were developed [25]. Because each weather element has a different relationship with the number of visitors [5,10,26], and because the purpose of building preference functions was to find specific thresholds for each weather element for outdoor water activities, the preference functions were built based on a one-to-one relationship between each of them and the Z-score of number of visitors, rather than considering multiple relationships that include all weather elements simultaneously. For the construction of the preference functions, the scatterplots of the Z-score of number of visitors for each selected weather element were drawn and the best-fitting lines of the scatterplots were found using the ordinary least squares (OLS) method. To find the most reasonable best-fitting line for each scatterplot, linear, quadratic, cubic, and log models were tested considering the shape of the best-fitting lines. For example, because previous studies explained that preference increases according to the increase of temperature and then decreases when the temperature goes over a specific threshold [5,10], linear, quadratic, and cubic models were tested for temperature. In addition, because preference largely decreases with an occurrence of precipitation [26], linear and log models were tested for precipitation. The models that best explained the relationship of Z-score and number of visitors and each selected weather element were chosen for developing the preference functions. Lastly, the thresholds of preferred weather conditions for outdoor water activities were found from the inflection points or stabilized points of the developed preference functions.
For the second step of the analysis, by applying the future climate data for the 2030s (2031 to 2040), 2060s (2061 to 2070), and 2090s (2091 to 2100) to the determined preferred weather conditions for outdoor water activities, future changes in the preferred season for the outdoor water activities were predicted. The number of consecutive days from the date when weather conditions are between the minimum and maximum threshold for preferred weather conditions were calculated and classified as the whole season for outdoor water activities. Next, the number of individual days when weather conditions were below the minimum threshold or above the maximum threshold for outdoor water activities were calculated and classified as less desirable days for visitation. For example, days where the temperature was above the maximum temperature for outdoor water activities and days where precipitation was above the maximum precipitation for outdoor water activities were considered to be less desirable days due to hot or rainy weather. After that, the preferred days for outdoor water activities were calculated by deducting less desirable days due to hot or rainy weather from the whole season. Lastly, the periods for the whole season (e.g., from the beginning of June to the end of September), the less desirable days due to hot weather (e.g., the first of August), and the preferred days (e.g., from the beginning of June to the end of July and from the middle of August to the end of September) were determined. In terms of periods for less desirable days, only the less desirable days due to hot weather were considered; no considerations were made for less desirable days due to precipitation. This is because the amount of precipitation was randomly distributed throughout July and August, rather than concentrated on a specific period, making it unfeasible to determine the specific periods for less desirable days due to precipitation.
3. Results
3.1. Preferred Weather Conditions for Outdoor Water Activities
As a result of the correlation analysis, it was determined that the Z-score of number of visitors has around or above a 0.3 correlation with temperature (Seoul: 0.512, Daegu: 0.397, and Busan: 0.448), discomfort index (Seoul: 0.466, Daegu: 0.384, and Busan: 0.345), and precipitation (Seoul: −0.338, Daegu: −0.429, and Busan: −0.271) at the 0.001 significance level (Table 5). In terms of behavioral science, the minimum correlation level representing a practically significant effect is considered to be anything greater than 0.1 to 0.2, and a moderate or large effect can be considered present when the correlation level is over 0.5 [27,28]. Thus, it is reasonable to state that the Z-score of number of visitors has a significant relationship with temperature, discomfort index, and precipitation. As the correlations between Z-score of number of visitors and temperature, discomfort index, and precipitation were confirmed, it was reasonable to use these variables in the next steps of the analysis. However, because there were strong correlations between temperature and discomfort index (Seoul: 0.940, Daegu: 0.942, and Busan: 0.506), the discomfort index, which has relatively lower correlations with the Z-score of number of visitors compared to temperature, was excluded, and only temperature and precipitation were used for the next stages of the analysis.
As a result of finding the best-fitting lines of the scatterplots of the Z-score of the number of visitors and temperature, it was determined that the R2 of the linear, quadratic, and cubic models was over 0.15. When it comes to precipitation, the R2 of the linear and log models was over 0.10. In behavioral and social sciences, the minimum level of R2 that represents a significant effect is considered to be anything greater than 0.02 to 0.04, and a moderate or large effect is noted when R2 is over 0.35 [27,28]. Thus, it is reasonable to explain the relationship between Z-score of number of visitors and temperature using linear, quadratic, and cubic models, and the relationship of Z-score of number of visitors and precipitation can be explained by using linear and log models. In terms of the relationship with temperature, a cubic model showed the highest R2 (Seoul: 0.27, Daegu: 0.19, Busan: 0.27); previous studies have explained that the preferred temperature for outdoor water activities increases and then decreases when it goes above a specific threshold [5,10], which coincides with the shape of cubic models, so the cubic model was selected to build the preference function of temperature. When it comes to temperature, as the log model showed the higher R2 (Seoul: 0.11, Daegu: 0.14, Busan: 0.16), and a previous study has explained that the occurrence of precipitation significantly decreases the number of visitors for recreation purposes [26], which coincides with the shape of a log model, a log model was selected to build the preference function of precipitation (Table 6).
The preference functions of temperature for outdoor water activities structured using the cubic model are below. The inflection points of each function were 24.84 °C and 34.90 °C in Seoul, 25.53 °C and 35. 58 °C in Daegu, and 26.25 °C and 34.42 °C in Busan.
Seoul:
Daegu:
Busan:
To confirm these preference functions and inflection points, preference functions using the data of the average Z-score of number of visitors for each degree of temperature, instead of the individual Z-score of number of visitors, were developed. The additional preference functions for each city are below.
Seoul:
Daegu:
Busan:
The R2 of functions were improved to 0.79 for Seoul, 0.36 for Daegu, and 0.43 for Busan. The inflection points of each function were found as 24.61 °C and 34.97 °C in Seoul, 25.54 °C and 35.50 °C in Daegu, and 27.44 °C and 34.43 °C in Busan, which are similar to the inflection points from the preference functions using the individual data of the Z-score of number of visitors (Table 7). Thus, it is possible to state that the preference functions and inflection points of the cubic model can reasonably be used to determine the preferred temperature for outdoor water activities.
Through these processes, this study set the thresholds for preferred temperature for outdoor water activities as 24.6 to 35.0 °C in Seoul, 25.5 to 35.5 °C in Daegu, and 27.4 to 34.4 °C in Busan.
The preference functions of precipitation for outdoor water activities structured using the log model are below. The stabilized point of each function, when the slope of the best-fitting line goes below −0.01, was 23.5 mm in Seoul, 31.5 mm in Daegu, and 16.5 mm in Busan.
Seoul:
Daegu:
Busan:
To confirm these preference functions and the stabilized points, preference functions using the data of the average Z-score of number of visitors for each degree of precipitation, instead of the individual Z-score of number of visitors, were developed. The additional preference functions for each city are below.
Seoul:
Daegu:
Busan:
The R2 of functions were improved to 0.42 for Seoul, 0.36 for Daegu, and 0.29 for Busan. The stabilized points of the preference functions, when the slope of the best-fitting line goes below −0.01, were 36.5 mm in Seoul, 31.5 mm in Daegu, and 26.5 mm in Busan, which are not very different from the stabilized points from the preference functions using the individual data of the Z-score of number of visitors (Table 8). Thus, it is possible to state that the preference functions and stabilized points of the log model can reasonably determine the threshold of precipitation for outdoor water activities.
Through these processes, this study set the thresholds where precipitation makes outdoor water activities less preferable as 36.5 mm in Seoul, 31.5 mm in Daegu, and 26.5 mm in Busan.
3.2. Projected Changes in the Season for Outdoor Water Activities
As a result of applying the future temperatures from the RCP scenarios to the preferred weather conditions, it was predicted, according to RCP 2.6, that the whole season for outdoor water activities will increase from the present to the 2090s, with the season increasing in each city as follows: 125 days to 139 days in Seoul, 144 days to 147 days in Daegu, and 95 days to 104 days in Busan. The number of less desirable days due to extremely hot weather is expected to increase from 1 day to 7 days in Seoul, 8 days to 10 days in Daegu, and 1 day to 7 days in Busan, and the number of less desirable days due to rain is expected to change from 10 days to 6 days in Seoul, 7 days to 8 days in Daegu, and 10 days to 5 days in Busan. Thus, the number of preferred days for outdoor water activities is expected to increase from 114 days to 126 days in Seoul, stay at 129 days in Daegu, and increase from 84 days to 92 days in Busan. According to RCP 4.5, it was determined that the whole season for water activities will increase to 161 days in Seoul, 164 days in Daegu, and 114 days in Busan. The number of less desirable days due to hot weather is expected to increase to 18 days in Seoul, 15 days in Daegu, and 8 days in Busan, and the number of less desirable days due to rain is expected to decrease to 5 days in Seoul, 5 days in Daegu, and 8 days in Busan. Thus, the number of preferable days for outdoor water activities is expected to increase to 138 days in Seoul, 144 days in Daegu, and 98 days in Busan. According to RCP 6.0, it was determined that the whole season for water activities will increase to 162 days in Seoul, 170 days in Daegu, and 124 days in Busan. The number of less desirable days due to hot weather is expected to increase to 24 days in Seoul, 22 days in Daegu, and 15 days in Busan, and the number of less desirable days due to rain is expected to decrease to 4 days in Seoul, 8 days in Daegu, and 7 days in Busan. Thus, the number of preferred days for outdoor water activities is expected to increase to 134 days in Seoul, 140 days in Daegu, and 102 days in Busan. According to RCP 8.0, it was determined that the whole season for water activities will increase to 173 days in Seoul, 187 days in Daegu, and 147 days in Busan. The number of less desirable days due to hot weather in this scenario is expected to increase to 46 days in Seoul, 41 days in Daegu, and 30 days in Busan, and the number of less desirable days due to rain is expected to change to 7 days in Seoul, 10 days in Daegu, and 10 days in Busan. Thus, the number of preferred days for outdoor water activities is expected to increase to 120 days in Seoul, 136 days in Daegu, and 107 days in Busan (Table 9).
When it comes to preferred periods for outdoor water activities, according to RCP 2.6, it was determined that the preferred period will expand from the end of May to the end of September at present to the middle of May to the end of September in the 2090s in Seoul; from the beginning of May to the end of September at present to the beginning of May to the end of September in the 2090s in Daegu; and from the middle of June to the middle of September at present to the middle of June to the middle of September in 2090 in Busan. In addition, it was also determined that the end of July to the first of August in Seoul, Daegu, and Busan would be less favorable for outdoor water activities from the 2030s on. According to RCP 4.5, it was determined that the preferred period will expand to: the first of May to the beginning of October in Seoul; the first of May to the middle of October in Daegu; and the first of June to the end of September in Busan in the 2090s. In addition, it was also predicted that the end of July and the first of August will be less favorable from the 2030s on according to this scenario. According to RCP 6.0, it was determined that the preferred period will expand to: the first of May to the beginning of October in Seoul; the first of May to the middle of October in Daegu; and the first of June to the end of September in Busan in the 2090s. In addition, it was also predicted that the end of July to the first of August would be less favorable in Seoul, Daegu, and Busan from the 2030s on in this scenario. According to RCP 8.5, it was determined that the preferred period will expand to: the first of May to the middle of October in Seoul; the end of April to the end of October in Daegu; and the first of May to the middle of October in Busan in the 2090s. In addition, it was also estimated that the middle of July to the middle of August in Seoul and Busan would be less favorable in the 2090s (Table 10).
This means that May, June, September, and October will be more preferable for outdoor water activities in the future, and the generally preferred season at present, from the middle of July to the middle of August, will be less favorable.
4. Discussion and Conclusions
The aim of this study is to predict future changes in the season for outdoor water activities due to climate change. To accurately predict the changes, this study determined the preferred weather conditions for outdoor water activities by constructing preference functions using the best-fitting line of scatterplots of the Z-score of number of visitors and temperature and precipitation. Then, this study applied future weather data from four RCP scenarios (e.g., 2.6, 4.5, 6.0, and 8.5) to the preferred weather conditions to project changes in future season for outdoor water activities.
The preferred temperature for outdoor water activities from this study was found to be 24.6 to 35.0 °C in Seoul, 25.5 to 35.5 °C in Daegu, and 27.4 to 34.4 °C in Busan. These are slightly different from those of previous studies: Morgan et al. [15] suggested 32.5 to 35.5 °C based on beaches in Wales, Malta, and Turkey; and Ibarra [16] proposed 35 to 39 °C based on a coast in Spain. The reason for the relatively extensive range of this study could be explained by several factors. First, because previous studies were conducted based on world-class beaches, visitors participating in those studies had high expectations for a specific type of weather, and so visited the beaches meeting those specific weather conditions. Second, the visitors who visit the beaches in Europe or the Caribbean, and who are supposed to live relatively close to these areas, may be more tolerant of higher temperatures than South Koreans, as these areas are located at lower latitudes than South Korea. Third, there is another possibility that the ranges of temperatures at the beaches were originally narrower than at the outdoor pools in South Korea. Fourth, it is also possible that because the outdoor swimming pools of this study are located in megacities, which have good accessibility, there may be individuals who visit the pools for recreation or exercise regardless of weather conditions, and these demands expand the range of preferred temperature for each location. As there are many factors that can create regional differences in weather conditions and weather preferences, further research that focuses on a variety of locations at different latitudes is required to obtain more information on the preferred temperatures for outdoor water activities.
Additionally, there were also differences in preferred temperatures between Seoul, Daegu, and Busan in this study: Daegu showed the highest preferred temperature, followed by Seoul, and Busan had the lowest preferred temperature. Even though the differences were very slight, the variations can be explained as being a result of the different temperatures each city experiences in the summer, with Daegu seeing the highest temperatures, Seoul seeing the second highest temperatures, and Busan the lowest (Table 1). This means that the people in Daegu have a tolerance for higher temperatures greater than those in Seoul, and the people in Seoul tolerate higher temperatures than the people in Busan. Furthermore, the reason why Busan had a narrower temperature range is most likely due to it being a coastal city, which means that the demand for outdoor water activities largely shifts to beaches when the temperature reaches a specific point.
In addition, the thresholds for precipitation that are preferred for outdoor water activities from this study were found to be 36.5 mm in Seoul, 31.5 mm in Daegu, and 26.5 mm in Busan. As there has been a lack of studies that have found the thresholds related to precipitation for outdoor water activities, it is expected that these defined thresholds will be helpful for further studies or the recreation industry. Meanwhile, there were slight differences in the thresholds of precipitation between cities. The reason the threshold of Seoul is the highest among the three cities can be explained as being due to the fact that Seoul experiences the highest precipitation during the summer (Table 1). In addition, the reason the threshold of Busan is the lowest is because Busan is a coastal city, which has beaches or other sites for outdoor water activities, meaning the demand for outdoor water activities can easily shift to other leisure activities or locations when people are met with unfavorable weather conditions.
The predicted changes in the preferred period for outdoor water activities in this study shared a similar projected path with previous studies. Many previous studies, which were conducted in North America and the Mediterranean, predicted that the available seasons for leisure activities will expand and that the demand will shift from July and August to May to June and September to October [7,18]. This study predicted a similar shift in the preferred period from June to September to May, June, September, and October. This means that even though the preferred weather conditions for outdoor activities in South Korea are different from other countries, the industry for outdoor water activities in South Korea will also experience impacts from climate change similar to those of other countries. This implies that the industry for outdoor water activities in South Korea needs to prepare to address changes resulting from climate change in the future.
If we consider the structure of the recreation industry to be based on supply and demand, preparation of the demand side for these changes would not be difficult to accomplish, especially compared to the supply side [10,29]. In terms of leisure activities, when a person is no longer able to perform the leisure activities they intended to, the person replaces said activities with other leisure activities or with activities in other places [30]. In other words, people are willing to substitute their leisure activities or destinations when they can be satisfied by other activities and destinations. For example, a study that analyzed how visitors deal with extremely hot weather during outdoor water activities showed that they altered their plans to avoid unpleasant weather conditions and maintain their satisfaction [22,31].
However, climate change would be a major issue in terms of supply, as locations have already invested massive budgets into the development of attractions and/or destinations. The flexibility of the demand for recreation would cause more difficulties for destination operators, because they would experience damage to attractions due to climate change (e.g., lack of attractiveness of weather) and a loss of visitors due to the deterioration of their attractions. Thus, managerial and technical efforts that overcome these difficulties will be necessary for the operators to avoid these problems.
It may be possible to suggest some adaptation strategies based on the results of this study. As it is predicted that the preferred season for outdoor water activities will shift to May, June, September, and October, and July and August will be less desirable for outdoor water activities in the future due to extremely hot weather, efforts can be made to expand the season for outdoor water activities so that it includes July and August. To do this, locations must appeal to visitors even during hot weather conditions. For example, operators can implement diverse indoor facilities such as pools, rides, or rest areas, which allow visitors to avoid heat waves. In addition, operators can also prepare safety facilities to deal with heat-related accidents, such as heat strokes. If operators can successfully intrigue visitors even in July and August, operators can manage their businesses over a period of six months from May to October. Thus, recreational operators may need to promote destinations as attractive daily leisure areas rather than specialty areas for the summer season. Diverse facilities, such as shops and spas, and better services, such as healthcare programs, can aid in this. In addition, as it is also believed that higher temperatures cause more people to visit beaches or simply to leave urban areas altogether for their vacations, beach areas also need to prepare for an expanded operational season and the increased demand of tourists. Implementing additional accommodations and facilities for summer weather-based tourism, such as water sports and sunbaths, may be a potential area for increased investment going forward.
This study is meaningful in that it attempted to estimate the future changes to outdoor water activities due to climate change in the limited setting of study sites using the quantitative data of the number of visitors. However, as this study was almost the first of its kind, it has some limitations. First, because this study is not survey-based, it was not possible to obtain information on the visitors and consider personal characteristics, such as lifestyle, purpose for visitation, and so on. In addition, this study was not also able to determine if the visitors of outdoor swimming pools will continue to perform their leisure activities in the future because no visitor survey was conducted. Second, in terms of the data of the number of visitors, the number of sampled days in Daegu and Busan was smaller than the number of sampled days of Seoul due to the smaller number of outdoor swimming pools in Daegu and Busan, and this might contribute to the relatively lower R2 of these two cities. If it is possible to gather more sample days in Daegu and Busan, more reliable analyses and results will be possible. Third, there is an insurmountable limitation of this study: the uncertainty of the future. It is possible that the trend of climate change might not follow the RCP scenarios, people might adapt to changed climatic conditions better than expected, rather than become concerned with the changes, or the demand for recreation may take on an entirely new form in the future.
However, this uncertainty merely highlights the necessity for further studies on the future of the recreation industry going forward. Because nobody knows what the future holds, the efforts to prepare for the uncertainty of tomorrow are more necessary than ever to minimize the damage from potential changes. To build more practical strategies for the recreation industry to deal with climate change, follow-up studies that can overcome the limitations of this study are needed. This will not only contribute to the academic field of recreation, but also to the sustainability of the recreation industry as a whole in the era of climate change.
Acknowledgments
This research was supported by the Korea Agency for Infrastructure Technology Advancement (KAIA) grant funded by the Ministry of Land, Infrastructure, and Transport of the Korean government (17AUDP-B102406-03).
Author Contributions
All authors have contributed to the intellectual content of this paper. Songyi Kim analyzed the data and wrote the manuscript. Jin Han Park contributed to analytical design and data collection. Dong Kun Lee provided advice on the whole process of study.
Conflicts of Interest
The authors declare no conflict of interest.
References
- Gómez Martín, M.B. Weather, climate and tourism a geographical perspective. Ann. Tour. Res. 2005, 32, 571–591. [Google Scholar] [CrossRef]
- Gössling, S.; Scott, D.; Hall, C.M.; Ceron, J.P.; Dubois, G. Consumer behaviour and demand response of tourists to climate change. Ann. Tour. Res. 2012, 39, 36–58. [Google Scholar] [CrossRef]
- Kim, S.; Park, J.H.; Lee, D.K.; Son, Y.; Yoon, H.; Kim, S.; Yun, H.J.; Kim, S.; Park, J.H.; Lee, D.K.; et al. The impacts of weather on tourist satisfaction and revisit intention: A study of South Korean domestic tourism. Asia Pac. J. Tour. Res. 2017, 22, 895–908. [Google Scholar] [CrossRef]
- Schott, C. Tourism and the Implications of Climate Change: Issues and Actions; Emerald Group Publishing Limited: Bingley, UK, 2010. [Google Scholar]
- De Freitas, C.R. Tourism climatology: Evaluating environmental information for decision making and business planning in the recreation and tourism sector. Int. J. Biometeorol. 2003, 48, 45–54. [Google Scholar] [CrossRef] [PubMed]
- Intergovernmental Panel on Climate Change (IPCC). Cliamte Change 2013: The Physical Science Basis; Cambridge University Press: Cambridge, UK, 2013. [Google Scholar]
- Scott, D.; McBoyle, G.; Schwartzentruber, M. Climate change and the distribution of climatic resources for tourism in North America. Clim. Res. 2004, 27, 105–117. [Google Scholar] [CrossRef]
- Buzinde, C.N.; Manuel-Navarrete, D.; Yoo, E.E.; Morais, D. Tourits’ perceptions in a cliamte of change: Eroding destinations. Ann. Tour. Res. 2010, 37, 333–354. [Google Scholar] [CrossRef]
- Weaver, D. Can sustainable tourism survive climate change? J. Sustain. Tour. 2011, 19, 5–15. [Google Scholar] [CrossRef]
- Scott, D.; Hall, C.M.; Stefan, G. Tourism and Climate Change: Impacts, Adaptation and Mitigation; Routledge: Abingdon, UK, 2012. [Google Scholar]
- United Nations World Tourism Organization (UNWTO); United Nations Environment Programme (UNEP). Climate Change and Tourism: Responding to Global Challenges; United Nations World Tourism Organization (UNWTO): Madrid, Spain, 2008. [Google Scholar]
- De Freitas, C.R.; Scott, D.; McBoyle, G. A second generation climate index for tourism (CIT): Specification and verification. Int. J. Biometeorol. 2007, 52, 399–407. [Google Scholar] [CrossRef] [PubMed]
- Becker, S. Beach comfort index—A new approach to evaluate the thermal conditions of beach holiday resorts using a South African example. GeoJournal 1998, 44, 297–307. [Google Scholar] [CrossRef]
- Scott, D.; Gössling, S.; de Freitas, C.R. Preferred climates for tourism: Case studies from Canada, New Zealand and Sweden. Clim. Res. 2008, 38, 61–73. [Google Scholar] [CrossRef]
- Morgan, R.; Gatell, E.; Junyent, R.; Micallef, A.; Özhan, E.; Williams, A.T. An improved user-based beach climate index. J. Coast. Conserv. 2000, 6, 41–50. [Google Scholar] [CrossRef]
- Ibarra, E.M. The use of webcam images to determine tourist-climate aptitude: Favourable weather types for sun and beach tourism on the Alicante coast (Spain). Int. J. Biometeorol. 2011, 55, 373–385. [Google Scholar] [CrossRef] [PubMed]
- Moreno, A.; Amelung, B. Climate change and tourist comfort on Europe’s beaches in Summer: A Reassessment. Coast. Manag. 2009, 37, 550–568. [Google Scholar] [CrossRef]
- Amelung, B.; Viner, D. Mediterranean tourism: Exploring the future with the tourism climatic index. J. Sustain. Tour. 2006, 14, 349–366. [Google Scholar] [CrossRef]
- Alegre, J.; Garau, J. The factor structure of tourist satisfaction at sun and sand destinations. J. Travel Res. 2011, 50, 78–86. [Google Scholar] [CrossRef]
- Korea Employers Federation. 2016 Survey on Summer Vacation; Korea Employers Federation: Seoul, Korea, 2016. [Google Scholar]
- Moreno, A.; Amelung, B.; Santamarta, L. Linking beach recreation to weather conditions: A Case study in Zandvoort, Netherlands. Tour. Mar. Environ. 2008, 5, 111–119. [Google Scholar] [CrossRef]
- Rutty, M.; Scott, D. Thermal range of coastal tourism resort microclimates. Tour. Geogr. 2014, 16, 346–363. [Google Scholar] [CrossRef]
- Yu, G.; Walsh, J.E. A weather-resolving index for assessing the impact of climate change on tourism related climate resources. Clim. Chang. 2009, 95, 551–573. [Google Scholar] [CrossRef]
- Thom, E.C. The Discomfort Index. Weatherwise 1959, 12, 57–61. [Google Scholar] [CrossRef]
- Carolli, M.; Zolezzi, G.; Geneletti, D.; Siviglia, A.; Carolli, F.; Cainelli, O. Science of the Total Environment Modelling white-water rafting suitability in a hydropower regulated Alpine River. Sci. Total Environ. 2017, 579, 1035–1049. [Google Scholar] [CrossRef] [PubMed]
- Joo, H.H.; Kang, H.-G.; Moon, J.J. The effect of rain on the decision to visit a theme park. Asia Pac. J. Tour. Res. 2012, 19, 61–85. [Google Scholar] [CrossRef]
- Cohen, J. Statistical Power Analysis for the Behavioral Sciences, 2nd ed.; Lawrence Erlbaum: Mahwah, NJ, USA, 1998. [Google Scholar]
- Ferguson, C.J. An effect size primer: A guide for clinicians and researchers. Prof. Psychol. Res. Pract. 2009, 40, 532–538. [Google Scholar] [CrossRef]
- Njoroge, J.M. Climate change and tourism adaptation: Literature review. Tour. Hosp. Manag. 2015, 21, 95–108. [Google Scholar]
- Iso-ahola, S.E. A theory of substitutability of leisure behavior A Theory of Substitutability of Leisure Behavior. Leis. Sci. 1986, 8, 367–389. [Google Scholar] [CrossRef]
- Becken, S.; Wilson, J. The impacts of weather on tourist travel. Tour. Geogr. 2013, 15, 620–639. [Google Scholar] [CrossRef]
Figure 1.
Study sites for the analysis of the impact of climate change on outdoor water activities; Names of outdoor swimming pools: 1 = Mangwon, 2 = Yeouido, 3 = Jamwon, 4 = Ttukseom, 5 = Jamsil, 6 = Gwangnaru, 7 = Dooryu, 8 = Hwamyung, and 9 = Onchenonchen.
Figure 1.
Study sites for the analysis of the impact of climate change on outdoor water activities; Names of outdoor swimming pools: 1 = Mangwon, 2 = Yeouido, 3 = Jamwon, 4 = Ttukseom, 5 = Jamsil, 6 = Gwangnaru, 7 = Dooryu, 8 = Hwamyung, and 9 = Onchenonchen.


Table 1.
Climatic characteristics during summer for Seoul, Daegu, and Busan.
| Temperature-Mean (°C) a) | Temperature-Max (°C) a) | Discomfort Index-Mean b) | Discomfort Index-Max b) | Precipitation (mm) a) | Number of Tropical Nights a) | |
|---|---|---|---|---|---|---|
| Seoul | 25.57 | 29.18 | 75.11 | 80.62 | 20.70 | 8.8 |
| Daegu | 26.76 | 31.30 | 76.47 | 83.26 | 14.50 | 16.7 |
| Busan | 25.40 | 28.53 | 75.29 | 80.22 | 18.78 | 14.2 |
a) Korea Meteorological Administrator, b) The impact of heat stress on the individual according to the status of temperature and humidity. It is calculated using the data for temperature and humidity from the Korea Meteorological Administrator. The formula for calculation is explained in the Equation (2) below.
Table 2.
Information about the swimming pools.
| City | Outdoor Swimming Pools | Area a) (m2) | Capacity a) (Persons) | Ticket Price b) (KRW) | Number of Visitors b) (Persons) | ||
|---|---|---|---|---|---|---|---|
| Max | Mean | Min | |||||
| Seoul | Yeouido | 20,000 | 3600 | 5000 | 8795 | 1429 | 14 |
| Ttukseom | 21,000 | 3500 | 5000 | 10,534 | 2571 | 13 | |
| Mangwon | 23,493 | 3300 | 5000 | 7412 | 1215 | 11 | |
| Gwangnaru | 9630 | 1200 | 5000 | 2519 | 530 | 11 | |
| Jamsil | 27,945 | 3400 | 5000 | 2353 | 536 | 13 | |
| Jamwon | 23,325 | 3000 | 5000 | 1946 | 485 | 12 | |
| Daegu | Dooryu | 3625 c) | 5500 | 5000 | 2773 | 894 | 18 |
| Busan | Hwamyung | 9966 | 5000 | 4000 | 4980 | 1448 | 40 |
| Onchenonchen | 210 c) | 200 | 0 | 1300 | 451 | 50 | |
The reason the number of visitors exceeds the pools’ capacity is because “capacity” refers to the number of visitors a pool can hold at once, while “number of visitors” reflects the amount of visitors a pool received over the course of an entire day. 1000 KRW = 0.9 USD; a) Ministry of culture, sports, and tourism (2012), Current state of public sports facilities in South Korea. b) Management organization of each swimming pool (Seoul: 2009 to 2013, Daegu: 2008 to 2014, Busan: 2012 to 2014). c) The area of pool with water only.
Table 3.
Number of data.
| Climate Factors | Seoul a) | Daegu b) | Busan c) |
|---|---|---|---|
| Gathered data (a) | 1384 | 300 | 217 |
| Weekend and national holidays (b) | 376 | 87 | 58 |
| First week of August (c) | 104 | 24 | 21 |
| June and September (d) | 112 | 32 | 42 |
| Used data (a-b-c-d) | 792 | 157 | 96 |
a) Six pools from 2009 to 2013, b) One pool from 2008 to 2014, c) Two pools from 2012 to 2014.
Table 4.
Projected average of daily maximum temperature and precipitation during summer (July and August) for Seoul, Daegu, and Busan.
Table 4.
Projected average of daily maximum temperature and precipitation during summer (July and August) for Seoul, Daegu, and Busan.
| Seoul | Daegu | Busan | |||||||||||
|---|---|---|---|---|---|---|---|---|---|---|---|---|---|
| Temperature (°C) (Increased Points) | Precipitation (mm) (Increased Points) | Temperature (°C) (Increased Points) | Precipitation (mm) (Increased Points) | Temperature (°C) (Increased Points) | Precipitation (mm) (Increased Points) | ||||||||
| Present | 29.18 | 20.70 | 31.30 | 14.50 | 28.53 | 18.78 | |||||||
| RCP 2.6 | 2030s | 30.80 | (1.62) | 13.49 | (−7.21) | 31.09 | (−0.21) | 12.89 | (−1.61) | 30.22 | (1.69) | 12.37 | (−6.41) |
| 2060s | 30.81 | (1.63) | 11.57 | (−9.13) | 31.20 | (−0.10) | 12.26 | (−2.24) | 30.28 | (1.75) | 12.28 | (−6.50) | |
| 2090s | 31.43 | (2.25) | 11.63 | (−9.07) | 31.90 | (0.60) | 13.39 | (−1.11) | 31.05 | (2.52) | 11.50 | (−7.28) | |
| RCP 4.5 | 2030s | 31.51 | (2.33) | 12.22 | (−8.48) | 31.52 | (0.22) | 15.58 | (1.08) | 30.21 | (1.68) | 18.02 | (−0.76) |
| 2060s | 30.66 | (1.48) | 15.96 | (−4.74) | 31.31 | (0.01) | 16.70 | (2.20) | 30.32 | (1.79) | 19.50 | (0.72) | |
| 2090s | 32.56 | (3.38) | 13.59 | (−7.11) | 32.52 | (1.22) | 13.55 | (−0.95) | 31.20 | (2.67) | 14.87 | (−3.91) | |
| RCP 6.0 | 2030s | 30.18 | (1.00) | 14.71 | (−5.99) | 30.00 | (−1.30) | 15.40 | (0.90) | 28.80 | (0.27) | 16.09 | (−2.69) |
| 2060s | 31.00 | (1.82) | 14.83 | (−5.87) | 31.88 | (0.58) | 12.74 | (−1.76) | 30.45 | (1.92) | 14.50 | (−4.28) | |
| 2090s | 33.26 | (4.08) | 12.57 | (−8.13) | 33.42 | (2.12) | 14.94 | (0.44) | 31.94 | (3.41) | 18.56 | (−0.22) | |
| RCP 8.5 | 2030s | 30.62 | (1.44) | 13.52 | (−7.18) | 30.86 | (−0.44) | 13.29 | (−1.21) | 29.75 | (1.22) | 15.52 | (−3.26) |
| 2060s | 32.64 | (3.46) | 13.66 | (−7.04) | 32.97 | (1.67) | 14.89 | (0.39) | 31.62 | (3.09) | 14.63 | (−4.15) | |
| 2090s | 34.89 | (5.71) | 14.30 | (−6.40) | 35.13 | (3.83) | 15.97 | (1.47) | 33.16 | (4.63) | 20.50 | (1.72) | |
Table 5.
Results of correlation analysis for Z-score of number of visitors and weather elements.
| Seoul | |||
| Temperature | Discomfort Index | Precipitation | |
| Z-score of number of visitors | 0.512 *** | 0.466 *** | −0.338 *** |
| Temperature | - | 0.940 *** | −0.098 |
| Discomfort index | - | - | 0.056 |
| Daegu | |||
| Temperature | Discomfort index | Precipitation | |
| Z-score of number of visitors | 0.397 *** | 0.384 *** | −0.429 *** |
| Temperature | - | 0.942 *** | −0.275 |
| Discomfort index | - | - | −0.211 |
| Busan | |||
| Temperature | Discomfort index | Precipitation | |
| Z-score of number of visitors | 0.448 *** | 0.345 *** | −0.271 *** |
| Temperature | - | 0.506 *** | −0.300 |
| Discomfort index | - | - | 0.173 |
*** Correlation is significant at the 0.001 level (2-tailed).
Table 6.
R2 of the best-fitting lines for scatterplots of Z-score of number of visitors and weather elements.
Table 6.
R2 of the best-fitting lines for scatterplots of Z-score of number of visitors and weather elements.
| Climate Factors | Model | Seoul | Daegu | Busan |
|---|---|---|---|---|
| Temperature | Linear | 0.25 | 0.15 | 0.20 |
| Quadratic | 0.25 | 0.16 | 0.22 | |
| Cubic | 0.27 | 0.19 | 0.27 | |
| Precipitation | Linear | 0.11 | 0.10 | 0.15 |
| Log | 0.11 | 0.14 | 0.16 |
Table 7.
Best-fitting lines and scatterplots for the Z-score of number of visitors and temperature.
| Data | Seoul | Daegu | Busan |
|---|---|---|---|
| Individual data a) |  |  |  |
| (Preference function) | (R2 = 0.27) | (R2 = 0.19) | (R2 = 0.27) |
| (Inflection Points (°C)) | Low = 24.84, High 34.90 | Low = 25.53, High 35.58 | Low = 26.25, High 34.42 |
| Average Z-score of number of visitors for each degree of temperature b) |  |  |  |
| (Preference function) | (R2 = 0.79) | (R2 = 0.36) | (R2 = 0.43) |
| (Inflection Points (°C)) | Low = 24.61, High 34.97 | Low = 25.54, High 35.50 | Low = 27.44, High 34.43 |
a) Seoul: n = 792, Deagu: n = 157, Busan: n = 96, b) Seoul: n = 121, Deagu: n = 84, Busan: n = 51; y-axis: Z-score of number of visitors, x-axis: temperature.
Table 8.
Best-fitting lines and scatterplots for the Z-score of number of visitors and precipitation.
Table 8.
Best-fitting lines and scatterplots for the Z-score of number of visitors and precipitation.
| Data | Seoul | Daegu | Busan |
|---|---|---|---|
| Individual data a) |  |  |  |
| (Preference function) | (R2 = 0.11) | (R2 = 0.14) | (R2 = 0.16) |
| (Stabilized Point c)) | 23.5 mm | 31.5 mm | 16.5 mm |
| Average Z-score of number of visitors for each degree of precipitation b) |  |  |  |
| (Preference function) | (R2 = 0.42) | (R2 = 0.36) | (R2 = 0.29) |
| (Stabilized Point c)) | 36.5 mm | 31.5 mm | 26.5 mm |
a) Seoul: n = 390, Deagu: n = 78, Busan: n = 20, b) Seoul: n = 121, Deagu: n = 40, Busan: n = 14, c) The points when the slope of the best-fitting line goes below −0.01; y-axis: Z-score of number of visitors, x-axis: precipitation.
Table 9.
Projected changes in season for outdoor water activities (number of days (percentage of changes)).
Table 9.
Projected changes in season for outdoor water activities (number of days (percentage of changes)).
| Seoul | Daegu | Busan | |||||||||||
|---|---|---|---|---|---|---|---|---|---|---|---|---|---|
| Whole Season (a) | Less Desirable Days | Preferred Days (a-b-c) | Whole Season (a) | Less Desirable Days | Preferred Days (a-b-c) | Whole Season (a) | Less Desirable Days | Preferred Days (a-b-c) | |||||
| Hot (b) | Rainy (c) | Hot (b) | Rainy (c) | Hot (b) | Rainy (c) | ||||||||
| Present | 125 | 1 | 10 | 114 | 144 | 8 | 7 | 129 | 95 | 1 | 10 | 84 | |
| RCP 2.6 | 2030s | 136 | 4 | 7 | 125 | 144 | 7 | 9 | 128 | 95 | 5 | 5 | 85 |
| (8.80) | (300) | (−30) | (10) | (0) | (−13) | (29) | (−1) | (0.00) | (400) | (−50) | (1) | ||
| 2060s | 138 | 4 | 6 | 128 | 144 | 6 | 6 | 132 | 102 | 5 | 5 | 92 | |
| (10.40) | (300) | (−40) | (12) | (0) | (−25) | (−14) | (2) | (7.37) | (400) | (−50) | (10) | ||
| 2090s | 139 | 7 | 6 | 126 | 147 | 10 | 8 | 129 | 104 | 7 | 5 | 92 | |
| (11.20) | (600) | (−40) | (11) | (2) | (25) | (14) | (0) | (9.47) | (600) | (−50) | (10) | ||
| RCP 4.5 | 2030s | 140 | 12 | 5 | 123 | 149 | 13 | 7 | 129 | 105 | 8 | 8 | 89 |
| (12.00) | (1100) | (−50) | (8) | (3) | (63) | (0) | (0) | (10.53) | (700) | (−20) | (6) | ||
| 2060s | 154 | 4 | 8 | 142 | 160 | 11 | 9 | 140 | 110 | 8 | 11 | 91 | |
| (23.20) | (300) | (−20) | (25) | (11) | (38) | (29) | (9) | (15.79) | (700) | (10) | (8) | ||
| 2090s | 161 | 18 | 5 | 138 | 164 | 15 | 5 | 144 | 114 | 8 | 8 | 98 | |
| (28.80) | (1700) | (−50) | (21) | (14) | (88) | (−29) | (12) | (20.00) | (700) | (−20) | (17) | ||
| RCP 6.0 | 2030s | 135 | 4 | 6 | 125 | 139 | 2 | 8 | 129 | 105 | 1 | 7 | 97 |
| (8.00) | (300) | (−40) | (10) | (−3) | (−75) | (14) | (0) | (10.53) | (0) | (−30) | (15) | ||
| 2060s | 146 | 10 | 6 | 130 | 160 | 13 | 5 | 142 | 115 | 8 | 5 | 102 | |
| (16.80) | (900) | (−40) | (14) | (11) | (63) | (−29) | (10) | (21.05) | (700) | (−50) | (21) | ||
| 2090s | 162 | 24 | 4 | 134 | 170 | 22 | 8 | 140 | 124 | 15 | 7 | 102 | |
| (29.60) | (2300) | (−60) | (18) | (18) | (175) | (14) | (9) | (30.53) | (1400) | (−30) | (21) | ||
| RCP 8.5 | 2030s | 139 | 5 | 5 | 129 | 156 | 8 | 8 | 140 | 114 | 5 | 8 | 101 |
| (11.20) | (400) | (−50) | (13) | (8) | (0) | (14) | (9) | (20.00) | (400) | (−20) | (20) | ||
| 2060s | 148 | 20 | 6 | 122 | 168 | 20 | 7 | 141 | 128 | 14 | 6 | 108 | |
| (18.40) | (1900) | (−40) | (7) | (17) | (150) | (0) | (9) | (34.74) | (1300) | (−40) | (29) | ||
| 2090s | 173 | 46 | 7 | 120 | 187 | 41 | 10 | 136 | 147 | 30 | 10 | 107 | |
| (38.40) | (4500) | (−30) | (5) | (30) | (413) | (43) | (5) | (54.74) | (2900) | (0) | (27) | ||
Table 10.
Projected changes in the preferred periods for outdoor water activities.
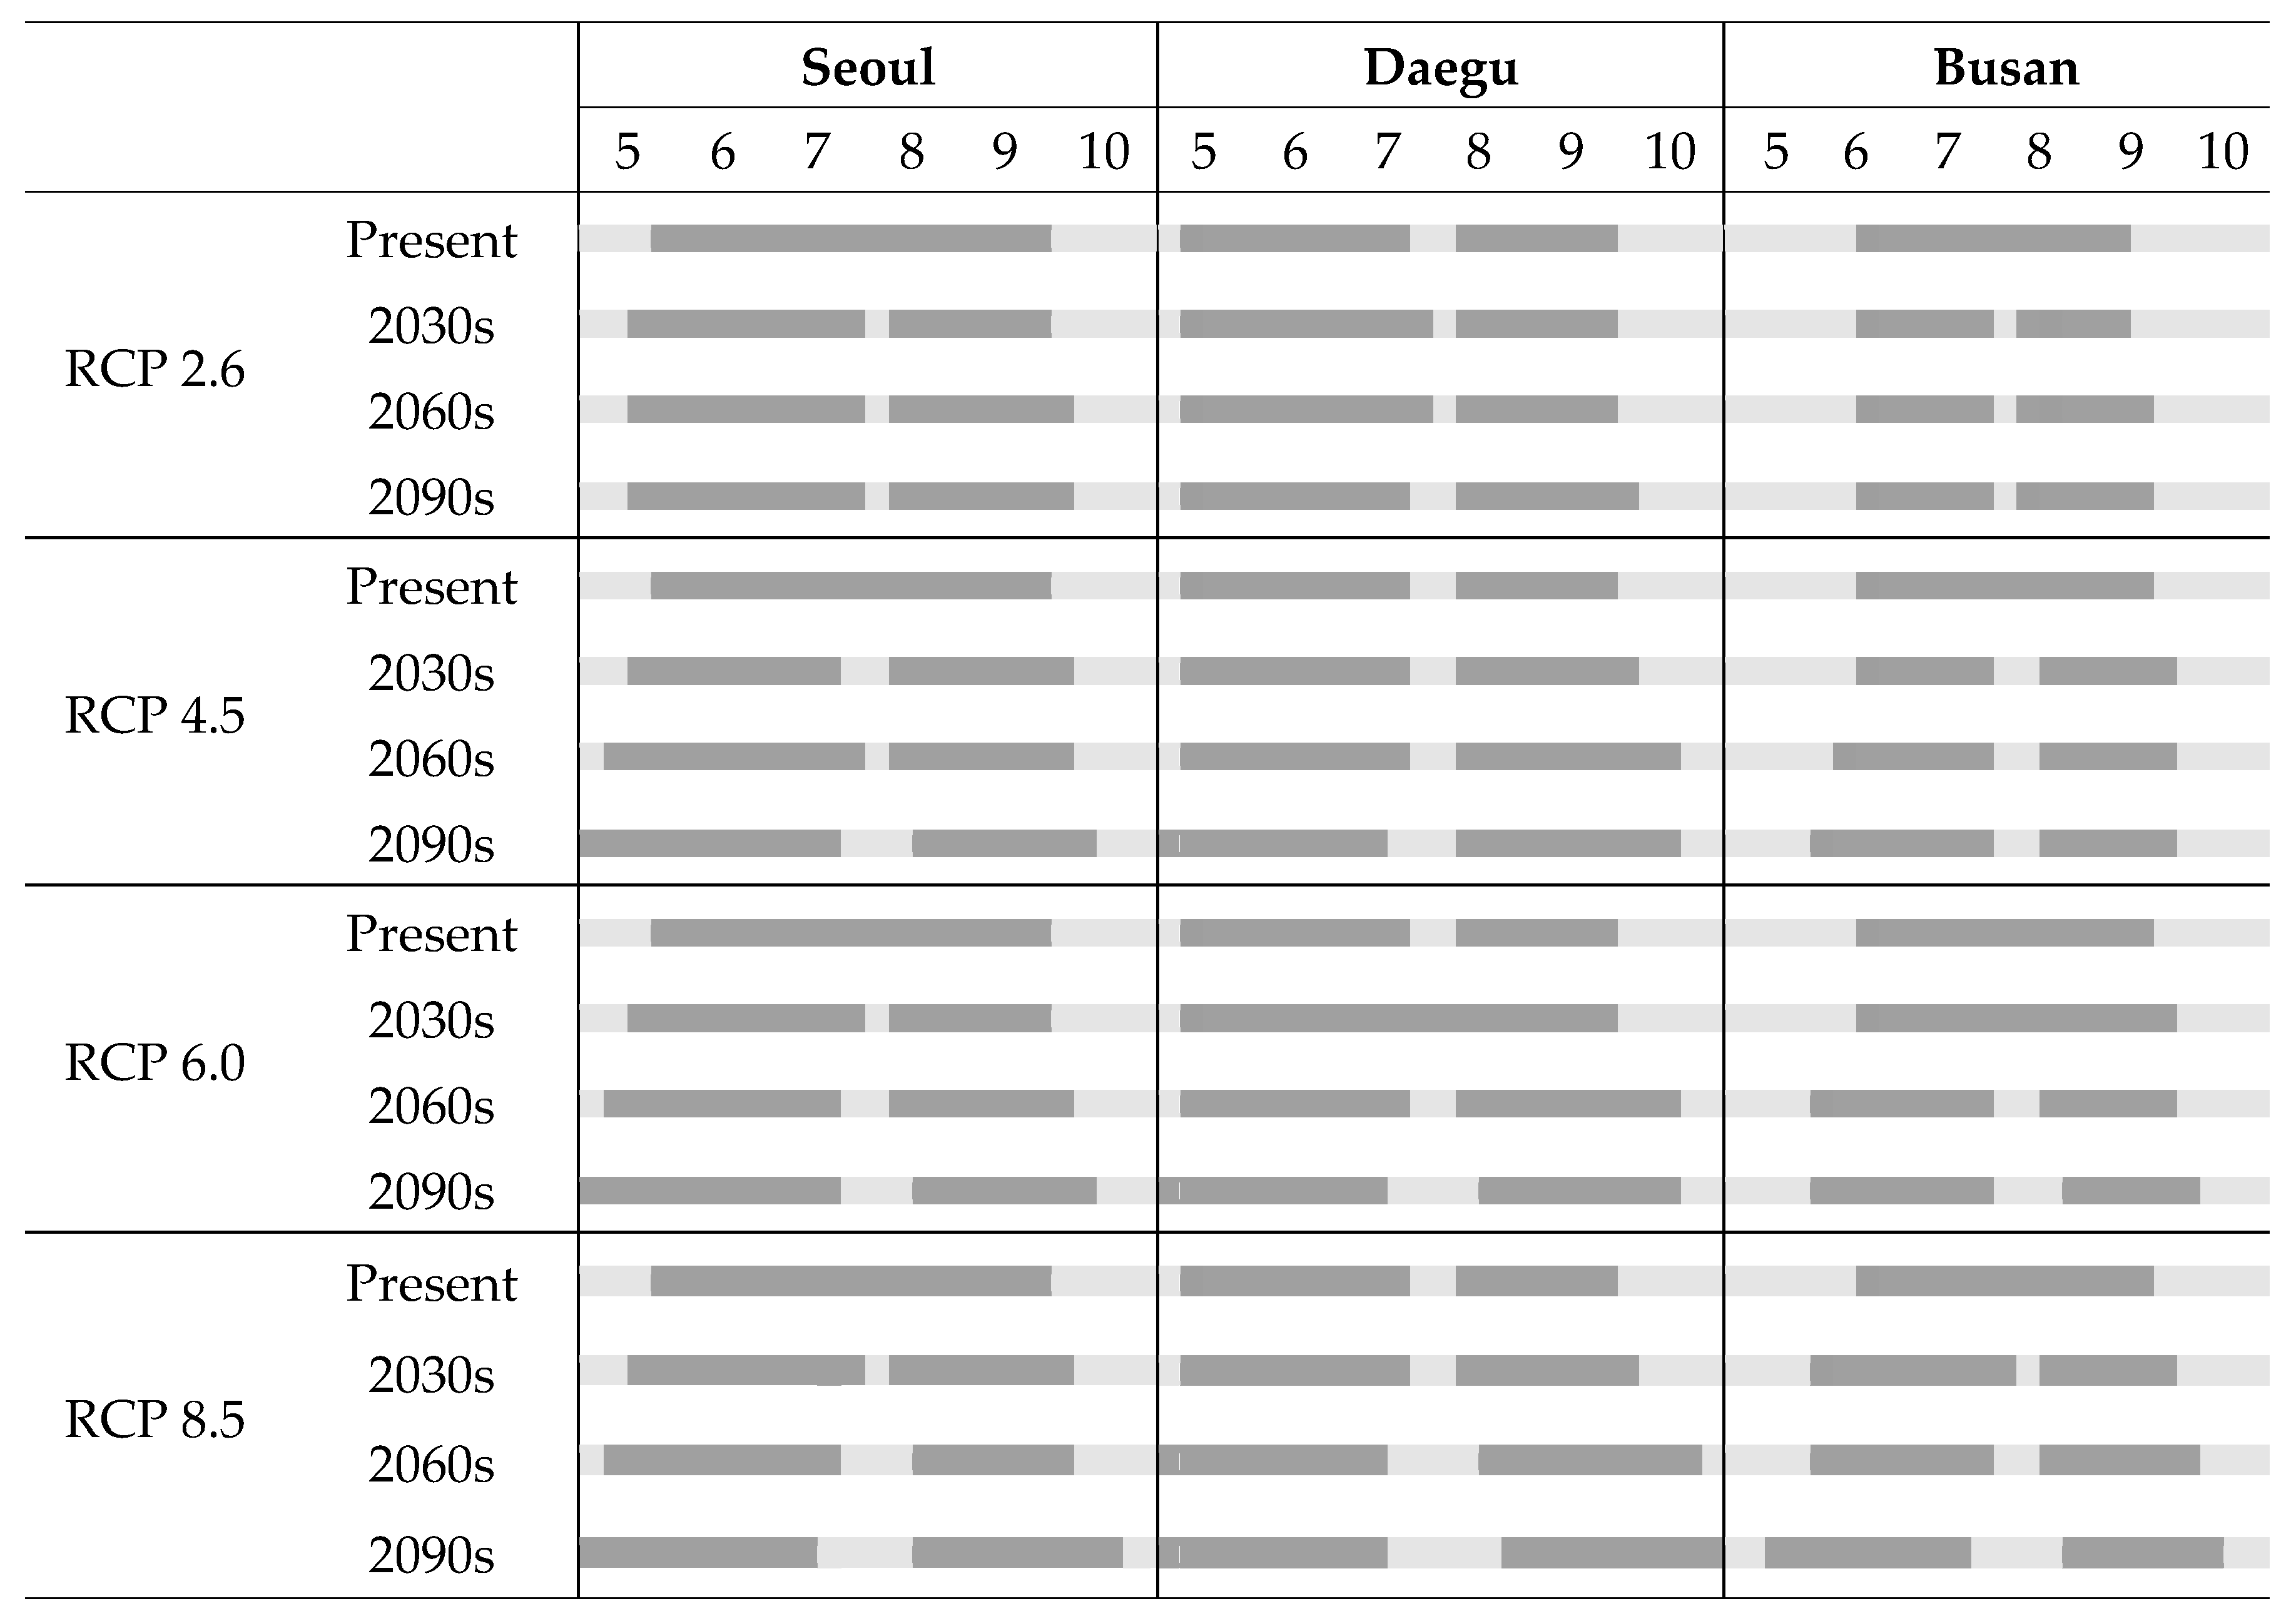
Light gray: less preferred periods, dark gray: more preferred periods.
© 2017 by the authors. Licensee MDPI, Basel, Switzerland. This article is an open access article distributed under the terms and conditions of the Creative Commons Attribution (CC BY) license (http://creativecommons.org/licenses/by/4.0/).
Share and Cite
MDPI and ACS Style
Kim, S.; Park, J.H.; Lee, D.K. Impact of Climate Change on the Preferred Season for Outdoor Water Activities. Sustainability 2017, 9, 1535. https://doi.org/10.3390/su9091535
AMA Style
Kim S, Park JH, Lee DK. Impact of Climate Change on the Preferred Season for Outdoor Water Activities. Sustainability. 2017; 9(9):1535. https://doi.org/10.3390/su9091535
Chicago/Turabian StyleKim, Songyi, Jin Han Park, and Dong Kun Lee. 2017. "Impact of Climate Change on the Preferred Season for Outdoor Water Activities" Sustainability 9, no. 9: 1535. https://doi.org/10.3390/su9091535
Note that from the first issue of 2016, this journal uses article numbers instead of page numbers. See further details here.