Communication Networks and Performance of Four New Delhi City Parks


1
Ashoka Trust for Research in Ecology and the Environment (ATREE), Royal Enclave, Jakkur Post, Srirampura, Bangalore 560064, India
2
Manipal University, Manipal 576104, India
3
School of Environmental Sciences, Jawaharlal Nehru University, New Delhi, Delhi 110067, India
4
Danube Research Institute, MTA Centre for Ecological Research, Karolina út 29, 1113 Budapest, Hungary
5
School of Development, Azim Premji University, Pixel B, PESIT Campus, Electronics City, Hosur Road, Bangalore 560100, India
*
Author to whom correspondence should be addressed.
Sustainability 2017, 9(9), 1551; https://doi.org/10.3390/su9091551
Submission received: 26 June 2017
/
Revised: 19 August 2017
/
Accepted: 27 August 2017
/
Published: 31 August 2017
(This article belongs to the Special Issue Sustainability in an Urbanizing World: The Role of People)
Abstract
:Urban green spaces are very important for human wellbeing and environmental sustainability. The efficiency of managing urban green spaces often depends on communication and integration of information. We performed a social network analysis survey for assessing the communication structure among the staff in four New Delhi city parks. We were interested in the relationship between three topological properties of the social networks (centre of gravity, MaxS, compactness) and three network-independent attributes of their performance (average satisfaction, visitor’s median expected improvements, number of species identified). The presence of a dynamic leader, improved communication and flow of information down the hierarchical chain and lastly, maximization of interaction and strengthening of relationships of the co-workers are three network properties that emerge as very important for a well-performing park. Through this study, we demonstrate the ability of social network analysis to provide simple, yet powerful, insights that can assist in improving the management of urban green spaces.
1. Introduction
Attractive public green spaces contribute to liveable cities and a satisfying experience for urban inhabitants. They also contribute towards sustainable cities [1,2]. Urban green spaces reduce air pollution [3,4], greenhouse gas emissions [5] and urban heat island effects [6,7]. They contribute to enhanced biodiversity and function as important urban wildlife corridors [8,9]. Urban green spaces also contribute to the urban economy. Property prices are often higher near green areas [10,11] and afforestation has very large potential for employment [12,13]. Access to urban green spaces contributes to psychological and physical wellbeing by providing opportunities for recreation, socialization and physical activity [14]. In recent years, awakened by the fact of depleting urban nature at the cost of sustainability, governments and policy-makers have focused on enhancement of urban green spaces, protecting and enhancing ecosystems and developing green networks [15,16].
Parks are important elements of the urban greenscape. Neighbourhood parks are important for promoting physical activity amongst children and adults [17,18]. Social safety, sociability and nature make urban parks more attractive and safe for visitors, including for children [19]. Parks in general should have distributional equity and easy accessibility, attributes that are recognized as essential indicators of a well-functioning urban system [20,21]. Other equally important characteristics that influence the likelihood of park use include safety, cleanliness and effective maintenance [17]. Visitor aesthetic experience is another important indicator of good management [22]. Visitors look forward to a good, positive experience from their visits [23]. Thus, managers of urban parks are primarily responsible for providing attractive outdoor recreation resources for city residents.
Instituting and upholding good governance and responsibility measures are critical for the effectiveness and protection of the nature [24]. Assessment of park performance appraisal of governance enables improvement in quality of the recreational experience. Apart from biodiversity indicators, a range of indicators [25,26,27], have been developed by researchers for measuring dimensions of user satisfaction (performance) related to urban parks and urban greening. Some of the indicators of quality of visitor experience are presence of litter, graffiti, maintenance, cleanliness, appearance of parks and behaviour of park staff [25,28]. Hence, the understanding of the attitudes and perspectives of both management and users of the urban parks through performance indicators generates valuable information on the functioning of park management [27].
In India, parks are usually public owned and managed by different public institutions, sometimes with community participation in management. There is a need to understand the governance structure and functioning of different parks and relate them to the condition and performance of the park. This will enable administrators to have consistent information on the quality and function of the parks while formulating environmental policies and plans for a city. Such performance measures have significant impacts on administrative practices [29].
Social Network Analysis (SNA) can provide a suitable approach for such studies. SNA involves mapping, modelling and measuring the relationships among suitably defined players [30]. Network structure is important for understanding the functioning of the whole group and seeing how the behaviour of individual players depends on the group context.
SNA has begun to become more widely used to study natural resource management in a variety of contexts. Carlsson and Sandström [31] presented an analytical framework for network study of co-management of natural resources. Bodin and Crona [32] in their review of empirically-based literature, showed that the social networks approach has immense possibility in allowing studies of various cross-scale connections and is significant in investigating natural resource governance practices. Crona and Bodin [33] also used SNA for communication of knowledge and information related to natural resource extraction in Kenya. Dee et al. [34] proposed a framework that uses SNA to examine the impact of management on ecosystem services. SNA has been applied to look into the organizational structure, comparative analysis of organizations [35], and performance of individuals, as well as groups in the organization [36]. This study advances previous research by examining the relationships between the social network structure of the park management communication system and the performance of parks.
This comparative study aims at understanding the communication networks for four New Delhi parks, quantifying their structure by SNA and looking for the relationships between performance indicators and network properties.
We describe the methods of data collection, calculation of social network indices and park performance indicators, along with a contextual description of the four selected parks. The co-relationships identified between social network indices and park performance indicators help to understand specific factors that are important for urban park management.
2. Materials and Methods
2.1. Methodology
The study is based on a questionnaire survey. Two separate sets of questionnaires were used to survey park keepers (managers) and park visitors. This was followed by in-depth interviews of long-term park visitors and park keepers. The collected data were coded, categorized and processed. Data derived from the park keepers was used in the SNA. SNA-generated social network indices, while performance indicators were identified from the results of questionnaire surveys of park keepers and park visitors. Following this, associations between the network indices and the performance indicators were derived. In-depth interviews assisted in the interpretation of the results (Figure 1).
2.1.1. Data Collection
As a first step before the SNA, social network data describing the interactions among various actors has to be collected. This can be done through various approaches, like the full network method, ego-centric networks and snowball approaches [37]. These in-depth interviews provide crucial contextual information for understanding the SNA results [38]. On-site face-to-face questionnaire surveys helped to assess visitor perceptions [14].
2.1.2. Data Analysis
As mentioned earlier, the social network analysis looks into the organizational structure and relationships between the actors in a network. Social network data matrices were analysed using standardly-used software programmes, like Ucinet (Harvard, Massachusetts, USA) [39] and the CoSBiLab Graph (Trento, Trentino, Italy) [40]. The qualitative and quantitative data from the interviews were summarized and subsequently coded. Both the numerical approach and the graphic display are effective ways of describing a social structure. This was visualised using Netdraw software [39], where the points (nodes) represent the actors and their pattern of reporting is displayed by lines (or edges). Three macroscopic (global) measurements of network structure can be used to succinctly describe several aspects of the topology of hierarchies: Centre of Gravity (CG), Max S and Compactness.
Centre of Gravity (CG) shows how “tall” or “flat” a hierarchy is [41]. In a directed hierarchy, sources are at the bottom of the network (like producers in a food web) and sinks are at the top (like top-predators in a food web). CG determines how long the distance is, between the source level and an average node in the hierarchy:
where N refers to the number of nodes, µi describes the longest path from node i to the source nodes. We also computed its maximal value in the network
CG can take values ranging from zero to one. When the network is flat (without hierarchy) values extend towards zero, and when the network is tall (extremely hierarchical) values approach one.
The status measure of Harary quantifies the relative power of individuals in the hierarchy [42]. S is computed for each graph node I, as the sum of distances from each node i to all possible nodes j (dij):
The highest S value (MaxS) quantifies the influence of the most important person in the hierarchy.
Compactness quantifies how close the nodes of the network are to each other and how tightly the network is linked [43]. The minimal value, zero, means isolated nodes with no interaction and the maximal values, one means a complete graph where each pair of nodes is connected. This is a measure for undirected networks, where the direction of the hierarchy is not considered.
The survey of the park visitors helps in understanding the perception and preferences of the visitors regarding the park preferences and expectations. Further, the co-relationships help to look for the relationships between park performance indicators and network properties.
2.2. Case Study
Our study was located in New Delhi, the capital of India and one of India’s largest cities. One of the districts in Delhi is New Delhi district, popularly known as Lutyens Delhi, with large open green spaces. It is the greenest region of the National Capital Territory of Delhi with more than 45% of its area under green cover [44] and surrounded by dense built-up area. Lutyens Delhi has an impressive list of species, with more than 200 types of trees distributed across green avenues, iconic large parks, heritage bungalows, roundabouts and other areas [45]. The area of New Delhi district is 35 km2, with 142,000 inhabitants [46]. It houses politically-influential residents—politicians, ministers, bureaucrats and diplomats as well as citizens from all other walks of life. The parks and gardens are well-utilized in this region for exercise and recreation.
New Delhi district is a popular location for recreation, and attracts visitors from across the country at it is the most preferred area for leisure activity in Delhi. We selected four parks: Bhuli Bhatiyari park; Buddha Jayanti Smarak park; Safdarjung’s Tomb; and Lodhi Garden (Figure 2). These parks are maintained by Delhi Development Authority, Central Public Works Department, Archaeological Survey of India and New Delhi Municipal Council, respectively. These four parks in New Delhi are iconic, frequently visited, and managed by four different agencies, enabling a useful comparison of park management structures and visitor experiences.
Bhuli Bhatiyari Park (BBP) (Figure 2a) covers an area of 60 acres, of which 28 acres are under maintenance. The park has a large number of trees like Jamun (Sygium cumini), Keekar (Prosopis juliflora) and Semal (Bombax ceiba) [47]. It forms a part of Delhi’s native Ridge forest.
The Buddha Jayanti Smarak Park (BJSP) (Figure 2b) is the largest of the four parks, covering 100 acres in area, and also located in the Ridge. The park has a large number of trees, many native. Some of the important species are Keekar (Prosopis juliflora), Amaltas (Cassia fistula) and Rosewood (Millettia peguensis) [47].
Safdarjung’s Tomb (ST) (Figure 2c) is the smallest park, with the garden area covering 32 acres. It is a heritage Islamic funerary garden in origin [48] with trees like Royal Palm (Roystonea regia) and Amla (Phyllanthus embilica) [47].
The Lodhi Garden (LG) (Figure 2d) is in South New Delhi district. The garden covers 80 acres. The park contains about 154 species and 5400 trees (NDMC). Some of the important tree species in the garden are Arjun (Terminalia arjuna), Champa (Plumeria), Neem (Azadirachta indica), Jamun (Sygium cumini) and Amaltas (Cassia fistula) [47].
Data Collection and Analysis
In-depth interviews of a few park keepers, as well as some of the long-term regular visitors, have been conducted in each of the four parks. The interviewees were informed about the purpose of the interview and why they were chosen. Assurance of confidentiality of the information was provided to the interviewees. The approximately 40 min interviews explored the participant’s perspectives on the condition of the parks, functioning and management of the park, changes in the parks in terms of green cover and facilities, their expectations and their involvement in the park.
Social network data describing the interactions among various participants have been collected using personal interviews, conducted between April and August 2013. Two different sets of questionnaires were designed to obtain information from (a) park keepers and (b) park visitors. A total of 53 park keepers (31%) were interviewed (12 in BJSP (representing 32% of the total population of park managers), 21 in LG (23%), seven in BBP (70%) and 13 in ST (43%)). The questionnaire for the park keepers (see Appendix A) contains questions regarding the respondent’s personal information, their involvement in the park, and about their contacts. A snowball sampling method [49] has been applied in the data collection of the park keepers in each of the parks. The gardeners and security guards are easily-identifiable, socially-visible respondents [49]. Hence, their knowledge assisted us in locating subsequent respondents (keepers) within each of the parks though their social contacts.
The second set of questionnaires recorded information about visitor’s satisfaction, expected improvements, knowledge about the park and distance and frequency of park visits (Table 1 of [14]). This questionnaire was also aimed at understanding the factors influencing the perception and use of urban nature [14], drawing on each other. Visitor responses were categorized and coded for analysis. For the present study, two indicator variables, namely ‘number of species identified’ and ‘expected improvements’ were selected. A total of 123 respondents (26 in BJSP, 28 in LG, 37 in BBP and 32 in ST) were interviewed. The non-responsive rate for the survey was 7% overall (7% in BJSP, 7% in LG, 3% in BBP and 11% in ST).
Answering the questionnaires took just about 5–7 min for the visitors and park keepers. This ensured that it echoed their instantaneous observations. Weekdays, weekends and public holidays were used for visitor surveys. Interviews were largely conducted in the morning between 8:30 and 10:00 a.m. and in the evening between 5:00 and 6:00 p.m., on weekdays, weekends and major public holidays. We recognize that this survey cannot be considered to represent all visitors to the park. Nevertheless, we are confident that it represents the view of a range of visitors. The park keepers were interviewed on weekdays.
We conducted an analysis of the qualitative data on keepers’ and visitors’ attitudes and expectations, and examined their responses in detailed in-depth interviews to understand the reasoning behind the responses given. The indicators were developed on the basis of four guiding factors: (a) relevancy of the factors linked to park management; (b) representing aspects of both the park managers and keepers; (c) data availability; and (d) simplicity and efficiency by avoiding repetition [50]. ANOVA [51] was used to examine the significant differences in the performance indicators of the four parks.
In the SNA, relationships that exist among the park keepers were compiled in an adjacency matrix, where each respondent in the network has one cell. The second matrix is of attribute data. In this one interviewee has a cell corresponding to one attribute. Social network data matrices were analysed using standardly-used software programmes: Ucinet (Harvard, Massachusetts, USA) [39] and CoSBiLab Graph (Trento, Trentino, Italy) [40]. Three macroscopic (global) measurements of network structure from the SNA: centre of gravity (CG), MaxS and compactness were used to explore associations with park performance indicators. The CG provides information about the strength of communication between workers and leaders (the bottom and the top) in a hierarchical social structure. MaxS provides information about the how important (influential) the most important actor in the hierarchy is. Compactness is an indicator of the richness of general interactions and the potential for collaboration.
3. Results
The in-depth interviews of the park keepers in the four parks reflect varied views about the park’s management and functioning, manpower, changes, problems, their probable solution, involvement and their expectations from the park. The key issues which emerged in each of the parks were identified.
BJP has 30 permanent gardeners, about 30 temporary workers and seven security guards. The major problems reported by park staff are littering, hooliganism and the lack of availability of water for gardening, especially during the summer, as also evident from the presence of dry tanks within the park. The gardeners, however, express trust that administrators will find a solution to the problems, especially of water scarcity. The green cover has increased over the years, along with the enhancement of the safety of the visitors and facilities like park benches.
LG employs 85 gardeners and seven private security guards. Most visitors, as well as park staff, are very satisfied with the quality of the park. Some minor problems mentioned are the insufficiency of water for plants, littering by visitors and incursions by street dogs. Concern for the park’s cleanliness has been voiced by the park keepers, because it does not come under the gardener’s purview. The garden has been consistently in good stature with new additions, like an open-air gymnasium, herbal garden, etc.
BBP is looked after by 10 permanent gardeners. The park is not well maintained, with leaf litter and animal droppings strewn around. The park faces the problem of a lack of water for the plants. The staff size is insufficient for monitoring; personnel are old and unable to traverse the park, leading to an unsafe condition and presence of anti-social activity within the park premises. The park has a large number of trees that have been planted in compensatory plantation initiatives, leading to overcrowding of trees in recent years.
There are 11 gardeners and 19 security guards working in the ST. The park is well laid out with neatly-pruned and widely-spaced trees, yet all parts are not equally maintained. Lack of sufficient personnel has led to less visited areas of the park becoming somewhat messy, with dried leaf branches and leaf litter found on the paths. The park is impacted by water scarcity, yet very few gardeners seem to be concerned by this. The security guard’s major concern is to protect the monument from public vandalism. The park authorities are striving to plant the species of trees that were originally planted on the tomb premises.
The social network structures of four parks were derived on the basis of park keeper’s pattern of communication amongst each other. It is observed that the BBP has the smallest network, while LG has the largest network (Table 1, Figure 3).
Amongst the four parks, in terms of CG, LG (0.15), followed by BJSP (0.18), have relatively low CG, indicating a flat network. On the other hand, BBP has relatively high (0.25) CG, denoting a tall network.
In LG, MaxS is highest (11), signifying the importance of the most important person in the network and MaxS in ST (3) is the lowest among the four parks.
In general, all the park networks have low compactness. Still, amongst the four parks, ST (0.06) has the comparatively lowest compactness, followed by LG (0.08). BJSP (0.13) has the comparatively highest compactness value amongst the four parks.
The park keepers were questioned about their satisfaction regarding the park (Table 2). Satisfaction, here, is defined as a cognitive judgmental process of the present state of affairs, based on an individual’s judgment of self-imposed standard [52]. Studies have shown that the satisfied workers are productive workers which, in turn, has a favorable influence on the functioning of the system, as perceived by their clients [53]. In the present study, park keeper’s satisfaction indicates satisfaction with the management of the park, ranked on a Likert scale from 1 (dissatisfied) to 4 (highly satisfied). LG’s park keepers are highly (4) satisfied with the quality of the park, whereas BBP keepers’ average satisfaction with the quality of the park is least (2.57) among the four parks.
The park keepers were also asked about the problems of the parks. All four parks have various problems. They were categorized and ranked into four categories: the following way: no problem was ranked 1; water scarcity ranked 2; issues related with visitors (littering, vandalism, visitors harming trees, hooliganism, security issues and social nuisance) ranked 3; and issues related to management (maintenance, cleanliness, facilities, shortage of manpower and stray animals) ranked 4. From the data it is revealed that the median number of problems cited by the keepers of BB is higher (3) than the rest. All the other three parks have a similar (2) median number of problems.
The visitors to each of the parks were asked about the improvements they would want to see in the park. Four categories of responses were recorded and ranked. No improvements required ranked 1; improvements related to management (maintenance, cleanliness, facilities, ward off stray animals and advertisement) ranked 2; improvements related to security issues ranked 3; and improvements related to biodiversity (flowering plants, trees, hedges and lawns) ranked 4. Visitors to ST (4) tend to have a higher median expected improvement in the park in comparison to the other three parks. The median expected improvement of visitors is lowest in LG (2).
Visitors to BJSP could identify an average higher (4.27) number of species than the visitors to rest of the parks.
The examination of the relationships between indices of social network structure and park performance indicators reveals some prominent relationships. The most obvious and significant relationship were between (a) CG and average satisfaction of the park keepers; (b) MaxS and median expected improvements by visitors; and (c) Compactness and the average number of species identified by the visitors. Hence, three significant correlations are further analysed and discussed (Table 3).
The average satisfaction of the park keepers tend to decrease with the increase of CG value of the network. The LG network having the lowest CG value have highest average satisfaction of park keepers, while the BBP network having the highest CG value have lowest average satisfaction of park keepers (Figure 4).
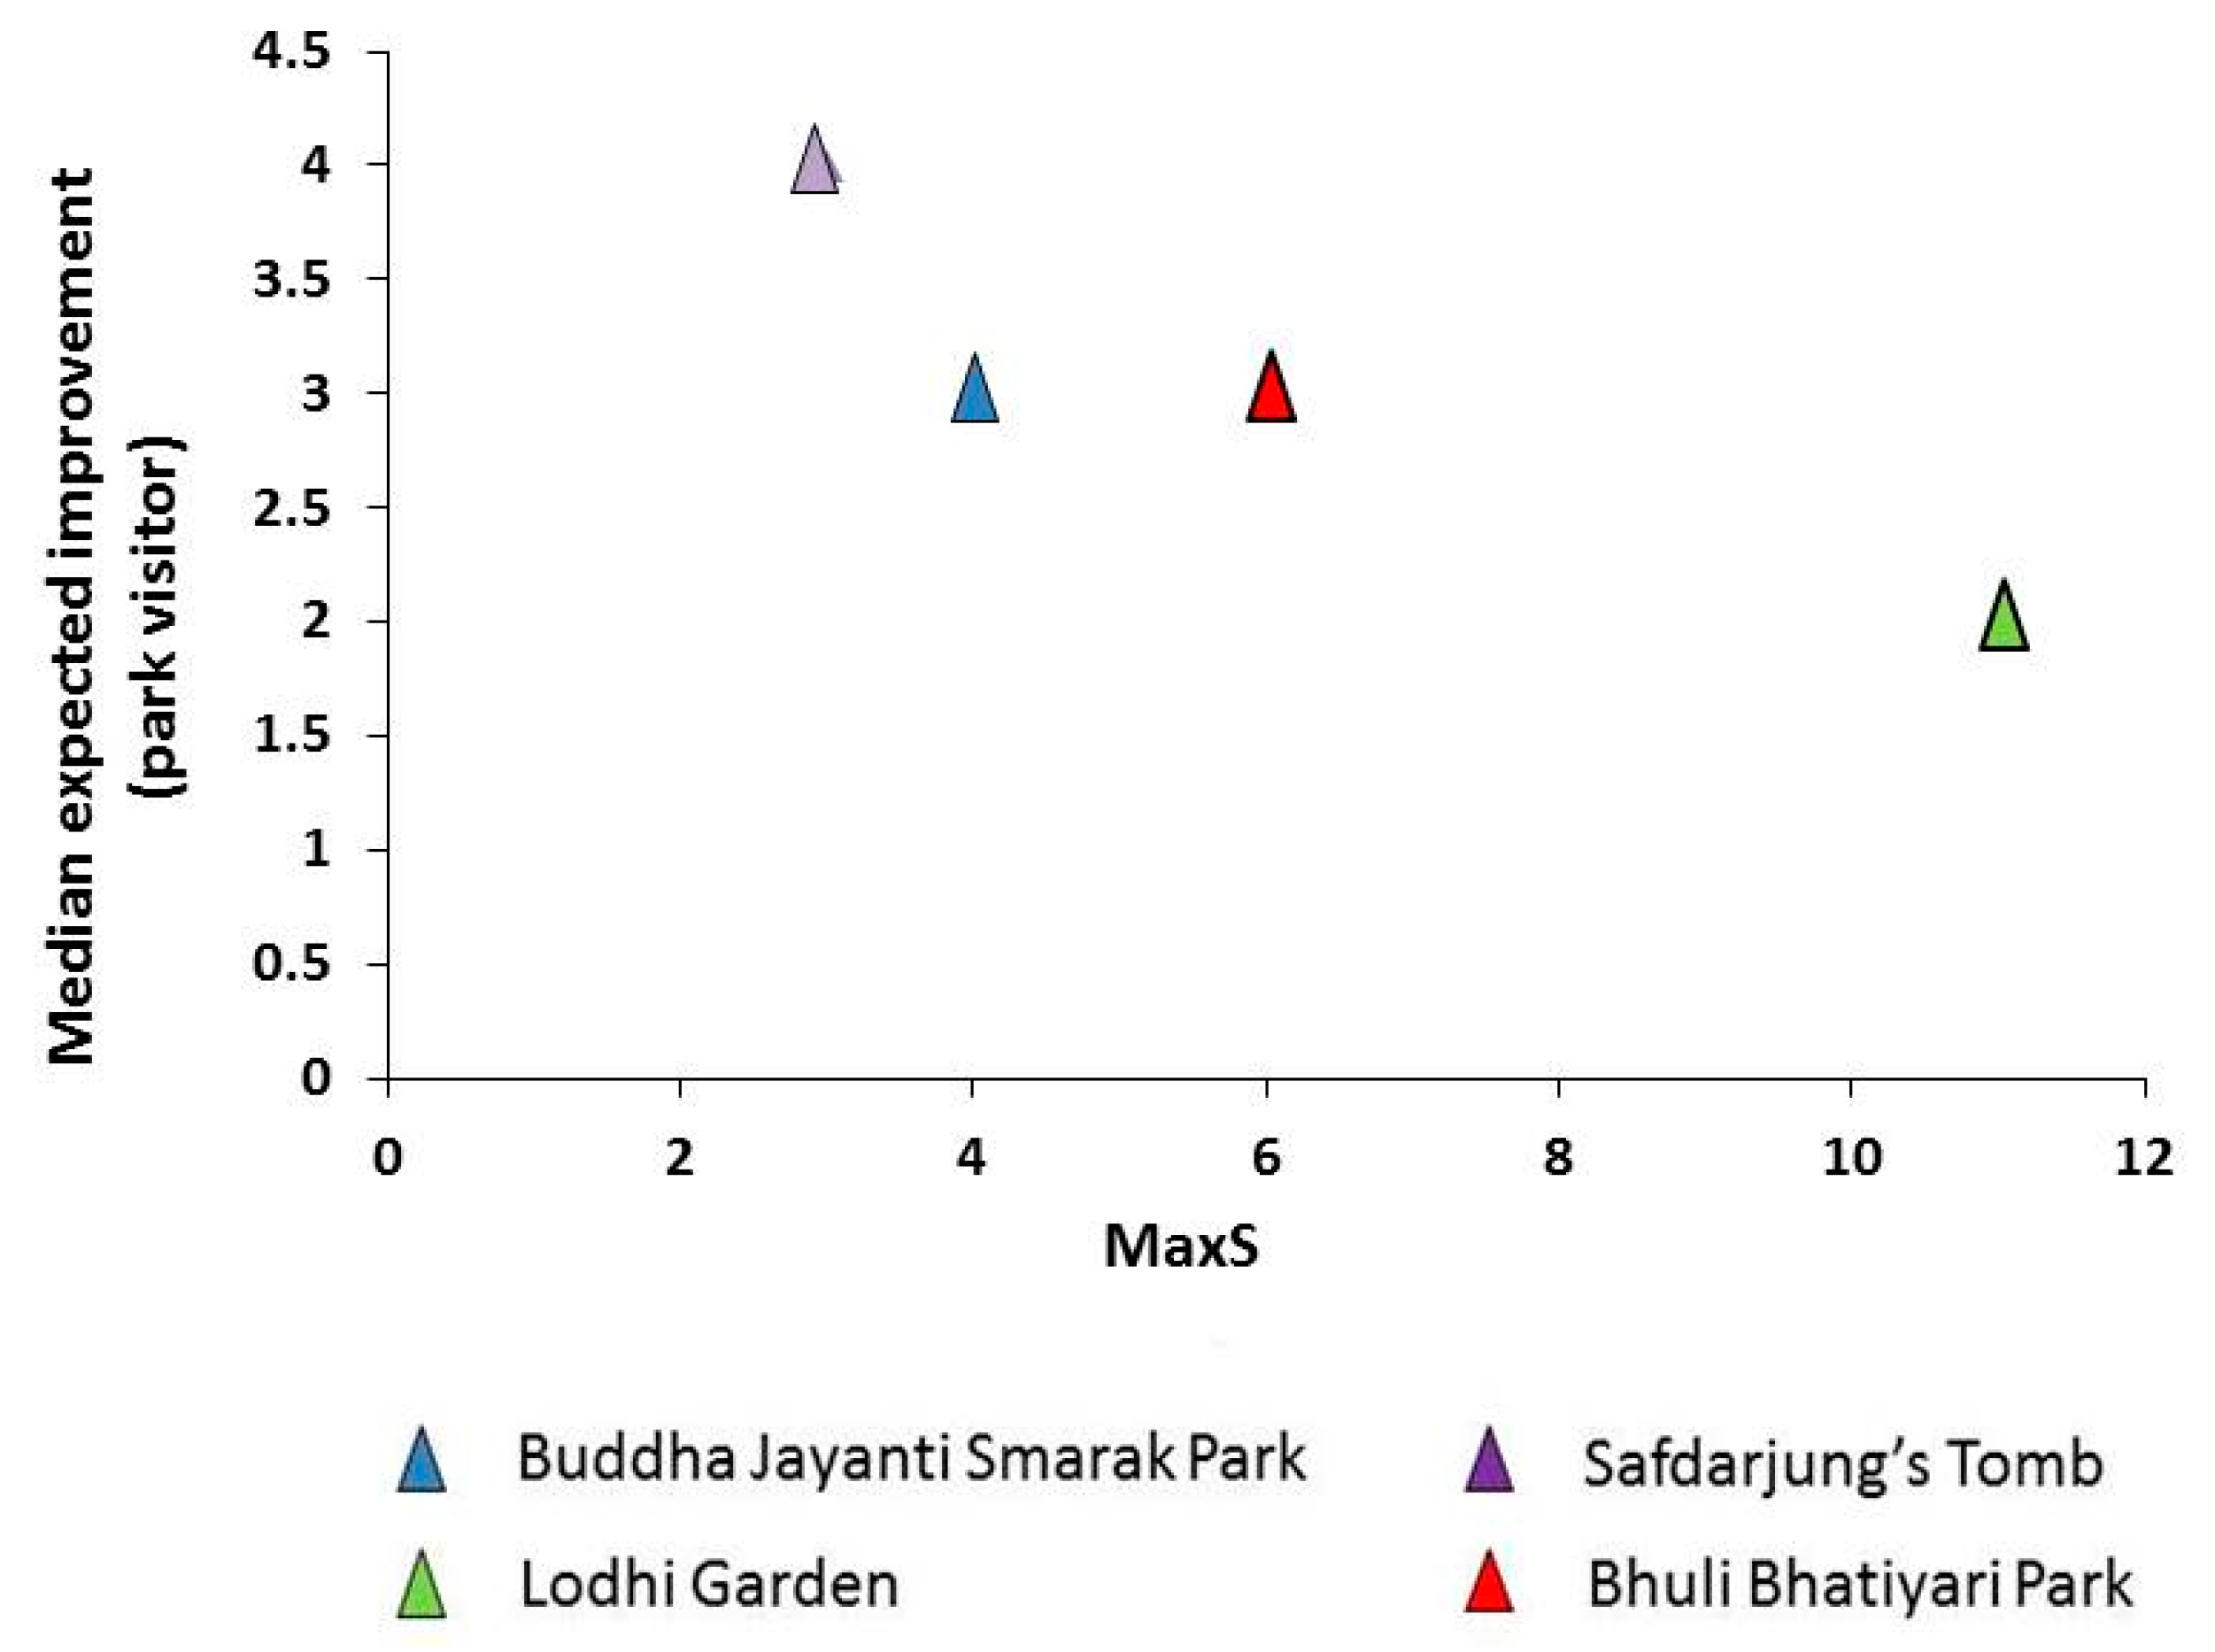
The median expected improvement of the park visitors tend to reduce with the increase in MaxS value of the network. The visitors of ST, having lower MaxS value (3), have higher median expected improvement (4). The LG (11) network having higher MaxS have lower median expected improvement by the park visitors (2) (Figure 5).
The average number of species identified by the park visitors tends to increase with the compactness of the network. The visitors of ST, which has the least compact network, tends to identify a lesser average number of species, whereas visitors to BJSP, which has the most compact network amongst the four parks, tends to identify larger average number of species (Figure 6).
4. Discussion
The studied parks are managed by four different public authorities and they have different hierarchies of management. The differences in management hierarchy lead to differences in the maintenance of the parks. This experimental comparative study arises out of the need to understand the governance structure and functioning of different park managements and how this translates into better managed parks capable of providing a satisfying park experience to urban visitors. Since our observations are limited to only four parks and a smaller sample size, we are very careful in making assertions.
If the social network has a larger CG value, the average satisfaction by the park keepers is lower. This means a larger distance and poorer communication between the lower-level (workers) and higher-level (leaders) individuals. One reason for satisfaction seems to be a flat and wide hierarchy (small CG), where workers appreciate a relatively flat hierarchy where they are feel closer to higher decision-making levels. The lower CG of LG is associated with higher average satisfaction of the park keepers while, for BBP, high CG is associated with lower average satisfaction. It has been observed that the managers of LG interact with the park gardeners and security personnel on a regular basis indicating better communication. In BBP, managers seldom visit the parks, hence, poorer communication is seen between workers and higher-level managers. A study by Rad and Hossein [54] has shown that a supportive management, demonstrated through open communication, respect and recognition between the leader and workers tends to significantly improve satisfaction of employees. A timely and smooth flow of communication is a vital feature of a strong relationship. It works through the development of trust by support in solving disagreements and in lining up views, opinions and anticipations [55]. Hence, intense interaction and mutual communication in a network having low CG leads to higher satisfaction of the park keepers.
The park visitors’ expectation of park improvement tends to decrease with the increase in MaxS. The expectation of improvement of visitors to LG is lowest amongst the four parks and, at the same time, LG has the strongest leader amongst the four parks. LG is frequented by influential bureaucrats and politicians. Thus, the park has to be maintained well to meet to expectations of the elite group and, hence, the leader plays the crucial role in the management of the park. It is seen that the community’s expectations on nature of service delivery, their interactions with the workers influence worker motivation [56]. From the interviews of the park keepers and visitors, it is evident that the leader’s initiatives have contributed to improvements, through setting up of a butterfly conservatory, construction of an open air gym and training of stray dogs for security purposes in the garden [57]. A strong leader is capable of effective articulation of a convincing vision which leads to settling of high expectations by the followers and also inspires others to participate. The leaders tend to look into details of roles, responsibilities, structures and rewards in an organization [58,59] and their attention and ability leads to planning, organizing, implementing and evaluating projects to maximize results [60]. Envisioning or “future thinking” is very vital for sustainability, as it motivates meaningful actions [61]. In ST, the in-depth interviews revealed the absence of a leader capable of taking strong initiative for the betterment of the park: such a leader was there, but was recently transferred to another location. Here the visitors want to see more flowers and trees in the park, whose absence is evident from the photograph of the park. Safety and security related improvements are expected by the visitors to the BBP and BJSP, because these parks turn into ‘safe havens for criminals’ after sunset [14,62].
Compactness also contributes to a larger number of species being identified. This suggests that communication is also helpful in providing a better-maintained park where visitors are more aware of their surroundings, thereby promoting a greater connection between people and nature in urban settings. A study by Panzarasa et al. [63] has shown that networks having compact structure tend to have smaller distances between the users due to which information gets disseminated faster and more accurately. The enhanced interaction of the park keepers of BJSP and BBP might have facilitated conversation, discussion and information about the species seen in the park, leading to incidental learning. According to Doucette and Cole [64] personal interaction between visitors and park keepers is the most essential and very effective means of communication and education. Studies have also shown that bystanders observing flora or feeding wildlife tends to stimulate responses towards flora and fauna by others [65,66]. There is also a possibility that visitors to parks having greater vegetation diversity tend to identify a larger number of species.
5. Conclusions
There is a general understanding that a sustainable city implies a better balance between economic, social and environmental aspects in policy formulation and activities which will have positive impacts in the long-term. Environmental sustainability refers to the efficiency in the use of natural resources which, in turn, takes into account the role, participation and co-operation of the stakeholders and stewards of urban nature in upholding the sustainability goals. The path to sustainability requires new ways to engage people, rather than convey just a body of knowledge [67]. This typically translates directly into management policies and practice [68]. Thus, by integrating knowledge about the park governance system with the peoples’ perceptions, experiences and satisfaction, a comprehensive understanding has been derived, which can serve as an empirically valid foundation for education, research and practice.
Three key takeaways have emanated from this analysis. Firstly, it is evident that networks having lower CG render greater satisfaction to the park keepers, owing to better communication between the highest and the lowest levels of the network.
Secondly, it is also observed that parks having stronger leadership, as indicated by high MaxS, are able to meet the expectation of the visitors for further development of the parks. A strong leader ensures that there is effective control, involvement and also a certain level of dynamism in the management of the park. Initiation and implementation of novel ideas for the betterment of the park is reflected in positive acceptance by the lower levels, translating into better work output. Demonstrated strong and dynamic leadership, i.e., value of the highest person in the chain, also translates into better managed parks capable of meeting the expectations of the visitors.
Thirdly, greater closeness of the nodes in the network, as indicated by high compactness is indicative of better collaboration amongst the workers. Having a sound interactive relationship between workers and their levels of control ensure that participation in the park upkeep is more inclusive and, in turn, enhances the park quality. This also promotes greater connection between people and nature in urban scenarios.
The results of this analysis can be used for strategic restructuring of the informal structure of parks for better management related to greater visitor satisfaction [69] (p. 22). Thus, in order to accomplish the status of well-performing parks, which is capable of meeting the needs of the urban community, there should be restructuring initiative by integrating strong dynamic leadership, capable of providing guidance, encouragement and support to help them overcome any difficulties the park may encounter. Better communication and greater flow of information from higher levels to lower levels of the management hierarchy are also important. The interaction and relationship of the coworkers in the parks should be strengthened and maximized so that communication is broader wherein they can share job experiences and collaborative learning.
All of this can be achieved if SNA arrives at the intended combination of high Max S, high compactness and low CG. In the final analysis, this combination is the perfect match to ensure that the park management works at maximum efficiency, translates itself into effective upkeep of the park and the ability to raise expectations of visitors. Arriving at any other balance among the three would be a calculated decision that policy-makers would have to make and may have the desired results with certain limitations. What works best for each park would remain limited by local considerations, but variation from the ideal social network considerations would reflect itself in the overall park management.
This study of four parks brings out the correlation between the network indices and park performance. We note that some caveats are clear, but it is not easy to improve these aspects of this kind of analyses: the sample size is small (both the number of parks and the number of persons), the quality of the answers to questionnaires is always unknown and, finally, other types of interactions that are not considered here can also be important. Yet, we think that understanding social network effects on the performance of organizations is crucial and this kind of research is so lacking that our exploratory research can catalyze further studies along this line.
Future research can be expanded to examine the social network structure in a greater number of parks to examine variations and relationships between other network indices and the quality of the park. In these cases, the opinion about leadership, consideration of problems and park performance seem to be well correlated with the structure of the social network. This suggests that (1) social network analysis can be used as a monitoring tool to assess the performance of parks and to indicate their internal problems, and (2) social network analysis can also be used as a strategic consultancy tool for designing better functioning parks.
We have studied the park governance structure of four parks managed by four different authorities. Future research can build on this to examine urban parks in diverse contexts. The aim will be to obtain a general understanding of the social network operations of urban parks and to identify ways in which leaders and co-workers can collaborate and network to improve park management and satisfaction of visitor needs. It will also be interesting to obtain an understanding of how network awareness influences the behavior of managers and co-workers towards more effective park management.
Acknowledgments
We thank Royal Norwegian Embassy (RNE: IND-3025 1210050) and Tata Social Welfare Trust (TSWT: TSWT/IG/SP/BM/sm/CM/24/MNRL/2011-12) for doctoral research support to S.P., D.S. Kothari Postdoctoral Fellowship (DSKPDF) for post-doctoral research support to S.P. and Azim Premji University for research funding through a Research Centre grant to HN.
Author Contributions
Somajita Paul, Ferenc Jordán and Harini Nagendra conceived and designed the study; Somajita Paul conducted the survey; Ferenc Jordán and Somajita Paul analyzed the data; and Somajita Paul, Ferenc Jordán and Harini Nagendra wrote the paper.
Conflicts of Interest
The authors declare no conflict of interest. The founding sponsors had no role in the design of the study; in the collection, analyses, or interpretation of data; in the writing of the manuscript and in the decision to publish the results.
Appendix A

Table A1.
The questionnaire used for the social network survey.
| Personal Information |
| 1. Name |
| 2. Occupation |
| 3. Place of stay |
| Respondent’s Involvement in the Park |
| 4. Are you satisfied with the greenery in this park? |
| (i) very satisfied |
| (ii) satisfied |
| (iii) not very satisfied |
| (iv) dissatisfied |
| 5. What are the problems faced by this park? |
| 6. How do you think you can overcome these problems? |
| 7. What improvements do you want to see in this park? |
| 8. Have you noticed any changes in the park over time? |
| Important Contacts |
| 9. Whom do you report/share issues regarding the park? |
| 10. How frequently you meet? |
| 11. Who is the most important authority to whom you report regarding the park? |
| 12. With whom you don’t want /don’t like to share issues regarding the park? |
| Other Contacts |
| 13. Regarding matters of the park, do you interact with other people outside the park? |
| 14. How frequently do you meet? |
References
- Nagendra, H. Nature in the City: Bengaluru in the Past, Present and Future; Oxford University Press: New Delhi, India, 2016. [Google Scholar]
- Loures, L.; Costa, L. Urban parks as a driver for urban sustainability—Case studies from Oporto, Portugal. Interdiscipl. Soc. Hum. Sci. 2016, 5, 576. [Google Scholar]
- Vailshery, L.S.; Jaganmohan, M.; Nagendra, H. Effect of street trees on microclimate and air pollution in a tropical city. Urban For. Urban Green. 2013, 12, 408–415. [Google Scholar] [CrossRef]
- Selmi, W.; Weber, C.; Rivière, E.; Blond, N.; Mehdi, L.; Nowak, D. Air pollution removal by trees in public green spaces in Strasbourg city, France. Urban For. Urban Green. 2016, 17, 192–201. [Google Scholar] [CrossRef]
- Stoffberg, G.H.; van Rooyen, M.W.; van der Linde, M.J.; Groeneveld, H.T. Carbon sequestration estimates of indigenous street trees in the City of Tshwane, South Africa. Urban For. Urban Green. 2010, 9, 9–14. [Google Scholar] [CrossRef]
- Solecki, W.D.; Rosenzweig, C.; Parshall, L.; Pope, G.; Clark, M.; Cox, J.; Wiencke, M. Mitigation of the heat island effect in urban New Jersey. Glob. Environ. Chang. Part B 2005, 6, 39–49. [Google Scholar] [CrossRef]
- Fu, P.; Weng, Q. Responses of urban heat island in Atlanta to different land-use scenarios. Theor. Appl. Climatol. 2017. Available online: https://doi.org/10.1007/s00704-017-2160-3 (accessed on 29 August 2017). [CrossRef]
- Angold, P.G.; Sadler, J.P.; Hill, M.O.; Pullin, A.; Rushton, S.; Austin, K.; Small, E.; Wood, B.; Wadsworth, R.; Sanderson, R.; et al. Biodiversity in urban habitat patches. Sci. Total Environ. 2006, 360, 196–204. [Google Scholar] [CrossRef] [PubMed]
- Norton, B.A.; Evans, K.L.; Warren, P.H. Urban Biodiversity and Landscape Ecology: Patterns, Processes and Planning. Curr. Landsc. Ecol. Rep. 2016, 1, 178–192. [Google Scholar] [CrossRef]
- Anderson, L.M.; Cordell, H.K. Residential property values improved by landscaping with trees. South. J. Appl. For. 1985, 9, 162–166. [Google Scholar]
- Czembrowski, P.; Kronenberg, J. Hedonic pricing and different urban green space types and sizes: Insights into the discussion on valuing ecosystem services. Landsc. Urban Plan. 2016, 146, 11–19. [Google Scholar] [CrossRef]
- Shuifa, K.E.; Wagner, J.E.; Zhou, L.; Yali, W.; Yan, Z. The Situations and Potentials of Forest Carbon Sinks and Employment Creation from Afforestation in China 1. Int. For. Rev. 2010, 12, 247–255. [Google Scholar] [CrossRef]
- Roy, S.; Dutta, S.; Hoque, M.M. Urban forestry and urban greening for sustainable urban development—A case of Dhaka north city corporation area (Zone-1). J. Bangladesh Agric. Univ. 2017, 14, 167–176. [Google Scholar] [CrossRef]
- Paul, S.; Nagendra, H. Factors Influencing Perceptions and Use of Urban Nature: Surveys of Park Visitors in Delhi. Land 2017, 6, 27. [Google Scholar] [CrossRef]
- Thierfelder, H.; Kabisch, N. Viewpoint Berlin: Strategic urban development in Berlin–Challenges for future urban green space development. Environ. Sci. Policy 2016, 62, 120–122. [Google Scholar] [CrossRef]
- Mattijssen, T.J.M.; van der Jagt, A.P.N.; Buijs, A.E.; Elands, B.H.M.; Erlwein, S.; Lafortezza, R. The long-term prospects of citizens managing urban green space: From place making to place-keeping? Urban For. Urban Green. 2017, 26, 78–84. [Google Scholar] [CrossRef]
- Tucker, P.; Gilliland, J.; Irwin, J.D. Splashpads, swings, and shade: Parents’ preferences for neighbourhood parks. Can. J. Public Health. 2007, 98, 198–202. [Google Scholar] [PubMed]
- Stewart, O.T.; Moudon, A.V.; Fesinmeyer, M.D.; Zhou, C.; Saelens, B.E. The association between park visitation and physical activity measured with accelerometer, GPS, and travel diary. Health. Place 2016, 38, 82–88. [Google Scholar] [CrossRef] [PubMed]
- Lloyd, K.; Burden, J.; Kiewa, J. Young Girls and Urban Parks: Planning for Transition through Adolescence. J. Park Recreat. Adm. 2008, 26, 21–38. Available online: http://js.sagamorepub.com/jpra/article/view/1311 (accessed on 29 August 2017).
- Schroeder, H.W. Preferred features of urban parks and forests. J. Arboric. 1982, 8, 317–322. [Google Scholar]
- Nicholls, S. Measuring the accessibility and equity of public parks: A case study using GIS. Manag. Leis. 2001, 6, 201–219. [Google Scholar] [CrossRef]
- Wong, K.K.; Domroes, M. The visual quality of urban park scenes of Kowloon Park, Hong Kong: Likeability, affective appraisal, and cross-cultural perspectives. Environ. Plan. B 2005, 32, 617–632. [Google Scholar] [CrossRef]
- Hamilton, J.A.; Crompton, J.L.; More, T.A. Identifying the dimensions of service quality in a park context. J. Environ. Manag. 1991, 32, 211–220. [Google Scholar] [CrossRef]
- Michael, L. Good governance for terrestrial protected areas: A framework, principles and performance outcomes. J. Environ. Manag. 2010, 91, 754–766. [Google Scholar]
- Budruk, M.; Manning, R. Indicators and standards of quality at an urban-proximate park: Litter and graffiti at Boston Harbor Islands National Recreation Area. J. Park Recreat. Adm. 2006, 24, 1–23. [Google Scholar]
- Ammons, D.N.; Coe, C.; Lombardo, M. Performance-Comparison Projects in Local Government: Participants’ Perspectives. Public Adm. Rev. 2001, 61, 100–110. [Google Scholar] [CrossRef]
- Chan, C.S.; Marafa, L.M.; Van Den Bosch, C.C.K. Changing perspectives in urban park management: A longitudinal study of Hong Kong. Manag. Sport Leis. 2015, 20, 56–76. [Google Scholar] [CrossRef]
- Fletcher, D.; Fletcher, H. Manageable Predictors of Park visitor satisfaction: Maintenance and Personnel. J. Park Recreat. Adm. 2003, 21, 1. [Google Scholar]
- Swindell, D.; Kelly, J.M. Linking citizen satisfaction data to performance measures: A preliminary evaluation. Public Perform. Manag. 2000, 24, 30–52. [Google Scholar] [CrossRef]
- Wasserman, S.; Faust, K. Social Network Analysis: Methods and Applications; Cambridge University Press: Cambridge, UK; New York, NY, USA, 1994; Volume 8. [Google Scholar]
- Sandström, A.; Carlsson, L. The performance of policy networks: The relation between network structure and network performance. Policy Stud. J. 2008, 36, 497–524. [Google Scholar] [CrossRef]
- Bodin, Ö.; Crona, B.I. The role of social networks in natural resource governance: What relational patterns make a difference? Glob. Environ. Chang. 2009, 19, 366–374. [Google Scholar] [CrossRef]
- Crona, B.; Bodin, Ö. Power asymmetries in small-scale fisheries: A barrier to governance transformability. Ecol. Soc. 2010, 15, 32. [Google Scholar] [CrossRef]
- Dee, L.E.; Allesina, S.; Bonn, A.; Eklöf, A.; Gaines, S.D.; Hines, J.; Thompson, R.M. Operationalizing network theory for ecosystem service assessments. Trends Eecol. Evol. 2017, 32, 118–130. [Google Scholar] [CrossRef] [PubMed]
- Tichy, N.M.; Tushman, M.L.; Fombrun, C. Social network analysis for organizations. Acad. Manag. Rev. 1979, 4, 507–519. [Google Scholar]
- Sparrowe, R.T.; Liden, R.C.; Wayne, S.J.; Kraimer, M.L. Social networks and the performance of individuals and groups. Acad. Manag. J. 2001, 44, 316–325. [Google Scholar] [CrossRef]
- Chan, C.; Liebowitz, J. The synergy of social network analysis and knowledge mapping: A case study. Int. J. Manag. Decis. Mak. 2006, 7, 1. [Google Scholar] [CrossRef]
- Scott, J.; Tallia, A.; Crosson, J.C.; Orzano, A.J.; Stroebel, C.; DiCicco-Bloom, B.; Crabtree, B. Social network analysis as an analytic tool for interaction patterns in primary care practices. Ann. Fam. Med. 2005, 3, 443–448. [Google Scholar] [CrossRef] [PubMed]
- Borgatti, S.P.; Everett, M.G.; Freeman, L.C. Ucinet 6 for Windows: Software for Social Network Analysis; Analytic Technologies: Harvard, MA, USA, 2002; Available online: http://pages.uoregon.edu/vburris/hc431/Ucinet_Guide.pdf (accessed on 29 August 2017).
- Valentini, R.; Jordán, F. CoSBiLab Graph: The network analysis module of CoSBiLab. Environ. Model. Softw. 2010, 25, 886–888. [Google Scholar] [CrossRef]
- Fussmann, G.F.; Heber, G. Food web complexity and chaotic population dynamics. Ecol. Lett. 2002, 5, 394–401. [Google Scholar] [CrossRef]
- Harary, F. Status and contrastatus. Sociometry 1959, 22, 23–43. [Google Scholar] [CrossRef]
- Freeman, L.C. Centrality in social networks conceptual clarification. Soc. Netw. 1978, 1, 215–239. [Google Scholar] [CrossRef]
- Economic Survey of Delhi, 2014–2015. Available online: http://www.delhi.gov.in/wps/wcm/connect/DoIT_Planning/planning/economic+survey+of+dehli/economic+survey+of+delhi+2014+-+2015 (accessed on 22 April 2016).
- Buch, M. Lutyens’ New Delhi—Yesterday, today and tomorrow. India Int. Cent. Q. 2003, 30, 29–40. [Google Scholar]
- Chandramouli, C.; General, R. Census of India 2011. In Provisional Population Totals; Office of the Registrar General & Census Commissioner: New Delhi, India, 2011. [Google Scholar]
- Krishen, P. Trees of Delhi: A Field Guide; Penguin Books India Ltd.: Delhi, India, 2006. [Google Scholar]
- Sharma, J.P. The British treatment of historic gardens in the Indian subcontinent: The transformation of Delhi’s Nawab Safdarjung’s Tomb complex from a Funerary garden into a public park. Gard. Hist. 2007, 35, 210–228. [Google Scholar]
- Biernacki, P.; Waldorf, D. Snowball sampling: Problems and techniques of chain referral sampling. Sociol. Methods Res. 1981, 10, 141–163. [Google Scholar] [CrossRef]
- Zuo, X.; Hua, H.; Dong, Z.; Hao, C. Environmental Performance Index at the Provincial Level for China 2006–2011. Ecol. Indic. 2017, 75, 48–56. [Google Scholar] [CrossRef]
- Cressie, N. Statistics for Spatial Data; John Wiley Sons: New York, NY, USA, 2015. [Google Scholar]
- Diener, E.D.; Emmons, R.A.; Larsen, R.J.; Griffin, S. The satisfaction with life scale. J. Pers. Assess. 1985, 49, 71–75. [Google Scholar] [CrossRef] [PubMed]
- Taris, T.W.; Schreurs, P.J. Well-being and organizational performance: An organizational-level test of the happy-productive worker hypothesis. Work Stress 2009, 23, 120–136. [Google Scholar] [CrossRef]
- Rad, A.; Hossein, Y.M. A study of relationship between managers' leadership style and employees’ job satisfaction. Leadersh. Health Serv. 2006, 19, 11–28. [Google Scholar]
- Morgan, R.M.; Hunt, S.D. The commitment-trust theory of relationship marketing. J. Mark. 1994, 58, 20–38. [Google Scholar] [CrossRef]
- Franco, L.M.; Bennett, S.; Kanfer, R. Health sector reform and public sector health worker motivation: A conceptual framework. Soc. Sci. Med. 2002, 54, 1255–1266. [Google Scholar] [CrossRef]
- Times of India. Available online: http://timesofindia.indiatimes.com/city/delhi/Lodhi-Garden-decks-up-for-80th-birthday/articleshow/51749253.cms (accessed on 12 June 2017).
- Nadler, D.A.; Tushman, M.L. Beyond the charismatic leader: Leadership and organizational change. Calif. Manag. Rev. 1990, 32, 77–97. [Google Scholar] [CrossRef]
- LeMay, N.V.; Ellis, A. Evaluating leadership development and organizational performance. In Handbook of Leadership Development Evaluation; Wiley: Hoboken, NJ, USA, 2006; pp. 228–260. [Google Scholar]
- Hoppe, B.; Reinelt, C. Social network analysis and the evaluation of leadership networks. Leadersh. Q. 2010, 21, 600–619. [Google Scholar] [CrossRef]
- Tilbury, D.; Wortman, D. Engaging People in Sustainability, Commission on Education and Communication; IUCN: Gland, Switzerland; Cambridge, UK, 2004. [Google Scholar]
- Pankhuri, Y. Times of India. Available online: http://timesofindia.indiatimes.com/city/delhi/parks-safe-haven-for-criminals-at-night/articleshow/57239080.cms (accessed on 4 April 2017).
- Panzarasa, P.; Opsahl, T.; Carley, K.M. Patterns and dynamics of users’ behavior and interaction: Network analysis of an online community. J. Am. Soc. Inf. Sci. Technol. 2009, 60, 911–932. [Google Scholar] [CrossRef]
- Doucette, J.E.; Cole, D.N. Wilderness Visitor Education: Information about Alternative Techniques; General Technical Report, INT-295; Intermountain Research Station, USDA Forest Service: Washington, DC, USA, 1993.
- Dick, R.E.; Hendee, J.C. Human responses to encounters with wildlife in urban parks. Leis. Sci. 1986, 8, 63–77. [Google Scholar] [CrossRef]
- Randler, C.; Höllwarth, A.; Schaal, S. Urban park visitors and their knowledge of animal species. Anthrozoos 2007, 20, 65–74. [Google Scholar] [CrossRef]
- Tilbury, D.; Stevenson, R.B.; Fien, J.; Schreuder, D. Education and Sustainability: Responding to the Global Challenge; Commission on Education and Communication, IUCN: Gland, Switzerland; Cambridge, UK, 2002; p. 206. [Google Scholar]
- Gobster, P.H. Visions of nature: Conflict and compatibility in urban park restoration. Landsc. Urban Plan. 2001, 56, 35–51. [Google Scholar] [CrossRef]
- Manso, B.; Manso, M. Know the Network, Knit the Network: Applying SNA to N2C2 Maturity Model Experiments; EDISOFT S.A.: Monte de Caparica, Portugal, 2010. [Google Scholar]
Figure 1.
Methodology.
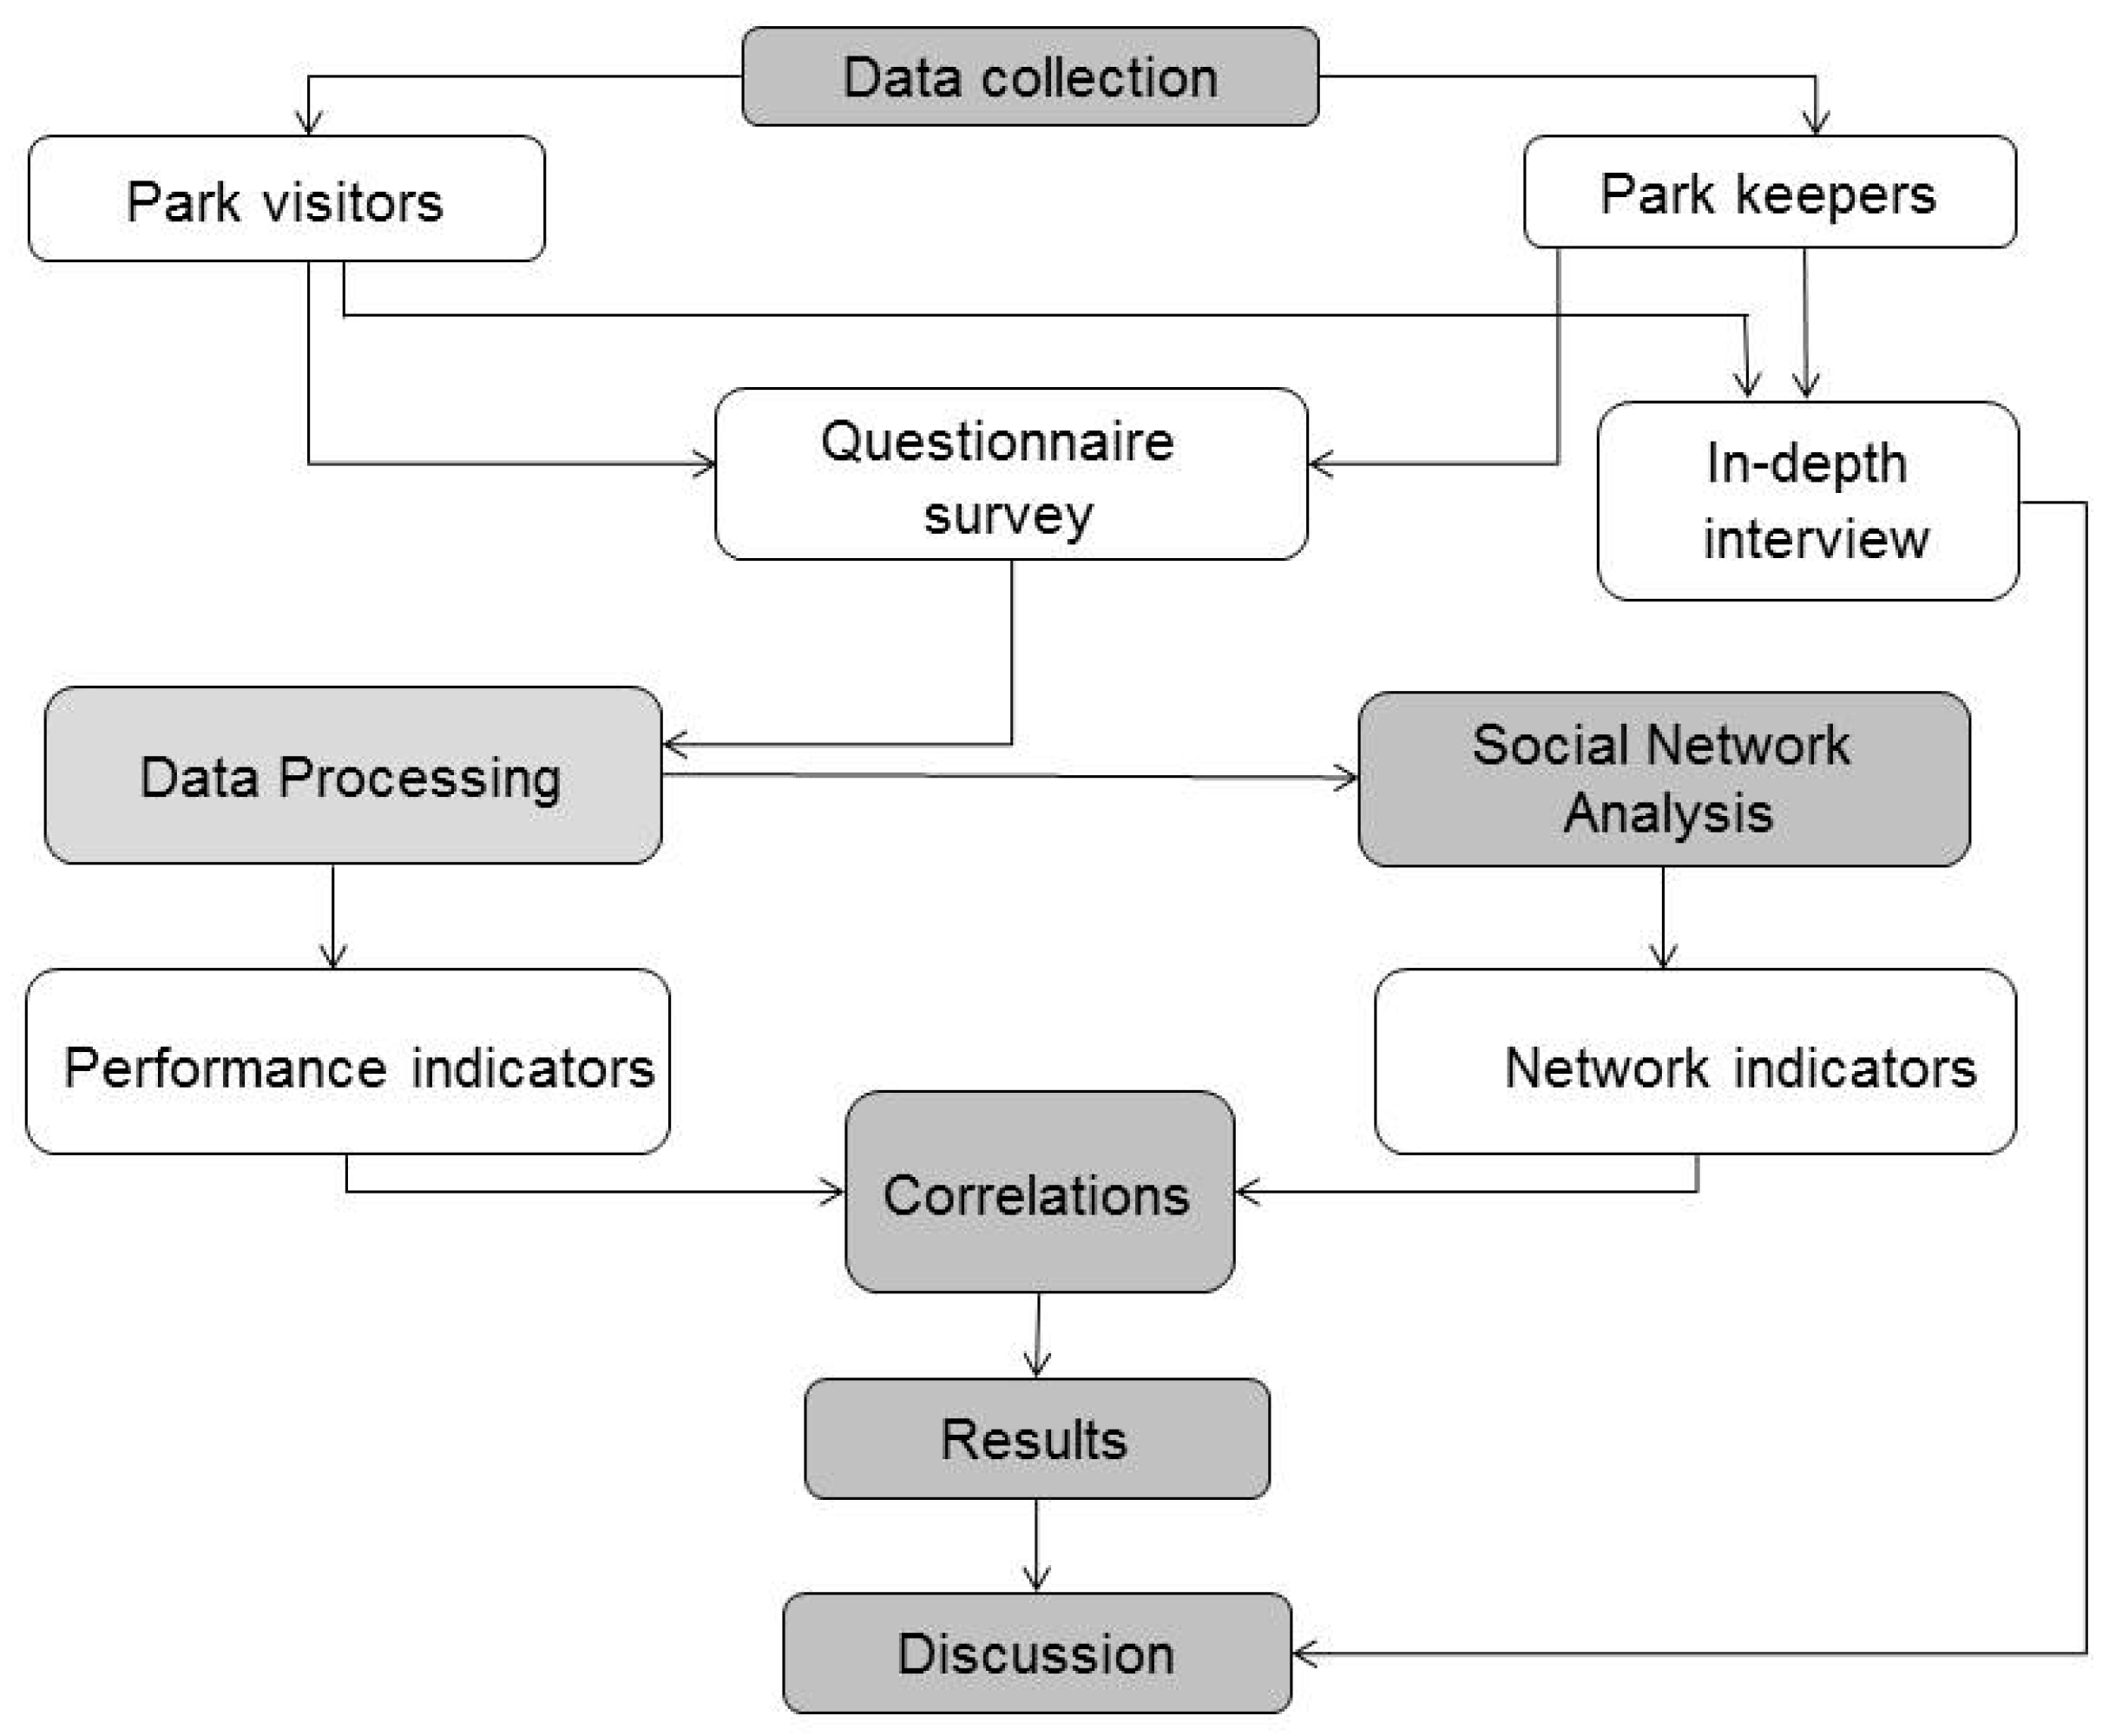
Figure 2.
The four parks under study: (a) Bhuli Bhatiyar;i (b) Buddha Jayanti Smarak; (c) Safdarjung’s Tomb; and (d) Lodhi Garden.
Figure 2.
The four parks under study: (a) Bhuli Bhatiyar;i (b) Buddha Jayanti Smarak; (c) Safdarjung’s Tomb; and (d) Lodhi Garden.
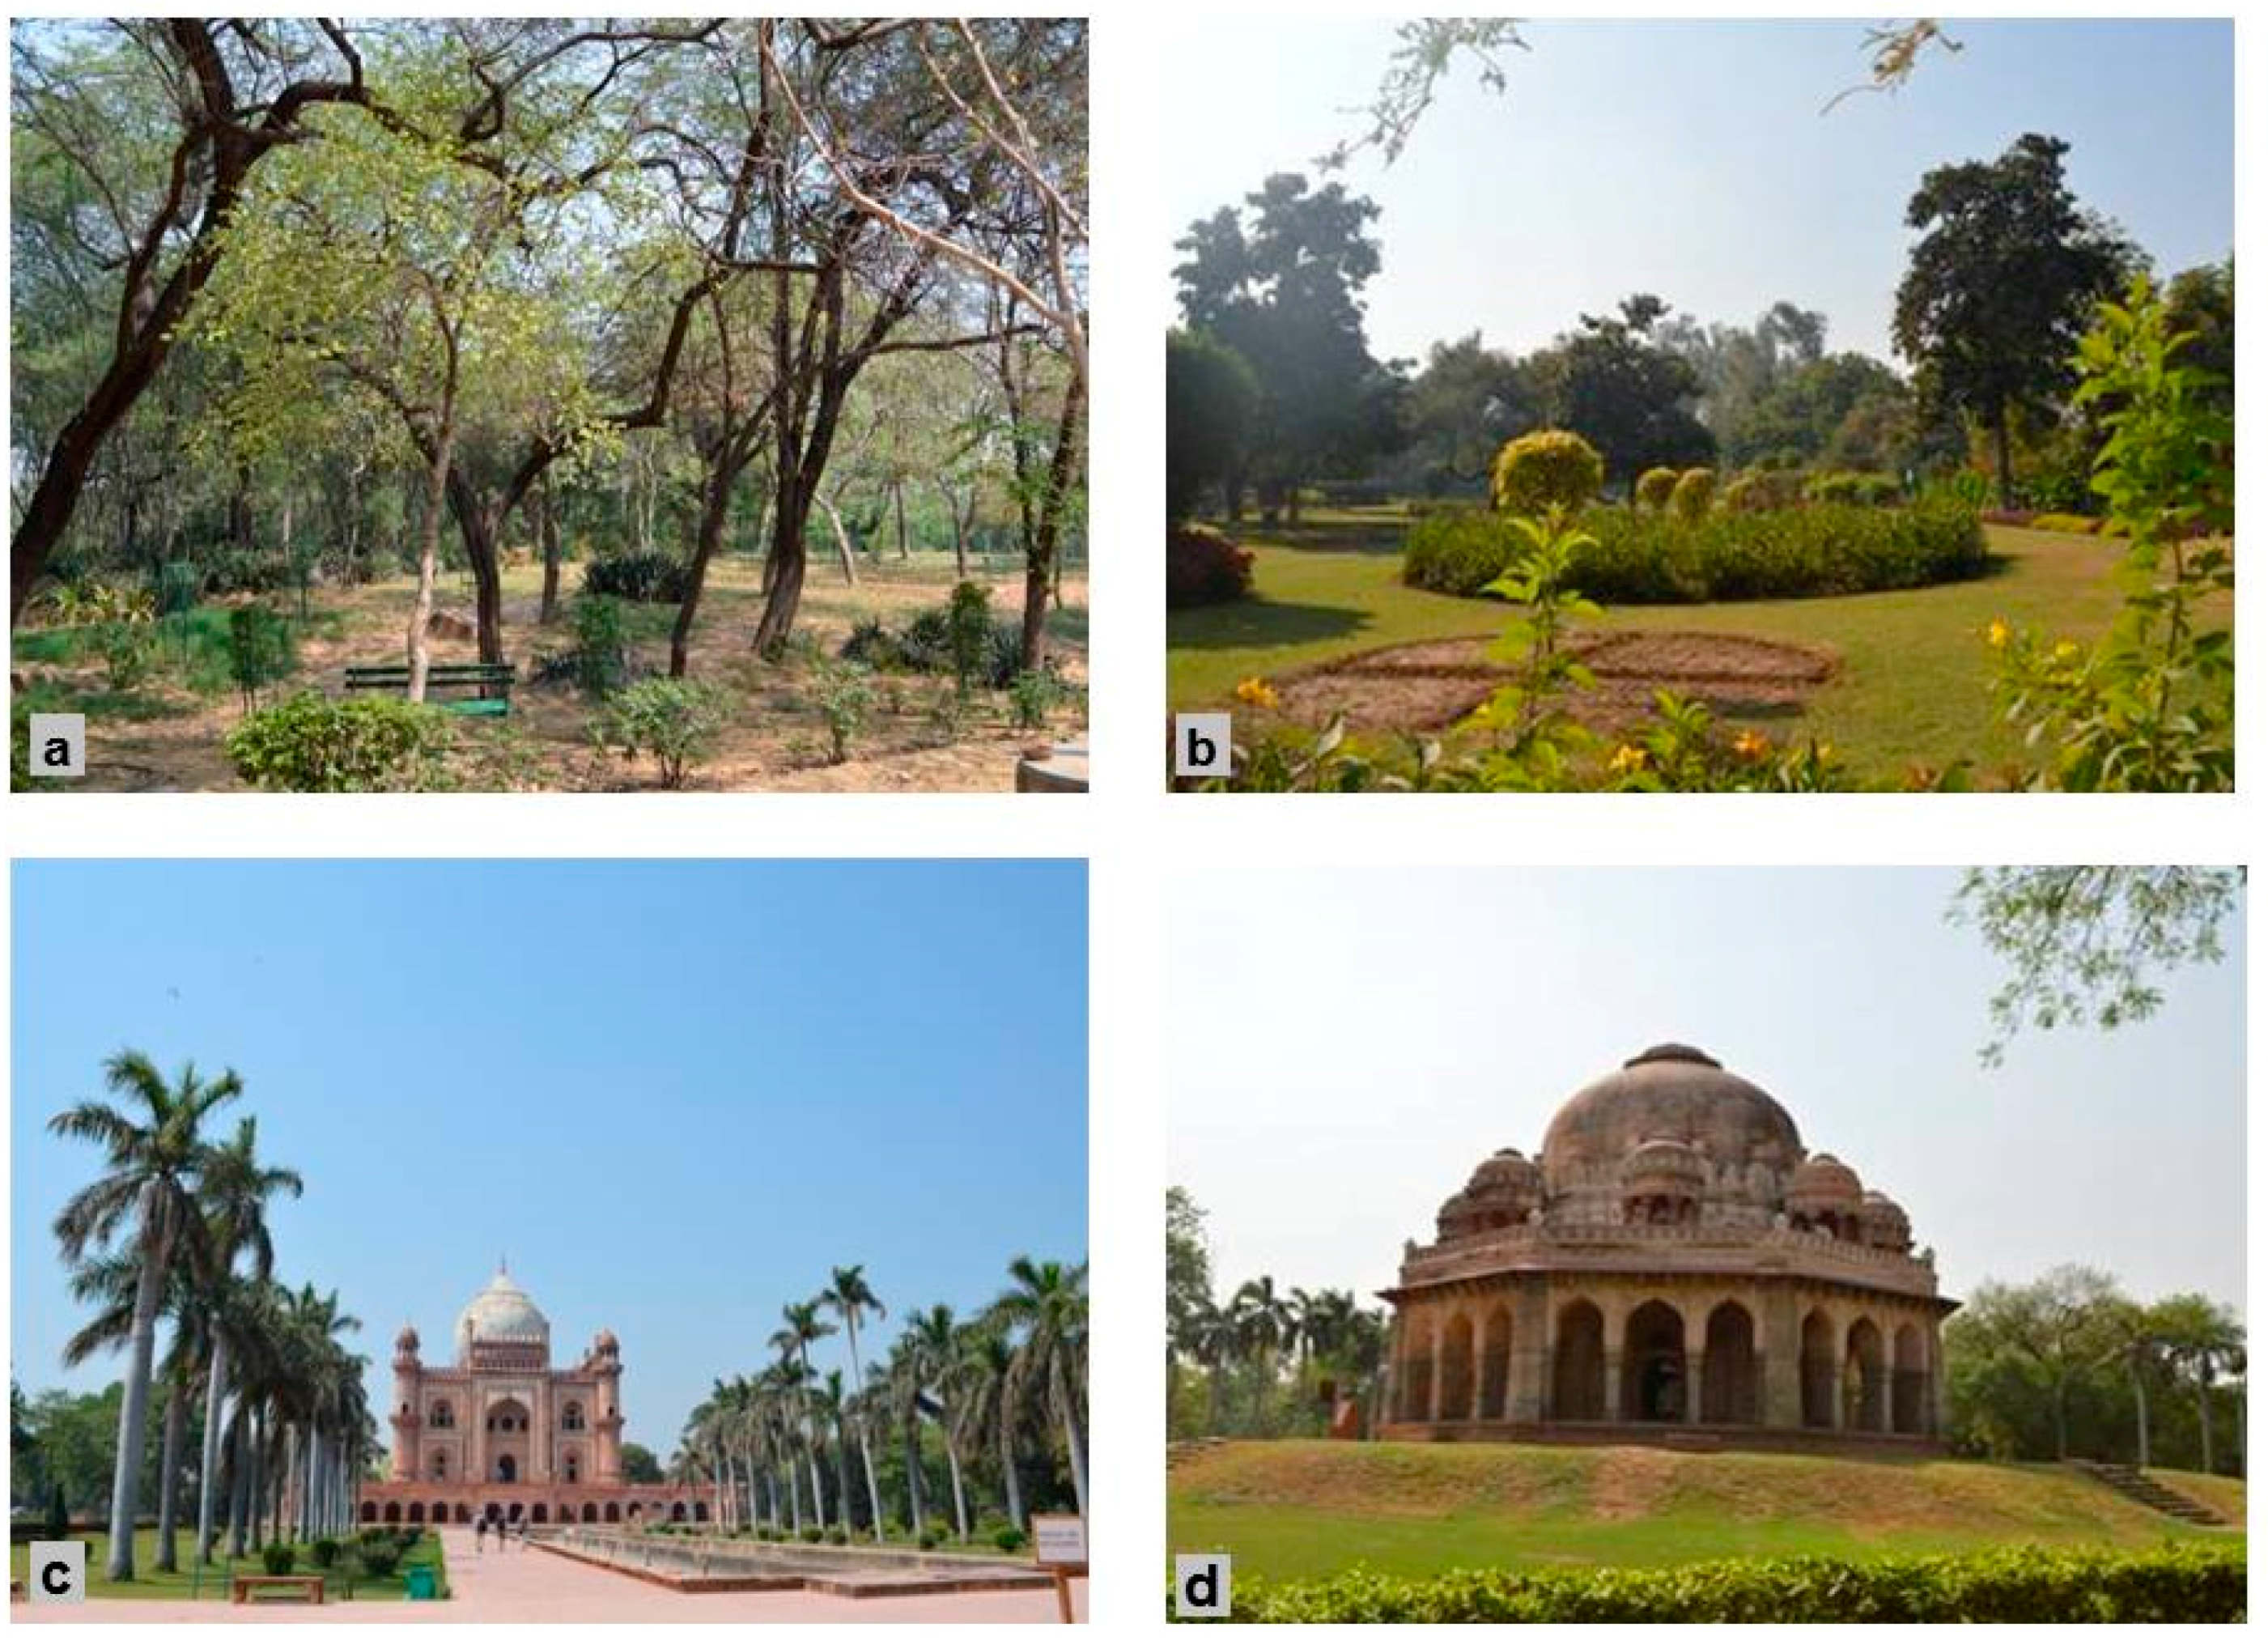
Figure 3.
The organization chart of the four parks under study: (a) Bhuli Bhatiyari Park; (b) Buddha Jayanti Smarak Park; (c) Safdarjung’s Tomb; and (d) Lodhi Garden. Arrows point at higher officials in the hierarchy.
Figure 3.
The organization chart of the four parks under study: (a) Bhuli Bhatiyari Park; (b) Buddha Jayanti Smarak Park; (c) Safdarjung’s Tomb; and (d) Lodhi Garden. Arrows point at higher officials in the hierarchy.
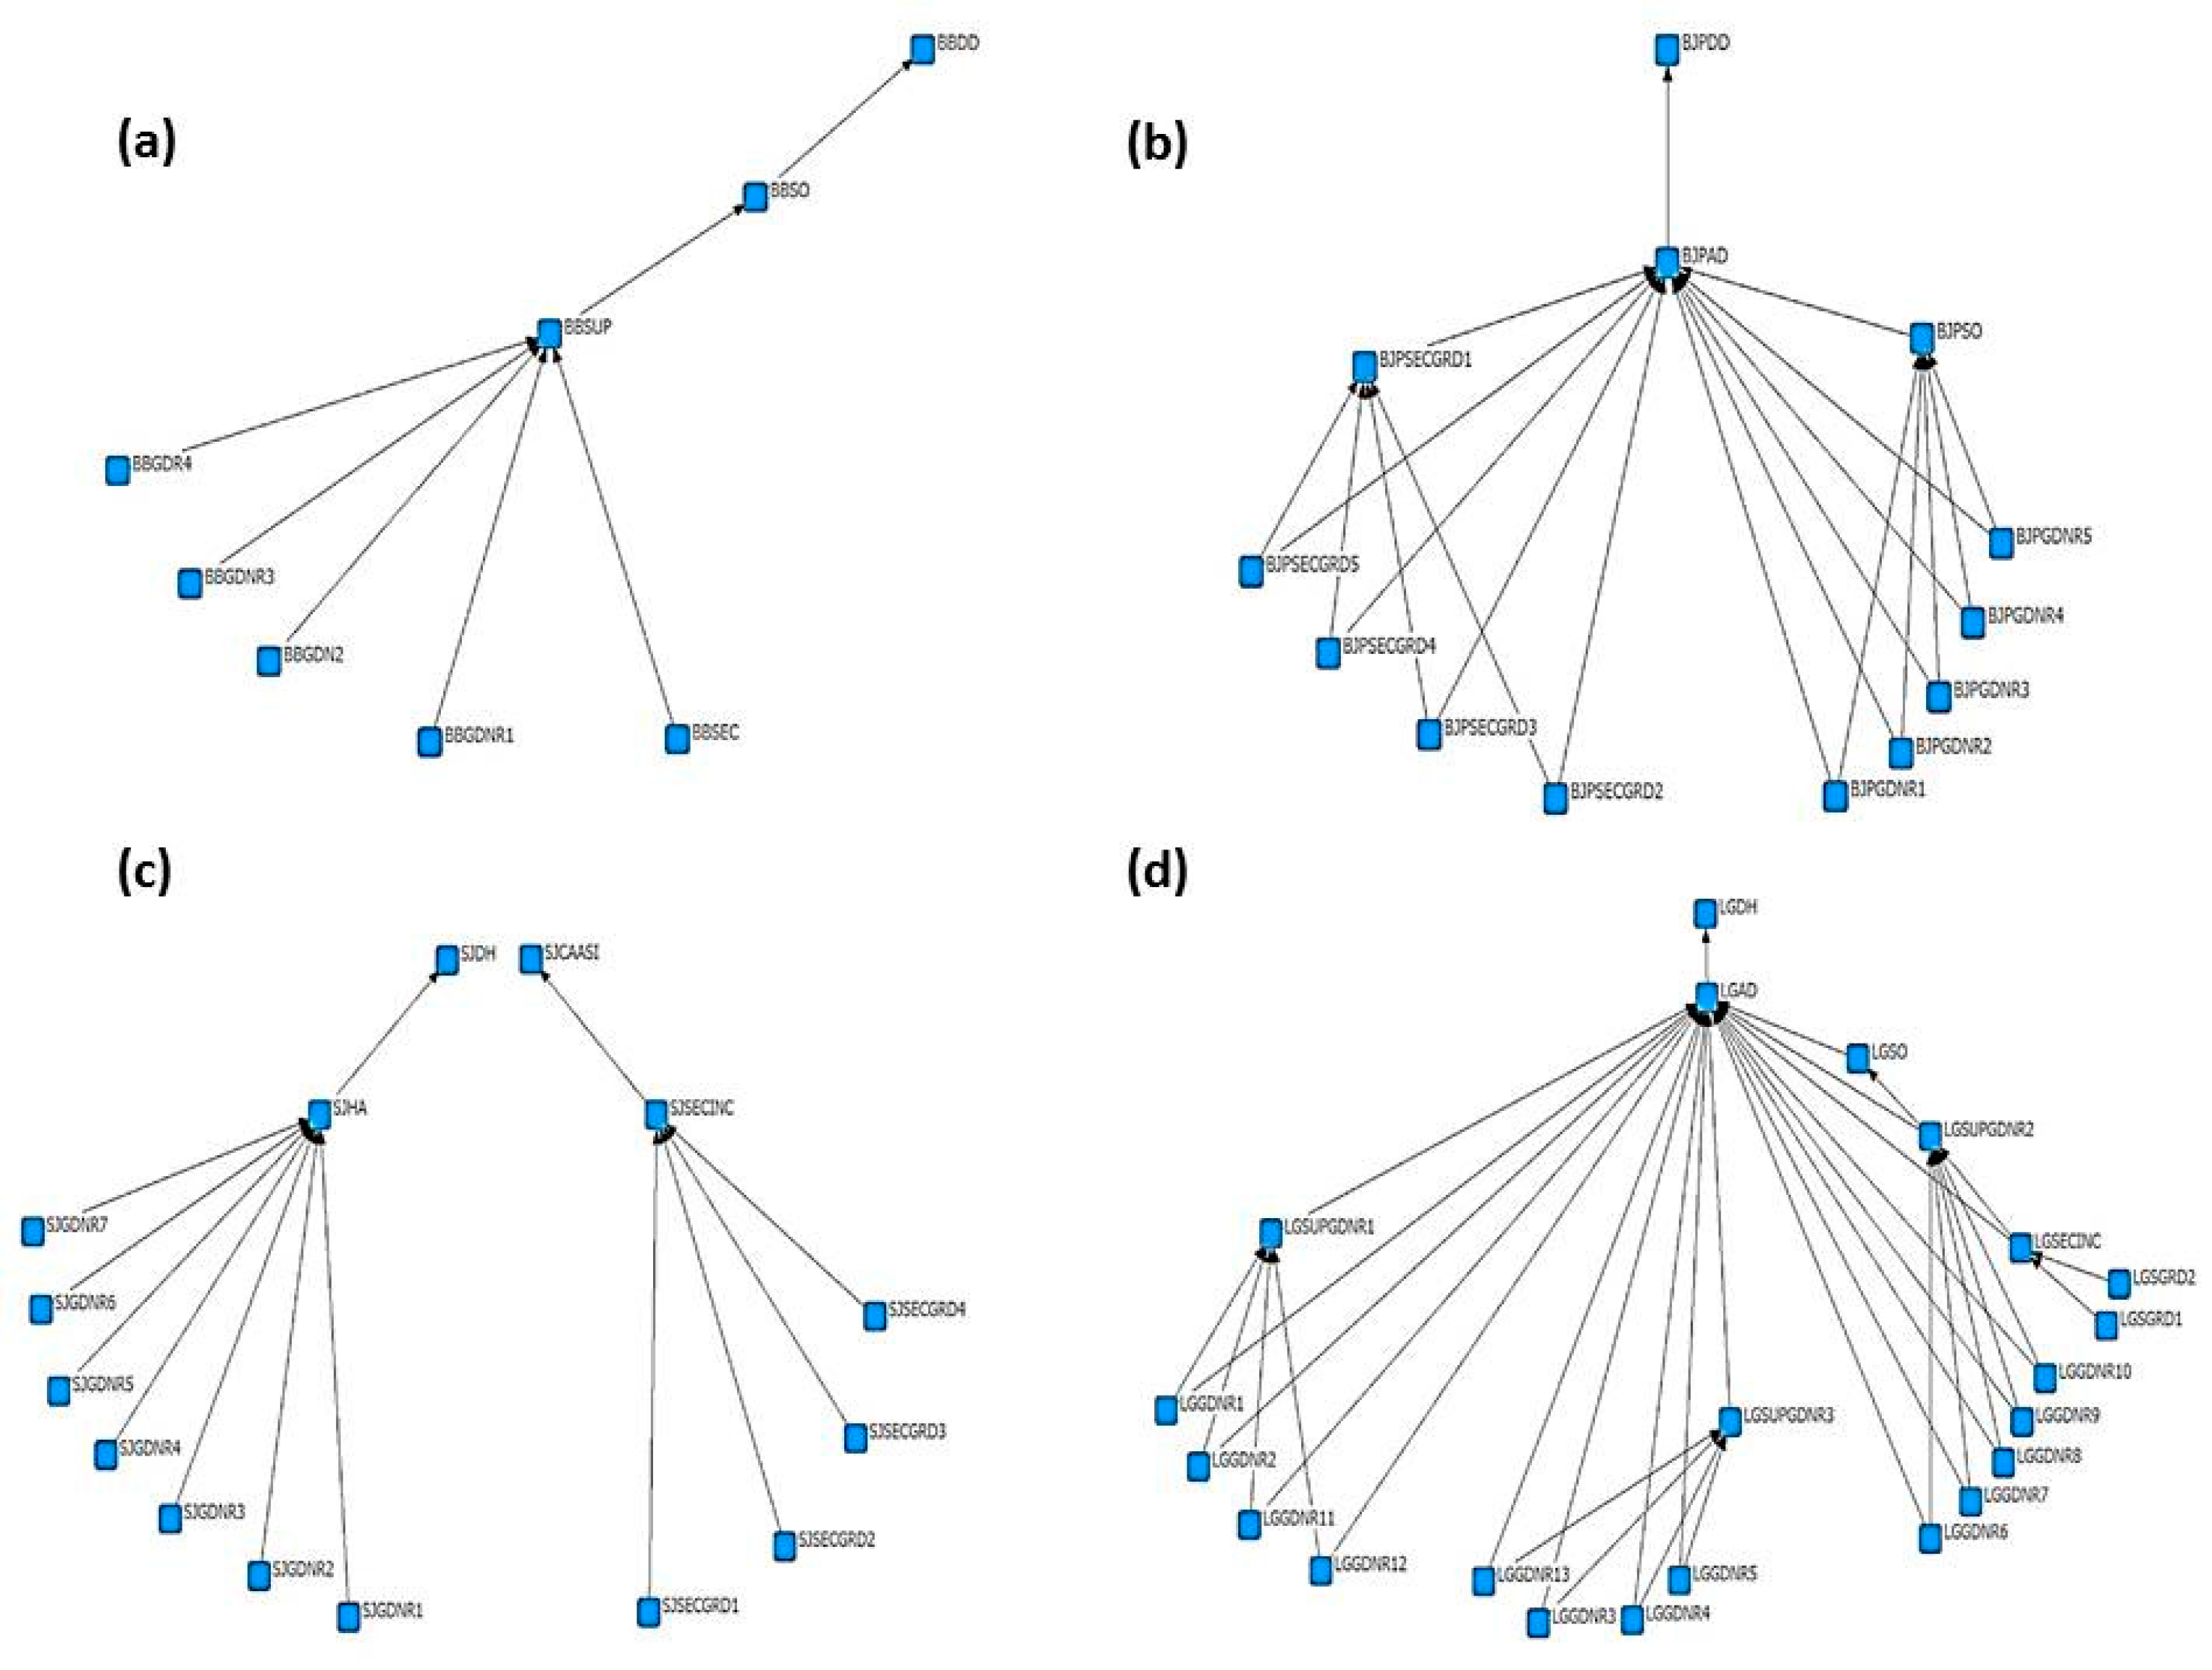
Figure 4.
Relation between center of gravity (CG) and the average satisfaction of the park keepers.
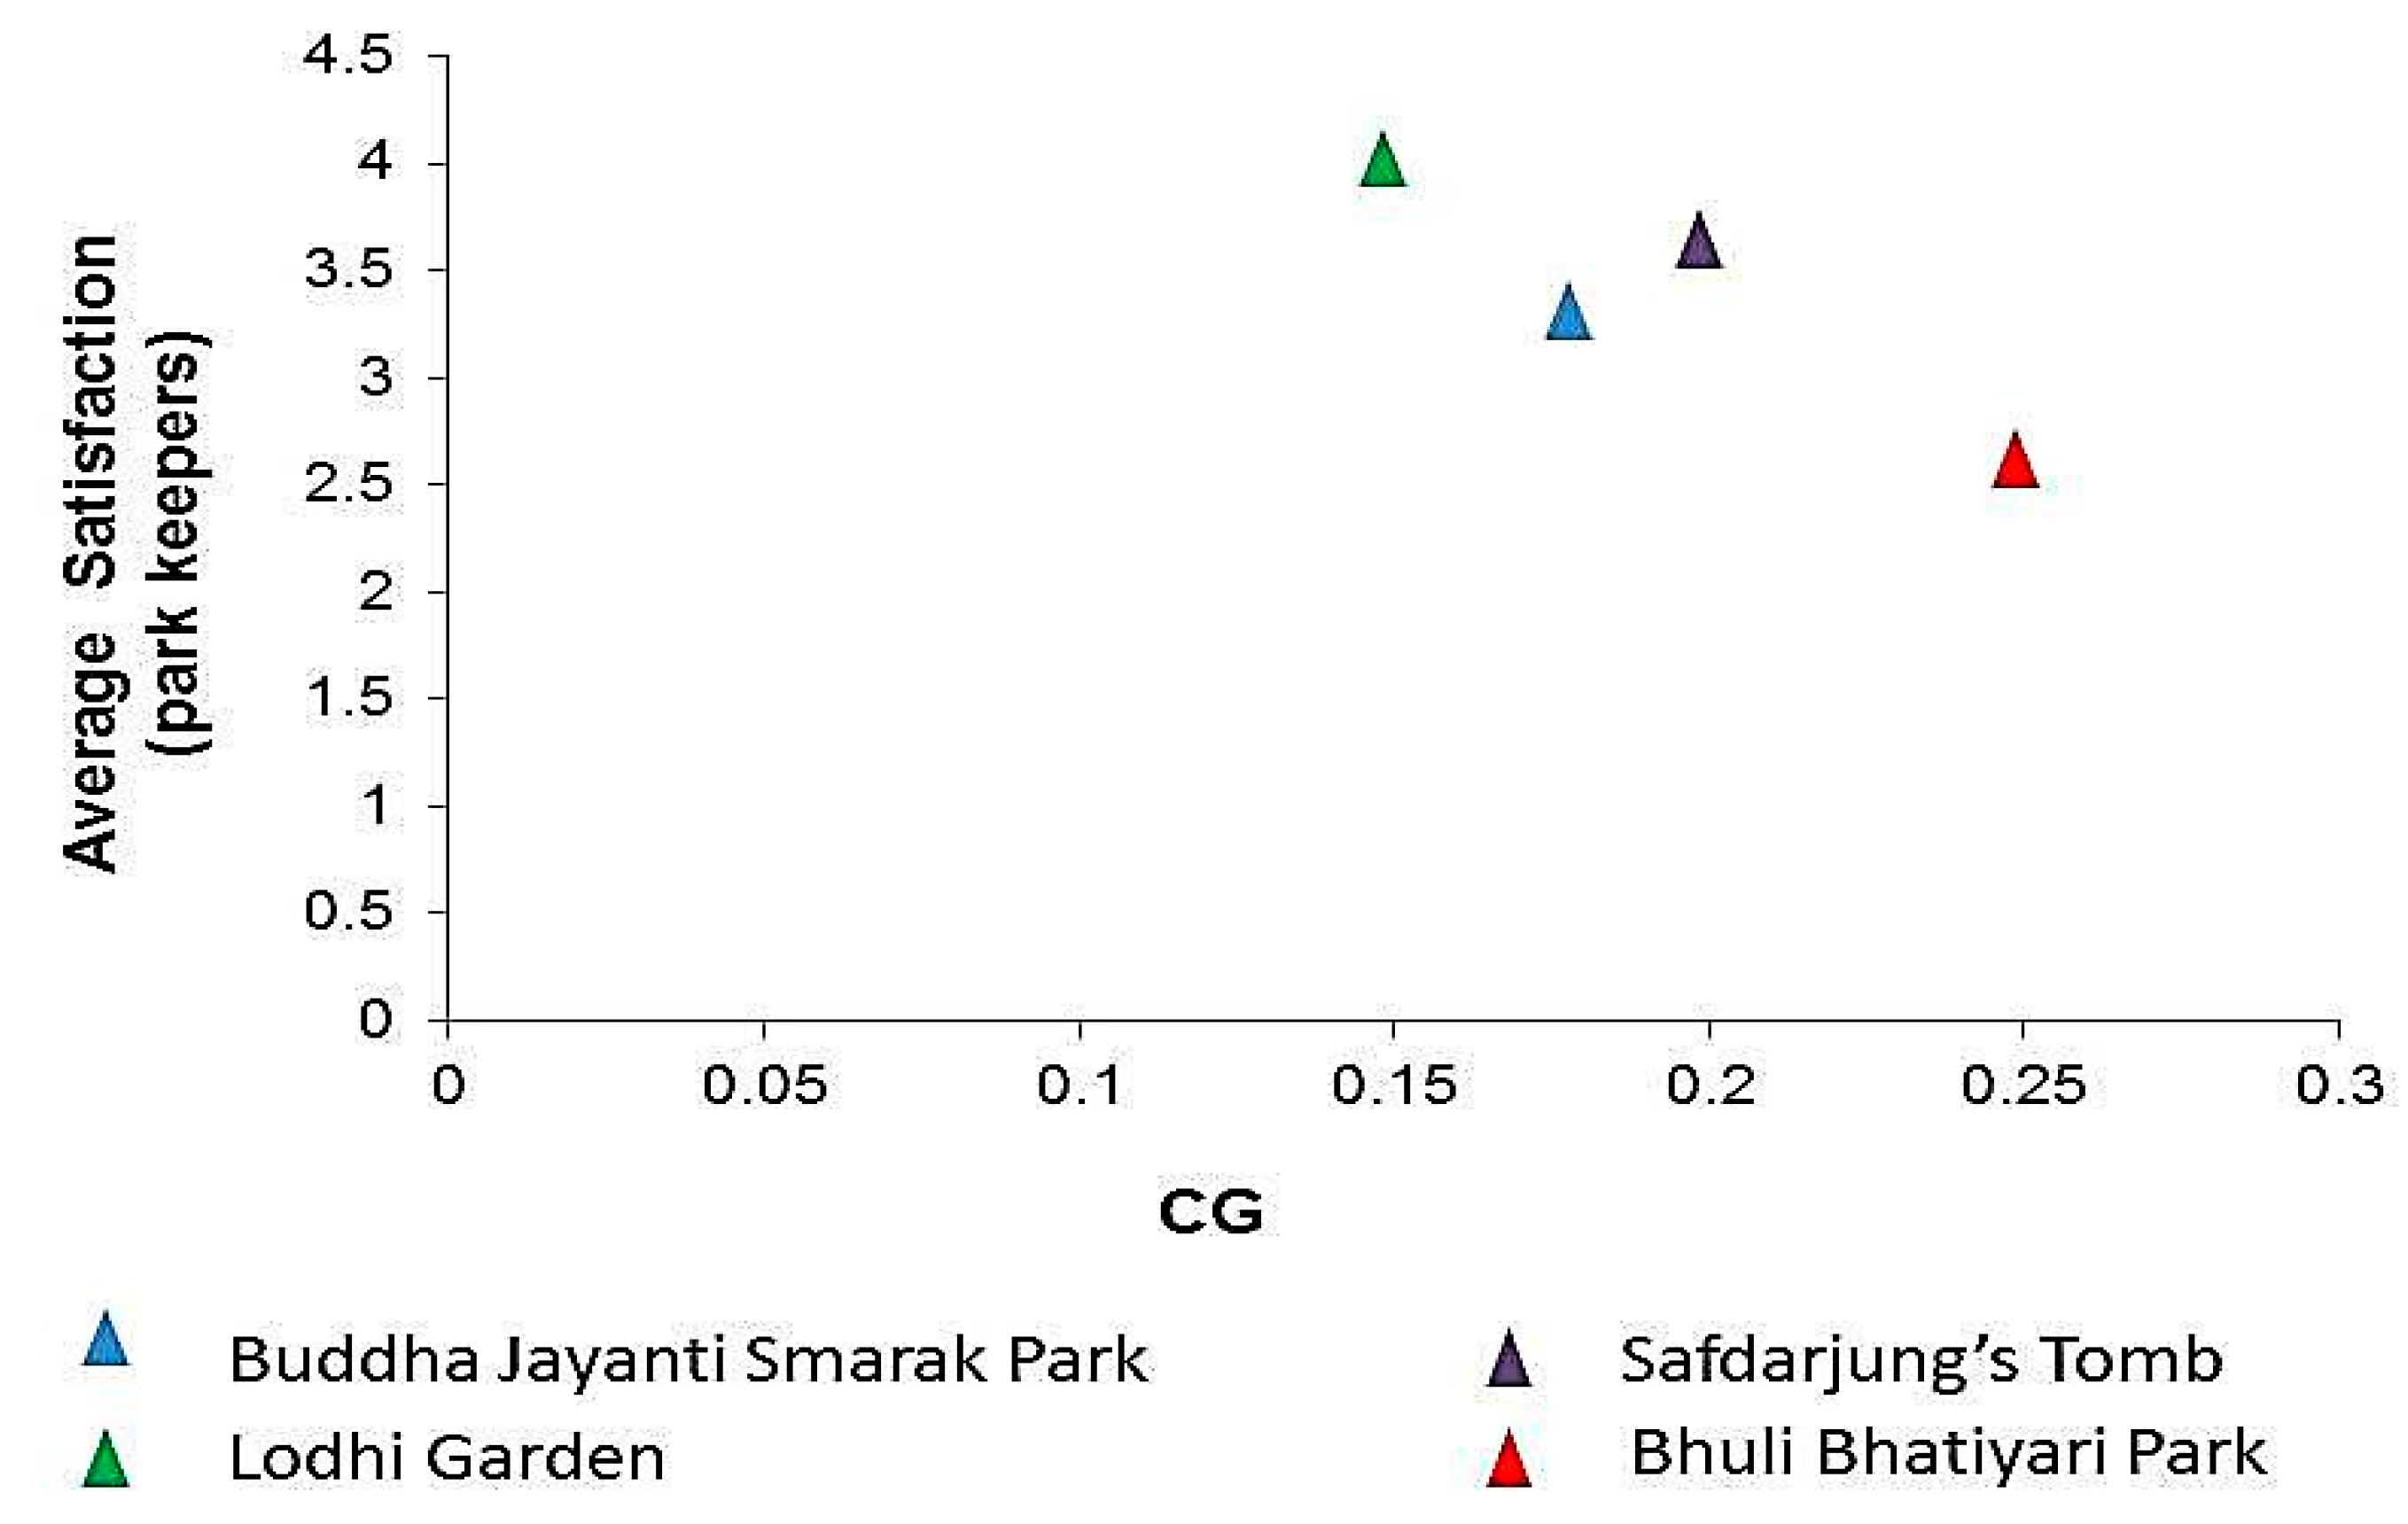
Figure 5.
Relation between MaxS and the median expected improvement by the park visitors.

Figure 6.
Relation between compactness and the average number of species identified by the park visitors.
Figure 6.
Relation between compactness and the average number of species identified by the park visitors.
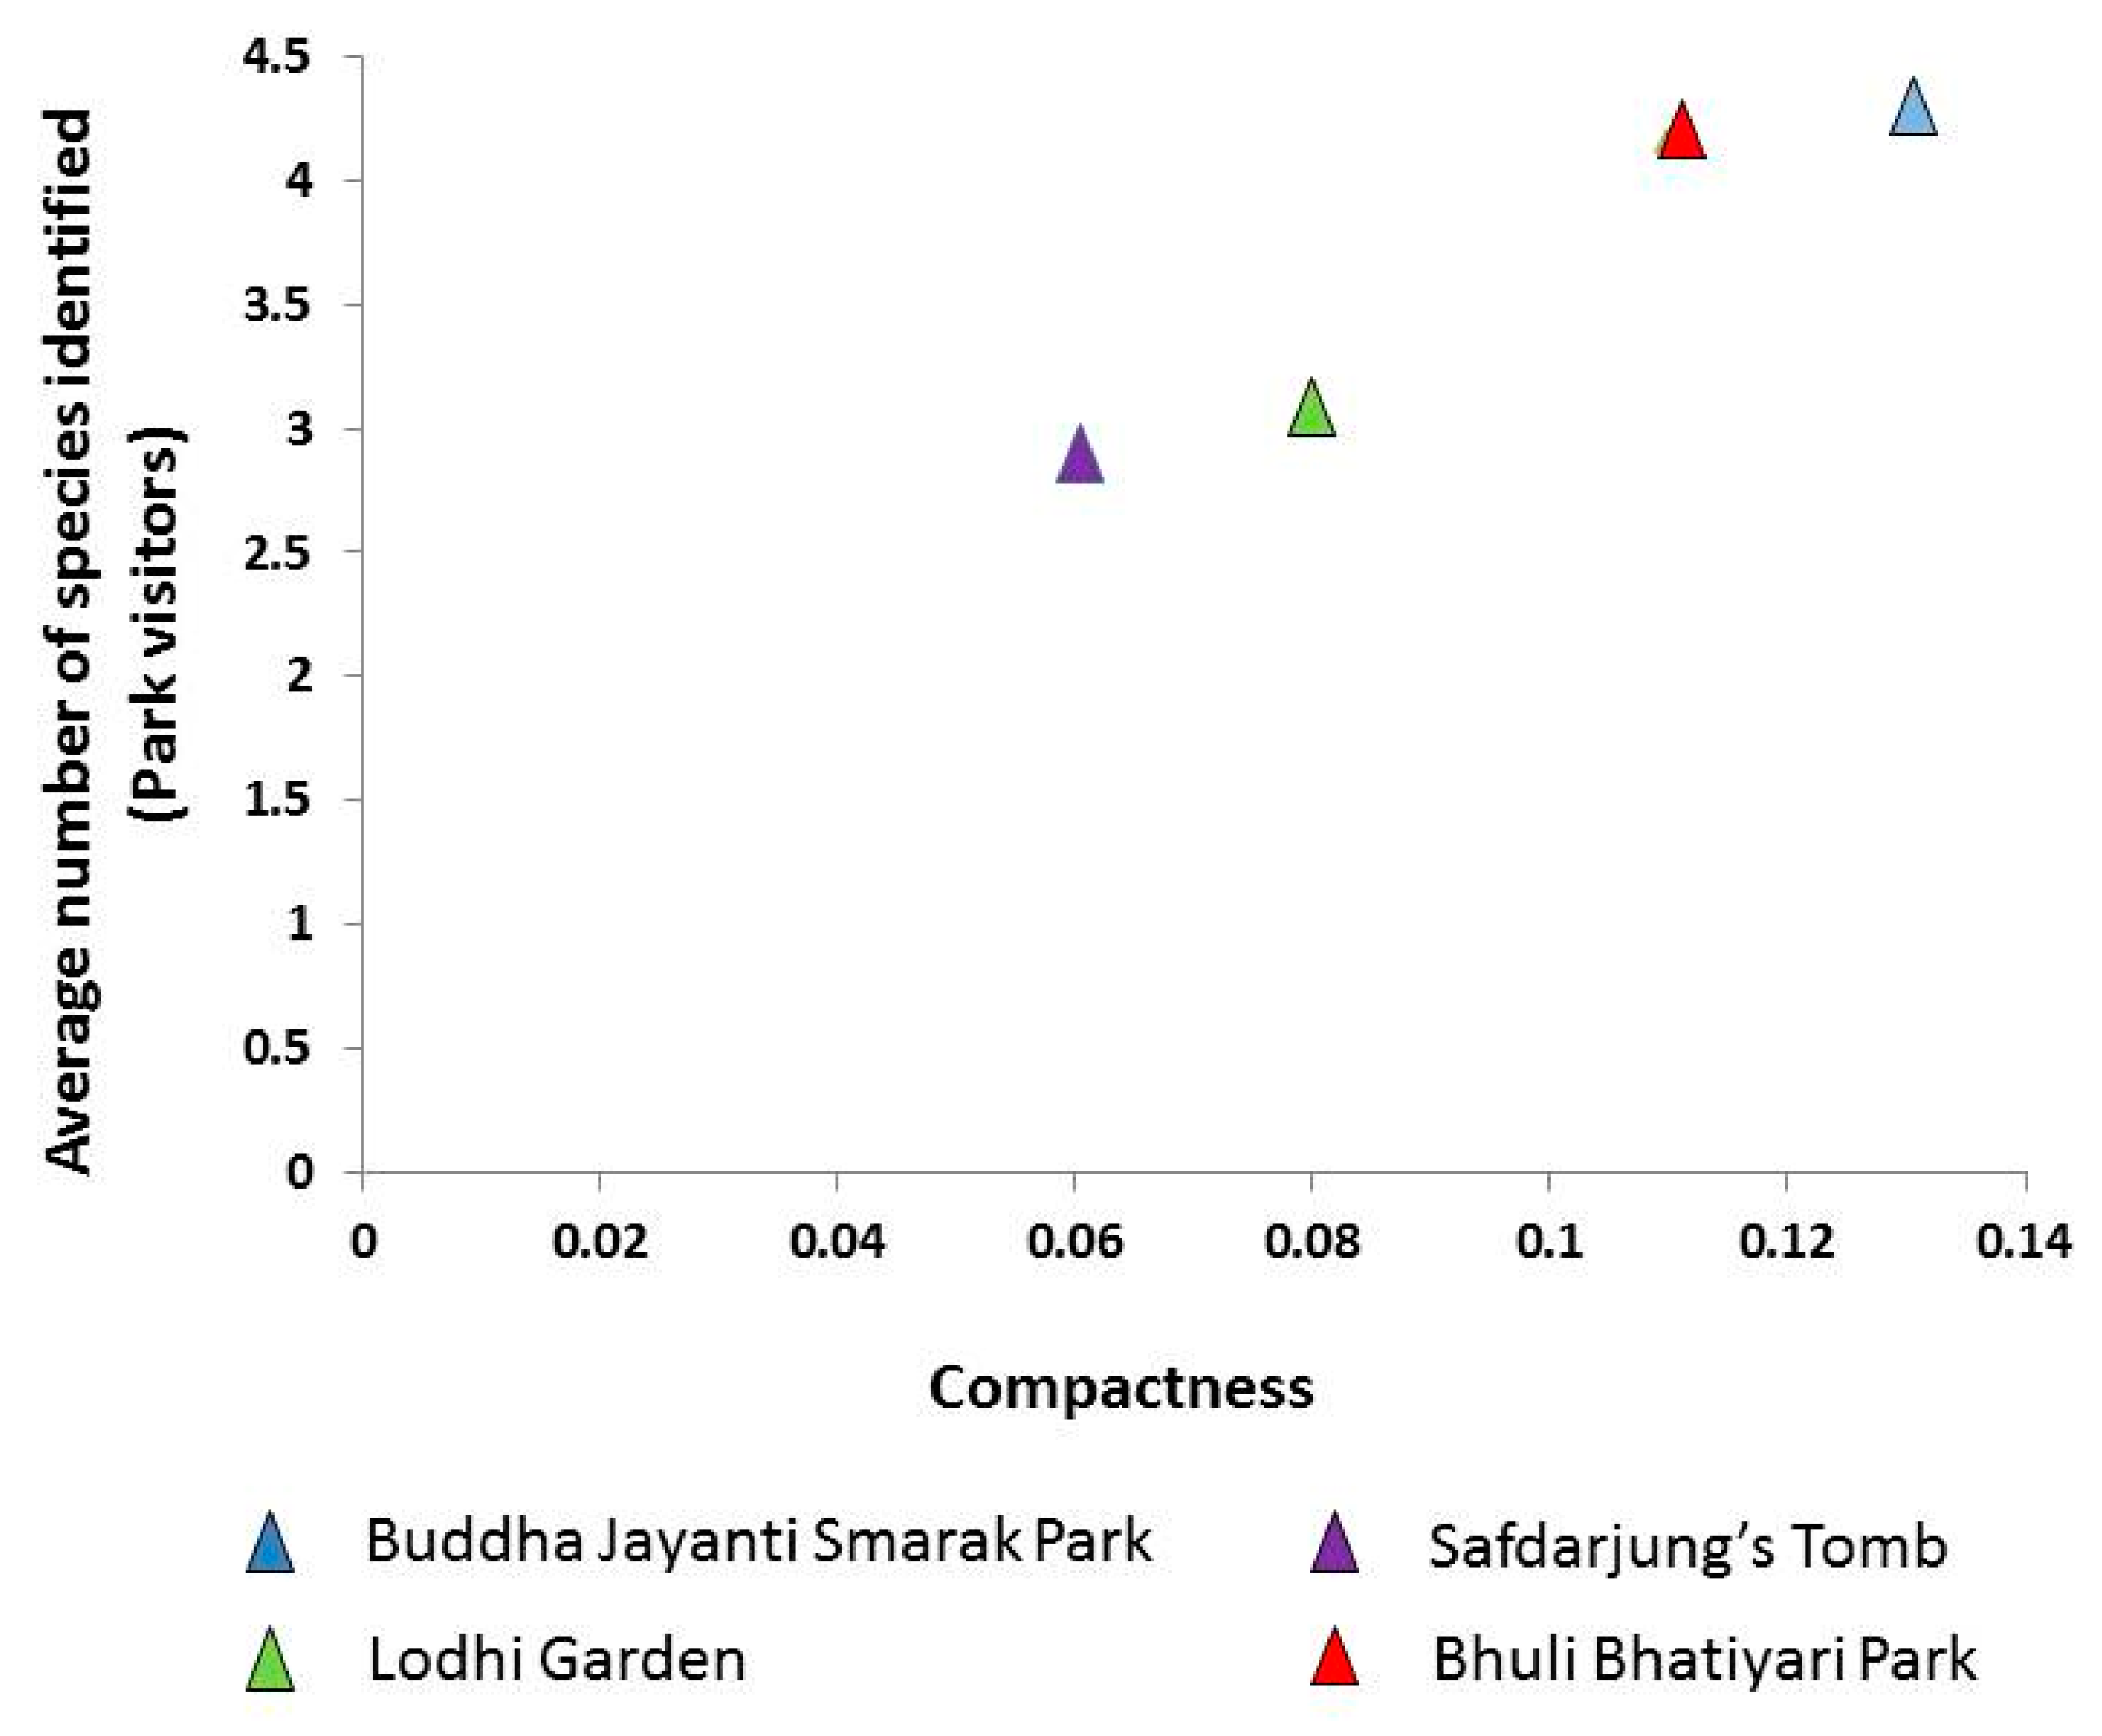
Table 1.
Network indices of parks.
| Parks | Network Indices | ||||
|---|---|---|---|---|---|
| Nodes | Links | CG | MaxS | Compactness | |
| BBP | 8 | 7 | 0.25 | 6 | 0.11 |
| BJSP | 13 | 21 | 0.18 | 4 | 0.13 |
| ST | 15 | 13 | 0.2 | 3 | 0.06 |
| LG | 22 | 36 | 0.15 | 11 | 0.08 |
Table 2.
Performance indicators of parks.
| Parks | Park Keepers | Park Visitors | ||
|---|---|---|---|---|
| Average Satisfaction | Median Problems | Median Expected Improvements | Average Number of Species Identified | |
| BBP | 2.57 | 3 | 3 | 4.16 |
| BJSP | 3.25 | 2 | 3 | 4.27 |
| ST | 3.62 | 2 | 4 | 2.84 |
| LG | 4 | 2 | 2 | 3.03 |
| p value (ANOVA) | <0.0001 * | 0.40 | <0.001 * | 0.04 |
* p < 0.01.
Table 3.
Performance indicators of parks.
| Network Indices | Performance Indicators | R2 Value | p Value | |
|---|---|---|---|---|
| CG | Park keepers | Average satisfaction | 0.81 | 0.04 * |
| Median problems | 0.76 | 0.06 | ||
| Park visitors | Median expected improvement | 0.23 | 025 | |
| Average number of species identified | 0.20 | 0.27 | ||
| MaxS | Park keepers | Average satisfaction | 0.16 | 0.29 |
| Median problems | 0 | 0.50 | ||
| Park visitors | Median expected improvement | 0.84 | 0.04 * | |
| Average number of species identified | 0.05 | 0.29 | ||
| Compactness | Park keepers | Average satisfaction | 0.36 | 0.05 |
| Median problems | 0.10 | 0.33 | ||
| Park visitors | Median expected improvement | 0.35 | 0.20 | |
| Average number of species identified | 0.93 | 0.02 * | ||
* p < 0.05.
© 2017 by the authors. Licensee MDPI, Basel, Switzerland. This article is an open access article distributed under the terms and conditions of the Creative Commons Attribution (CC BY) license (http://creativecommons.org/licenses/by/4.0/).
Share and Cite
MDPI and ACS Style
Paul, S.; Jordán, F.; Nagendra, H. Communication Networks and Performance of Four New Delhi City Parks. Sustainability 2017, 9, 1551. https://doi.org/10.3390/su9091551
AMA Style
Paul S, Jordán F, Nagendra H. Communication Networks and Performance of Four New Delhi City Parks. Sustainability. 2017; 9(9):1551. https://doi.org/10.3390/su9091551
Chicago/Turabian StylePaul, Somajita, Ferenc Jordán, and Harini Nagendra. 2017. "Communication Networks and Performance of Four New Delhi City Parks" Sustainability 9, no. 9: 1551. https://doi.org/10.3390/su9091551
Note that from the first issue of 2016, this journal uses article numbers instead of page numbers. See further details here.