Spatial Equity Measure on Urban Ecological Space Layout Based on Accessibility of Socially Vulnerable Groups—A Case Study of Changting, China


1
School of Geographic and Oceanographic Sciences, Nanjing University, Nanjing 210093, China
2
Nanjing Engineering Consulting Center, Nanjing 210005, China
3
School of Architecture and Urban Planning, Nanjing University, Nanjing 210093, China
4
Key Laboratory of Regional Sustainable Development Modeling, Chinese Academy of Sciences, Beijing 100101, China
5
Institute of Geographical Sciences and Natural Resources Research, Chinese Academy of Sciences, Beijing 100101, China
*
Authors to whom correspondence should be addressed.
Sustainability 2017, 9(9), 1552; https://doi.org/10.3390/su9091552
Submission received: 1 August 2017
/
Revised: 25 August 2017
/
Accepted: 28 August 2017
/
Published: 31 August 2017
Abstract
:The improper layout of urban public parks leads to the difference between citizens sharing or not sharing this kind of public resource, particularly in the historical districts of mountainous cities in China. The purpose of this study is to explore the spatial equity and quantitative measures of urban public parks’ layouts by building a demand index of socially vulnerable groups sharing public parks based on the accessibility evaluation model. In this paper, Changting—a famous national historical and cultural city—is taken as the empirical object, then the accessibility and social equity of public parks is quantitatively measured with the aid of the field investigation method, the spatial analysis model of geographic information system (GIS) and the SPSS statistical analysis method. The results indicate that it is feasible to measure the spatial equity of urban public parks with the accessibility and demand index of socially vulnerable groups, and it can effectively characterize the rationality and social equity of urban ecological space. It shows that a degree of spatial mismatch exists between the distribution of urban public parks and that of residents, that is to say the spatial distribution of public parks is not equitable in terms of accessibility or residents’ demands. Therefore, the data suggest that the spatial patterns and accessibility levels of parks in Changting County—especially the historical districts—should be further improved and perfected to achieve high levels of accessibility and equity through urban green space system planning. The paper may be used as a scientific reference for the planning and construction of ecological urban spaces. It can also provide useful decision-making guidance for urban planners in investigating, analyzing, and adjusting the distribution of public service facilities to achieve equitable outcomes, while promoting the harmonious and sustainable development of mountainous cities.
1. Introduction
The term “equity” is originally derived from social science and represents one of the core contents of the “urban sustainable development” concept [1]. Social equity refers to the distribution of public services, especially “popular services” such as parks, schools and so on, which should be allocated among different space units and different economic, racial and political groups in an equitable manner with special considerations made for the needs of special groups [1,2,3]. The allocation of social resources should reflect equity in time and space; namely, it denotes intergenerational and intra-generational equity among different groups [4,5]. Adherence to social equity ideals represents the objective of the social value orientation. In a spatial context, the term could be defined and measured in numerous ways [6]. For some researchers, spatial equity simply involves providing equal access to basic public service facilities as measured by distance [7]. The definition of equity in relation to service distribution applied in this paper includes two aspects as follows: (1) horizontal equity (equality), in which everyone receives the same public benefit following the concept of social equity; (2) vertical equity, based on the different ability and demand of various social groups, whereby the specific socially vulnerable groups receive disproportionately more benefits [8]. Talen argued that spatial equity involves considering needs, fairness and justice in the distribution of public service facilities [9]. Overall, the term ‘spatial equity’ just focuses on the service level difference among a region’s public facilities while, the term ‘social equity’ pays more attention to the “spatial match” between the service level of public facilities and the distribution of the resident population.
Equity measure was generally calculated by the accessibility index using GIS to express the distance to and the cost people spent at (location of space unit mostly used) the facilities [9]. Therefore, the accessibility difference of space units (smaller scale such as street, neighborhood, etc.) becomes the important index for the evaluation of spatial equity. Empirical research on the notion of equity in public service distribution focuses on defining and measuring equity and determining causal factors involved in the distribution of public service facilities [10]. Urban ecological space is mainly composed of forest land and waters that have the important ecological service function of natural conservation, relaxation and vacation, forest protection, ecological protection and so on. It plays an important role in maintaining healthy and comfortable regional ecological environments, as well as the survival of mankind in urban areas [11]. The social service function of public parks can be partly measured based on how easily (especially with respect to reaching nearby parks by walking) and equally residents can access and benefit from such space, and this is also an important indicator for measuring residents’ quality of life. Therefore, urban public parks’ layouts should be designed to support equitable and efficient supply of green space. In other words, this limited resource should be maximized so that individuals of all social hierarchies may enjoy equal access [1]. However, while previous research has examined indicators such as per capita public green space and green space ratios for evaluating the service function of public parks, the literature has focused less on public parks’ spatial equity. What’s more, urban public parks as an ecological space agent for urban residents’ recreation, their spatial layout equity denotes a situation where residents of a planning area can access parks’ services regardless of socioeconomic status, desire, demand, population distribution and other factors. The term also emphasizes equal accessibility to urban parks for residents from different geographic locations.
The equity studies of public service abroad experienced three stages including regional equality, spatial equity and social equity. An abundance of previous research has been conducted on spatial equity. The research objects focused on various types of public facilities such as commercial service facilities [12], health care facilities [13,14], education facilities [15], cultural facilities [16], parks [17,18,19,20,21], sports facilities [22] and other service facilities [23,24]. While in China, with the issuing of new urban planning establishment means by the Ministry of Construction at the end of 2005, the maintenance of social equity had started to be recognized as an important guiding principle, and especially in reference to the interests of low-income groups and socially vulnerable groups. Spatial equity studies on urban public service facilities are still in the initial stages in China and have mainly been focused on the fields of health care [25,26,27] and education [28]. The evaluation methods that are most commonly used in this line of research include range analysis, the Lorenz curve approach, the Gini coefficient method, the GIS spatial analysis method, etc. Urban public parks as the most important ecological space have developed into a special kind of public service facilities, and with significant attention being paid to social equity in western human geography, the accessibility and social equity of public parks is increasingly becoming a hot topic for academic discussion. Research conducted abroad has tended to focus on the socioeconomic attributes of a population and then analyzed differences in green space supply among different social groups based on single, multiple or comprehensive factors [1]. Lindsey [29] and Zhang Yangjian [30] studied comprehensive factors that reflected the socio-economic status (SES) of groups to study the social equity of green space and found that the high-income, white and highly educated groups living in top communities enjoyed more green space, while socially vulnerable groups, such as the blue-collar, ethnic minority, and low-income groups living in bottom communities, enjoyed less green space. Gentrification is a form of urban renewal. It actually means that the high trend of the urban central community from the residents to the corresponding material conditions and environment. The potential negative externalities on the improvement of urban parks in deprived neighbourhoods was studied in western countries. Several authors showed in different urban contexts how the provision of new urban parks have fuelled displacement and gentrification processes (what has been called “green gentrification”) [31]. Therefore, many public service facilities and consumer facilities (including parks) that serve for the high income groups enter the community through the process of urban gentrification. However, spatial equity research on public parks in China is still in its infancy [32,33,34,35]. The previous literature discussed the spatial equity layout of urban parks. More attention is paid to the equity of parks’ accessibility and supply and demand matching between different communities for vulnerable groups such as the elderly in China. Some studies focus that the ultimate goal is to have the same accessibility of minority groups and non-minority groups in the community, and even to provide a higher level of accessibility for low-income residents in spatial distribution in western countries [9]. However, the previous literature mainly focuses on the parks’ accessibility and the socio-economic status of groups—few studies have comprehensively evaluated the spatial equity of urban parks through studying accessibility and demand indexes from the perspective of residents’ demands. Fewer scholars studied whether the blocks with higher accessibility are also the blocks that are relatively concentrated with higher demand groups, or whether the blocks with a high proportion of vulnerable groups such as children, the elderly and low-income groups have higher accessibility.
As for thoughts on ecological civilization construction—ecological civilization is based on natural respect and protection, takes the harmonious symbiosis among human-human, human-nature, human-society as its purpose, establishing sustainable production and consumption patterns as its content, and focusing on guiding people to get on sustainable and harmonious development path [36]—ecological city and sustainable development concepts are becoming more and more embedded deeply into the hearts of people, the research on spatial layout equity of public parks which are special public service facilities is receiving the extensive attention of academic circles at home and abroad. With the rapid process of urbanization, income gaps among different social groups is widening in mountainous cities. Especially in old towns, lots of typical problems exist including higher population density, poor landscape environment of traditional old districts, concentration of the weak and old groups, and scarce community parks. The improper layout of urban public parks leads to a difference among citizens ability to share in this kind of public resource, and the inequity of park layouts is a common problem, particularly in historical districts of mountainous cities in China. Therefore, it is very meaningful to explore the social equity of urban ecological space layouts. In order to illustrate the concept of “people-orientation” and “social equity” in the context of urban construction, this paper takes the central urban area of Changting, which is a thousand-year-old ancient city in western Fujian, as the empirical object and studies the spatial equity issues of urban public parks based on the accessibility evaluation and the socially vulnerable groups demand index. It is a great challenge to arrange urban public parks reasonably within the limited urban construction land-use in Changting. Furthermore, we want to know whether the communities with a high level of accessibility are the communities where high-demand groups are also relatively concentrated, and whether the communities with a high proportion of socially vulnerable groups, such as children, the elderly and low-income groups have a higher level of accessibility. This paper intends to introduce the accessibility of public parks for vulnerable groups as the touchstone to test the spatial distribution equity and rationality of urban ecological spaces. Moreover, the paper will provide a scientific and feasible reference for urban public parks planning practices, to achieve the spatial equity of different social groups and social spaces, ease social contradictions caused by inequity, and promote the harmonious and sustainable development of mountainous cities.
2. Overview of the Study Area
The study area of the paper is the central urban area of Changting County which is a famous national, historical, and cultural city. It is located in the southwest of the Fujian Province, and it belongs to the city of Longyan (Figure 1). Changting is known as the “Hakka capital” and a famous revolutionary area (called the small red Shanghai). It became a national historic city in 1994. It is situated at the foot of mountains and beside rivers, merges the human landscape and natural landscape into an organic whole, and is honoured as “two of the most beautiful mountainous cities of China” together with the ancient city of Phoenix in the Hunan Province by the international friends Rewi Alley.
According to the sixth population census of Changting County, the population of the subdistrict community of urban districts reached nearly 80,000. The district governs six residential committees, including Dongmen Street Community, Ximen Street Community, Nanmen Street Community, Yingbei Street Community, Shuidong Street Community, and Zhongxinba Community. According to the urban landscape statistics of 2010, the green space area of built-up areas in Changting County reached 357 hectares, the greening rate was 24%, the green coverage rate for the built-up areas was 32.5%, and the per capita area of public parks reached 11.09 m2 (While in 2010, the per capita area of green space for cities is 10.66 square meters in China). The “Bulletin on China’s land greening in 2011”issued by the national greening commission office shows that the per capita area of green space for cities is 11.18 square meters in 2011, an increase of 0.52 square meters in 2010. Several parks have begun to take shape in the Tingzhou district, such as Wolong mountain park, Tashan park (also called Fangfang park), Longtan park, Changting railway station plaza, World Hakka mother plaza and Yang Chengwu martyr square (Figure 2).
3. Methodology
3.1. Sources of Data and Data Preprocessing
Graphic and statistical data were used in this study. Graphic data included a 1:5000 topographical map, a present land-use map of Changting County of 2011. Statistical data included the sixth population census data (2010) for Changting County and the distribution data of residential buildings and community conditions.
First, the present land-use map of Changting County (2011) was corrected by combining with the data from the field investigation, and then it was imported to ArcGIS software.
Second, the layers of parks, rivers, roads and residential buildings data for the central urban area of Changting were established, to produce the relatively accurate spatial vector data that could be directly manipulated through the ArcGIS software platform.
Third, the CAD files of the residential communities in the central urban area were converted to Geodatabase data, then we obtained the same geographic coordinate system as that of the existing vector data by means of registration. As a result, the GIS database of the land-use for communities was completely built.
Fourth, urban parks were selected and extracted using the SQL method on the ArcGIS platform according to the “Classification Standard of Urban Green Space (CJJ/T85-2002)”, which were prepared for further spatial and statistical analysis.
Fifth, the demographic data of the six communities were obtained from the sixth population census data of Changting County (2010). These data were used to specify the socially vulnerable group demand indices for each community.
3.2. The Technology Route
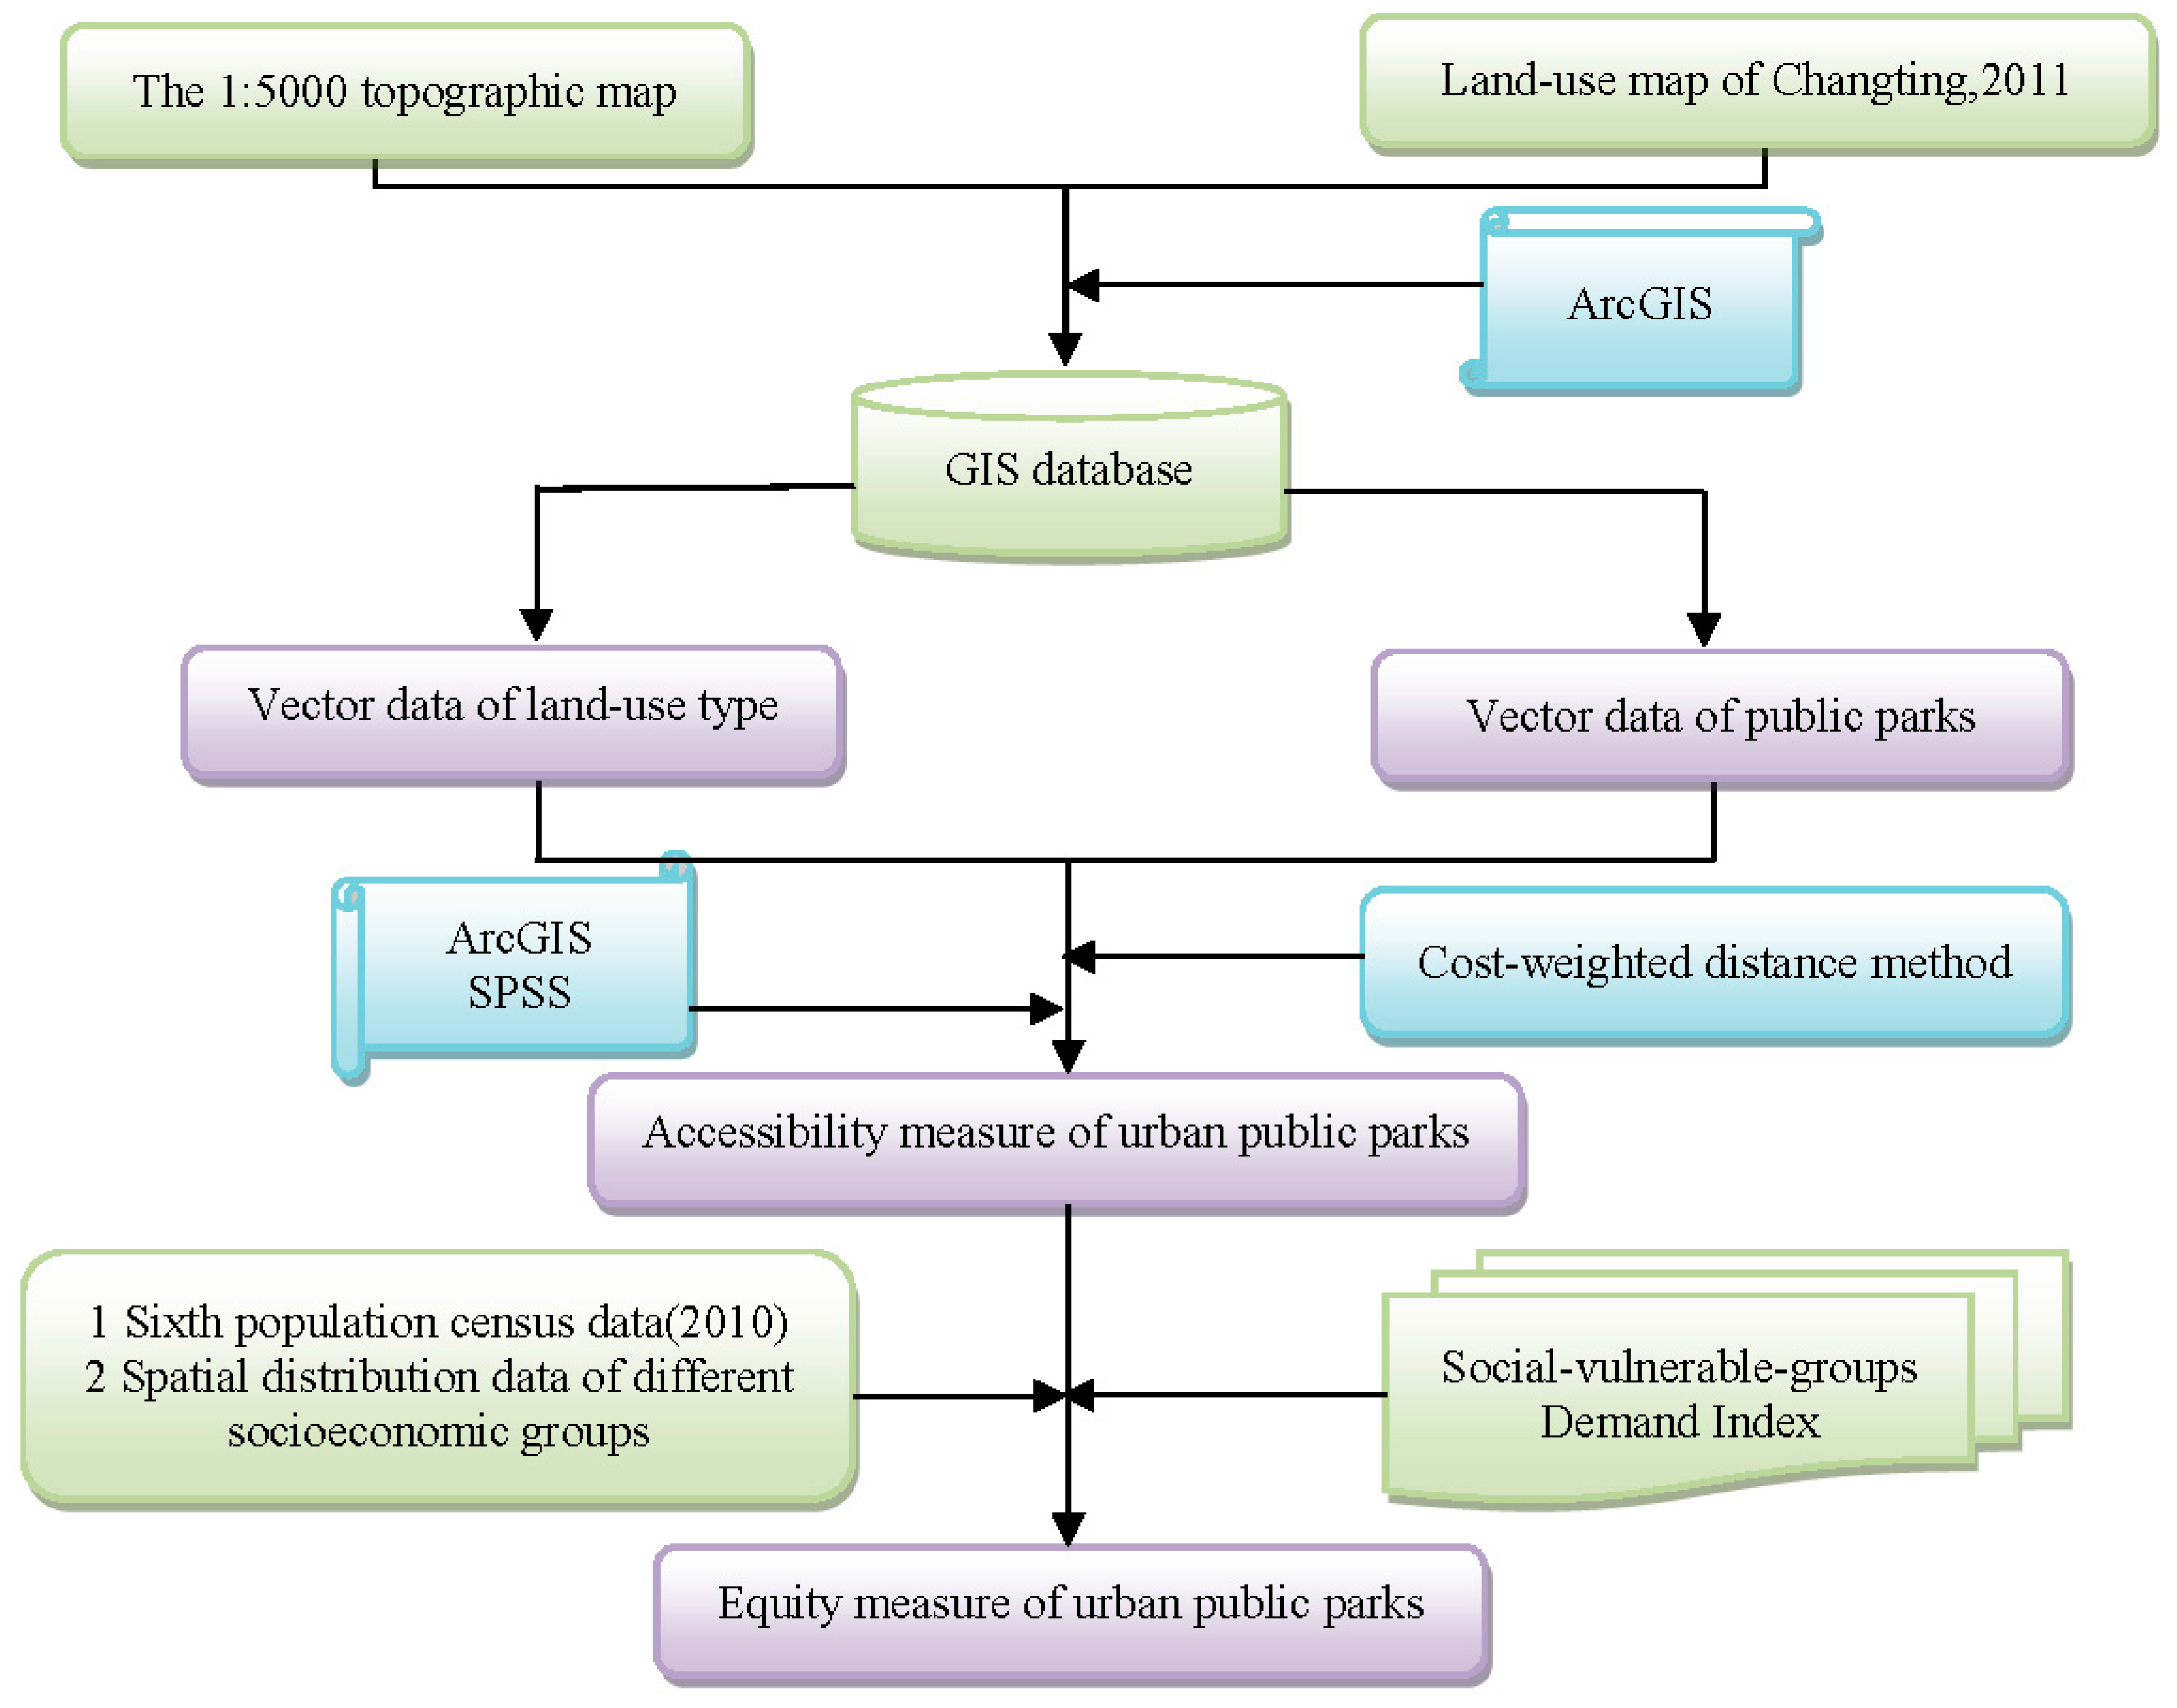
Firstly, based on ArcGIS platform and combining with the adjusted satellite images of Changting County, data on public parks, rivers, roads and residential buildings in Changting County were digitized and imported into the GIS database. Secondly, the cost-weighted distance method was applied to study the accessibility levels of public parks at the community level. What’s more, appropriate demographic indicators were normalized with the method of range-standardization to build a socially vulnerable group demand index, and the potential demand conditions of socially vulnerable groups in Changting’s communities were analyzed. Finally, based on a spatial analysis of ArcGIS software, the demand index and accessibility evaluation results were overlapped, and the results revealed park accessibility degree for groups residing in high demand areas, thus reflecting the spatial equity of public parks in Changting (Figure 3).
3.3. Measure Model of Accessibility
Accessibility of public parks, which is one important subject of urban ecological space, is defined as the relative or absolute degree of difficulty that individuals face when using a particular transportation system to overcome space resistance to urban public parks from a given location [37]. It also reflects space resistance overcome while engaging in horizontal movement to reach an urban park, and it can be expressed by measuring transportation time, costs, and levels of attraction between the original location and destination [38,39]. The accessibility of urban parks has been studied by many scholars [40,41]. Accessibility can not only be used to measure the service’s possibility or the potential of public parks to adequately provide for the public, but also be used to evaluate whether it is equitable for different populations sharing the same degree of closeness to parks in mountainous cities.
Due to the physical limitations of the vulnerable groups such as women, the disabled and the elderly, as well as the economic constraints of low-income groups, they have more requirements including better traffic conditions, more economically reasonable, and more convenient-to-use facilities. So in this study, we chose the walkway to measure accessibility level for residents getting to the nearby public parks, thus to enjoy all kinds of public services in the neighbourhood. The cost weighted distance method characterizes accessibility by calculating time or distance that residents need to walk to public parks, it fully considers the perfect degree of the road transportation networks. And it usually was conducted to analyze the accessibility [42], radiation effect and service scope of urban parks [43,44]. Based on ArcGIS spatial analytic software platform, this paper attempted to apply the relatively mature cost-weighted distance method, and considered the influence of land-use practices to study the accessibility spatial pattern of public parks under the spatial unit of residential building, residential land and community scales in central urban area of Changting.
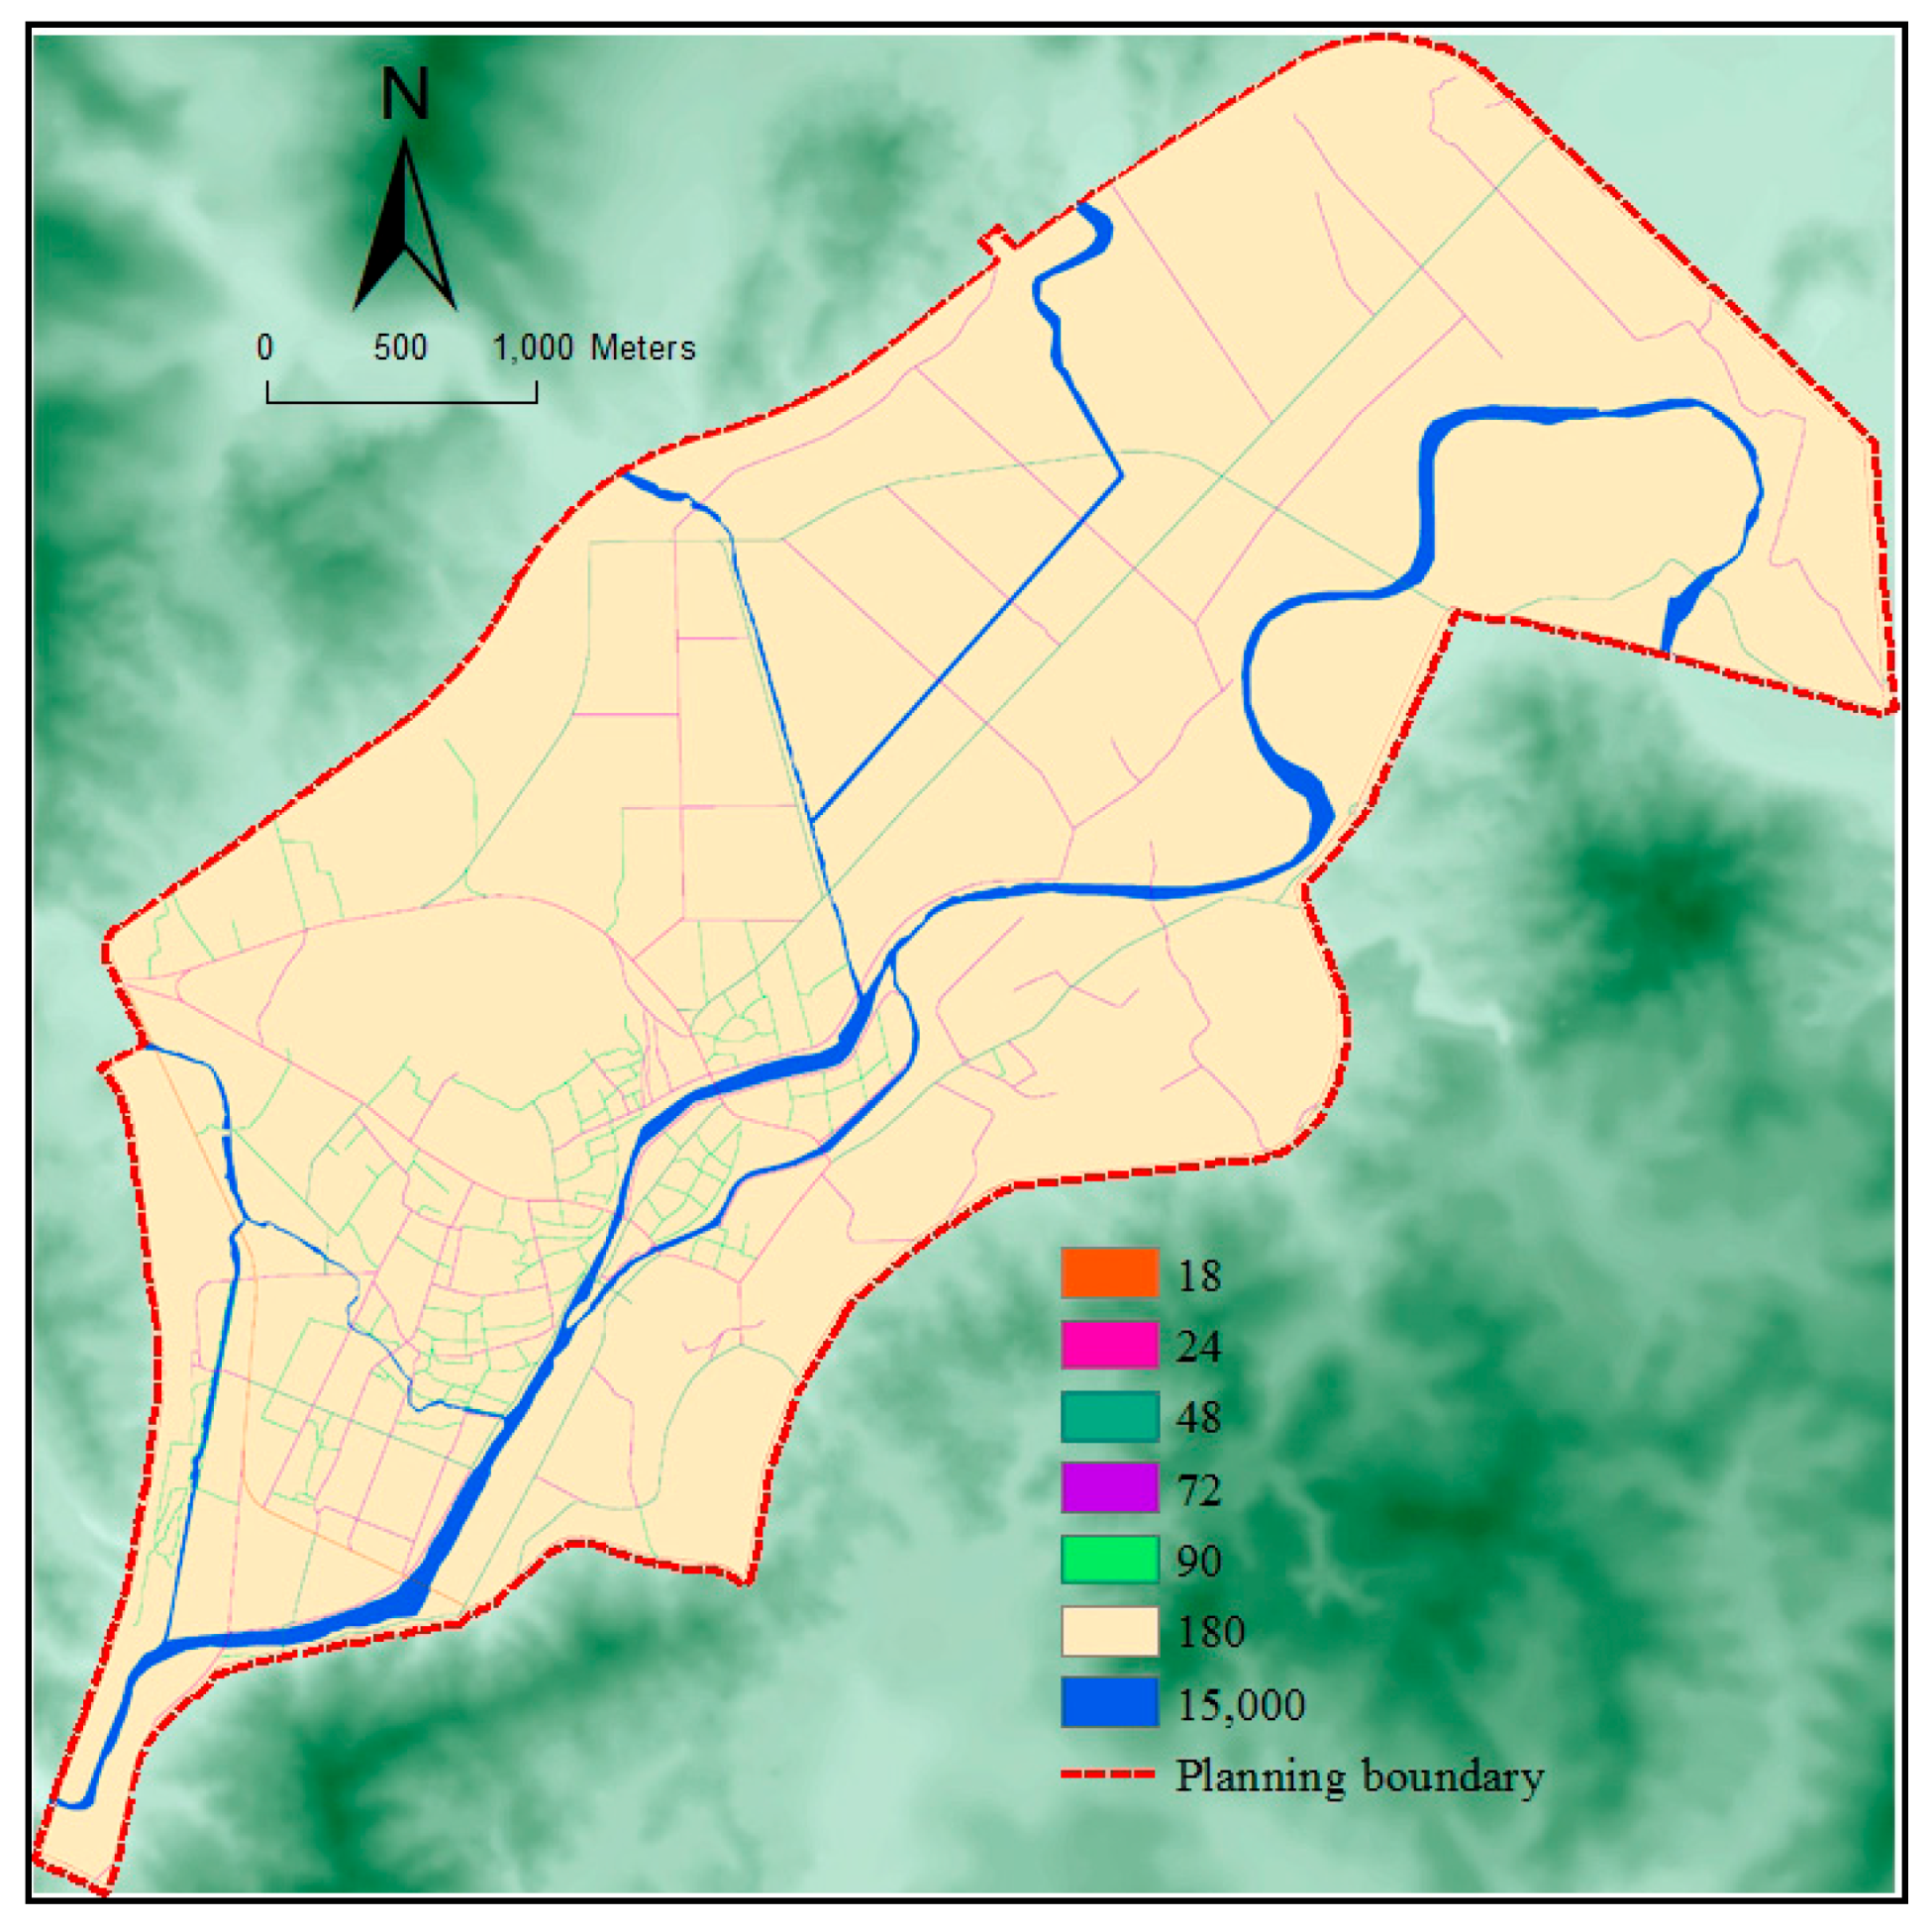
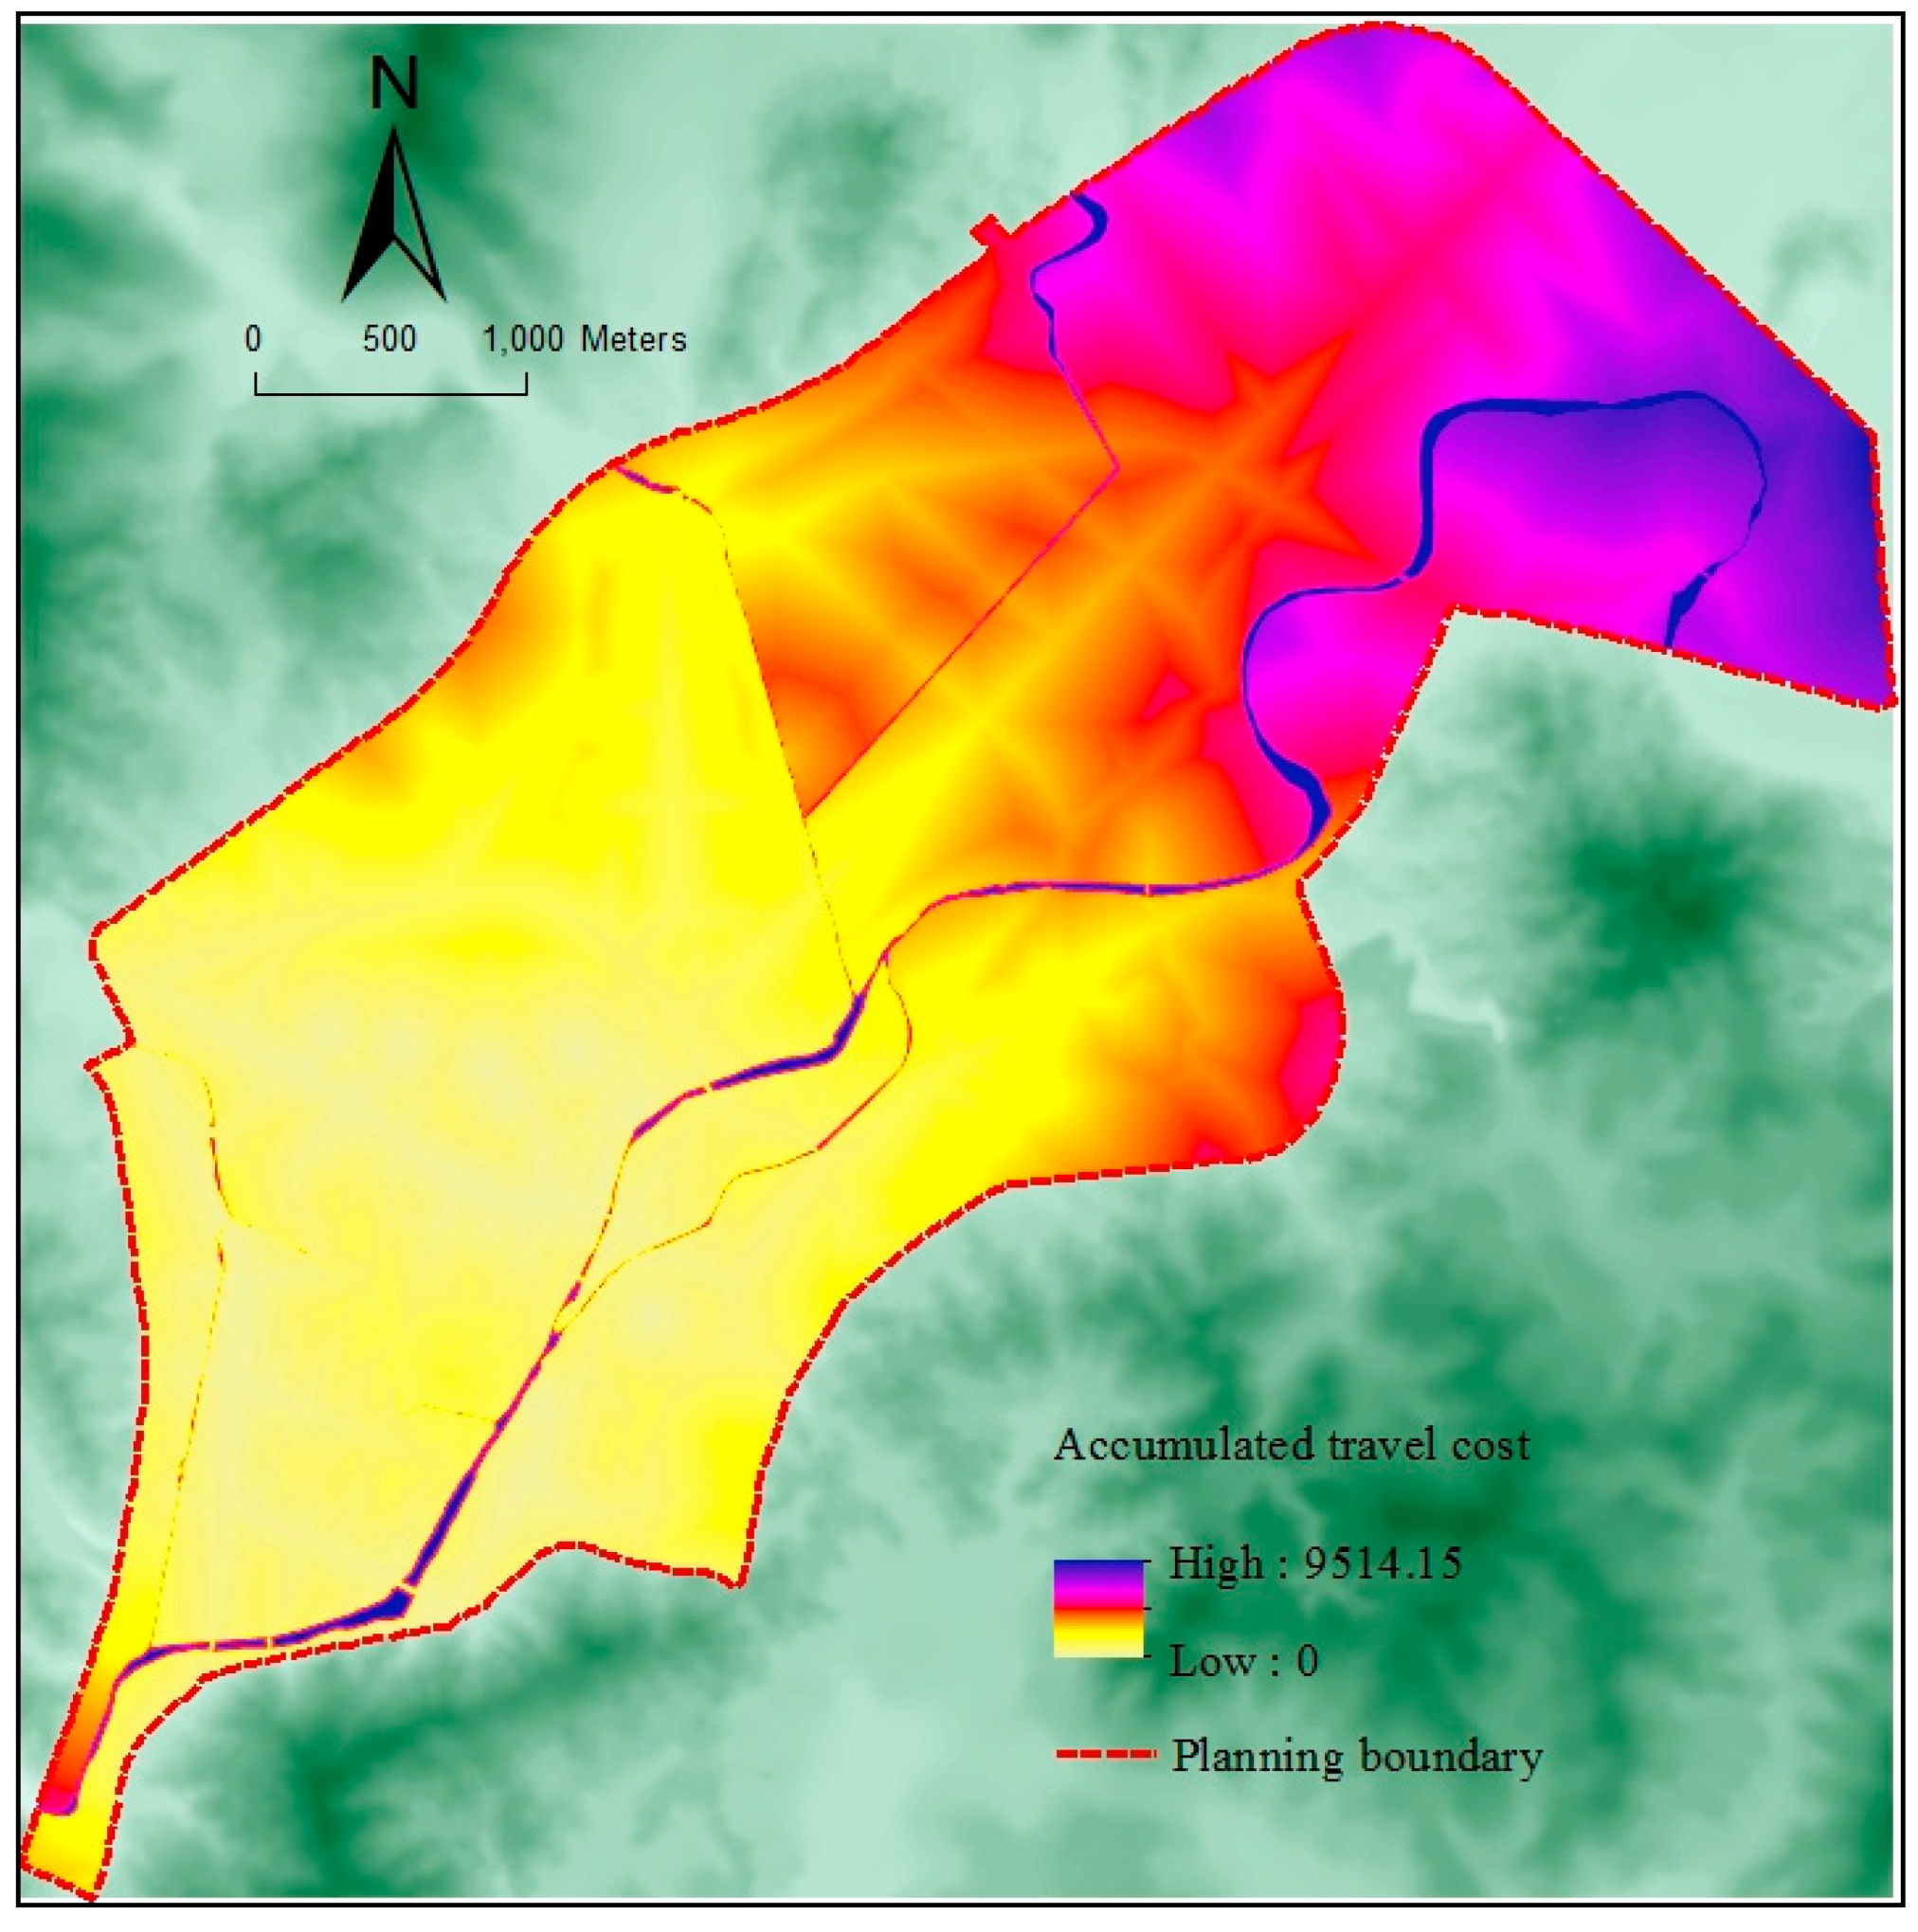
The paper adopts the relatively mature method of cost-weighted distance analysis to measure and evaluate the accessibility for residents walking to the nearest parks in central urban area of Changting. The cost-weighted distance method, which is based on raster data, is realized through the ArcGIS spatial analysis module that is included in the unique operating environment provided by ArcGIS software. The software platform’s command for calculating cost-weighted distance included in the “Spatial Analyst” module was used, and the accumulated travel cost raster graph for resident park-use in the study area was obtained from the calculation (Figure 4 and Figure 5).
3.4. Measure Model of Social Equity
Urban public parks’ layout and allocation may only be considered as indicators of spatial equity in reference to people’s demands [29,45]. In studies conducted in several foreign countries, spatial layout studies of public resources such as parks, schools, hospitals, supermarkets, museums and gymnasiums [6,10,46] widely used the demand index to evaluate the equity of the public resources’ allocation. Alternatively, a needs-based definition of equity could be considered, it would be equitable when the socially vulnerable groups receive disproportionately more benefits [29]. In expressing residents’ demands for green space, factors such as gender, age, ethnicity, and economic status are related to the measure and at the same time, special attention should be paid to the vulnerable groups in order to embody the concept of social equity. Therefore, gender, ethnicity, age and economic status are often selected to build a demand index system, which are then used to analyze spatial layout equity levels and the service functions of green space resources.
3.4.1. Definition of Socially Vulnerable Groups and Calculation of Demand Index
The term “socially vulnerable group” (also referred to as socially weak groups) is derived from the field of sociology and represents a core concept in social issues and social policy research. The term denotes a relative concept. It is defined on the basis of one’s social status and living conditions rather than one’s physical characteristics and physical state, and it is a virtual community in form. Vulnerable groups may be defined as “social groups that experience limited resources and consequently high relative risks of morbidity and premature mortality” [47]. However, in this paper, a socially vulnerable group is referred to as a particular type of social group that acquires negligible economic benefit through the allocation of social resources, lives a poor quality of life, struggles with issues of affordability, and which is marginalized and experiences more social exclusion [48]. Several definitions of socially vulnerable groups exist. Generally speaking, groups that are viewed as being socially vulnerable include children, the elderly, ethnic minorities, the disabled, mental patients, the unemployed, the poor, laid-off workers, displaced populations, asylum seekers, peasant workers, informal employees, and disadvantaged individuals with respect to labor relations such as off- staff members and earlier retired in- staff members, and there is a certain degree of intersection among these groups [49,50,51,52]. As urban public parks are the ecological space agent oriented and constructed by government, they have a strong social public welfare property. In order to quantitatively measure the equity degree of their spatial layout, we should take into full consideration and maximize meeting the requirements of all ranks of society—especially for women, the elderly, children, the laid-off and unemployed workers and other vulnerable groups, full attention should be paid to and priority to meet their requirements. Only based on the spatial distribution characters of vulnerable groups, the accessibility study can really reveal the spatial equity of green space resources. Therefore, the concept of a socially vulnerable groups’ demand index [32] is adopted, and it reflects the differences in the spatial distribution of the vulnerable groups and also objectively manifests the potential requirements of the vulnerable groups for sharing urban ecological space.
For the purposes of the study, we measured eight indicators to build the socially vulnerable group demand index system for the central urban area of Changting County, including the total population, the proportion of population aged and over 60, the proportion of the population aged 0–19, the proportion of female population, the proportion of ethnic minority population, the proportion of illiterate population, the proportion of laid-off population, and the proportion of the unemployed population, based on demographic data for each community collected from the sixth population census of Changting County (completed in 2010). The index measures the differences in potential demand of socially vulnerable groups that share parks at the community level. Among them, the first five indexes reflect the social structure characteristics of the population, and the last three indexes are used to indirectly describe the structural economic characteristics of the population in each community (the situation of low-income groups). For ease of calculation, all indicators listed above should be normalized with the range-standardized method. This task involved a range-transform approach. The formula used is as follows:
Ci = (Fi − Fmin)/(Fmax − Fmin)
In this formula, Ci represents the value that is standardized for a proportion of a certain kind of socially vulnerable groups in community i. Fi represents the proportion of a certain type of socially vulnerable groups in community i. Fmax and Fmin respectively represent the maximum and minimum proportion of a certain type of socially vulnerable groups in all communities. i is a random integer between 1–6.
According to the existing data, this paper calculates an SDI value for six communities of the central urban area of Changting. The steps for carrying out this process are as follows:
Firstly, the following eight datasets from community demographic data were selected as indices, including total population, the population aged over 60, the population aged 0–19, the female population, the ethnic minority population, the illiterate population, the laid-off population and the unemployed population. These data were then assigned to the six communities of the central urban area of Changting. Furthermore, the authors calculated the population proportion of each index respectively according to the specified formula (Table 1).
Secondly, all indicators listed above were normalized with the method of range-standardization for convenient calculation, to eliminate external influences imposed by the communities themselves.
Thirdly, the standardized indexes could be summed from the same weight (that is adding all indexes and averaging), creating a Socially-Vulnerable-Groups Demand Index (SDI) for each community.
3.4.2. Measure of Spatial Equity
In order to quantitatively measure the spatial equity of urban parks’ distribution, the paper attempts to overlay the results of the accessibility level indicator with the results of the socially vulnerable groups demand indicator to obtain a comprehensive evaluation. Based on the ArcGIS and SPSS software platforms, it intends to apply overlay analysis and sequencing variable correlation analysis to quantitatively measure the spatial layout equity of public parks. The sequencing variable correlation analysis method is used to calculate the correlations between the sorted orders of two variables via statistical analysis, to thereby characterize the sequential relationship between the two variables [29]. The spearman rank correlation coefficient reflects the degree of close relation between two sets of variables, with R’s value ranging between −1 and 1 [47]. The Kendall rank correlation coefficient is used to calculate the proportion of the difference between the sequence logarithmic and heterotopic logarithmic for all possible logarithmic proportions, and it reflects the compliance extent of orders between these two variables as well as the degree of correlation [47]. Based on the SPSS software platform, the spearman rank correlation coefficient and the kendall rank correlation coefficient are used to carry out the correlation analysis of accessibility level and demand index for six communities of the central urban area. A two-tailed test is conducted for the correlation coefficient inspection, from which spatial layout equity and rationality of urban public parks are quantitatively measured. The formulas that were applied for the calculation and analysis were as follows:
In this formula, R represents the rank correlation coefficient; U and V respectively represent the sorted order of two variables; Ui − Vi represents the sorted grade difference of two column variables in pairs; n represents the sample size; R is the coefficient value ranging between −1and 1.
In this formula, T represents the rank correlation coefficient; K represents the non-uniform number from rank data of variables; n represents the sample size; T is the coefficient value ranging between −1 and 1.
4. Result Analysis
4.1. Measure and Analysis of Accessibility
Because the accumulated travel cost raster graph which was generated reflected only a relative value of time-cost, values were further converted to minutes spent on travel using the command of “Raster Calculator”. According to the survey, accessibility was regarded as being the most favorable, when the travel time required to reach a park was less than three minutes on foot (walking speed was approximated at between 1.1 and 1.3 m/s). However, travel time that extended to between three and eight minutes were viewed as comparatively ideal. In addition, the psychological research showed that when daily travelling time was more than 30 minutes, individuals would generally feel anxious and impatient. As a result, when the time spent traveling to a park was more than 30 min, the park accessibility was regarded as having poor accessibility. Using these parameters, a reference standard that quantified time-cost and accessibility values for residents sharing parks could be obtained as shown in Table 2.
The evaluation ratings s of the accumulated time-cost raster graph presented above were reassigned using the “Reclassify” command to five ratings: pretty good accessibility (<3 min), good accessibility (3–8 min), common accessibility (8–15 min), poor accessibility (15–30 min), very poor accessibility (>30 min). From this reclassification, the evaluation graph for public parks’ accessibility was obtained (Figure 6). Finally, as shown in Figure 7, the accessibility evaluation results for public parks of each community were obtained using the “Clip” command.
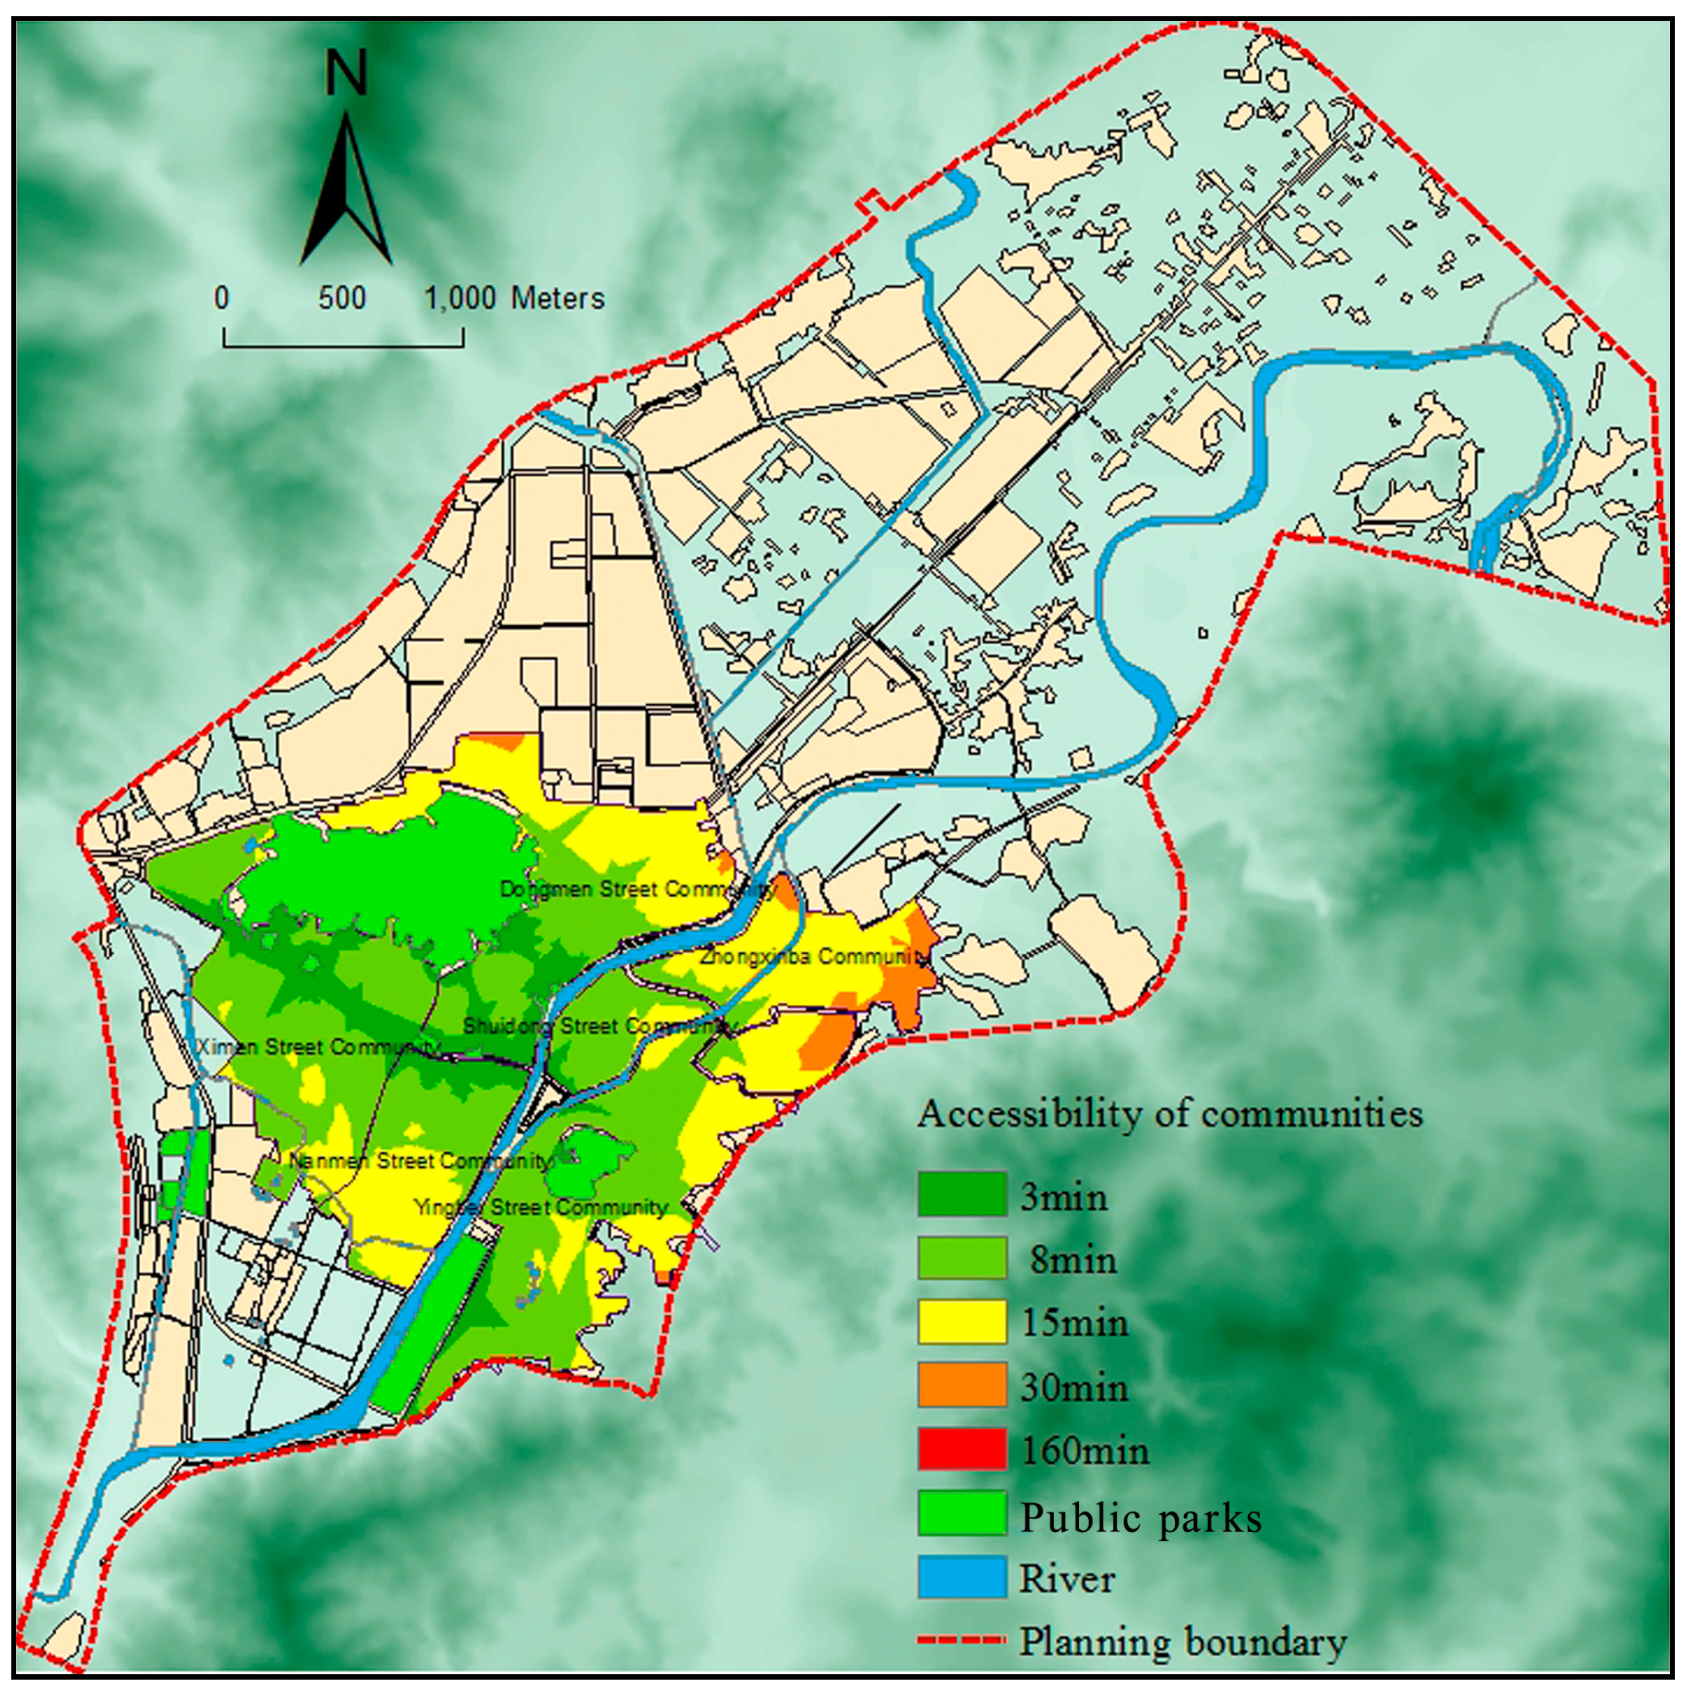
The results showed that Zhongxinba Community covered little area with a travel time to public parks that was less than three minutes at the community level. For the area residents, travel time to public parks was between 8 and 15 min, Dongmen Street Community accounted for 10.43%, Yingbei Street Community accounted for 6.08%, and Zhongxinba Community accounted for 7.33% of such cases. While the travel time was between 15 and 30 min, Dongmen Street Community accounted for 0.48%, Shuidong Street Community accounted for 1.01%, Zhongxinba Community accounted for 2.35% of such cases (Table 3).
Based on these data, the accessibility evaluation raster graph of public parks was converted to a vector graph using the command of “Raster to Features” and it was combined with the residential buildings by the spatial overlay analysis to obtain the residential building area for each community at different accessibility levels. Using the results of the attribute table, the accessibility indices (AI) for each community were obtained—the definition of AI in this paper is expressed as the percentage of residential building area whose travel time to parks is no more than eight minutes accounting for the total residential area—and then it was divided into five grades according to the accessibility presented above: pretty good accessibility (>0.8), good accessibility (0.6–0.8), common accessibility (0.4–0.6), poor accessibility (0.2–0.4), and very poor accessibility (<0.2). The accessibility situations and relevant statistical tables for the community level were then generated according to the method described above (Table 4, Figure 8).
It can thus be concluded that areas exhibiting high levels of accessibility are mainly concentrated close to urban parks, and accessibility levels show a strong spatial coupling relationship with urban parks’ distribution. Accessibility levels for public parks in the Dongmen Street Community, Shuidong Street Community and Zhongxinba Community are not high, and residents cannot enjoy service from urban parks equally. Thus, the current spatial patterns and accessibility levels of public parks in the study area must be improved further. The proportion of public parks close to communities can be increased by urban green space system planning, thereby achieving the spatial layout rationality and equity of the public parks.
4.2. Measures and Evaluation of Equity
4.2.1. Calculation Results of the Socially Vulnerable Groups Demand Index
According to the calculations, the six communities were divided into the following four grades according the SDI results: pretty high demand (SDI > 0.4), high demand (0.3 < SDI < 0.4), low demand (0.2 < SDI < 0.3) and very low demand (SDI < 0.2) (Table 5 and Figure 9). The lowest demand level was found in Shuidong Street Community valuing 0.14, while the highest was found in Nanmen Street Community valuing 0.58.
4.2.2. Equity Evaluation
The results of the sequencing variable correlation analysis showed that the Spearman rank correlation coefficient and Kendall rank correlation coefficient of the accessibility level and demand index were −0.086 and −0.067 respectively, indicating that a negative correlation existed between accessibility levels and the demand index (Table 6). However, because the correlation was too low to pass the significance test, there was no significant correlation between these variables. This result indicated that high demand communities demonstrated low accessibility levels. Thus, the public parks’ layout in the study area were inequitable to some extent at the community level.
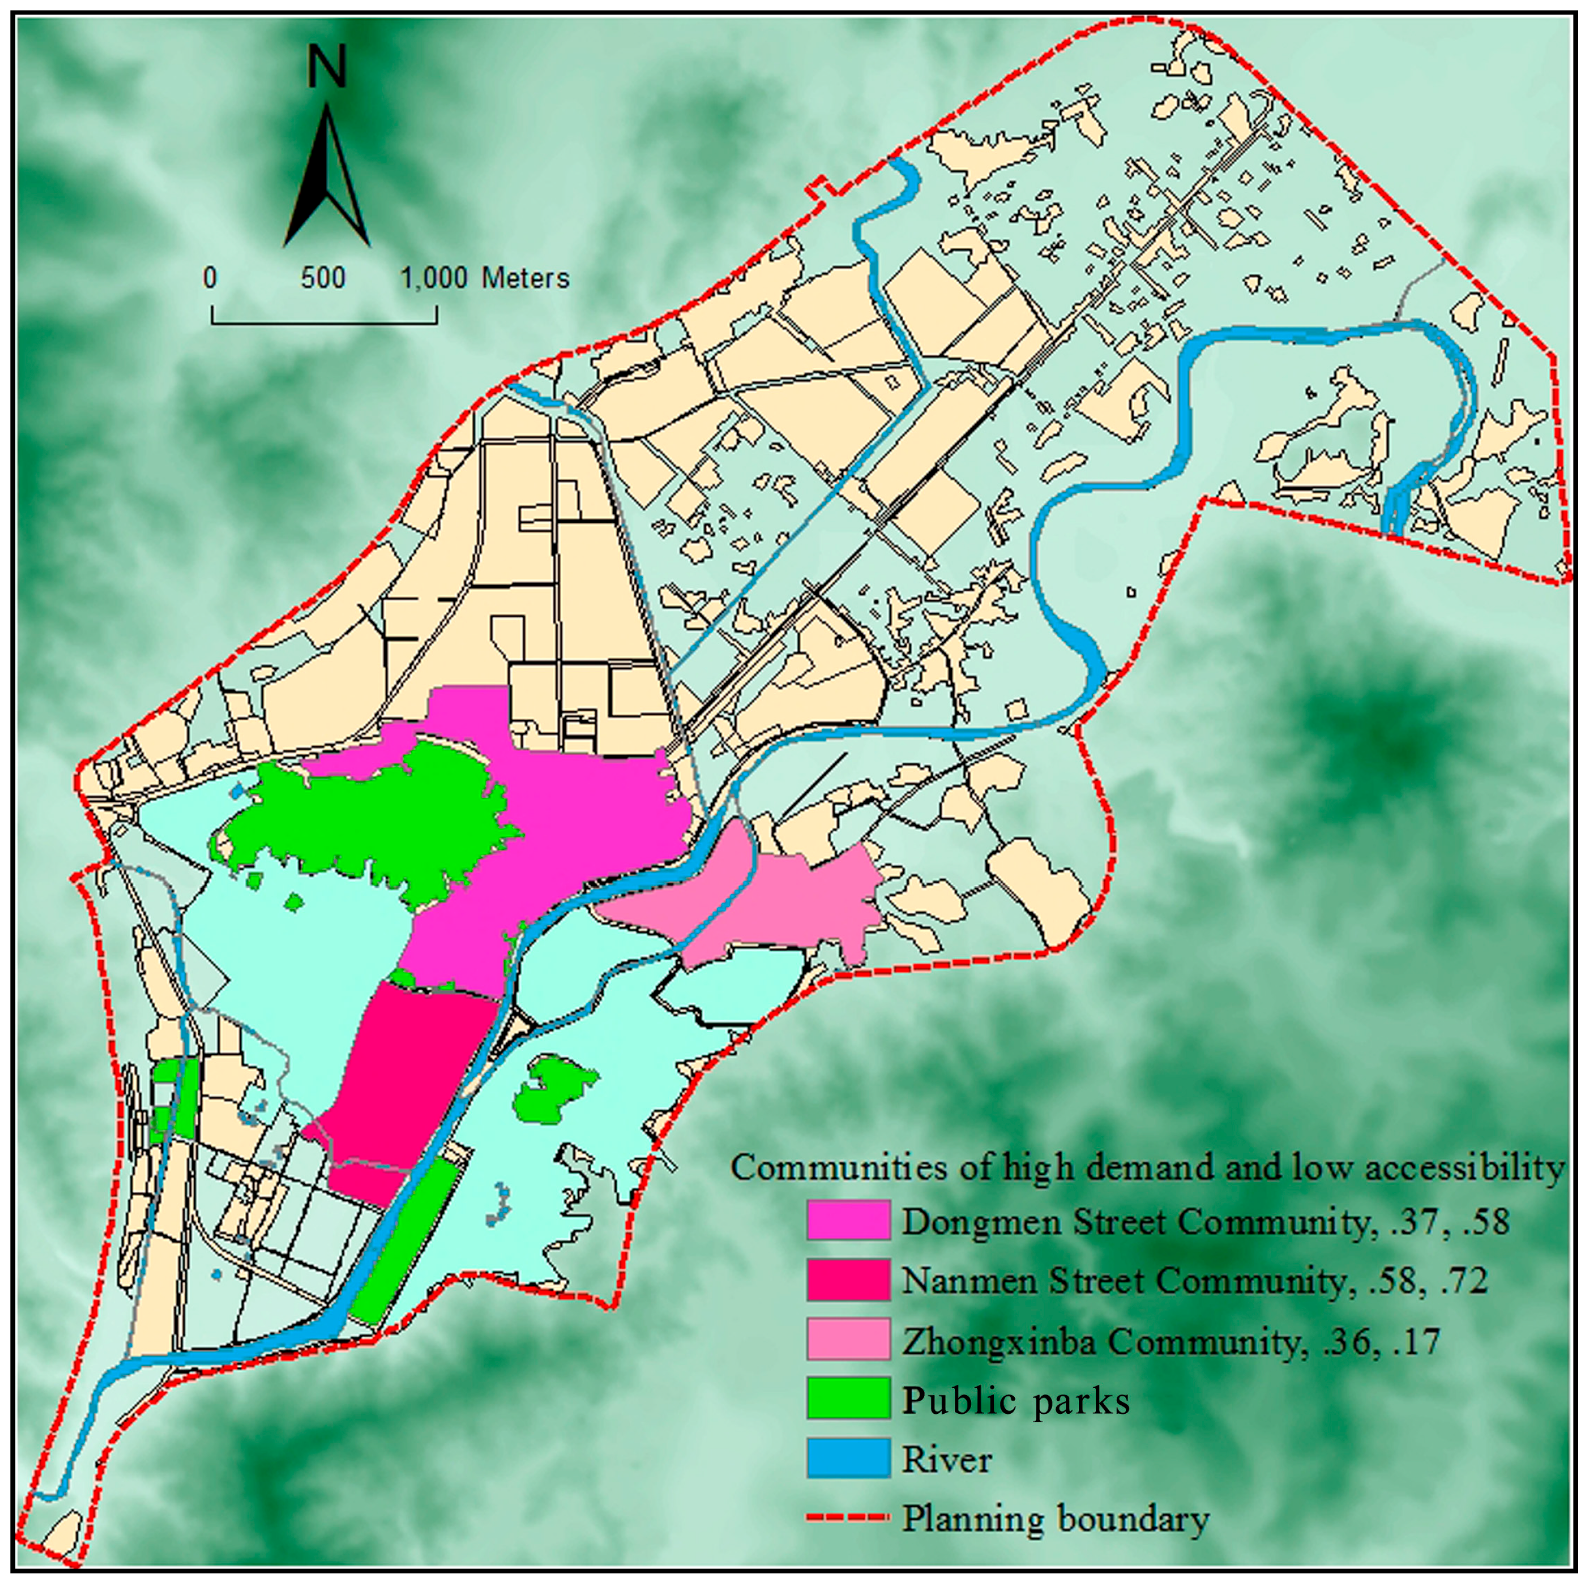
The factor spatial overlay analysis method measures the spatial equity degree of parks’ layout through overlaying the accessibility level and demand index. The quantity and distribution of communities with higher demand and lower accessibility were shown to measure quantitativelythe layout equity of urban public parks. The result can provide valuable reference information for the spatial layout planning of parks. The authors overlaid the classed accessibility level results (Figure 9) with the demand index (Figure 10) for each community of the central urban area of Changting based on ArcGIS software platform. The study results showed that Nanmen Street Community exhibited a pretty high demand index but a common accessibility level. Dongmen Street Community showed a high demand index in combination with a common accessibility level, while Zhongxinba Community exhibited a pretty high demand index but a very poor accessibility level (Table 7, Figure 10). Thus, it demonstrated that the distribution of urban parks did not yet meet the accessibility needs of all groups, and it showed that the potential high demand of communities exhibited rather poor accessibility—as a result, it presented the spatial inequity. The layouts of public parks in Ximen Street Community, Yingbei Street Community and Shuidong Street Community were relatively equitable.
5. Conclusions and Discussion
Urban parks as important urban ecological spaces provide residents with the best place for leisure and recreation, and they gradually become a “commodity” [53]. Therefore, studies on the accessibility and spatial equity of urban parks are becoming particularly important. Especially, the layout equity of urban parks directly affect the quality of residents’ living environments on different streets—particularly the accessibility profoundly affects socially vulnerable groups including poor groups, the disabled, ethnic minorities, the elderly and children sharing public service facilities such as urban parks.
The method of park level to determine service radius usually adopted to examine the rationality of the spatial distribution pattern in China, that realizing a complete coverage of park service scope through planning. The main indicators include quantity, per capita area and spatial layout equalization of parks. Few studies have comprehensively evaluated the spatial equity of urban parks through studying accessibility and demand indexes from the perspective of residents’ demands. The central urban area of Changting is taken as an example in the paper. The cost weighted distance method is adopted to carry out the quantitative analysis for urban parks’ accessibility, and the sixth census data (2010) [54] of Changting is combined to build the demand index, the demand for urban parks of residents is analyzed quantitatively. On this basis, the spatial equity of parks’ distribution in the study area is quantitatively measured by the two methods of sequencing variable correlation analysis and factor spatial overlay analysis. It not only evaluates the accessibility differences in different space units, but also considers the demands of different social groups. That is to say, the equity measure is based on different social groups, different areas, different demands and utilization modes (time limit), therefore the evaluation results are more targeted [55,56]. The results indicate that it is feasible to measure spatial equity of urban parks by the accessibility and demand index of socially vulnerable groups, and it can effectively characterize the rationality of urban ecological spaces. It can also provide useful decision-making guidance for urban planners in investigating, analyzing, and adjusting the distribution of public parks to achieve equitable outcomes. What’s more, the method of spatial equity measurement will be widely applied and provide an important referential significance for the reasonable planning and layout of other urban public service facilities, such as medical service facilities, schools, libraries, museums, and commercial shopping centers. Overall, our major conclusions are listed as follows:
First, the results of the accessibility evaluation at the community scale show that urban parks’ accessibility levels are not high for Dongmen Street Community, Shuidong Street Community where historical and cultural blocks are located, and the high-density Zhongxinba Community.
Second, according to the SDI results, the lowest value is found in Shuidong Street Community (0.14), while the highest value is found in Nanmen Street Community (0.58). This shows that there are obvious spatial differentiations between the distribution equity levels of the existing urban parks.
Third, according to the spatial overlay analysis, results indicate that the spatial distribution of urban parks is not equitable in terms of accessibility or residents’ demands. As a result, we can suggest an optimum SDI value of 0.3~0.4 and an AI value of 0.6~0.8 for the urban green space system planning for the future in the case study area.
The inequity is mainly affected by three factors. First, the implementation of ideas of people-orientation and social equity are not enough—vulnerable groups are still ignored by the social mainstream. Second, the development of urban real estate intensifies the differentiation of residential space, the residence of vulnerable groups mostly deviates from urban parks. Third, the aggregate supply of urban parks is insufficient and its spatial layout is unbalanced. There are significant differences of accessibility level in communities located in different areas in the study area. Thus, it fundamentally affects the equity degree for vulnerable groups sharing urban parks. Furthermore, on the basis of these data, we can increase the supply of green spaces and then establish an optimal urban park system according to accessibility and social equity.
In the recent ecological province construction of Fujian and with the recent goal of developing a provincial Garden County, Changting as the pilot county of ecological civilization construction demonstrates that its green space system planning should focus on both quantity and quality, as well as on the spatial distribution of urban parks. To obtain a more equitable and reasonable spatial distribution of urban parks, in addition to increasing urban green space resources and guiding the development of mixed land use, we still need to consider the equal distribution of green space resources and maximize the benefit of green space. In short, when planning an urban green space system, we should consider the equity evaluation and adaptively plan urban parks in the communities with a lower accessibility index, including Dongmen Street Community, Shuidong Street Community and Zhongxinba Community, to meet the demands of residents from all socio-economic backgrounds, and to ensure that residents enjoy this social service equally.
In the master plan for Changting (2010–2030), the goal of per capita green space is 13m2. Because of high population density and high load of parks in the old town of Changting, and the lack of street green space, the way of “see seam insert green space” should be adopted to increase small pieces of green space as soon as possible, in order to relieve pressure on parks. To realize the ecological benefits of such spaces, green corridors along Tingjiang River and Xihe Stream are recommended to increase connectivity among urban parks. In the case of road traffic, sub-level roads should be denser and greenways should be used to connect in series with major public parks to create better slow-moving conditions to improve accessibility. In addition, protective greenbelts can be updated to become public parks in conditional areas—even a small street green space can remedy the problem of unbalanced distribution. Using this strategy, the balance and equity distribution of urban public parks will be further improved, and still the urban green space system may be comprehensively improved from the angle of the integration of points, lines and surfaces.
Although there are important discoveries revealed by the study, there are also limitations. First, the eight indexes we selected not only reflect the social structure characteristics of the population and also indirectly describe the structural economic characteristics of the population, there still exist limitations that the details of the demand index are not comprehensive enough to fully express all the characteristics of socially vulnerable groups. Second, accessibility is only measured with respect to the associated time cost required to reach parks but does not involve material costs (such as money). Third, errors are generated from the cost-weighted distance method. In the process of calculation and analysis, the relative resistance values for roads, mountains, water systems and others are artificial assignments, so there exists a certain subjectivity. And much land area with the exception of urban roadways and rivers is occupied by buildings—actual paths refer to both urban roadways and community walking paths. Third, other attributes of urban parks such as park tickets, size, and facilities are not considered. Fourth, as this paper is restricted by the smallest statistical unit of the census data, and the measure of spatial equity is at the community level, the precision of the research is reduced. Further, the geographic unit of analysis is large, aggregated units; therefore it was impossible to accurately identify neighborhoods with a high percentage of vulnerable groups and calculate their access to parks. In addition, the findings were inconclusive due to the small number of observations. The factors described above will influence the accuracy of accessibility evaluation to some extent. Therefore, accessibility evaluation may be further improved by including such considerations to obtain more scientific and accurate research results.
Acknowledgments
This study was primarily funded by a grant from the National Key R&D Program of China (2017YFC0505702) and Program of National Natural Science of China (51278239, 41771181).
Author Contributions
Yanhua Yuan conceived and designed the research, analyzed the data and wrote the paper; Jiangang Xu and Zhenbo Wang reviewed the paper and made several comments and suggestions for revision.
Conflicts of Interest
The authors declare no conflict of interest.
References
- Jiang, H.Y.; Zhou, C.S.; Xiao, R.B. Spatial differentiation and social equity of public parks in Guangzhou. China City Plan. Rev. 2010, 34, 43–48. [Google Scholar]
- Tan, P.Y.; Samsudin, R. Effects of spatial scale on assessment of spatial equity of urban park provision. Landsc. Urban Plan. 2016. [Google Scholar] [CrossRef]
- Jiang, H.Y.; Zhou, C.S.; Gao, J.B. Advance in the equity of spatial distribution of urban public service in western countries. City Plan. Rev. 2011, 35, 72–77. [Google Scholar]
- Qin, Y.C. Theory and practice of regional sustainable development. Econ. Geogr. 1997, 17, 1–7. [Google Scholar]
- Zhang, J.Z.; Wei, T.H.; Chen, H. Research on the spatial equity in the distribution of public facilities based section quotient. Huazhong Archit. 2012, 2, 38–40. [Google Scholar]
- Hay, A.M. Concepts of equity, fairness and justice in geographical studies. Trans. Inst. Br. Geogr. 1995, 20, 500–508. [Google Scholar] [CrossRef]
- Smith, D.M. Geography and Social Justice; Wiley-Blackwell: Oxford, UK, 1994. [Google Scholar]
- Boone, C.G.; Buckley, G.L.; Grove, J.M.; Sister, C. Parks and people: An environmental justice inquiry in Baltimore, Maryland. Ann. Assoc. Am. Geogr. 2009, 4, 707–787. [Google Scholar] [CrossRef]
- Talen, E.; Anselin, L. Assessing spatial equity: An evaluation of measures of accessibility to public playgrounds. Environ. Plan. A 1998, 30, 595–613. [Google Scholar] [CrossRef]
- Chang, H.S.; Liao, C.H. Exploring an integrated method for measuring the relative spatial equity in public facilities in the context of urban parks. Cities 2011, 28, 361–371. [Google Scholar] [CrossRef]
- Rega, C.C.; Nilon, C.H.; Warren, P.S. Avian Abundance Patterns in Relation to the Distribution of Small Urban Greenspaces. J. Urban Plan. Dev. 2015, 141. [Google Scholar] [CrossRef]
- Kinman, E.L. Evaluating health services equity at a primary care clinic in Chilimarca, Bolivia. Soc. Sci. Med. 1999, 49, 663–678. [Google Scholar] [CrossRef]
- Taket, A.R. Equity and Access: Exploring the Effects of Hospital Location on the Population Served—A Case Study in Strategic Planning. J. Oper. Res. Soc. 1989, 40, 1001–1009. [Google Scholar] [PubMed]
- Kim, C.W.; Lee, S.Y.; Hong, S.C. Equity in utilization of cancer inpatient services by income classes. Health Policy 2005, 72, 187–200. [Google Scholar] [CrossRef] [PubMed]
- Le, A.T.; Miller, P.W. Participation in higher education: Equity and access? Econ. Rec. 2005, 81, 152–165. [Google Scholar] [CrossRef]
- Ottensmann, J.R. Evaluating equity in service delivery in library branches. J. Urban Aff. 1994, 16, 109–123. [Google Scholar] [CrossRef]
- Kim, J.; Nicholls, S. Using geographically weighted regression to explore the equity of public open space distributions. J. Leis. Res. 2016, 48, 105–133. [Google Scholar] [CrossRef]
- Kim, J.; Nicholls, S. Access for all? Beach access and equity in the Detroit Metropolitan Area. J. Environ. Plan. Manag. 2017. [Google Scholar] [CrossRef]
- Kim, J.; Nicholls, S. Influence of the measurement of distance on assessment of recreation access. Leis. Sci. 2016, 38, 118–139. [Google Scholar] [CrossRef]
- Wu, C.; Ye, X.Y.; Du, Q.Y.; Luo, P. Spatial effects of accessibility to parks on housing prices in Shenzhen, China. Habitat Int. 2017, 63, 45–54. [Google Scholar] [CrossRef]
- Ibes, D.C. A multi-dimensional classification and equity analysis of an urban park system: A novel methodology and case study application. Landsc. Urban Plan. 2015, 137, 122–137. [Google Scholar] [CrossRef]
- Tsou, K.; Hung, Y.; Chang, Y. An accessibility-based integrated measure of relative spatial equity in urban public facilities. Cities 2005, 22, 424–435. [Google Scholar] [CrossRef]
- Ibem, E.O. Accessibility of Services and Facilities for Residents in Public Housing in Urban Areas of Ogun State, Nigeria. Urban Forum 2013, 24, 407–423. [Google Scholar] [CrossRef]
- Hewko, J.; Smoyer-Tomic, K.E.; Hodgson, M.J. Measuring neighbourhood spatial accessibility to urban amenities: Does aggregation error matter? Environ. Plan. A 2002, 34, 1185–1206. [Google Scholar] [CrossRef]
- Vadrevu, L.; Kanjilal, B. Measuring spatial equity and access to maternal health services using enhanced two step floating catchment area method (E2SFCA)—A case study of the Indian Sundarbans. Int. J. Equity Health 2016, 15, 1–12. [Google Scholar] [CrossRef] [PubMed]
- Xing, Y.; Bao, Z.W.; Dai, J. Analysis on the equity of public health resource allocation in Huanggang City. Chin. J. Soc. Med. 2013, 30, 265–267. [Google Scholar]
- Chen, W. Equity and medical security for the vulnerable. Chin. J. Health Policy 2011, 4, 4–5. [Google Scholar]
- Li, X.P. Research on school choice behavior and the equity of educational opportunity distributing at compulsory educational stage: Based on the empirical analysis of the family expenditure on educational choice in 18 cities in China. Educ. Res. 2008, 3, 67–72. [Google Scholar]
- Lindsey, G.; Maraj, M.; Kuan, S.C. Access, equity, and urban greenways: An exploratory investigation. Prof. Geogr. 2001, 53, 332–346. [Google Scholar] [CrossRef]
- Zhang, Y.J.; Tarrant, M.A.; Green, G.T. The importance of differentiating urban and rural phenomena in examining the unequal distribution of locally desirable land. J. Environ. Manag. 2008, 88, 1314–1319. [Google Scholar] [CrossRef] [PubMed]
- Anguelovski, I. From Toxic Sites to Parks as (Green) LULUs? New Challenges of Inequity, Privilege, Gentrification, and Exclusion for Urban Environmental Justice. J. Plan. Lit. Inc. CPL Bibliogr. 2016, 31, 23–26. [Google Scholar] [CrossRef]
- Yin, H.W.; Kong, F.H.; Zong, Y.G. Accessibility and equity assessment on urban green space. Acta Ecol. Sin. 2008, 28, 3375–3383. [Google Scholar]
- Yin, H.W.; Xu, J.G. Spatial accessibility and equity of parks in Shanghai. Urban Stud. 2009, 6, 71–76. [Google Scholar]
- Xiao, Y.; Wang, Z.; Li, Z.G.; Tang, Z.L. An assessment of urban park access in Shanghai—Implications for the social equity in urban China. Landsc. Urban Plan. 2016, 157, 383–393. [Google Scholar] [CrossRef]
- Hughey, S.M.; Walsemann, K.M.; Child, S.; Powers, A.; Reed, J.A.; Kaczynski, A.T. Using an environmental justice approach to examine the relationships between park availability and quality indicators, neighborhood disadvantage, and racial/ethnic composition. Landsc. Urban Plan. 2016, 148, 159–169. [Google Scholar] [CrossRef]
- Zhang, W.; Li, H.; An, X. Ecological civilization construction is the fundamental way to develop low-carbon economy. Energy Procedia 2011, 5, 839–843. [Google Scholar]
- Liu, X.; Zhou, J.P. Spatial Pattern of Land Use and Its Implications for Mode-Based Accessibility: Case Study of Nanjing, China. J. Urban Plan. Dev. 2014, 141. [Google Scholar] [CrossRef]
- Li, P.H.; Lu, Y.Q. Review and prospection of accessibility research. Prog. Geogr. 2005, 24, 69–78. [Google Scholar]
- Kyushik, O.; Seunghyun, J. Assessing the spatial distribution of urban parks using GIS. Landsc. Urban Plan. 2007, 82, 25–32. [Google Scholar]
- Güngör, S. A Research on Accessibility of Urban Parks by Disabled Person: The Case Study of Birlik Park, Konya-Turkey; St. Kliment Ohridski University Press: Sofia, Bulgaria, 2016. [Google Scholar]
- Chen, Q.; Hou, Y.; Wu, S. Assessment of Accessibility to Urban Parks in Shaoxing City from the Perspective of Opportunity Equity. Sci. Geogr. Sin. 2016, 36, 375–383. [Google Scholar]
- Li, B.; Song, Y.; Yu, K.J. Evaluation method for measurement of accessibility in urban public green space planning. Acta Sci. Nat. Univ. Pekin. 2008, 44, 618–624. [Google Scholar]
- Liu, J.C.; Qiao, X.; Liu, L. An empirical study on the serving area of regional park in megapolis-case study of Yangpu park in Shanghai. Chin. Landsc. Archit. 2010, 26, 88–91. [Google Scholar]
- Gao, P.; Zhang, N.N.; Song, C.W. A cost weighted distance-based research on the radiation effect of urban comprehensive parks. J. Fuyang Vocat. Tech. Inst. 2016, 27. Available online: http://d.wanfangdata.com.cn/Periodical/fyzyjsxyxb201601018 (accessed on 10 May 2017). (In Chinese).
- Truelove, M. Measurement of spatial equity. Environ. Plan. C Gov. Policy 1993, 11, 19–34. [Google Scholar] [CrossRef]
- Talen, E. The social equity of urban service distribution: An exploration of park access in Pueblo, Colorado, and Macon, Georgia. Urban Geogr. 1997, 18, 521–541. [Google Scholar] [CrossRef]
- Flaskerud, J.H.; Winslow, B.J. Conceptualizing vulnerable population health-related research. Nurs. Res. 1998, 47, 69–78. [Google Scholar] [CrossRef] [PubMed]
- Chen, C.W. The Theory of the Socially Vulnerable Groups: Living Conditions and Social Support of the Socially Vulnerable Groups during the System Transformation Period; Current Affairs Press: Beijing, China, 2000; pp. 88–102. (In Chinese) [Google Scholar]
- Zheng, H.S.; Li, Y.S. Building China into a “well-off” society and social assistance for vulnerable groups. J. Renmin Univ. China 2003, 1, 2–8. [Google Scholar]
- Bai, X.M.; Zhao, S.S. The correlation analysis between two ordinal data. Jiangsu Stat. 1998, 5, 17–18. [Google Scholar]
- Pan, J.H.; Ma, C.T.; Li, J.F. Spatial structure of A-grade tourist attractions in Gansu. J. Arid Land Resour. Environ. 2014, 28, 188–193. [Google Scholar]
- Smoyer-Tomic, K.E.; Hewko, J.N.; Hodgson, M.J. Spatial accessibility and equity of playgrounds in Edmonton, Canada. Can. Geogr. 2004, 48, 287–302. [Google Scholar] [CrossRef]
- Zhang, W.; Yang, J.; Ma, L.; Huang, C. Factors affecting the use of urban green spaces for physical activities: Views of young urban residents in Beijing. Urban For. Urban Green. 2015, 14, 851–857. [Google Scholar] [CrossRef]
- Statistical Bureau of Changting. The Main Data Bulletin of the Sixth National Census Data (2010) for Changting County; Statistical Bureau of Changting: Changting, China, 2011. (In Chinese)
- Wang, Z.B.; Fang, C.L.; Cheng, S.W.; Wang, J. Evolution of coordination degree of eco-economic system and early-warning in the Yangtze River Delta. J. Geogr. Sci. 2013, 23, 147–162. [Google Scholar] [CrossRef]
- Wang, Z.B.; Fang, C.L.; Zhang, X.R. Spatial expansion and potential of construction land use in the Yangtze River Delta. J. Geogr. Sci. 2015, 25, 851–864. [Google Scholar] [CrossRef]
Figure 1.
The location of Changting.
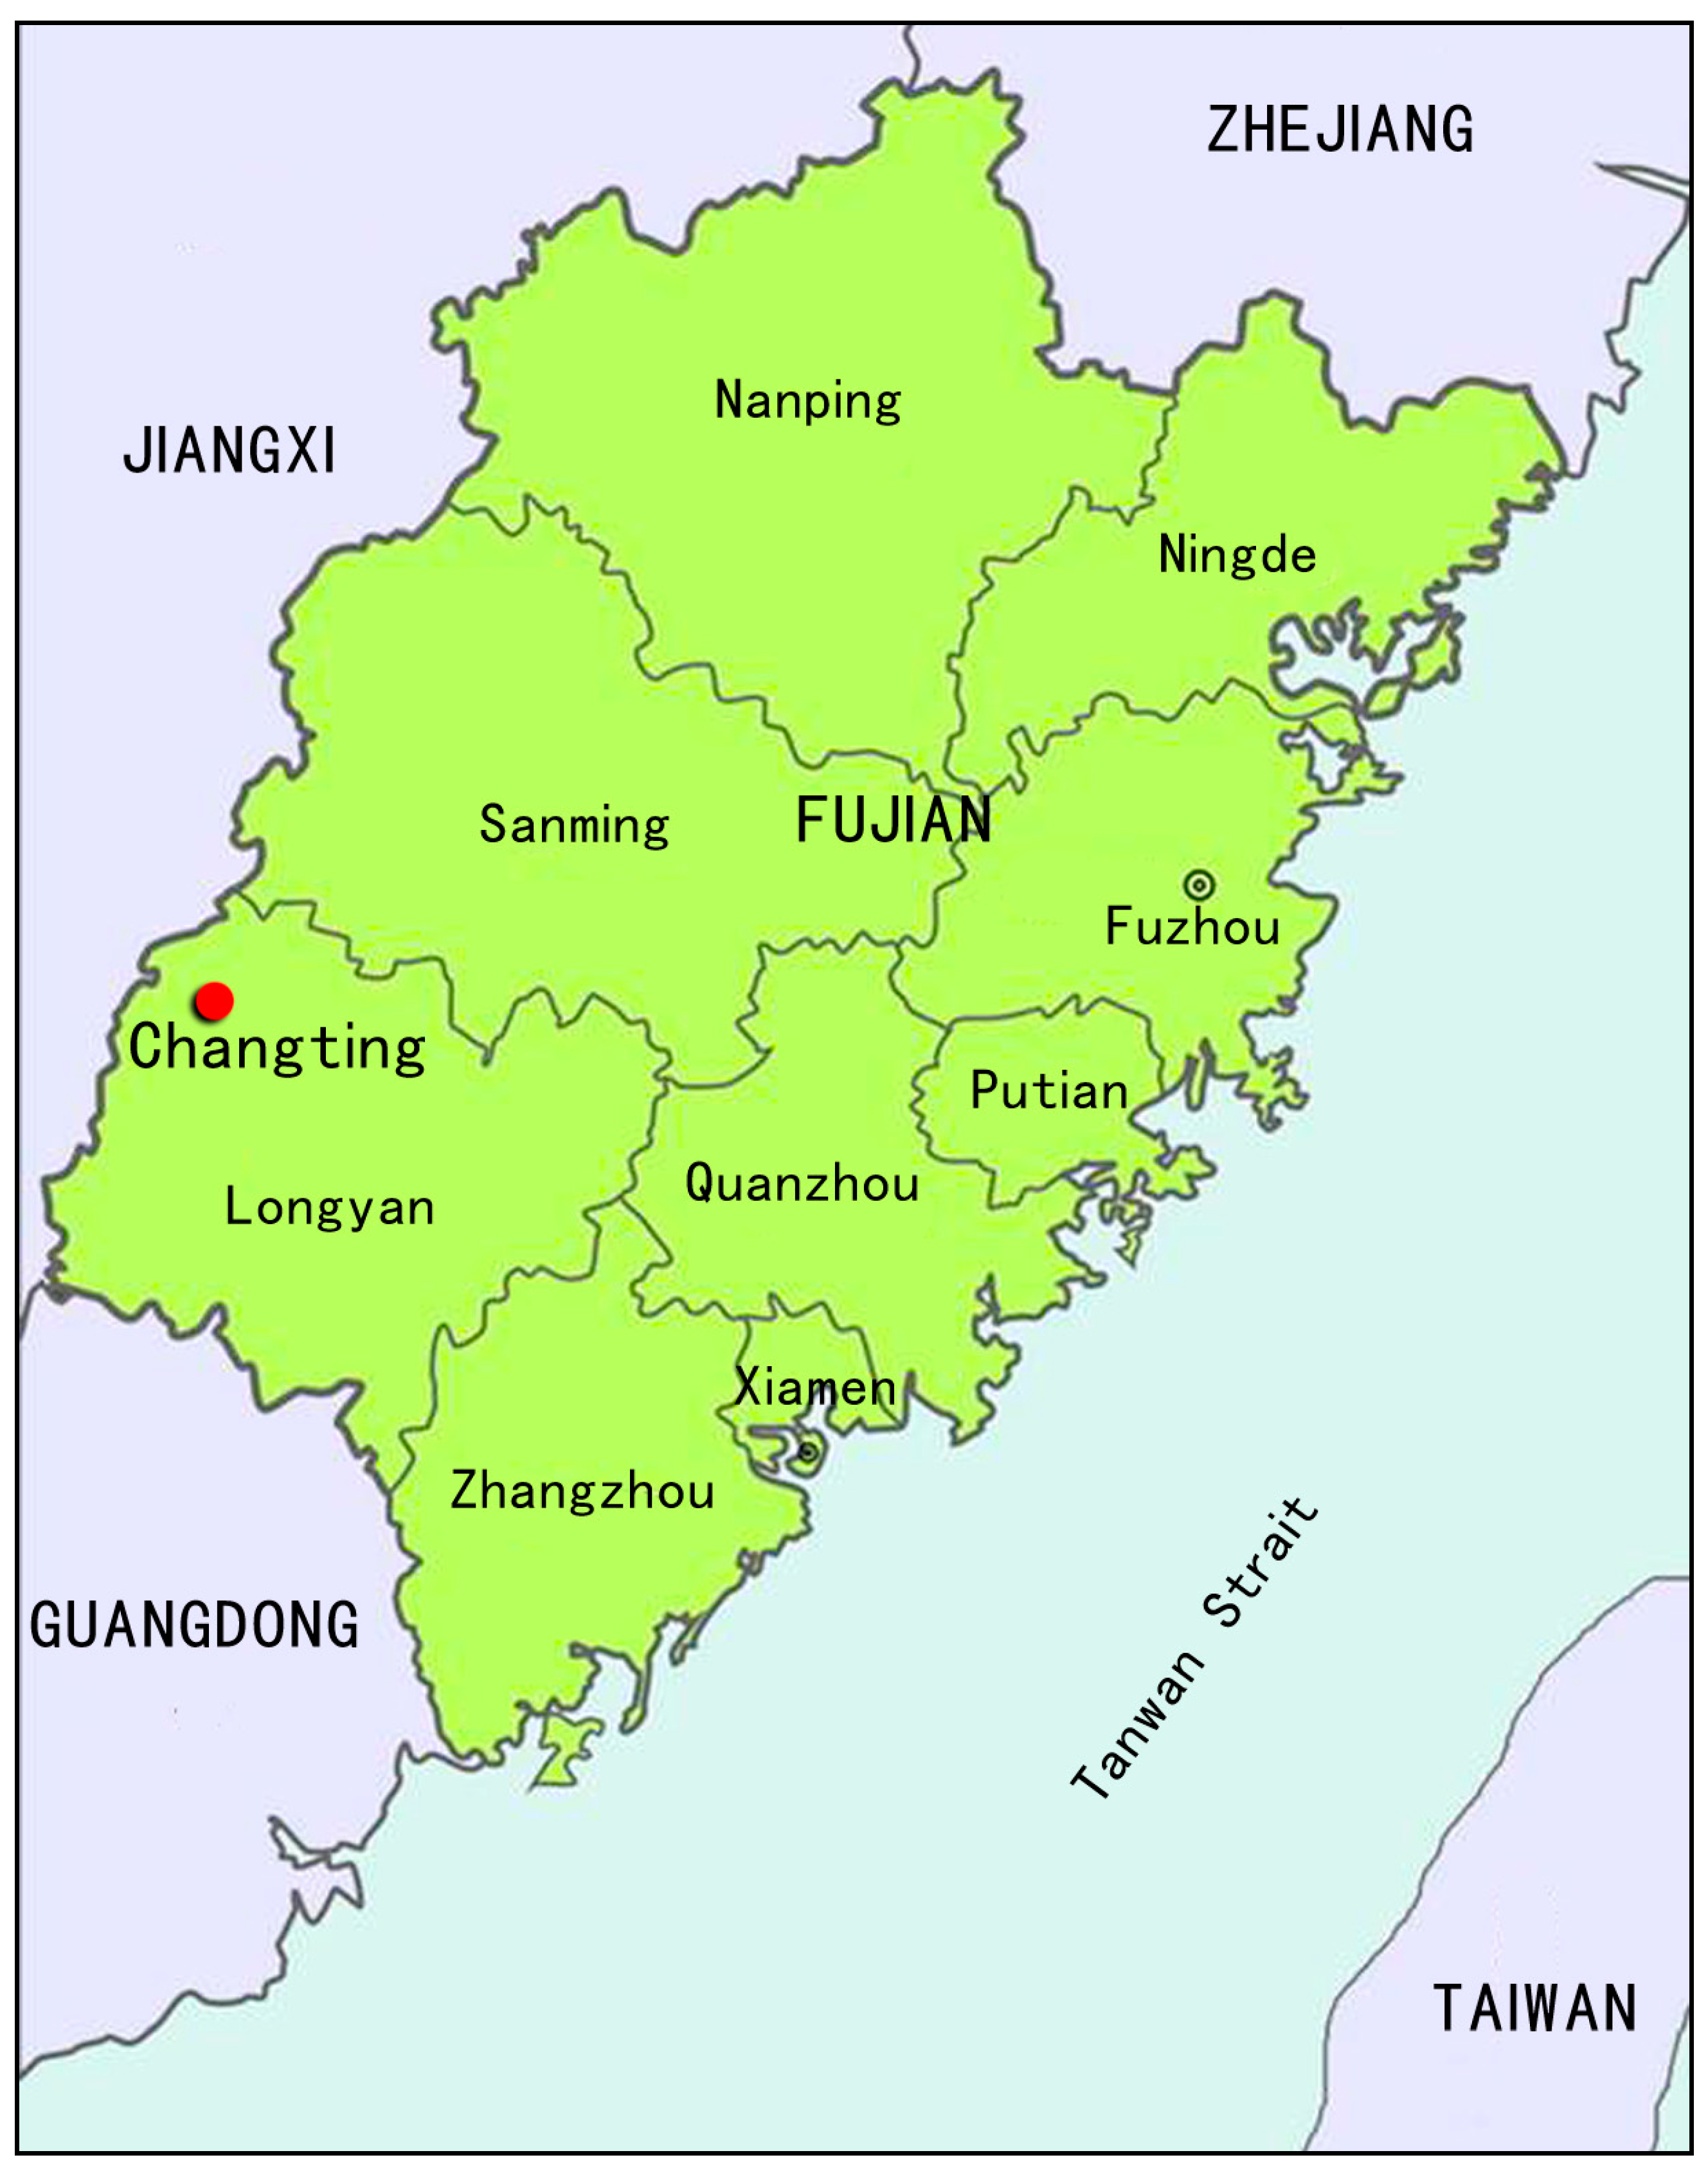
Figure 2.
Present distribution of public parks in the study area.
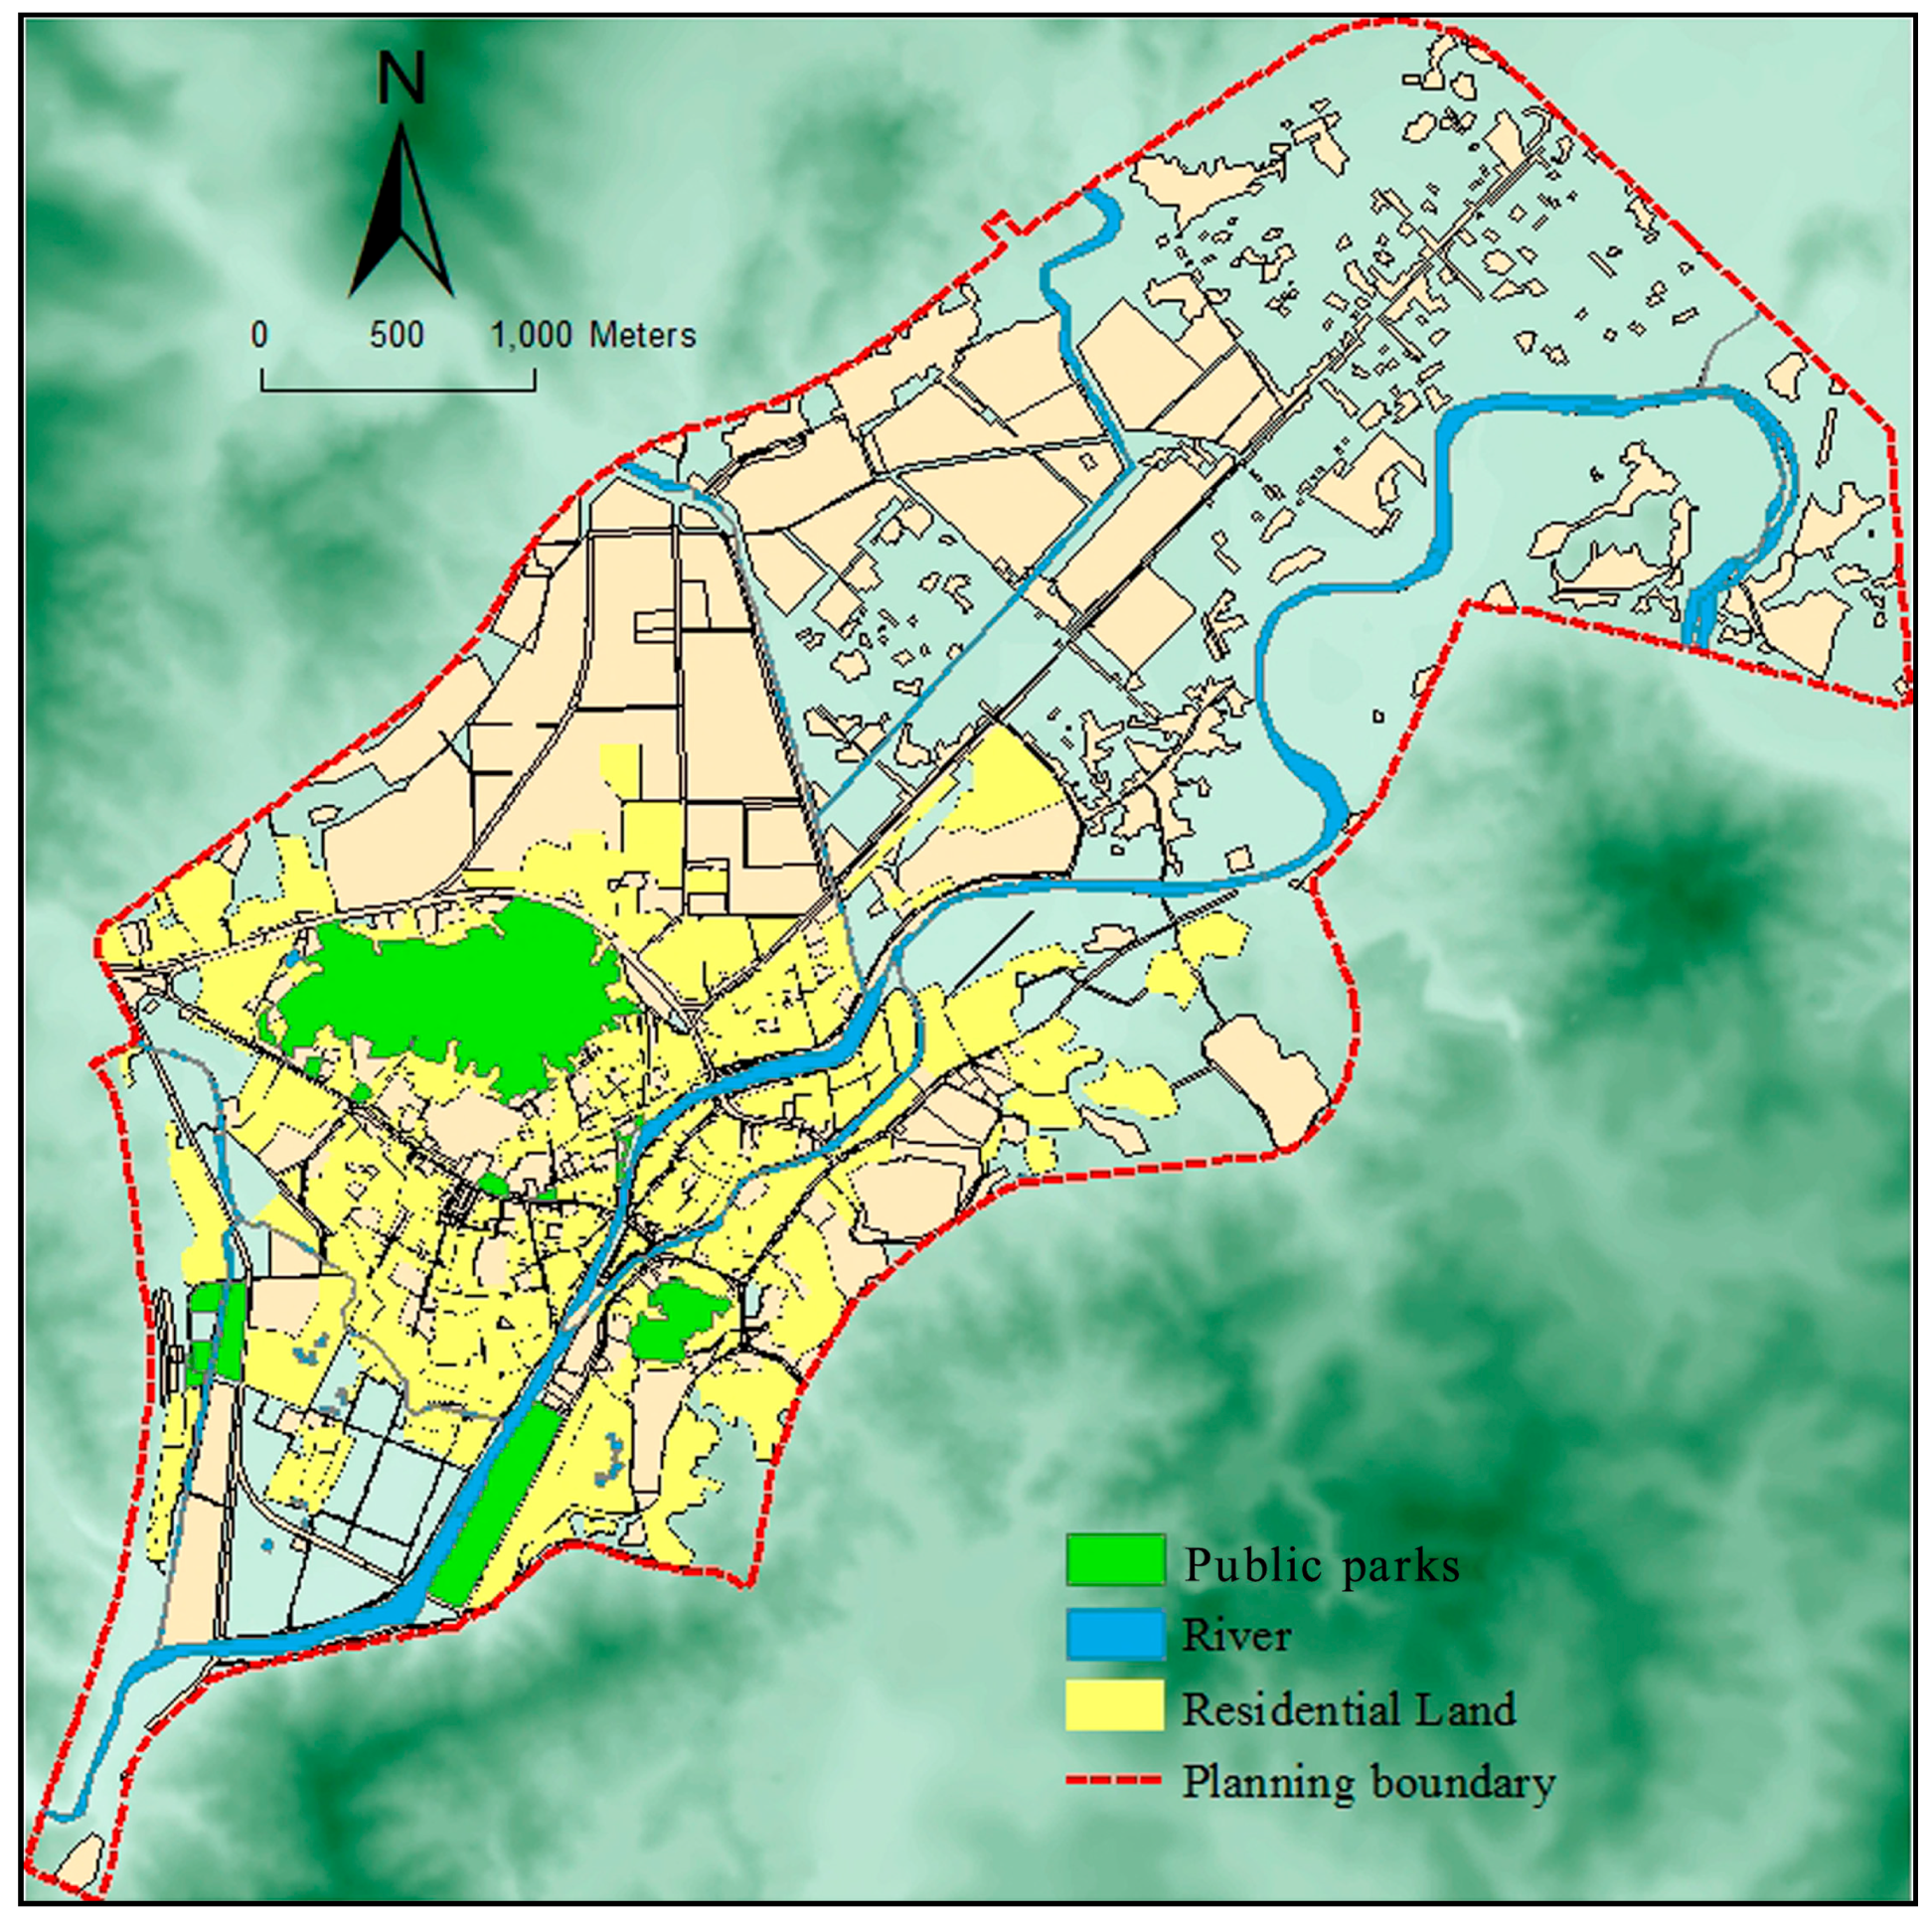
Figure 3.
The technology route.

Figure 4.
Time-cost grid chart of the study area.

Figure 5.
Cost-weighted distance grid chart of the study area.

Figure 6.
Accessibility evaluation of public parks in the study area.
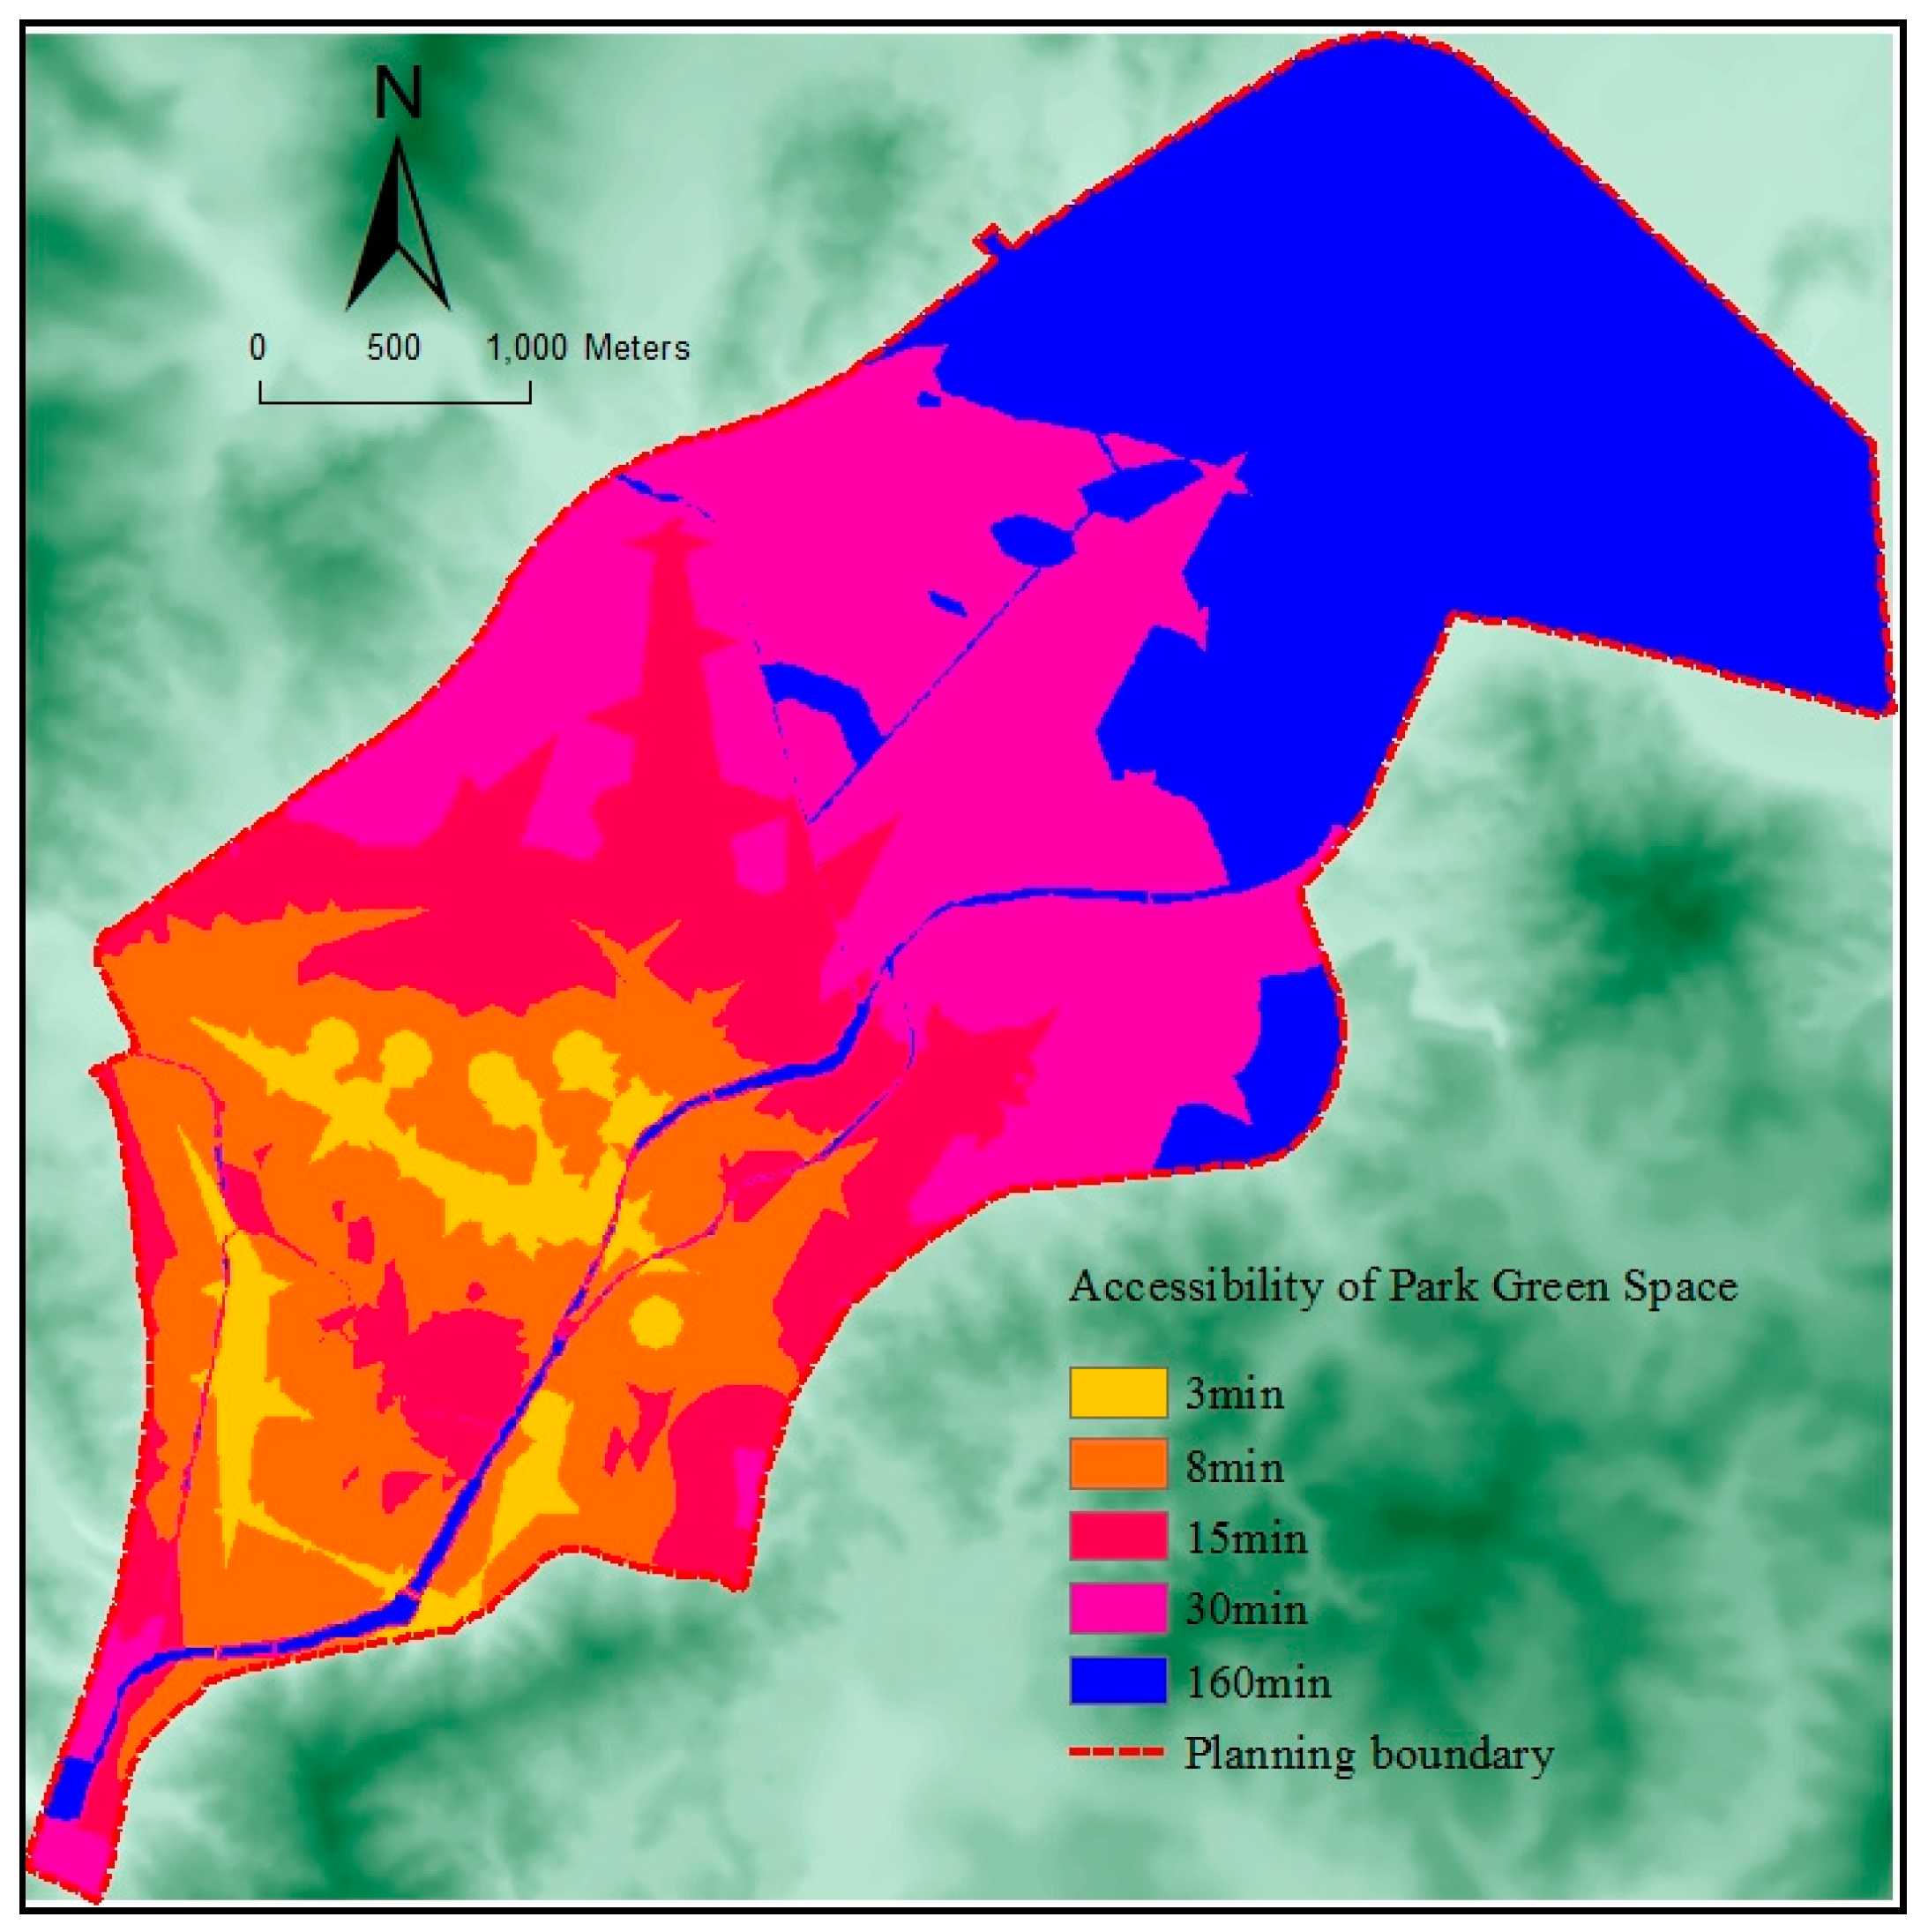
Figure 7.
Accessibility evaluation of public parks in each community.

Figure 8.
Classification of accessibility index in each community.

Figure 9.
Classification of demand index in each community.
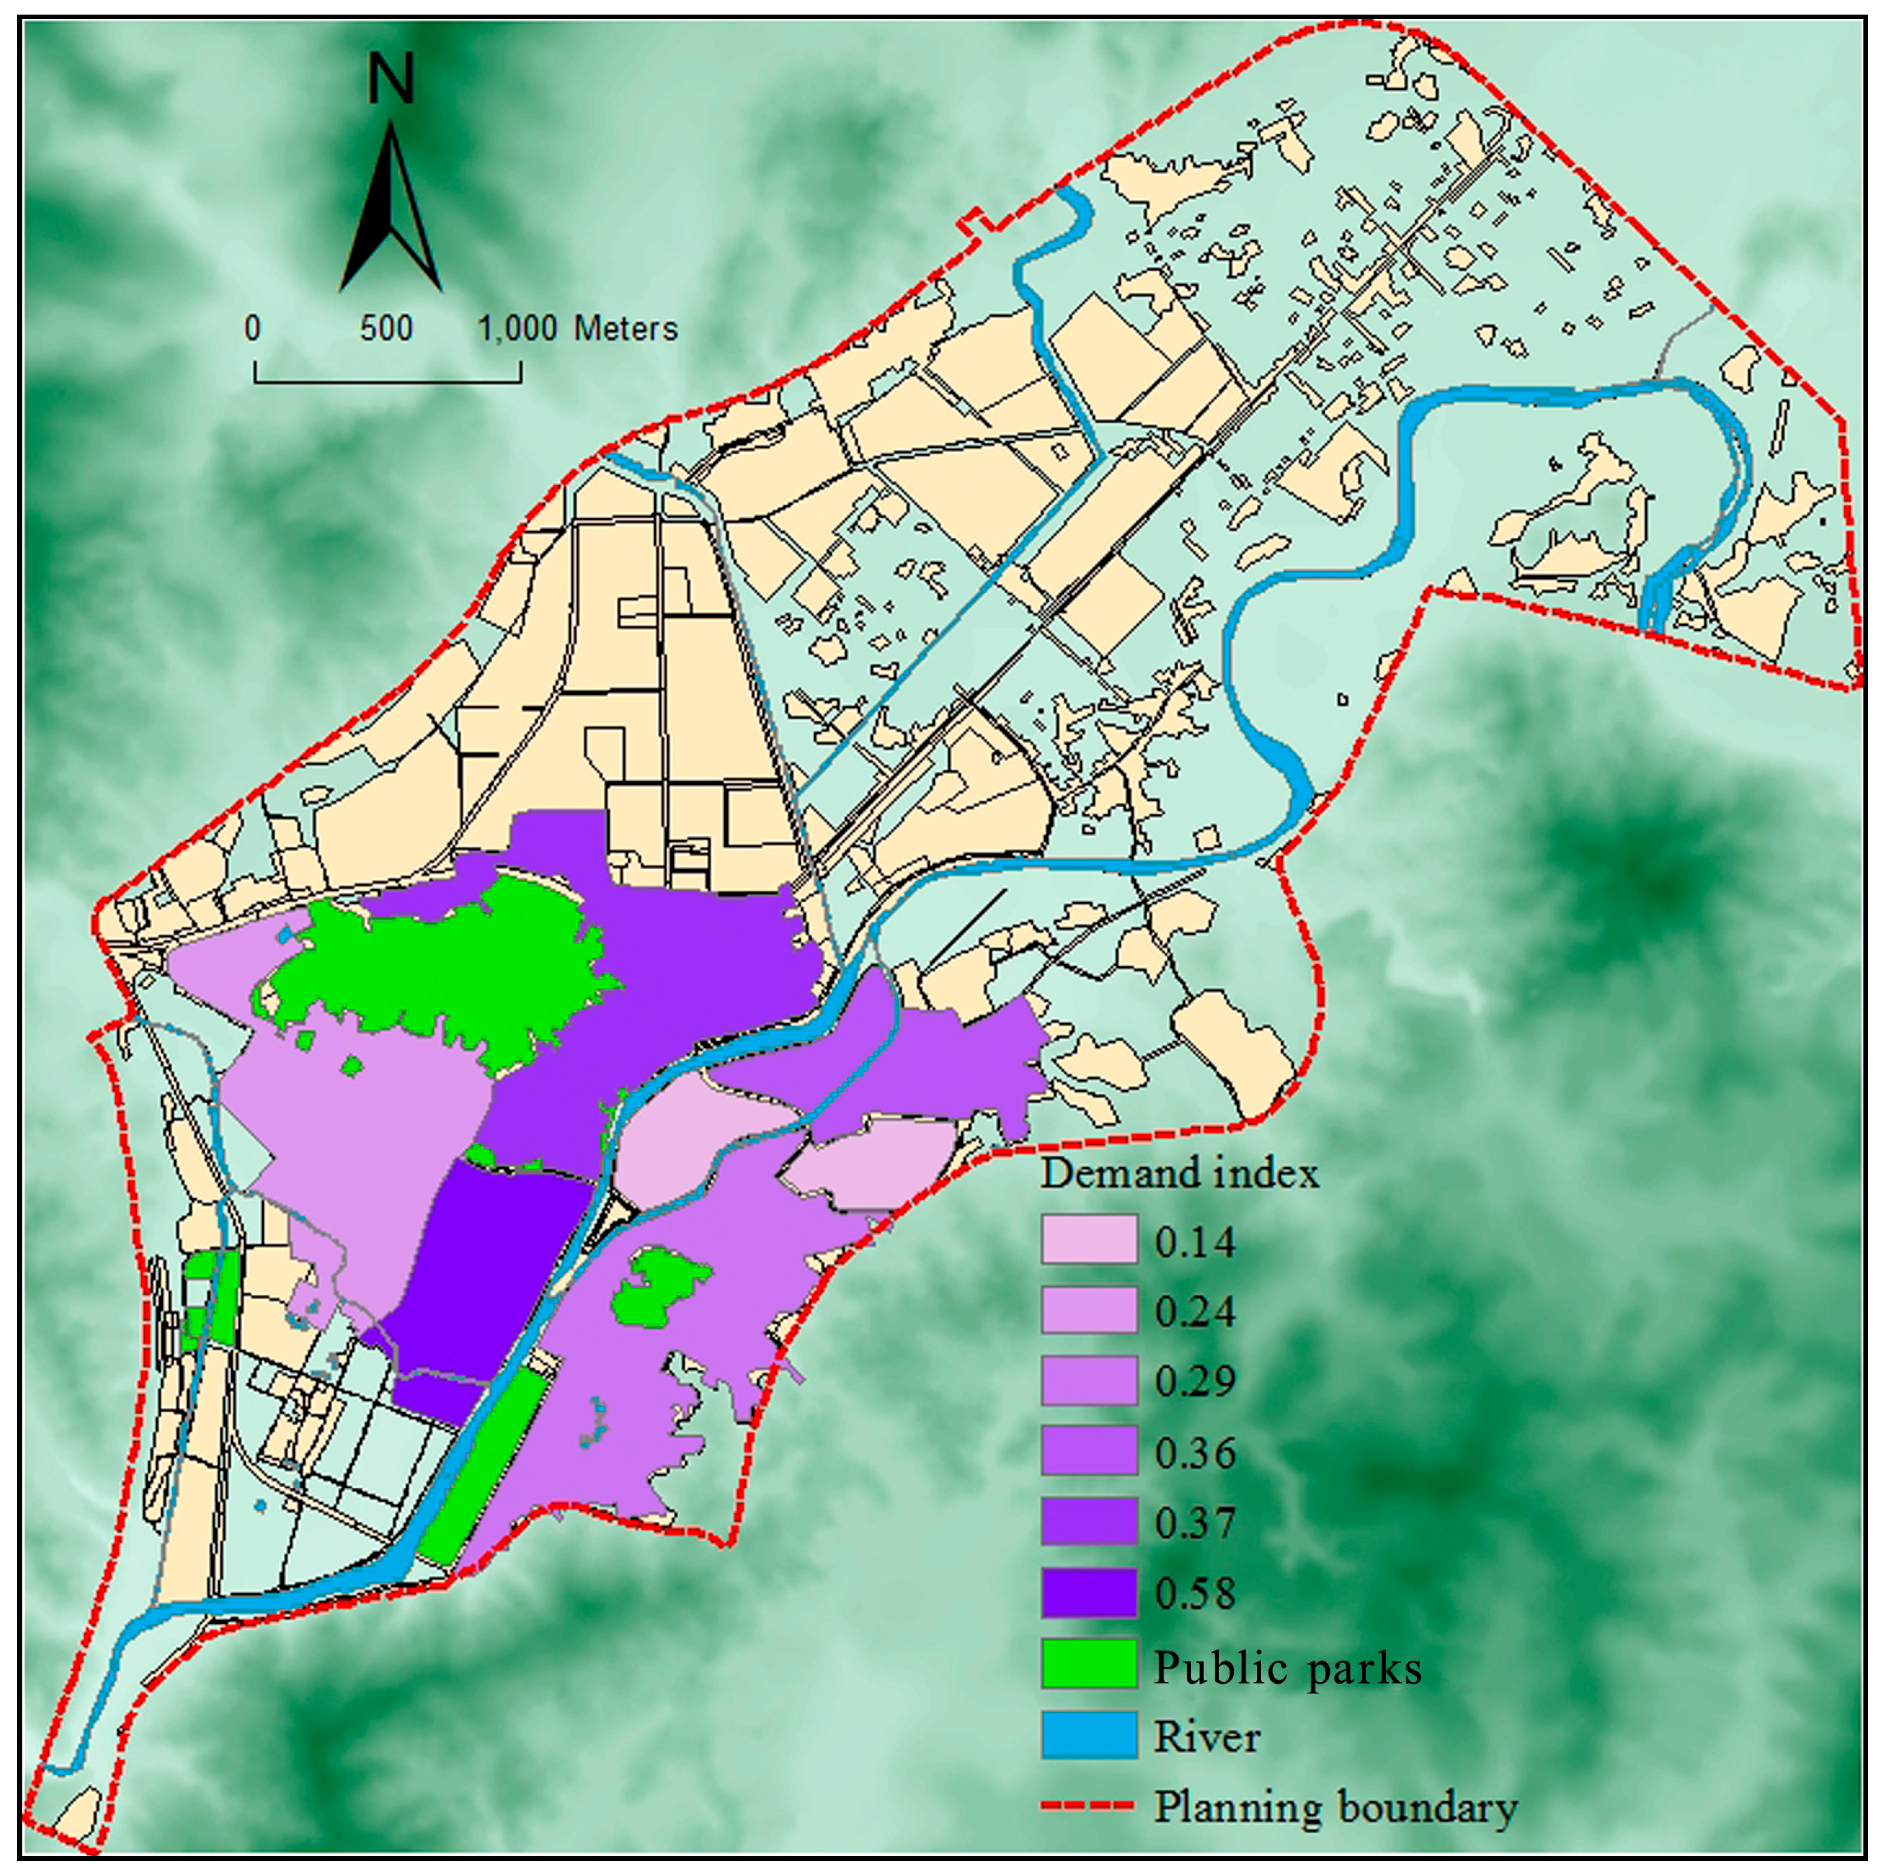
Figure 10.
Community distribution with high demand and low accessibility.

Table 1.
Population proportion of each index in six communities.
| Community | Proportion of the Female Population | Proportion of the Population Aged 0–19 | Proportion of the Population Aged 60 and Over | Proportion of the Ethnic Minority Population | Proportion of the Illiterate Population | Proportion of the Laid-Off Population | Proportion of the Unemployed Population |
|---|---|---|---|---|---|---|---|
| Dongmen Street Community | 49.32% | 25.14% | 13.96% | 0 | 3.45% | 4.60% | 18.10% |
| Ximen Street Community | 49.27% | 30.60% | 13.21% | 0 | 0.82% | 2.90% | 16.80% |
| Nanmen Street Community | 50.60% | 23.25% | 18.47% | 0 | 0.40% | 8.90% | 23.90% |
| Yingbei Street Community | 49.20% | 37.81% | 10.63% | 0.03% | 0.27% | 4.10% | 19.00% |
| Shuidong Street Community | 49.25% | 24.93% | 13.51% | 0 | 1.75% | 2.40% | 8.80% |
| Zhongxinba Community | 49.42% | 25.74% | 12.81% | 0.27% | 1.58% | 2.40% | 16.00% |
Table 2.
Reference standards of time-cost accessibility levels for residents sharing parks.
| Time Cost | <3 min | 3–8 min | 8–15 min | 15–30 min | >30 min |
|---|---|---|---|---|---|
| Accessibility level | Pretty good | Good | Common | Poor | Very Poor |
Table 3.
Statistics results of accessibility in each community.
| Time (Min) | <3 min | 3–8 min | 8–15 min | 15–30 min | |
|---|---|---|---|---|---|
| Accessibility Level | Pretty Good | Good | Common | Poor | |
| Dongmen Street Community | Area (ha) | 15.08 | 28.93 | 41.16 | 1.89 |
| Proportion (%) | 3.82 | 7.34 | 10.43 | 0.48 | |
| Ximen Street Community | Area (ha) | 20.89 | 62.02 | 8.89 | 0 |
| Proportion (%) | 5.29 | 15.71 | 2.25 | 0 | |
| Nanmen Street Community | Area (ha) | 6.00 | 18.61 | 21.78 | 0 |
| Proportion (%) | 1.52 | 4.72 | 5.52 | 0 | |
| Yingbei Street Community | Area (ha) | 6.58 | 61.57 | 24.03 | 0 |
| Proportion (%) | 0.31 | 15.60 | 6.08 | 0 | |
| Shuidong Street Community | Area (ha) | 1.21 | 16.91 | 12.05 | 3.97 |
| Proportion (%) | 0.31 | 4.28 | 3.05 | 1.01 | |
| Zhongxinba Community | Area (ha) | 0 | 4.33 | 28.93 | 9.26 |
| Proportion (%) | 0 | 1.10 | 7.33 | 2.35 | |
Table 4.
Computations of accessibility index at the community level.
| Classification of AI | AI > 0.8 | 0.6 < AI < 0.8 | 0.4 < AI < 0.6 | 0.2 < AI < 0.4 | AI < 0.2 |
|---|---|---|---|---|---|
| Accessibility Level | Pretty Good | Good | Common | Poor | Very Poor |
| Dongmen Street Community | 0.58 | ||||
| Ximen Street Community | 0.82 | ||||
| Nanmen Street Community | 0.59 | ||||
| Yingbei Street Community | 0.78 | ||||
| Shuidong Street Community | 0.39 | ||||
| Zhongxinba Community | 0.17 |
Table 5.
Computations of socially vulnerable groups demand index at the community level.
| Classification of SDI | SDI > 0.4 | 0.3 < SDI < 0.4 | 0.2 < SDI < 0.3 | SDI < 0.2 |
|---|---|---|---|---|
| Demand Level | Pretty High | High | Low | Very Low |
| Dongmen Street Community | 0.37 | |||
| Ximen Street Community | 0.24 | |||
| Nanmen Street Community | 0.58 | |||
| Yingbei Street Community | 0.29 | |||
| Shuidong Street Community | 0.14 | |||
| Zhongxinba Community | 0.36 |
Table 6.
Correlation between accessibility and demand index in Changting.
| Accessibility | Demand Index | |
|---|---|---|
| Spearman Rank Correlation | Kendall Rank Correlation | |
| Cost-weighted distance | −0.086 (P = 0.872) | −0.067 (P = 0.851) |
Table 7.
Overlay result of accessibility and socially vulnerable groups demand index.
| Accessibility Level | Pretty Good Accessibility (AI > 0.8) | Good Accessibility (0.6 < AI < 0.8) | Common Accessibility (0.4 < AI < 0.6) | Poor Accessibility (0.2 < AI < 0.4) | Very Poor Accessibility (AI < 0.2) | |
|---|---|---|---|---|---|---|
| Classification of SDI | ||||||
| Very low demand (SDI < 0.2) | Shuidong Street Community | |||||
| Low demand (0.2 < SDI < 0.3) | Ximen Street Community | Yingbei Street Community | ||||
| High demand (0.3 < SDI < 0.4) | Dongmen Street Community | Zhongxinba Community | ||||
| Pretty high demand (SDI > 0.4) | Nanmen Street Community | |||||
© 2017 by the authors. Licensee MDPI, Basel, Switzerland. This article is an open access article distributed under the terms and conditions of the Creative Commons Attribution (CC BY) license (http://creativecommons.org/licenses/by/4.0/).
Share and Cite
MDPI and ACS Style
Yuan, Y.; Xu, J.; Wang, Z. Spatial Equity Measure on Urban Ecological Space Layout Based on Accessibility of Socially Vulnerable Groups—A Case Study of Changting, China. Sustainability 2017, 9, 1552. https://doi.org/10.3390/su9091552
AMA Style
Yuan Y, Xu J, Wang Z. Spatial Equity Measure on Urban Ecological Space Layout Based on Accessibility of Socially Vulnerable Groups—A Case Study of Changting, China. Sustainability. 2017; 9(9):1552. https://doi.org/10.3390/su9091552
Chicago/Turabian StyleYuan, Yanhua, Jiangang Xu, and Zhenbo Wang. 2017. "Spatial Equity Measure on Urban Ecological Space Layout Based on Accessibility of Socially Vulnerable Groups—A Case Study of Changting, China" Sustainability 9, no. 9: 1552. https://doi.org/10.3390/su9091552
Note that from the first issue of 2016, this journal uses article numbers instead of page numbers. See further details here.