Generational Differences in the Perception of Corporate Culture in European Transport Enterprises


1
Institute of Technology and Business in České Budějovice, Faculty of Technology, Okružní 517/10, 370 01 České Budějovice, Czech Republic
2
Technical University in Zvolen, T. G. Masaryka 24, 960 53 Zvolen, Slovakia
*
Author to whom correspondence should be addressed.
Sustainability 2017, 9(9), 1561; https://doi.org/10.3390/su9091561
Submission received: 28 June 2017
/
Revised: 7 August 2017
/
Accepted: 30 August 2017
/
Published: 4 September 2017
Abstract
:The workforce of an enterprise consists of employees of various ages with different personality types. Members of each generation differ not only in their behaviour, but also in their attitudes and opinions. A manager should identify generational differences. Subsequently, the management style, leadership and employee motivation should be adapted forasmuch as well-motivated employees are able to affect the efficiency of enterprise processes in right way. The objective of the paper is to identify differences in perception of the preferred level of corporate culture in terms of various generations. Preferred level of corporate culture in six areas is evaluated using a questionnaire consisting of 24 questions. Sixty-four European transport enterprises are engaged in the survey. Following the outcomes, we find that all generations of respondents working in the European transport enterprises prefer clan corporate culture in the course of five years. This culture puts emphasis on employees, customers and traditions. Loyalty and teamwork are considered to be the essential tools for business success. Following the statistical verification using the ANOVA test, we can state that the hypothesis regarding the existence of generational differences in the perception of corporate culture was not confirmed.
1. Introduction
New technology and increasing globalisation reflect in the changing nature of work [1,2]. Rising demand for product quality can be seen in order to meet customer needs at the highest level [3,4]. Economy relies upon intellectual abilities more than upon physical labour. In the context of personnel management, work with people in various areas plays a key role [5]. Managers at all levels are required to learn new skills. Their main task is to define a way of managing employees of various age groups that will result in contribution of the employees to the enterprise goals and achieving a higher level of employee performance. Each generation has its particularities, unique standards and different culture as well as behaviour; therefore, the managing process is extremely demanding.
Making an effective connection between communication and workforce means the ability to overcome cultural barriers in the work environment. Organizational culture comprises the fundamental values, assumptions, and beliefs held in common by members of an organization [6]. It is stable, socially constructed, and subconscious. Employees impart the organizational culture to new members, and culture influences in large measure how employees relate to one another and their work environment. Theorists propose that organizational culture is among the most critical barriers to leveraging new knowledge and implementing technical innovation [7].
A corporate culture represents behaviour and feelings of employees in the work environment. Moreover, it represents values shared by the organization members and passed down through the generations [8]. Provided that values and standards resulting in patterns of behaviour are widely shared throughout the organization, the corporate culture is strong and affects running of the enterprise significantly [9]. Organizational culture represents a higher-order construct or shared property of the organization [10]. The fact that corporate culture is considered to be a key factor affecting the financial performance and, at the same time, a critical factor determining organisation success or failure is the main reason for emphasizing the importance of corporate culture [11,12,13].
Organizational culture is a topic of considerable interest to organizational researchers, management consultants, and corporate executives alike [14]. Organizational culture is the overall characteristic of an organization; it is manifest in various aspects and areas of its activity [15,16,17,18]. Organizational culture has been described as a management tool [19], credited with creating a competitive advantage [20], as the reason behind merger and acquisition failure [21], viewed as an essential determinant of management practice [22], and for providing the basis for success [23,24]. An organization’s culture is also thought to be intricately related to its leadership, particularly its upper echelon leaders [19,25,26,27,28]. In public administration and service delivery, organizational culture is widely considered to be one of the most significant factors in reforming and modernizing [29]. Further research studies prove that enterprises with stronger corporate culture tend to be more efficient than those with weak corporate culture [9]. Thus, managers devote more attention to corporate culture nowadays and focus on its improvement [30]. It may even be argued that corporate culture is like an enterprise personality [31]. Furthermore, each enterprise has its specific corporate culture that differs from the corporate culture of other businesses. It is affected especially by employees. Moreover, their behaviour and actions affect not only corporate culture, but also the enterprise as a whole. They are the most valuable asset of an enterprise as its market success is affected by their performance significantly [32,33]. When such organization focuses on sustainable development, it strengthens its own competitiveness as well as the competitiveness level of a country and/or an industry, where it operates [34].
Regarding the term generation, it is defined as an identifiable group that shares year of birth and, hence, same significant life events and historical and social life experience. Whereby, it results in how the given generation differs from one to another [35]. At the present time, workforce consists of five general groups: Generation Z (from the beginning of the millennium up to the present), Generation Y (from the early 1980s to the end of millennium), Generation X (from the mid-1960s to the early 1980s), Baby Boomers (Post-war generation), and Veterans (the World War II generation) [36].
Generation Z (2000–present) is known as a mobile generation because this generation has grown up with technology (ranging from mp3 players, websites, short messages to YouTube, iPads and other digital media technology). Members of the generation can be described as self-confident, happy team players with an interest in social services and activities. Work is a means for achieving their dreams, but unless they succeed, they are unhappy. In fact, happiness is important for people of this generation and if they cannot find happiness in the workplace, they are able to leave it fairly quickly. In addition, these individuals like independence, yet they dislike authority [37]. Forasmuch as this generation has not been economically productive yet, it is not included in the research.
Members of Generation Y (1980–1999) grew up in the era of socio-economic, cultural and technological changes that represent certain differences in values, beliefs, attitudes and preferences [38]. Members of the generation are team players with a strong sense of group formation. Moreover, they need to feel appreciated and recognized in their workplace and they are willing to learn and grow as well. However, unless their work environment provides these options, they will leave it without hesitation [39]. Work values and beliefs of Generation Y are completely different in comparison to Baby Boomers and Generation X. This generation was affected especially by the most significant historical development, by the information and communication technology development. As a result, Generation Y is viewed as the most digitally-skilled generation with technologically capable employees [40] who are considered to be the most demanding, confident and best-educated to date [41]. They often “want everything” and they “want it right now”, whether it is a perfect salary, benefits, quick career progression, balance between life and work, or carrying out interesting and stimulating work that benefits society. Moreover, performing a meaningful and fulfilling job is more important for them than a payslip [42].
Generation X (1965–1980) grew up in the era of major technological innovations. Its members have been active in their workplaces over the past 30 years and form a large part of employment statistics [39]. This generation works to live rather than lives to work. Moreover, the higher rate of blended families (stepfamilies) while growing up results in their behaviour based on independence. Thus, employees of this generation are independent, autonomous and self-sufficient, and, although they show strong feelings of loyalty to their families and friends, they are not too loyal to their employers [41]. Additionally, they are more willing to adapt, even though they are often distrustful and pessimistic about authority [36]. They prefer to work independently and work–life balance is an important factor for them, but they consider personal goals to be more important than work goals [43,44]. In spite of being mostly individualistic, they like teamwork. Values essential for them may include lifelong learning, skill development, feedback or flexible plans. Due to the fact that young age of this generation is connected with technologically advanced environment, they prefer jobs with this kind of environment available [45].
The name “Baby Boomers” arose from an enormous increase in birth rates between 1946 and 1964 [41]. This generation grew up in times of economic growth and its members experienced many historical events and political upheavals of the post-war period. Therefore, these individuals are ambitious and highly competitive. They put an emphasis on their organizations and the loyalty to them, and are more likely to remain in the same workplace for most of their lives [39]. As well as, they have a strong work ethic, focus on tasks [43] and are often considered to be workaholics believing that hard work and sacrifice are the price for success. Although they want their success to be recognized, continued feedback may offend them. They are also open, liberal, avoid conflicts and their values include healthy lifestyle, personal growth, personal satisfaction, and job security [41].
The generation of “Veterans” (1925–1945) belongs to a period affected by The Great Depression and the Second World War. Its members are disciplined and conservative with a sense of duty, formality and top-down management. Such employees need to be respected and participate in decision-making process based on how work was performed in the past. They are loyal, firmly committed to teamwork and cooperation [41]. In addition, they are characterized by traditional values, detailed workplace orientation, hard work, resistance to change and a low risk threshold as well as experience, willingness to listen, respect for authorities, adherence to rules and respect towards an organizational structure [45,46].
As age increases, people acquire knowledge, experience and skills that influence their opinions, values, convictions, attitudes, preferences and goals. Various research studies [35,36,37,38,39,40,41,42,43,44,45] confirm the existence of differences among individual generations. When taking into account the generational differences in terms of corporate culture, it is necessary to emphasise that the values and experience appreciated by each generation are various. Therefore, their work habits, general attitude towards life and work vary as well. Besides that, approach to education, motivation, collaboration with colleagues and obtaining new information of each generation are different [46,47]. The main objective of the paper is to identify particular differences in the perception of preferred level of corporate culture in terms of generations. Successful leader should be familiar with the features of each generation, should be able to communicate with their members effectively, understand the importance of diversities and increase the efficiency in a workplace because satisfied, motivated and engaged employees have the abilities to affect the enterprise performance in positive way [36].
2. Materials and Methods
The research aimed at corporate culture was conducted in various transport enterprises during 2015–2017 (Table 1). In total, 1159 respondents from 64 companies operating on the European transport market were engaged in the research in total (Czech Republic, Lithuania, Hungary, Germany, Poland, Portugal, Austria, and Slovak Republic).
The OCAI (Organizational Culture Assessment Instrument) questionnaire was used in the research. OCAI is based on the Competing Values Framework model [47]. The framework is a synthesis of organizational theories, and posits that most organizations can be characterized along two dimensions, each representing alternative approaches to basic challenges that all organizations must resolve in order to function [48]. Two basic dimensions are flexibility versus control and internal versus external focus. Their combination resulted in four types of culture: clan, adhocracy, hierarchical and market [49]. The corporate culture content is detected through six components, i.e., Dominant Characteristics, Organizational Leadership, Management of Employees, Organization Glue, Strategic Emphases, and Criteria of Success. The components are examined by four statements corresponding to Alternative A, B, C, and D. These four criteria/alternatives characterize the basic values according to which the organization is assessed. Each statement corresponds to one of the four culture types [49]. An example item from the Clan scale is “The organization is a very personal place. It is like an extended family. People seem to share a lot of themselves”. An example item from the Adhocracy scale is “The organization is a very dynamic and entrepreneurial place. People are willing to stick their necks out and take risks”. An example item from the Hierarchy scale is “The organization is a very controlled and structured place. Formal procedures generally govern what people do”. An example item from the Market scale is “The organization is very results-oriented. A major concern is with getting the job done. People are very competitive and achievement-oriented” [50]. While completing the questionnaire, the respondents were to evaluate the future direction of corporate culture of their organization. Respondents expressed their opinion on the most important factors in terms of corporate performance. They allocate 100 points according to the description of the organisation given in the statement. Following the applied methodology, all partial results are presented in tables and figures. Table 2, Table 3, Table 4, Table 5, Table 6 and Table 7 present the highest score achieved in each of six surveyed fields, based on the employee perception ranked into the appropriate age categories. Since the important differences in numerical series are much more understandable when they are recorded in charts, for better comparison of preferred values in terms of age of respondents, the achieved results are transformed into Figure 1, Figure 2, Figure 3, Figure 4, Figure 5 and Figure 6. The overall corporate culture profile represents the final output of the OCAI methodology. It provides an overview of the underlying assumptions and operating values in the analysed European transport enterprises (Table 8 and Figure 7). There are no right and wrong responses as there is no “good” and “bad” corporate culture [49]. These four cultures are proposed as archetypes. In reality, organizations are expected to reflect all four cultures to some degree. The Competing Values Framework does not specify a preferred organizational culture, and there are many competing hypotheses about what cultures or combinations of cultures are superior and under what conditions [51]. However, a fundamental supposition of the Competing Values Framework is that all four cultures operate at an organizational level and remain relatively stable over time [48]. Furthermore, all four cultures are hypothesized to permeate most facets of the organization, from the comportment of its managers, to the values that bind employees to one another, to the priorities the organization pursues. Therefore, one expects the dominant culture to manifest itself in the views of employees at all levels of the organization [47,48]. The OCAI [49,52] provides a diagnostic assessment of culture based on an examination of core values, shared assumptions, and common approaches to work. It is a classification approach to culture [54], and was designed to identify existing organizational culture as a prelude to cultural change. While acknowledging that the quantitative measurement of culture is controversial (e.g., [54]), Cameron and Quinn [49] claimed that the OCAI’s use of quantitative data gathered from multiple individuals within the organization, tapping into the core values and related assumptions woven into the organization, can provide a realistic representation of its culture. In order to identify particular differences in the levels of corporate culture in terms of distribution of respondents by age the following tools were used: descriptive statistics, averages, dispersions, standard deviations, p-level and analysis of variance. Obtained results are presented in Table 9 and Table 10.
3. Empirical Results
In total, 1159 respondents from transport enterprises in Europe were engaged in the research aimed at statistical verification of the existence of significant differences in the respondents’ opinions. The research was conducted using the ANOVA test. Respondents were asked to respond to the 24 items based on their perceptions of ideal organisational practices [50]. Then, respondents distributed 100 points between four statements to indicate organizational relevance. In the first studied field (Dominant Characteristics), respondents of all ages agreed and the highest importance attached to alternative A. The highest average score is highlighted in bold in Table 2. Therefore, over the next five years, the tools typical of Alternative A should be applied to the transport enterprises, i.e., collaboration, teamwork, participation and communication. The enterprise itself is perceived as a family rather than a business entity.
Comparison of generational differences in dominant characteristics is illustrated in Figure 1 as well.
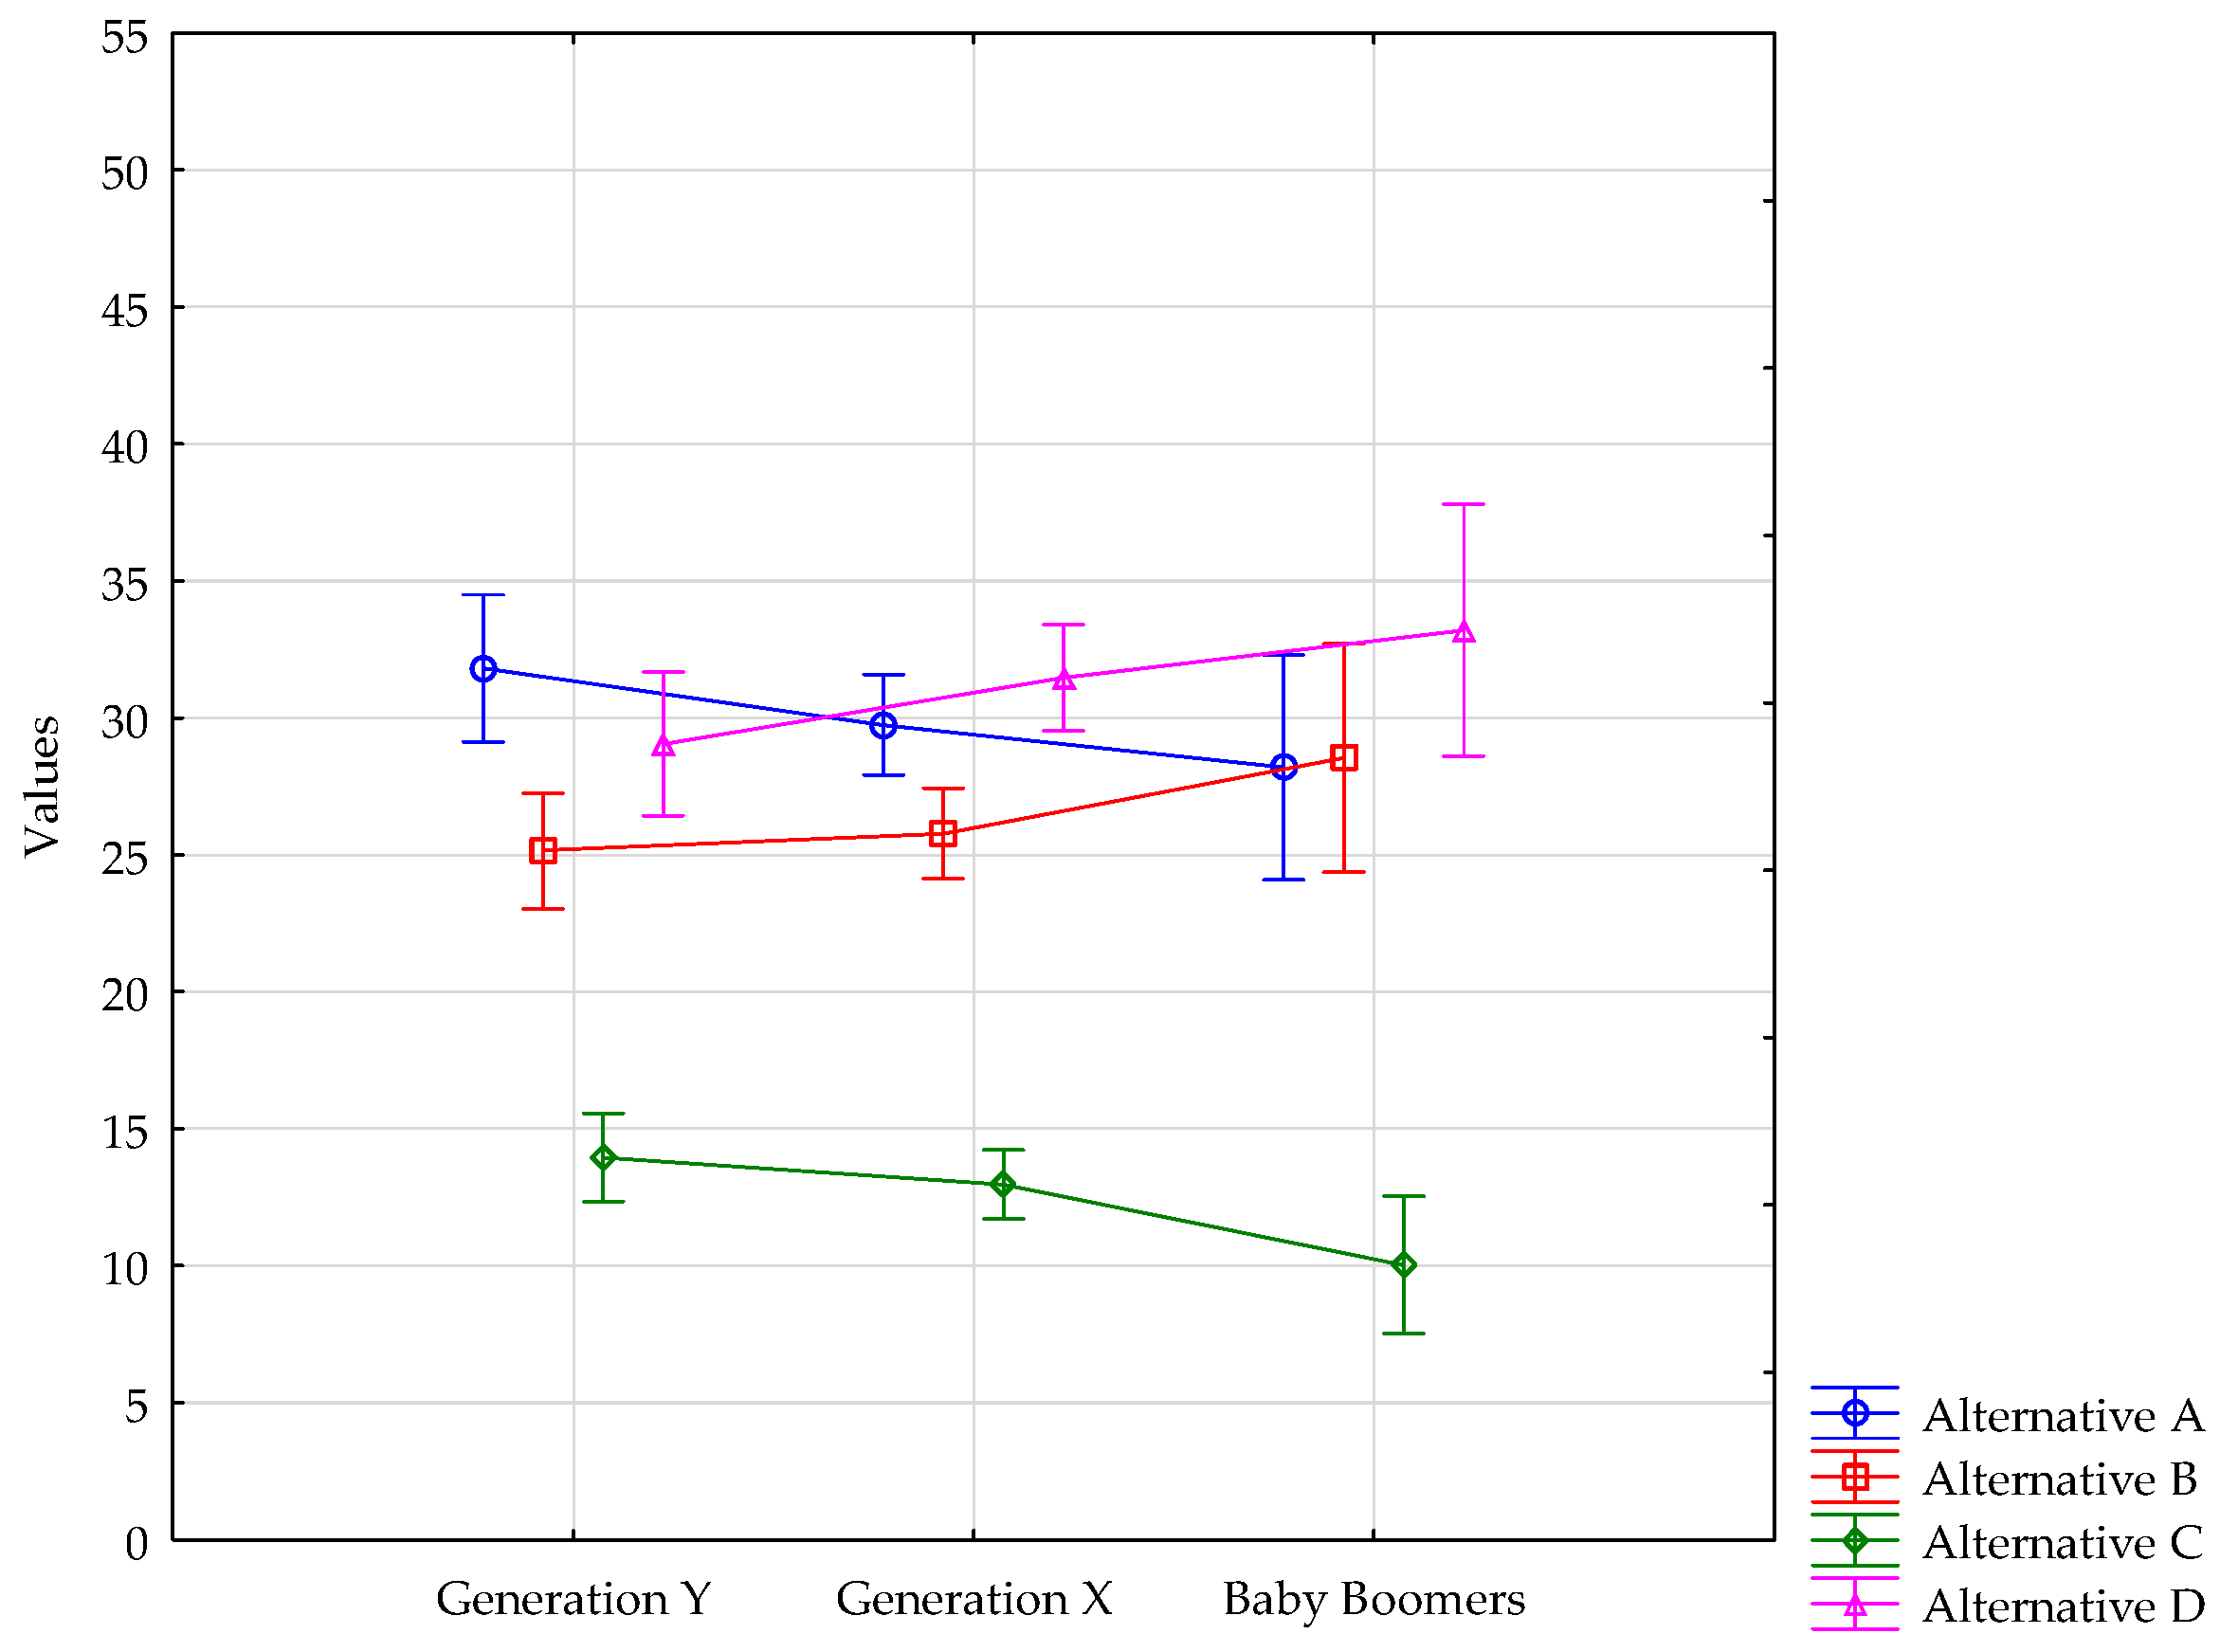
Organizational Leadership was the second component examined. The outcomes are shown in Table 3 and Figure 2. Alternative A was preferred by respondents of Generation Y. Following the research methodology, Organizational Leadership is characterized as a way of its demonstrating through a counsellor, an assistant and/or a caretaker, who should focus more on cooperation and communication. On the contrary, Generation X and Baby Boomers prefer collaboration, organization and performance, with senior executives striving for smooth, stress-free running of all enterprise processes in their future leadership. Alternative D was preferred. Timeliness, effectiveness, coherence and consistency are important as well.
The OCAI methodology was used to examine the Management of Employees as the third component. Alternative A was the most preferred one when examining Management of Employees (Table 4, Figure 3). The highest average values were attached to this alternative. According to opinions of all respondents at all ages, the factors typical of Alternative A such as teamwork and cooperation should be the decisive factors over the next few years.
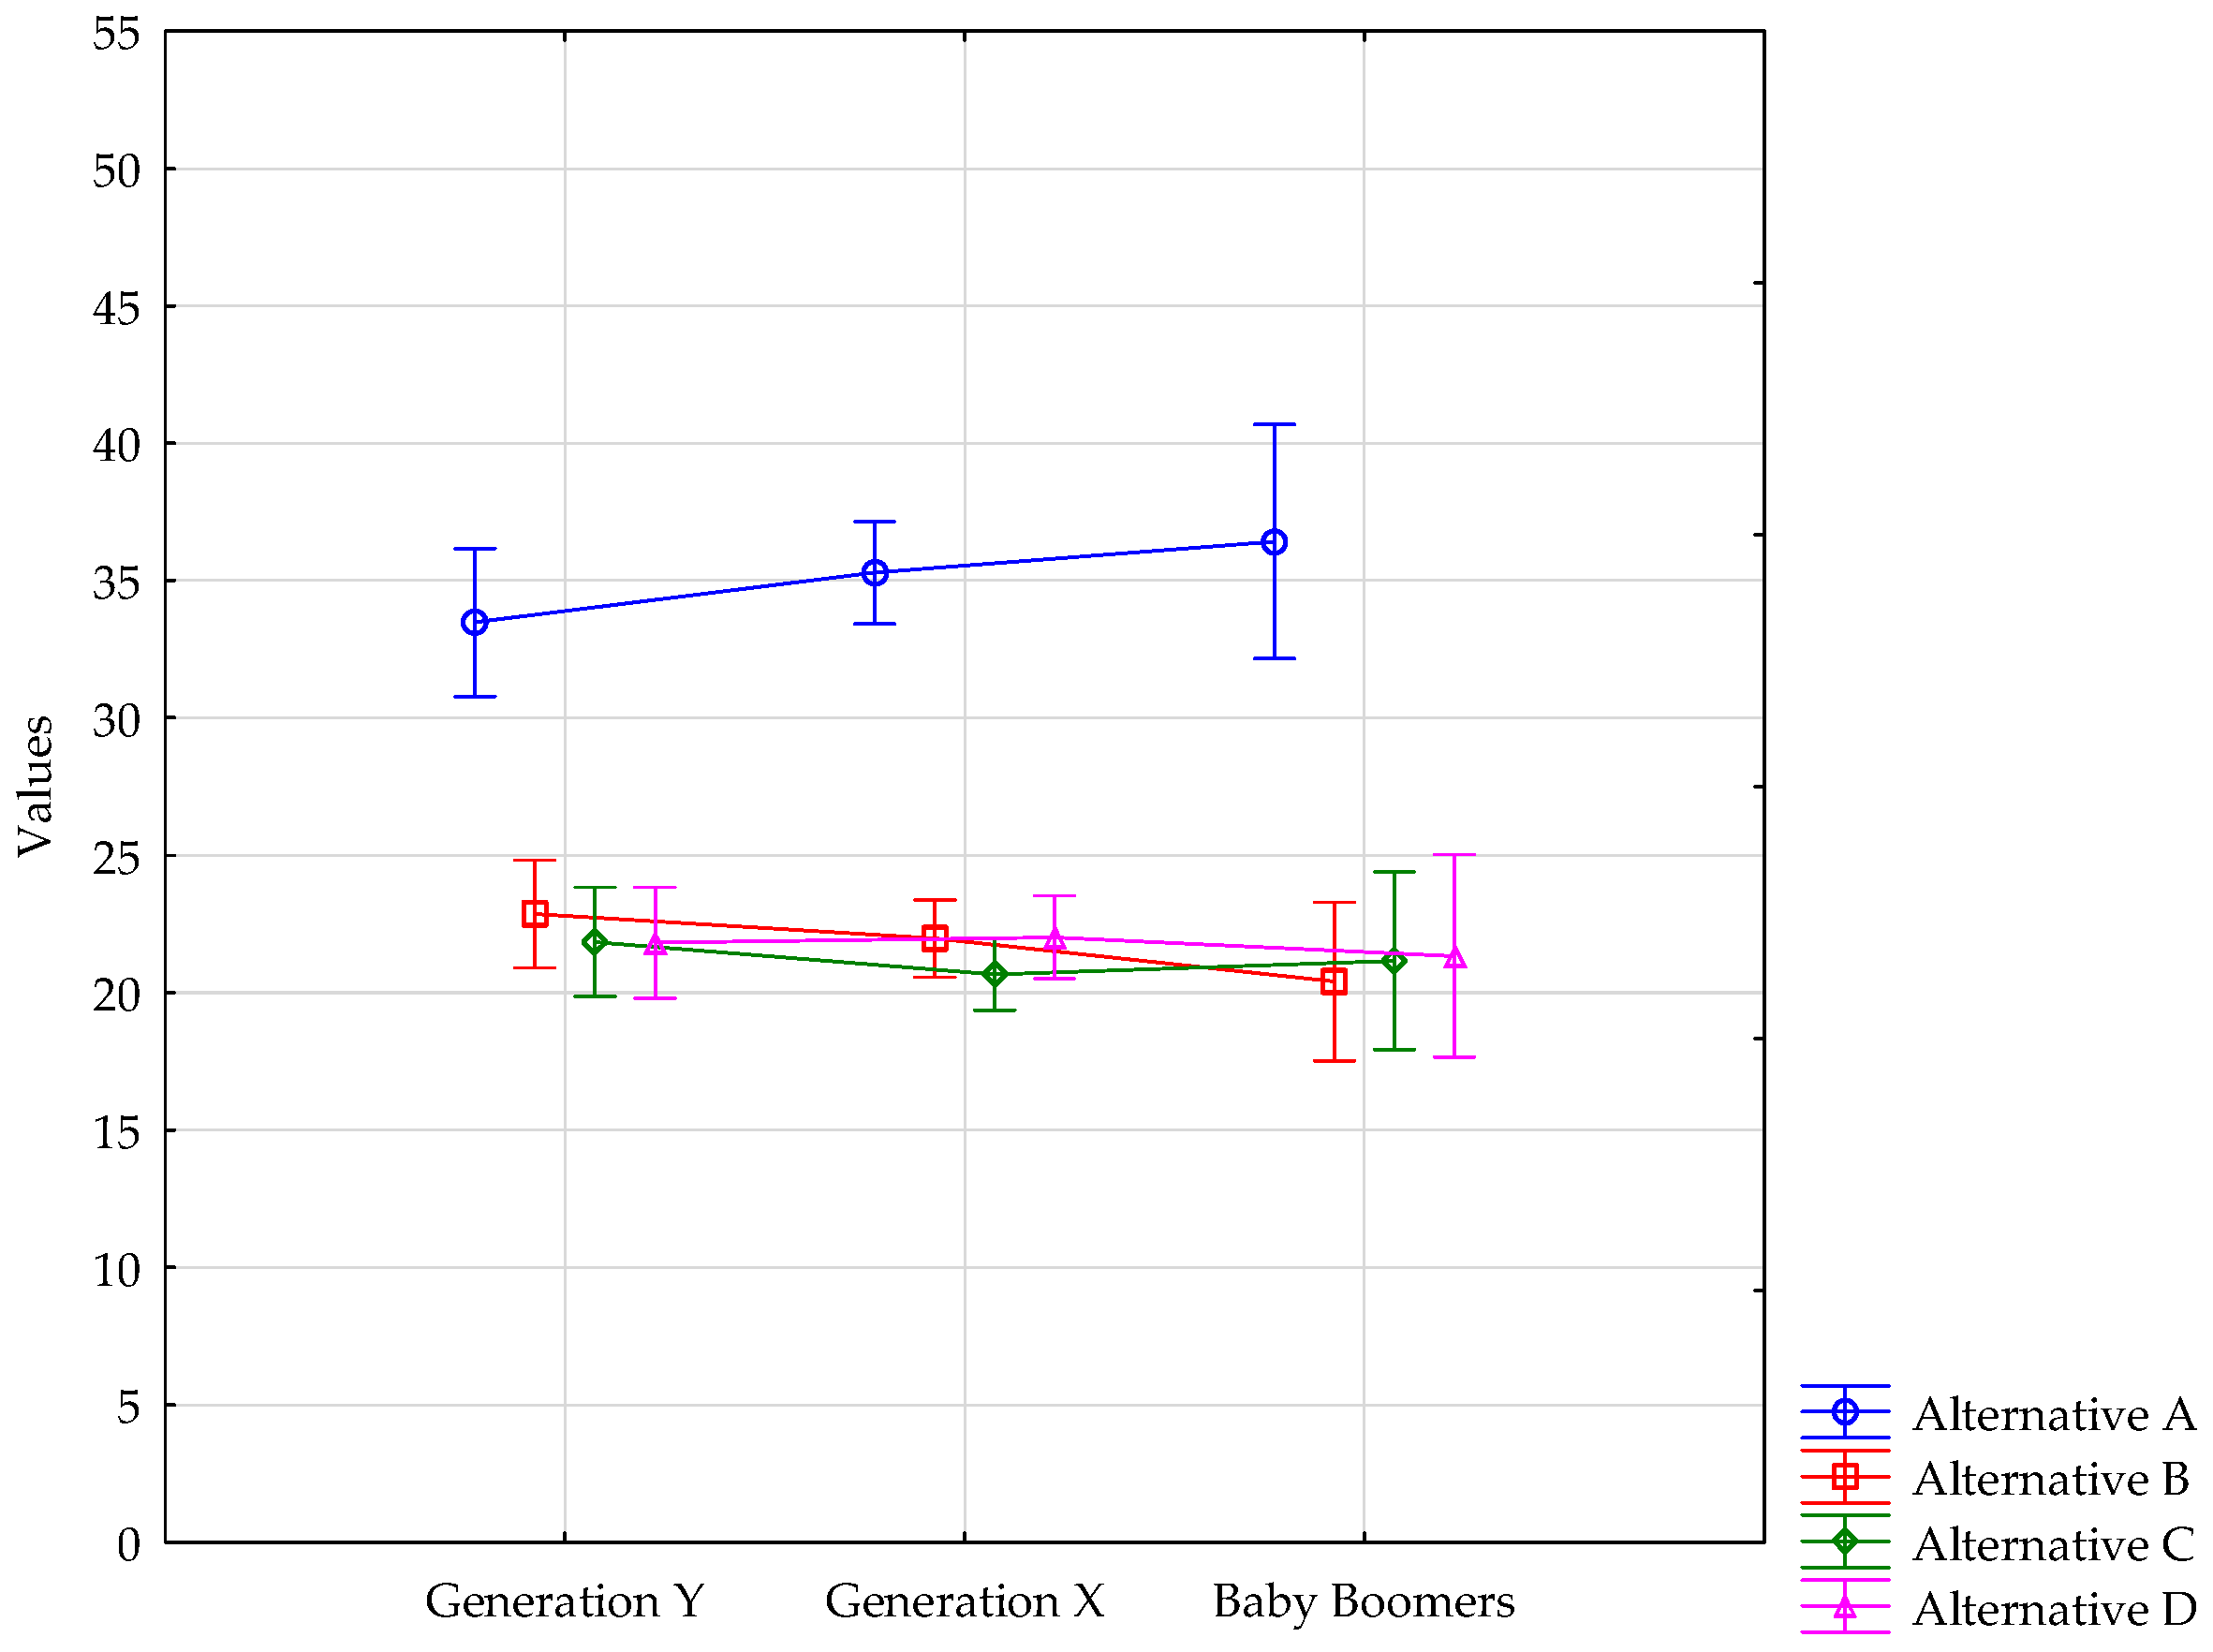
Following the outcomes presented in Table 5 and Figure 4, it can be concluded that, in the fourth analysed field represented by the Organization Glue, employees working in European transport companies preferred Alternative A. Therefore, corporate policy, well-established rules, innovation or development are not as significant as loyalty and mutual trust, which belong among the most preferred factors “gluing” (bonding and putting) employees together in the transport enterprises.
Strategic Emphases in the transport enterprises are evaluated in Table 6 and Figure 5. Following the respondents’ opinions, the strategies of such companies should be focused on human development, high trust, openness and inertial cooperation, which are the factors typical of Alternative A.
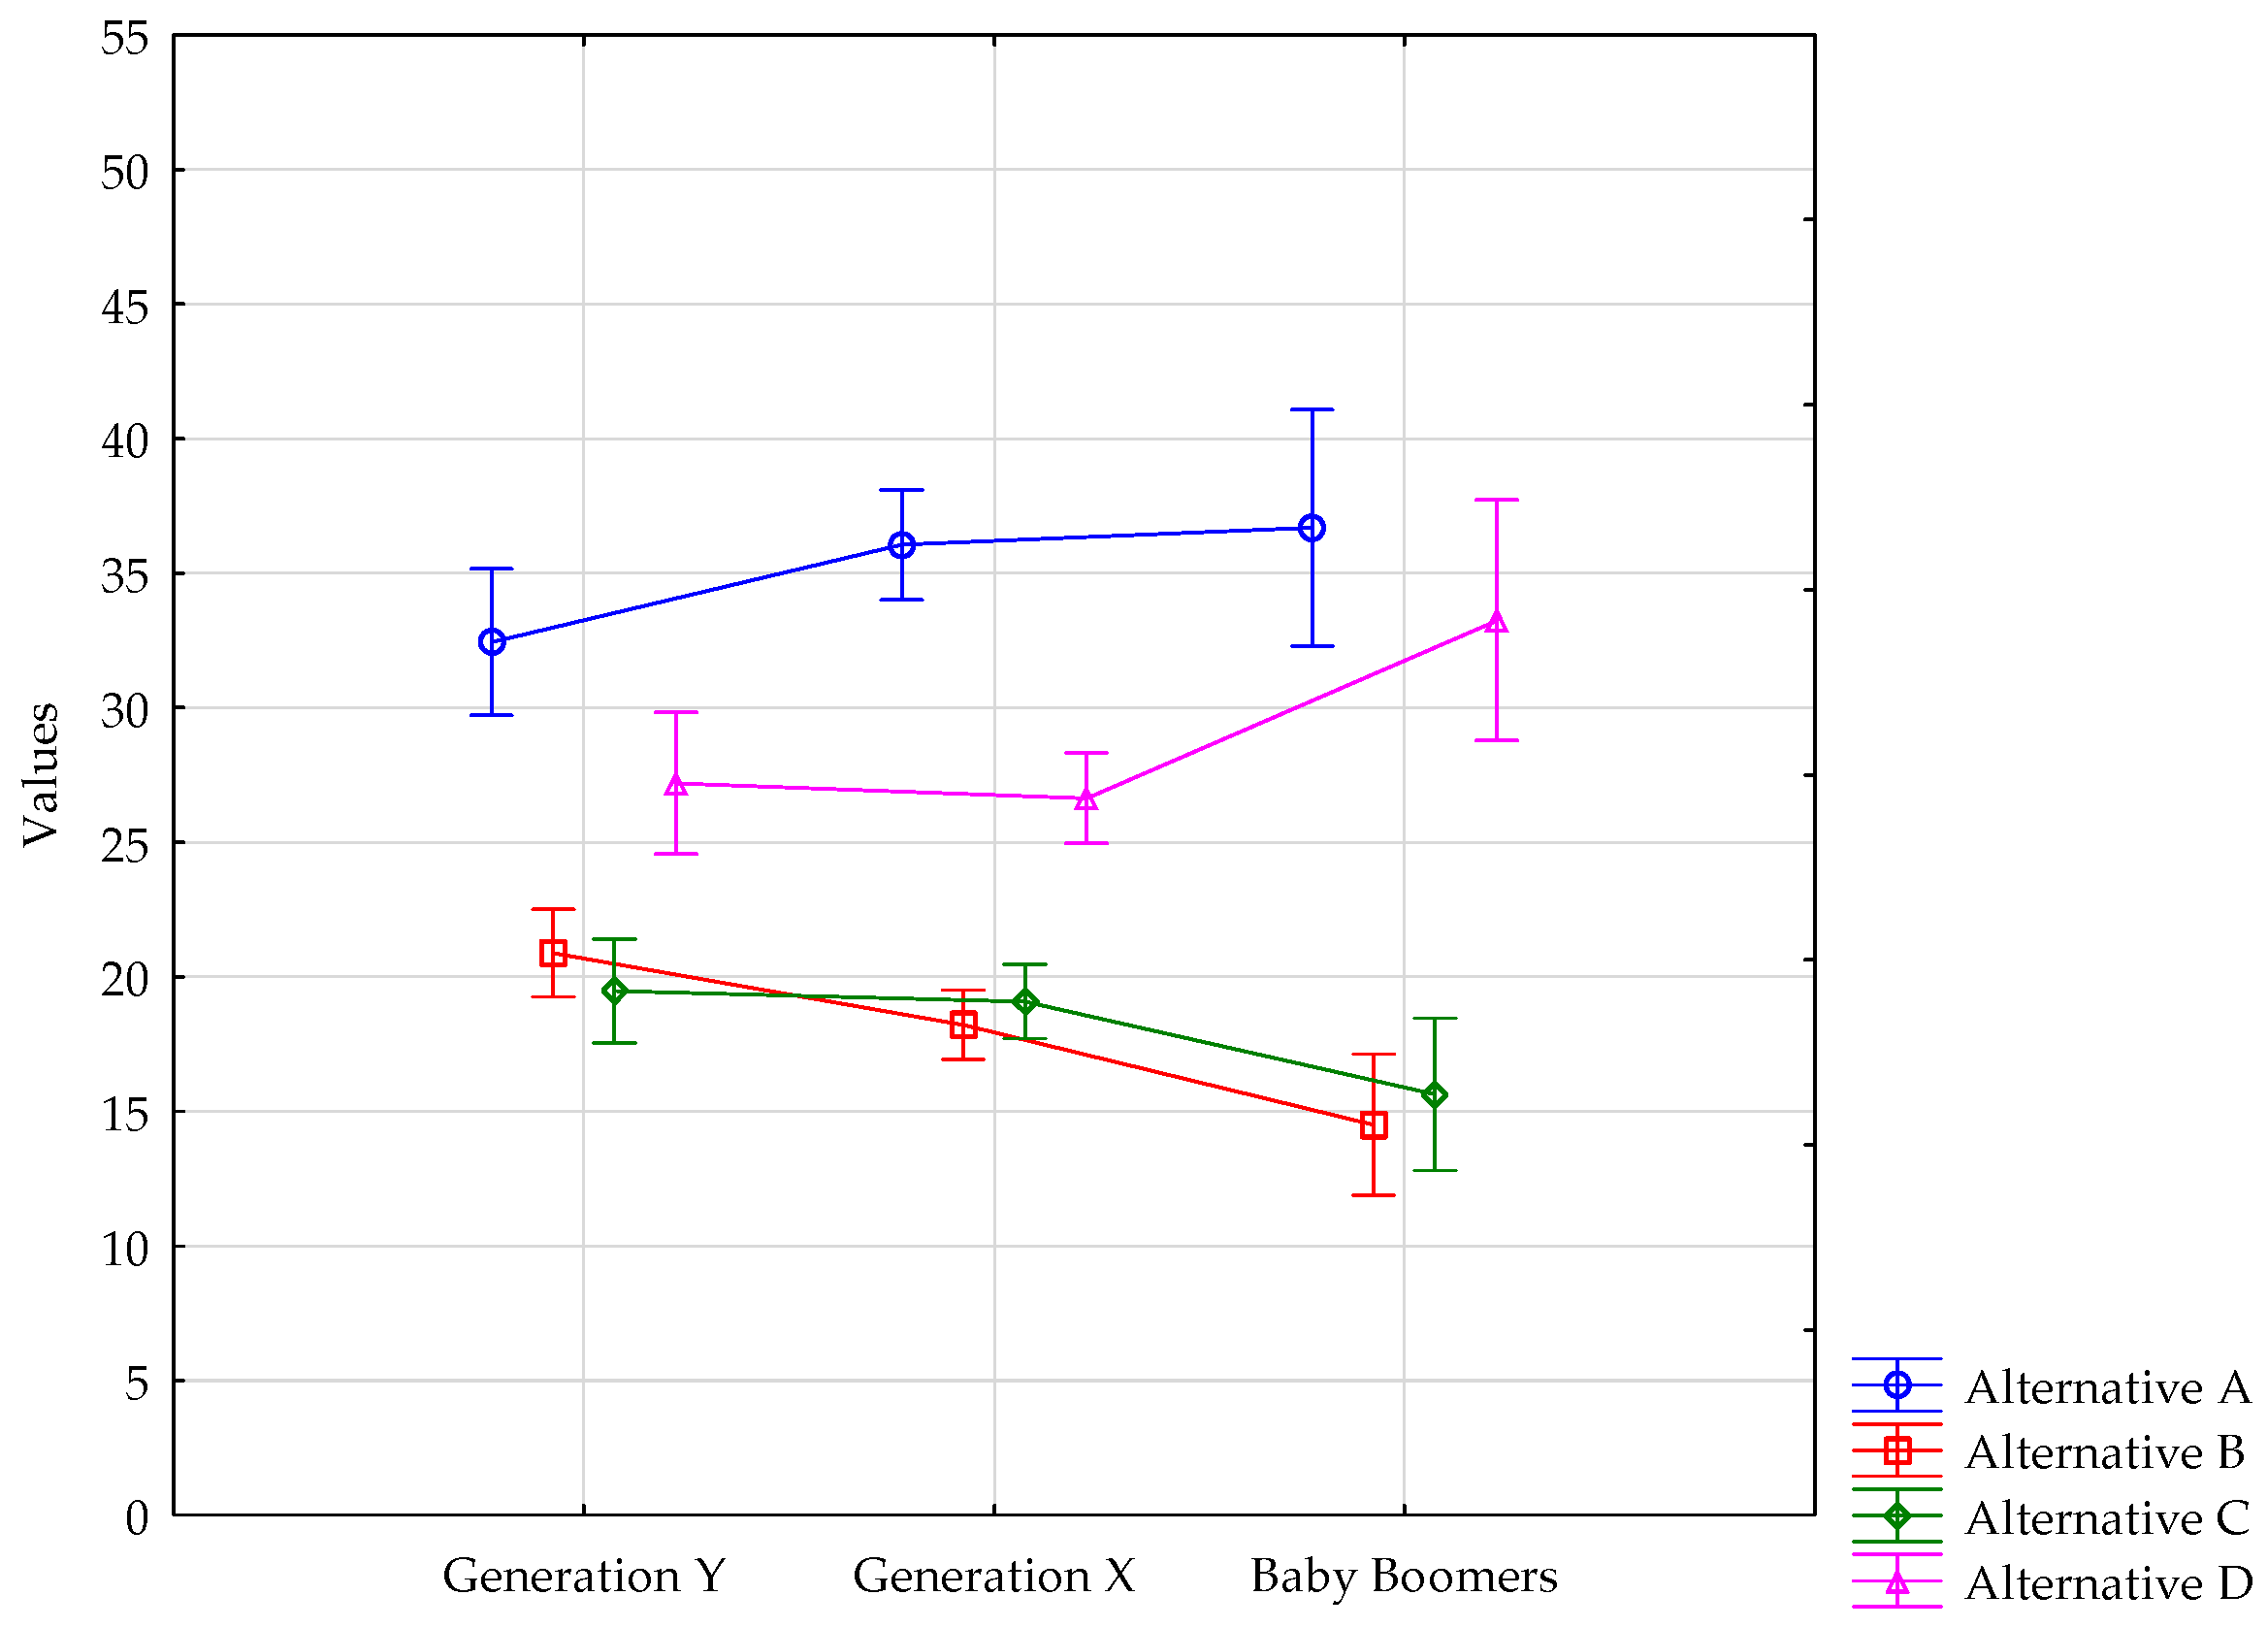
When taking into consideration the Criteria of Success, Alternative A was preferred by all generation groups. Obtained results are summarized in Table 7 and Figure 6. Respondents from all generations stated that teamwork, together with human resource development, should be the criteria in the centre of attention of the transport enterprises in order to build their success on over the next five years.
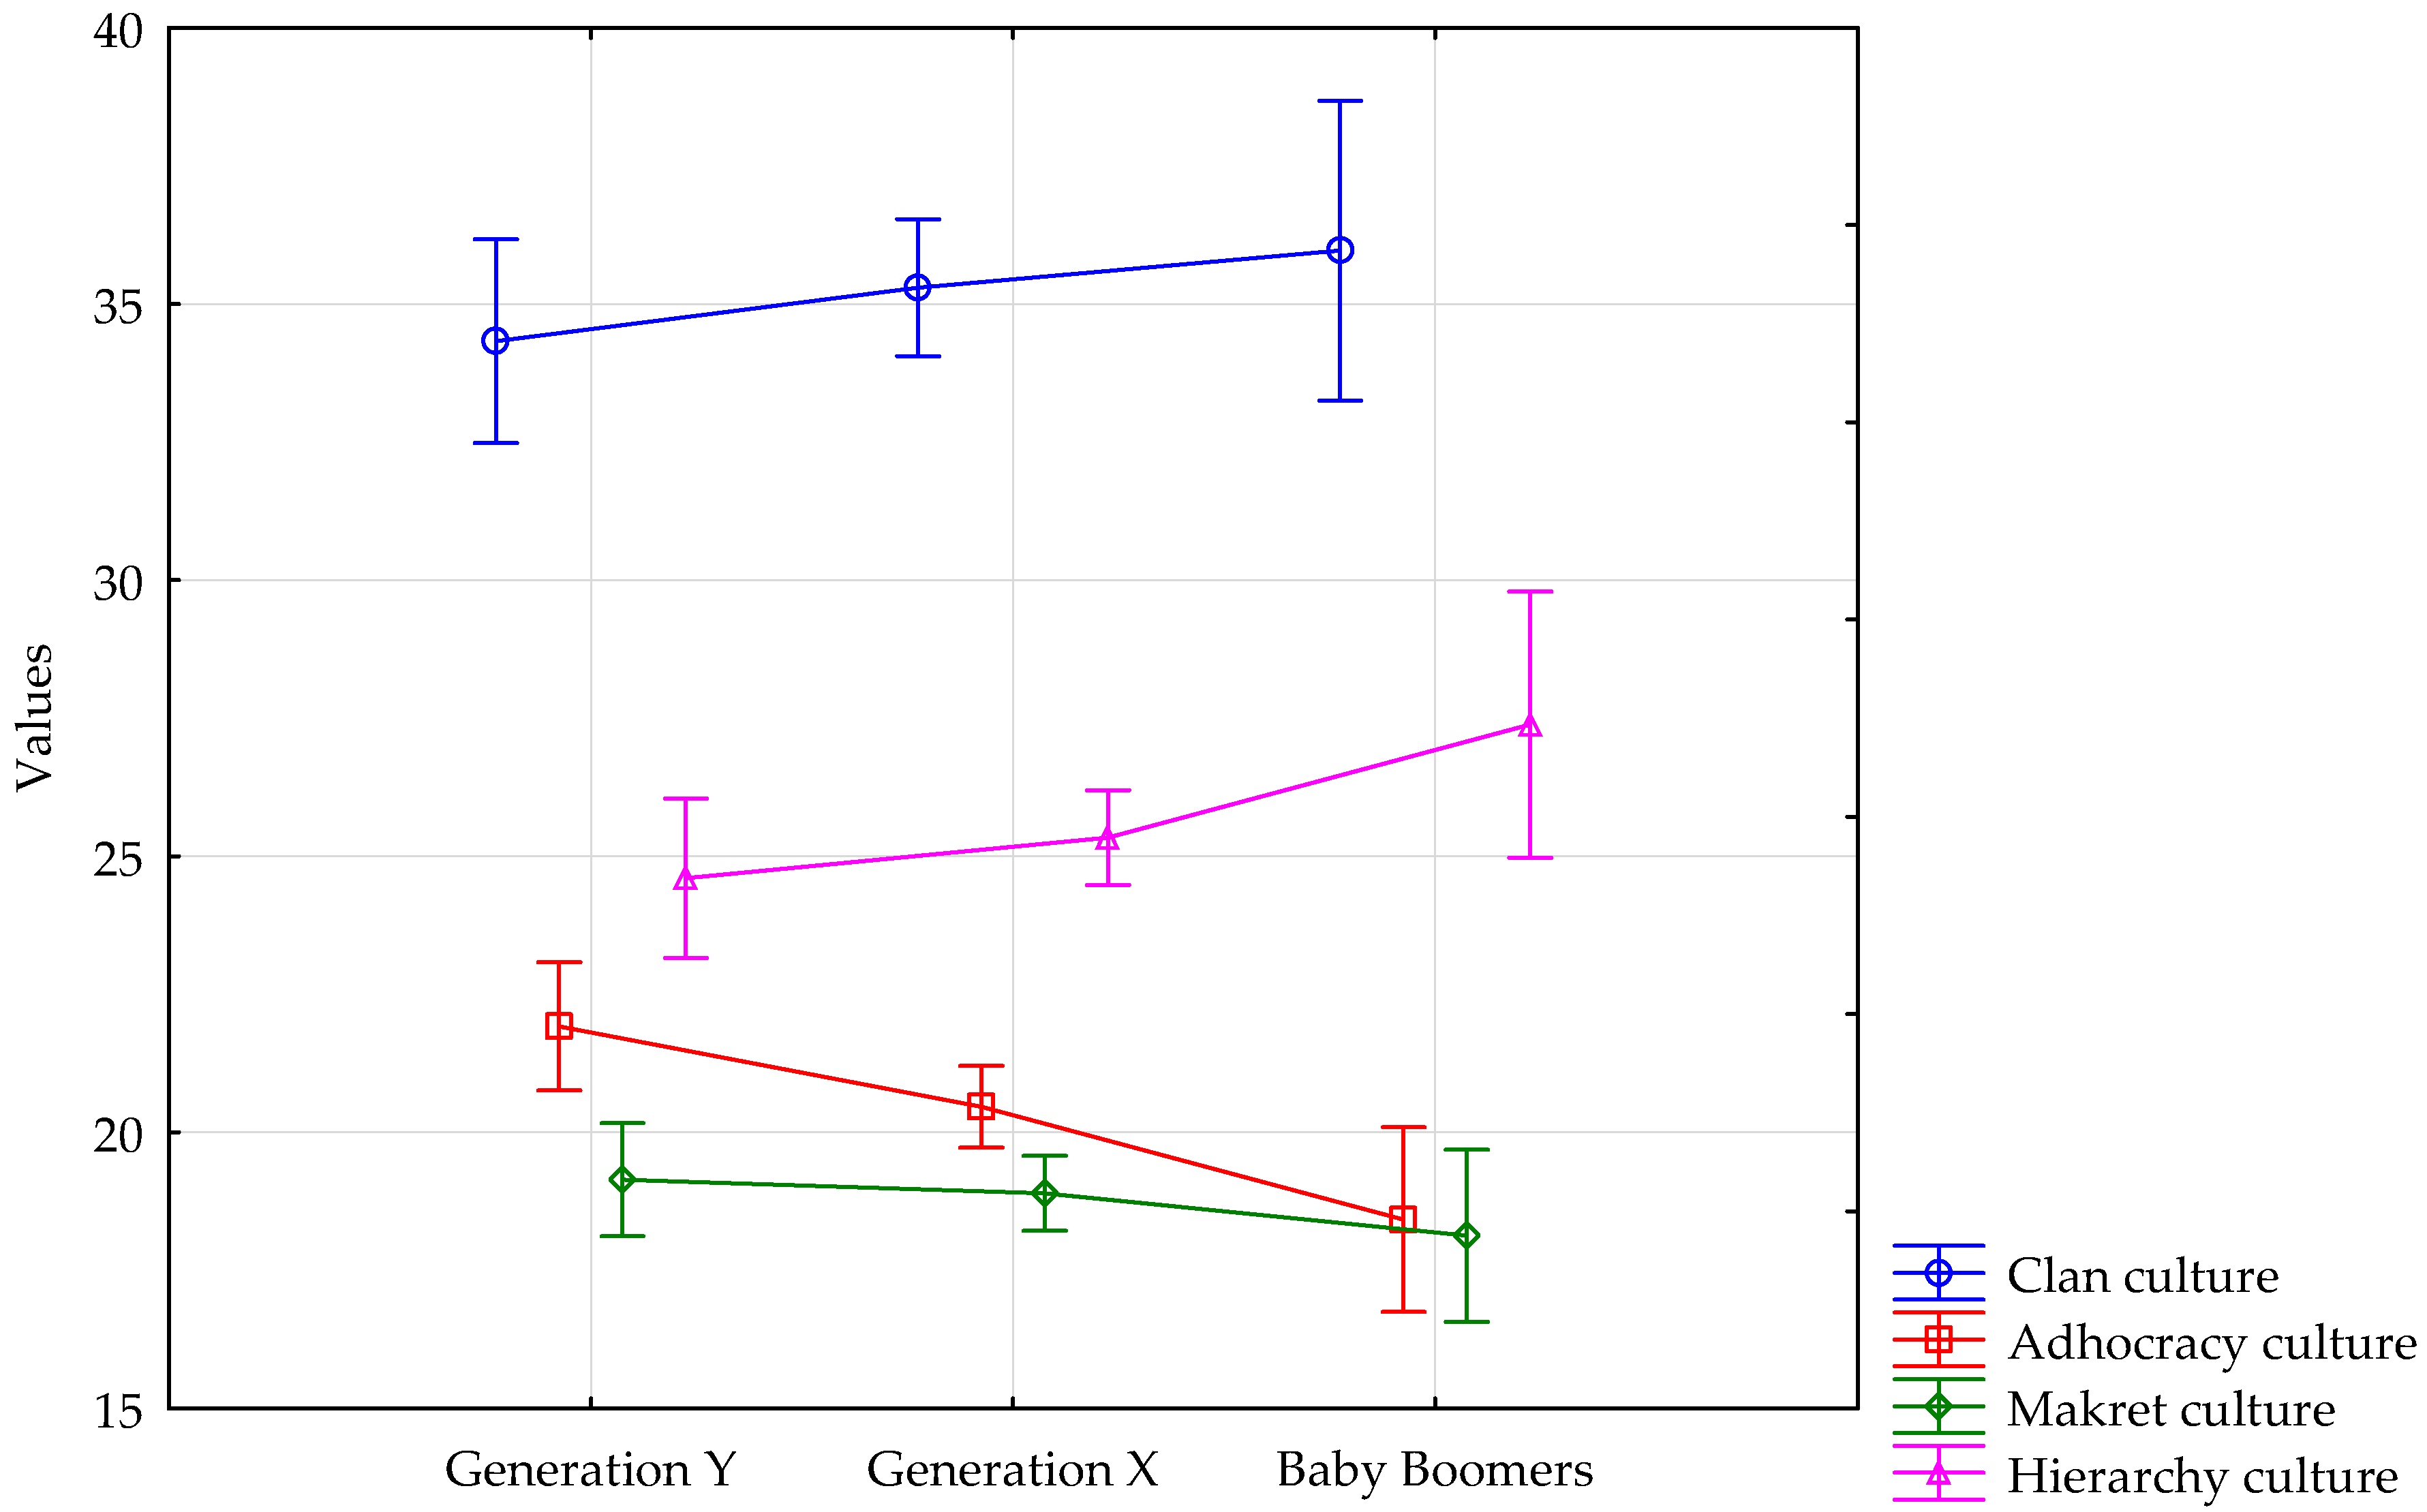
All generations agreed that clan corporate culture should prevail in the European transport enterprises in the future (see Table 8 and Figure 7). The Clan culture archetype is reminiscent of Wallach’s [55] supportive culture archetype, and is delineated by the flexibility and internal focus aspects of the OCAI’s continua. It is considered to be representative of a family-style organization, wherein members of the organization are involved in decision making, and teamwork is an important aspect of work [49,52]. Clan culture involves sharing values and goals, a “we consciousness”, team thinking, and instead of rules and precisely defined work procedures, it is characterized by teamwork, employee engagement programmes and corporate commitment to employees. A long-term benefit of each individual development journey is emphasized. Great significance is attributed to coherence, morality and work environment and success is seen in relation to the inner environment and solicitude for people [49]. Based on other research studies, clan cultural values have an orientation towards collaboration and combine an emphasis on flexibility and internal maintenance [56,57]. Clan cultural values have an orientation toward collaboration and combine an emphasis on flexibility and internal maintenance [56,57]. Organizational practices in Clan cultures focus on strengthening the sociotechnical systems, developing human capital, and building cohesion and commitment. A key underlying assumption of this culture type is that employee development, engagement, and commitment lead to organizational success [56]. The firm encourages leadership styles that are supportive and people-oriented [57], such as mentors and team builders [56].
The same outcomes as were achieved in this research study were also observed in the company People Express Airlines, which is an example of one of the most dramatic successes in history. Clan culture dominated in this company as well. The company began operating in April 1981 and was the major airline in 1984 (with revenues exceeding two trillion US dollars) [58]. Clan corporate culture as well as hierarchy culture dominated the research study conducted from January 2013 to March 2014 in New Zealand in the area of senior healthcare [59]. The findings of Turkish research show that the Turkish construction industry was dominated by firms with a mixture of clan and hierarchy cultures [60]. On the other hand, a study conducted in a Japanese company (Tokyo) showed that market culture followed by adhocracy culture is associated with better performance, as opposed to clan and hierarchy cultures which relates to poor performance [61]. Following the study conducted by Russian firms we can see that the ability to adapt and engage (i.e., typical of adhocracy and clan corporate cultures) together with flexible orientation are the most relevant features of efficiency in the Russian context. Within the US context, however, market corporate culture is important [62]. Other studies point out that adaptability, typical of adhocracy corporate culture, is more linked to performance [63,64,65]. Research studies show that different corporate cultures have different effects on performance as well.
No statistically significant differences in the perception of corporate culture in terms of generations were observed, even in the partial analysis of individual preferred components (Table 9); and, when regarding the preferred corporate culture in the European transport enterprises, no statistically significant differences were recorded either (see Table 10).
4. Conclusions
Following actual research studies conducted in the area of corporate culture in manufacturing as well as in service sector businesses [66,67,68,69], generational differences in the opinions on corporate culture can be stated. In total, 1159 employees working in the European transport companies were engaged in the research aimed at the verification of differences in the perception of preferred level of corporate culture in terms of generations owing to the fact that diversity in terms of generations was proven by several research studies [42,70,71,72,73,74,75,76] defining differences in opinions, values, attitudes or goals associated with individual generations. In the early stages of working life (until the age of 25), employees preferred highly competitive environment. Employees up to 35 years old prefer personal development. On the other hand, at the age of 55+, serenity, work safety, recognition, benefits and advancement become more motivating for employees [77]. Compared to the older generation, the younger one is more flexible, more energetic, with a higher level of education and language skills. Therefore, their career progression is faster even in other countries as well. On the other hand, practice is another important factor and it is missing [78].
Following the outcomes of the research, we can state that the respondents in European transport enterprises do not show any existence of generational differences in corporate culture. European transport enterprises are specific in comparison to other business sectors, where employees have an opportunity for horizontal or vertical career growth. On the other hand, organizational structure in transport enterprises is fixed (manager-white collar worker-driver) and the job position cannot be changed. Employees are hired for the specific job position and there is no opportunity for career growth. They are aware of the fact that they are expected to do the same job position over the course of their working life. Therefore, they accept clan corporate culture as the most suitable type of corporate culture for them. The same opinion is presented in the survey of veterans. Approximately 70% of them reported that they would like to stay with their current organization for the rest of their working life [79]. That is why we can state that attitudes of employees towards corporate culture are the same and do not change at all ages. Thus, our hypothesis was not confirmed, especially because of the specific features of the transport enterprises in comparison to businesses in other sectors.
The research was conducted in enterprises throughout Europe (Western, Central, and Eastern Europe). Results in individual national cultures were not significantly important; therefore, we state that issue of generational differences in transport enterprises is the same, regardless of the national culture.
Acknowledgments
This research was supported by VEGA 1/0024/17, VEGA 1/0537/16, and VEGA 1/0320/17.
Author Contributions
Rudolf Kampf, Silvia Lorincová, Miloš Hitka and Ondrej Stopka conceived and designed the paper; Rudolf Kampf, Silvia Lorincová, Miloš Hitka and Ondrej Stopka performed the experiments; and Rudolf Kampf, Silvia Lorincová, Miloš Hitka and Ondrej Stopka wrote the paper.
Conflicts of Interest
The authors declare no conflict of interest.
References
- Potkány, M.; Stasiak-Betlejewska, R.; Kováč, R.; Gejdoš, M. Outsourcing in contidions of SMEs—The potential for cost savings. Pol. J. Manag. Stud. 2016, 13, 145–156. [Google Scholar] [CrossRef]
- Bergman, M.M.; Bergman, Z.; Berger, L. An Empirical Exploration, Typology, and Definition of Corporate Sustainability. Sustainability 2017, 9, 753. [Google Scholar] [CrossRef]
- Zitrický, V.; Gašparík, J.; Pečený, L. The methodology of rating quality standards in the regional passenger transport. Transp. Probl. 2015, 10, 59–72. [Google Scholar] [CrossRef]
- Ližbetin, J.; Černá, L.; Ľoch, M. Model Evaluation of Suppliers in Terms of Real Company for Selected Criteria. NAŠE MORE 2015, 62, 147–152. [Google Scholar] [CrossRef]
- Olšovská, A.; Mura, L.; Švec, M. Personnel management in Slovakia: An explanation of the latent issues. Pol. J. Manag. Stud. 2016, 13, 110–120. [Google Scholar] [CrossRef]
- Helfrich, C.D.; Li, Y.F.; Mohr, D.C.; Meterko, M.; Sales, A.E. Assessing an organizational culture instrument based on the Competing Values Framework: Exploratory and confirmatory factor analyses. Implement. Sci. 2007, 13. [Google Scholar] [CrossRef] [PubMed]
- Ostroff, C.; Kinicki, A.J.; Tamkins, M.M. Organizational culture and climate. Ind. Organ. Psychol. 2003, 12. [Google Scholar] [CrossRef]
- Syafii, L.I.; Thoyib, A.; Nimran, U. The Role of Corporate Culture and Employee Motivation as a Madiating Variable of Leadership style related with the Employee Performance (Studies in Perum Perhutani). Procedia Soc. Behav. Sci. 2015, 211, 1142–1147. [Google Scholar] [CrossRef]
- Kotter, J.P.; Heskett, J.L. Corporate Culture and Performance; The Free Press: New York, NY, USA, 2011; p. 224. [Google Scholar]
- Klein, K.J.; Kozlowski, S.W.J. From micro to meso: Critical steps in conceptualizing and conducting multilevel research. Organ. Res. Methods 2000, 3, 211–236. [Google Scholar] [CrossRef]
- Flamholtz, E.; Randle, Y. Corporate Culture. The Ultimate Strategic Asset; Stanford University Press: Stanford, CA, USA, 2011; p. 264. [Google Scholar]
- Stacho, Z.; Potkány, M.; Stachová, K.; Marcineková, K. The organizational culture as a support of innovation processes’ management: A case study. Int. J. Q. Res. 2016, 10, 769–784. [Google Scholar]
- Potkány, M.; Krajčírová, L. Cost Reporting of the Transport Company and its Use in Decision-making. Procedia Eng. 2017, 192, 731–736. [Google Scholar] [CrossRef]
- Fan, Z.; Huang, S.; Robert, W.; Alexander, J. Do National Cultural Traits Affect Comparative Advantage in Cultural Goods? Sustainability 2017, 9, 1153. [Google Scholar] [CrossRef]
- Schein, E. Organizational Culture and Leadership; Jossey-Bass Publishers: San Francisco, CA, USA, 1992. [Google Scholar]
- Hofstede, G. Identifying organizational subcultures: An empirical approach. J. Manag. Stud. 1998, 35, 1–12. [Google Scholar] [CrossRef]
- Daft, R.L.; Noe, R.A. Organizational Behavior; Harcourt College Publishers: Fort Worth, TX, USA, 2001. [Google Scholar]
- Berrio, A.A. An organizational culture assessment using the competing values framework: A profile of Ohio state university extension. J. Ext. 2003, 41, n2. [Google Scholar]
- Trice, H.M.; Beyer, J.M. The Cultures of Work Organizations; Prentice Hall: Englewood Cliffs, NJ, USA, 1993. [Google Scholar]
- Bennis, W.; Nanus, B. Leaders; Harper & Row, Pub: New York, NY, USA, 1985. [Google Scholar]
- Donahue, K.B. How to ruin a merger: Five people-management pitfalls to avoid. Harv. Manag. Update 2001, 6, 1–4. [Google Scholar]
- Nguyen, L.H.; Watanabe, T. The Impact of Project Organizational Culture on the Performance of Construction Projects. Sustainability 2017, 9, 781. [Google Scholar] [CrossRef]
- Denison, D.R. Corporate Culture and Organizational Effectiveness; Wiley: New York, NY, USA, 1990. [Google Scholar]
- Lin, J.; Cai, J.; Han, Y.; Liu, J. Identifying the Conditions for Rural Sustainability through Place-Based Culture: Applying the CIPM and CDPM Models into Meibei Ancient Village. Sustainability 2017, 9, 1334. [Google Scholar] [CrossRef]
- Bennis, W. Leaders and visions: Orchestrating the corporate culture. In Corporate Culture and Change; Berman, M.A., Ed.; The Conference Board Inc.: New York, NY, USA, 1986; pp. 63–65. [Google Scholar]
- Davis, S.M. Managing Corporate Culture; Ballinger: New York, NY, USA, 1984. [Google Scholar]
- Quinn, R.E.; McGrath, M.R. The transformation of organizational culture: A competing values perspective. In Proceedings of the Conference of Organizational Culture and Meaning of Life in the Workplace, Vancouver, BC, Canada, April 1984. [Google Scholar]
- Schein, E. Organizational Culture and Leadership; Jossey-Bass: San Francisco, CA, USA, 2004. [Google Scholar]
- Jung, T.; Scott, J.T.; Davies, H.T.O.; Bower, P.; Whalley, D.; McNally, R.; Mannion, R. Instruments for Exploring Organizational Culture: A Review of the Literature. Public Adm. Rev. 2009, 69, 1087–1096. [Google Scholar] [CrossRef]
- Stanford, N. Corporate Culture: Getting It Right; Profile Books Ltd.: London, UK, 2010; p. 273. [Google Scholar]
- Stachová, K.; Stacho, Z.; Pajtinková Bartáková, G. Influencing organisational culture by means of employee remuneration. Bus. Theory Pract. 2015, 16, 264–270. [Google Scholar] [CrossRef]
- Weberová, D.; Ližbetinová, L. Consumer attitudes towards Brands in relation to price. In Proceedings of the 27th International Business Information Management Association Conference Innovation Management and Education Excellence Vision 2020: From Regional Development Sustainability to Global Economic Growth, Milan, Italy, 4–5 May 2016; International Business Information Management Association: Norristown, PA, USA, 2016. [Google Scholar]
- Kucharcikova, A.; Konusikova, L.; Tokarcikova, E. Approaches to the quantification of the human capital efficiency in enterprises. Komunikacie 2016, 18, 49–54. [Google Scholar]
- Wang, M.C. The relationship between firm characteristics and the disclosure of sustainability reporting. Sustainability 2017, 9, 624. [Google Scholar] [CrossRef]
- Kupperschmidt, B.R. Multigenerational employees: Strategies for effective management. Health Care Manag. 2000, 19, 65–76. [Google Scholar]
- Curry, G.D. Supervising Across Generations. In Security Supervision and Managemenet, 4th ed.; Davies, S.J., Hertig, C.A., Gilbride, B.P., Eds.; Butterworth: Oxford, UK, 2015. [Google Scholar]
- Ozkan, M.; Solmaz, B. Mobile Addiction of Generation Z and its Effects on their Social Lifes: (An Application among University Students in the 18–23 Age Group). Procedia Soc. Behav. Sci. 2015, 205, 92–98. [Google Scholar] [CrossRef]
- Duh, H.I. Childhood family experiences and young Generation Y money attitudes and materialism. Personal. Ind. Differ. 2016, 95, 134–139. [Google Scholar] [CrossRef]
- Hoole, C.; Bonnema, J. Work engagement and meaningful work across generational cohorts. J. Hum. Resour. Manag. 2015, 13, 11. [Google Scholar] [CrossRef]
- Shirish, A.; Boughzala, I.; Srivastava, S.C. Bridging cultural discontinuities in global virtual teams: Role of cultural intelligence. In Proceedings of the Thirty Sixth International Conference on Information Systems, Fort Worth, TX, USA, 13–16 December 2015. [Google Scholar]
- Tolbize, A. Generational Differences in the Workplace; University of Minesota: Minneapolis, MN, USA, 2008. [Google Scholar]
- Ng, E.S.W.; Schweitzer, L. New generation, great expectations: A field study of the millennia generation. J. Bus. Psychol. 2010, 25, 281–292. [Google Scholar] [CrossRef]
- Hadijah, A.; Badaruddin, I. Leadership and the Characteristic of Different Generational Cohort towards Job Satisfaction. Procedia Soc. Behav. Sci. 2015, 204, 14–18. [Google Scholar] [CrossRef]
- Wong, M.; Elliroma, G.; Whitney, L.; Leah, C. Generational differences in personality and motivation: Do they exist and what are the implications for the workplace? J. Manag. Psychol. 2008, 23, 878–890. [Google Scholar] [CrossRef]
- Parthasarathy, K.; Ramalingam, S. An empirical study on organization culture and its impact on employee motivation with reference to industrial estates in chennai. Int. J. Appl. Bus. Econ. Res. 2015, 13, 287–294. [Google Scholar]
- Jenkins, J. Leading the Four Generations at Work. 2007. Available online: http://www.amanet.org/movingahead/editorial.cfm?Ed=452 (accessed on 1 May 2017).
- Quinn, R.E.; Rohrbaugh, J. A Spatial Model of Effectiveness Criteria: Towards a Competing Values Approach to Organizational Analysis. Manag. Sci. 1983, 29, 363–377. [Google Scholar] [CrossRef]
- Denison, D.R.; Spreitzer, G.M. Organizational Culture and Organizational Development: A Competing Values Approach; JAI Press: Greenwich, CT, USA, 1991. [Google Scholar]
- Cameron, K.S.; Quinn, R.E. Diagnosing and Changing Organizational Culture; Jossey-Bass: San Francisco, CA, USA, 2006. [Google Scholar]
- Heritage, B.; Pollock, C.; Roberts, L. Validation of the organizational culture assessment instrument. PLoS ONE 2014. [Google Scholar] [CrossRef] [PubMed]
- Cameron, K.S.; Freeman, S.J. Cultural Congruence, Strength and Type: Relationships to Effectiveness; JAI Press: Greenwich, CT, USA, 1991. [Google Scholar]
- Cameron, K.S.; Quinn, R.E. Diagnosing and Changing Organizational Culture: Based on the Competing Values Framework; Addison-Wesley: Reading, MA, USA, 1999. [Google Scholar]
- Lim, B. Examining the organizational culture and organizational performance link. Leadersh. Organ. Dev. J. 1995, 16, 16–21. [Google Scholar] [CrossRef]
- Schein, E.H. Commentary: Sense and Nonsense about Culture and Climate; Sage: Thousand Oaks, CA, USA, 2000. [Google Scholar]
- Wallach, E.J. Individuals and organizations: The cultural match. Train. Dev. 1983, 37, 28–36. [Google Scholar]
- Cameron, K.S.; Quinn, R.E.; Degraff, J.; Thakor, A. Competing Values Leadership: Creating Value in Organizations; Edward Elgar Publishing: Northampton, MA, USA, 2007. [Google Scholar]
- Zammuto, R.F.; O’Connor, E.J. Gaining advanced manufacturing technologies’ benefits: The roles of organizational design and culture. Acad. Manag. Rev. 1992, 17, 701–728. [Google Scholar]
- Kochneff, E. People Express Airlines; World Heritage Encyclopedia, 2004. Available online: https://en.wikipedia.org/wiki/People_Express_Airlines_(1980s) (accessed on 15 May 2017).
- Frey, R.; Boyd, M.; Foster, S.; Robinson, J.; Gott, M. What’s the diagnosis? Organisational culture and palliative care delivery in residential aged care in New Zealand. Health Soc. Care Commun. 2016, 24, 450–462. [Google Scholar] [CrossRef] [PubMed]
- Oney-Yazici, E.; Giritli, H.; Topcu-Oraz, G.; Acar, E. Organizational culture the case of turkish construction industry. Eng. Constr. Arch. Manag. 2007, 14, 519–531. [Google Scholar] [CrossRef]
- Deshpandé, R.; Farley, J.U.; Webster, F.E., Jr. Corporate Culture, Customer Orientation, and Innovativeness in Japanese Firms: A Quadrad Analysis. J. Mark. 1993, 57, 23–37. [Google Scholar] [CrossRef]
- Fey, C.F.; Denison, D.R. Organizational Culture and Effectiveness: Can American Theory Be Applied in Russia? The William Davidson Institute: Arbor, MI, USA, 2003. [Google Scholar]
- Chan, L.L.M.; Shaffer, M.A.; Snape, E. In search of sustained competitive advantage: The impact of organizational culture, competitive strategy and human resource management practices on firm performance. Int. J. Hum. Resour. Manag. 2007, 15. [Google Scholar] [CrossRef]
- Púčková, K.; Kocifajová, L. How to improve business performance based on knowledge management in logistics. Logi Sci. J. Transp. Logist. 2013, 4, 106–115. [Google Scholar]
- Majerčák, P.; Majerčáková, E. Balanced scorecard—Time to increasing business performance. Logi Sci. J. Transp. Logist. 2012, 3, 111–116. [Google Scholar]
- Arsenault, P. Validating generational differences: A legitimate diversity and leadership issue. Leadersh. Organ. Dev. J. 2004, 25, 124–141. [Google Scholar] [CrossRef]
- Bauerlein, M. The Dumbest Generation: How the Digital Age Stupefies Young Americans and Jeopardizes Our Future; The Penguin Group: New York, NY, USA, 2009. [Google Scholar]
- Carver, L.; Candela, L. Attaining organizational commitment across different generations of nurses. J. Nurs. Manag. 2008, 16, 984–991. [Google Scholar] [CrossRef] [PubMed]
- De Waal, A.; Peters, L.; Broekhuizen, M. Do different generations look differently at high performance organizations? J. Strategy Manag. 2017, 10, 86–101. [Google Scholar] [CrossRef]
- Hammill, G. Mixing and managing four generations of employees. FDU Mag. 2005. Available online: http://www.fdu.edu/newspubs/magazine/05ws/generations.htm (accessed on 31 May 2017).
- Hershatter, A.; Epstein, M. Millennials and the world of work: An organization and management perspective. J. Bus. Psychol. 2010, 25, 211–223. [Google Scholar] [CrossRef]
- McCready, V. Generational issues in supervision and administration. ASHA Lead. 2011, 1, 12–15. [Google Scholar]
- Santos, S.; Cox, K. Workplace adjustment and intergenerational differences between matures, boomers, and Xers. Nurs. Econ. 2000, 18, 7–13. [Google Scholar] [PubMed]
- Zakaria, F. Why it’s different this time. Time 2011, 177, 30–31. [Google Scholar]
- Zavadsky, J.; Hitka, M.; Potkany, M. Changes of employee motivation of Slovak enterprises due to global economic crisis. E M Ekon. Manag. 2015, 18, 57–66. [Google Scholar] [CrossRef]
- Zemke, R.; Raines, C.; Filipczak, B. Generations at Work: Managing the Clash of Veterans, Boomers, Xers, and Nexters in Your Workplace; AMACON: New York, NY, USA, 2000. [Google Scholar]
- Inceoglu, I.; Segers, J.; Bartram, D. Age-related differences in work motivation. J. Occup. Organ. Psychol. 2012, 85, 300–329. [Google Scholar] [CrossRef] [Green Version]
- Folkman, J. Surprising Reasons Younger Managers Perform Best. Forbes 2015. Available online: https://www.forbes.com/sites/joefolkman/2015/10/01/6-surprising-reasons-younger-managers-perform-best/#eba71659cc5b (accessed on 6 June 2017).
- Deal, J.J. Retiring the Generation Gap: How Employees Young and Old van Find Common Ground; Jossey-Bass: San Francisco, CA, USA, 2007. [Google Scholar]
Figure 1.
Comparison of generational differences in dominant characteristics.
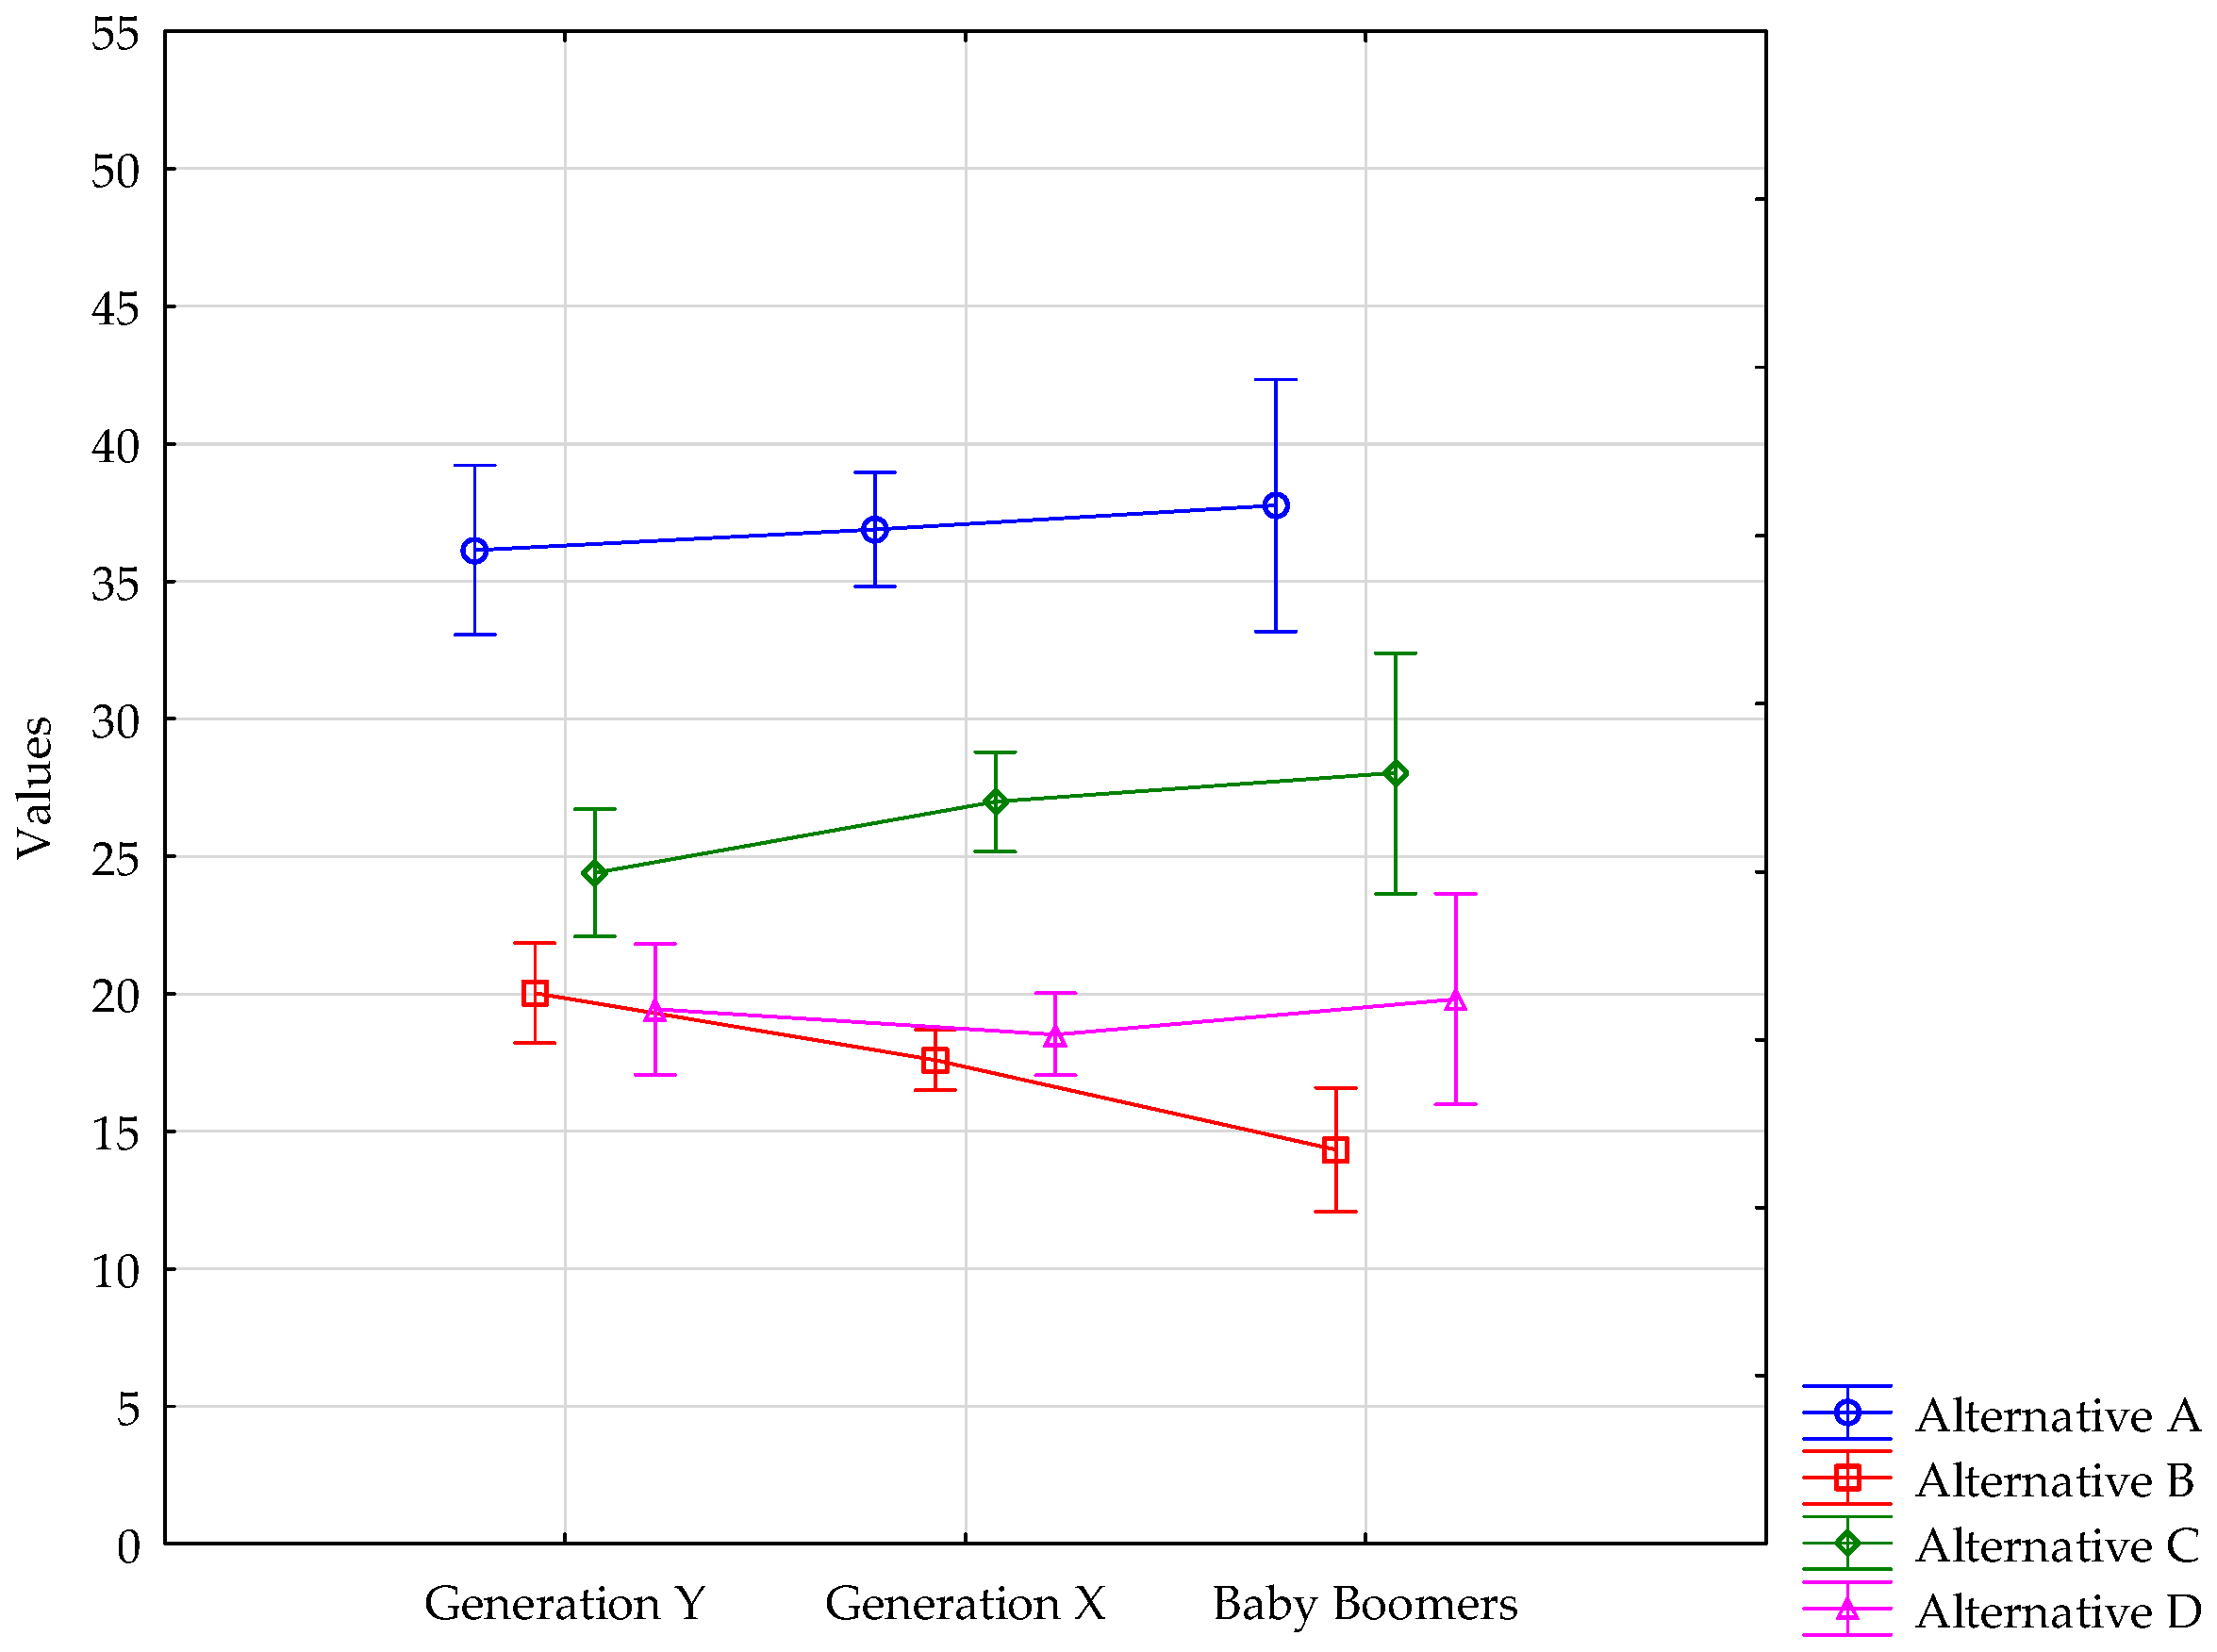
Figure 2.
Comparison of generational differences in organizational leadership.

Figure 3.
Comparison of generational differences in management of employees.
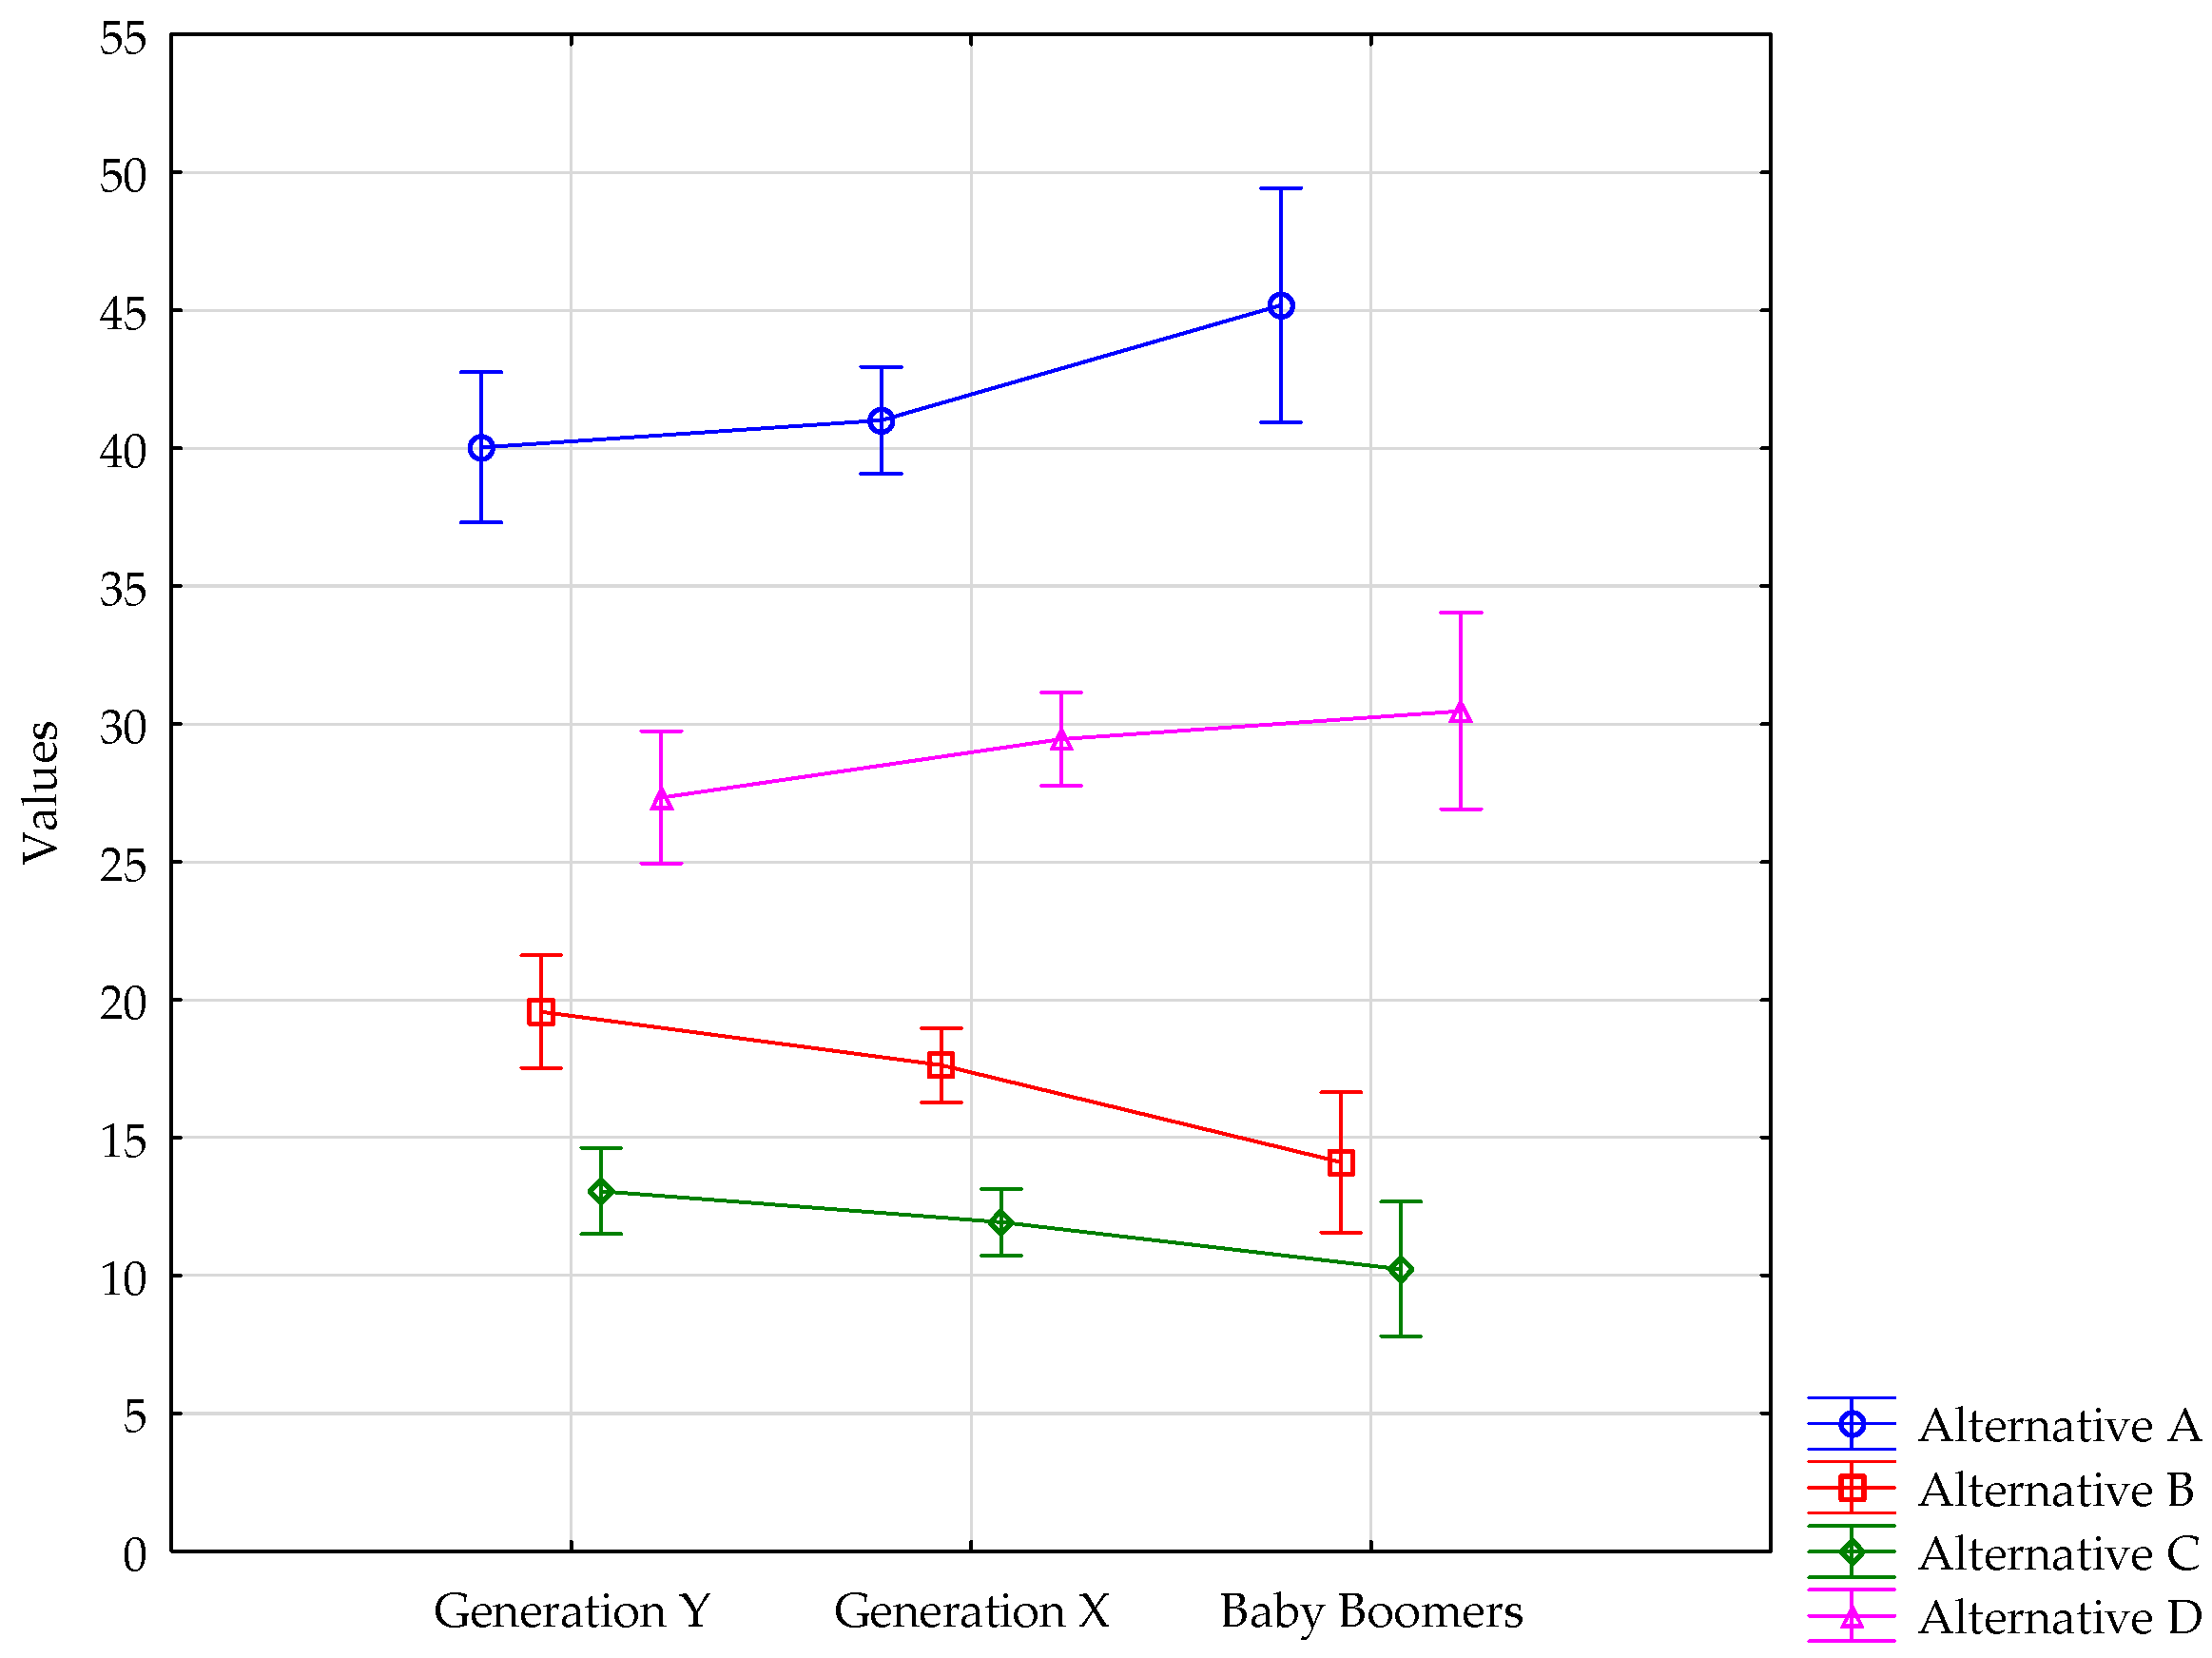
Figure 4.
Comparison of generational differences in organization glue.

Figure 5.
Comparison of generational differences in strategic emphases.
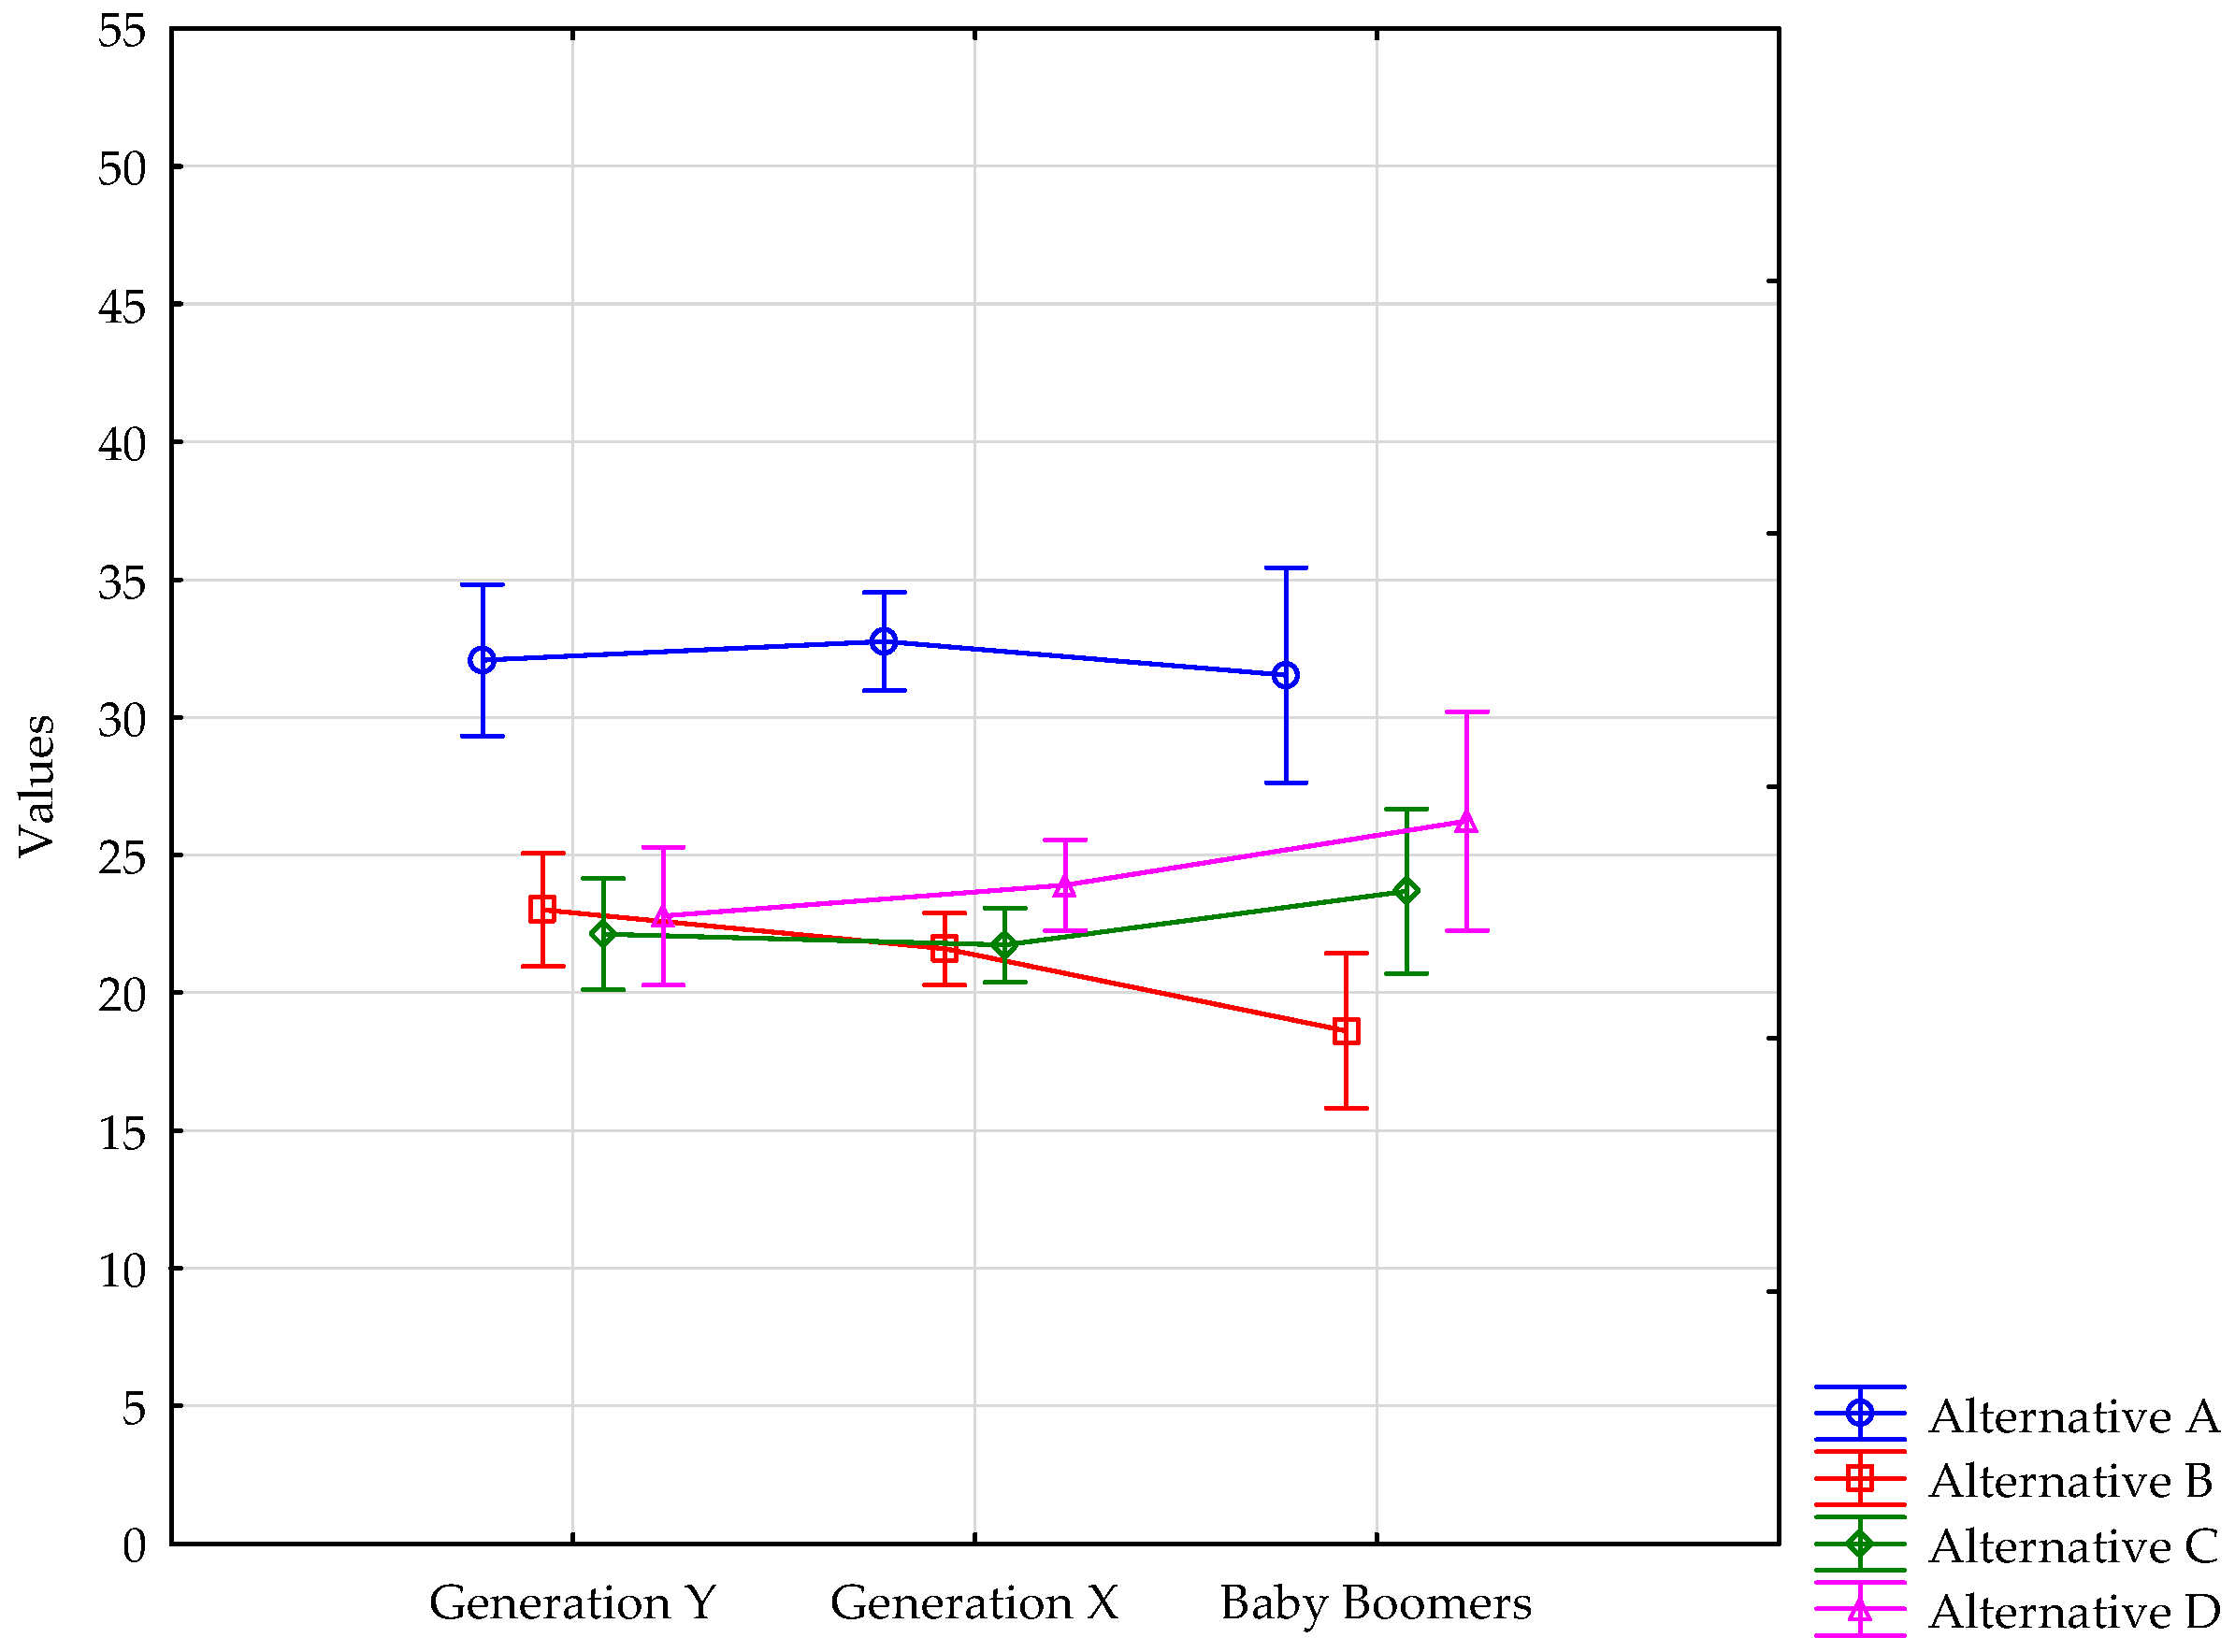
Figure 6.
Comparison of generational differences in criteria of success.

Figure 7.
Comparison of generational differences in the corporate culture profile.


Table 1.
Respondents participating in the research.
| Females | Males | |
|---|---|---|
| Generation Y | 180 | 186 |
| Generation X | 237 | 288 |
| Baby Boomers | 140 | 128 |
Source: Authors’ compilation.
Table 2.
Comparison of generational differences in dominant characteristics.
| Alternative A | Alternative B | Alternative C | Alternative D | |
|---|---|---|---|---|
| Generation Y | 36.14 | 20.02 | 24.40 | 19.43 |
| Generation X | 36.90 | 17.60 | 26.98 | 18.53 |
| Baby Boomers | 37.76 | 14.33 | 28.02 | 19.81 |
Note: Preferred generational characteristics are in bold. Source: Authors’ compilation.
Table 3.
Comparison of generational differences in organizational leadership.
| Alternative A | Alternative B | Alternative C | Alternative D | |
|---|---|---|---|---|
| Generation Y | 31.82 | 25.16 | 13.95 | 29.06 |
| Generation X | 29.75 | 25.79 | 12.98 | 31.47 |
| Baby Boomers | 28.21 | 28.54 | 10.04 | 33.21 |
Note: Preferred generational characteristics are in bold. Source: Authors’ compilation.
Table 4.
Comparison of generational differences in management of employees.
| Alternative A | Alternative B | Alternative C | Alternative D | |
|---|---|---|---|---|
| Generation Y | 40.02 | 19.57 | 13.07 | 27.34 |
| Generation X | 41.01 | 17.63 | 11.93 | 29.45 |
| Baby Boomers | 45.19 | 14.10 | 10.24 | 30.47 |
Note: Preferred generational characteristics are in bold. Source: Authors’ compilation.
Table 5.
Comparison of generational differences in organization glue.
| Alternative A | Alternative B | Alternative C | Alternative D | |
|---|---|---|---|---|
| Generation Y | 33.47 | 22.86 | 21.84 | 21.82 |
| Generation X | 35.29 | 21.97 | 20.67 | 22.01 |
| Baby Boomers | 36.42 | 20.41 | 21.16 | 21.34 |
Note: Preferred generational characteristics are in bold. Source: Authors’ compilation.
Table 6.
Comparison of generational differences in strategic emphases.
| Alternative A | Alternative B | Alternative C | Alternative D | |
|---|---|---|---|---|
| Generation Y | 32.07 | 23.01 | 22.13 | 22.79 |
| Generation X | 32.75 | 21.59 | 21.74 | 23.92 |
| Baby Boomers | 31.53 | 18.63 | 23.69 | 26.23 |
Note: Preferred generational characteristics are in bold. Source: Authors’ compilation.
Table 7.
Comparison of generational differences in criteria of success.
| Alternative A | Alternative B | Alternative C | Alternative D | |
|---|---|---|---|---|
| Generation Y | 32.44 | 20.89 | 19.48 | 27.19 |
| Generation X | 36.06 | 18.22 | 19.09 | 26.64 |
| Baby Boomers | 36.68 | 14.51 | 15.63 | 33.25 |
Note: Preferred generational characteristics are in bold. Source: Authors’ compilation.
Table 8.
Comparison of generational differences in the corporate culture profile.
| Clan Culture | Adhocracy Culture | Market Culture | Hierarchy Culture | |
|---|---|---|---|---|
| Generation Y | 34.33 | 21.92 | 19.14 | 24.61 |
| Generation X | 35.29 | 20.47 | 18.90 | 25.34 |
| Baby Boomers | 35.96 | 18.42 | 18.13 | 27.39 |
Note: Preferred generational characteristics are in bold. Source: Authors’ compilation.
Table 9.
Statistically significant differences in perceiving partial preferred components of corporate culture in terms of generations.
Table 9.
Statistically significant differences in perceiving partial preferred components of corporate culture in terms of generations.
| Sum of Square | Degree of Freedom | Mean of Square | Sum of Square Error | Degree of Freedom Error | Mean of Square Error | F | p-Level | ||
|---|---|---|---|---|---|---|---|---|---|
| Dominant characteristics | A | 234.73 | 2 | 117.36 | 547,164.9 | 900 | 607.96 | 0.19 | 0.824 |
| B | 2843.20 | 2 | 1421.60 | 160,706.5 | 900 | 178.56 | 7.96 | 0.000 | |
| C | 1501.87 | 2 | 750.94 | 402,231.8 | 900 | 446.92 | 1.68 | 0.187 | |
| D | 250.22 | 2 | 125.11 | 311,108.9 | 900 | 345.68 | 0.36 | 0.696 | |
| Organizational leadership | A | 1266.73 | 2 | 633.37 | 427,964.9 | 900 | 475.52 | 1.33 | 0.264 |
| B | 1060.57 | 2 | 530.28 | 341,719.6 | 900 | 379.69 | 1.40 | 0.248 | |
| C | 1365.35 | 2 | 682.67 | 180,141.1 | 900 | 200.16 | 3.41 | 0.033 | |
| D | 1687.17 | 2 | 843.59 | 468,356.2 | 900 | 520.40 | 1.62 | 0.198 | |
| Management of employees | A | 2465.11 | 2 | 1232.55 | 461,555.2 | 900 | 512.84 | 2.40 | 0.091 |
| B | 2587.42 | 2 | 1293.71 | 224,168.8 | 900 | 249.08 | 5.19 | 0.006 | |
| C | 695.00 | 2 | 347.50 | 169,076.8 | 900 | 187.86 | 1.85 | 0.158 | |
| D | 1067.91 | 2 | 533.96 | 349,214.2 | 900 | 388.02 | 1.38 | 0.253 | |
| Organization glue | A | 881.70 | 2 | 440.85 | 441,462.6 | 900 | 490.51 | 0.90 | 0.407 |
| B | 518.50 | 2 | 259.25 | 235,274.4 | 900 | 261.42 | 0.99 | 0.371 | |
| C | 232.55 | 2 | 116.27 | 226,730.5 | 900 | 251.92 | 0.46 | 0.630 | |
| D | 48.44 | 2 | 24.22 | 285,152.5 | 900 | 316.84 | 0.08 | 0.926 | |
| Strategic emphases | A | 191.02 | 2 | 95.51 | 410,290.9 | 900 | 455.88 | 0.21 | 0.811 |
| B | 1667.62 | 2 | 833.81 | 221,464.9 | 900 | 246.07 | 3.39 | 0.034 | |
| C | 404.12 | 2 | 202.06 | 233,078.1 | 900 | 258.98 | 0.78 | 0.459 | |
| D | 1027.85 | 2 | 513.92 | 360,571.5 | 900 | 400.64 | 1.28 | 0.278 | |
| Criteria of success | A | 2533.37 | 2 | 1266.68 | 500,083.7 | 900 | 555.65 | 2.28 | 0.103 |
| B | 3551.71 | 2 | 1775.86 | 191,207.3 | 900 | 212.45 | 8.36 | 0.000 | |
| C | 1485.01 | 2 | 742.51 | 229,119.1 | 900 | 254.58 | 2.92 | 0.055 | |
| D | 4775.96 | 2 | 2387.98 | 397,418.2 | 900 | 441.58 | 5.41 | 0.005 | |
Note: Statistically significant differences are in bold. Source: Authors’ compilation.
Table 10.
Statistically significant differences in perceiving the overall profile of corporate culture in terms of generations.
Table 10.
Statistically significant differences in perceiving the overall profile of corporate culture in terms of generations.
| Sum of Square | Degree of Freedom | Mean of Square | Sum of Square Error | Degree of Freedom Error | Mean of Square Error | F | p-Level | |
|---|---|---|---|---|---|---|---|---|
| Clan | 263.62 | 2 | 131.81 | 194,401.3 | 900 | 216.00 | 0.61 | 0.543 |
| Adhocracy | 1068.85 | 2 | 534.43 | 72,491.6 | 900 | 80.55 | 6.64 | 0.001 |
| Market | 91.99 | 2 | 46.00 | 60,173.9 | 900 | 66.86 | 0.69 | 0.503 |
| Hierarchy | 682.58 | 2 | 341.29 | 110,935.8 | 900 | 123.26 | 2.77 | 0.063 |
Note: Statistically significant differences are in bold. Source: Authors’ compilation.
© 2017 by the authors. Licensee MDPI, Basel, Switzerland. This article is an open access article distributed under the terms and conditions of the Creative Commons Attribution (CC BY) license (http://creativecommons.org/licenses/by/4.0/).
Share and Cite
MDPI and ACS Style
Kampf, R.; Lorincová, S.; Hitka, M.; Stopka, O. Generational Differences in the Perception of Corporate Culture in European Transport Enterprises. Sustainability 2017, 9, 1561. https://doi.org/10.3390/su9091561
AMA Style
Kampf R, Lorincová S, Hitka M, Stopka O. Generational Differences in the Perception of Corporate Culture in European Transport Enterprises. Sustainability. 2017; 9(9):1561. https://doi.org/10.3390/su9091561
Chicago/Turabian StyleKampf, Rudolf, Silvia Lorincová, Miloš Hitka, and Ondrej Stopka. 2017. "Generational Differences in the Perception of Corporate Culture in European Transport Enterprises" Sustainability 9, no. 9: 1561. https://doi.org/10.3390/su9091561
Note that from the first issue of 2016, this journal uses article numbers instead of page numbers. See further details here.