1. Introduction
The cultivation of olive tree for olive oil production is widespread worldwide, but is especially located in the Mediterranean area. Europe produces 75% of the world’s olive oil and Italy is one of the largest producers of olive oil in the EU (with 31% of the global production) [
1]. Olive oil extraction generates a variety of by-products, in different amounts depending on the production techniques used, which are all considered and treated as potential pollutants [
2]. Among these, solid olive residues account for approximately 35% (
w/
w) of the processed olives according to the extraction method used. The “paté” is a semi-solid destoned olive cake (pOC), with 75% moisture, which includes both conventional olive cake and olive mill waste waters. It also contains a variable amount of olive oil (approximately 8–12%, depending on the water content), high levels of structural carbohydrates and sugars, and moderate concentrations of crude protein. Fatty acids are mainly represented by oleic acid and polyunsaturated fatty acids. Major phenolic compounds contained in olive cake are included in the following classes [
3,
4,
5]: (a) hydroxytyrosol (3,4-DHPEA) and tyrosol (
p-HPEA) (class of phenolic alcohols); (b) dialdehydic form of decarboxymethyl elenolic acid linked to 3,4-DHPEA or
p-HPEA (3,4-DHPEA-EDA or
p-HPEA-EDA) (class of secoiridoids derivatives); (c) verbascoside (a derivative of the hydroxicinnamic acid); (d) caffeic acid,
p-coumaric acid and vanillic acid (class of phenolic acids and derivatives); (e) lutein (class of flavones); and (f) (+)-acetoxypinoresinol and (+)-pinoresinol (class of lignans). Polyphenols are bioactive molecules commonly used as antioxidants and antimicrobials in food industry [
6,
7]. It has been demonstrated that polyphenols with more than one hydroxyl group, such as hydroxytyrosol, exert a higher antioxidant activity [
5].
In virgin oil, a relationship between concentrations of simple phenols, lignans and secoiridoids, antioxidant activity and shelf life has been observed [
5,
8]. Furthermore, the advantage of using olive oil byproducts as feed supplements to reduce oxidative stress and improve meat antioxidant status, oxidative stability, and shelf life, has been demonstrated in different food producing animals, such as lambs [
9], chickens [
10,
11], rabbits [
3], and beef cattle [
2]. However, no reports are available on the use of pOC and the metabolic pathway of these compounds in poultry.
Poultry meat is particularly prone to oxidative deterioration due to its high concentration of polyunsaturated fatty acids [
12]. There are many studies showing an improvement in the oxidative stability of chicken meat after feeding poultry with natural antioxidants as dietary additives [
10,
11,
13], causing an increase in the market value of the resulting products. Olive industry by-products could represent a different source of nutrients for animals and their inclusion in animal diets could be a convenient strategy to reduce oxidative deterioration in meat and increase olive oil production sustainability.
From an analytical point of view, at present, the more efficient technique for the analysis of polyphenols in complex matrices such as food is the liquid-chromatography coupled to tandem mass spectrometry [
14,
15]. Due to the low volatility of polyphenols, gas-chromatographic techniques are generally not applied for their separation, since they would require an additional derivatization step. Mass analyzers furnish the best selectivity, sensitivity, and universality, compared to traditional detectors such as diode array or fluorescence. However, these techniques are still used to analyze polyphenols in food of animal and vegetal origin [
16,
17]. Sample preparation plays a pivotal role in polyphenol analysis, especially when low concentrations (parts per billions) have to be detected and quantified: a clean-up step with SPE cartridges is generally provided after analyte extraction with polar solvents [
18,
19,
20].
To our knowledge, no studies have been conducted so far on the effects of dietary pOC on oxidative stability and the presence of bioactive polyphenols in chicken meat. The aim of this study was therefore to investigate the effects of pOC dietary supplementation at two different levels on performance, quality characteristics, consumer acceptance, and antioxidant and oxidative status of meat in broilers. The presence of phenolic compounds and their metabolites in chicken meat was also investigated.
2. Materials and Methods
2.1. Animals and Experimental Design
The trial was conducted in 2015 in an experimental farm located in Umbria, Italy, with environmental conditions similar to those found in conventional industrial poultry houses.
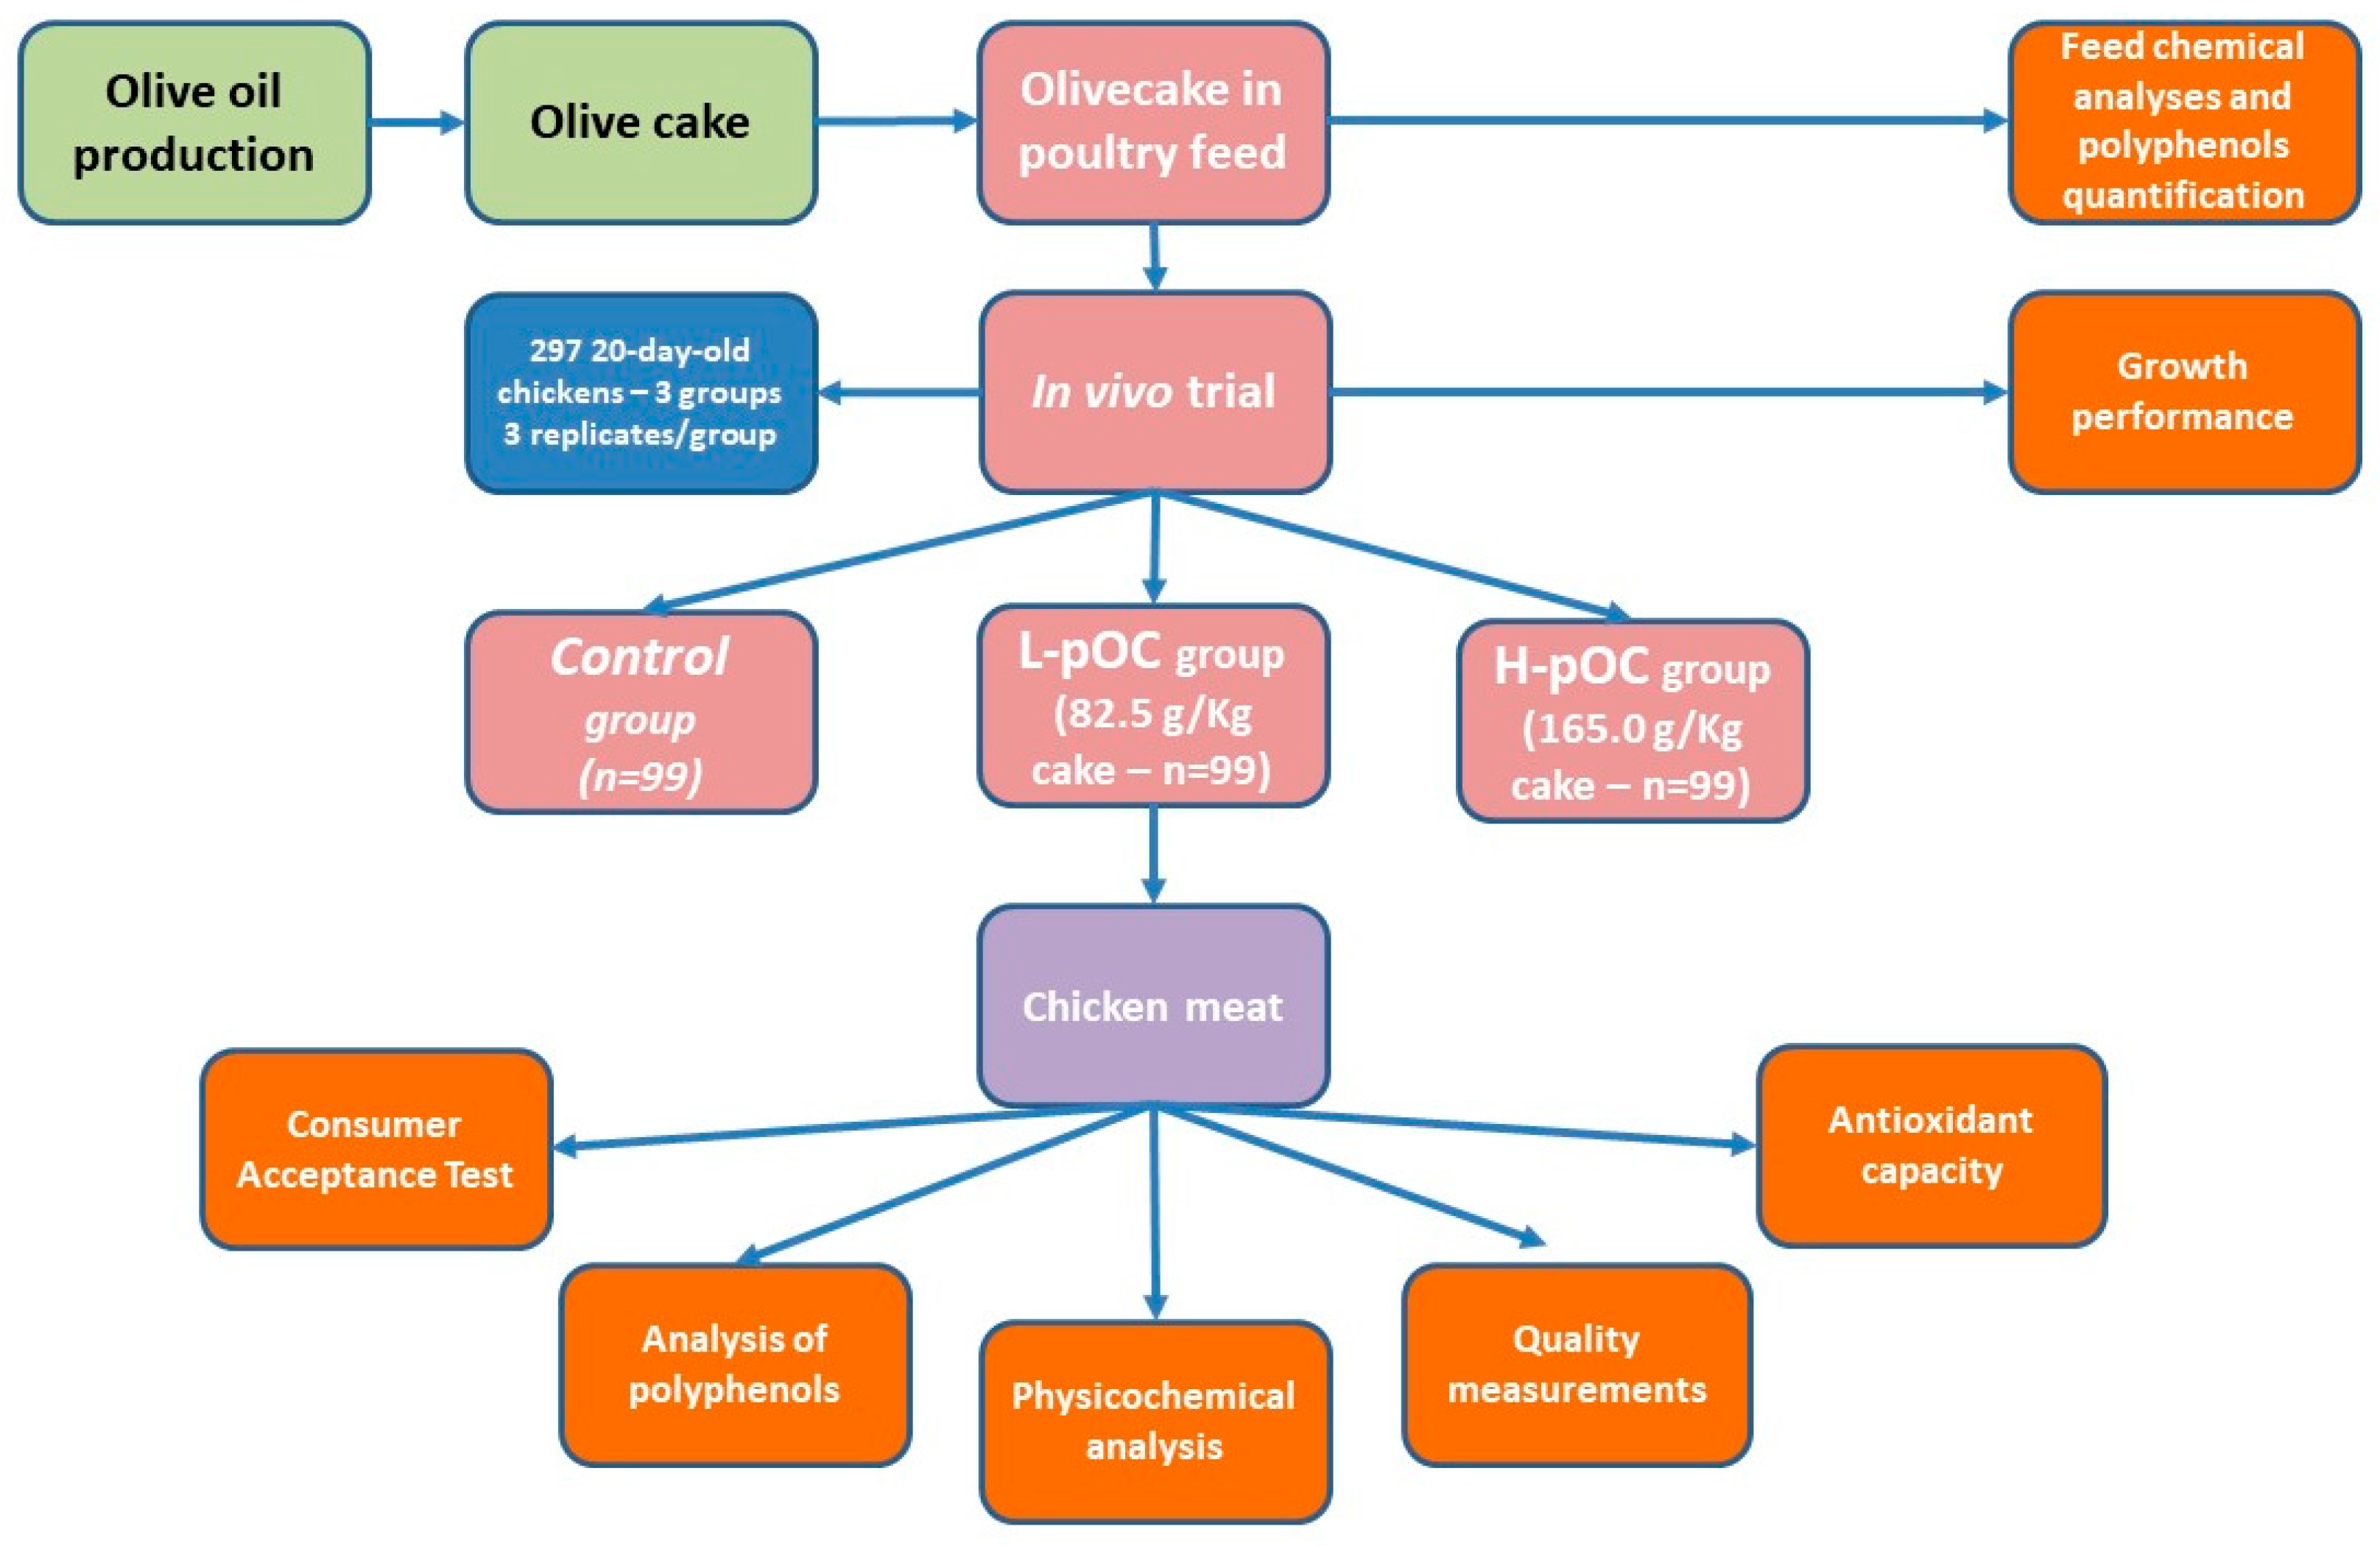
Two hundred and ninety-seven 22-day-old fast growing (Ross 308) female chicks were randomly assigned to three experimental grower-finisher diets. Each dietary group consisted of three replicates, each with 33 birds. The experimental treatments were: (1) a basal control diet (C); (2) C diet supplemented with a low dosage of olive cake (82.5 g/Kg, L-pOC); and (3) C diet supplemented with a high dosage of olive cake (165.0 g/Kg, H-pOC). The same starter diet was used for all experimental groups from 1 to 21 days of age.
The experiment lasted 20 days. All experimental feeds were formulated to be isoenergetic and isonitrogenous and according to the National Research Council standards for broiler chickens [
21]. The three experimental diets are presented in
Table 1. Feed and water were offered ad libitum during the whole experimental period.
Animal care procedures complied with European recommendations (Directive 2007/43/EU), which set welfare standards for keeping chickens for meat production. The experimental protocol was approved by the Italian Ministry of Health.
The birds were individually weighed at 28, 35, and 42 days of age. Feed conversion ratio was calculated as feed intake divided by average weight gain. At the end of the experiment (day 42), 10 broilers from each replicate were slaughtered in a local slaughterhouse. Carcasses were maintained at 4 °C for 24 h, then samples from Pectoralis major muscles were collected, vacuum-packed, and stored at −20 °C for three months for consumer test and at −80 °C for other analyses.
A graphical representation of the experimental design is presented in
Figure 1.
2.2. Analysis of Polyphenols in Feed and Meat
Considering the expected concentrations of polyphenols in the two matrices (mg/kg for feed versus µg/kg for meat), two different sample treatments were performed. Both methods were internally developed starting from previous published papers [
18,
19,
20].
For feed analysis, the extraction of polyphenols was conducted from 5 g of minced sample mixed with methanol/water 80/20 (v/v) solution containing 20 mg/L of BHT (2 × 25 mL). Two aliquots of the extract were collected and diluted 50 and 500 fold with a mixture of Na2EDTA 0.1 M/methanol 90/10 (v/v). After filtration, the two aliquots were injected in LC-MS/MS.
For meat analysis, the analytes were extracted twice on 5 g of homogenized sample with a methanol/water 80/20 (v/v) solution containing 20 mg/L of BHT (2 × 10 mL). After volume reduction under nitrogen stream, the extract was purified using an SPE OASIS HLB cartridge (200 mg/6 mL, Waters, Milford, MA, USA) previously conditioned with 6 mL of methanol and 6 mL of water. The extract was loaded; the cartridge was washed with 6 mL of water; and the analytes eluted with 6 mL of methanol. The eluate was evaporated and re-suspended in 1 mL of Na2EDTA 0.1 M/methanol 90/10 (v/v) solution. After filtration, the sample was injected in LC-MS/MS.
Liquid chromatographic separation and mass spectrometric detection and quantification were performed on a LC-MS/MS system consisting of a Finnigan Surveyor LC pump, combined with a triple quadrupole TSQ Quantum Ultra mass spectrometer via electrospray ionization (ESI) interface (Thermo Scientific, San Jose, CA, USA). Chromatographic separation was carried out on a Gemini analytical column (100 mm × 2.0 mm, 3 µm, Phenomenex, Torrence, CA, USA) with a binary mobile phase with water (A) and methanol (B). The gradient started with 5% eluent B for 1 min, and linearly increased to 43% B in 8 min, followed by a linear increase to 95% B in 6 min. After 7 min, the system decreased to 5% B in 1 min and was re-equilibrated for 12 min. The column temperature was 30 °C and the sample temperature was kept at 16 °C. The flow rate was 0.25 mL/min and the injection volume 10 µL. For LC-MS/MS detection, the ESI source was operated in negative ion mode. High-purity nitrogen was used as sheath (30 arbitrary units) and auxiliary gas (20 arbitrary units). The collision gas was high-purity argon (1.5 mTorr). The parameters were as follows: spray voltage, −2.5 kV; capillary temperature, 200 °C. The selected precursor ion and optimized collision voltages of product ions used for quantification and confirmation are shown in
Table 2. Thermo Scientific Excalibur software version 3.0 was employed for data acquisition and processing. Quantification was carried out by comparison with a four-point curve applying matrix-matched calibration (analytes added immediately prior to LC injection). Specific curve was prepared depending on matrix and, for feed, also on dilution factor.
2.3. Physicochemical Analysis of Meat
Samples of
P. major muscle from 10 animals per replicate (
n = 30) were analyzed for chemical composition according to the Association of Analytical Chemists methods [
21]. The moisture content was obtained by oven-drying meat samples (125 °C for 2 h) (method 950.46). The fat content was gravimetrically determined using ether solvent extraction (method 960.30). The nitrogen content was determined using the Kjeldahl method (method 992.15). The protein content was obtained by multiplying the total Kjeldahl nitrogen with a coefficient factor of 6.25. The ash content was obtained using a muffle furnace at 600 °C (method 923.03). The TBARS (2-ThioBarbituric Acid Reactive Substances) value was determined according to Ranucci et al. [
24] and the results were expressed as mg malonaldehyde (MDA)∙kg
−1.
2.4. Antioxidant Capacity of Meat
Meat samples (1 g) were mixed with ethanol/HCL 0.1 M 9.9/0.1 (
v/
v) solution at pH 4.0, homogenized with Ultra-Turrax homogenizer (Ultra Turrax T25 Basic, IKA Labortechnik Janke & Kunkel GmbH, Stavfen, Germany) for 1 min, and then vortexed for 2 min. The homogenates were centrifuged at 6000 rpm at 4 °C for 20 min and the supernatant used for DPPH assays. The DPPH free radical scavenging activity of ethanolic extracts was measured using the method described by Blasi et al. [
25], with some modifications. Briefly, a 0.06 mmol/L solution of DPPH in ethanol was prepared and left for 1 h in the dark at 4 °C; 0.06 mM ethanolic DPPH solution (3.9 mL) was added to ethanolic extracts (0.1 mL). The solutions were vortexed and left for 30 min in the dark. Absorbance was measured at 517 nm using a Jasco 7850 UV–Vis spectrophotometer against a blank and DPPH radical scavenging activity was expressed as mg of Trolox equivalents (TE) per 100 g sample from a standard curve developed with Trolox.
2.5. Meat Quality Measurements
Samples of
P. major muscle from 10 animals per replicate were analyzed. The pH was measured on
P. major muscle 45 min and 24 h post-mortem using a penetrating electrode connected to a portable pH-meter (Mod SG2, Mettler Toledo AG, Schwerzenbach, Switzerland). Color measurements were performed 24 h after slaughter on
P. major muscle following a 30 min bloom period at the refrigeration temperature. Color parameters (CIE L*a*b* color system) coordinates [
26] were determined using a Minolta Chromameter CR400 (Minolta, Osaka, Japan—light source of D65 calibrated against a standard white tile). The results were expressed as lightness (L*), redness (a*), and yellowness (b*). The hue value (tan
−1 b*/a*) and saturation index or chroma ((a*
2 + b*
2)
1/2), were also calculated.
Drip loss and cooking loss were measured in samples from the
P. major muscle as described by Honikel [
27]. For drip loss determination, meat samples were inserted in a plastic box on a grid parallel to the fiber direction and then stored at 4 °C for 24 h. For cooking loss determination, meat samples were held in plastic bags, then cooked in a water-bath at 80 °C for 30 min, and finally cooled under running tap water for 15 min. Samples were weighed before and after cooking, and losses were calculated as 100 × (initial weight-final weight)/initial weight [
28].
The Warner-Bratzler (WB) shear force value was also measured [
27]. Three cylindrical cores (Ø 1.25 cm), which were cut parallel to the
P. major muscle fibers, were obtained from cooking loss samples and tested for shear force using a WB shear device fitted to an INSTRON universal texting machine (INSTRON model 1011, INSTRON Instrument, Norwood, MA, USA; 50 kg loading range, shear velocity 100 mm/min). The peak force, which was expressed in Newton, was recorded and then converted to kg/cm
2.
2.6. Consumer Acceptance Test
Consumer acceptance tests were performed at the Department of Veterinary Medicine, University of Perugia (Perugia, Italy). All consumers were asked to complete a questionnaire which included information regarding their age, sex, and the frequency of chicken meat consumption [
29]. In total, 110 regular chicken meat consumers (aged 20–60; 60 females and 50 males) were included for the consumer evaluation. The assessors tasted samples of the
P. major muscle, which was placed on steel trays covered with aluminum foil and oven cooked at 180 °C (10% relative humidity) for approximately 25 min to an internal temperature of 71.1 °C, which was measured using a thermometer with a handheld probe (TES-1300, TES Electrical Electronic Co., Taipei, Taiwan). The cooked breast was cut into 2 × 2 × 2 cm pieces and kept warm until the slices were served. Practicing sessions were performed before the test to allow consumers to become familiar with the use of a hedonic scale and to explain the meaning of the used attributes. Samples were individually served on white plastic plates identified by three random digit codes. Consumers were asked to rate sensory attributes using a nine-point hedonic scale for overall appearance, odor, taste, overall texture, and overall acceptance. Purchase intent was evaluated using the binomial (yes/no) scale before and after acquiring information about dietary supplementation of the chicken [
30].
2.7. Statistical Analysis
Data were analyzed using the GLM procedure of SAS [
31]. An ANOVA model was used with diet (C, L-pOC and H-pOC) as the fixed factor. The replicate effect was found not significant and removed from the model. The differences of the means were detected using the Tukey test and considered significant when
p < 0.05. McNemar’s test was applied to determine if significant difference existed between consumers’ purchase intent before compared with after having gained information about the dietary supplementation of the chicken. Statistically significant difference was established at
p < 0.05.
3. Results and Discussion
Table 3 shows broiler performance data recorded during the trail at weekly intervals. At all intervals, pOC supplemented groups showed increased live weights and this increase was higher with increasing pOC concentration in the diet. However, the difference between the control and the H-pOC group became significant at 35 days of age (
p = 0.014), after 15 days of dietary supplementation. At the end of the trial, both pOC supplemented groups showed higher live weights compared to the control (
p < 0.001).
Most interestingly, feed conversion ratio decreased with increasing dose of pOC in the birds’ diet. Possibly, the effect is a result of the polyphenol action on the oxidative state of the animal and the intestinal microflora which increased the birds’ welfare level [
10]. According to Tufarelli et al. [
11], the positive effect of olive oil polyphenols on the chickens’ growth rate is possibly related with the increased feed digestibility caused by the reduced digesta passage rate. The only study which reports the effects of pOC on broiler performance demonstrated a positive effect of these supplements in birds when slaughtered at 49 days of age with diets which contained amounts of pOC similar to those of the present experiment [
6]. In previous studies where olive mill by-products or other polyphenol-rich by-products were used in broilers, inconsistent results were reported due to differences in the composition of feeds or in the experimental design [
10,
11,
32,
33].
The contents of polyphenols in feed are shown in
Table 4. The four molecules were selected on the base of previous research data: tyrosol, hydroxytyrosol, verbascoside, and pinoresinol, evaluated in this study, are some of the most abundant phenolic compounds present in the olive mill waste, characterized by a high antioxidant activity, a large bioavailability, and significant bioactive properties [
5,
34,
35,
36,
37]. In particular, hydroxytyrosol was reported as the major phenolic compound in olive oil waters and as one of the most abundant in olive cake [
38].
Most abundant polyphenol compounds in the experimental feeds were tyrosol and hydroxytyrosol, followed by verbascoside and pinoresinol. Taken into the account the different concentrations of polyphenols found in feed spanning about two orders of magnitude, each analyte was determined choosing the injected sample with the more suitable dilution factor (50 or 500 fold).
As expected, the H-pOC feed had the highest total polyphenol content, followed by the L-pOC one. The presence of low concentrations of tyrosol and hydroxytyrosol in the C feed is probably related to the presence of olive oil, added to this feed (1.75%) to balance the energy and fatty acid content of the three diets (
Table 1).
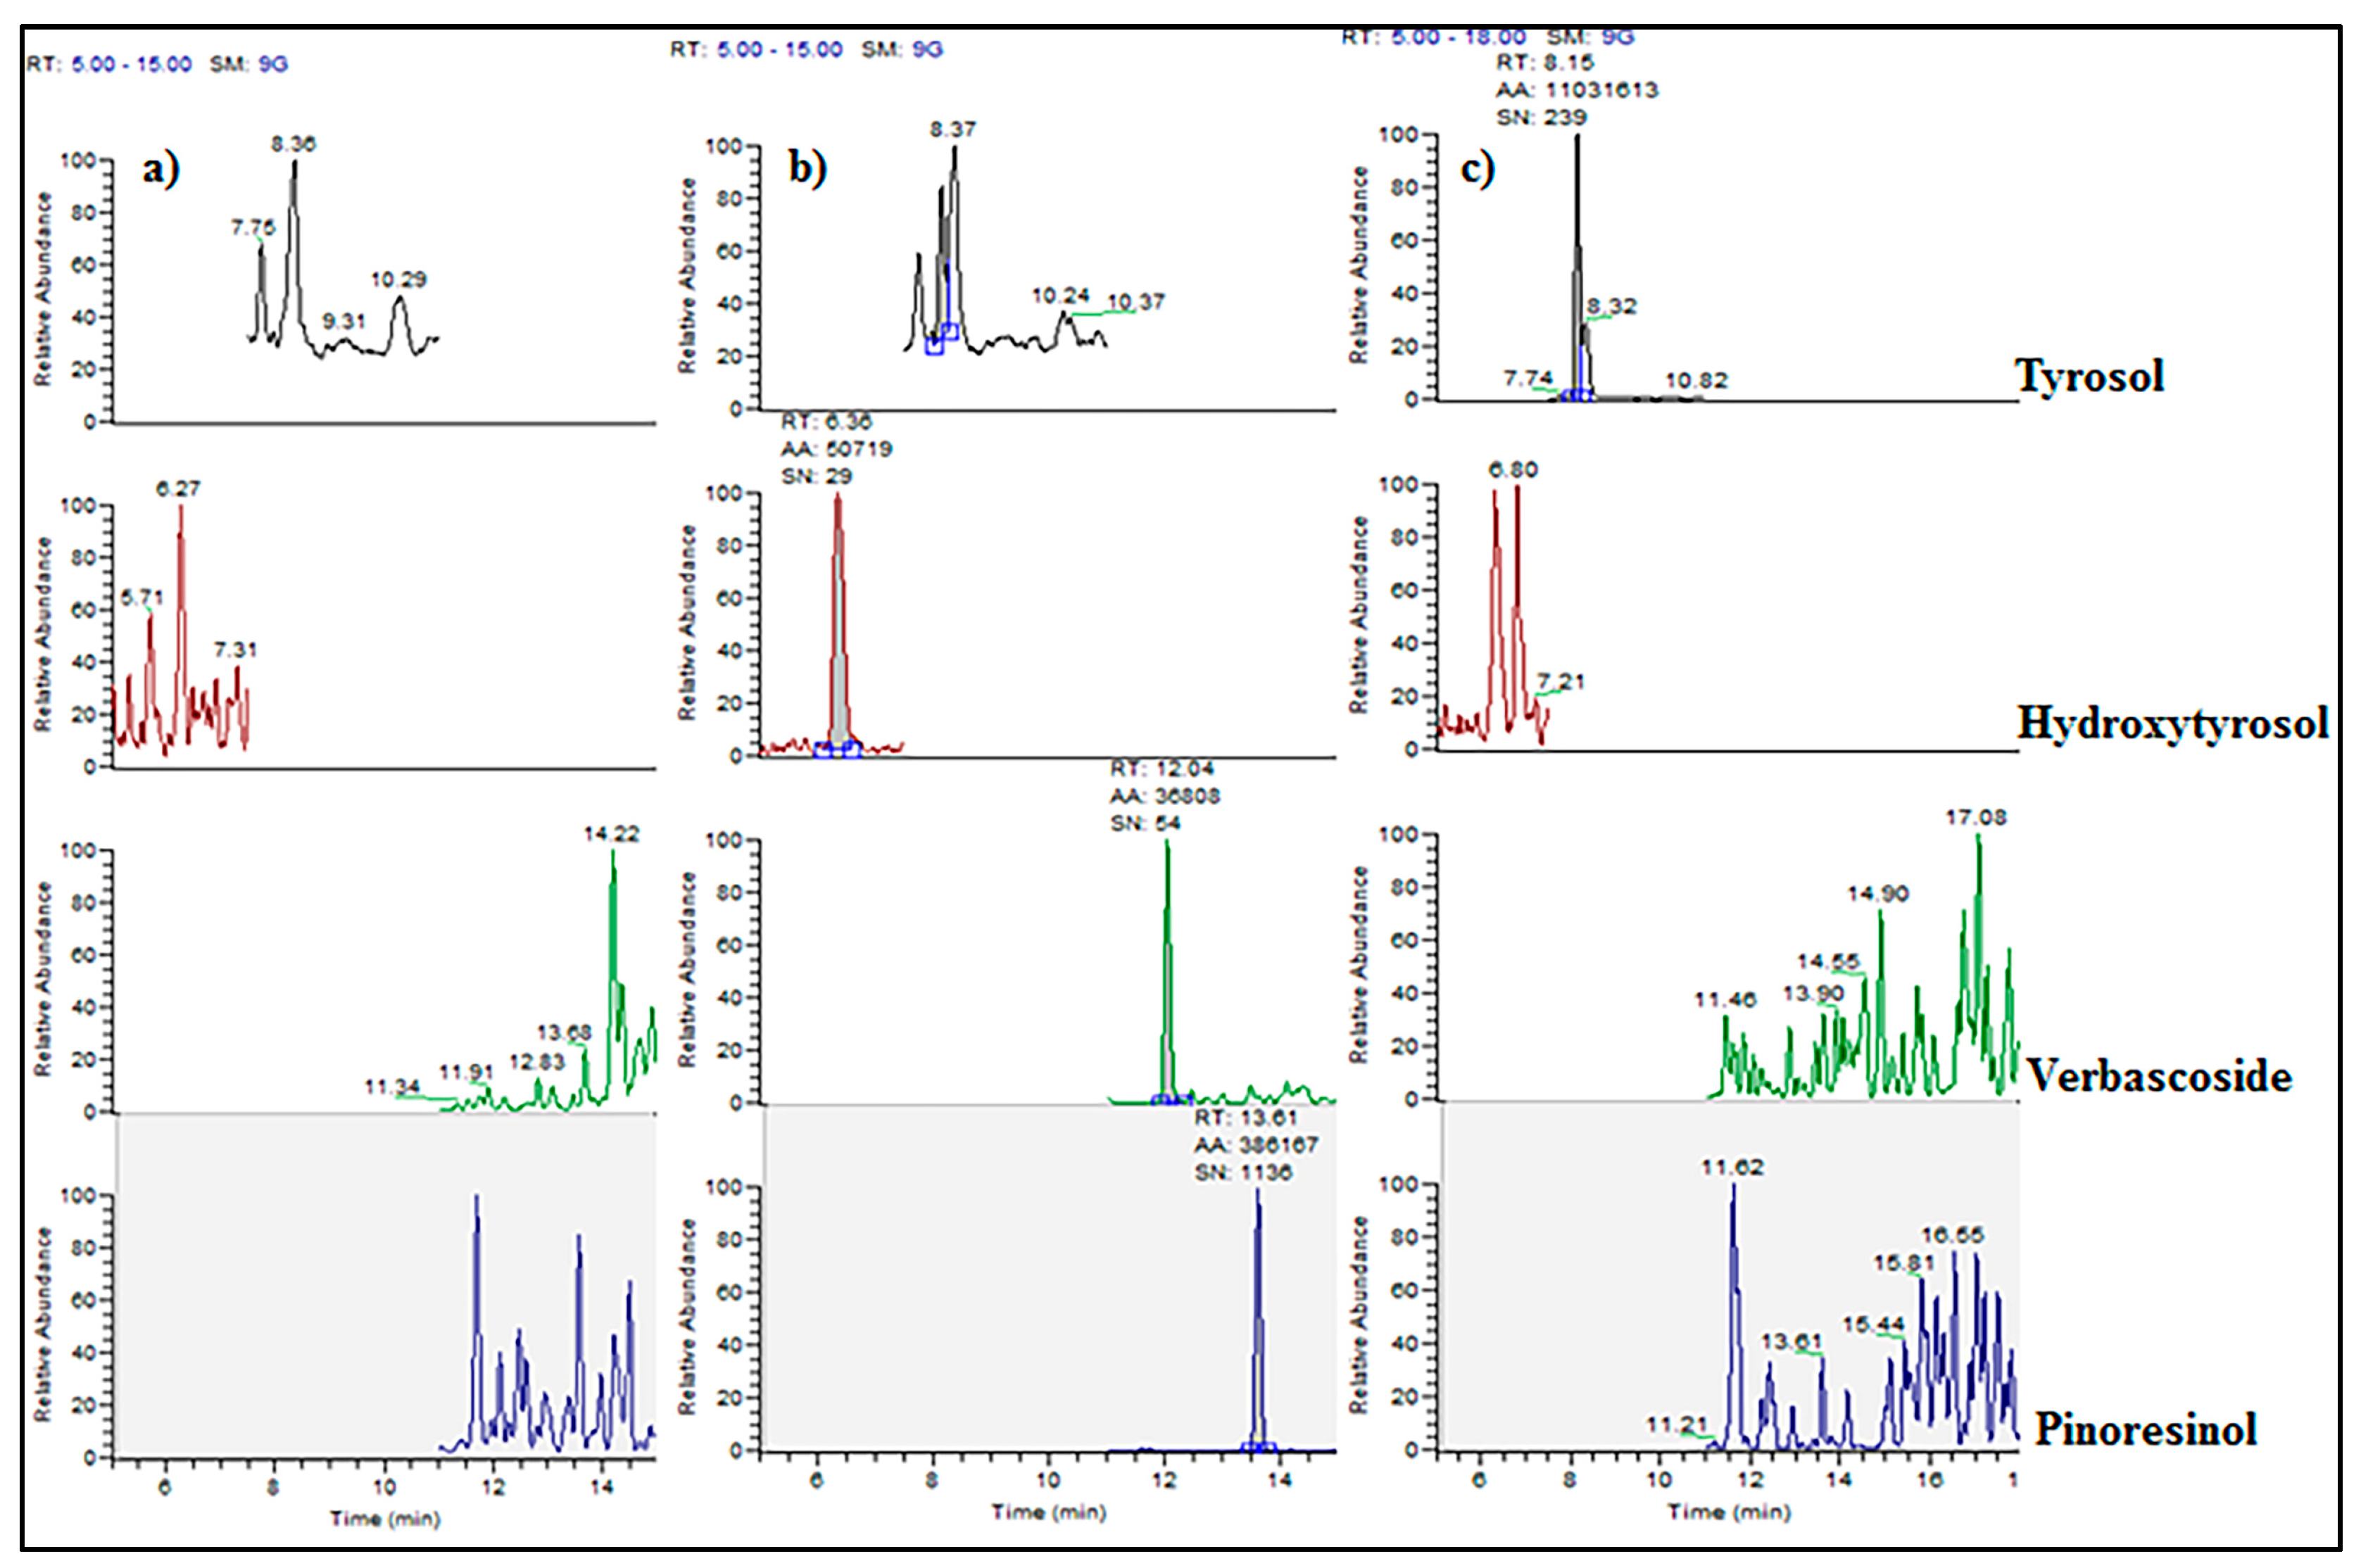
Regarding the analysis of
P. major muscle samples, pinoresinol, verbascoside, and hydroxytyrosol were not detected (<0.5 µg/kg). Only tyrosol was detected in two samples belonging to the H-pOC group (8 and 47 µg/kg). In
Figure 2, the LC-MS/MS chromatograms of a blank, spiked, and incurred meat sample are showed.
Figure 2b demonstrates the ability of the here-developed method to determine polyphenols at trace levels (1 µg/kg).
The detection of polyphenol metabolites has been documented in the literature in human/animal biological fluids, as well as in rat tissues [
39,
40,
41]. Therefore, in order to complete the analytical study, the possible presence of glucuronide and sulphate metabolites of hydroxytyrosol and tyrosol was investigated. For this purpose, the specific SMR transitions were acquired during all the chromatographic run [
19]. Only the hydroxytyrosol-sulphate was found and it was detected in all meat samples of both supplemented groups (L-pOC and H-pOC) in a concentration range from about 1 to about 5 µg/kg. Identification studies carried out with the authentic standards revealed that both isomers (hydroxytyrosol-3-sulphate and hydroxytyrosol-4-sulphate) were present (data not shown). It must be underlined that most of the previous studies [
18,
19,
20,
41] were performed measuring polyphenols and their metabolites immediately after the administration of high doses of polyphenols. To the best of our knowledge, to date no research has reported residue levels of these compounds in meat of food-producing animals within an on-farm trial.
The results of the meat quality traits and chemical composition on
P. major muscle are shown in
Table 5.
No differences in the pH of
P. major muscle 24 h after slaughter were detected among groups. Values of cooking loss, drip loss, WB shear force, and color were also not affected by the dietary treatment. Similarly, Dal Bosco et al. [
3] reported that quality traits of rabbit meat were not affected after supplementation with olive pomace. In meat of other species, the difference in a* value between controls and animals fed a diet supplemented with antioxidants only increased during sample storage [
2]. The proximate composition of muscles was also not affected by diet. The same results were obtained by Dal Bosco et al. [
3] in meat of rabbits fed with olive pomace.
Values of TBARS and DPPH measurements in meat samples are shown in
Table 6.
H-pOC animals showed lower meat TBARS values when compared to the other two groups. These results are in agreement with Gerasopoulos et al. [
10], who found a decrease in lipid peroxidation, as shown by the reduction in TBARS levels in meat of chicken fed with olive mill waste water. Furthermore, other studies have shown that some of the major polyphenols found in olive mill waste water (e.g., hydroxytyrosol, verbascoside, and isoverbascoside) are effective to inhibit lipid peroxidation [
42]. Several authors found extended meat oxidative stability and a decreased lipid oxidation during storage in lamb and beef muscles after olive cake dietary supplementation [
2,
9]. Tufarelli et al. [
11] found an increased antioxidant defense system and a reduced lipid peroxidation in chicken liver following dietary supplemented with extra virgin olive oil.
In accordance with the higher presence of polyphenols in the H-pOC diet, the DPPH assay showed higher antioxidant activity in H-pOC meat compared to the other two groups. Polyphenols derived from the olive waste could act as primary antioxidants and inhibit oxidation acting as chain breakers by donation of a hydrogen to alkylperoxyl radicals generated by the lipid oxidation. The ability to act as a hydrogen donor to inhibit oxidation is higher in those molecules with an increasing number of hydroxyl groups, such as hydroxytyrosol, that possesses the highest antioxidant and radical scavenger activity [
43]. Nevertheless, the presence of tyrosol and hydroxytyrosol sulphate may have played a role in the antioxidant capacity and oxidative status of meat.
The results of consumer acceptance tests performed for chicken meat are reported in
Table 7. No differences among groups were found regarding the examined attributes and consumer acceptability. It is possible that the efficacy of polyphenols in preventing lipid oxidation, thus preserving chicken meat sensory properties, is more evident during storage, since lipid oxidation in poultry meat is one of the primary causes for limiting its quality [
2]. As for the evaluation of purchase intent, consumers would prefer H-pOC meat (affirmative purchase intent of 48.15%), compared to C (46.29%) and L-pOC (44.4%) meat, before providing information about the chicken diet. After providing the information about treatments used to consumers, the purchase intent of L-pOC and H-pOC meat increased based on the McNemar test (
p < 0.05), while the purchase intent of the C meat decreased. Consumers were positively affected by the information, showing that the choice can be influenced by product information. Other studies on different kinds of meat demonstrated how the effect of the information can be able to modify consumer behavior and perception [
24].

 ,
, 

