The Gigantism of Public Works in China in the Twenty-First Century
by
 and
and
Mario Martín-Antón
*, 
Vicente Negro
,
José María Del Campo
,
José-Santos López-Gutiérrez
and
M. Dolores Esteban
Department of Civil Engineering: Hydraulics, Energy and Environment, Universidad Politécnica de Madrid, 28040 Madrid, Spain
*
Author to whom correspondence should be addressed.
Sustainability 2017, 9(9), 1581; https://doi.org/10.3390/su9091581
Submission received: 28 July 2017
/
Revised: 25 August 2017
/
Accepted: 31 August 2017
/
Published: 5 September 2017
(This article belongs to the Section Sustainable Engineering and Science)
Abstract
:Part of human beings’ relationship with the world around them includes constructing or building. They connect with the land and makes civil engineering an action of reflection with the environment, a use of material, and a function of construction work. This involves a combination of necessities and perfection in order to fulfil an aim. To build is essential on this earth. From a “mud hut” as the commencement of architecture up to water regulating with dams, conducting it via a channel, overcoming obstacles by use of a bridge, or finding shelter and sailing by using harbours, a public work requires the welfare of a community as its “raison d´être”. The aim of this investigation is to analyse the human condition in construction and how works of an enormous size that change the way of “being on earth” have been tackled for instrumental reasons by disassociating necessities, revitalizing noxious effects, destroying nature’s scenery and landscapes, disturbing the environment, and negatively affecting the urban development of our “poly-cities”. Referred to by the authors of this article as “gigantism of public works”, this concept is analysed using examples in Asia and works of a notable size in China.
Keywords:
civil engineering; bridges; tunnels; harbours; railways; structures; land reclamation; gigantism; China; Asia1. Introduction
Public works have been built over thousands of years to meet the needs of many populations. The vast majority were built solely to fulfil their function: a bridge to overcome obstacles, to communicate, and develop the neighbourhood; a dam to store water; a channel to lead it to its destination; and a roof to shelter from the sun and guarantee shade, amongst other aims. There are also examples of public works whose intention was to also demonstrate the political power of an area that, by adding in functionality, took their monumental nature and aesthetics into consideration. Roman activities and monuments such as an aqueduct, circus, or amphitheatre were symbols of power also associated with the human essence of function, recreation, and eternity.
All these works have gradually evolved throughout history due to new knowledge of structures and new materials but, as in other disciplines, “gigantic” development has taken place in the twentieth and especially the twenty-first centuries. This has brought humans to face the challenge of increasingly bettering themselves, forgetting sustainability factors in most cases. On occasion, these projects meet non-existent needs for purely instrumental reasons or a further demonstration of power concept, which was the case with many ancient civilizations and their large constructions: Egypt, Babylonia, Assyria, Greece, Rome, the Mayan and Inca empires, amongst others, can be mentioned.
This spirit of self-betterment in the field of public works is sometimes accompanied by the actual needs of current globalisation and population increase. This generates a greater demand for energy, natural resources, and passenger and goods transport. It leads to constructing new motorways, higher capacity bridges, higher dams, ports with more quays, backfills, and shipyards, longer tunnels, etc. Even though these developments may be necessary to a certain extent, many are the result of an out-of-control growth mentality that ignores environmental and social matters. Others are even the fruit of squandering policies with no coherent justification.
This concept is called “gigantism”, not to be confused with the architectural style called “brutalism”, whose huge, rugged-looking buildings are formed by concrete with repetitive angular geometries and textures for giving shape to the material. This idea of expressing a work and material in “brute” form [1] is quite a different architectural concept to the proposal of gigantism as the essence of the human being in construction, losing its essence of need, leaving behind innovation, and developing construction works as a pretence for needs and a waste of energetic, economic, and environmental resources.
Throughout history, some country or society has always been in the vanguard of technology. Large constructions, requiring very strenuous human effort when life was not deemed important and “slave labour” was the standard, were built in Babylonia and Egypt. Architecture began to become humanised in ancient Greece. In the Roman Empire, urban service systems were improved in towns, and the arch was invented, allowing for bridges and aqueducts to be built where they were unthinkable beforehand. It was this age that saw public works become as important as they are today. Building roadways along which troops were moved, harbours for trading in the Mediterranean, aqueducts to supply water to towns, bridges to cross rivers, sewer systems to improve the quality of health in streets, etc. made public works a necessary condition for Rome’s expansion and hegemony.
No substantial change came about in the Middle Ages as to the scale and technology used in public works. The use of iron (a new material) in construction and the Industrial Revolution was the drive behind development in the world, particularly in Europe and the United States. Machines working in the place of humans brought about a considerable reduction in construction time and an improvement in workers’ safety. Bridges could spread over greater spans, tunnels were bored much quicker, harbours required greater depths because the sailing ships were replaced with steam vessels, dredging machinery transformed dockyards and fills; as public works needed less direct human effort in their building, they grew and grew because of the obvious needs for “sustainable” progress. Another engineering landmark was the appearance of reinforced concrete in the nineteenth century and its employment in large engineering works in the twentieth century, commencing with Europe, following on in the United States, and concluding in Japan at the end of the century.
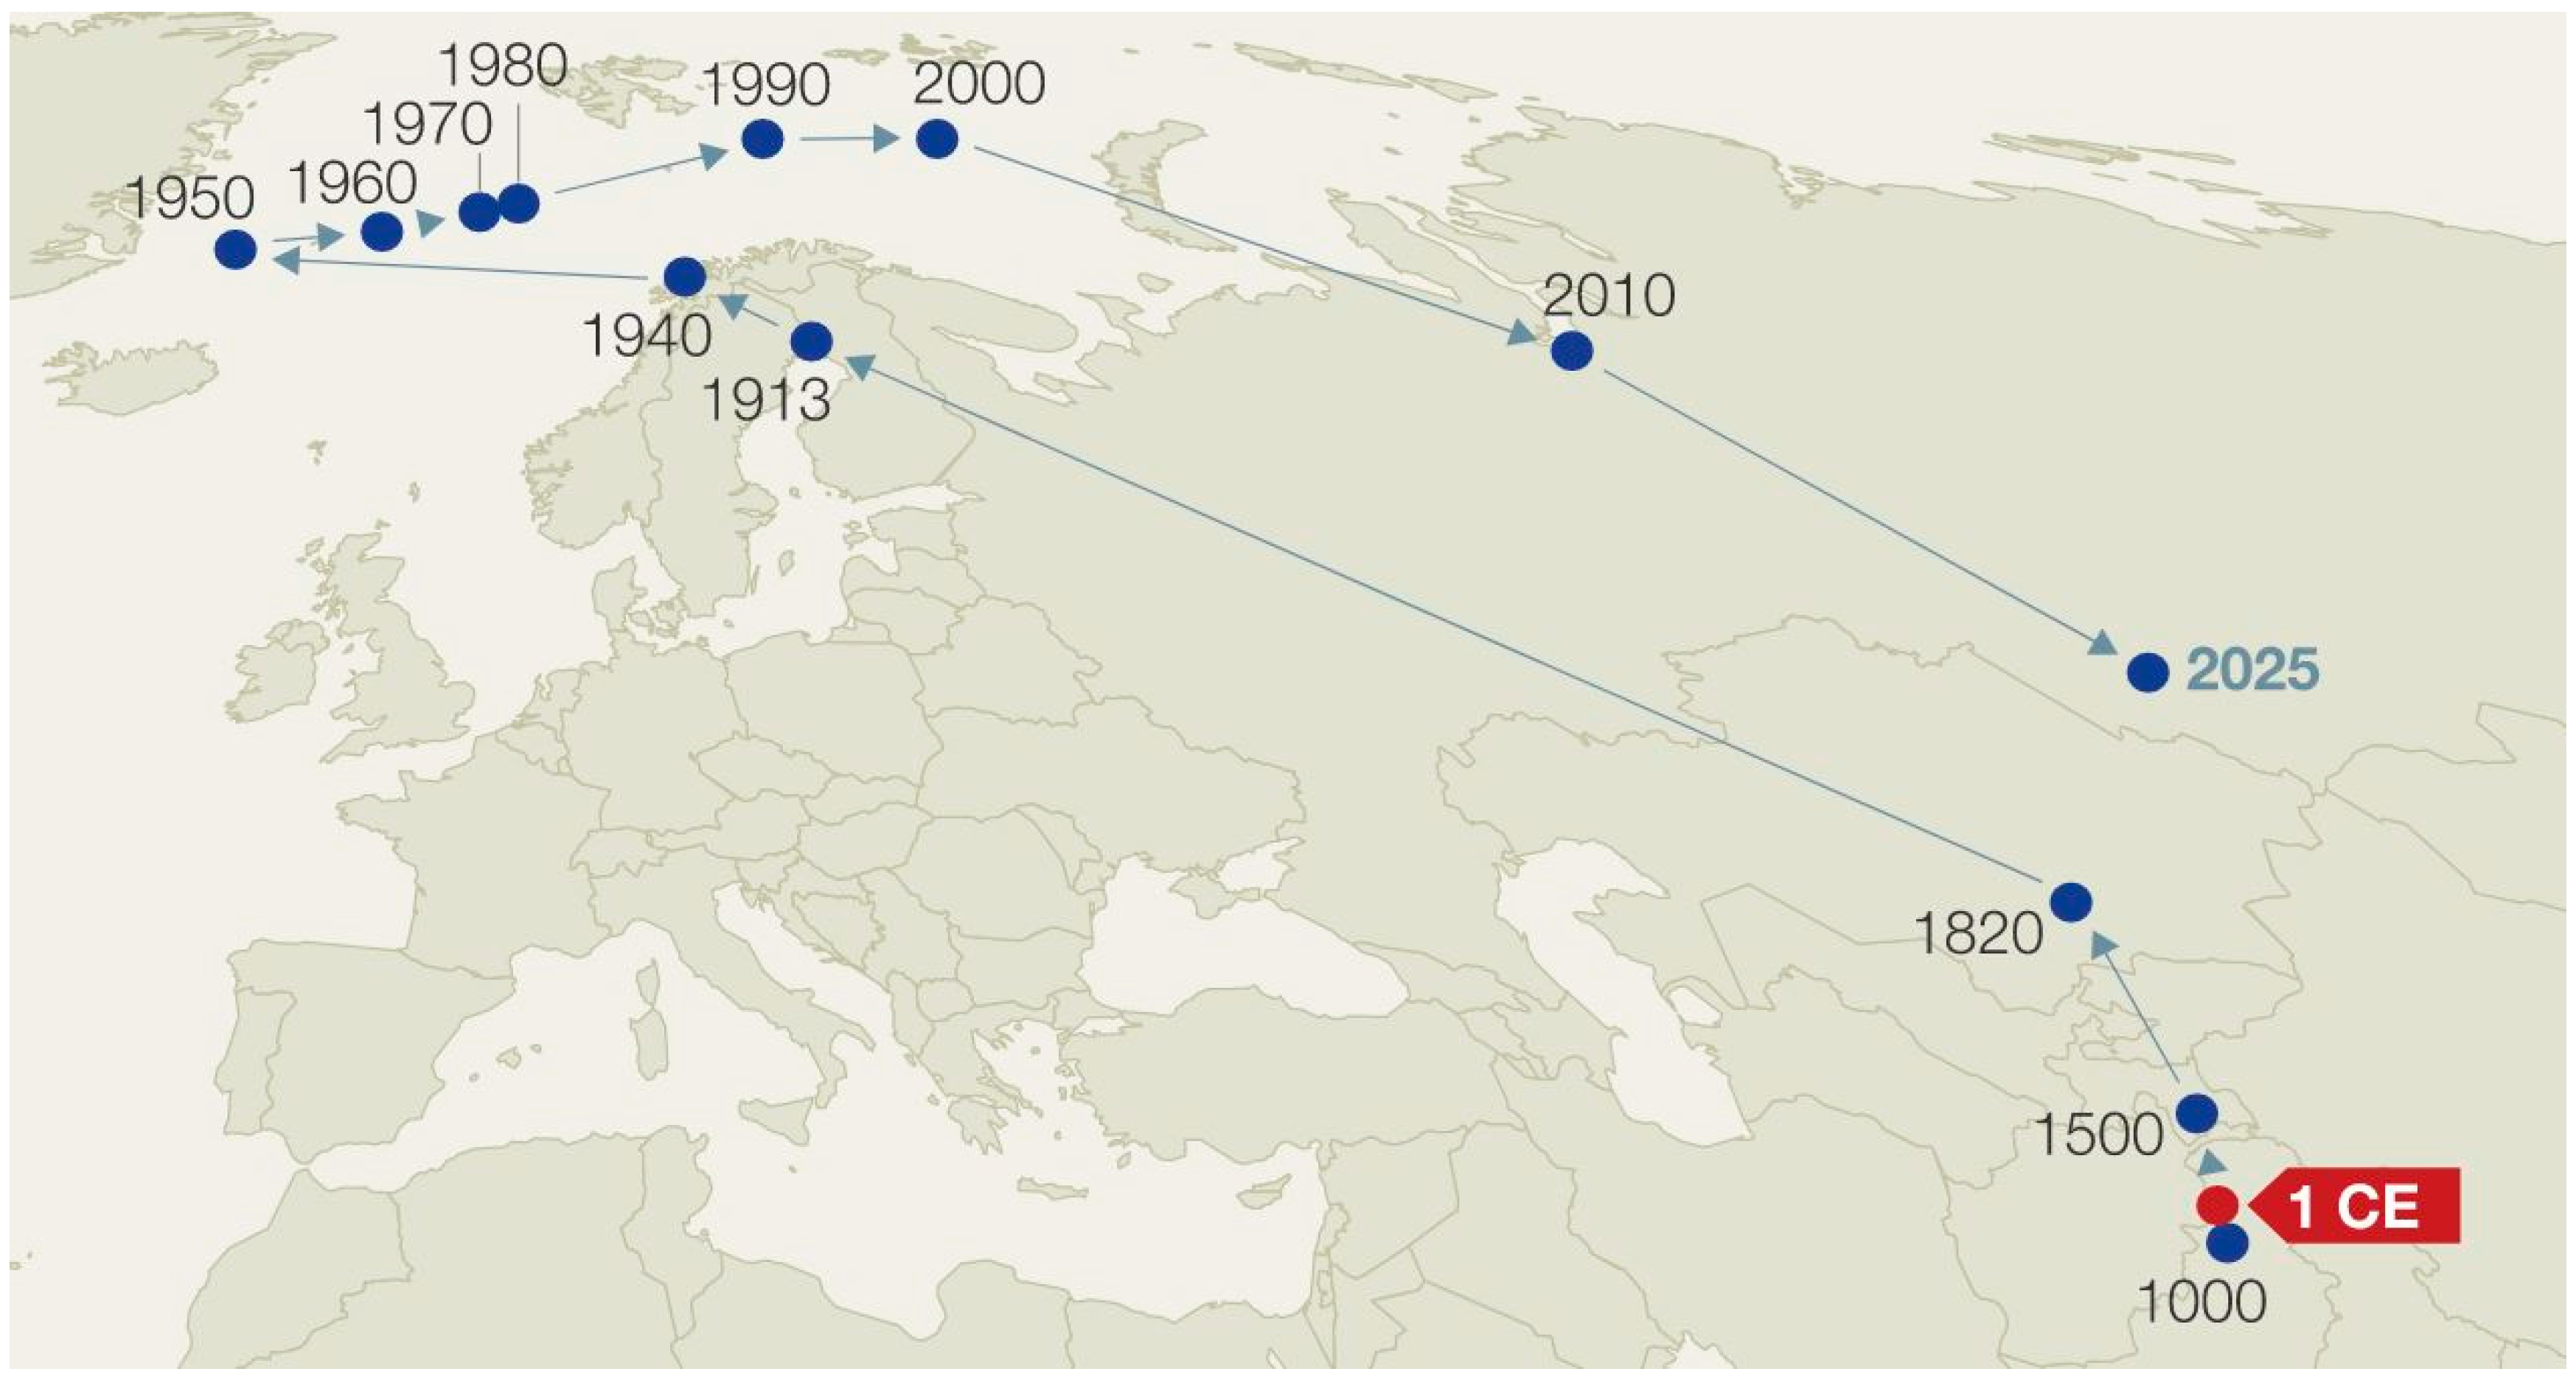
Players have changed in the twenty-first century. Western economies are being overtaken by the emerging countries’ as reflected in the progress of public works. Asian countries like those on the Persian Gulf and, in particular, China, are excelling. Asian countries are meeting the great challenge of developing major infrastructure constructions that are crucial both for improving the overall performance of their national economies and for reducing poverty [2]. If, beforehand, the centre of the world’s economic, commercial, and development activity was located in Europe and the United States, now that has completely changed. The greatest developments in the construction world are taking place in South East Asia and the Persian Gulf. This has moved the world’s construction centre of gravity to the area of China and other nearby countries (Figure 1). In the year 2008, $800 billion were earmarked worldwide for infrastructure projects, involving 2% of global GDP, while China earmarked almost 8% of its GDP for infrastructure in 1995–2005 [3]. In Asia, infrastructure finance has been estimated at US$300 billion a year, of which 65% is for new road construction, telecommunications, and power, and the remaining 35% is for maintaining existing facilities [4]. The problem of finance is important to these large projects. For some time, government funding was the main source of finance for large infrastructure projects. Nevertheless, it seems that it is not an appropriate or affordable way to fund such projects. For this reason, raising funds from the capital or money market has become an alternative source [5].
The past, current, and future situation of the world’s economy is shown in Figure 1. Economic development is translated mostly into a construction and environmental impact and today is moving fast to East Asia. Sometimes, this power is demonstrated by constructing the longest and highest bridges, longest tunnels, highest skyscrapers, or largest harbours. This is the tip of the iceberg of the construction industry, which is studied in this research work. In this discussion, some charts give an idea of the evolution of huge public works and construction in China and are related with natural resource consumption (cement, iron, fossil fuel) and their energy needs, which runs against sustainability.
2. Methods
The major feature of this investigation focuses on the validity of data and on the concept of gigantism or need as a function of public works since this is a study on the most extreme features of infrastructures the world over. The study assumes and demonstrates that many works performed over the last few years are those beating length, height, or area records. The end of 2015 has therefore been set as a reference date for all data. Varied parameters have been taken into account for classifying infrastructure and the manner for obtaining or calculating relevant variables. Information as to the height of skyscrapers and structures and lengths of bridges and tunnels has been obtained from Internet pages, such as http://skyscraperpage.com/, http://structurae.net/, and http://www.skyscrapercity.com/. As there are no technical or scientific articles or technological books with such up-to-date information, the Internet has been turned to for this reason, and data have always been checked from more than one source, Google Earth among them.
Studies of land reclamation and artificial island areas has not been extensively calculated before and has been drawn up from other research work performed by the authors [7]. The most significant land reclamation expansions over the whole of the world’s coasts have been located using Google Earth, thanks to its area calculation and historical images tool. Historical cartography has been turned to when old aerial photography could not be accessed in order to assess how the coast line evolved. Other data not referring to records but to the situation of several infrastructure indicators (ship or cargo traffic, high speed rail) have been obtained from official pages that draw up annual reports, including the American Association of Port Authorities (AAPA), the International Association of Ports and Harbours (IAPH), Containerisation international, Union Internationale des Chemins de Fer (UIC), etc.
3. Results
Different studies were performed on the following types of infrastructures and public works with their features defined: container ports (TEUs) (Figure 2), skyscrapers (height) (Figure 3 and Figure 4), suspension bridges (main span length), cable stayed bridges (main span length) (Figure 5), bridges (structure height), bridges (deck height), road tunnels (length), railway tunnels (length), high speed railways (length), land reclamation (area) (Figure 6), and cargo ports (volume of cargo). Results have been embodied in maps for better understanding. Where in the world each type of infrastructure is being most built can be seen at a glance. The area of circles each represents the value of the study detail (length, area, height, etc.).
4. Discussion
The results of this study show how much strength Asian countries can exert in world infrastructure development. On many occasions, building large engineering landmarks does not respond to the people’s priority needs but enters into another power and appearance struggle.
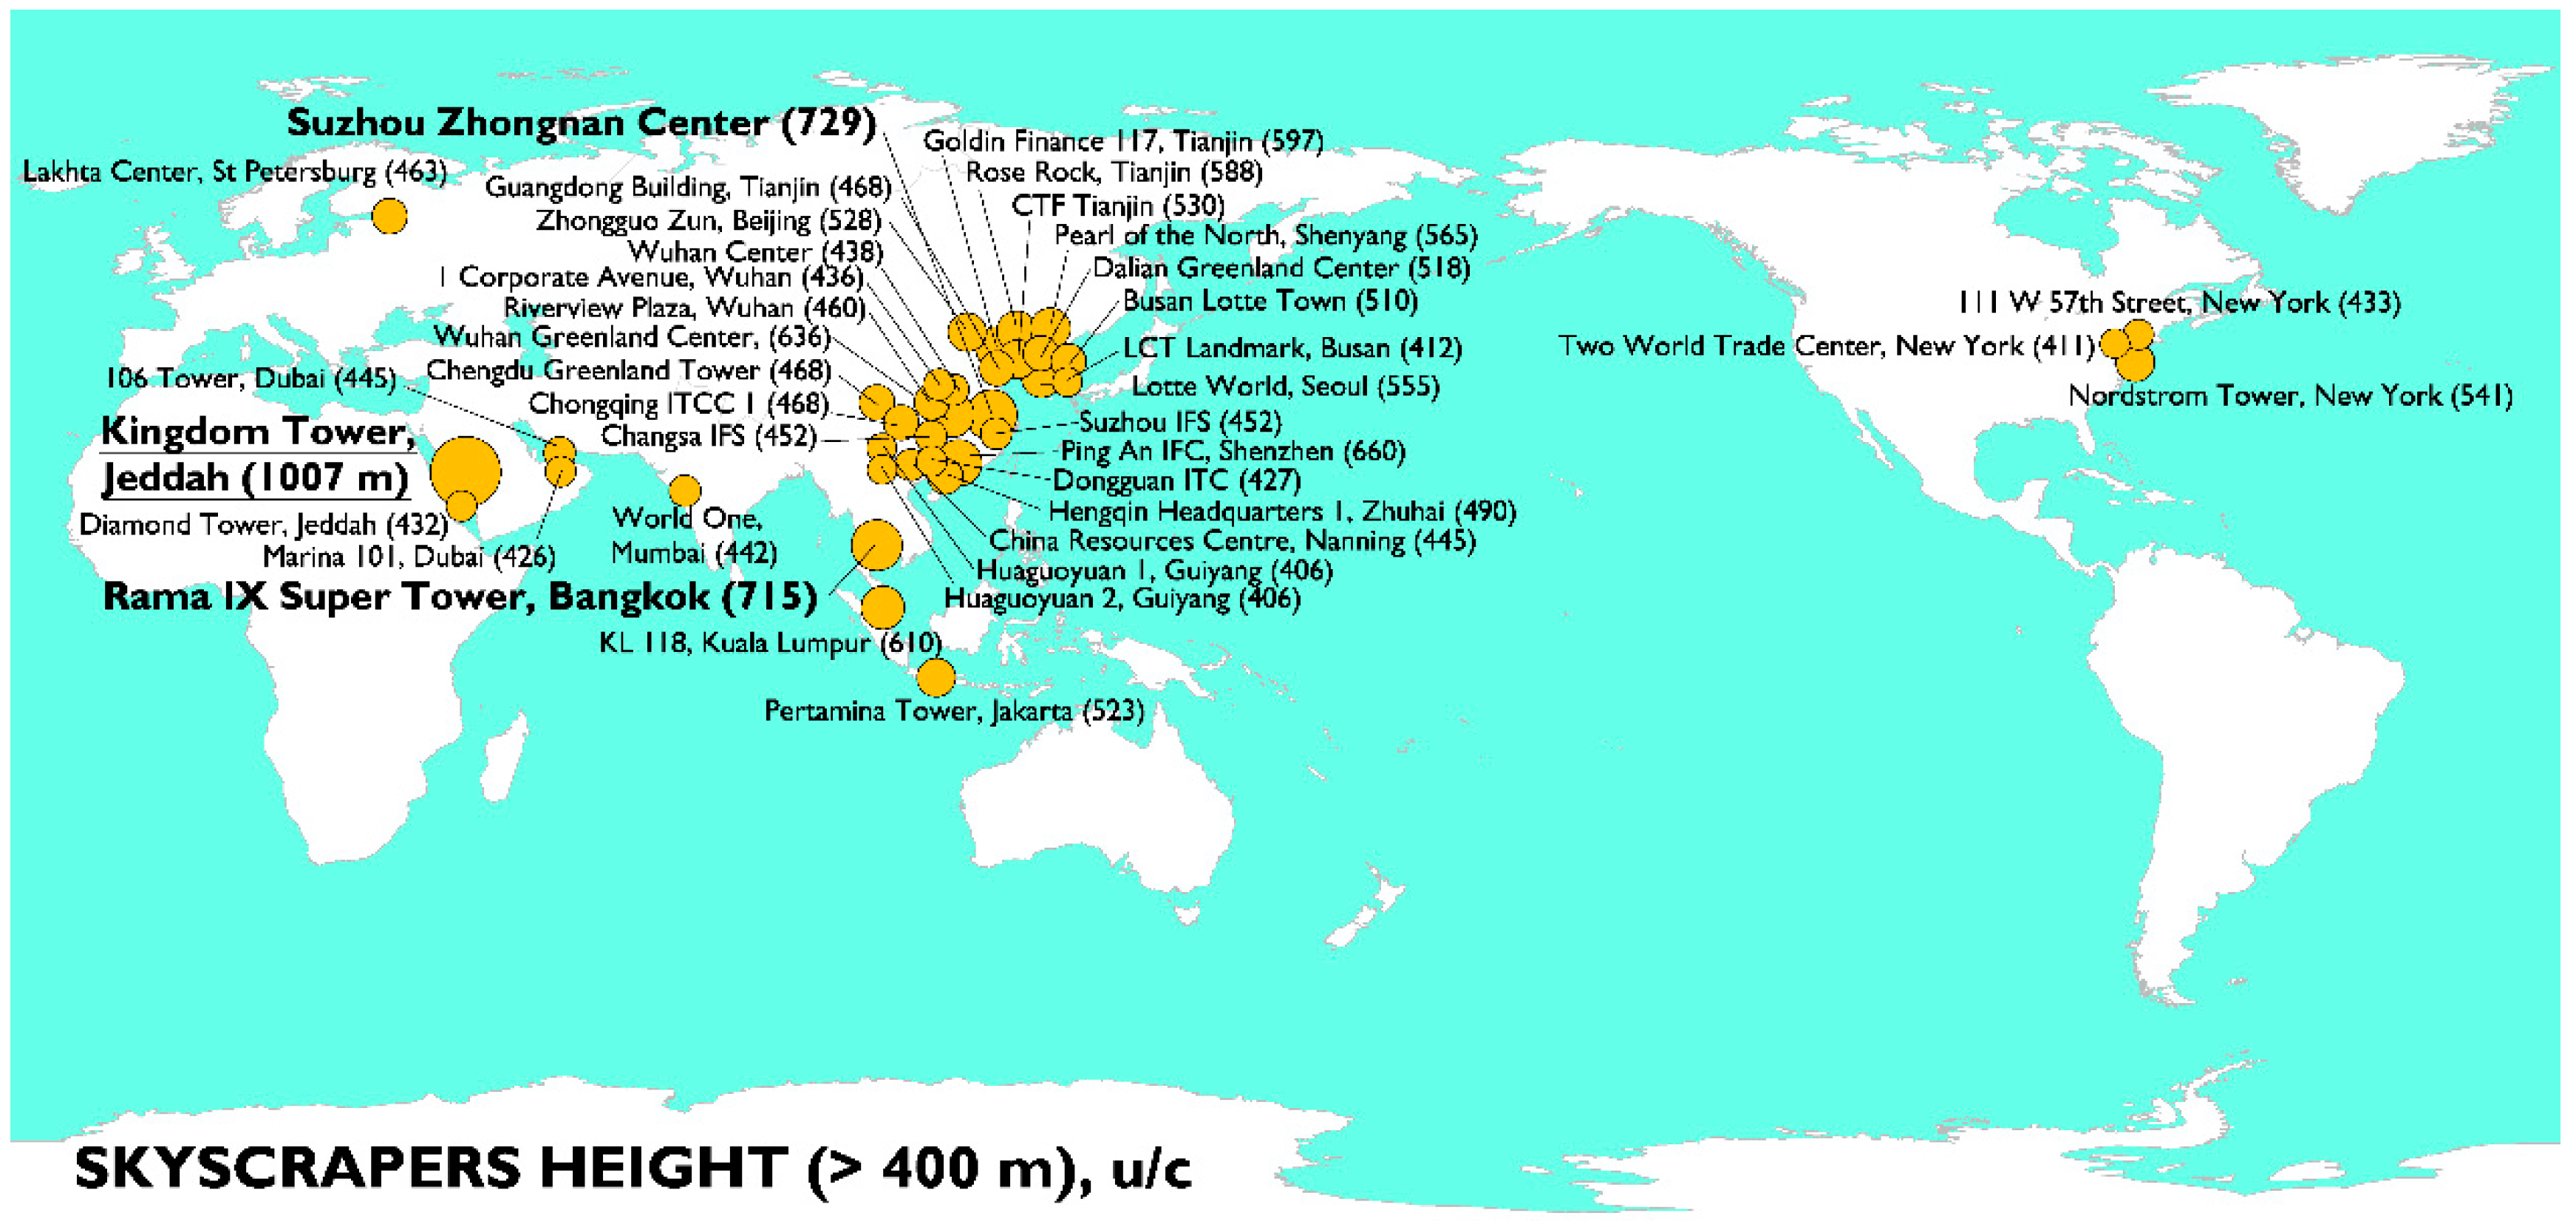
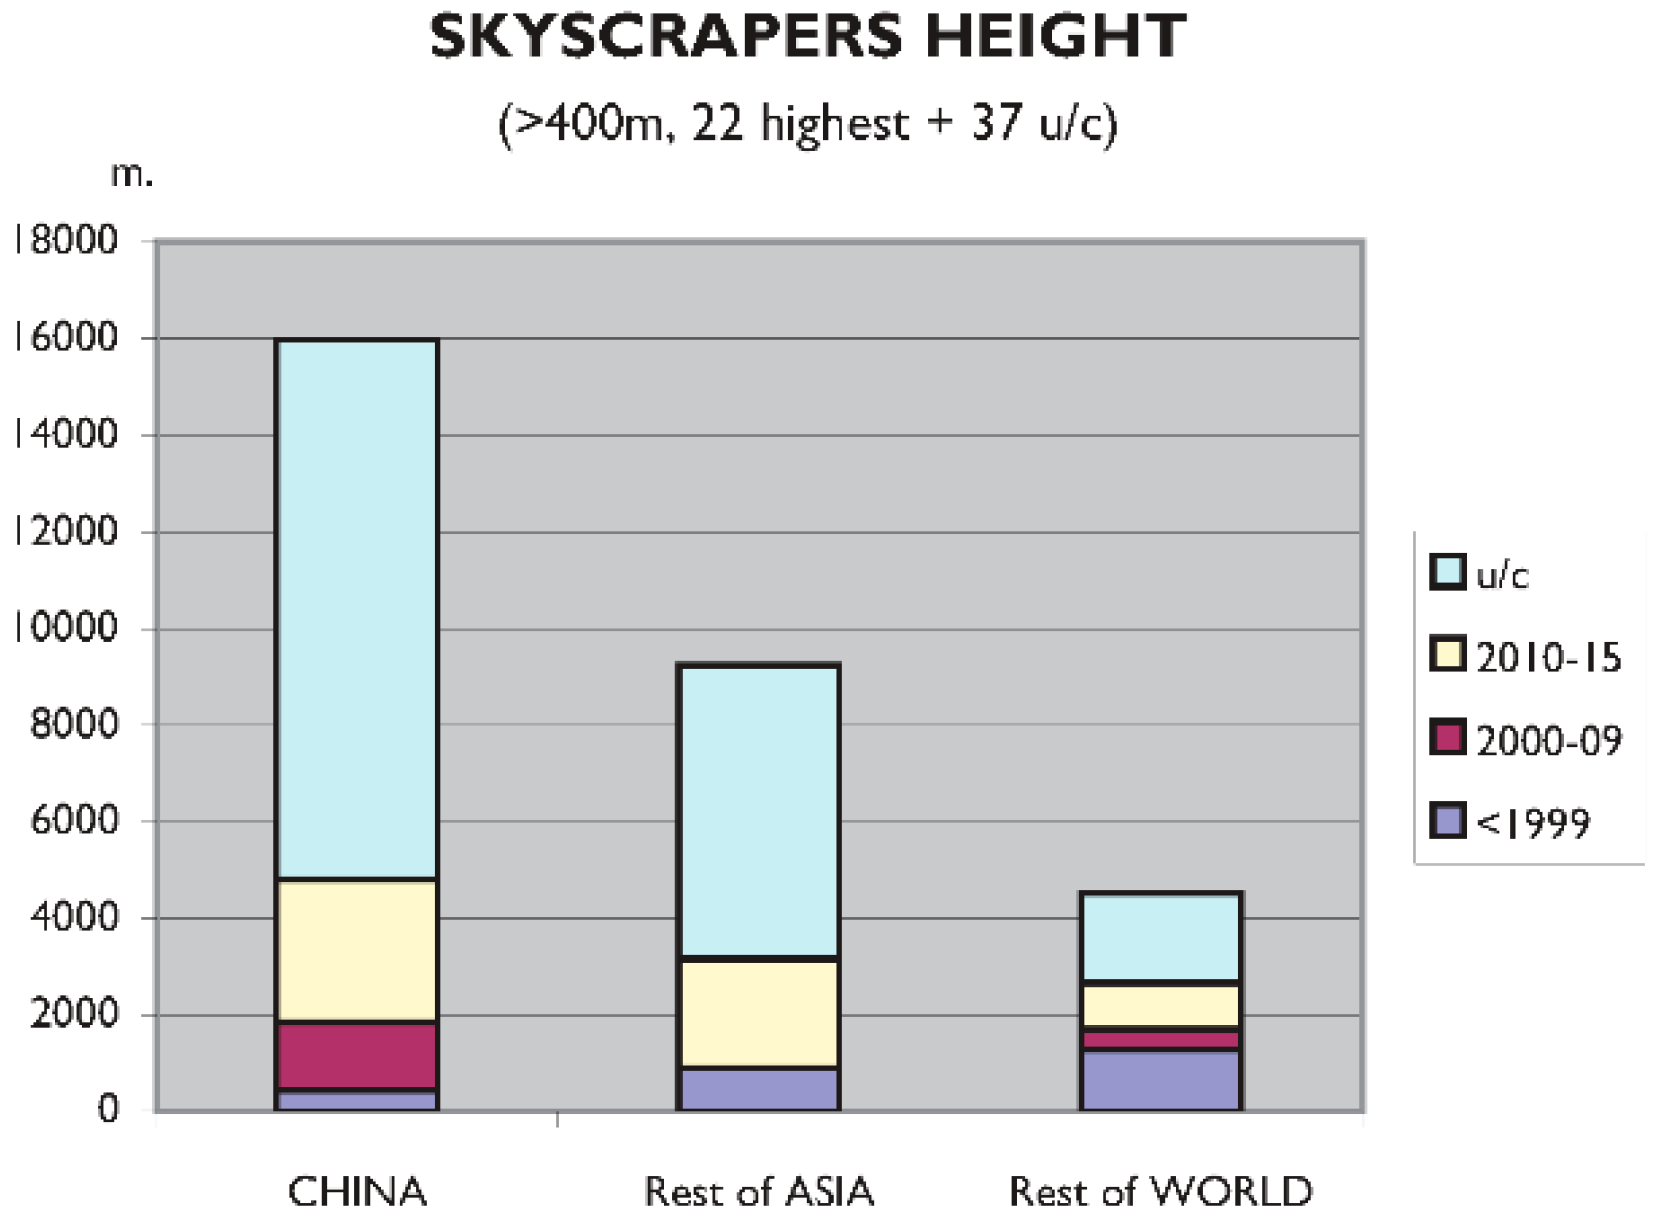
Today, super tall buildings have been emerging on unprecedented scales, especially in China and the Middle East (Figure 7). They are no longer an American building type [9]. In fact, the most active tall building development region has shifted in recent decades from the United States to Asian and Middle Eastern countries (China, Korea, United Arab Emirates, etc.), in conjunction with their rapid economic growth, oil wealth, and government-supported development [9]. Even though the world’s tallest building is located in Dubai (the 828 m tall Burj Dubai), that is not where brutal skyscraper development is occurring. At the present time, the sum of the heights of tall skyscrapers in China exceeds those of the rest of Asia and the rest of the world. Also in China, all big cities will soon have one or more skyscrapers of over 400 m in height, while prior to 2010, there were only six cities in the world with such kind of buildings (Taipei, Shanghai, Kuala Lumpur, Chicago, Hong Kong, and New York). At this very moment, there are buildings exceeding that figure either under construction or already built in 19 Chinese cities: Chengdu, Chongqing, Guiyang, Nanning, Guangzhou, Zhuhai, Hong Kong, Shenzhen, Dongguan, Changsa, Taipei, Wuhan, Suzhou, Nanjing, Shanghai, Tianjin, Beijing, Shenyang, and Dalian. When finished, China will have more than half of the skyscrapers over 400 m tall in the world. Apart from China, this happens in only 13 other cities in the world, and only three are not Asian (New York, Chicago, and St Petersburg).
China is the clear leader in the most known statistics regarding the length of suspension and cable stayed bridges, particularly the second (Figure 8). Large suspension bridges were built during the twentieth century, mainly in the USA, but in the twenty-first century, most have been built in China. Prior to the year 2000, there were 25 bridges with over 800 m span and more were located in the rest of the world than in Asia. In the first decade of the twenty-first century, seven were built just in China and one in the USA. However, in only the next five years, eight more were built in China, while only two were built outside of China. With its rapid economic development over the past decades, China has witnessed a significant development in the construction of all types of large-span bridges [10]. The largest suspension bridge spans are currently located in this Asian country, 43% of the total, despite the longest, with 1991 m, still being the Akashi Kaikyo in Japan.
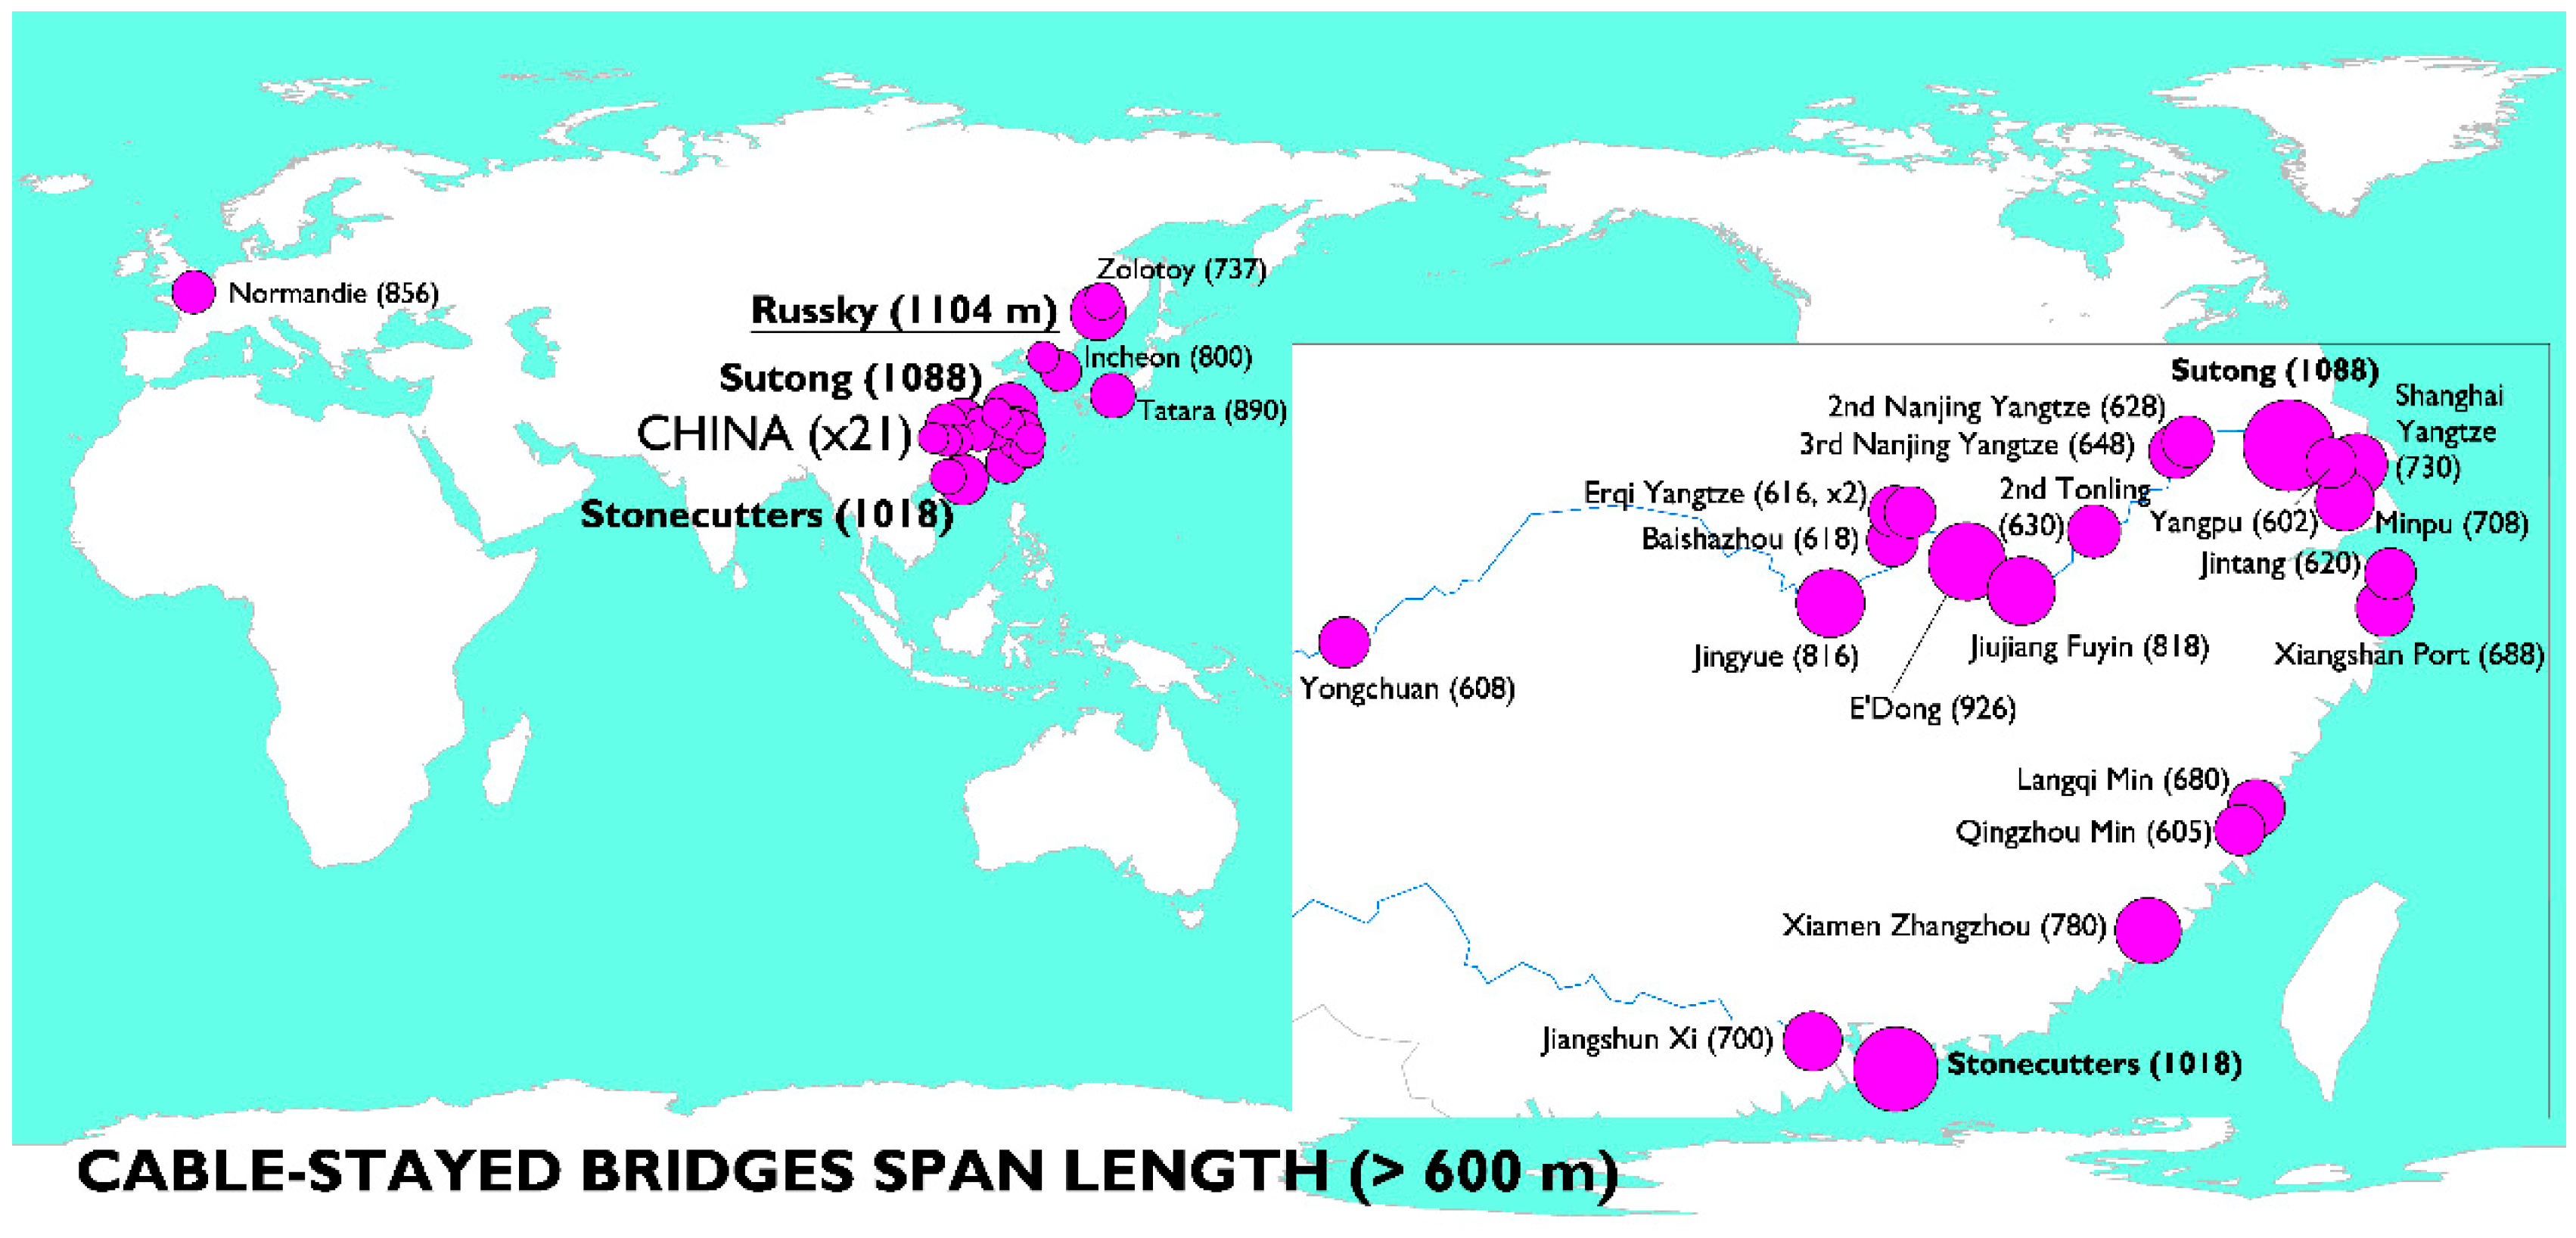
The difference between China and the rest of the world as to cable stayed bridges is much greater. Although, at the end of the twentieth century, the situation of long cable stayed bridges in the world (more than 500 m span) was very similar between China, the rest of Asia, and the rest of the world: 13 bridges were concluded in China in the first 10 years of the twenty-first century and a further 15 in the next five years. At this point in time, 64% of the longest cable stayed bridges are located in China, and only 13% are located outside of Asia. Many of these long bridges have a specific use, for example, crossing wide rivers to connect the road system in China. But others do not. This is the case of the largest cable stayed bridge in the world, with a 1104 m span, joining the Russian city of Vladivostok to the Isle of Russky with less than 5000 inhabitants. It was built for the APEC Summit on the island in 2012 and cost $1.1 bn. Russia can thus prove to other regional players in the Asian Pacific that it is still relevant as an industrial power to demonstrate its wealth and strength on the Pacific Rim [11].
Large, high-structured bridges are a further indicator of the technical development of engineering. China is by far the leader over the rest of the world in two aspects. The first relates to the structural height of bridge piers and the other to the height of the deck (Figure 9). The record for the first is held by the Millau Viaduct in France, with its 343 m pier [12]. However, apart from this, most bridges with more than a 200 m structure are located in China. They add up to over 8 km in height, half of them built between 2010 and 2015. The sum total in the rest of Asia is 1.5 km, and in the rest of the world, a little more than 2 km.
The second classification might not be deemed important, since the above ground level height of a bridge depends a lot on the ground’s orography. However, the large number of examples built in China over the last few years reflects how its roads and motorways have greatly developed so as to build such engineering constructions to reach across valleys and mountains. This is an indicator that may also be related to the lengths of tunnels, where China also leads. Twelve of the 14 highest bridges in the world are in China, all mainly in the provinces of Guizhou, Hunan, Hubei, and Chongqing in inland China. Recent expansion of highways in the high, mountainous region of western China has led to the widespread construction of large and high suspension bridges [13]. The Royal Gorge Bridge in the USA was the highest in the world for many decades, 291 m above the river Arkansas. The Siduhe Bridge in China currently heads the ranking: it was built in 2009 with 496 m above the river. The sum of the heights of Chinese bridges from amongst the highest 48 in the world exceeds the rest of the world by almost three times.
In road tunnels, China leads with 48% of length excavated in the world for tunnels of more than 8 km (Figure 10a). More than half these tunnels were built after 2010. Building long motorways in the centre of the country is obliging the construction of numerous very long tunnels [14]. No tunnel of such dimensions existed in this Asian country before 2000. The expansion of motorways means that all tunnels exceeding such a distance are twin bored. In the rest of the world, long tunnels are sometimes built with only a single tube. One example is the Laerdal tunnel in Norway, with 24.5 km, the longest in the world, together with the large Transalpine tunnels.
China is even further in the lead in railway tunnels compared to road tunnels (Figure 10b). However, the longest in this country is only ranked fourth worldwide. We also find long tunnels in Japan, such as the Seikan Tunnel, the longest in the world (in 2015). However, the difference lies in the long High Speed train tunnels in China, usually built with two tubes, whilst only one tube is the norm in Japan. In general, it should be pointed out that in 2009, China and the rest of Asia each had one quarter of over 16 km long tunnels, and the rest of the world had the remaining half, due to the transalpine tunnels. However, the change has been a major one. China has built 622 new km of long railway tunnels in the last five years, representing almost half the world’s total of long tunnels over all time. In this case, as with road tunnels, China had no tunnel of these characteristics before the year 2000. Most are for the new high-speed lines, some of which feature tunnels that are over half the length of the complete line. The average for tunnels and bridges is 74% over the whole system [15].
The development of high-speed railways (HSR) has also broken all records in China (Figure 11a). High-speed lines are defined as those built to take trains travelling at more than 250 km/h or upgraded to 200 km/h [16]. The first high-speed line in the world was the Shinkansen in Japan in 1964 whilst the first brought into service in China is less than 10 years old, dating from 2007 [17]. Despite its recent implementation, this development cannot be compared to any country in the world. Current infrastructure covers approximately 20,000 km with almost the same figure under construction, being the most heavily used in the world [17]. The country’s overall infrastructure exceeds the whole of the rest of the world’s, especially Japan and Europe. These last two began to develop their networks in the twentieth century, but have not developed as much and in such short a time as China.
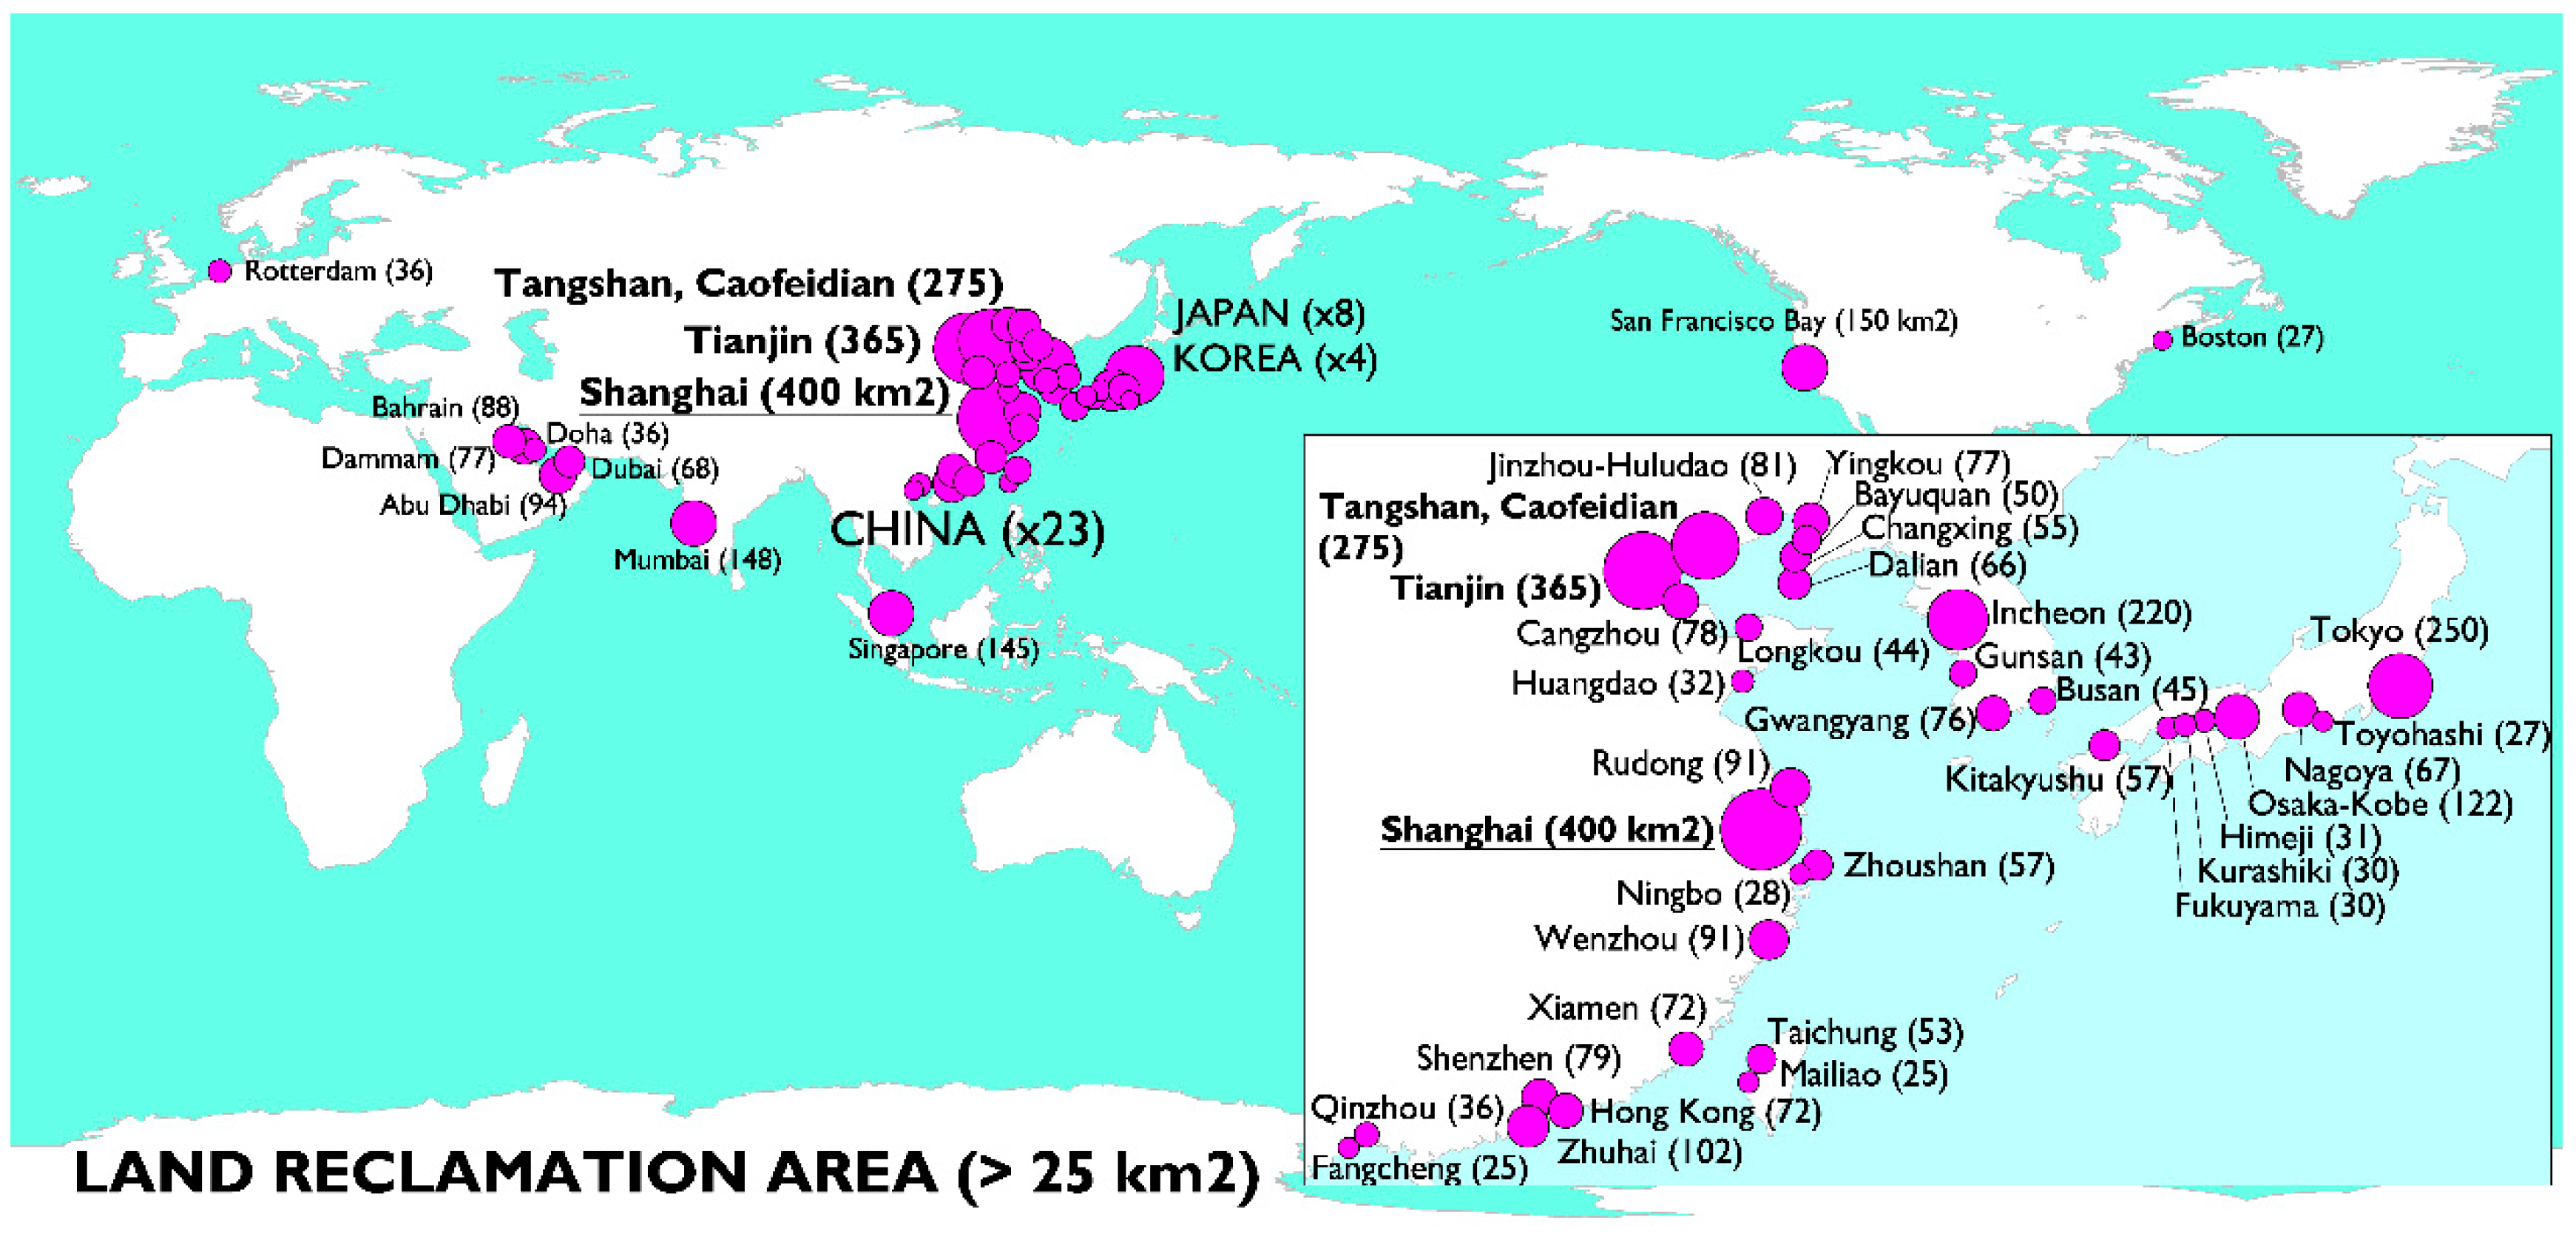
A further aspect where Asia is clearly the world leader and where China again stands out refers to the construction of reclaimed land and artificial islands (Figure 11b). Regarding only the largest reclaimed zones, with more than 25 km2, in China alone there is 55% of the world total, particularly the port of Shanghai and the Bohai Bay, while the rest of Asia has only 40% (Tokyo, Incheon, etc.), and the rest of the world only 5% (San Francisco, Rotterdam, Boston) [7]. This practice is, to a large extent, related with the requirements of ports to expand and generate new associated industries and coincides with container cargo volume statistics. This has caused a serious environmental problem on the Chinese coastline, especially because of the dredging, coastal erosion, and environmental pressure to which the coastline is subjected [18]. These data have been obtained by deep research in Google Earth, field study, maps, drawings, and historical imagery performed by our research group (Martín-Antón et al.) last year. This original material involves updated and impressive knowledge of land reclamation.
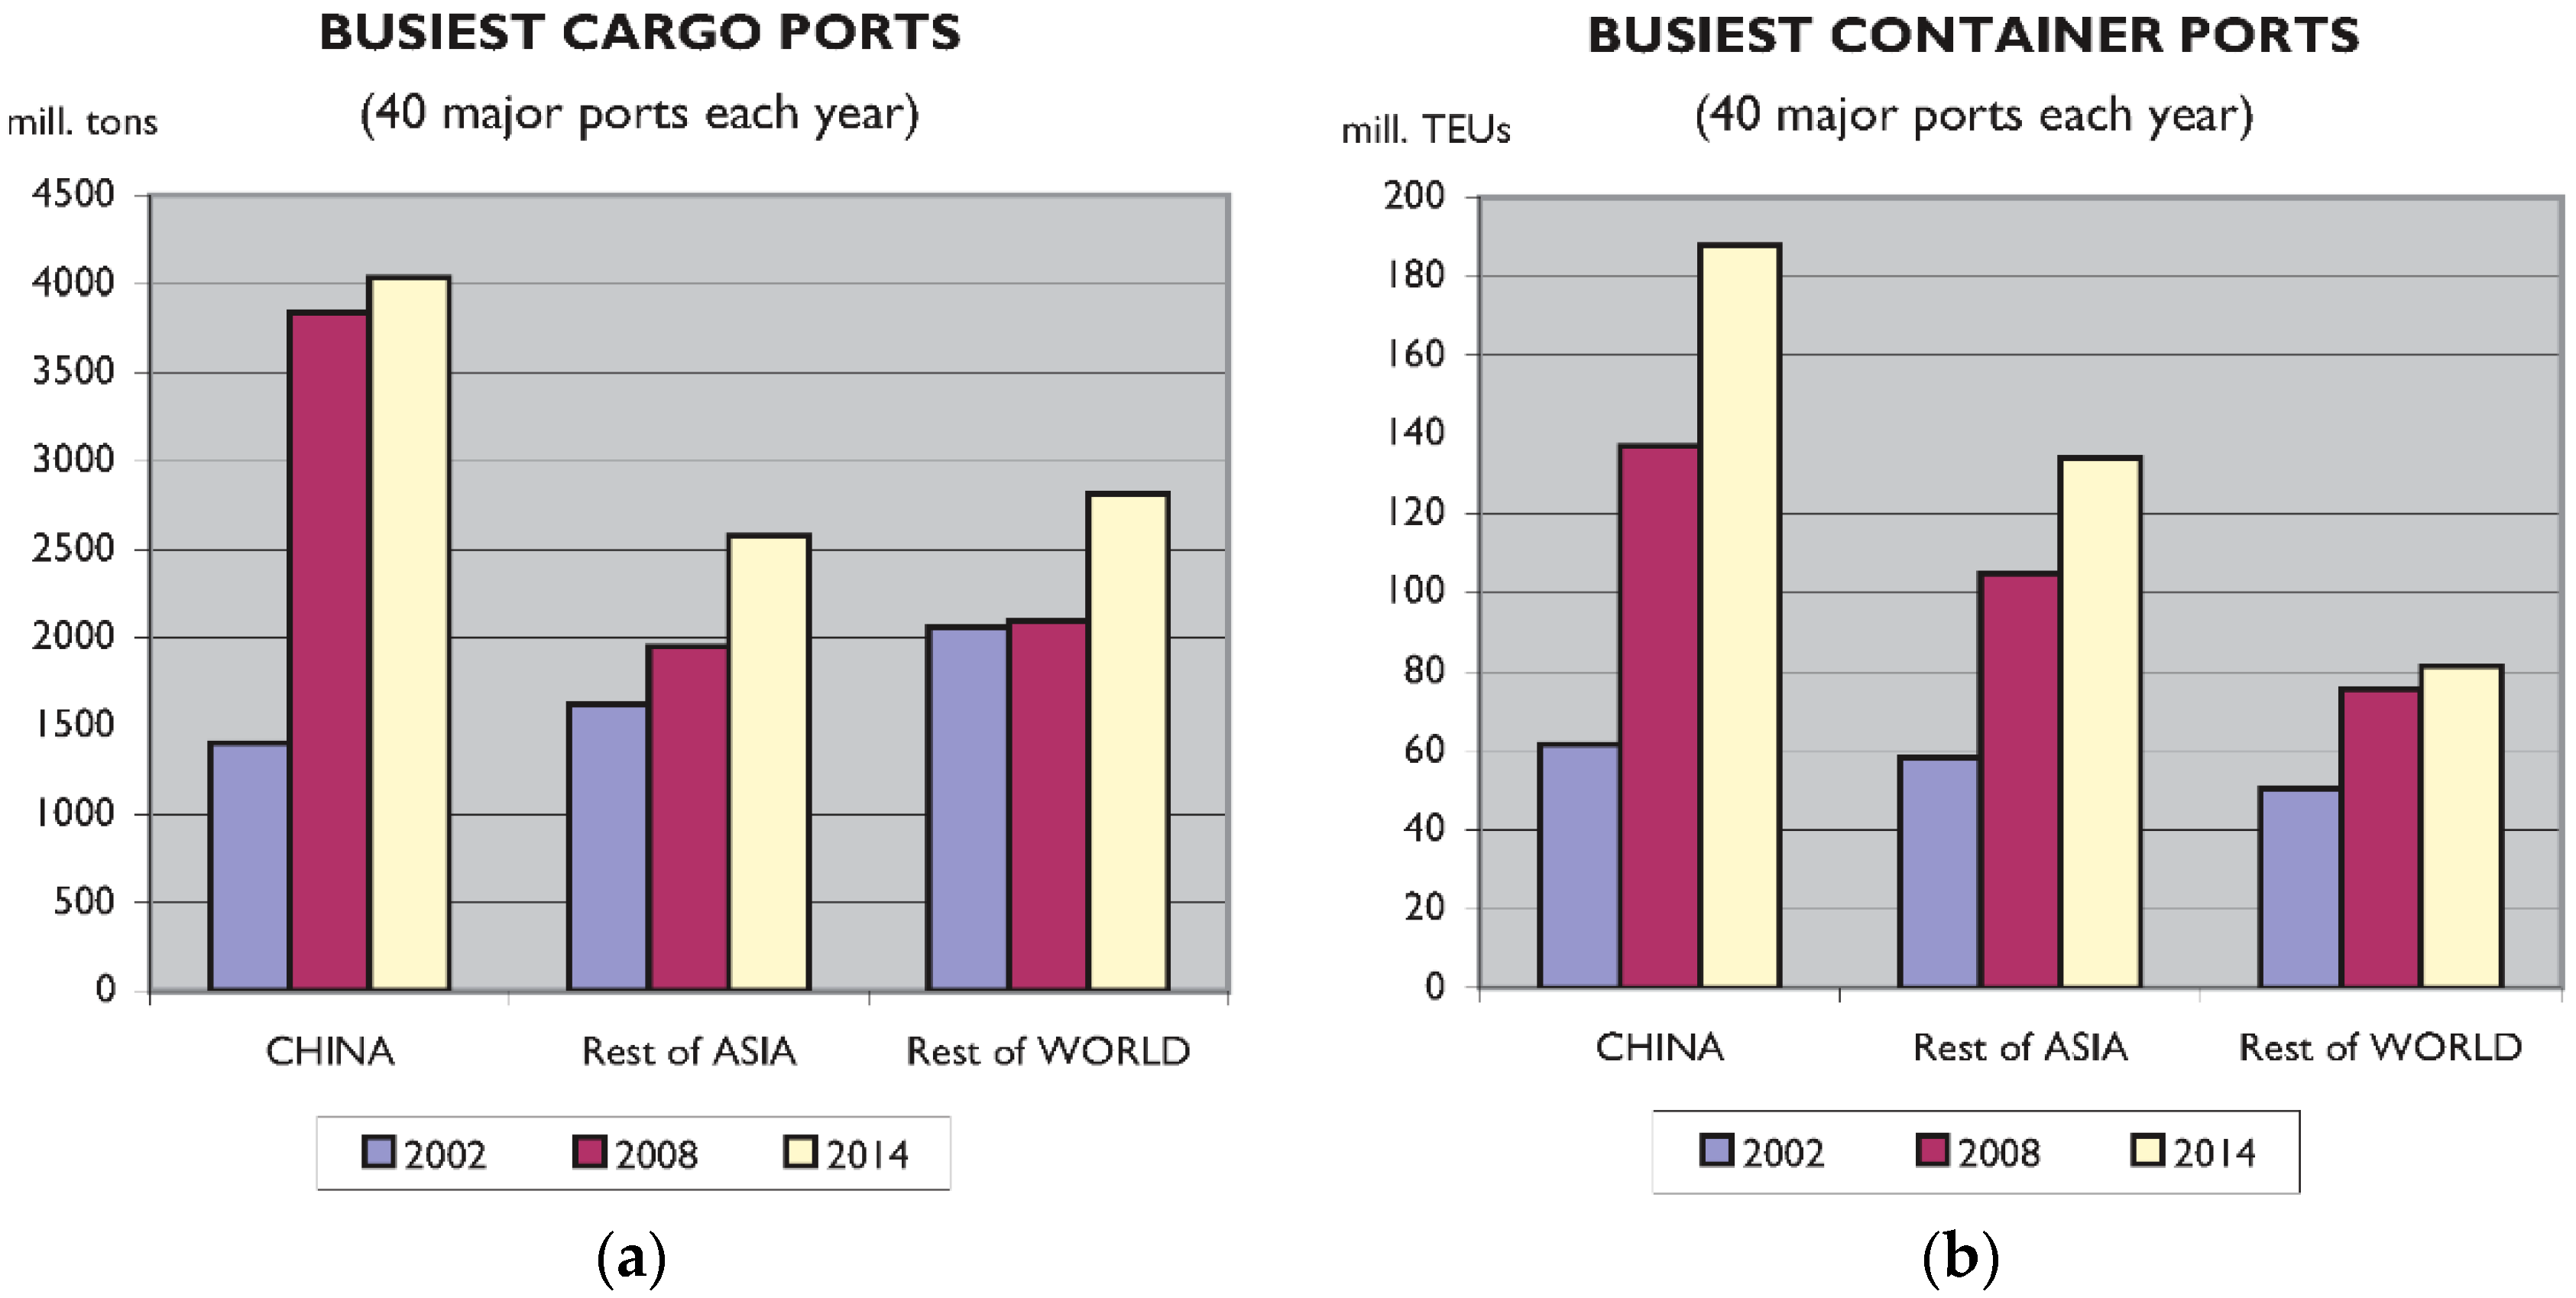
East Asia stands out in all aspects of civil engineering. Even with indicators not directly related to construction but to running infrastructures, this region takes the leading positions in container traffic and vessel cargoes (Figure 12). China’s data were seen to be worse than Asia’s and the rest of the world’s as to cargo volume statistics in 2002. However, in the following years, that volume almost tripled, while it hardly grew in the rest of the world. The twenty-first century has witnessed a drastic change in scale as far as those indicators are concerned. The case of containers gives the same result. The container shipping industry today faces an unforeseen gigantism. In the last 20 years, the demand for container transportation has continuously grown [19]. The level of traffic in the busiest ports 15 years ago was similar in the three areas, but in a scarce six years, it doubled in China, and in a further five years, tripled compared with 2002. The increase in the rest of Asia has seen proportional (but a little less), and much less in the rest of the world, with not much growth over these past few years. As observed in Figure 1, the port of New York handled most volume of cargo in the decade of the 1970s, but was overtaken in the 1980s by Rotterdam. Hong Kong came to occupy first place in 1990, and this position has not moved from Asia since then (Hong Kong, Singapore, Shanghai) [20].
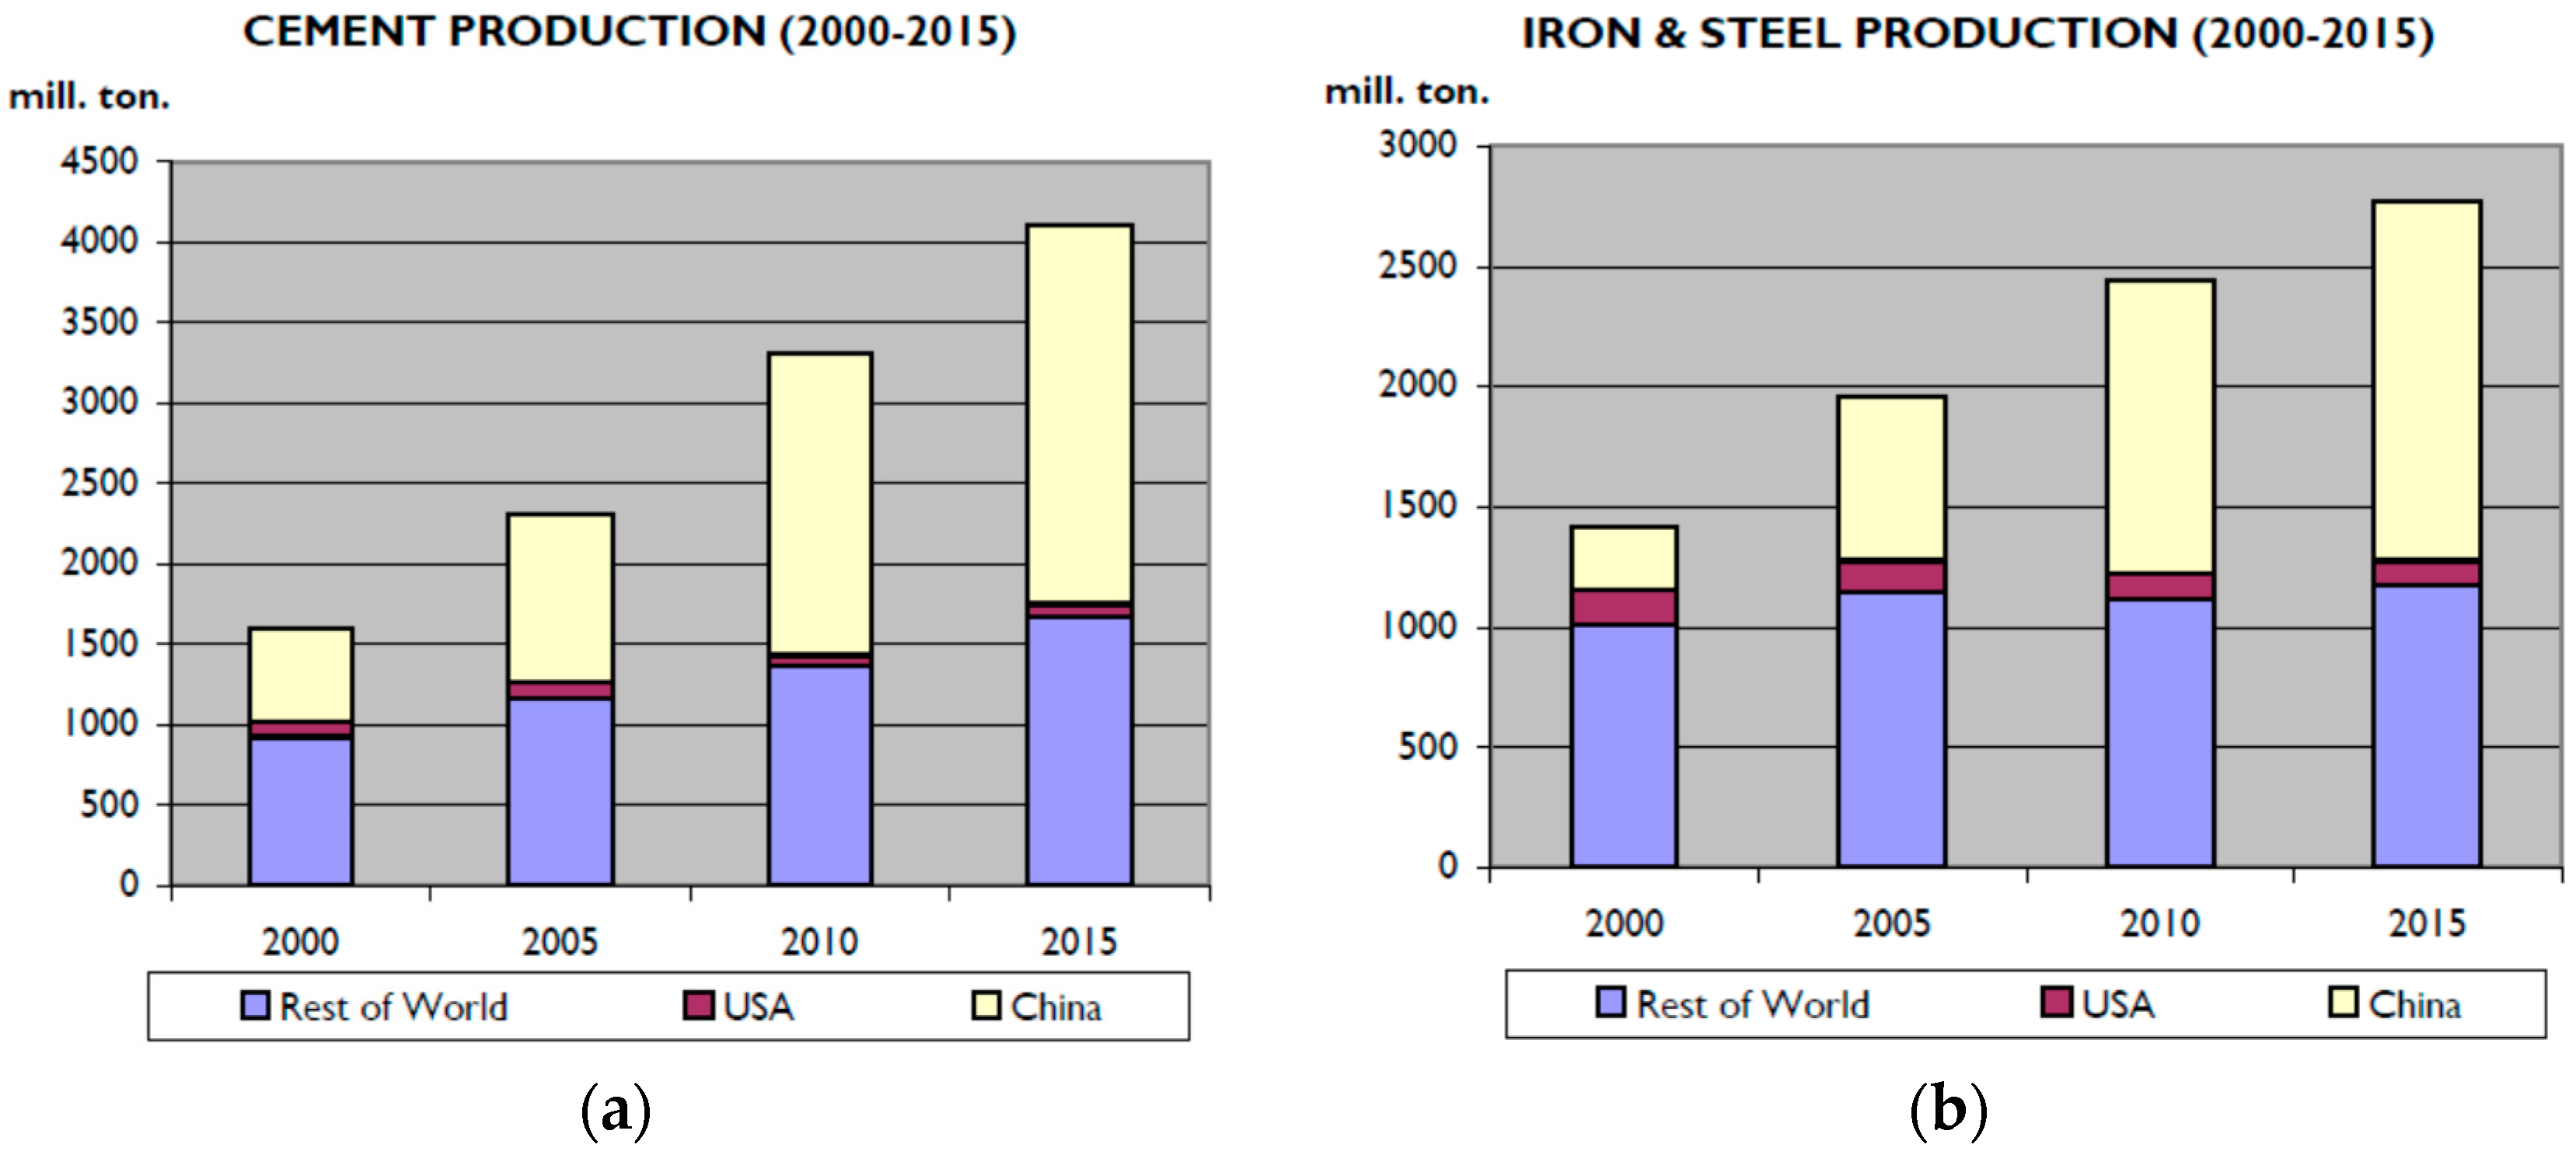
This study shows the trend of large works in Asia and more especially in China, but also reflects the real situation of the whole country in terms of constructions. In the last few years, China has undergone disproportionate development. According to World Bank data, CO2 emissions in China have increased by 200% since 2000, while only 45% in the world. This is a consequence of population growth, with an increase of 110 million people in China in the last 15 years, and its subsequent development, in addition to the industrial sector, construction, and transportation. For example, China used more cement (6.6 gigatons) in three years (2011–2013) than the USA used in the entire twentieth century (4.5 gigatons) [21]. This translates into a very high environmental impact, placing the planet’s sustainability at risk. The industry emits nearly 900 kg of CO2 for every 1000 kg of cement produced [22], and studies made in China show that, for the entire iron and steel production process, the base-case CO2 emission intensity is nearly 2150 kg per tonne of crude steel [23]. In China, construction, the most polluting sector, is alone responsible for 28% of the country’s CO2 emissions [24].
Figure 13 shows two representative indicators of what is reflected in the research work. These are the production data for cement, steel, and iron. Cement production has grown slightly worldwide and has decreased in the USA, a country where construction played a key role during much of the twentieth century. In China, it has grown exponentially, in 2015 reaching 57% of world production. The USA alone produces 30 times less than China. In steel and iron, China also leads world production with 54% of the total. Natural resources are limited, and things do not seem to be changing.
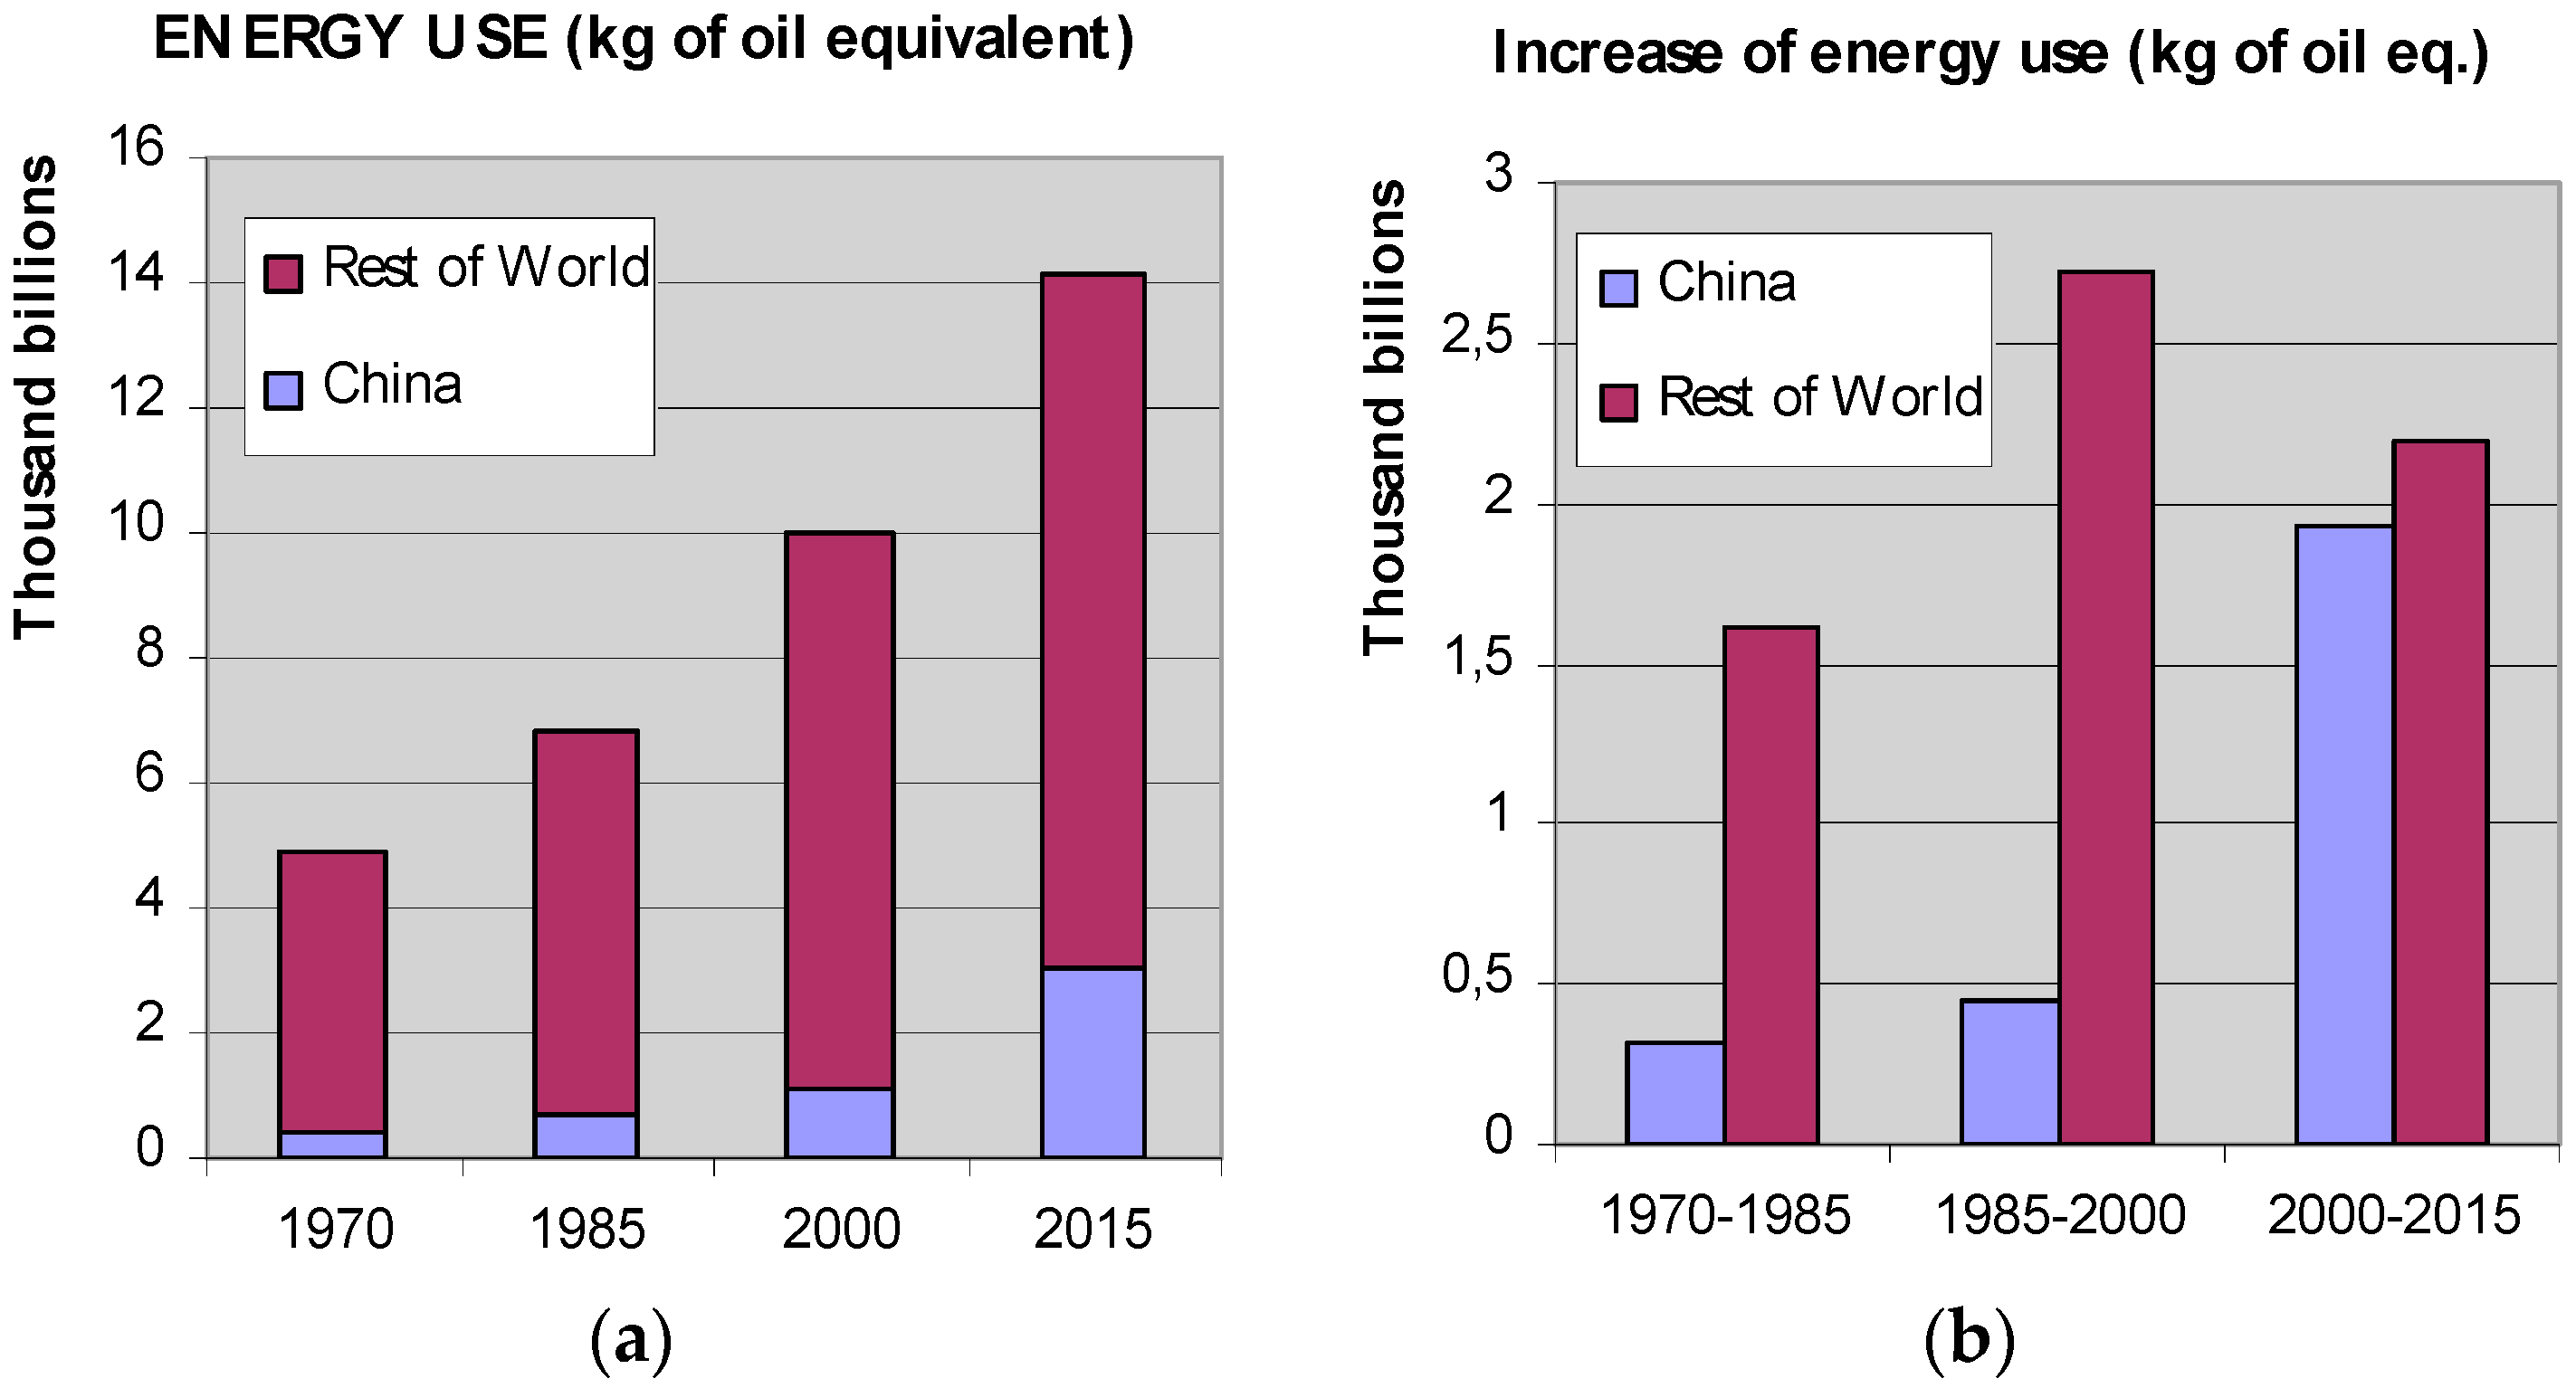
All these data are understood with the general situation in China. Its GDP growth in 2015 was 6.4%, versus 1.9% in the European Union or the USA. In 2009, when the economic crisis began, while growth in the USA and Europe was negative (around −4%), in China, it was 8.8% [29], which demonstrates the strength of this country to grow in adverse times. Its population has reached almost 1.4 billion people, representing 20% of the world total in the last few years, with encompassing only 7% of the Earth’s terrestrial surface (Figure 14a). Besides this population growth, society in China pays no attention to the environment, increasingly using fossil fuels (growing from 60% in 1970 to 88% in 2015), while the world average has been declining for decades (from 95% to 81%). The most alarming data is the use of total energy in the world, but especially in China, and the drastic upward evolution that seems to be endless. From 2000 to 2015, the period of time used in this research of public works, the increase in energy use in equivalent kg of oil is almost the same as the increase in energy use in the rest of the world: 1932 billion kg in China versus 2187 billion kg in the rest of the world (Figure 15). The dramatic conclusion is that China, representing 20% of the world’s population, has accounted for half of the increase in the world’s energy consumption in recent years.
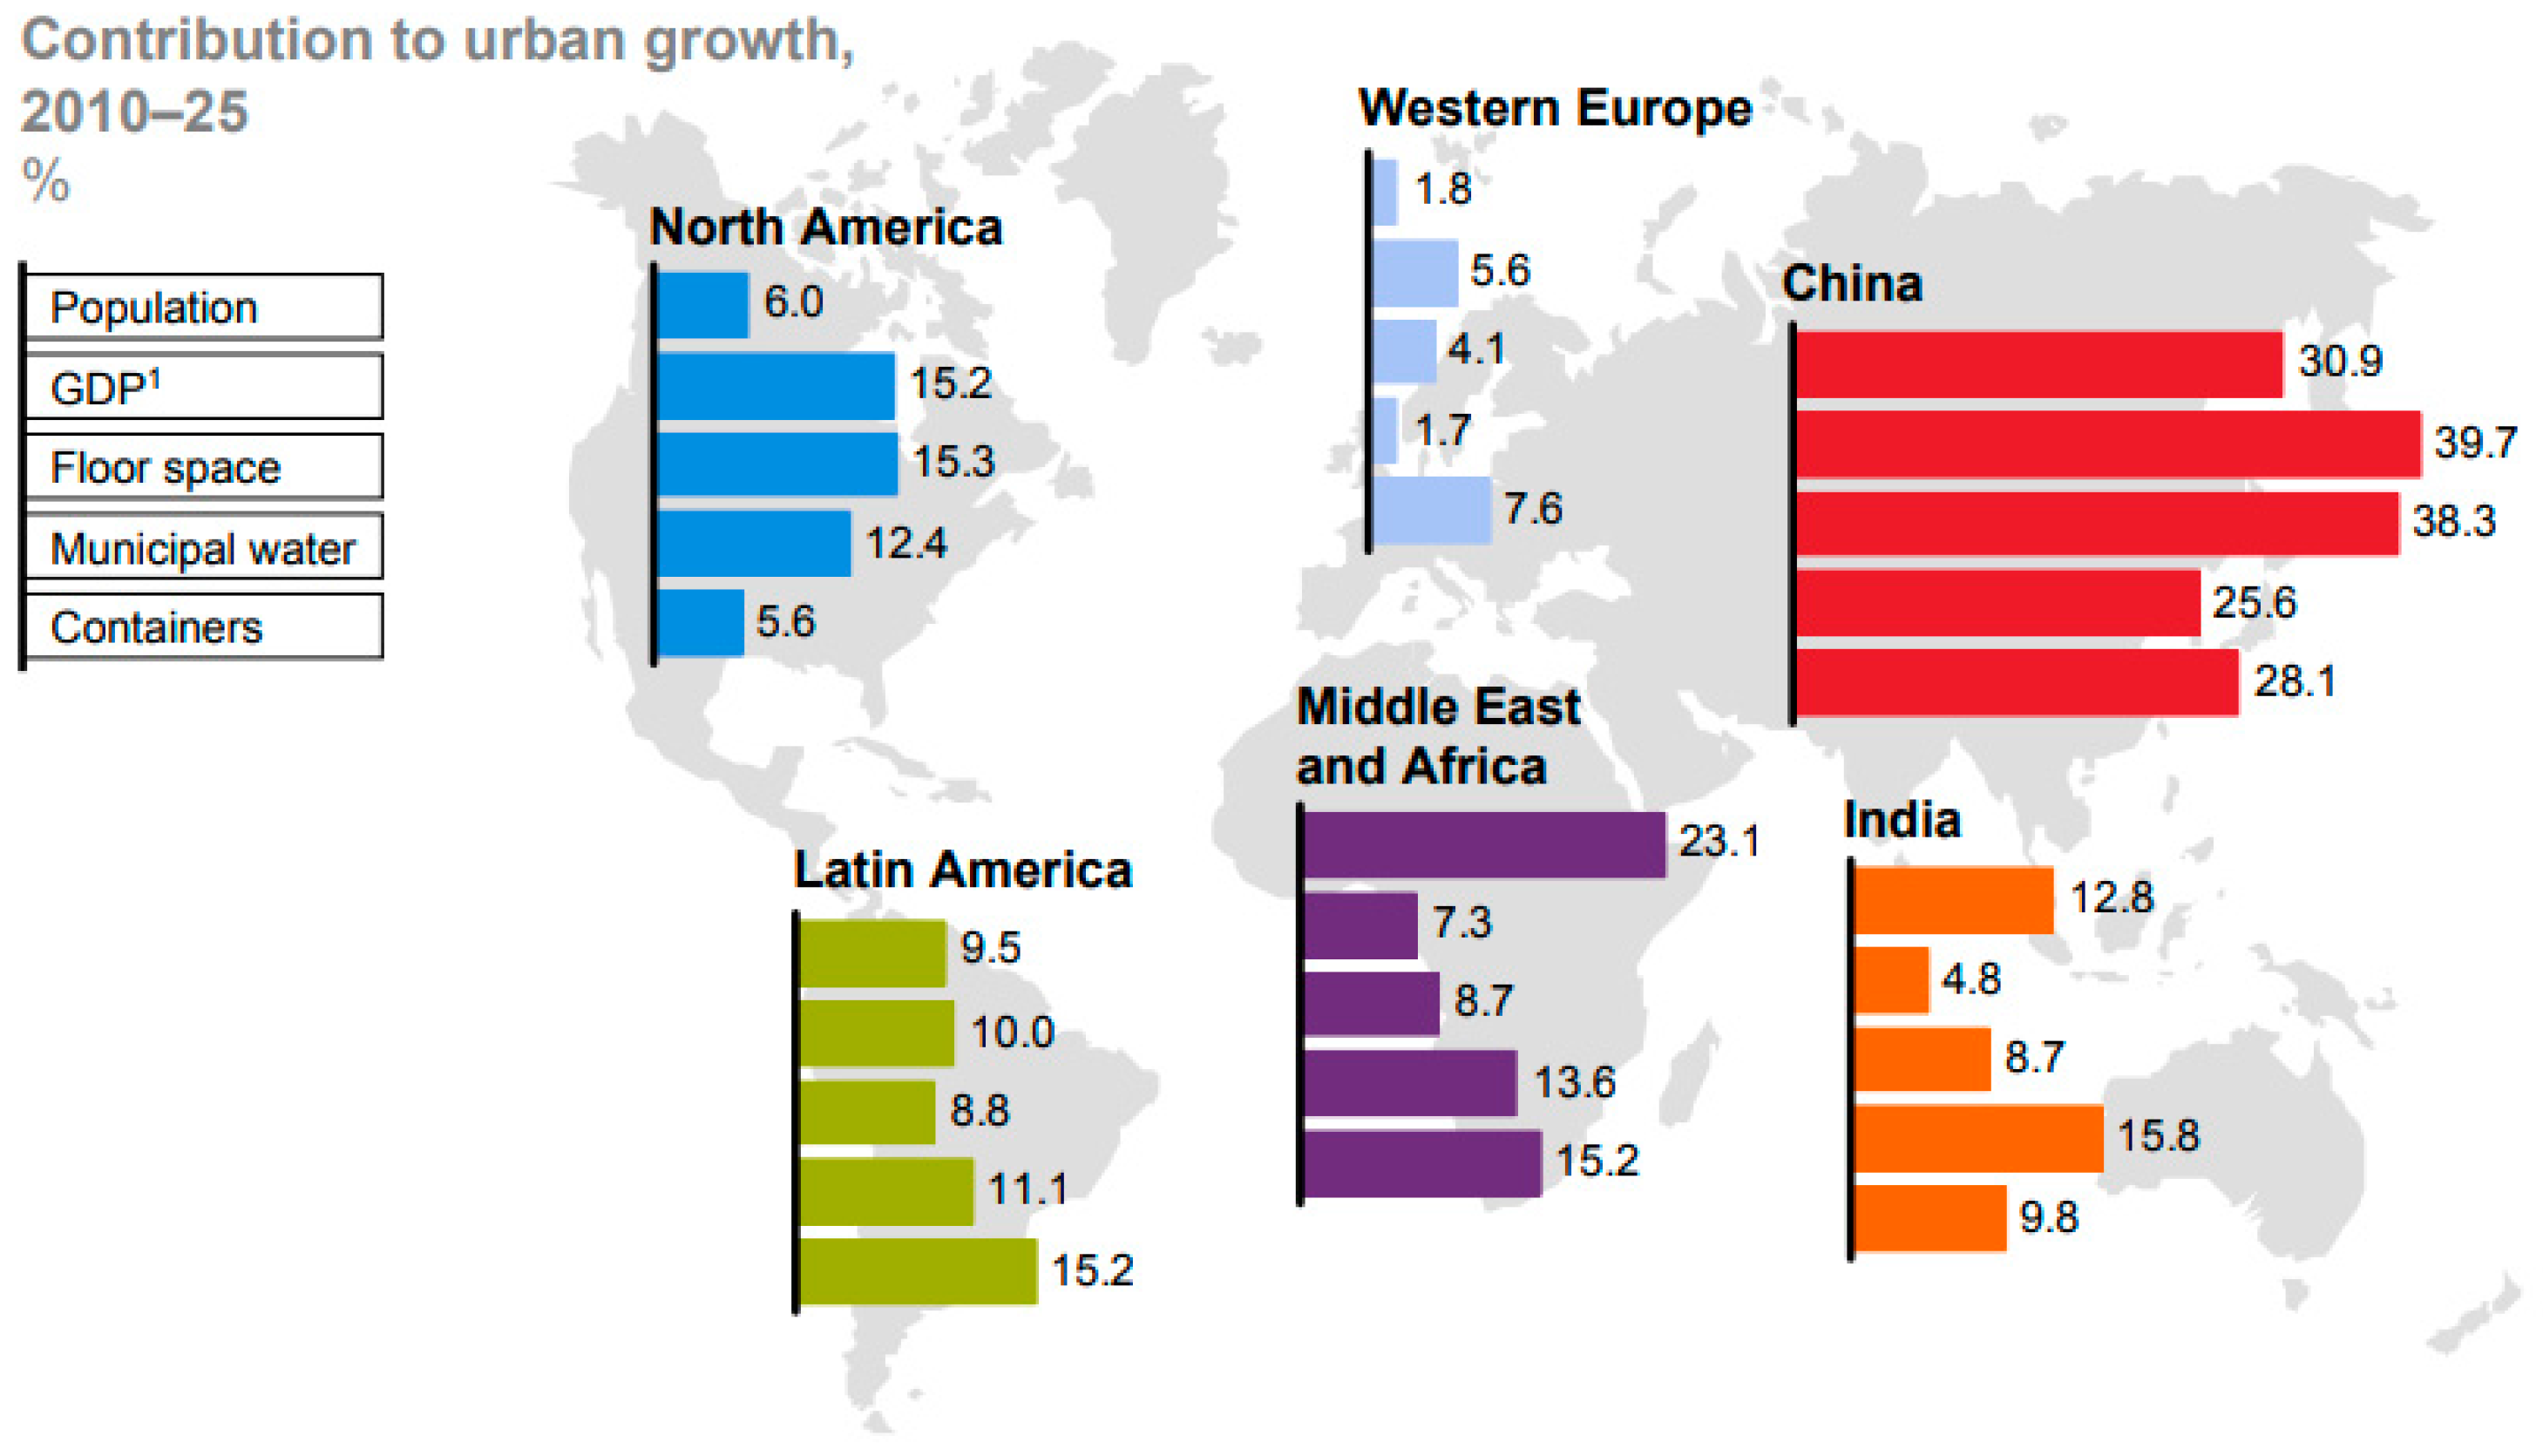
Moreover, in terms of urban growth (Figure 16), China heads up all the key categories. This country is likely to have a 25 percent share of global municipal water demand growth and an almost 40 percent share of growth in global demand for urban building floor space by 2025. In port capacity for containers, its share is nearly 30 percent [6]. All these indicators predict a rampant growth in all aspects in China, which is incompatible with sustainable development.
5. Conclusions
The purpose of this research paper is to underline how the construction of large civil works and structures (bridges, tunnels, skyscrapers, land reclamation, etc.) represents a great challenge to engineering and construction. This is a very important indicator of the economic and technical capacity of a country to develop infrastructure in the future. The authors recognize that, in general, larger countries tend to have more networks since they often have more population with more and increasing requirements. This construction and urbanization growth is often performed without taking the environment into consideration, which represents a great risk to the planet’s sustainability.
The world is undoubtedly in an age of enormous development in countries such as China, which up to a few decades ago was very far behind the large industrialised countries such as the United States, Japan, or certain European countries. The speed at which its economy took off is quite dizzying, and such a high rate of development just cannot be sustained. China has the highest and longest bridges in the world, the longest tunnels, the most extensive area of land reclaimed from the sea, and the highest skyscrapers are being built. It also controls most of the world’s goods traffic, and the difference with the rest of the world is growing.
The case of Asia in general, and China in particular, is the paradigm of uncontrolled development, as demonstrated in this research article. This development is exponential, and what was achieved in the first decade of this century has been matched and surpassed in the following five years alone. What will happen in 2020 or 2025? Will the same happen in another part of the world? The question we must ask ourselves is how long this growth rate can endure. In a few years’ time, we shall see whether this gigantism in infrastructures and disproportionate development in all aspects can be economically, socially, and environmentally sustained.
The characteristics of development lead to the needs of the present generation to compromise those of future generations. This reflects on the concept of sustainability and environmental and economic aspects. In public works, service to society must predominate while ensuring that the mistake of conquering nature, exploiting it, and demonstrating power to other countries is not repeated. This research work should be a reflection on the construction and presence of the human being in the territory.
Acknowledgments
The authors express their gratitude to the “Fundación Agustín de Betancourt” for all the support given in the last years.
Author Contributions
Vicente Negro had the main idea of the article and provided the reflections. Mario Martín-Antón wrote most of the research paper. José María del Campo helped with the research. José-Santos López-Gutiérrez and M. Dolores Esteban made the maps and the graphics.
Conflicts of Interest
The authors declare no conflict of interest.
References
- Smithson, A.; Smithson, P. The New Brutalism, Alison and Peter Smithson answer the criticisms on the opposite page. Archit. Des. 1957, 27, 113. [Google Scholar]
- Kim, Y.H. Financing infrastructure development: Asian developing countries need to tap bond markets more rigorously. In Economics and Research Department; Series No. 34; Asian Development Bank (ADB): Mandaluyong, Philippines, 2005; ISSN 1655-5260. [Google Scholar]
- Davis, A.H. Infrastructure Finance: Trends and Techniques; Euromoney: London, UK, 2008; ISBN 1843742829. [Google Scholar]
- Asian Development Bank (ADB); World Bank Institute (WBI). More Public-Private Partnerships Needed to Meet Demand for Infrastructure; ADB News Release: Mandaluyong, Philippines, 2010. [Google Scholar]
- Lam, P.T.I.; Chiang, Y.H.; Chan, S.H. Critical success factors for bond financing of construction projects in Asia. ASCE J. Manag. Eng. 2011, 27, 190–199. [Google Scholar] [CrossRef]
- McKinsey Global Institute. Urban World: Cities and the Rise of the Consuming Class; McKinsey Global Institute: New York, NY, USA, 2012. [Google Scholar]
- Martín-Antón, M.; Negro, V.; del Campo, J.M.; López-Gutiérrez, J.S.; Esteban, M.D. Review of coastal Land Reclamation situation in the World. J. Coast. Res. 2016, 75, 667–671. [Google Scholar] [CrossRef]
- Song, D.; Panayides, P. (Eds.) Maritime Logistics: A Guide to Contemporary Shipping and Port Management; Kogan Page Publishers: London, UK, 2015; ISBN 0749472693. [Google Scholar]
- Moon, K.S. Supertall Asia/Middle East: Technological Responses and Contextual Impacts. Buildings 2015, 5, 814–833. [Google Scholar] [CrossRef]
- Feng, M. Modern bridges in China. Struct. Infrastruct. Eng. 2014, 10, 429–442. [Google Scholar] [CrossRef]
- Zepp-LaRouche, H.O.; Billington, M.; Maitra, R.; Small, D.; Director, B.; Ross, J.; Gallagher, P.; Askary, H.; Douglas, R.; Deniston, B. The New Silk Road Becomes the World Land-Bridge; EIR Special Report; Executive Intelligence Review: Leesburg, VA, USA, 2014; ISBN 0943235243. [Google Scholar]
- Solway, A. Buildings and Structures. Science and Technology; Raintree: Oxford, UK, 2012; ISBN 1406228486. [Google Scholar]
- Zhang, Q.; Li, Y.; Yu, M.; Hu, J. Study of the rock foundation stability of the Aizhai suspension bridge over a deep canyon area in China. Eng. Geol. 2015, 198, 65–77. [Google Scholar] [CrossRef]
- Zhou, Q.Y.; Xue, Y.D. Discussion on Several Problems of Construction Risk Assessment of Highway Tunnels. J. China Three Gorges Univ. (Nat. Sci.) 2014, 4, 87–90. (In Chinese) [Google Scholar]
- Chen, Z.; Haynes, K.E. Chinese Railways in the Era of High-Speed; Emerald Group Publishing: Bingley, UK, 2015; ISBN 1784419850. [Google Scholar]
- European Commission (EC). Council Directive 96/48/EC of 23 July 1996 on the interoperability of the trans-European high-speed rail system. Off. J. L 1996, 235, 0006–0024. [Google Scholar]
- Divall, C. From Rail to Road and Back Again? A Century of Transport Competition and Interdependency; Routledge: Abingdon, UK, 2016; ISBN 131713186X. [Google Scholar]
- Gao, G.D.; Wang, X.H.; Bao, X.W. Land reclamation and its impact on tidal dynamics in Jiaozhou Bay, Qingdao, China. Estuar. Coast. Shelf Sci. 2014, 151, 285–294. [Google Scholar] [CrossRef]
- Bostina, A.; Bostina, A.L.; Acomi, N.; Acomi, O.C. Sea trails of large container ships. Adv. Mater. Res. 2014, 1036, 952–956. [Google Scholar] [CrossRef]
- Alderton, P. Port Management and Operations; Informa Law: London, UK, 2008; ISBN 9781843117506. [Google Scholar]
- Smil, V. Making the Modern World: Materials and Dematerialization; John Wiley & Sons: Chichester, UK, 2013; ISBN 978-1119942535. [Google Scholar]
- Mahasenan, N.; Smith, S.; Humphreys, K.; Kaya, Y. The Cement Industry and Global Climate Change: Current and Potential Future Cement Industry CO2 Emissions. In Greenhouse Gas Control Technologies—6th International Conference; Pergamon: Oxford, UK, 2003; Volume 2, pp. 995–1000. [Google Scholar]
- Hasanbeigi, A.; Arens, M.; Cardenas, J.C.R.; Price, L.; Triolo, R. Comparison of carbon dioxide emissions intensity of steel production in China, Germany, Mexico, and the United States. Resour. Conserv. Recycl. 2016, 113, 127–139. [Google Scholar] [CrossRef]
- Zheng, H.; Fang, Q.; Wang, C.; Wang, H.; Ren, R. China’s Carbon Footprint Based on Input-Output Table Series: 1992–2020. Sustainability 2017, 9, 387. [Google Scholar] [CrossRef]
- U.S. Geological Survey (USGS). Mineral Commodity Summaries 2002; U.S. Geological Survey: Reston, VA, USA, 2002.
- U.S. Geological Survey (USGS). Mineral Commodity Summaries 2007; U.S. Geological Survey: Reston, VA, USA, 2007.
- U.S. Geological Survey (USGS). Mineral Commodity Summaries 2012; U.S. Geological Survey: Reston, VA, USA, 2012; ISBN 978-1-4113-3349-9.
- U.S. Geological Survey (USGS). Mineral Commodity Summaries 2017; U.S. Geological Survey: Reston, VA, USA, 2017.
- World Bank Data. Available online: http://data.worldbank.org/indicator (accessed on 24 July 2017).
Figure 1.
Change in the centre of gravity of the World’s Economic Development. This is calculated by weighting locations by GDP in three dimensions and projected to the nearest point on the Earth’s surface. Source: McKinsey Global Institute analysis using data from Angus Maddison; University of Groningen [6].

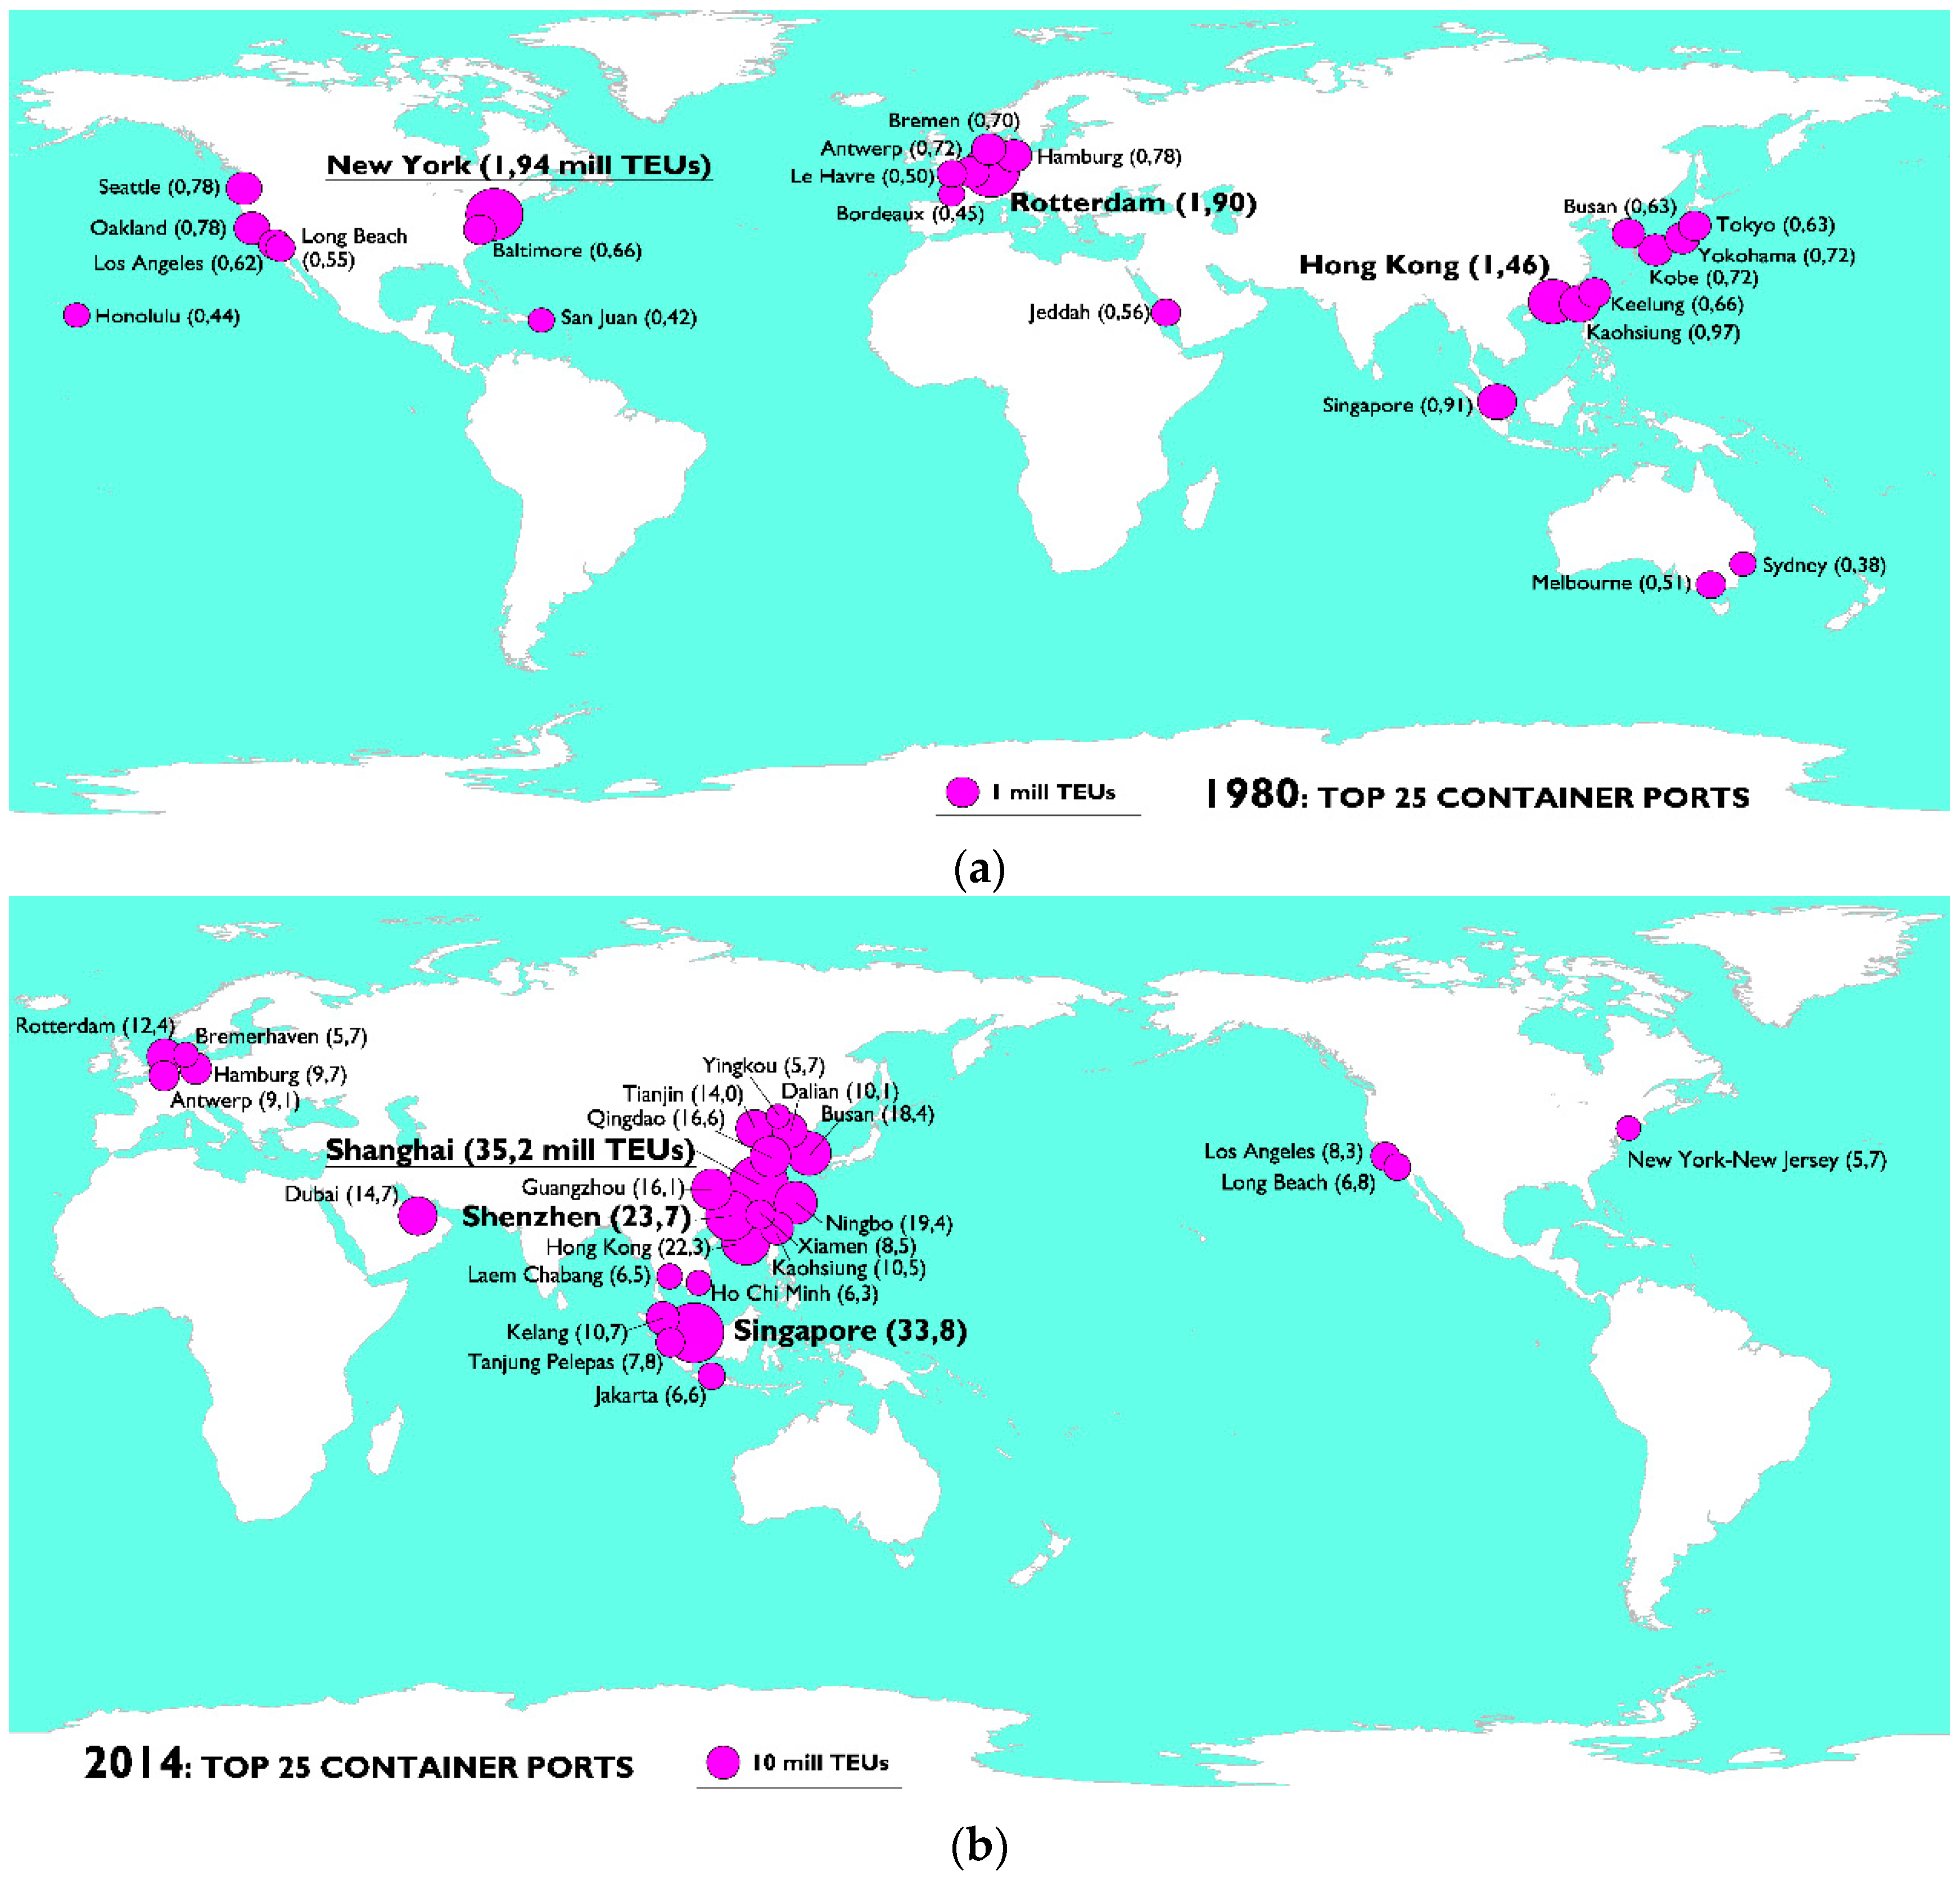
Figure 2.
Containerisation (TEUs) of the 25 ports with most movement in 1980 (a) and 2014 (b) [8]. These maps reflect the same idea of Figure 1, but with a particular indicator, i.e., the volume of containers. Source of maps: self-made production.

Figure 3.
Map of tallest skyscrapers in 2015.
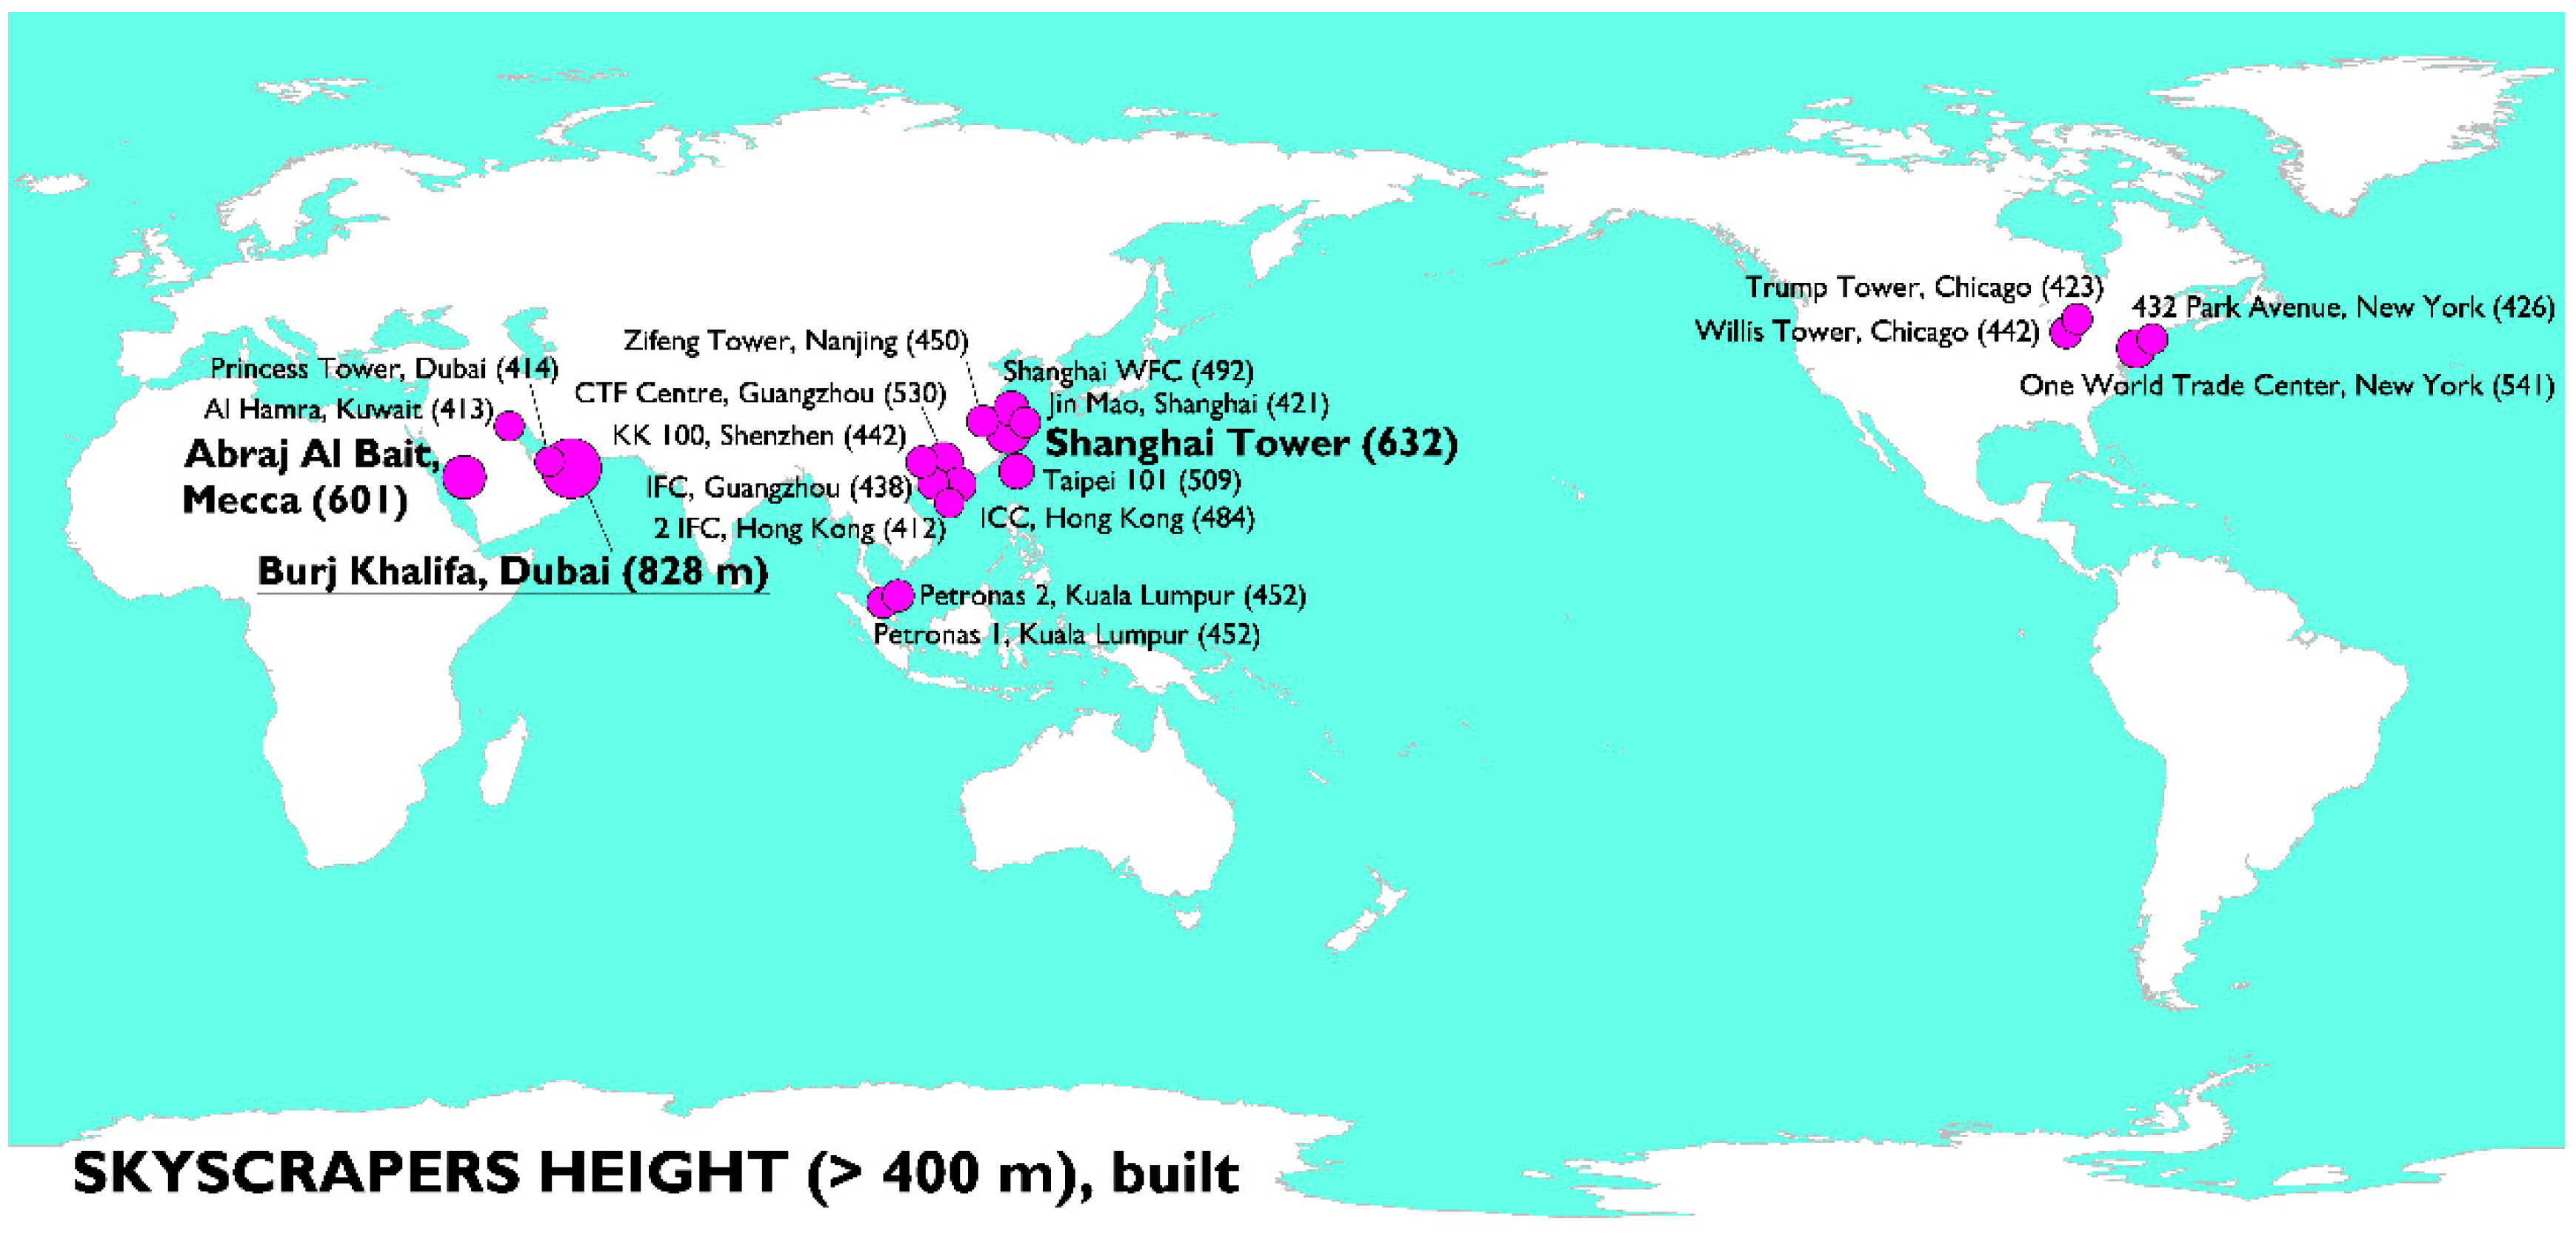
Figure 4.
Map of tallest skyscrapers under construction in 2015.

Figure 5.
Map of longest cable-stayed bridge spans, 2015.

Figure 6.
Map of largest land reclamation areas, 2015.

Figure 7.
Tallest skyscrapers by country and period of time. Source of charts: self-made production.
Figure 7.
Tallest skyscrapers by country and period of time. Source of charts: self-made production.

Figure 8.
Longest spans of suspension (a) and cable-stayed (b) bridges by country and period of time.
Figure 8.
Longest spans of suspension (a) and cable-stayed (b) bridges by country and period of time.
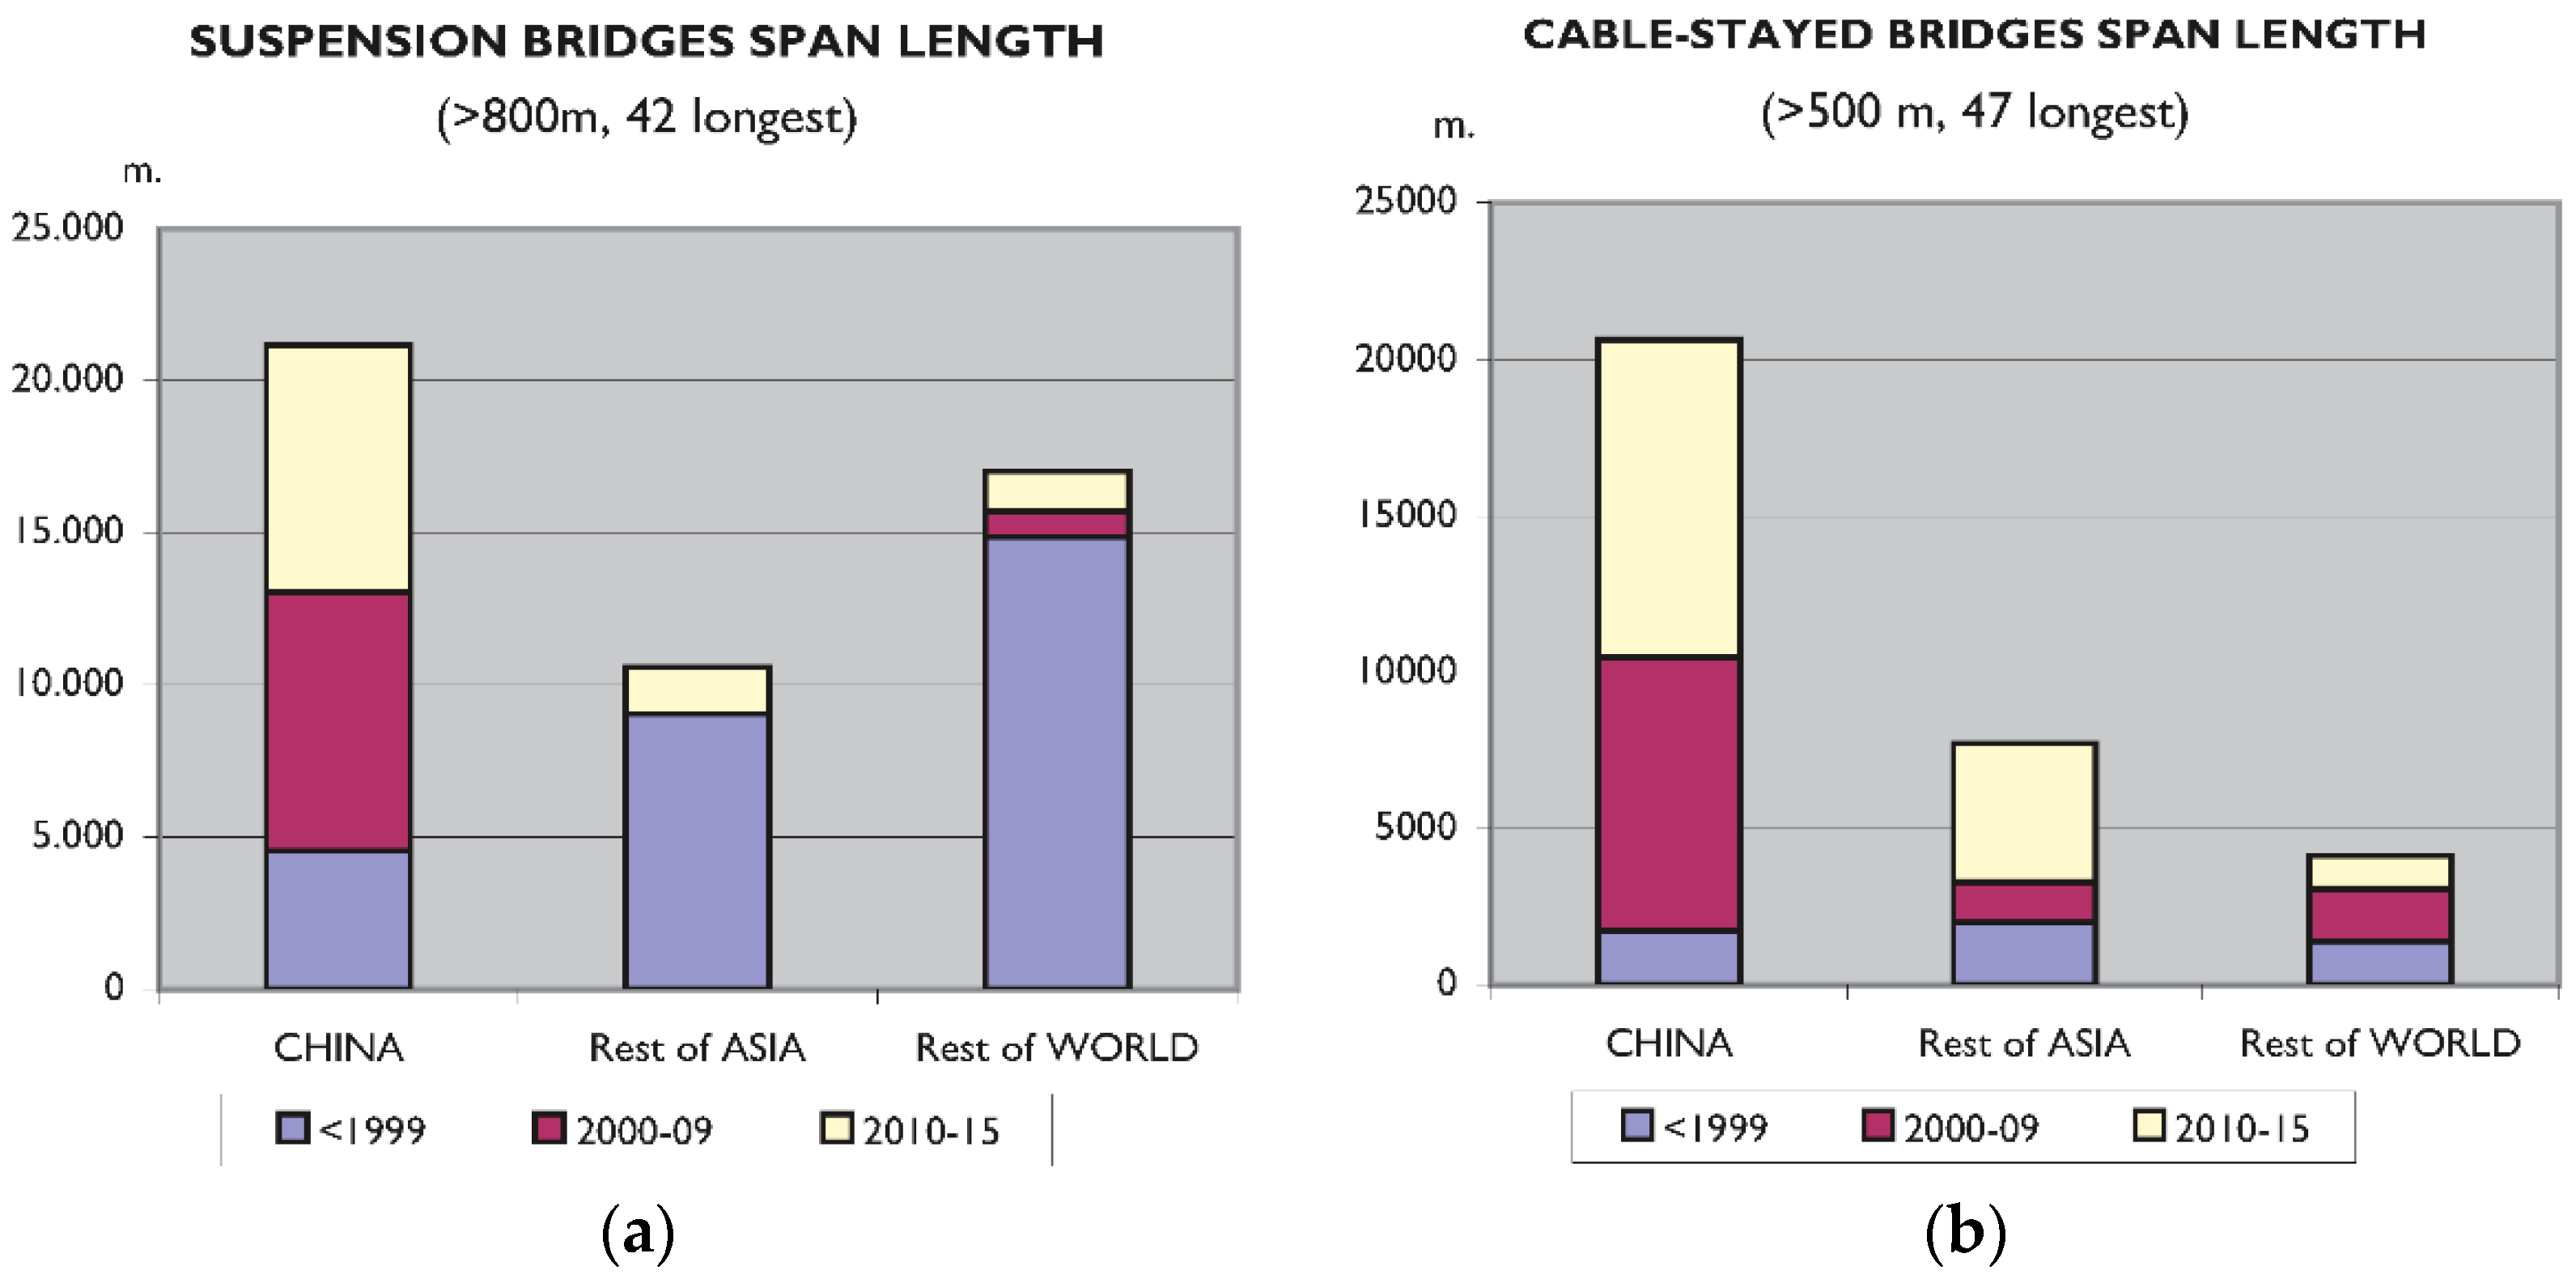
Figure 9.
Tallest (a) and highest deck (b) bridges by country and period of time.
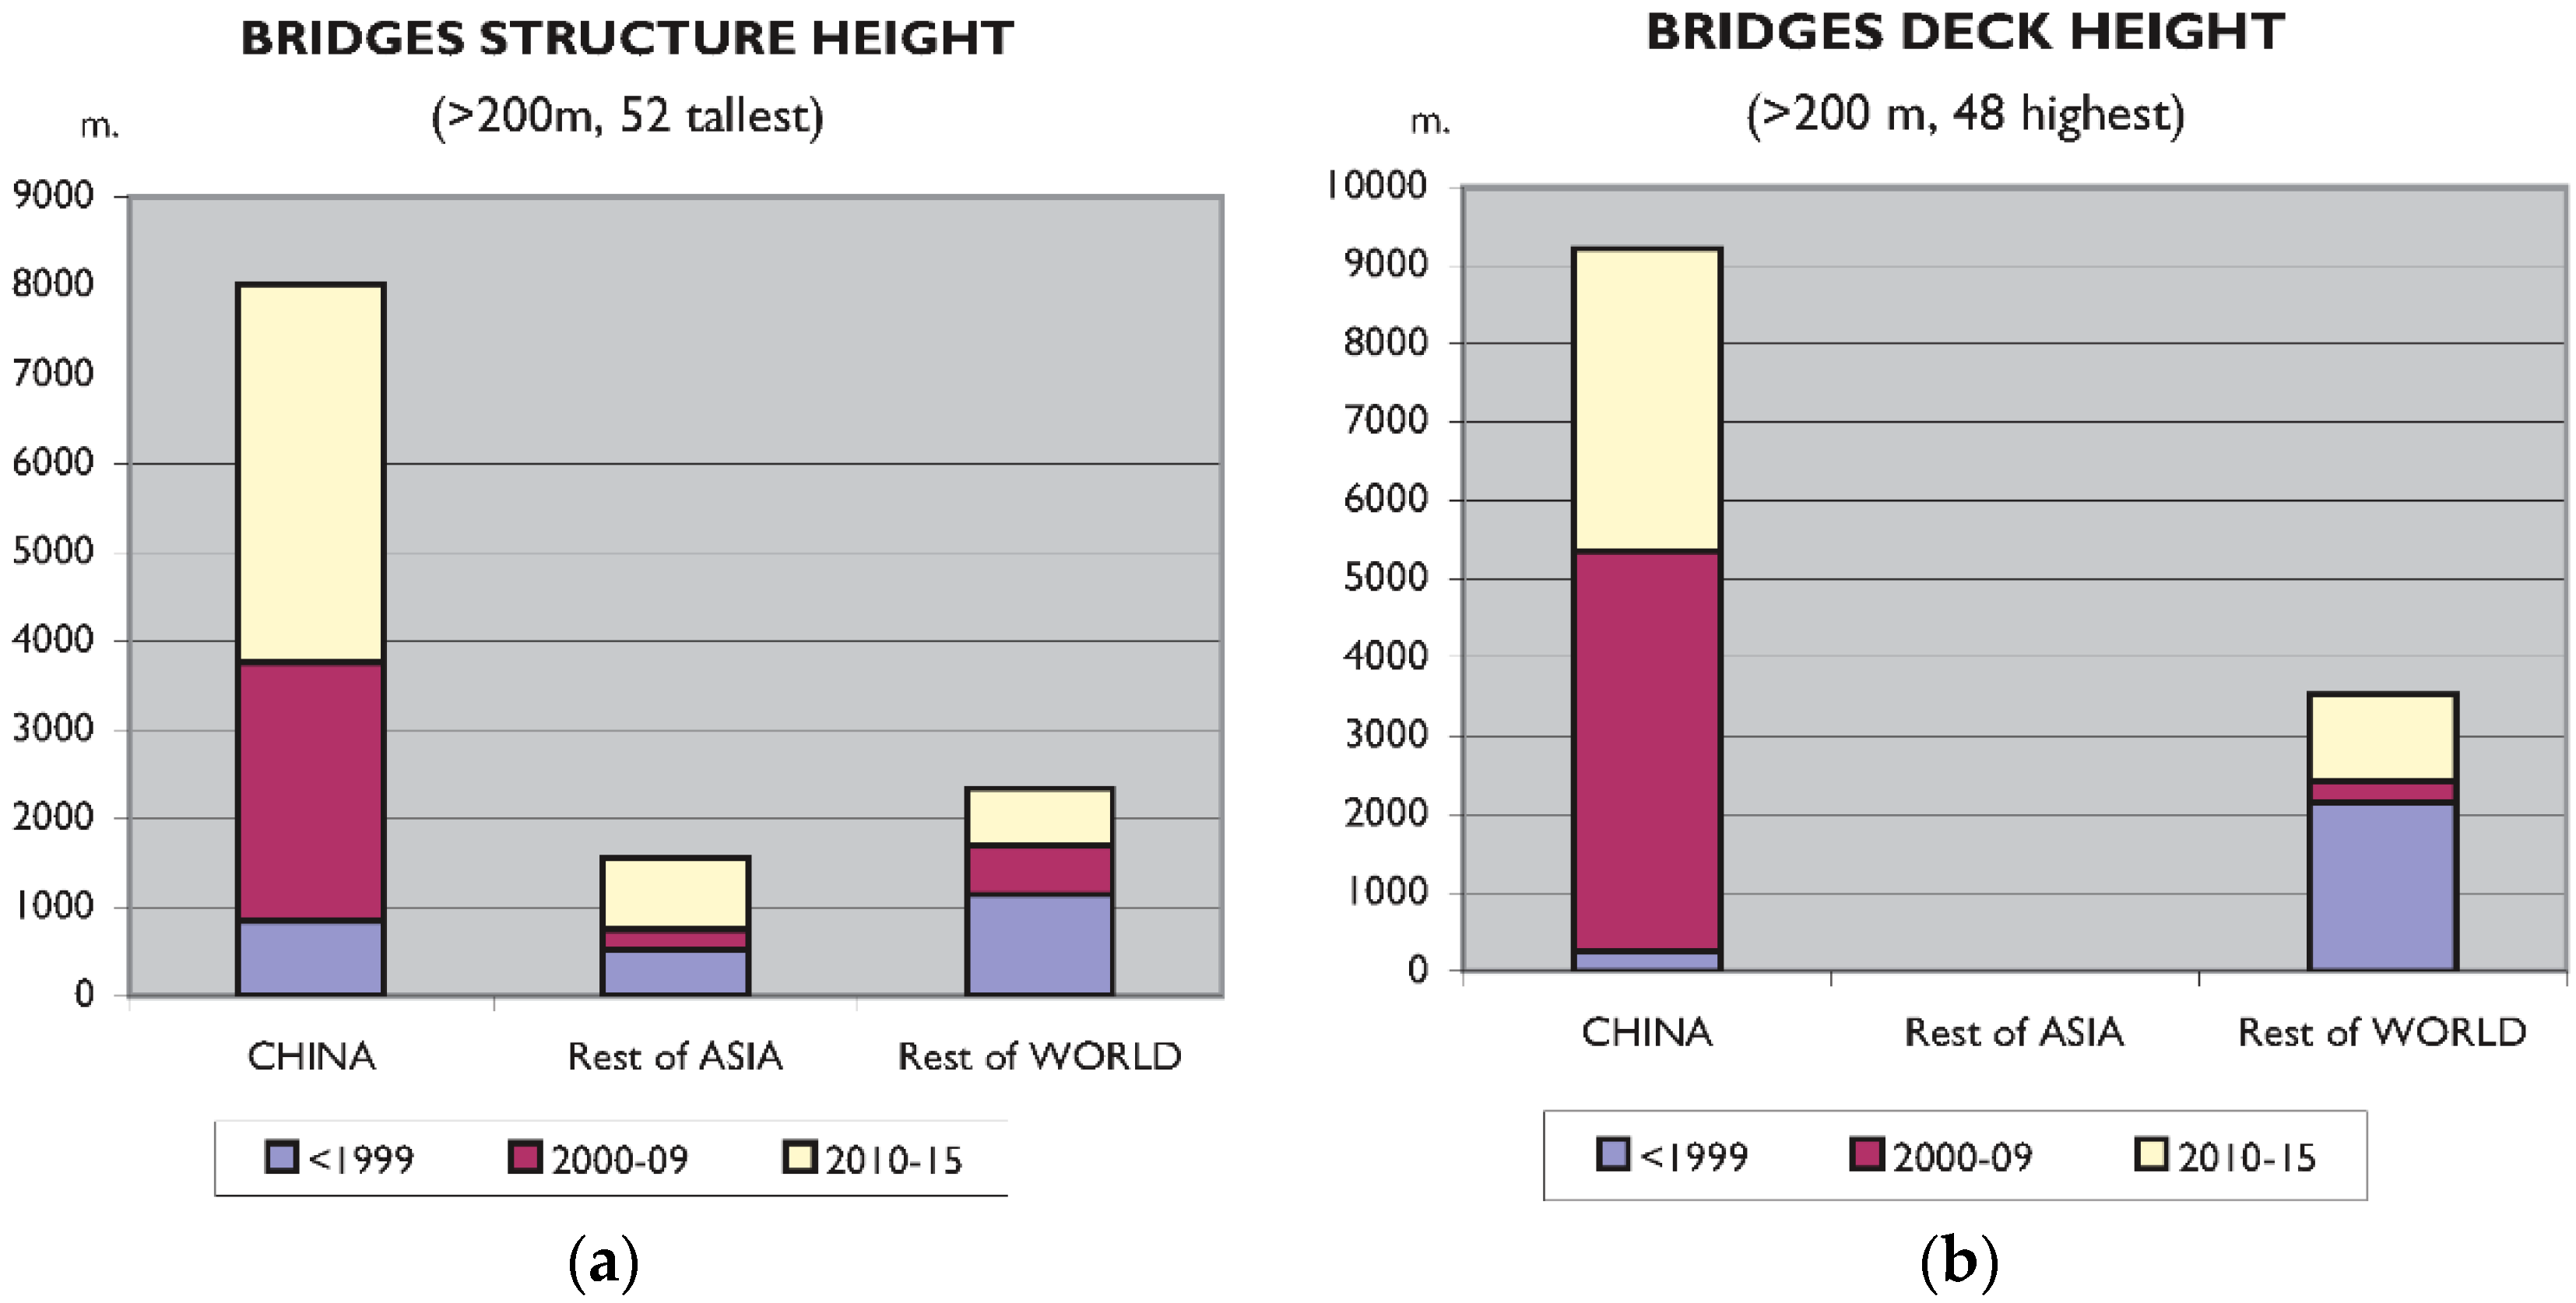
Figure 10.
Longest road (a) and railway (b) tunnels by country and period of time.
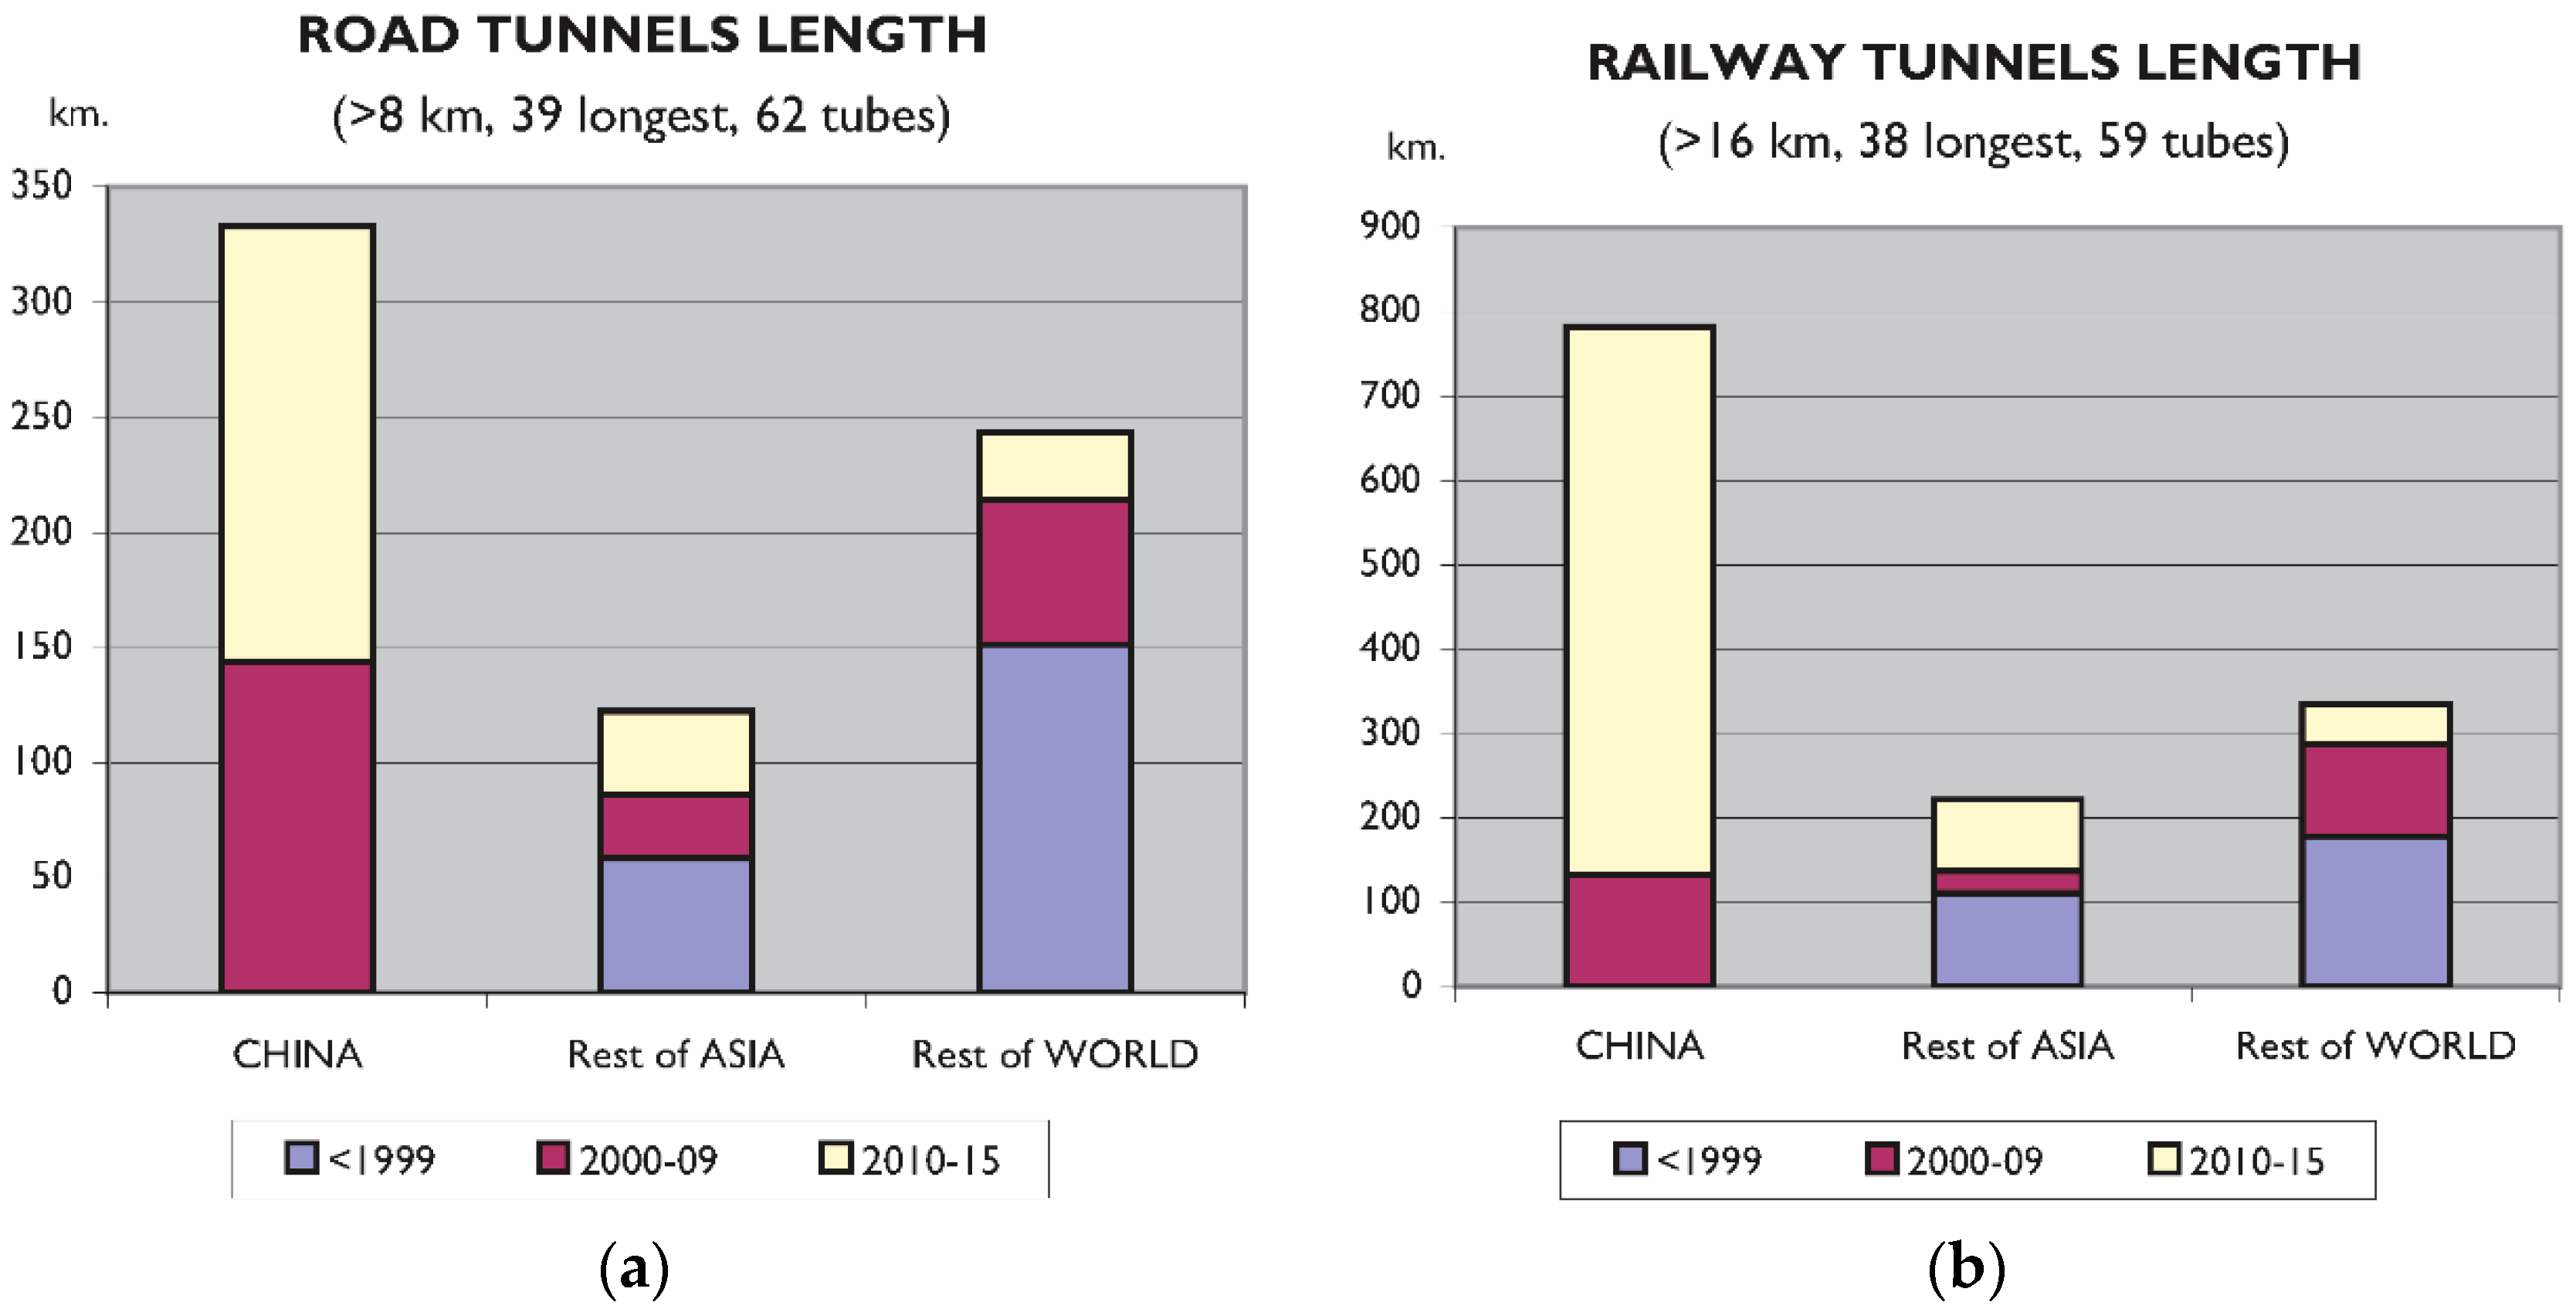
Figure 11.
High-speed Rail network situation in 2015 (a) and land reclamation worldwide by country in 2015 (b).
Figure 11.
High-speed Rail network situation in 2015 (a) and land reclamation worldwide by country in 2015 (b).
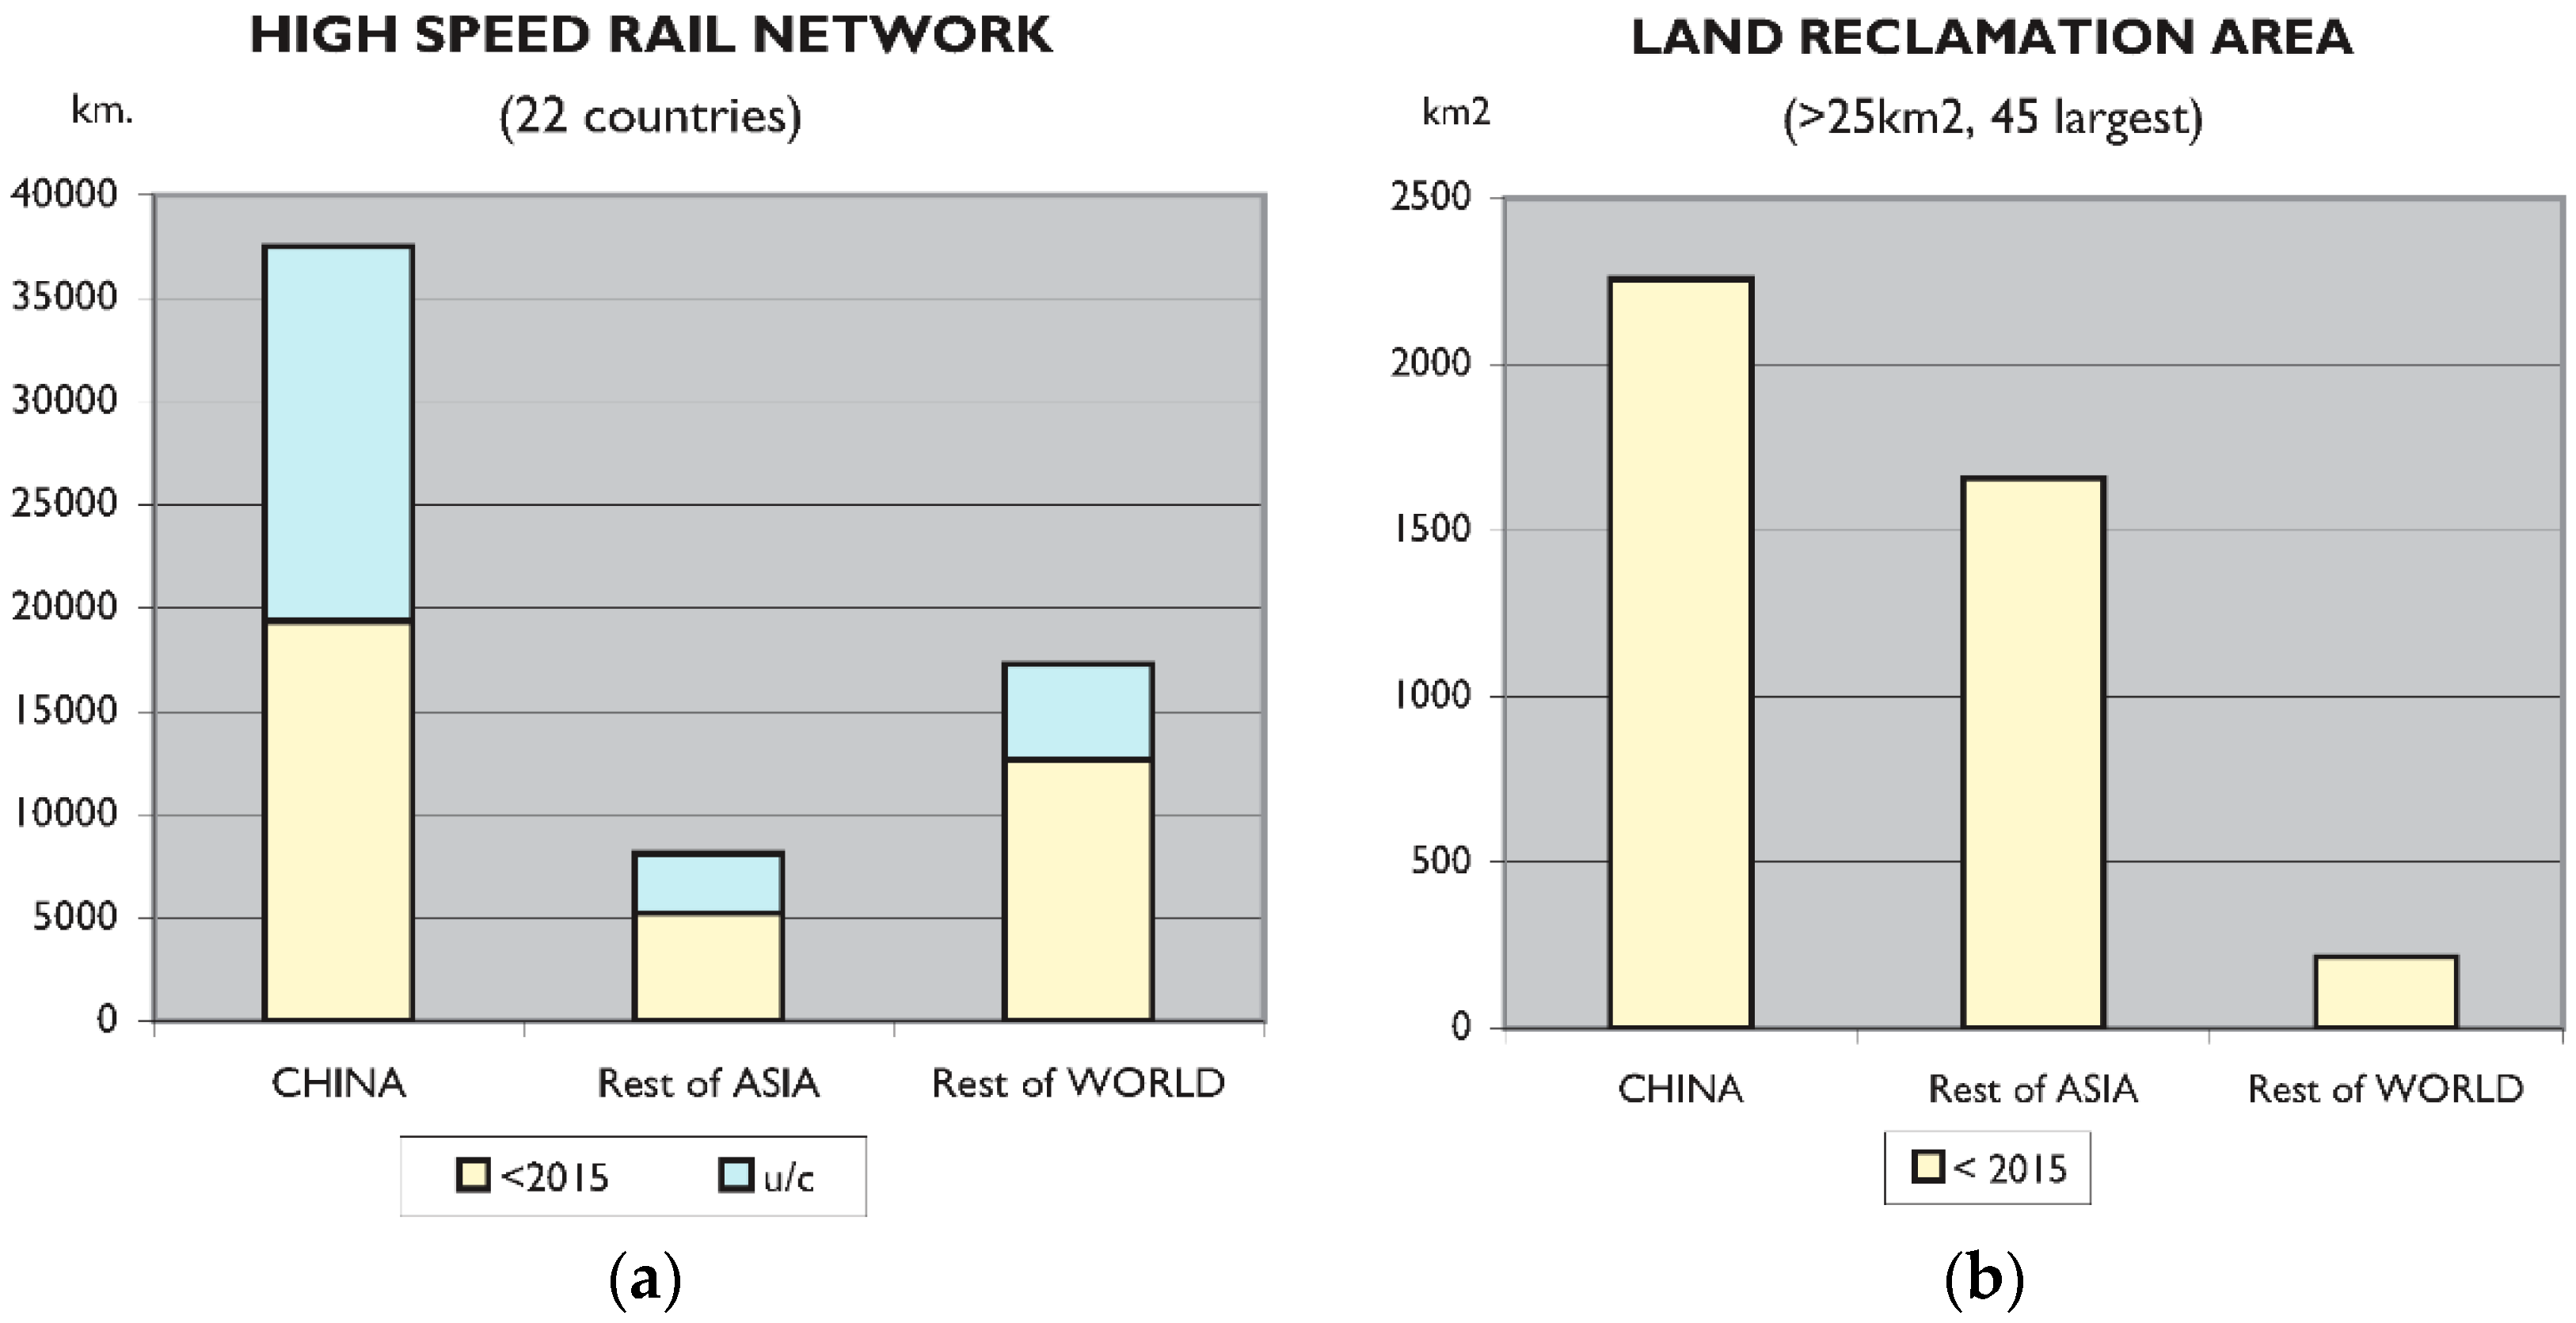
Figure 12.
Busiest ports by cargo tonnage (a) and container volume (b) in 2002, 2008, and 2014.

Figure 14.
World population (a) and percentage of fossil fuel energy consumption (b) [28].
Figure 14.
World population (a) and percentage of fossil fuel energy consumption (b) [28].
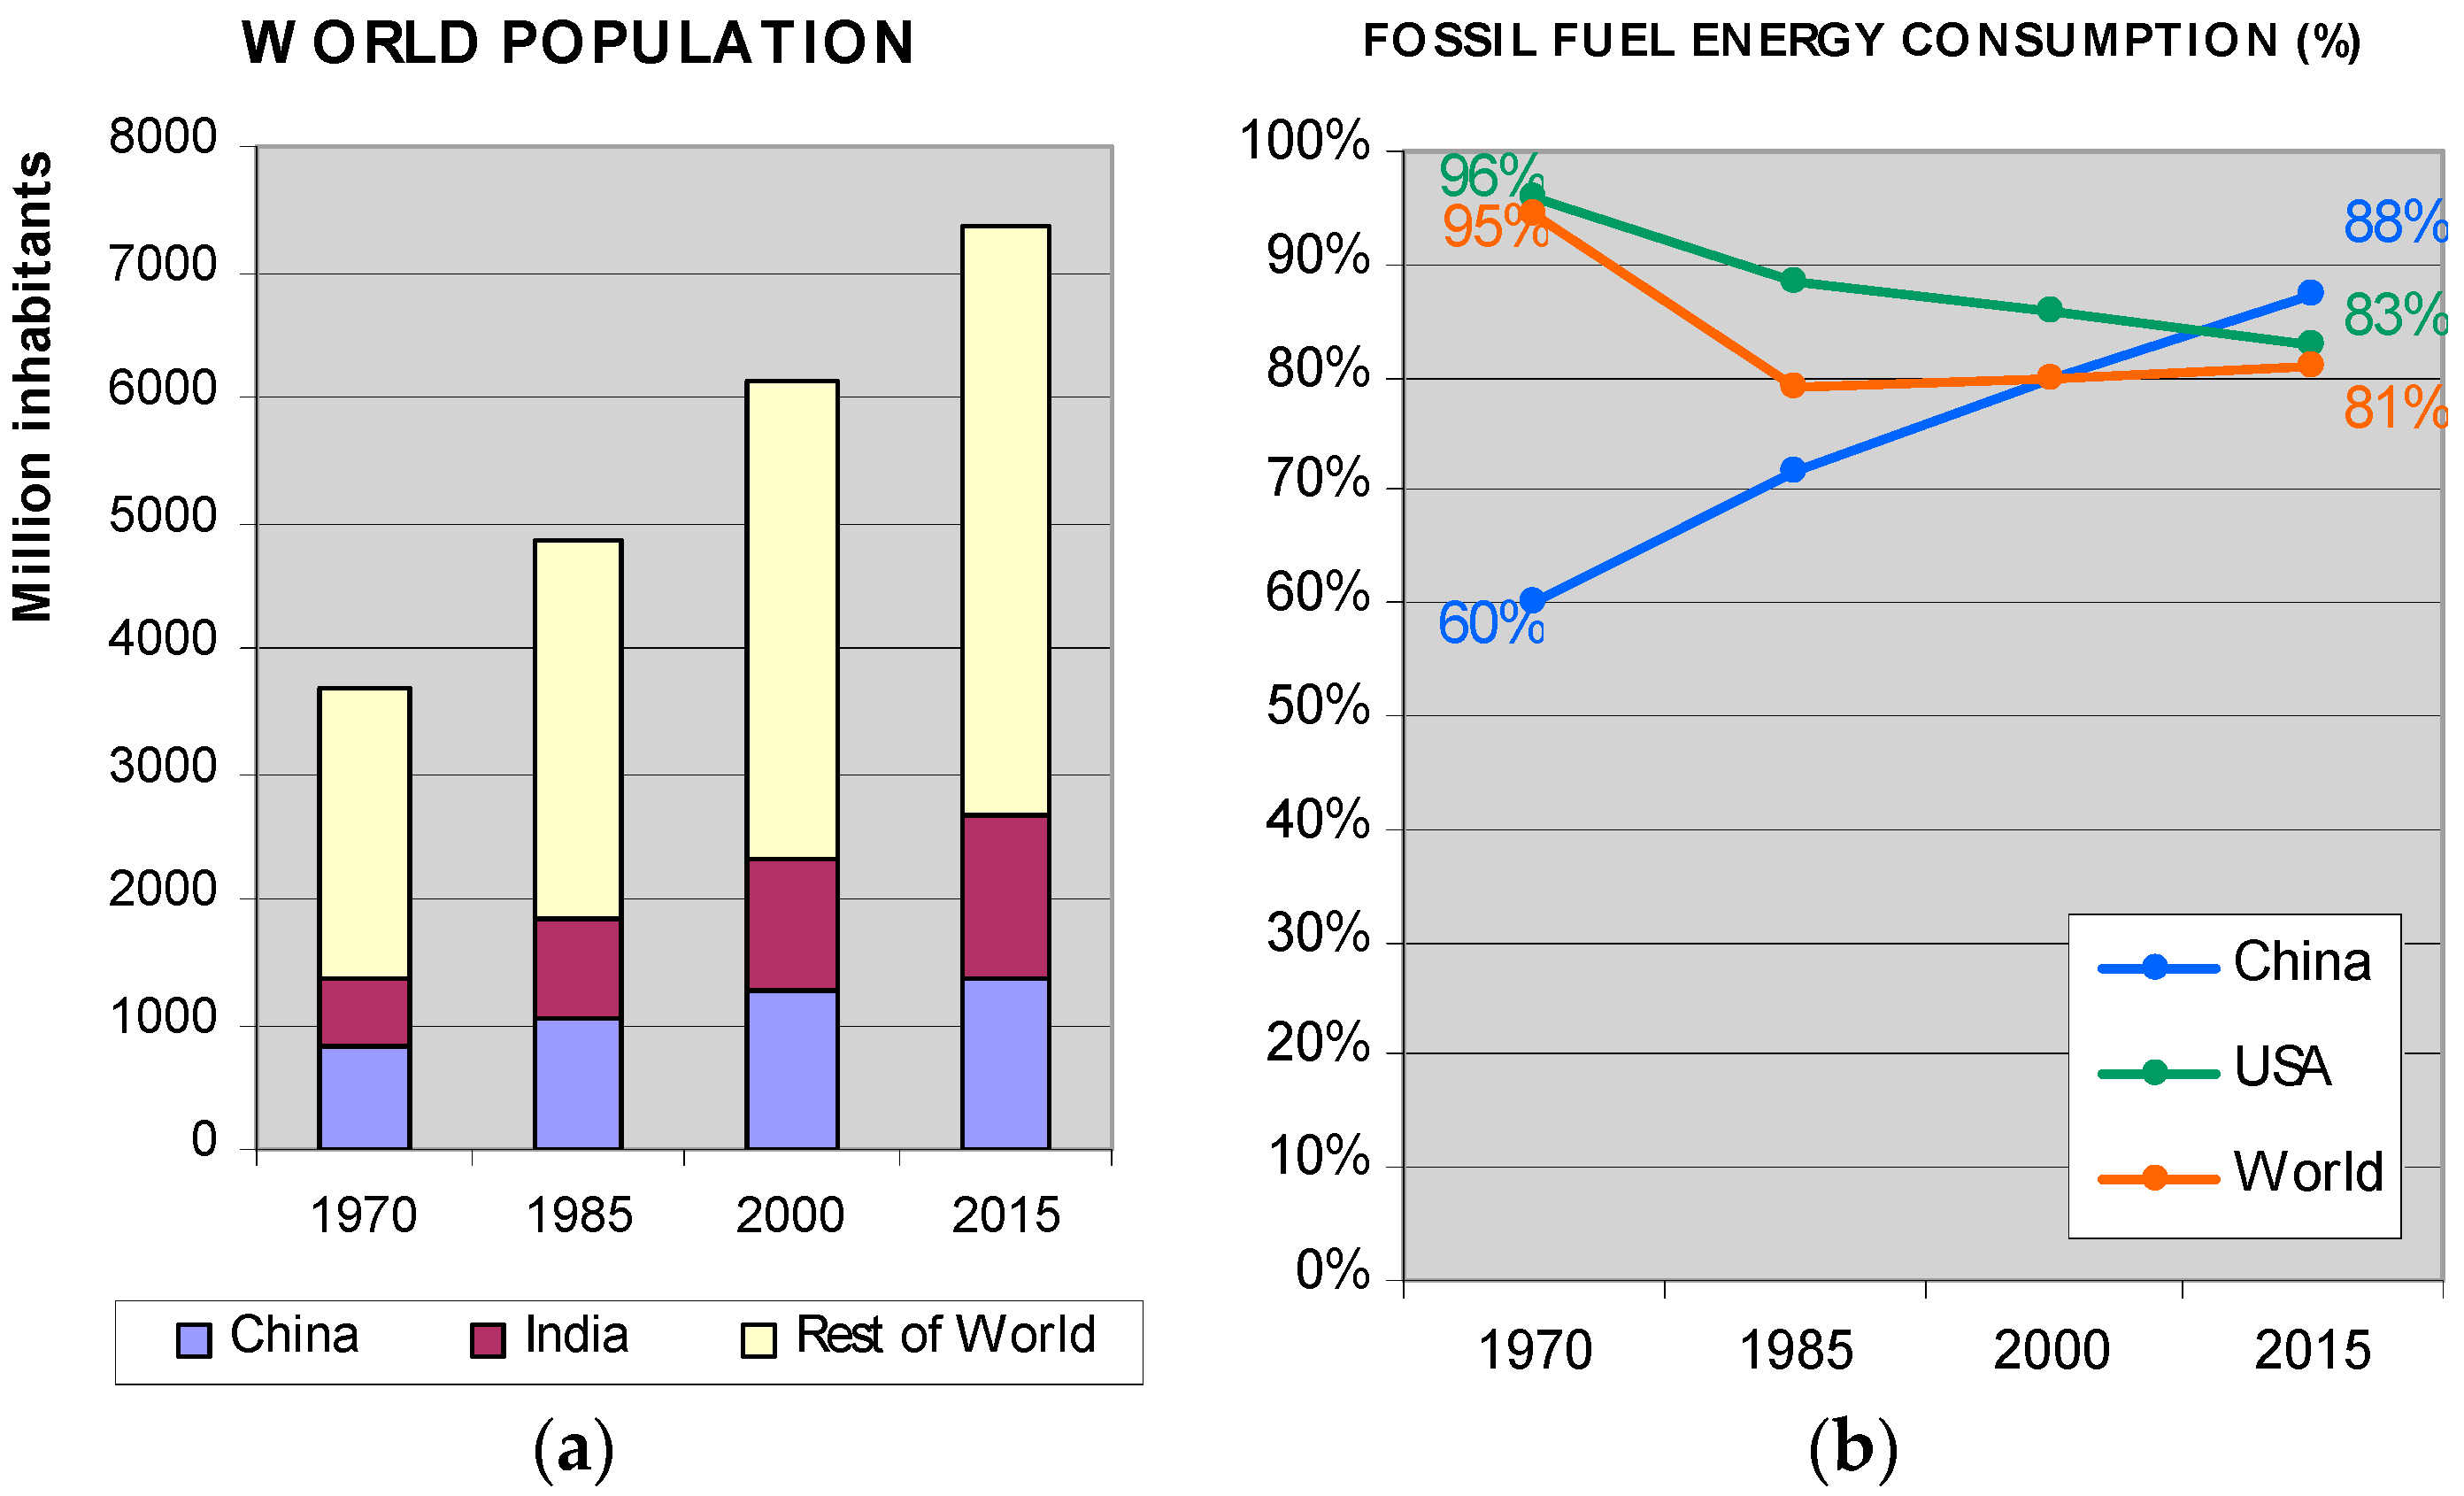
Figure 15.
Energy use (a) and its increase over the last few years (b). Data in kg of oil equivalent [28].
Figure 15.
Energy use (a) and its increase over the last few years (b). Data in kg of oil equivalent [28].

Figure 16.
How five indicators of population, economy and resources contribute to urban growth. Source: McKinsey Global Institute Cityscope 2.0. [6].
Figure 16.
How five indicators of population, economy and resources contribute to urban growth. Source: McKinsey Global Institute Cityscope 2.0. [6].
© 2017 by the authors. Licensee MDPI, Basel, Switzerland. This article is an open access article distributed under the terms and conditions of the Creative Commons Attribution (CC BY) license (http://creativecommons.org/licenses/by/4.0/).
Share and Cite
MDPI and ACS Style
Martín-Antón, M.; Negro, V.; Del Campo, J.M.; López-Gutiérrez, J.-S.; Esteban, M.D. The Gigantism of Public Works in China in the Twenty-First Century. Sustainability 2017, 9, 1581. https://doi.org/10.3390/su9091581
AMA Style
Martín-Antón M, Negro V, Del Campo JM, López-Gutiérrez J-S, Esteban MD. The Gigantism of Public Works in China in the Twenty-First Century. Sustainability. 2017; 9(9):1581. https://doi.org/10.3390/su9091581
Chicago/Turabian StyleMartín-Antón, Mario, Vicente Negro, José María Del Campo, José-Santos López-Gutiérrez, and M. Dolores Esteban. 2017. "The Gigantism of Public Works in China in the Twenty-First Century" Sustainability 9, no. 9: 1581. https://doi.org/10.3390/su9091581
Note that from the first issue of 2016, this journal uses article numbers instead of page numbers. See further details here.