A Decomposition Analysis of Embodied Energy Consumption in China’s Construction Industry

1
School of Economics, Fujian Normal University, Fuzhou 350001, China
2
Fujian Talents Introduction Service Center, Fuzhou 350001, China
3
Department of International Economics and Business, School of Economics, Xiamen University, Xiamen 361005, China
4
China Center for Energy Economics Research, School of Economics, Xiamen University, Xiamen 361005, China
*
Authors to whom correspondence should be addressed.
Sustainability 2017, 9(9), 1583; https://doi.org/10.3390/su9091583
Submission received: 31 July 2017
/
Revised: 23 August 2017
/
Accepted: 31 August 2017
/
Published: 8 September 2017
(This article belongs to the Section Energy Sustainability)
Abstract
:With the fast-paced urbanization process, there will be a rapid development of China’s construction industry. However, it could also drive for considerable energy consumption, resulting in immense pressure on the environment. Based on non-competitive (import) input–output tables, we employed the SRIO (Single Region Input–Output) model to analyze energy use embodied in China’s construction industry from 1995 to 2009 and made projections for 2020. Our results show that about 4.84 billion tons of coal equivalent energy would be consumed by China’s construction industry in 2020. It implies that urbanization not only promotes the flow of embodied energy, but also provides development opportunities for a green and energy-saving construction industry.
1. Introduction
With a large-scale infrastructure construction in urbanization process, China’s energy demand grew so fast that it has become the largest energy consumer since 2009 [1]. As a high energy-consuming, high-pollution and inefficient industry, China’s construction industry has made the energy shortage worse. According to Chang Y et al. [2], in the last two decades the annual average increase in building energy consumption in China exceeded 10% and the construction industry consumed 793.74 million tons of coal equivalent energy in 2007, which was equal to 29.6% of China’s total national energy consumption [3]. Furthermore, considering the large processing stages, it is critical to take account of the inevitable energy pulling effect caused by the booming construction industry from the perspective of full life-cycle activity. In recent years, China’s construction industry gradually went up with the world with the deepening of economic globalization. Therefore, more extensive attention should be paid to evaluating the impact of energy pulling effect and improving the green efficiency of construction industry.
Generally, the energy pulling effect of construction industry could be assessed by its embodied energy characteristic. It indicates that the direct energy use related to construction processes of added value or final production is small, whereas the indirect energy use engaged in its upstream productions like steel and cement is relatively large. Therefore, it is more helpful to use an input–output analysis to depict the embodied energy flow from high energy-consuming upstream sector to construction sector [4]. As China’s construction industry gradually goes up in the world while deepening economic globalization and international trade, studies of embodied energy characteristic should not only analyze the domestic relations between its upstream and downstream sectors, but also evaluate its exports and imports at home and abroad from the international perspective.
In recent years, several studies have paid attention to investigate domestic embodied energy of China’s construction industry while studies for that of imports and exports are still rare. Hong J et al. [3] employed a multi-regional input–output model to analyze embodied energy flow and technical differences on interregional trade of China’s construction industry. The result shows that regions with high energy intensity are concentrated in the central part, whereas the less energy-intensive regions are located on the southern and eastern coasts. Guan J et al. [5] developed an input–output (I–O)-based hybrid life-cycle assessment (LCA) model in quantification of building embodied energy in China and compared the results with different LCA models. Fridley D G [6] used assumptions to develop two operational energy forecasts for 2020, estimating energy consumption and emissions of China’s commercial and office buildings. Different from them, our study is to evaluate the embodied energy use of China’s construction industry from 1995 to 2009 under the opening condition, and make forecasts for 2020. In addition, policy suggestions are made for developing green efficiency and energy-saving construction industry.
Our study differs from previous researches in the following three aspects: First, we employ the (Single Region Input–Output) SRIO model to explore embodied energy in imports and exports of construction industry under the opening condition from the perspective of international value chain. Second, our study improves the model of Lin and Sun [7] by decomposing final demand into seven parts so as to more comprehensively examine the embodied energy flow from upstream to downstream, at home and abroad. Third, we use China’s input–output tables and environmental accounts from WIOD (World Input–Output Database). These data can provide a more solid foundation for projections because of their superior continuity, compared to traditional input–output tables which are updated every five years.
2. Methodology and Data
2.1. Input–Output Analysis
This study is based on input–output analysis to estimate energy consumption in full life-cycle activities of construction industry. Input–output method is widely used to analyze energy consumption in recent years [8,9,10,11].
Assuming that there are n industries in an economy, the relationship of total output and intermediate input and final demand can be represented as
where is the total output of the entire economy, the value of which equals to that of total input. Although the ranges and patterns of calculation for total output and total input are somewhat different, the values of result are the same.
There are two parts of total output. represents the intermediate input and is the final demand. is a direct requirement coefficient matrix. Its element is , representing the proportion of intermediate input from industry in per unit output from industry . The final demand includes household consumption, government consumption, gross fixed capital formation, changes in inventories and valuables and net export. This definition will be kept in the remainder of this paper.
The relationship between and can be further represented as
is called the Leontief inverse matrix. It links input with output creatively and is the core part of input–output analysis. Its element represents the amount of output from industry required directly and indirectly to produce per unit final demand from industry .
2.2. Direct and Indirect Energy Use
Direct energy use is represented by , which is a row vector. is domestic energy consumption generated by all sectors.
is also a row vector, every element of which stands for direct energy used to produce per unit good (, where is the value of total output, not in practical form.) in its sector. Using the Leontief inverse matrix, can be formulated as
where is embodied energy coefficient and it is a row sector. Its element represents energy consumed directly and indirectly in per unit final demand in industry .
2.3. Decomposition of Embodied Energy Consumption
Based on the model of Lin and Sun [7], this study divides embodied energy of final demand into seven parts. The embodied energy consumption of final demand can be represented as and it concludes domestic part () and net export part (). Embodied energy of net export is the difference between that of export part () and import part (). Therefore, embodied energy consumption of final demand can be
Furthermore, we can divide it more precisely into seven parts according to the scale of each part.
stands for embodied energy of products manufactured and consumed domestically and is that of import products used by final consumers domestically.
Similarly, the embodied energy of export can be represented as
where represents energy embodied in export products manufactured domestically whereas is energy embodied in import products but not for domestic consumption.
Furthermore, embodied energy use of imports is composed of three parts: represents energy embodied in imports which are consumed directly; is energy embodied in import intermediates which are manufactured and consumed domestically and represents embodied energy of re-exported products.
It is necessary to note that although the total amount of is the same as that of , the forms of them are different. and are considered as domestic input, but they are then transformed into the output product after domestic processing. Therefore, energy embodied in output () has been relocated by different sectors. Similarly, in which is regarded as input and is output. In this way can we explore more clearly the movement of embodied energy from inputs to outputs.
Divided into seven parts, embodied energy consumption of final demand can be represented as
2.4. Estimating Embodied Energy Use
This paper adopts non-competitive input–output tables from WIOD. This database contains annual time-series of world input–output tables, covering the period from 1995 onwards and it is popular in recent studies. Different from traditional input–output tables, the data made a distinction of imports used for processing and for direct consumption. Therefore we do not need to make assumptions like some studies [7,12,13] that the proportion of the imported intermediate input from sector to all other sectors is the same. Instead, we can immediately find imports of each sector and calculate the direct requirement coefficient matrix of imports () so that it can improve the accuracy of final results.
The total imports includes two parts:
where is the imported intermediate input, is the imported directed domestic final consumption, represents the final product form after domestic processing. can be divided into and , representing the intermediate inputs consumed domestically and be reexported after domestic processing respectively.
This study adopts the EAI (Emissions Avoided by Imports) assumption as mostly other SIRO models [13,14] which represents that the emission factors of the exporting countries are the same as the domestic . The embodied energy in is represented as
According to the earlier discussion, we can deduce that , and are accounting formulas correspond to , and . The input form and output form of are the same because these products, which have been consumed directly, did not transform from importing to consuming.
Embodied energy of imported immediate inputs transforms by domestic processing can be shown as:
where is a row vector. Its element represents the embodied energy in per unit final product.
Formula (12) deduces from output form to input form . is the accounting formula for and it is the output form corresponding to .
Similarly, the input form can be transformed into output form . Therefore, the accounting formula of is .
It is necessary to note that the scope of in our study is consistent of the II part in Lin and Sun’s model [7]. While in that paper, the scope of is wrong because embodied energy of re-exported products should not be included in . As a result, the value is exaggerated and the accuracy is somewhat influenced.
The accounting formula of energy embodied in final demand, , is . In addition, according to Formulas (4), (5) and (13), we can get:
The explanations for seven parts are shown in Table 1.
2.5. Data Source and Processing
This paper adopts the China’s IO tables from WIOD and adjusts all data to the price level of 1995. The tables are non-competitive IO tables, the data of which cover 35 sectors from 1995 to 2014. It is important to note that the energy use data of WIOD is exaggerated because of recalculation. Thus, we replaced the data of total energy use by that of IEA (International Energy Agency) but followed the original proportions from WIOD. Consequently, the adjusted data is more practical by combining strengths of WIOD and IEA. Since the latest available data of energy consumption is in 2009, we had to choose 1995–2009 as our study period.
3. Results
3.1. Direct and Embodied Energy Consumption of Construction Industry
The size of construction industry has been continuously expanding from 1995 to 2009 by 5 times from 153.57 billion dollars to 926.82 billion dollars. The final demand of it is the largest among all sectors during study period, the growth of which reached to 551%. In addition, the size of imports and exports expanded rapidly in general. This evidence shows that the expansion of construction industry has made great contributions to national economic growth.
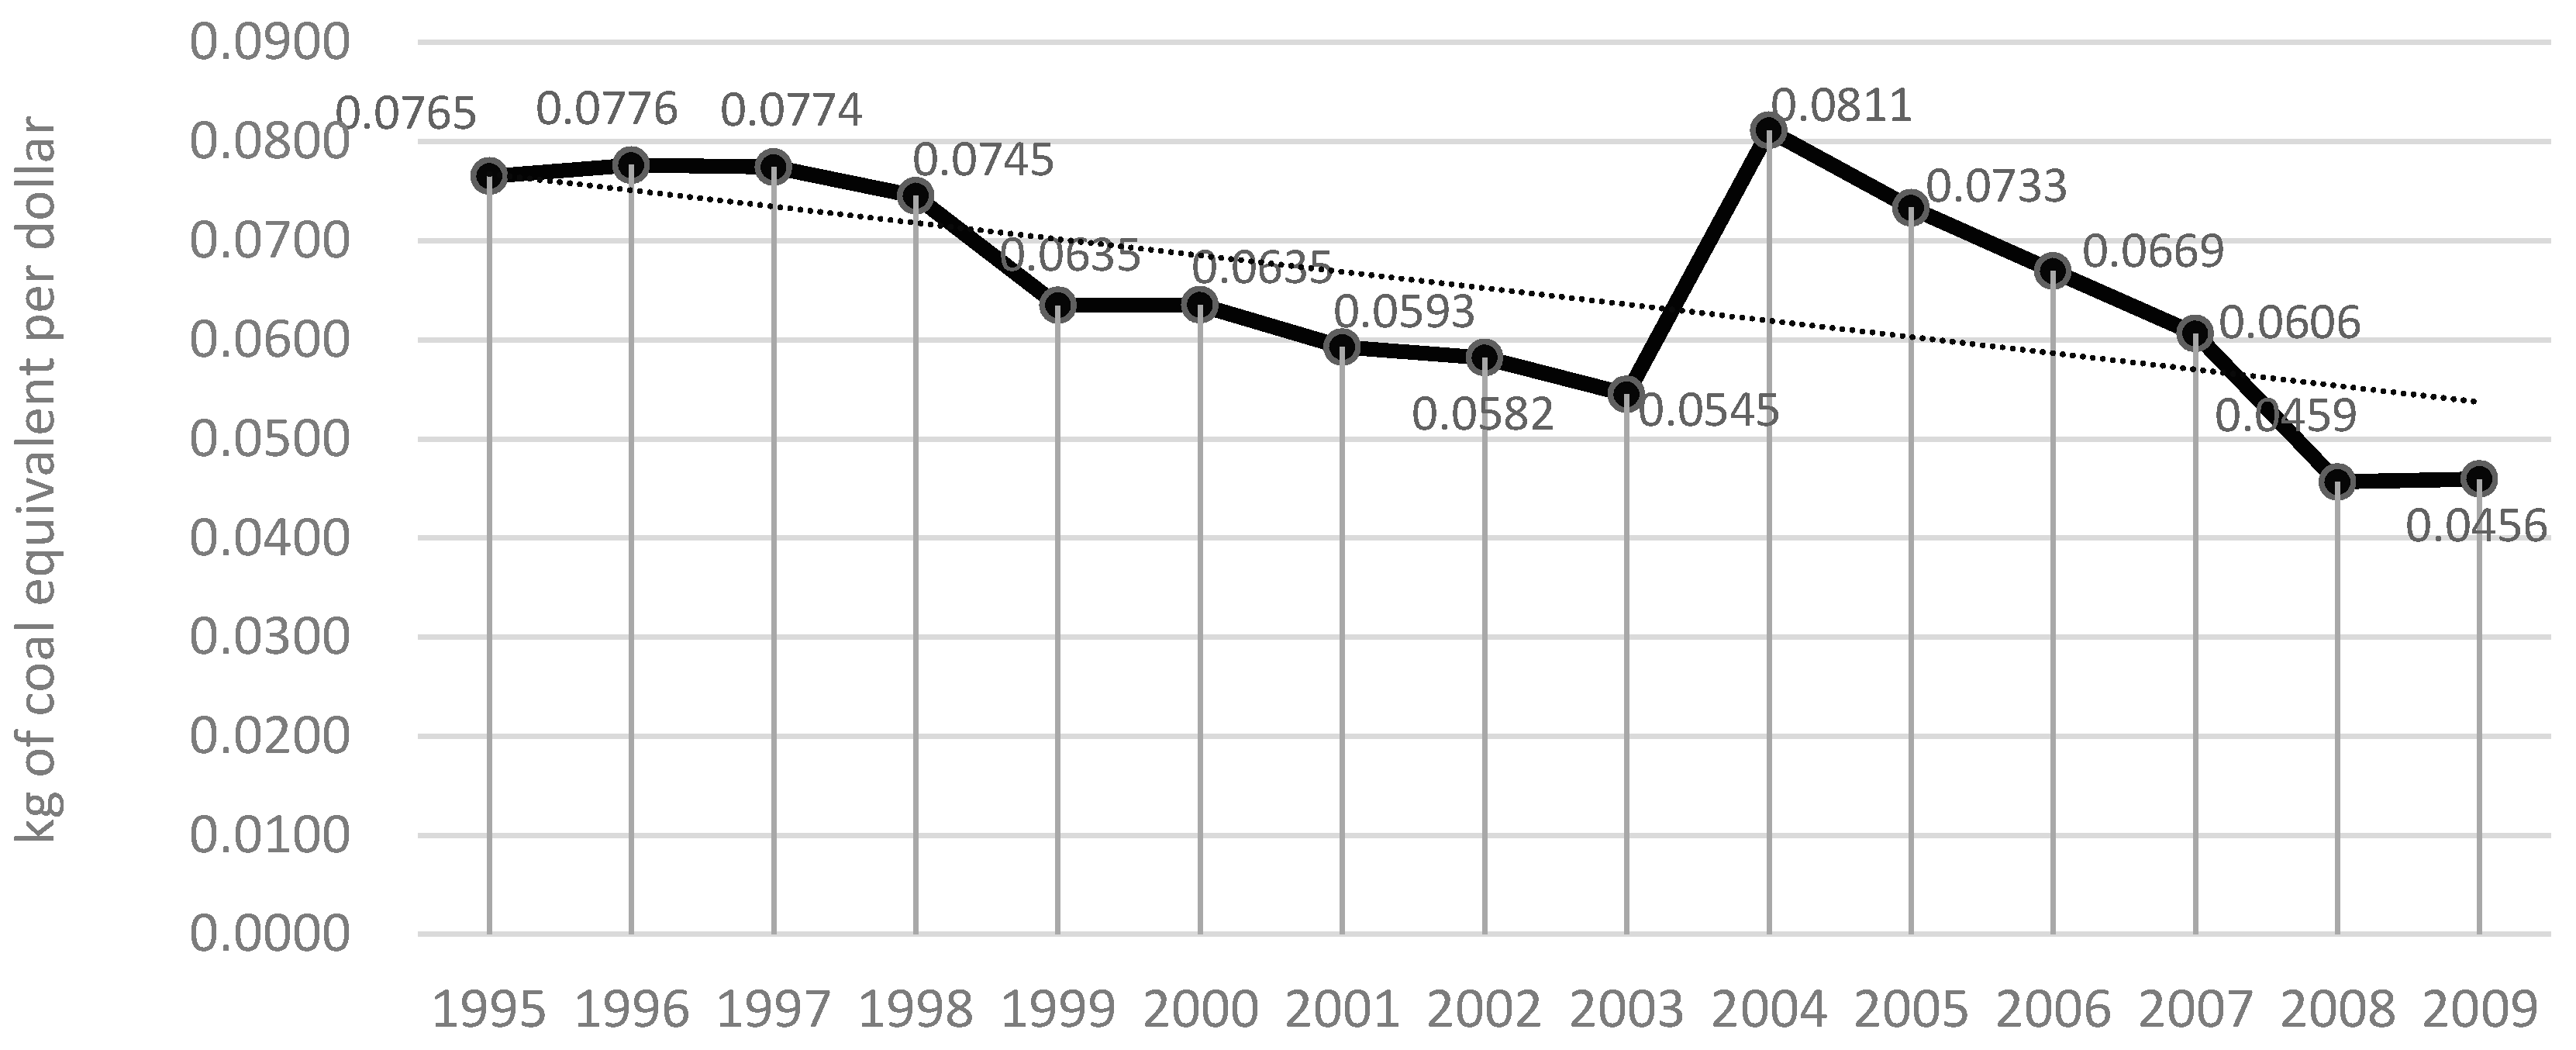
Figure 1 shows the trend of direct energy consumption coefficient which drops about 40% from 0.077 to 0.046. Its general downward trend indicates the energy efficiency was gradually developing in construction industry and immediate input sectors. Conversely, embodied energy consumption coefficient in Figure 2 has a smaller change, about 38.68%, from 2.124 to 1.302. It is due to higher specialization degree which increases demand for intermediate inputs and lengthens production chains so as to accumulate more energy use. This phenomenon is the embodiment of industrial promotion and technical progress of China at this stage [7].
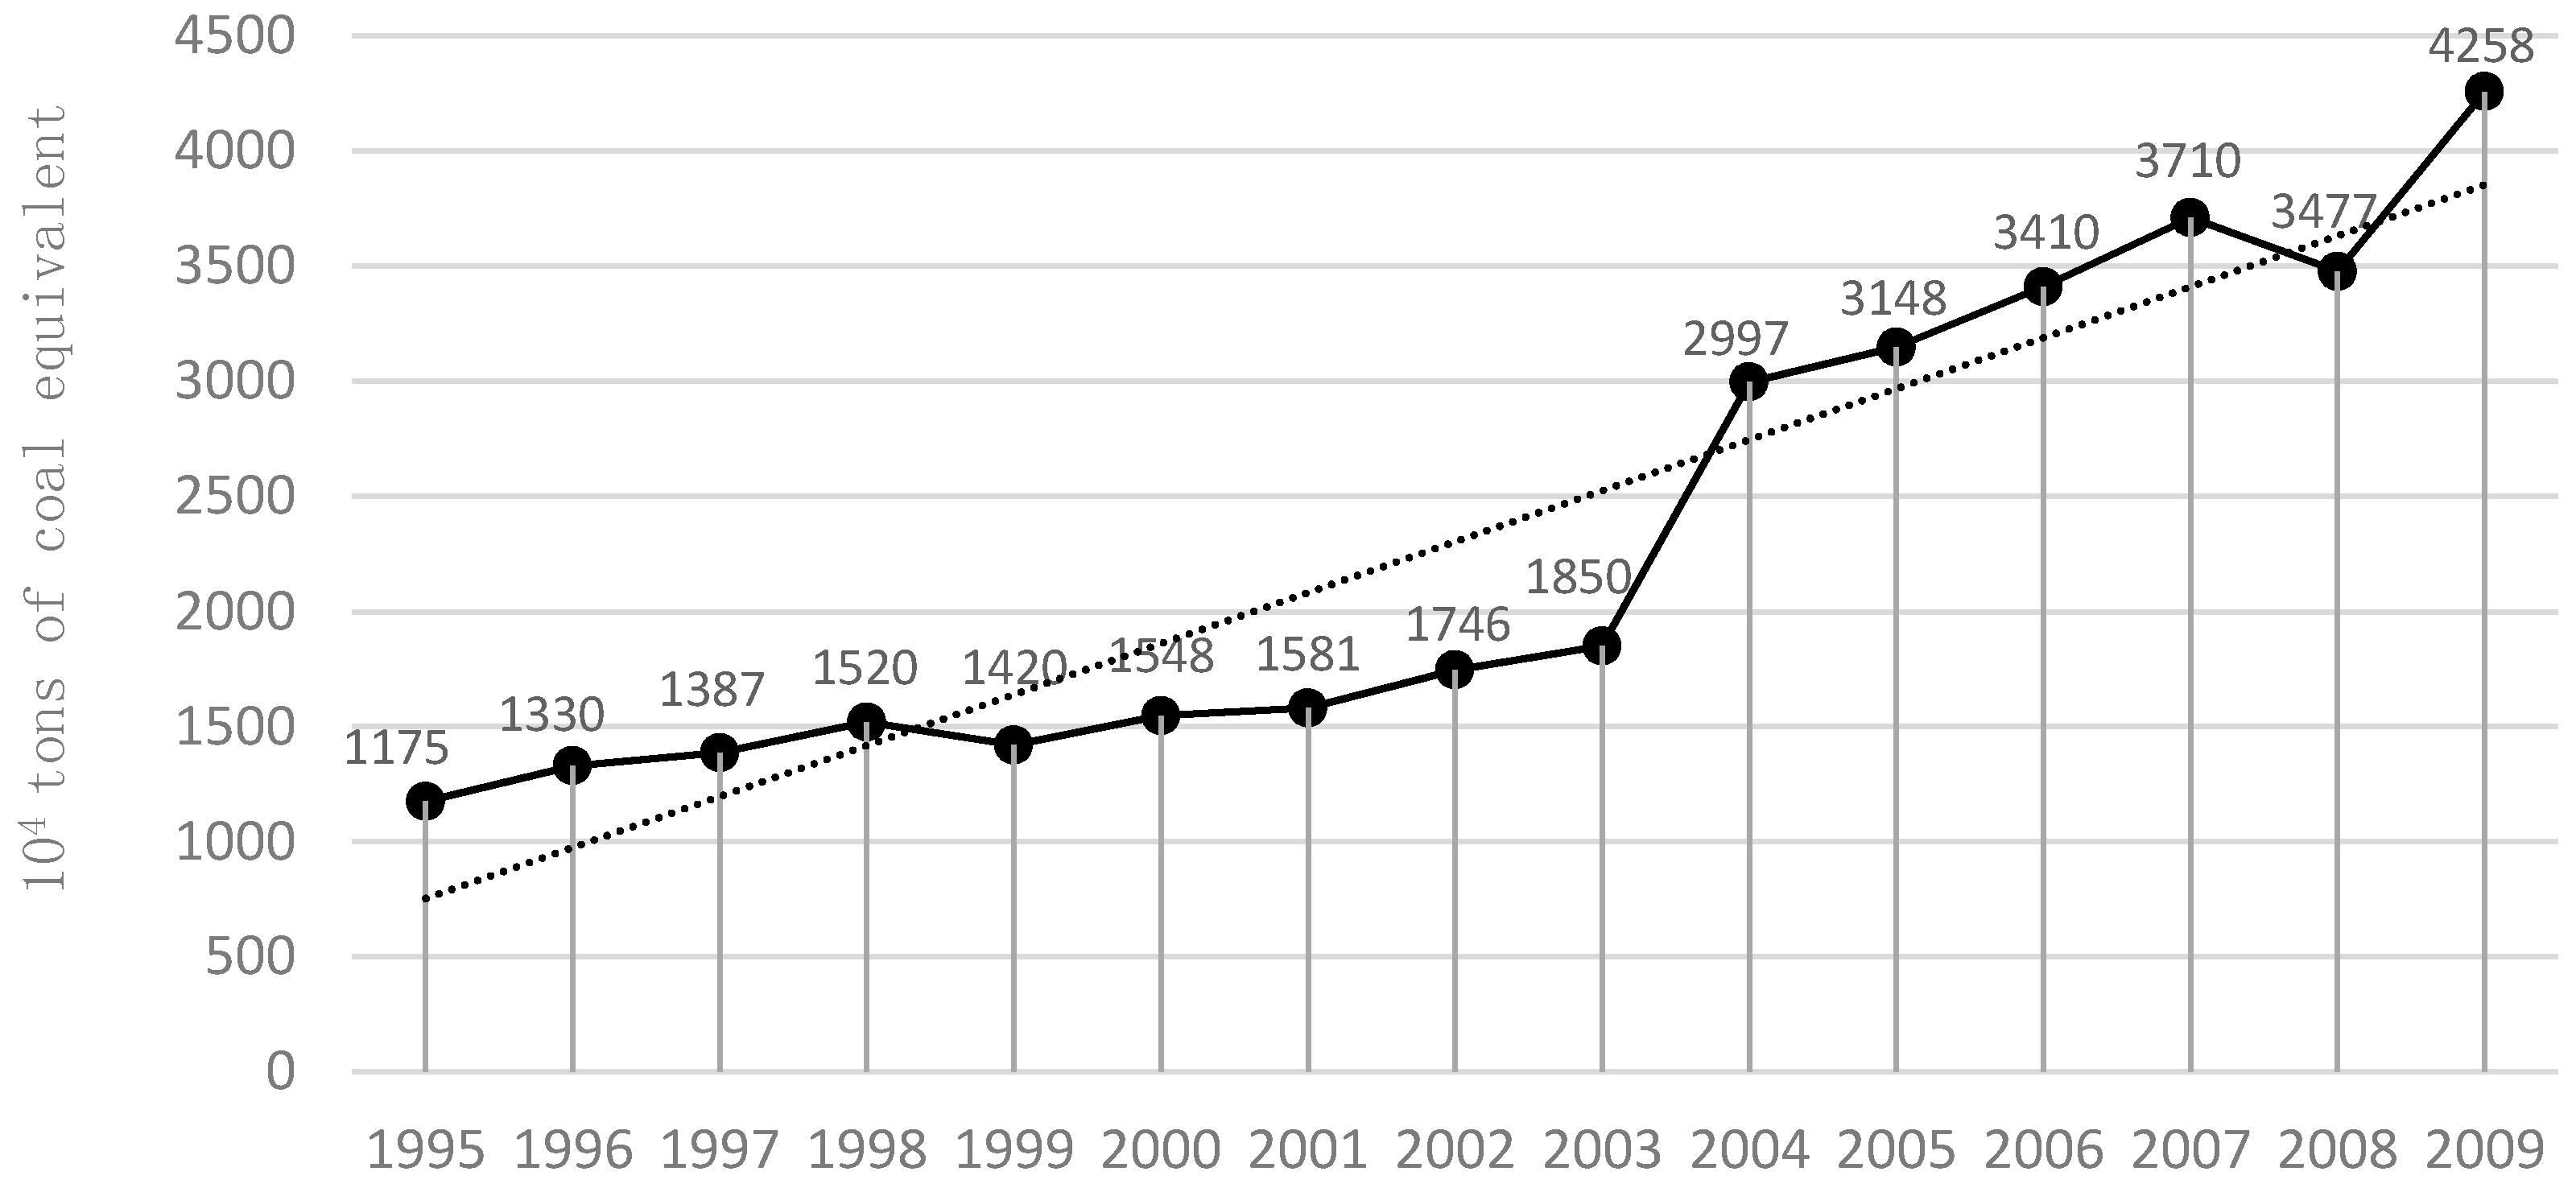
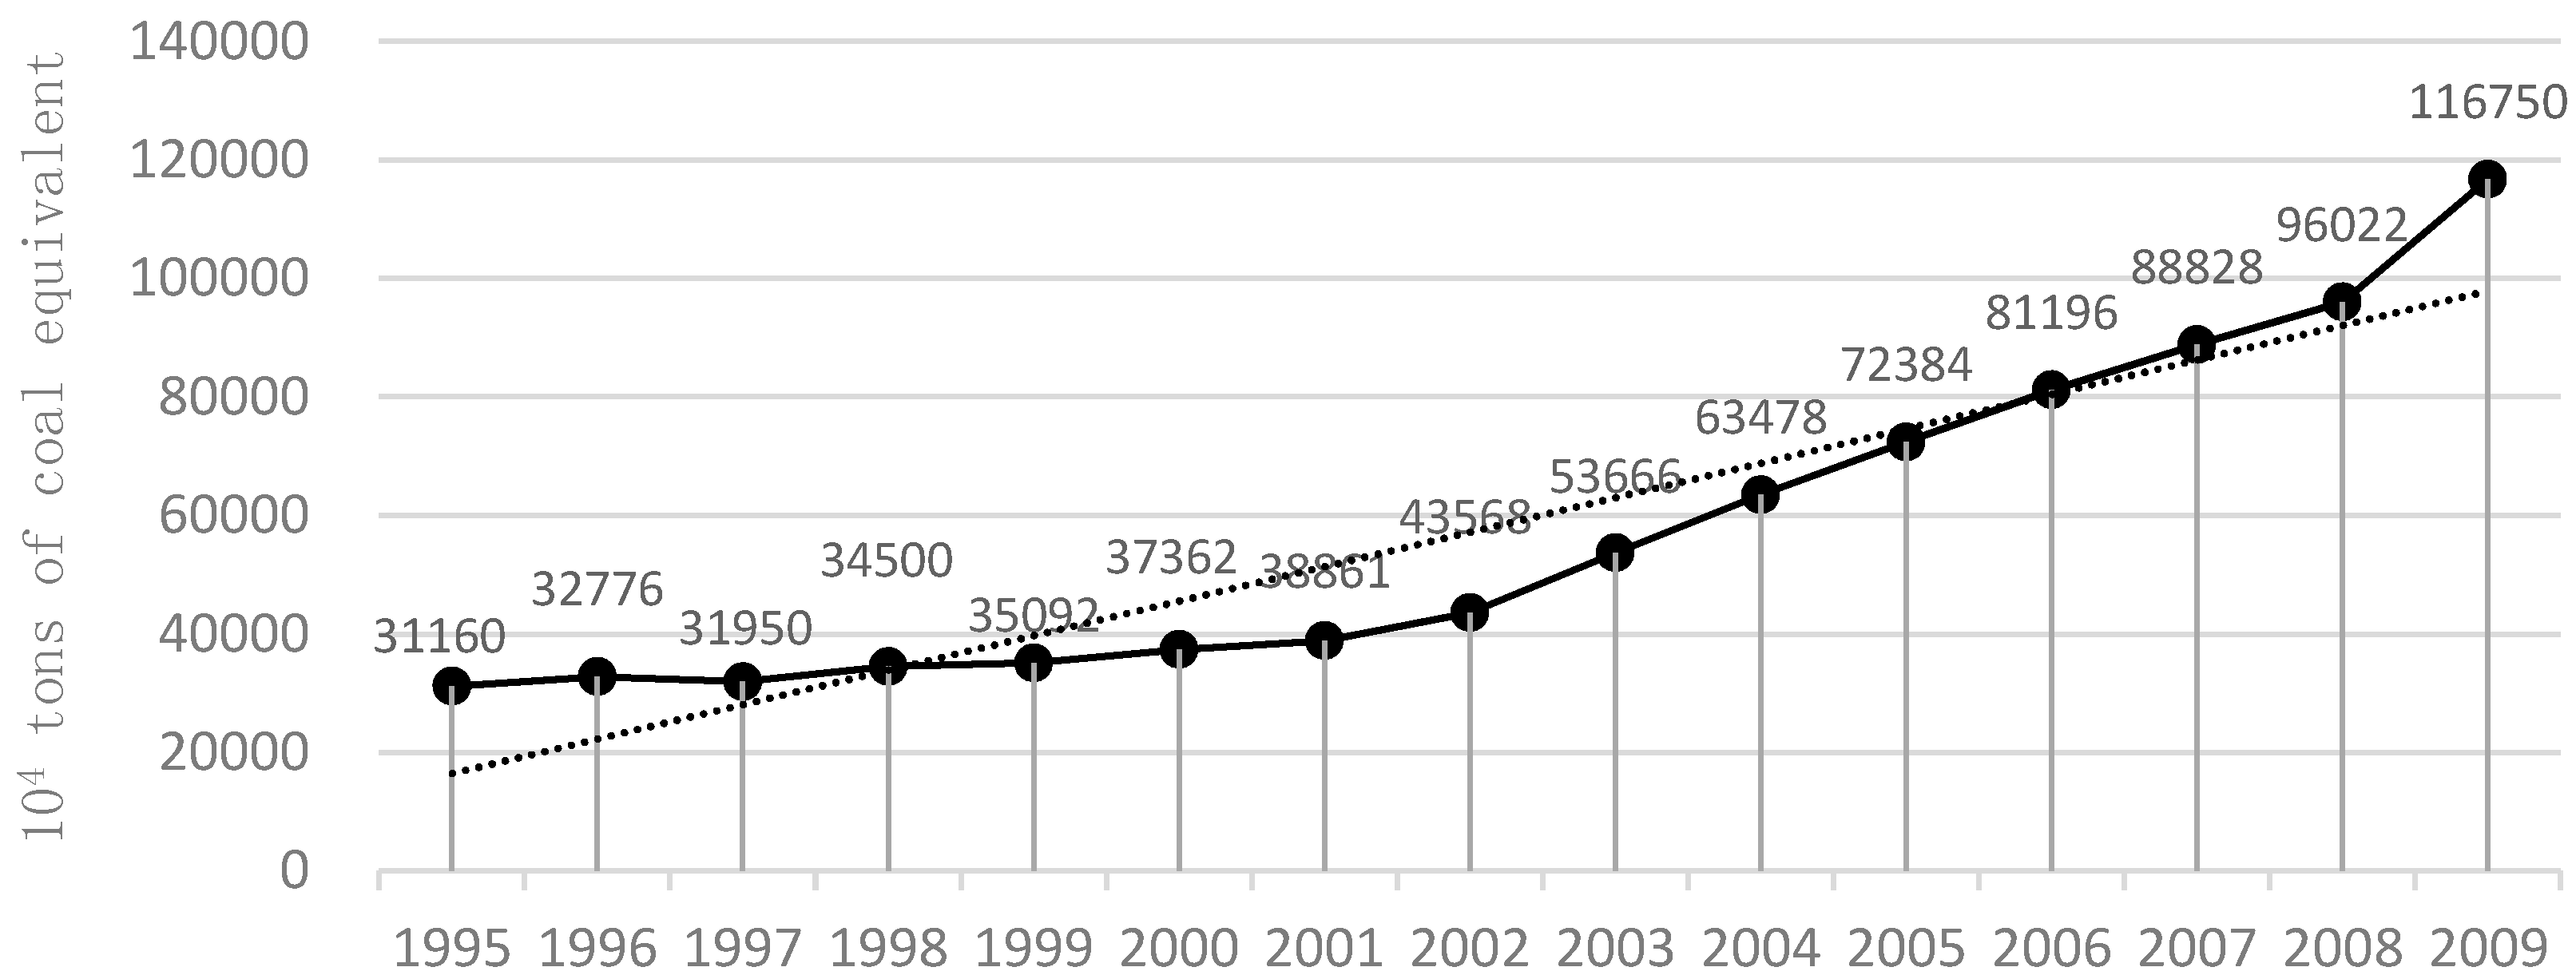
As shown in Figure 3, direct energy consumption of construction industry exceeded by 262.38% from 11.75 million tons of coal equivalent to 42.58 million tons. Particularly, during 2001–2009 the increase reached 26.77 million tons which took up 86.83% of total consumption in study period. The expansion of embodied energy consumption was 274.67%, the value of which was 311.6 million tons of coal equivalent in 1995 and 1167.5 in 2009 (Figure 4). The results show that direct and embodied energy consumption both have been increasing rapidly in study period. In further calculation, we find that embodied energy consumption is about 25 times of direct energy consumption and it was always the largest consumption of all 35 sectors. It proves that the construction industry is a typical demand-driven sector [3]. There is a large amount of energy embodied in construction sector as the life-cycle of its products involve many processing stages and the accumulation of embodied energy is considerable. This result provides evidence supporting [2,3].
3.2. Decomposition Analysis of Embodied Energy Consumption
According to methods above, this study divides embodied energy of final demand into seven parts.
The domestic consumption-based energy embodied in products which were produced and consumed domestically () and in imported products () both have a sharp increase in study period. The growth range of is 275.10% and that of is 307.27%. Because of enormous demand of construction industry, and is the largest of all sectors. It is worth to note that, as is shown in Figure 5 the size of had a rapid expansion after China’s entry into WTO (World Trade Organization). It increased by 776.03 million tons of coal equivalent from 2001 to 2009, which accounts for 90.92% of total increase in study period.
Figure 6 shows embodied energy of exports. It can be clearly seen that energy embodied in both export products manufactured domestically () and import products but not for domestic consumption () had a considerable expansion after China’s entry into WTO. The value of increased by 3.25 times and increased by 3.17 times after China’s entry into WTO. However, as more and more products were exported, we offered more and more “energy service” to foreign countries which led to their reduction of energy consumption.
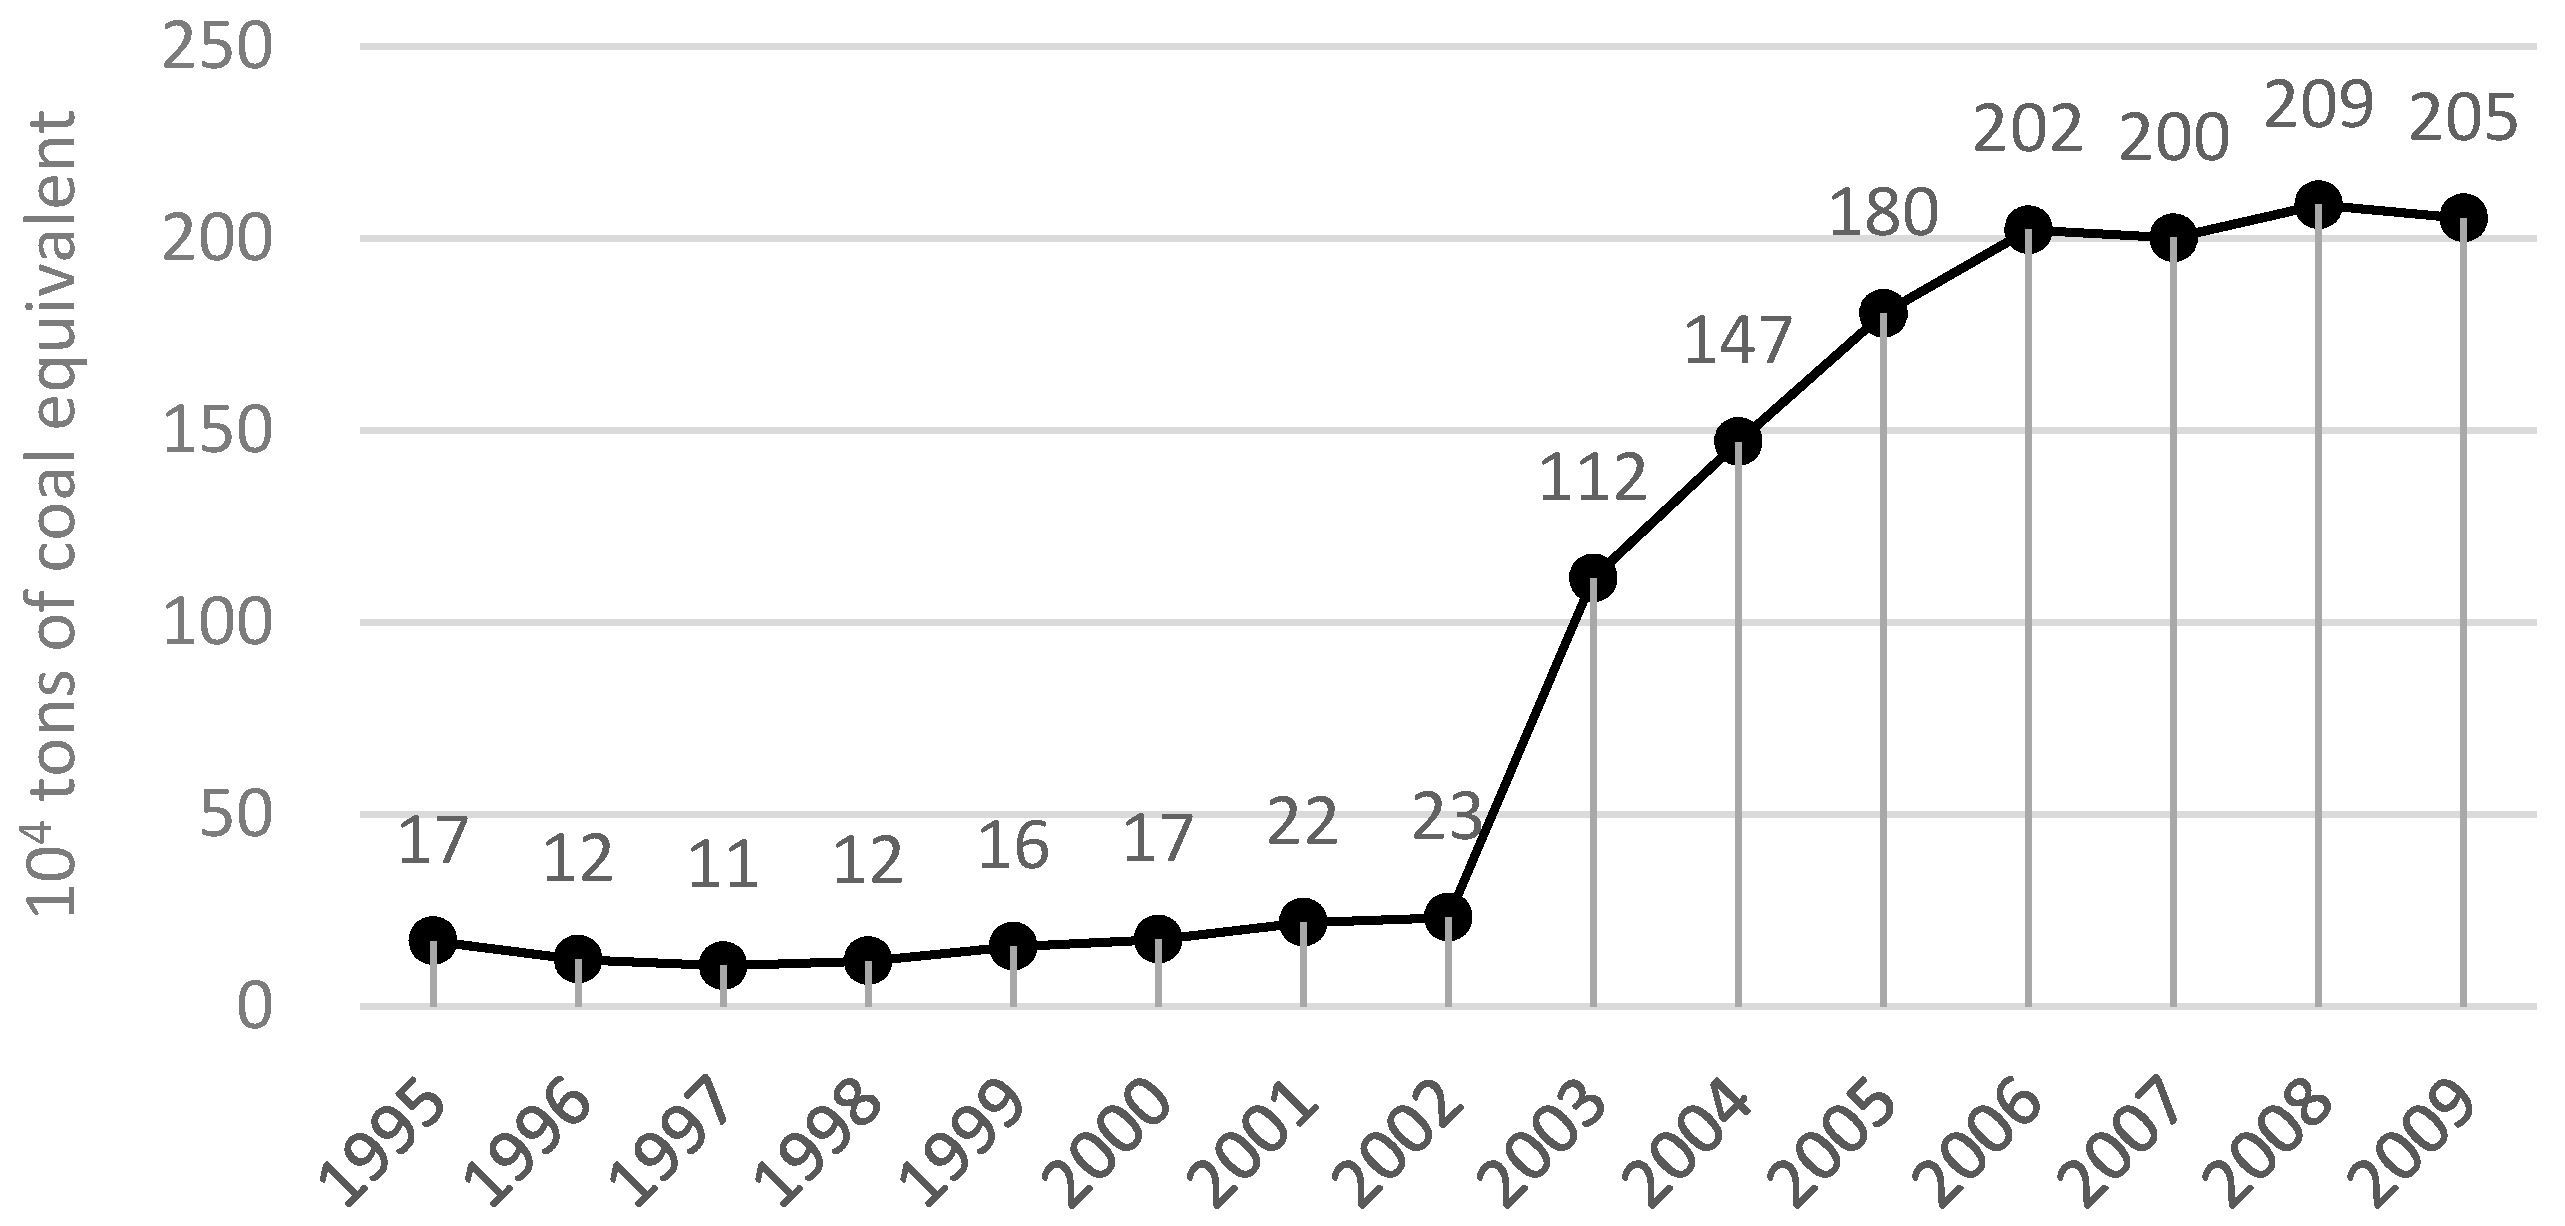
According to preceding text, embodied energy use of imported part includes three kinds of products which are consumed directly at home (), processed and consumed at home () and processed for re-exporting (). Our findings show that the value of had a slight variation around 1.2 million tons of coal equivalent. first showed increase then decrease after China’s entry into WTO. Different from , was increased by a large amount after the entry into WTO. As Figure 7 shows, the value of increased 8.32 times from 2001 to 2009, which indicates China’s construction industry has tended to import more intermediate products to save domestic energy with international trade communication.
3.3. Differences between Embodied Energy of Inputs and Outputs
According to earlier discussion, we have divided products into input form and output form to trace energy consumption footprint of the life-cycle. The imported intermediates are input form while they are transformed into output form after domestic processing. Therefore, the corresponding total energy use of two forms are the same, but embodied energy has been shifted among different sectors.
Total embodied energy of the imported products used by final consumers domestically () includes two kinds of imported products. One is imported for direct consumption (), the other is consumed after domestic processing (). However, the equation holds generally for total energy use. So it may not be appropriate for individual sector. As shown in Table 2, the size of is much larger than in study period, which explains most of energy consumption processes are carried out at home. The value of increased from 22.71 to 74.91. The result shows that as construction industry is closely connected to many other sectors when processing, the development of construction industry drives growth of many industries whereas it also causes larger size of energy use in other sectors, which is against energy saving and emission reduction. Besides, we find that the ratio of and increased from 22.71 to 74.91. It indicates the specialization degree is deepening and processes are increasing with improvement of construction industry and it causes larger amount of intermediates from other sectors [7].
Similarly, the value of total energy use of is the same as that of . They represent energy embodied in re-exported products in input form and output form, respectively. Because there is accumulation of energy when processing, the value of is much larger than in construction industry. But we can see from Table 3 that embodied energy of both input form and output form are rather small. It shows a typical characteristic of construction industry that re-exported products are relatively few, and only take account of less than 0.05% in total embodied energy of construction industry, which is 1411.76 million tons of coal equivalent in 2009. The value of ratio appears to have a downward trend in general. It proves the processing technology of such products has been improving in energy saving.
3.4. Projections
Due to the deepening urbanization, there is still an increasing energy demand of China’s construction industry. Combining with the BAU (business-as-susal) analysis method of Huang B et al. [15] and Grey Forecasting Model GM(1,1) [16], this study estimated values of energy use in 2020. BAU scenario assumes energy consumed in per unit maintains the latest level of study period [17,18,19] and GM(1,1) model uses average growth speed to predict the value of total outputs [20,21,22]. The results are shown in Table 4.
The result shows that maintaining the pace of growth, total output and final demand of China’s construction industry in 2020 will be 3800 billion and 3200 billion dollars respectively. The value of total imports will reach 5.217 billion dollars and total outputs will be 12.197 billion dollars. Under the BAU analysis, China’s construction industry in 2020 will consume 170 million tons of coal equivalent directly and 4.84 billion tons of coal equivalent of embodied energy. In addition, embodied energy of total imports, , will be 6.79 million tons of coal equivalent and that of total outputs, , will reach 15.89 million.
4. Conclusions and Recommendations
Based on non-competitive (import) input–output tables, our study employed the SRIO (Single Region Input-Output) model to evaluate embodied energy use of China’s construction industry from 1995 to 2009, divided final demand into seven parts for numerical computation, and used the BAU analysis method and Grey Forecasting Model GM(1,1) to make forecasts for 2020.
The main conclusions are shown as follows:
- (1)
- The size of construction industry has been continuously expanding from 1995 to 2009 by five times. The construction industry is a typical demand-driven sector, embodied energy consumption of which is about 25 times compared with direct energy consumption. Direct and embodied energy use both were increasing rapidly in study period while direct energy consumption coefficient and embodied energy consumption coefficient appeared to have a downward trend, dropping by 40% and 38.68% respectively. The above results show that the development of construction industry has a significant driving effect on other sectors. Meanwhile, it brings about a growing demand for energy consumption, resulting in immense pressure on the environment.
- (2)
- Construction industry is always a “self-sufficiency” industry because its products are difficult for decomposing and moving. The domestic part accounts for most part of embodied energy, while the proportion of imports and exports is relatively small. We find that the value of energy embodied in both imported intermediates and final products has remarkably increased after China’s entry into WTO in 2001. Increasing imported intermediates and final goods of construction industry is helpful to reduce energy consumption from other sectors in China, which has a positive effect on achieving the energy conservation and emission reduction goal. However, exported products which are produced domestically take account most part of total exports. It implies that China’s construction industry is gradually involved into the global system of division and offers more and more “energy service” to foreign countries with deepening openness.
- (3)
- According to BAU analysis method and Grey Forecasting Model GM(1,1), with the deepening urbanization, total output and final demand of China’s construction industry in 2020 will be 3800 billion and 3200 billion dollars respectively, driving for 170 million tons of coal equivalent direct energy consumption and 4.84 billion tons of coal equivalent of embodied energy. In addition, the value of total imports of construction industry will reach 5.217 billion dollars and total outputs will be 12.197 billion dollars, driving for 6.79 million tons of coal equivalent and 15.89 million embodied primary energy respectively. These results suggest that construction industry, as an important industry of national economy, has significant energy pulling effect for other sectors upstream and downstream. Therefore, it is necessary to balance the rapid growth of construction industry and energy consumption.
Policy implications of this study can be summarized as follows:
- (1)
- Although the improvement of energy-saving technology plays a role in relieving stress of energy use, it is not enough for such a huge energy consumption industry. However, it is very difficult to independently improve energy efficiency by technology innovation as a developing country. Therefore Shui B and Harriss R C [23] suggested the export of developed countries like US technologies and expertise related to clean production and energy efficiency to China would decrease the current trade imbalance, reduce pollution loading and related negative environment impacts in China and improve energy efficiency of the world.
- (2)
- To avoid sacrificing domestic energy resources and being manufacturing factories of developed countries, Chinese government should coordinate imports and exports of construction industry and define responsibility of consumers. But China should not do it blindly because exports remain an important driver of China’s economic growth and play a significant role in expanding political and economic influence now and in the future [24].
- (3)
- Since 2014, China has been actively improving the interconnection with countries of “the Belt and Road (“The Belt and Road” refers to the Silk Road Economic Belt and 21st Century Maritime Silk Road, a significant development strategy launched by the Chinese government with the intention of promoting economic co-operation among countries along the proposed Belt and Road routes. The Initiative was designed to enhance the orderly free-flow of economic factors and the efficient allocation of resources. It is also intended to further market integration and create a regional economic co-operation framework of benefit to all.)”. Construction industry, as the material foundation for cooperation, became the most prior investment area of “the Belt and Road”. The government should especially seize the opportunity of “the Belt and Road” by enhancing cooperation and communication with countries along the road and promoting vigorous “going out” of construction products to drive growth of national economy. On the other hand, it is essential to improve energy saving and emission reducing technologies in construction materials, processes etc. It plays a necessary role in relieving environmental pressure and improving the whole energy efficiency of countries along the road.
Data limitations are always a challenge in empirical studies. For example, the data of IO tables cover from 1995 to 2014, however, the latest available data of energy consumption is in 2009. Therefore, the newest data are needed in future research.
Further study is still being performed. First, the embodied energy use of construction industry in different countries should be considered for comparison. Second, local pollution caused by pollutants like CO2, SO2 should also be considered in further study other than energy use.
Acknowledgments
We would like to express our sincere gratitude to the editor and anonymous referees for their insightful and constructive comments. This work is supported by the National Natural Science Foundation of China (Funding No. 71673230 and 71774071), the Major Program of the National Social Science Foundation of China (grant 13&ZD167), the Fundamental Research Funds for the Central Universities (Funding No. 20720171001, 20720151026 and 20720151039). Especially, we would like to thank the experts who participated in the evaluation and improvement of this manuscript.
Author Contributions
All authors contributed to the model construction. Chuanwang Sun provided the core idea and provided key advice pertaining to the results. Luhang Lin and Yinzi Fan wrote the entire manuscript. Meilian Xu helped check the manuscript and wrote the policy recommendations.
Conflicts of Interest
The authors declare no conflicts of interest.
References
- Chen, S.; Zhang, S. Large-scale land use for construction and energy consumption after the new millennium with their impact on total-factor efficiency change in China’s regional economy. Energies 2014, 7, 1986–2003. [Google Scholar] [CrossRef]
- Chang, Y.; Ries, R.J.; Man, Q.; Wang, Y. Disaggregated IO LCA model for building product chain energy quantification: A case from China. Energy Build. 2014, 72, 212–221. [Google Scholar] [CrossRef]
- Hong, J.; Shen, G.Q.; Guo, S.; Xue, F.; Zheng, W. Energy use embodied in China’s construction industry. Amulti-regional input-output analysis. Renew. Sustain. Energy Rev. 2016, 53, 1303–1312. [Google Scholar]
- Pan, J.; Chen, Y. Carbon budget proposal: A framework for an equitable and sustainable international climate regime. Soc. Sci. China 2009, 5, 83–98. [Google Scholar]
- Guan, J.; Zhang, Z.; Chu, C. Quantification of building embodied energy in China using an input–output-based hybrid LCA model. Energy Build. 2016, 110, 443–452. [Google Scholar] [CrossRef]
- Fridley, D.G. Estimating Total Energy Consumption and Emissions of China’s Commercial and Office Buildings; Lawrence Berkeley National Laboratory: Berkeley, CA, USA, 2008.
- Lin, B.; Sun, C. Evaluating carbon dioxide emissions in international trade of China. Energy Policy 2010, 38, 613–621. [Google Scholar] [CrossRef]
- Li, J.S.; Xia, X.H.; Chen, G.Q.; Alsaedi, A.; Hayat, T. Optimal embodied energy abatement strategy for Beijing economy: Based on a three-scale input-output analysis. Renew. Sustain. Energy Rev. 2016, 53, 1602–1610. [Google Scholar] [CrossRef]
- Guo, S.; Shen, G.; Yang, J.; Sun, B.; Xue, F. Embodied energy of service trading in Hong Kong. Smart Sustain. Built Environ. 2015, 4, 234–248. [Google Scholar] [CrossRef] [Green Version]
- Li, Z.; Pan, L.; Fu, F.; Liu, P.; Ma, L.; Amorelli, A. China’s regional disparities in energy consumption: An input–output analysis. Energy 2014, 78, 426–438. [Google Scholar] [CrossRef]
- Lindner, S.; Guan, D. A Hybrid-Unit Energy Input-Output Model to Evaluate Embodied Energy and Life Cycle Emissions for China’s Economy. J. Ind. Ecol. 2014, 18, 201–211. [Google Scholar] [CrossRef]
- Ying, C.; Jiahua, P.; Laihui, X. Energy Embodied in Goods of International Trade in China: Calculation and Policy Implications. Econ. Res. J. 2008, 7, 3. [Google Scholar] [CrossRef]
- Weber, C.L.; Peters, G.P.; Guan, D.; Hubacek, K. The contribution of Chinese exports to climate change. Energy Policy 2008, 36, 3572–3577. [Google Scholar] [CrossRef]
- Sánchez-Chóliz, J.; Duarte, R. CO2 Emissions Embodied in International Trade: Evidence for Spain. Energy Policy 2004, 32, 1999–2005. [Google Scholar] [CrossRef]
- Huang, B.; Zhao, J.; Geng, Y.; Tian, Y.; Jiang, P. Energy-related GHG emissions of the textile industry in China. Resour. Conserv. Recycl. 2017, 119, 69–77. [Google Scholar] [CrossRef]
- Hsiao, F.S.; Hsiao, M.C.W. FDI, exports and GDP in east and southeast Asia-panel data versus time series causality analyses. J. Asian Econ. 2006, 17, 1082–1106. [Google Scholar] [CrossRef]
- Mallah, S.; Bansal, N.K. Allocation of energy resources for power generation in India: Business as usual and energy efficiency. Energy Policy 2010, 38, 1059–1066. [Google Scholar] [CrossRef]
- Lin, Q.G.; Huang, G.H. A dynamic inexact energy systems planning model for supporting greenhouse-gas emission management and sustainable renewable energy development under uncertainty—A case study for the City of Waterloo, Canada. Renew. Sustain. Energy Rev. 2009, 13, 1836–1853. [Google Scholar] [CrossRef]
- Jun, S.; Lee, S.; Park, J.W.; Jeong, S.J.; Shin, H.C. The assessment of renewable energy planning on CO2, abatement in South Korea. Renew. Energy 2010, 35, 471–477. [Google Scholar] [CrossRef]
- Lin, C.S.; Liou, F.M.; Huang, C.P. Grey forecasting model for CO emissions: A Taiwan study. Appl. Energy 2011, 88, 3816–3820. [Google Scholar] [CrossRef]
- Bao, G.L.; Hui, H.Q. Grey Forecasting Model for CO2 Emissions. Adv. Mater. Res. 2012, 518–523, 1664–1668. [Google Scholar] [CrossRef]
- Xie, N.M.; Yuan, C.Q.; Yang, Y.J. Forecasting China’s energy demand and self-sufficiency rate by grey forecasting model and Markov model. Int. J. Electr. Power Energy Syst. 2015, 66, 1–8. [Google Scholar] [CrossRef]
- Shui, B.; Harriss, R.C. The role of CO2 embodiment in US–China trade. Energy Policy 2006, 34, 4063–4068. [Google Scholar] [CrossRef]
- Zhang, Y. Carbon Contents of the Chinese Trade and Their Determinants: An Analysis Based on Non-competitive (Import) Input-Output Tables. China Econ. Q. 2010, 9, 1287–1310. [Google Scholar]
Figure 1.
Direct energy consumption coefficient .

Figure 2.
Embodied energy consumption coefficient .
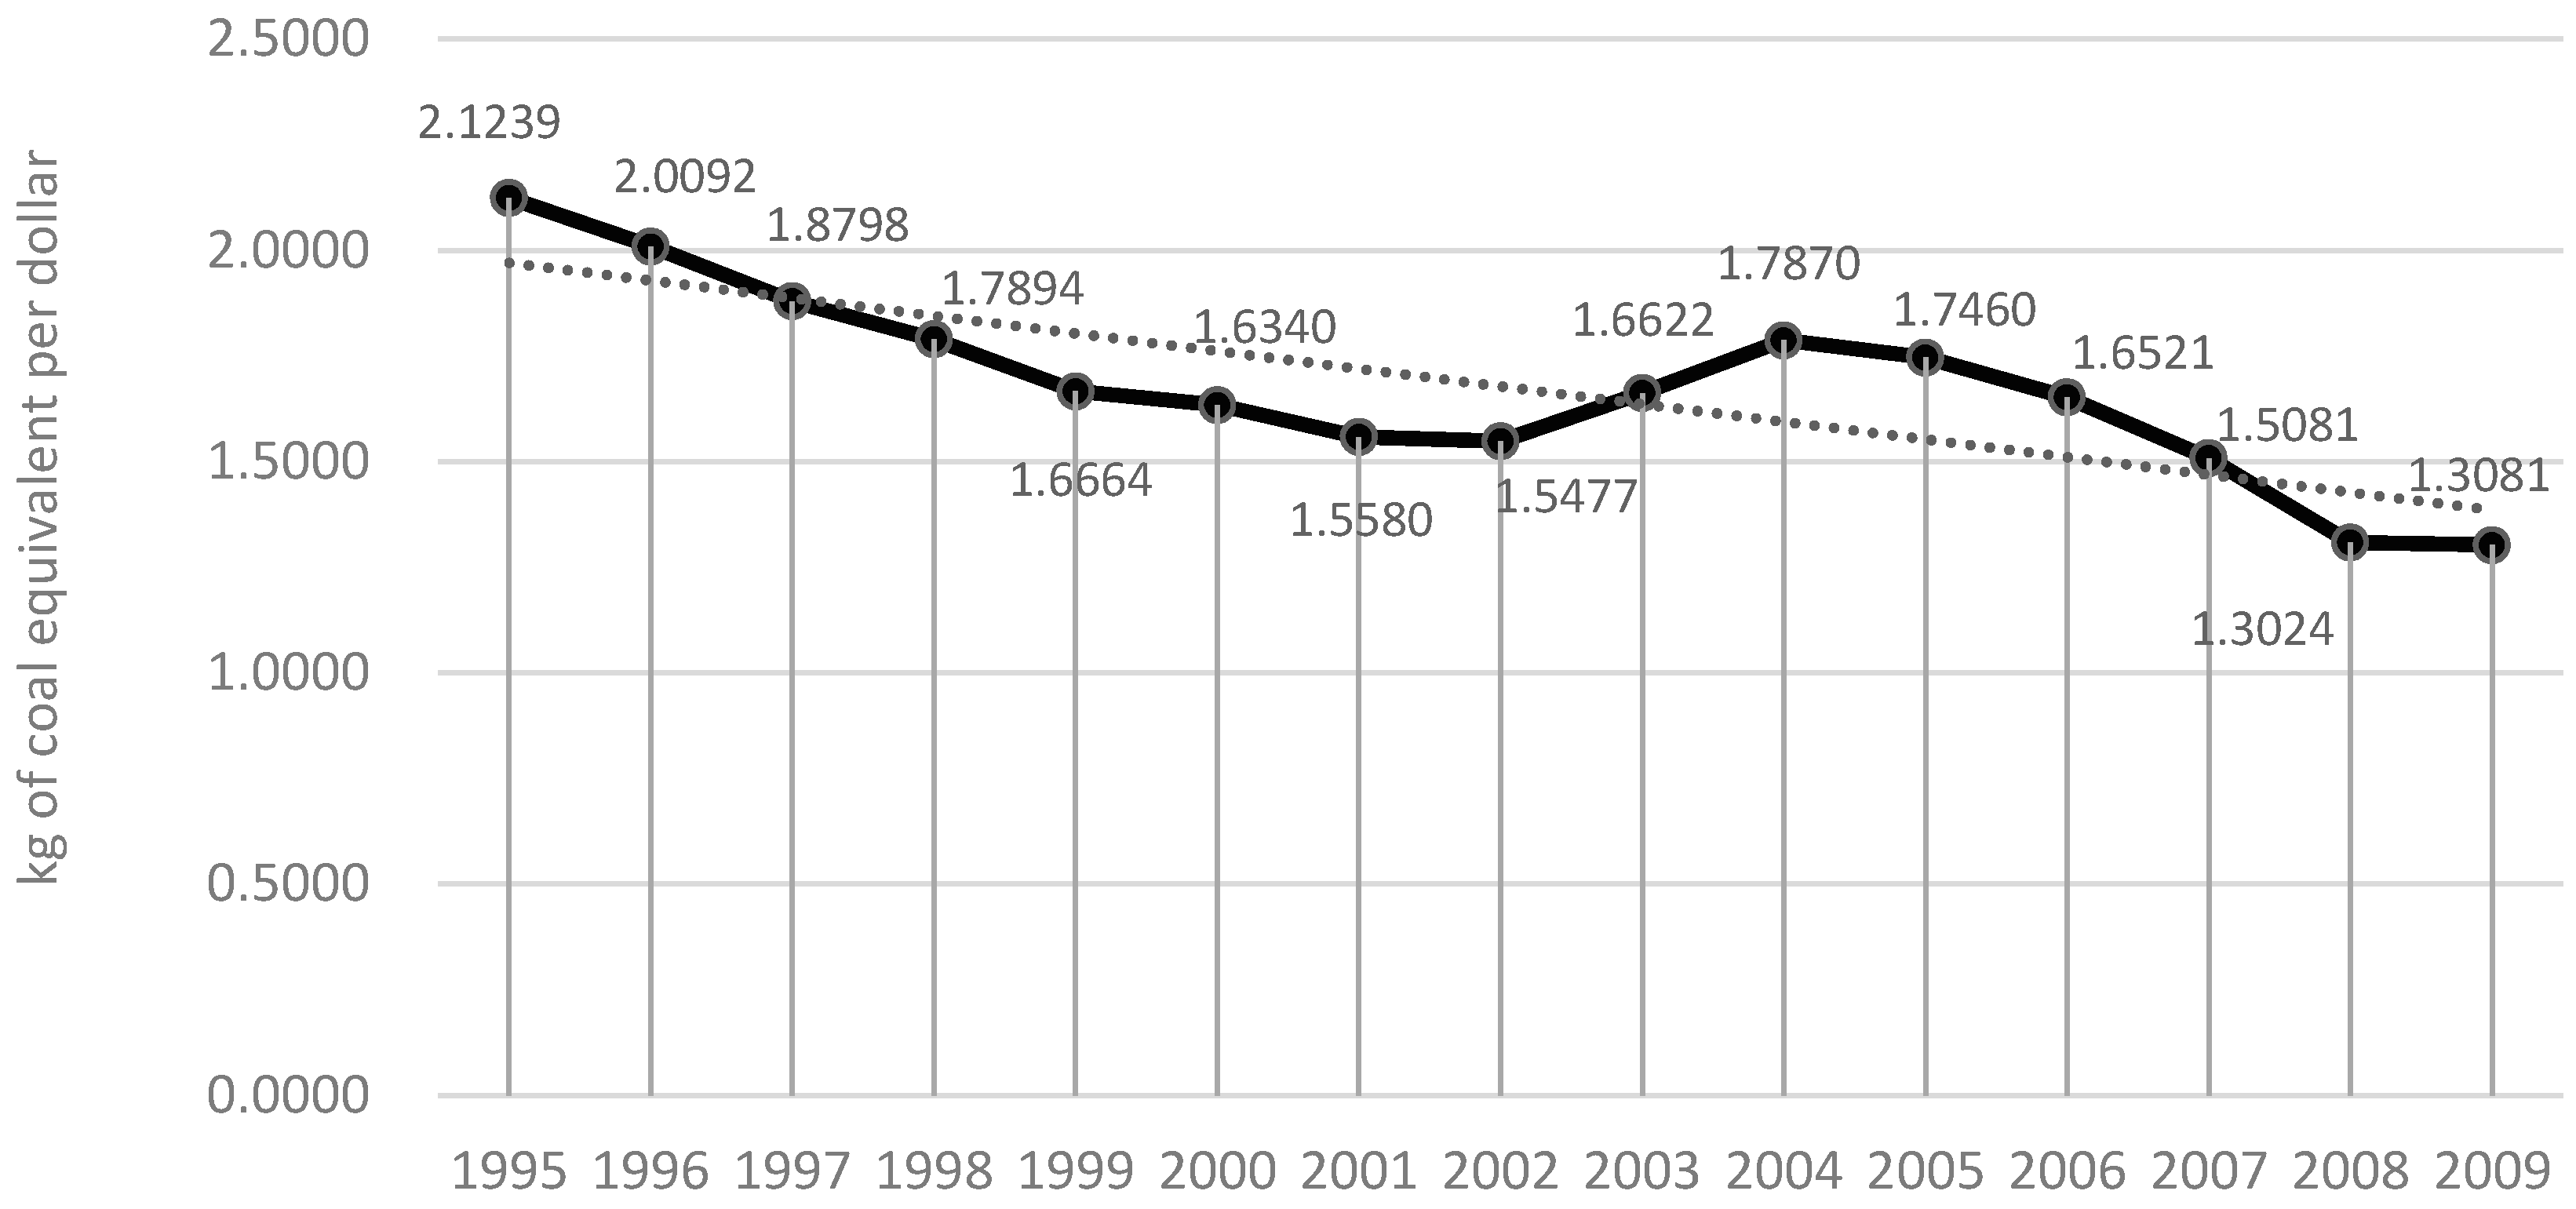
Figure 3.
Direct energy consumption of construction industry.

Figure 4.
Embodied energy consumption of construction industry.

Figure 5.
Embodied energy of .
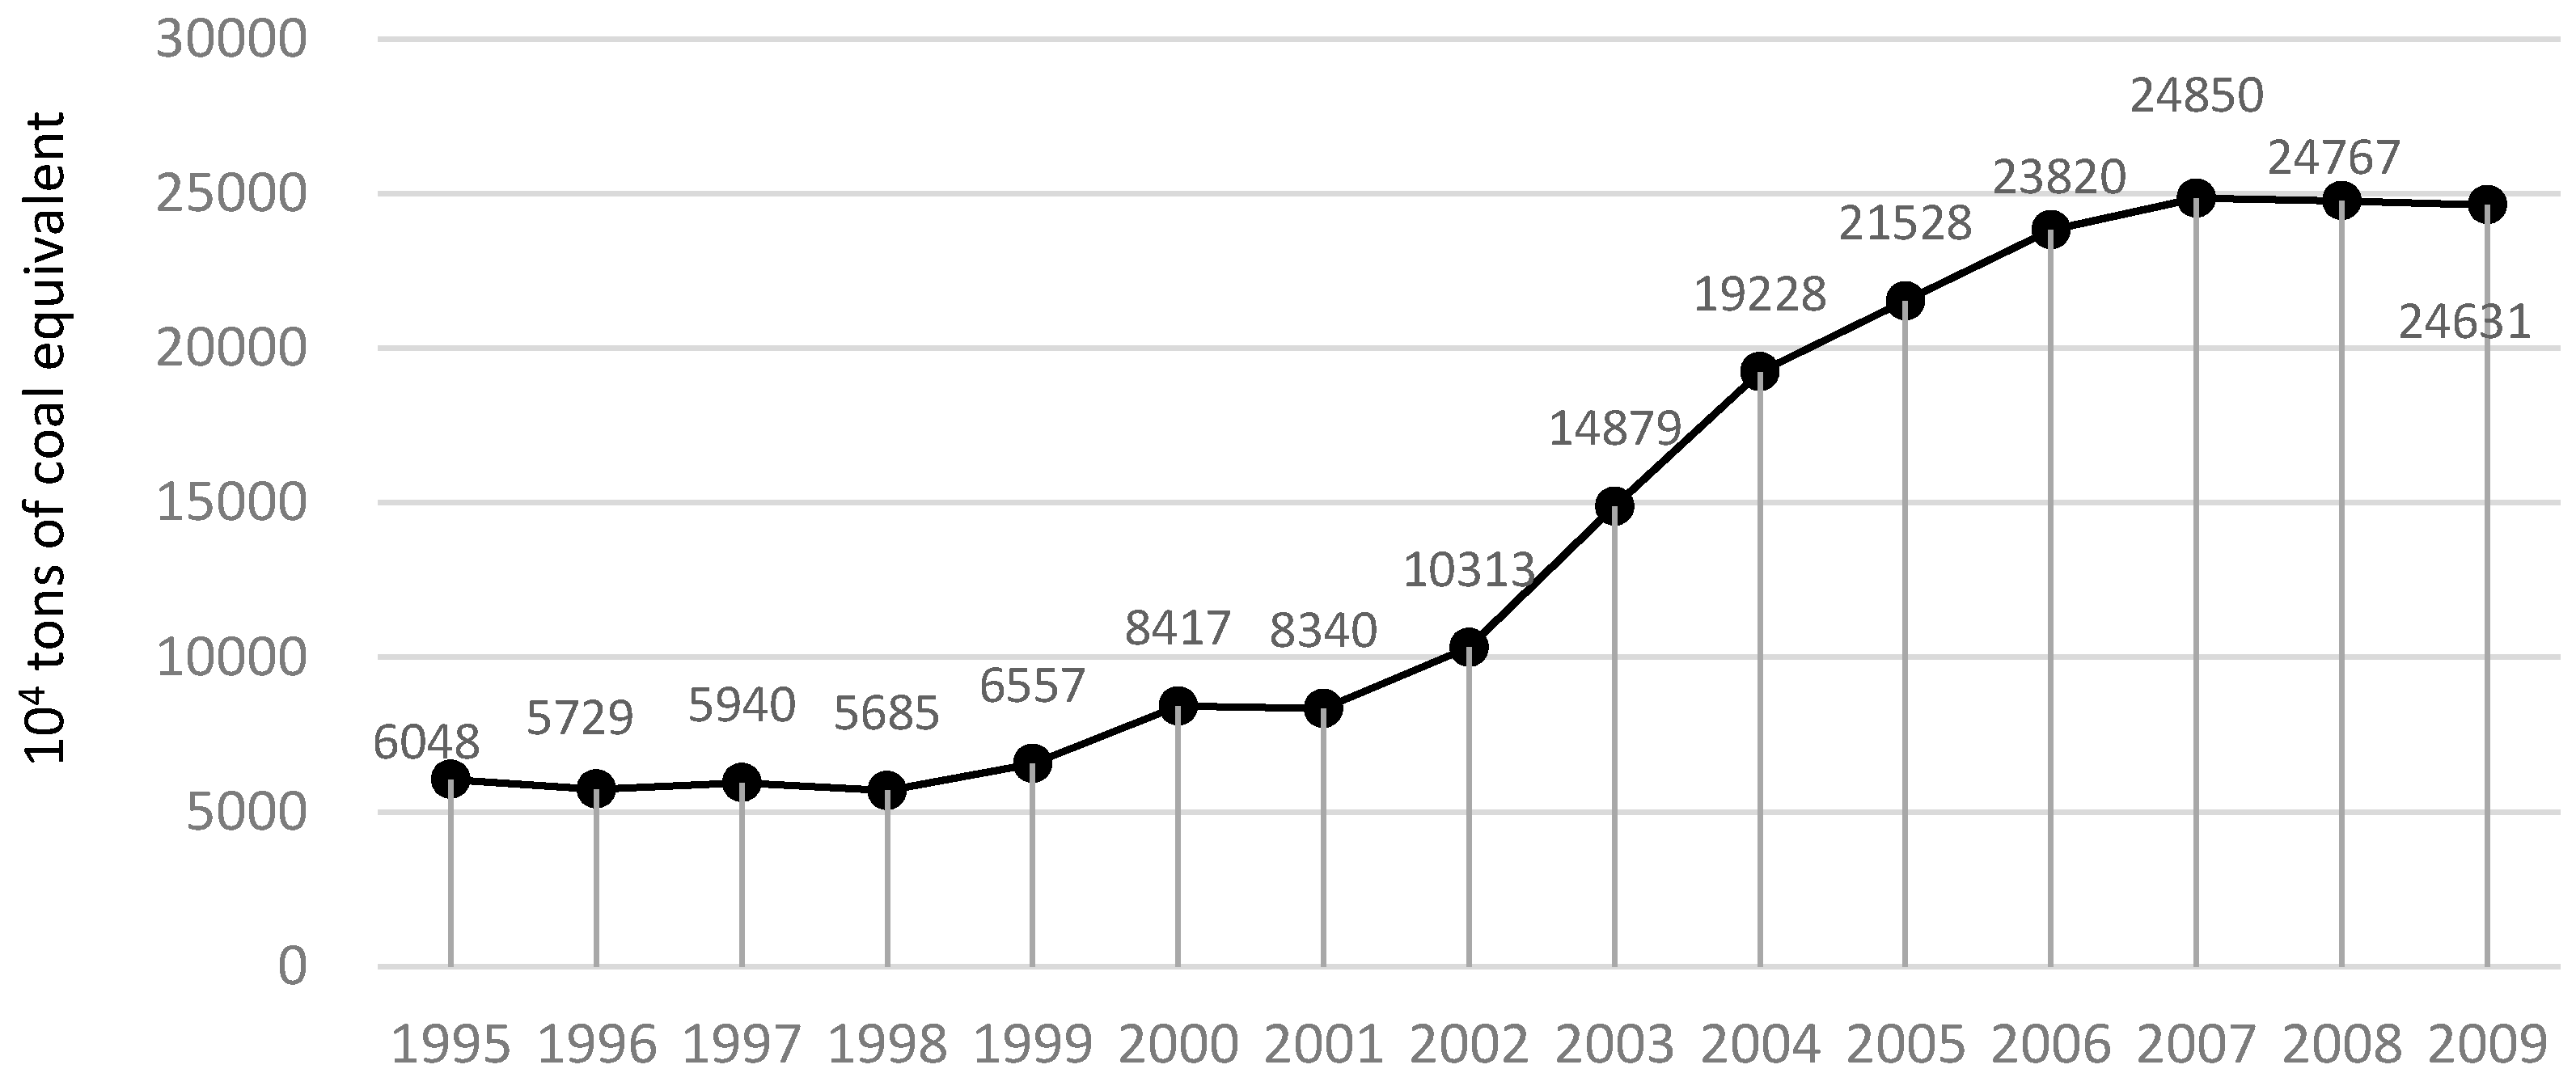
Figure 6.
Embodied energy of and .
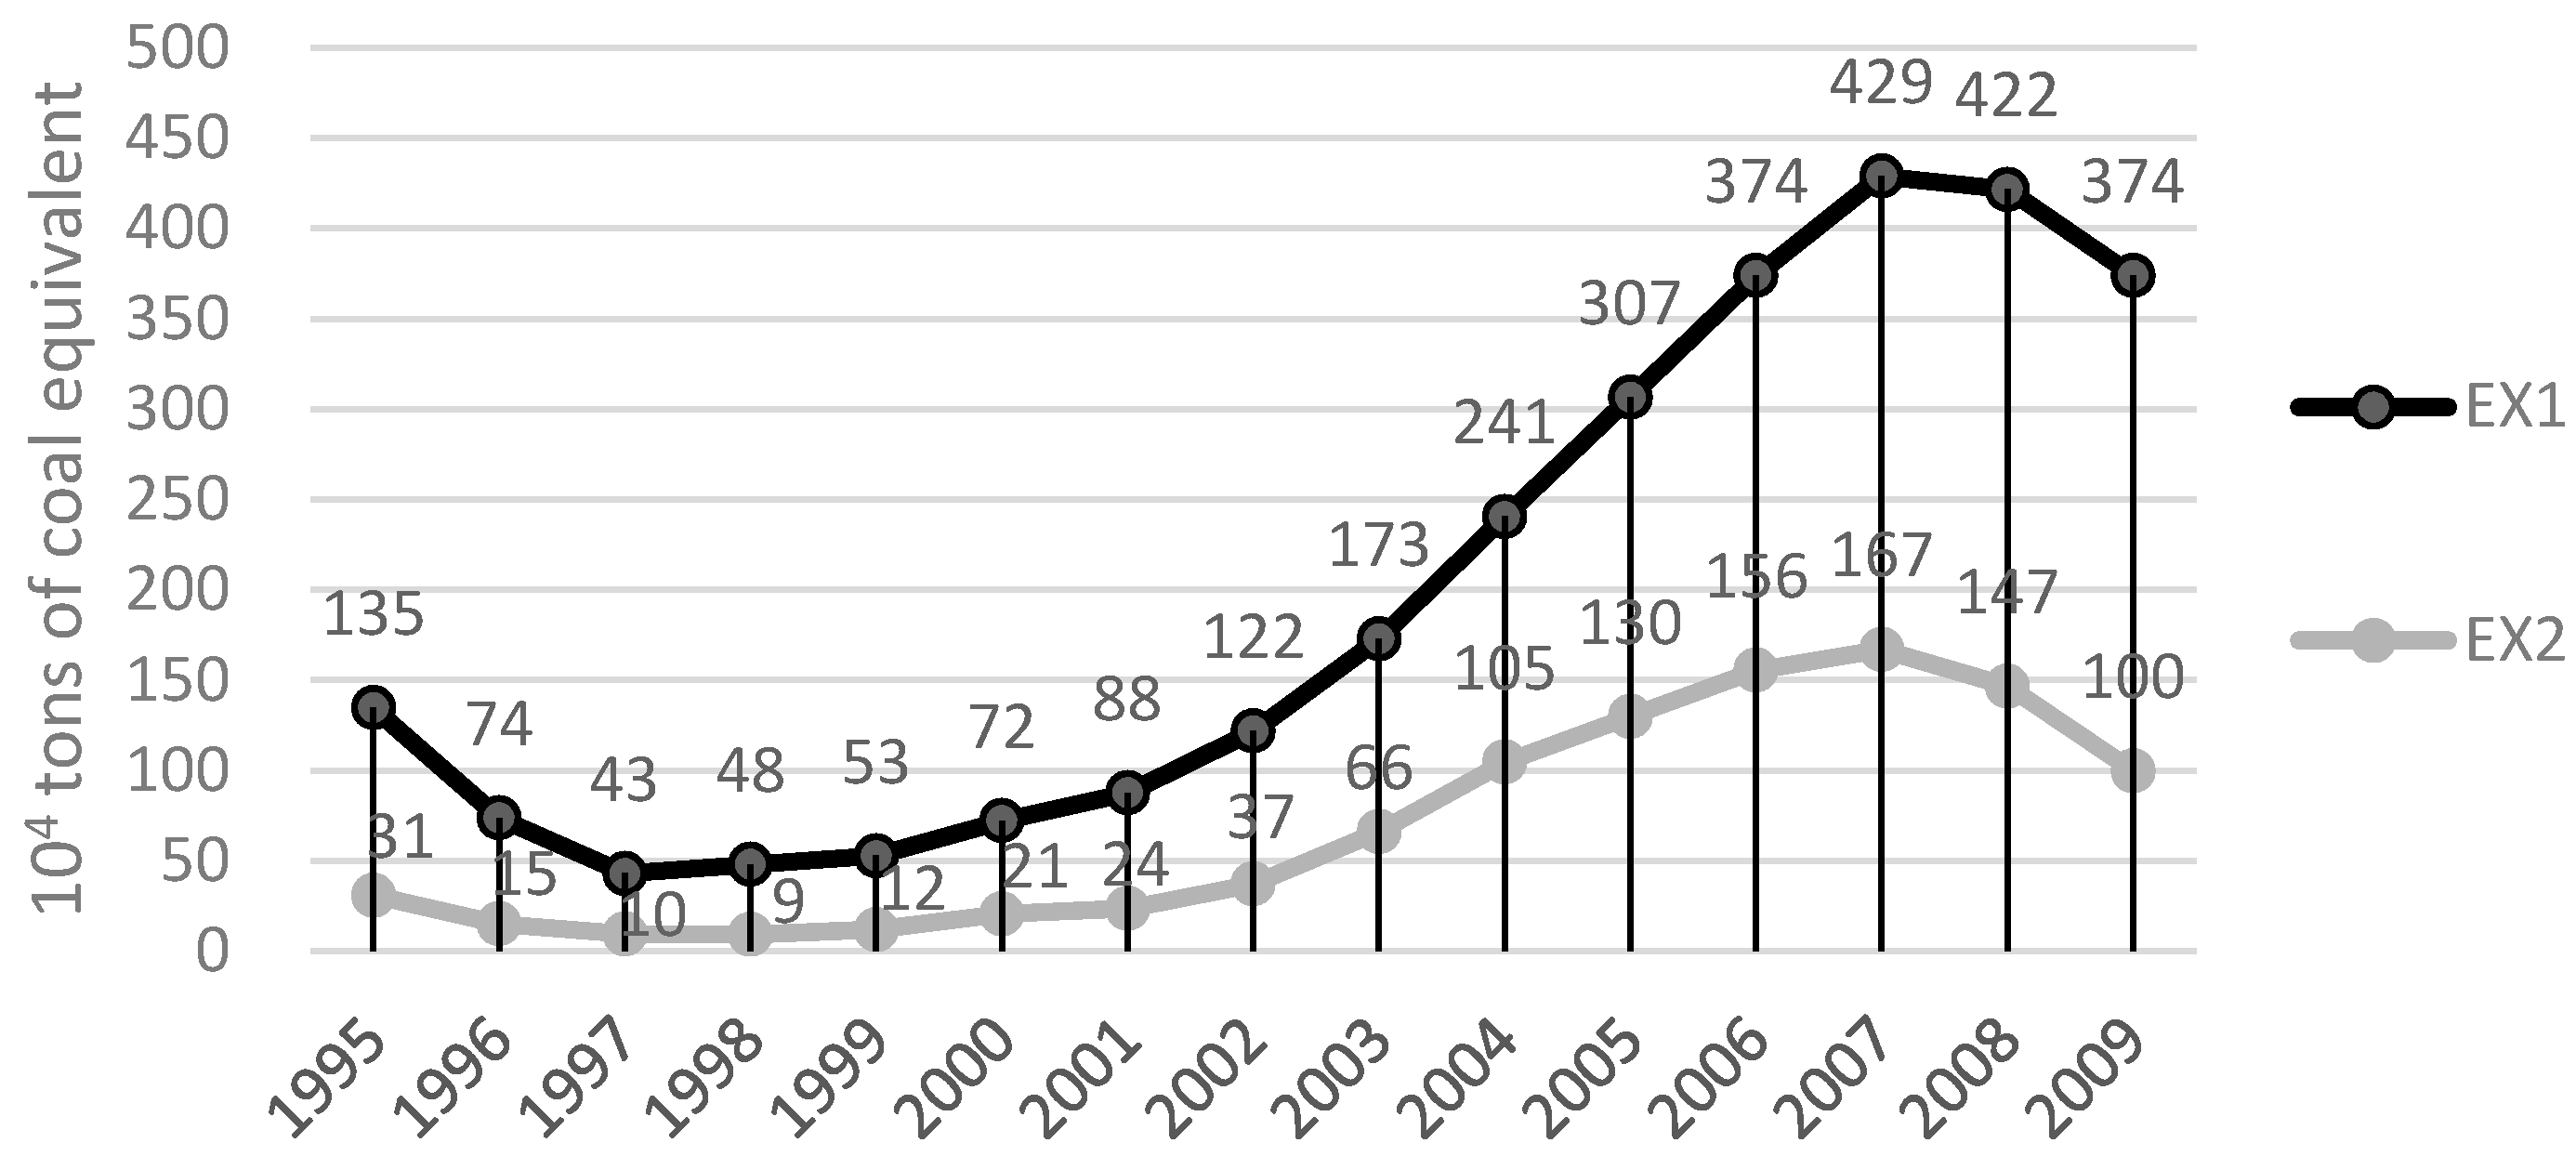
Figure 7.
Embodied energy of .


Table 1.
Explanations for seven parts.
| embodied energy in products which are produced and consumed domestically | ||
| embodied energy in products which are imported and consumed domestically | ||
| embodied energy in exported products which are manufactured domestically | ||
| embodied energy in imported products which are not for domestic consumption | ||
| embodied energy in imported products which are for direct consumption | ||
| embodied energy in imported products which are consumed after domestic processing | ||
| embodied energy in imported products which are processed for re-exporting |
Table 2.
Comparison between and .
| 1995 | 1997 | 1999 | 2001 | 2003 | 2005 | 2007 | 2009 | |
|---|---|---|---|---|---|---|---|---|
| D2 (104 tons of coal equivalent) | 6048 | 5940 | 6557 | 8340 | 14,879 | 21,528 | 24,850 | 24,631 |
| IM1 + IM2 (104 tons of coal equivalent) | 266 | 107 | 117 | 137 | 184 | 292 | 315 | 329 |
| D2/(IM1 + IM2) | 22.71 | 55.44 | 55.95 | 60.71 | 80.66 | 73.78 | 78.79 | 74.91 |
Table 3.
Comparison between and .
| 1995 | 1997 | 1999 | 2001 | 2003 | 2005 | 2007 | 2009 | |
|---|---|---|---|---|---|---|---|---|
| EX2 (104 tons of coal equivalent) | 31 | 10 | 12 | 24 | 66 | 130 | 167 | 100 |
| IM3 (104 tons of coal equivalent) | 4 | 2 | 4 | 8 | 29 | 53 | 57 | 37 |
| EX2/IM3 | 7.38 | 3.95 | 3.04 | 3.11 | 2.25 | 2.47 | 2.93 | 2.73 |
Table 4.
Projections for energy consumption in 2020.
| 1995 | 2009 | 2020 | |
|---|---|---|---|
| (kg of coal equivalent per dollar) | 0.077 | 0.046 | 0.046 |
| (kg of coal equivalent per dollar) | 2.124 | 1.302 | 1.302 |
| (kg of coal equivalent per dollar) | 0.397 | 0.275 | 0.275 |
| (billions of dollars) | 153.567 | 926.822 | 3805.416 |
| (billions of dollars) | 146.716 | 896.431 | 3716.370 |
| (billions of dollars) | 1.274 | 2.805 | 5.217 |
| (billions of dollars) | 0.780 | 3.639 | 12.197 |
| (billions of dollars) | 1.174 | 0.948 | 0.801 |
| (104 tons of coal equivalent) | 1175 | 4258 | 17483 |
| (104 tons of coal equivalent) | 31,160 | 116,750 | 484,014 |
| (104 tons of coal equivalent) | 31,026 | 116,376 | 482,760 |
| (104 tons of coal equivalent) | 6048 | 24,631 | 101,787 |
| (104 tons of coal equivalent) | 135 | 374 | 1254 |
| (104 tons of coal equivalent) | 31 | 100 | 335 |
| (104 tons of coal equivalent) | 249 | 123 | 104 |
| (104 tons of coal equivalent) | 17 | 205 | 688 |
| (104 tons of coal equivalent) | 4 | 37 | −113 |
© 2017 by the authors. Licensee MDPI, Basel, Switzerland. This article is an open access article distributed under the terms and conditions of the Creative Commons Attribution (CC BY) license (http://creativecommons.org/licenses/by/4.0/).
Share and Cite
MDPI and ACS Style
Lin, L.; Fan, Y.; Xu, M.; Sun, C. A Decomposition Analysis of Embodied Energy Consumption in China’s Construction Industry. Sustainability 2017, 9, 1583. https://doi.org/10.3390/su9091583
AMA Style
Lin L, Fan Y, Xu M, Sun C. A Decomposition Analysis of Embodied Energy Consumption in China’s Construction Industry. Sustainability. 2017; 9(9):1583. https://doi.org/10.3390/su9091583
Chicago/Turabian StyleLin, Luhang, Yinzi Fan, Meilian Xu, and Chuanwang Sun. 2017. "A Decomposition Analysis of Embodied Energy Consumption in China’s Construction Industry" Sustainability 9, no. 9: 1583. https://doi.org/10.3390/su9091583
Note that from the first issue of 2016, this journal uses article numbers instead of page numbers. See further details here.