Modeling the Impact of Short-Term and Long-Term Determinants of European Health Systems’ Performance: A Panel Data Approach


Faculty of Management, The Bucharest University of Economic Studies, Piata Romana 6, 010374 Bucharest, Romania
*
Author to whom correspondence should be addressed.
Sustainability 2017, 9(9), 1595; https://doi.org/10.3390/su9091595
Submission received: 20 June 2017
/
Revised: 26 August 2017
/
Accepted: 5 September 2017
/
Published: 7 September 2017
Abstract
:The purpose of this paper is to provide empirical evidence to help health systems’ policy makers within European countries in making the most appropriate decisions to maintain and improve the health of the people they serve. For this purpose, we have analyzed secondary data provided by the annual reports of the Euro Health Consumer Index, which ranks European countries in terms of their health systems’ ability to serve the needs of healthcare consumers. We consider both the short-run and long-run approach in determining the influence of Patient rights and information, Accessibility, Prevention, Range and reach of services, and Pharmaceuticals on Outcomes. By means of a panel data analysis, we capture the influences not only in a single point of time, but in a time span of five years (2012–2016). The main findings suggest that pharmaceuticals and range and reach of services are positively associated with improving immediate outcomes, while for sustainable results, efforts should be directed to prevention programs and means of accessibility improvement.
1. Introduction and Background
It is a common belief that health is the most precious asset of a person, and, by extension, of a nation. People’s health is also a precondition for economic prosperity, influencing economic outcomes in terms of labor supply, productivity, human capital, and public spending [1]. Healthcare systems of all European countries face major challenges such an ageing population, increasing healthcare needs, and increased costs of new and often expensive treatments [2]. In the actual socioeconomic context, health systems are also faced with the shift of roles in the healthcare market, from the central role that doctors and the quality of medical care have long held, to a patient-centered process, directed to the identification and satisfaction of their needs.
Despite the near-universal coverage of health insurance among European countries, and the undisputed efforts of national health systems, there are still major health inequalities across countries and regions, as well as across socioeconomic groups [2]. Moreover, there are large differences in health outcome between countries with similar levels of economic development. Most of those differences may be explained by differences in health systems’ performance [3]. In this context, improving the healthcare systems’ performance is a priority on the international agenda and the central goal of healthcare reform [4,5].
According to Murray and Frank [3], the performance of health systems should be evaluated in relation to three fundamental goals: (1) improving health, translated in increased health status and reduced health inequalities; (2) enhancing responsiveness to people’s expectations, which means respect for individuals and orientation towards the client; and (3) assuring the fairness of financial contribution.
Therefore, is major responsibility and a difficult task of healthcare policy makers and administrators to design more patient-centered health systems [4], identify and operationalize the most effective and efficient means able to meet patients’ needs and expectations, and improve the health status of the population.
The issue of the most appropriate combination of inputs able to determine an increase in the output of health systems has been widely debated over time and, so far, remains without a definite answer. European governments need tools to monitor and evaluate the functioning and performance of their health systems on a routine basis, in order to identify factors of influence and allow for more informed decisions on systems policies, funding, and organization that will achieve better results [3,6].
Considering the above, the purpose of this paper is to provide empirical evidence to help health systems’ policy makers within European countries in making the most appropriate decisions to maintain and improve the health of the people they serve. Given the above, we address four research questions, by whose answers we hope to bring empirical evidence to help identify the best combination of inputs that are able to determine an increase in the healthcare systems’ outcomes.
- How do we stand?
- What is important in the short-run?
- What is important in the long-run?
2. Assessing the Performance of Healthcare Systems from the Patient Point of View
Despite the inherent methodological limitations involved in such approach, mainly due to sociocultural differences between involved countries, differences between existing health system models, and the different ways in which each of them has felt the effects and responded to economic crisis, the comparison provided by cross-country patient satisfaction surveys may provide valuable input and examples of “good practice” in improving national health systems’ performance [7,8]. Patients’ experience may provide feedback on the pulse of the healthcare systems, in terms of accessibility, affordability, clinical safety, effectiveness, and perceived clinical outcome [8].
One of the most comprehensive assessments of European health systems’ performance is the annual reports of the Euro Health Consumer Index (EHCI), which, by means of a limited number of indicators within a definite number of evaluation areas assessed, ranks European countries in terms of their health systems’ ability to serve the needs of healthcare consumers [9]. EHCI serves to monitor the healthcare systems in 36 European countries, comparing the healthcare key values, taking the patient and consumer point of view, and seeking to improve the understanding of European healthcare, to empower patients and, ultimately, to help address weaknesses [10]. There are also several studies which, based on EHCI data, analyze the overall performance of health systems, or the relationship of the EHCI score with other indices and macroeconomic indicators.
Iacobuță [4], analyzing 2009 data from 27 European countries, noticed major differences among healthcare systems’ performance from a consumer point of view, reflected by the overall EHCI scores. Another finding of the study was the high correlation (r = 0.790) between the EHCI score and the positive evaluations for the overall quality of healthcare, provided by Special Eurobarometer 327 (Patient safety and quality of healthcare). There were also high correlations between the EHCI score and the Corruption Perception Index 2009, as well as several macroeconomic indicators measuring health expenditure.
Gonçalves [11] was interested in explaining the differences of health systems’ performance observed in EHCI ranking, by mean of PLS (Partial Least Squares) modeling. Thus, national data, such healthcare expenditure, human resources, and physical resources were considered as input variables in the PLS model, while the performance of the national health system (output) was measured by the EHCI index. The estimation results confirmed that investment in health and physical resources have a positive influence on health systems’ performance. However, the path coefficient between human resources and performance was negative. This would mean that those countries that provide more health professionals are not those that deliver the best overall performance.
Moreover, previous research by our group [12] focused on identifying the factors that may contribute to increase the outcomes of health systems and on the possible links between the quality of health services and the general level of development of the society, the competitiveness, and the corruption in each of the countries included in the analysis. The obtained results confirmed that Patient rights and information, Range and reach of services, Prevention, and Pharmaceuticals have a positive influence on Outcomes, while Accessibility/Waiting time for treatment has no influence. Also, the findings confirmed that there is a positive correlation between the Euro Health Consumer Index 2013 and Human Development Index 2014 [13], Europe 2020 Index 2014 [14], and Corruption Perceptions Index 2013 [15].
All those studies provide valuable insight on the healthcare systems’ performance from the consumer point of view, also pointing out some relations with macroeconomic indicators of healthcare resources allocation and the general level of human development or corruption. However, all those studies present a static picture, analyzing data only in a single point of time, and by consequence, not capturing the effects of the determinant variables over time. Our study proposes a step further and, by means of a panel data analysis, captures the dynamic relations between Patient rights and information, Accessibility, Prevention, Range and reach of services, and Pharmaceuticals and Outcomes, not only in a single point of time, but in a time span of five years (2012–2016).
3. How Do We Stand?
For this purpose, in the first step of our research, we analyzed secondary data provided by the annual reports of the Euro Health Consumer Index (EHCI) [9,16,17,18,19]. The dynamics of quality and efficiency of Romanian health system were examined in terms of the obtained scores for each subdiscipline based on which the Euro Health Consumer Index is calculated. Overall, the EHCI score of Romania fluctuated over the considered period, but remained well below the European average. In the period of 2012–2014, the EHCI score decreased steadily from year to year; from 489 in 2012 to 483 in 2014. 2015 marked a notable increase (from 453 to 527), which has not been maintained in 2016, since it dropped again to 497. A gloomy picture is also provided by the yearly low scores which situated Romania among the last positions of the overall ranking. More details are presented in Figure 1.
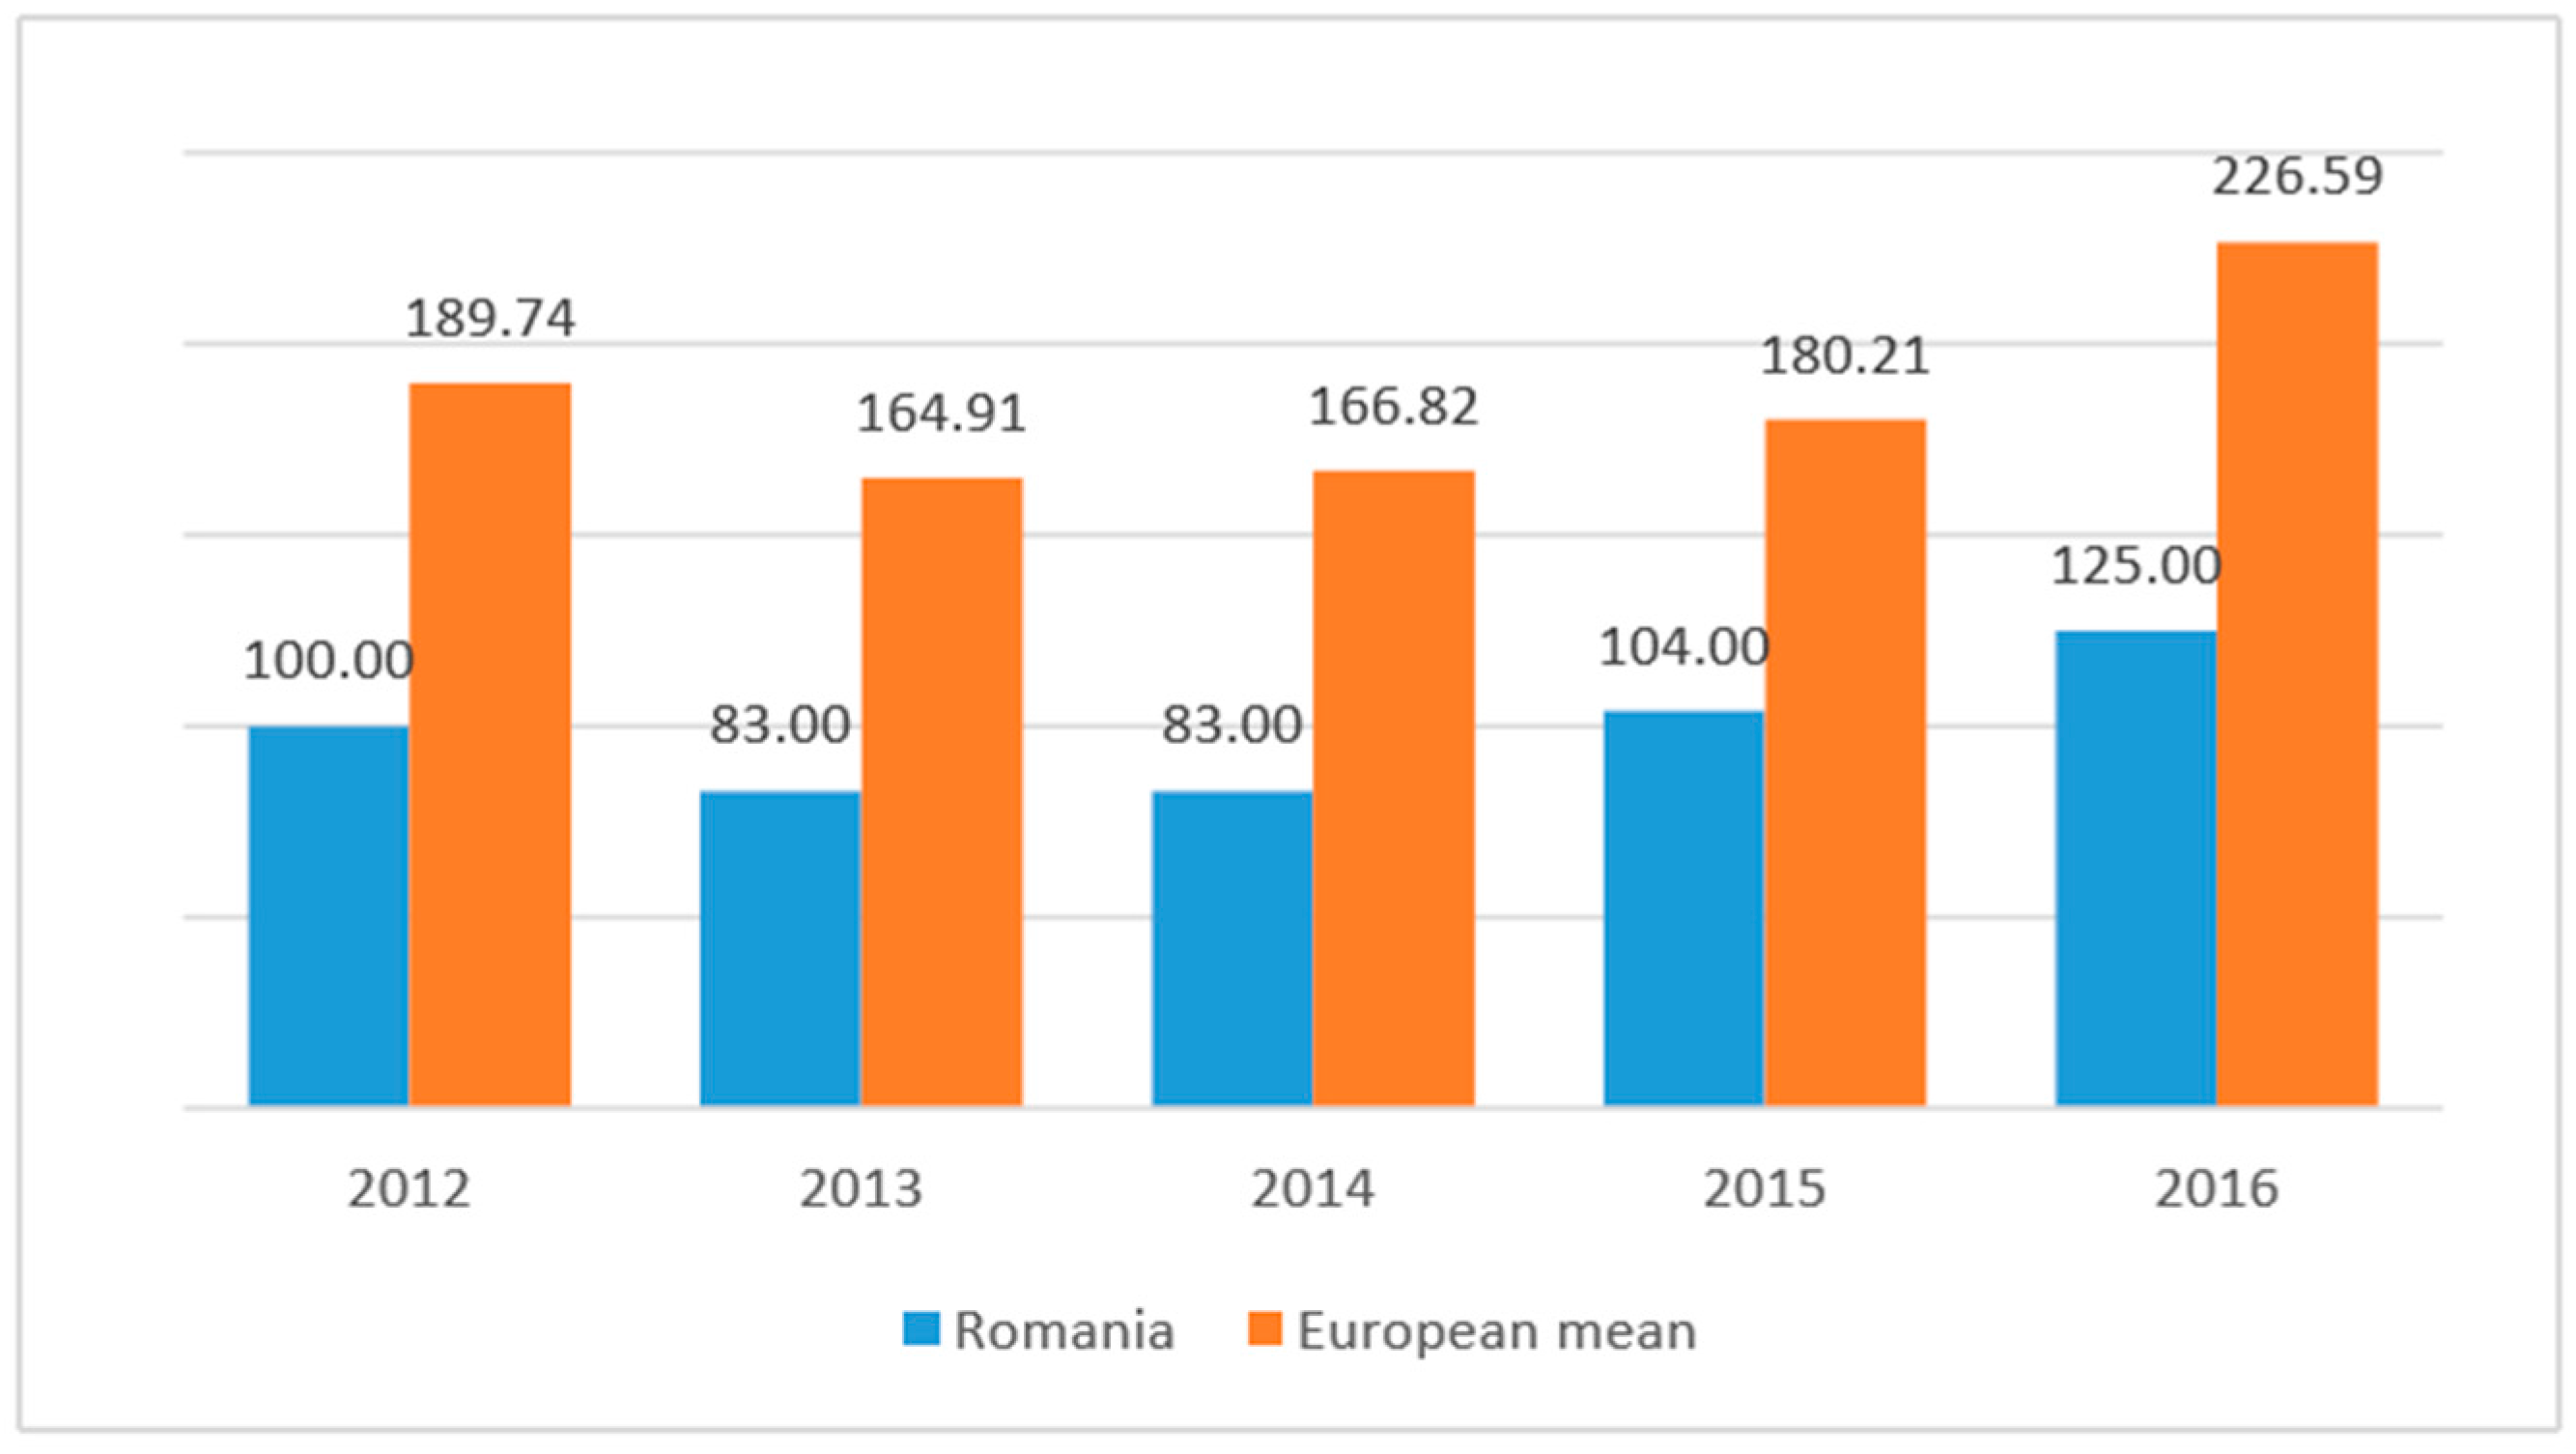
In terms of outcomes (see Figure 2), the good news is that the Romanian scores follow the general trend of the European mean score, namely a decrease in 2013 from 2012, followed by a steady increase over the next three years. The bad news is that throughout the analyzed period, Romanian scores are well below the European mean.
These figures are far from encouraging. Both in terms of inputs (represented by accessibility, patient rights and information, range and reach of services, prevention, and pharmaceuticals) and outputs (represented by outcomes indicators), Romania scores are among the lowest of the studied European countries.
4. Data and Methods
For the purpose of our analysis, we analyzed secondary data provided by the annual reports of the Euro Health Consumer Index (EHCI) [9,16,17,18,19], particularly, the country scores of the six subdisciplines on which the EHCI is built: Patient rights and information (PRI), Accessibility/waiting time for treatment (ACC), Outcomes (OUT), Range and reach of services (RRS), Prevention (PRE), and Pharmaceuticals (PHA), provided by the last five consecutive editions of the Euro Health Consumer Index [9,16,17,18,19].
The analyzed information covers the 28 European member states, plus Albania, Iceland, Macedonia, Norway, Serbia, and Switzerland, for a period of five consecutive years (2012–2016). For that period of five years we managed to collect annual data, allowing us to analyze them in the short-run as well as in the long-run.
We designed a research methodology in three steps:
- To examine the possible influences of each of the five subscales on the outcomes, we adopted two approaches: the short-run approach and the long-run approach. In the short-run, stepwise regressions were performed for each of the analyzed years.
- To account for the time factor, we had to deal with panel data (both time series and cross-section data) the Pool Object was used [20]. Panel data perform better in detecting and measuring the effects which in pure cross-sectional or time series data could not be observed [21]. This approach allowed us to capture the influences not only in each point of time, but in a time span of five years (2012–2016) [20].
- We were also interested to see if there were any differences among countries/groups of countries with respect to the influence of different determinants on the healthcare system outcomes. Therefore, we first divided the 34 European countries into more homogenous groups by means of Cluster Analysis. Subsequently, for each group of countries, separate panel data regressions were performed, which more accurately captured the specific influences of dependent variables on health outcomes.
5. Results and Discussion
5.1. What Is Important in the Short-Run?
To examine the possible influences of each of the five subscales on the outcomes, we adopted two approaches: the short-run approach and the long-run approach. In the short-run, stepwise regressions were performed for each of the analyzed years.
The regression equations were defined as follows:
where a represents the intercept, b, c, d, e, and f are the independent variables’ coefficients to be estimated, i is the number of cross-sections, and ε is the error term.
At each step in the analysis, based on the stepwise algorithm, independent variables entered/exited the equation according to their statistical contribution in explaining the variance in the dependent variable. The criterion for a variable to enter the equation was the probability of F to be ≤0.05 and the criterion for a variable to be removed was the probability of F to be ≥0.1 [12]. The regression results are presented in Table 1.
In a previous study by our group [12], considering the information from EHCI 2013 and by means of a stepwise regression, it was found that approximately 77.8% of the variability of OUT could be explained by the variability of Range and reach of services (RRS), Pharmaceuticals (PHA) and Prevention (PRE). All three variables had a positive and significant effect on Outcomes (OUT) ( = 0.778, F = 35.128, p = 0.000). Moreover, Prevention (PRE), Patient rights and information (PRI) and Accessibility/waiting time for treatment (ACC) had no significant effect.
Similar results (i.e., different combinations of RRS, PHA, and PRE) were found to have significant effects on OUT for each of the other considered years. Thus: in 2012, 52.6% of the variability of OUT was explained only by the variability of RRS ( = 0.526, F = 35.569, p = 0.000). In 2014, PHA seemed to be the most important determinant of OUT, since 59.9% of its variability could be explained by the variability of PHA ( = 0.599, F = 47.864, p = 0.000). Both RRS and PHA had positive effects on OUT in the last two years: 2015 ( = 0.652, F = 29.005, p = 0.000) and 2016 = 0.705, F = 37.095, p = 0.000).
Concluding the above findings, we could state that, in the short-run, the healthcare outcomes were determined mostly by pharmaceuticals and range and reach of services, and only in a single year (2013) by prevention. Moreover, each of these determinants had a positive effect on the outcomes. Consequently, in wishing to improve the health system outcomes, one should consider paying particular attention to pharmaceuticals and the range and reach of health services provided. Moreover, this finding suggests that accessibility/waiting time for treatment and patient rights and information have no significant impact on outcomes.
At first sight, one may think these results seems to be a little strange. It was, of course, expected that pharmaceuticals and range and reach of services would determine increased outcomes, but it was not expected that accessibility and prevention would have no significant effect. However, we have to remember that, in this step, the analysis covered only a single year. Therefore, patient rights and information, accessibility, and especially prevention are expected to determine an increased outcome, not within a few months or a year, but over several years. In other words, is expected that the time factor plays a decisive part in the behavior of the considered independent variables in predicting the outcomes.
5.2. What Is Important in the Long-Run?
To account for the time factor, we had to deal with panel data (both time series and cross-section data), so, the Pool Object was used. This approach allowed us to capture the influences not only in a single point of time, but in a time span of five years (2012–2016) [20,22].
The regression equations were defined as follows:
where a represents the intercept, g is the cross-section specific fixed effects, b, c, d, e, and f are the independent variables’ coefficients to be estimated, i is the number of cross-sections (i = 1, 2, …, 28), t is the time (t = 2012, 2013, …, 2016), and ε is the error term.
We estimated the above equation by means of the Least Squares method and cross-section fixed effects. The F-test, test, and the associated p-values rejected the null hypothesis of cross-section effects redundancy. The fixed effect estimation means that the intercept is now reported in two parts: the average value of the intercept for all the countries (a) and the individual country’s intercept as a deviation from that overall average (). The limited number of observations restricted the regression coefficients to be the same across all cross-sections. We also selected cross-section weights, assuming the presence of cross-section heteroskedasticity.
The estimation results are presented in Table 2 last column. As shown in the table, there is high amount of variability of the dependent variable (Outcomes) explained by the independent variables (R2 = 0.927, F = 47.583, p ≤ 0.01), which is an improvement over the variability explained by the equations considering only one year each. A good explanation of this phenomena was provided by Gujarati [21], who stated that panel data perform better in detecting and measuring the effects that could not be observed in pure cross-sectional data.
However, perhaps the most important difference compared to the single year cross-section equations came from the independent variables that were statistically significantly related to the dependent variable. As we remember, in the short-run, the healthcare outcomes were determined mostly by pharmaceuticals and the range and reach of services, and only in a single year (2013) by prevention. Moreover, each of these determinants had a positive effect on the outcomes.
It seems that the time factor indeed played a decisive part in the behavior of the considered independent variables in predicting the outcomes, since a different set of independent variables was shown to be significantly related to the dependent variable. As one can see in Table 2, last column, the estimated coefficients of Accessibility (b = 0.291, t = 4.996, p ≤ 0.01) and Prevention (b = 0.903, t = 9.771, p ≤ 0.01) are positive and statistically significant at the 0.01 level, suggesting that they positively influence the outcomes, while Range and reach of services (b = −1.657, t = 11.829, p ≤ 0.01) has a negative influence [12,23]. Regarding Accessibility and Prevention, those results were expected, since better access to medical services and the existence of prevention programs would determine increased levels of outcomes, not in a few months or a year, but in a number of years. On the contrary, the negative effect of Range and reach of services was not expected and not so straightforward to explain; it requires deeper investigations.
Patient rights and information seems to have no influence on outcomes either in the short- or in the long-run. As for Pharmaceuticals, as we remember, it was a significant determinant of the outcome, but proved to have no influence when we considered a five-year period.
Consequently, in wishing to improve health system outcomes, one should consider paying particular attention to prevention programs and accessibility of medical services.
5.3. Are There Any Differences among Countries/Groups of Countries?
We were also interested to see if there were any differences among countries/groups of countries with respect to the influence of different determinants on the healthcare system outcomes. Therefore, we first divided the 34 European countries into more homogenous groups by means of cross-country Two-Step Cluster Analysis, using as clustering variables the country mean scores (2012–2016) based on the yearly EHCI.
Depending on the five variables on which they were formed, the Cluster Analysis revealed a four clusters solution and some useful information to analyze the characteristics of the four clusters [12]. Clusters' profiles are presented in Table 3.
Cluster 1 is characterized by low mean values for all five variables (see Table 3): PRI—Patient right and information (M = 92.98), OUT—Outcomes (M = 136.36), RRS—Range and reach of services (M = 75.15), PRE—Prevention (M = 79.17), PHA—Pharmaceuticals (M = 50.45). PHA—Pharmaceuticals had the highest importance in the clustering process. In this cluster were included 12 countries, namely: Albania, Bulgaria, Cyprus, FYR Macedonia, Greece, Hungary, Latvia, Lithuania, Malta, Poland, Romania, and Serbia. As for the Romanian position, inside its cluster, there was further bad news: for all the five criteria, its multiannual mean scores were far below of those of cluster 1.
Cluster 2 is composed of seven countries (Croatia, Czech Republic, Estonia, Italy, Portugal, Slovakia, and Slovenia) and is characterized by the third mean scores for four of the five variables (OUT, RRS, PRE, and PHA) and the second for PRI. In the clustering process of these countries, the the PHA-mean (Pharmaceuticals) was of the highest importance.
Cluster 3 stands by far in the leading position in terms of four of the five variables considered: (PRI, OUT, RRS, and PRE) and in the second place in terms of PHA (Pharmaceuticals). This cluster gathers seven countries (Denmark, Finland, Iceland, Netherlands, Norway, Sweden, and the UK). PRE (Prevention) had the highest importance in the clustering process for this group.
Cluster 4 is characterized by the second mean scores in four of the clustering variables: PRI (M = 109.60), OUT (M = 208.92), RRS (M = 112.85), and PRE (M = 101.25) as well as the highest mean score for PHA (M = 77.27). This cluster gathered the remaining seven countries: Austria, Belgium, France, Germany, Ireland, Luxembourg, Spain, and Switzerland. RRS (Range and reach of services) was the most important variable in the clustering process for this group.
Subsequently, for each group of countries (cluster), separate panel data regressions were estimated by means of the Least Squares method, cross-section fixed effects, and cross-section weights, which more accurately captured the specific influences of dependent variables on the healthcare system outcomes.
The estimation results (presented in Table 2) will be further analyzed for each cluster:
For the first two clusters, respectively 75.3% (R2 = 0.753, F = 9.837, p ≤ 0.01) and 69.6% (R2 = 0.396, F = 6.383, p ≤ 0.01) of the variability of the dependent variable (Outcomes) was explained by the variability of the independent variables, and the estimation results of regression equations were mainly similar to those obtained for the whole group of 32 countries: the estimated coefficients of Accessibility and Prevention were positive and statistically significant at the 0.01 level, suggesting that they positively influenced the Outcomes, while Range and reach of services had a negative influence [12,23]. Moreover, Patient right and information and Pharmaceuticals seemed to have no influence on outcomes. Consequently, in wishing to improve the health system outcomes of the healthcare systems, one should consider paying particular attention to prevention programs and the accessibility of medical services. As we remember, in those clusters there were included countries in Southeast and Central Europe—namely, Albania, Bulgaria, Cyprus, FYR Macedonia, Greece, Hungary, Latvia, Lithuania, Malta, Poland, Romania (cluster 1), and Serbia and Croatia, Czech Republic, Estonia, Italy, Portugal, Slovakia, and Slovenia (cluster 2)—those with the lowest average scores for almost all subdisciplines.
In Cluster 3, there were included the best performing countries for almost all subdisciplines, mainly from North and Northwest Europe (Denmark, Finland, Iceland, Netherlands, Norway, Sweden, and UK). For this cluster, there is a quite different situation since 91.6% of the variability of outcomes (R2 = 0.916, F = 30.640, p ≤ 0.01), is due to the variability of Patient right and information (b = −1.071, t = −3.405, p ≤ 0.01), range and reach of services (b = −1.030, t = −2.821, p ≤ 0.05), and prevention (b = 1.414, t = 9.684, p ≤ 0.01), while Accessibility and Pharmaceuticals have no significant influence. Consequently, in wishing to improve the health system outcomes, one should consider paying particular attention to prevention programs.
In case of Cluster 4, 74.4% (R2 = 0.744, F = 9.721, p ≤ 0.01) of the variability of the dependent variable (Outcomes) was explained by the variability of the independent variables. The estimation results of regression equation are presented in Table 2, fifth column: the estimated coefficient of Accessibility was positive and statistically significant at the 0.01 level, suggesting that it positively influenced the Outcomes, while Range and reach of services had a negative influence [12,23]. Moreover, Patient right and information, Prevention, and Pharmaceuticals seemed to have no influence on outcomes. Consequently, in wishing to improve the health system outcomes of the healthcare systems of those countries, one should consider improving the accessibility of medical services. As we remember, in those clusters there were included mainly Central and West European countries (Austria, Belgium, France, Germany, Ireland, Luxembourg, Spain, and Switzerland), characterized by the second mean scores in four of the clustering variables, as well as the highest mean scores for Accessibility and Pharmaceuticals.
6. Discussion and Conclusions
The aim of this paper is to provide empirical evidence to help health systems’ policy makers within European countries in making the most appropriate decisions to maintain and improve the health of the people they serve. For this purpose, we analyzed secondary data provided by the annual reports of the Euro Health Consumer Index (EHCI), covering 32 European countries from 2012–2016. Our study made a step further compared to previous research and, by means of panel data analysis, captured the dynamic relations between Patient rights and information, Accessibility, Prevention, Range and reach of services, and Pharmaceuticals and Outcomes, not only in a single point of time, but in a time span of five years.
The main findings of the study suggest that the time factor plays a decisive role in the behavior of the considered independent variables in predicting the outcomes, since a different set was found to significantly influence the dependent variable (outcomes) in one year compared with a five-year period.
In the short-run, the healthcare outcomes were determined mostly by pharmaceuticals and range and reach of services, and only in a single year (2013) by prevention, with each of these determinants having a positive effect. However, accessibility/waiting time for treatment and patient rights and information had no significant impact. Consequently, in wishing to improve the health systems’ performance, one should consider paying particular attention to pharmaceuticals and to the range and reach of health services provided.
In the long-term, Accessibility and Prevention positively impacted Outcomes; Range and reach of services had a negative influence, and Patient right and information and Pharmaceuticals seemed to have no influence on outcomes. Consequently, in wishing to improve the health system outcomes in the long-run, one should consider improving prevention programs and the accessibility of medical services.
As pointed out above, cross-country analyses raise questions of methodological limitations [7], mainly due to the sociocultural, economic, and environmental differences involved. This research managed to thwart such a problem by dividing the 38 European countries into four homogeneous groups (clusters). This approach accounted for cross-country differences and allowed different factors to be associated with healthcare systems’ performance. Thus, there were differences among countries/groups of countries with respect to the influence of different determinants on the healthcare system outcomes, which might suggest that different means of action should be identified and operationalized by the policy makers of each country/group of countries in their efforts to maintain and improve the health status of their citizens.
The main limitation of the study is the fact that it relies on the analysis of secondary data. Future research should consider the dynamic relations between health systems resources, processes, and outcomes. Also, the limited number of available observations restricted the regression coefficients to be the same for all cross-sections. A more generous dataset would allow specific cross-section coefficients for each country.
Author Contributions
All authors were involved in literature review, methodology design, data analysis and manuscript preparation. All authors have read and approved the final manuscript.
Conflicts of Interest
The authors declare no conflict of interest.
References
- European Commission. Investing in Health—Commission Staff Working Document. European Commission, 2013. Available online: https://ec.europa.eu/health/sites/health/files/strategy/docs/swd_investing_in_health.pdf (accessed on 5 April 2017).
- European Commission. Health Care. Available online: http://ec.europa.eu/social/main.jsp?langId=en&catId=754 (accessed on 5 April 2017).
- Murray, C.J.; Frenk, J. A Framework for Assessing the Performance; No. 78; World Health Organization: Geneva, Switzerland, 2000. [Google Scholar]
- Iacobuță, A.O. Patients’ evaluation of access and quality of healthcare in EU countries. A comparative analysis. Procedia 2012, 62, 896–900. [Google Scholar] [CrossRef]
- Calu, D.A.; Ștefănescu, A.; Dobrin, C.; Șerban, R. Empirical research on the public-private partnership into the public hospitals from Romania. Afr. J. Bus. Manag. 2011, 5, 12996–13014. [Google Scholar]
- Kruk, M.E.; Freedman, L.P. Assessing health system performance in developing countries: A review of the literature. Health Policy 2008, 85, 263–276. [Google Scholar] [CrossRef] [PubMed]
- Jankauskiene, D.; Jankauskaite, I. Access and quality of health care system by opinion of patients in ten european countries. Manag. Health 2011, 15, 31–39. [Google Scholar]
- Schoen, C.; Osborn, R.; Huynh, P.T.; Doly, M.; Zapert, W.; Peugh, J.; Davis, K. Taking the pulse of health care systems: Experiences of patients with health problems in six countries. Health Aff. 2005, 10, W5-509–W5-525. [Google Scholar] [CrossRef] [PubMed]
- Björnberg, A. Euro Health Consumer Index 2016 Report. Available online: http://www.healthpowerhouse.com/wp-content/uploads/2017/01/EHCI_2016_report.pdf (accessed on 16 March 2017).
- Euro Health Consumer Powerhouse. Available online: http://www.healthpowerhouse.com/en/about-us/ (accessed on 16 March 2017).
- Gonçalves, F. A cross country explanation of performance of heath care systems The consumer point of view using the Euro Health Consumer Index. Econom. Model. 2011, 28, 196–200. [Google Scholar] [CrossRef]
- Popa, I.; Ștefan, S.C. A cluster analysis of the quality of health services at European level. In Proceedings of the 25th IBIMA Conference on Innovation Vision 2020: From Regional Development Sustainability to Global Economic Growth, Amsterdam, The Netherlands, 7–8 May 2015; pp. 104–116. [Google Scholar]
- United Nations Development Programme. Human Development Report 2014. Available online: http://hdr.undp.org/en/content/table-1-human-development-index-and-its-components (accessed on 5 January 2015).
- World Economic Forum. The Europe 2020 Competitiveness Report. Available online: http://www3.weforum.org/docs/WEF_Europe2020_CompetitivenessReport_2014.pdf (accessed on 25 January 2015).
- Transparency International. Corruption Perceptions Index 2013. Available online: http://www.transparency.org/cpi2013/results (accessed on 5 January 2015).
- Björnberg, A. Euro Health Consumer Index 2012 Report. Available online: http://www.healthpowerhouse.com/files/Report-EHCI-2012.pdf (accessed on 16 March 2017).
- Björnberg, A. Euro Health Consumer Index 2013—Report. Available online: http://www.healthpowerhouse.com/files/ehci-2013/ehci-2013-report.pdf (accessed on 4 January 2015).
- Björnberg, A. Euro Health Consumer Index 2014—Report. Available online: http://www.healthpowerhouse.com/wp-content/uploads/2015/01/EHCI_2014_report.pdf (accessed on 16 March 2017).
- Björnberg, A. Euro Health Consumer Index 2015—Report. Available online: http://www.healthpowerhouse.com/wp-content/uploads/2016/01/EHCI_2015_report.pdf (accessed on 16 March 2017).
- Popa, I.; Cicea, C.; Dobrin, C.; Marinescu, C.; Botez, D. Modeling energy’s contribution to the agriculture field: Evidence for European countries. Econom. Comput. Econom. Cybern. Stud. Res. 2013, 47, 61–74. [Google Scholar]
- Gujarati, D. Econometrics by Example; Palgrave Macmillan: Basingstoke, UK, 2011. [Google Scholar]
- Olaru, O.; Marinescu, C. A regression analysis of the effect of important determinants of wine production. In Proceedings of the 13th International Multidisciplinary Scientific Geoconference SGEM 2013, Sofia, Bulgaria, 16–22 June 2013. [Google Scholar]
- Ștefan, S.C.; Giurgiu, A.; Abrudan, M.M.; Miricescu, D.; Vlăsceanu, C. Why T&C companies need to develop global strategies? Ind. Text. 2016, 67, 428–433. [Google Scholar]
Figure 1.
Romania’s Euro Health Consumer Index overall scores (2012–2016) compared to the European average. Source: adapted from Björnberg, A., 2012, 2013, 2015, 2016, 2017 [9,16,17,18,19].

Figure 2.
Romania’s Outcomes scores (2012–2016) compared to the European average. Source: adapted from Björnberg, A., 2012, 2013, 2015, 2016, 2017 [9,16,17,18,19].


Table 1.
Single year stepwise regressions.
| Independent Variables | Single Year Stepwise Multiple Regressions | ||||
|---|---|---|---|---|---|
| 2012 | 2013 | 2014 | 2015 | 2016 | |
| C (intercept) | - | −52.571 * (−1.99) | - | - | - |
| RRS—Range and reach of services | 1.515 **,a (5.96) b | 0.737 ** (3.60) | - | 0.556 * (2.24) | 0.833 ** (2.85) |
| PRE—Prevention | - | 0.869 * (2.47) | - | - | - |
| PHA—Pharmaceuticals | - | 1.109 ** (3.00) | 2.669 ** (6.92) | 1.532 ** (3.11) | 1.787 ** (3.92) |
| R-squared | 0.526 | 0.778 | 0.599 | 0.652 | 0.705 |
| Adjusted R-squared | 0.512 | 0.756 | 0.587 | 0.629 | 0.686 |
| F-statistic | 35.568 ** | 35.128 ** | 41.864 ** | 29.005 ** | 37.095 ** |
Table 2.
Panel data regressions.
| Independent Variable | Panel Data Regressions | ||||
|---|---|---|---|---|---|
| Cluster I | Cluster 2 | Cluster 3 | Cluster 4 | Combined | |
| C (intercept) | 127.944 **,a (6.030) b | 212.973 ** (3.842) | 336.465 ** (13.859) | 236.098 ** (3.077) | 225.531 ** (9.89) |
| PRI—Patient right and information | - | - | −1.071 ** (−3.405) | - | - |
| ACC—Accessibility/waiting time for treatment | 0.231 ** (2.816) | 0.464 * (2.221) | - | 1.212 ** (3.177) | 0.291 ** (4.996) |
| RRS—Range and reach of services | −1.273 ** (−4.753) | −1.851 ** (−4.510) | −1.030 * (−2.821) | −2.194 ** (−7.463) | −1.657 ** (11.829) |
| PRE—Prevention | 0.890 ** (3.586) | 1.057 ** (4.581) | 1.414 ** (9.684) | - | 0.903 ** (9.771) |
| PHA—Pharmaceuticals | - | - | - | - | - |
| R-squared | 0.753 | 0.696 | 0.916 | 0.744 | 0.927 |
| Adjusted R-squared | 0.677 | 0.587 | 0.886 | 0.668 | 0.908 |
| F-statistic | 9.837 ** | 6.383 ** | 30.640 ** | 9.721 ** | 47.583 ** |
Table 3.
Cluster centroids.
| Variables | Clusters | Combined | Romania | |||
|---|---|---|---|---|---|---|
| 1 | 2 | 3 | 4 | |||
| Cluster Size | 35.3% (12) | 23.5% (8) | 20.6% (7) | 20.6% (7) | ||
| OUT_mean | 136.366 | 188.285 | 240.914 | 208.925 | 185.652 | 99.000 |
| PRI_mean | 92.983 | 111.485 | 133.542 | 109.600 | 109.052 | 87.800 |
| ACC_mean | 145.016 | 152.800 | 146.200 | 181.925 | 155.547 | 138.400 |
| RRS_mean | 75.150 | 100.600 | 135.885 | 112.850 | 101.764 | 65.800 |
| PRE_mean | 79.166 | 85.600 | 111.342 | 101.250 | 92.311 | 70.200 |
| PHA_mean | 50.450 | 64.114 | 77.085 | 77.275 | 65.058 | 45.800 |
© 2017 by the authors. Licensee MDPI, Basel, Switzerland. This article is an open access article distributed under the terms and conditions of the Creative Commons Attribution (CC BY) license (http://creativecommons.org/licenses/by/4.0/).
Share and Cite
MDPI and ACS Style
Popa, I.; Ștefan, S.C. Modeling the Impact of Short-Term and Long-Term Determinants of European Health Systems’ Performance: A Panel Data Approach. Sustainability 2017, 9, 1595. https://doi.org/10.3390/su9091595
AMA Style
Popa I, Ștefan SC. Modeling the Impact of Short-Term and Long-Term Determinants of European Health Systems’ Performance: A Panel Data Approach. Sustainability. 2017; 9(9):1595. https://doi.org/10.3390/su9091595
Chicago/Turabian StylePopa, Ion, and Simona Cătălina Ștefan. 2017. "Modeling the Impact of Short-Term and Long-Term Determinants of European Health Systems’ Performance: A Panel Data Approach" Sustainability 9, no. 9: 1595. https://doi.org/10.3390/su9091595
Note that from the first issue of 2016, this journal uses article numbers instead of page numbers. See further details here.