Human Mobility Analysis for Extracting Local Interactions under Rapid Socio-Economic Transformation in Dawei, Myanmar


1
School of Engineering and Technology, Asian Institute of Technology, Moo 9 km 42 Phaholyothin Rd, Klong Nueng, Klong Luang, Pathumthani 12120, Thailand
2
Graduate School of Sciences and Technology for Innovation, Yamaguchi University, Yamaguchi 755-8611, Japan
*
Author to whom correspondence should be addressed.
Sustainability 2017, 9(9), 1598; https://doi.org/10.3390/su9091598
Submission received: 8 July 2017
/
Revised: 28 August 2017
/
Accepted: 2 September 2017
/
Published: 7 September 2017
Abstract
:Understanding human mobility patterns provides knowledge about impacts of a socio-economic transformation in a rapidly urbanizing environment. This study assesses a long-term mobility data which uses a face-to-face questionnaire and GPS logger-based method of data collection for extracting socio-economic impacts from the rapid transformation. Conversion of mobility related information such as travel distance, direction, and time from the questionnaire survey into spatiotemporal information was carried out by developing an algorithm. To illustrate the proposed approach, a case study in Dawei Special Economic Zone, Myanmar was conducted. The results show that the questionnaire-based mobility data can be associated with GPS-based mobility data and diverse mobility patterns are found for different social groups in the stage of urban formation. The results enabled an understanding of the human dynamics in interactions, which can be used for monitoring rural sustainability and its challenges in the future with the background of the accelerated project development in the area.
1. Introduction
Rapid socio-economic transformations induced by urbanization and industrialization have a significant impact on local human mobility patterns [1,2]. Those transformations create working opportunities and motivate local people to be involved as rural labor forces [1], leading involvement in non-farm activities beyond subsistence agricultural activity by restructuring rural livelihood. Thus, evaluation of local impacts associated with socio-economic and environmental transformation is closely related to human mobility. Understanding human mobility patterns can help in the exploration of the underlying driving factors and its diverse impacts to local villagers. It can also provide a significant insight in understanding the urban formation, and to monitor rural sustainability at a community level in the background of future accelerated project development.
Methods for human mobility data collection have shifted over the time. Traditionally, human mobility data was acquired by questionnaire survey or travel diaries. This comprises travel demographic characteristics as well as travel descriptions including destination, purpose, time, and mode per trip. However, the complexity of the contents increased non-response rate [3], reduction of sample sizes [4], misreporting of the trip [5], underreporting of the trip, inaccuracies in travel time and fatigue of respondents [6]. Due to the difficulty in collecting accurate human mobility information, ways of obtaining human mobility data have been shifting from questionnaire survey to automated data collection methods such as Global Positioning System (GPS) survey by loggers and mobile phones. GPS is capable of automatically obtaining accurate trip information such as latitude, longitude, time, speed and heading [7,8], which enables the visualization of the data by static and animation maps [9,10], with interface of online map applications such as Google maps for better visualization and mobility analysis [11,12,13]. The increased popularity of GPS function-equipped smartphone has further enabled researchers to easily acquire human mobility data at a large scale. Mobility data coupled with Geographic Information Systems (GIS) data can be useful in transportation mode detection [13,14], purpose detection [5,8,11,15,16], and behavioral analyses [17,18,19], further enhancing empirical knowledge and information. As the GPS trip surveys provide high accurate trip data [8,20], they can be the main method of human mobility data collection among a population with GPS equipped smartphones and taxis.
A GPS-based human mobility analysis can also provide a better understanding of the interaction between the surrounding environment and localities [21], and it can be further utilized for dynamics of urban monitoring [22]. GPS technological advancements also help to assure the reliability of the questionnaire-based human mobility data such as recall diary, face-to-face interview or computer-assisted telephone interview (CATI). The use of GPS trajectories for the validation of questionnaires can be cited from developed countries such as Australia, USA, where the GIS and GPS technology has been already in use for a longer time [23,24]. However, it appeared to be very limited in developing countries due to under consolidated spatial information and local address, less distribution of GPS equipped devices and mobile phone network, and ambiguous mobility information from face-to-face interviews resulting from non-significant landmarks such as prominent shopping centers and buildings in the major cities. Several studies have studied mobility patterns resulting from socio-economic development addressing social attributes such as residential status and age group [25,26]; however, these analyses are descriptive and lack quantitative visualization of questionnaire-based trip data. The development of GPS technology may generate a possibility to utilize the questionnaire-based human mobility data for evaluating impacts even in rural areas in developing courtiers.
In areas with rapid growth in developing countries, economic differentials among the local population have emerged from the establishment of Special Economic Zones in Southeast Asia such as Cambodia, Laos, and Myanmar and is a significant challenge for rural sustainable development. Assessment of a long-term human mobility pattern by merging both questionnaire and GPS survey data may be a key to understanding how local communities interact with a rapid socio-economic development and achieve rural sustainability.
In this study, the primary objective was to study human mobility to extract local interactions under a rapid socio-economic transformation. It aimed to analyze long-term human mobility data by merging questionnaire-based and GPS-based human mobility data. Specifically, the objectives were to (1) Develop an algorithm to convert face-to-face questionnaire-based human mobility data to spatial data and visualize those human mobility data; (2) Validate converted questionnaire-based human mobility data with GPS logger-based human mobility data, associated with the average trip frequency, travel distance and travel time and (3) Assess human mobility changes in the year 2005, 2010 and 2015 associated with socio-environmental changes such as land cover. This study is expected to contribute to indexing the conventional human mobility data in order to handle further spatial data analysis associated with socio-economic data with use of remote sensing and GIS data.
2. Study Area and Dataset
2.1. Dawei Special Economic Zone and Study Area
Dawei Special Economic Zone (DSEZ) Project is one of the largest petrochemical industrial estates in South East Asia located in Tanuntharyi Region, Southern Myanmar, 132 km from the border of Thailand (Figure 1). This DSEZ with a total area of 204.5 km2 was initially developed in 2008 as a joint project between the Thai and Myanmar governments. The Japanese government has also participated in it since 2015 by the equal partnership and provision of technical and financial support [27]. The project includes the development of the Dawei deep seaport, an industrial estate and highway road and rail links to Thailand with a total investment of 8.6 billion US$ [28]. The DSEZ is expected to be the pivotal hub for better connectivity and logistics among the surrounding regions.
The main livelihood in the DSEZ is lowland agricultural activities such as plantation and paddy cultivation, fisheries; however, the project development has led to the reconstruction of villagers’ mobility patterns due to the creation of employment opportunities and the roads infrastructure development. Indeed, since its establishment in 2008, the project has been hiring local employees on a daily basis as surveyors and road construction workers. Both the 18.5 km road infrastructure within the DSEZ and the main road infrastructure from Dawei to the Myanmar-Thai border, have been constructed [29]. It is expected that development would affect a total of 4457 households with 26,083 population in the area.
For the study, three villages were selected in DSEZ. Out of the total affected population of 5871, the sample size for questionnaire survey was found out to be 345. A stratified random sampling technique by sex and age was used to select respondents for the face-to-face questionnaire and GPS survey with the support of village authorities. The list of villagers was obtained from the village heads. Sex distribution of the respondents was 44.4% and 55.6% by male and female, respectively. Furthermore, age distribution showed an age group of 16.9% (16–20 years), 16.0% (21–30 years), 16.6% (31–40 years), 18.1% (31–50 years), 19.3% (51–60 years), and 13.0% (above 61 years).
2.2. Questionnaire Survey Data
A face-to-face interview with a pre-tested questionnaire carried out earlier in 2014 was conducted in 2015 to obtain information both for a personal profile and one-day human mobility in the year 2005, 2010 and 2015. Questionnaire-based human mobility data can be described by topological relationships represented by connectivity, adjacency, and enclosure [30]. The personal profile includes information such as age, sex, marital status, education level, household status, occupation, and monthly household income. The mobility-related information includes travel origin, destination, direction, distance, time, and transport mode. These three years covered the following periods—before project initiation, after project initiation and latest project status, respectively. These three years were indicative of the environmental change associated with the project development so that respondents were able to trace their typical mobility by year. The study also employed formal and informal interviews with key informants such as village heads using checklists and direct field observations.
2.3. GPS Log Records
GPS-based human mobility data can be described by geometrical relationships consisting of the spatial components [30]. Wearable GPS devices such as “i-gotU USB Travel & Sports Logger—GT-600” were used to log human mobility and validate the mobility data obtained from the questionnaire survey. This device is lightweight (37 g) and small (44 × 41.5 × 14 mm) with an automatic motion detector [31] which can be worn on the waist or clipped to clothes. The device recorded 24-h mobility with a 5-s interval using the motion detection mode. A maximum of 38 devices was distributed at one time to a total of 345 respondents above 16 years, one day before conducting the GPS survey. The selected respondents were requested to wear the devices for a whole day. This showed their week day’s mobility. As the respondents followed a defined pattern of work in the weekdays, their mobility was indicative of their regular social and economic engagements.
2.4 Satellite Imagery
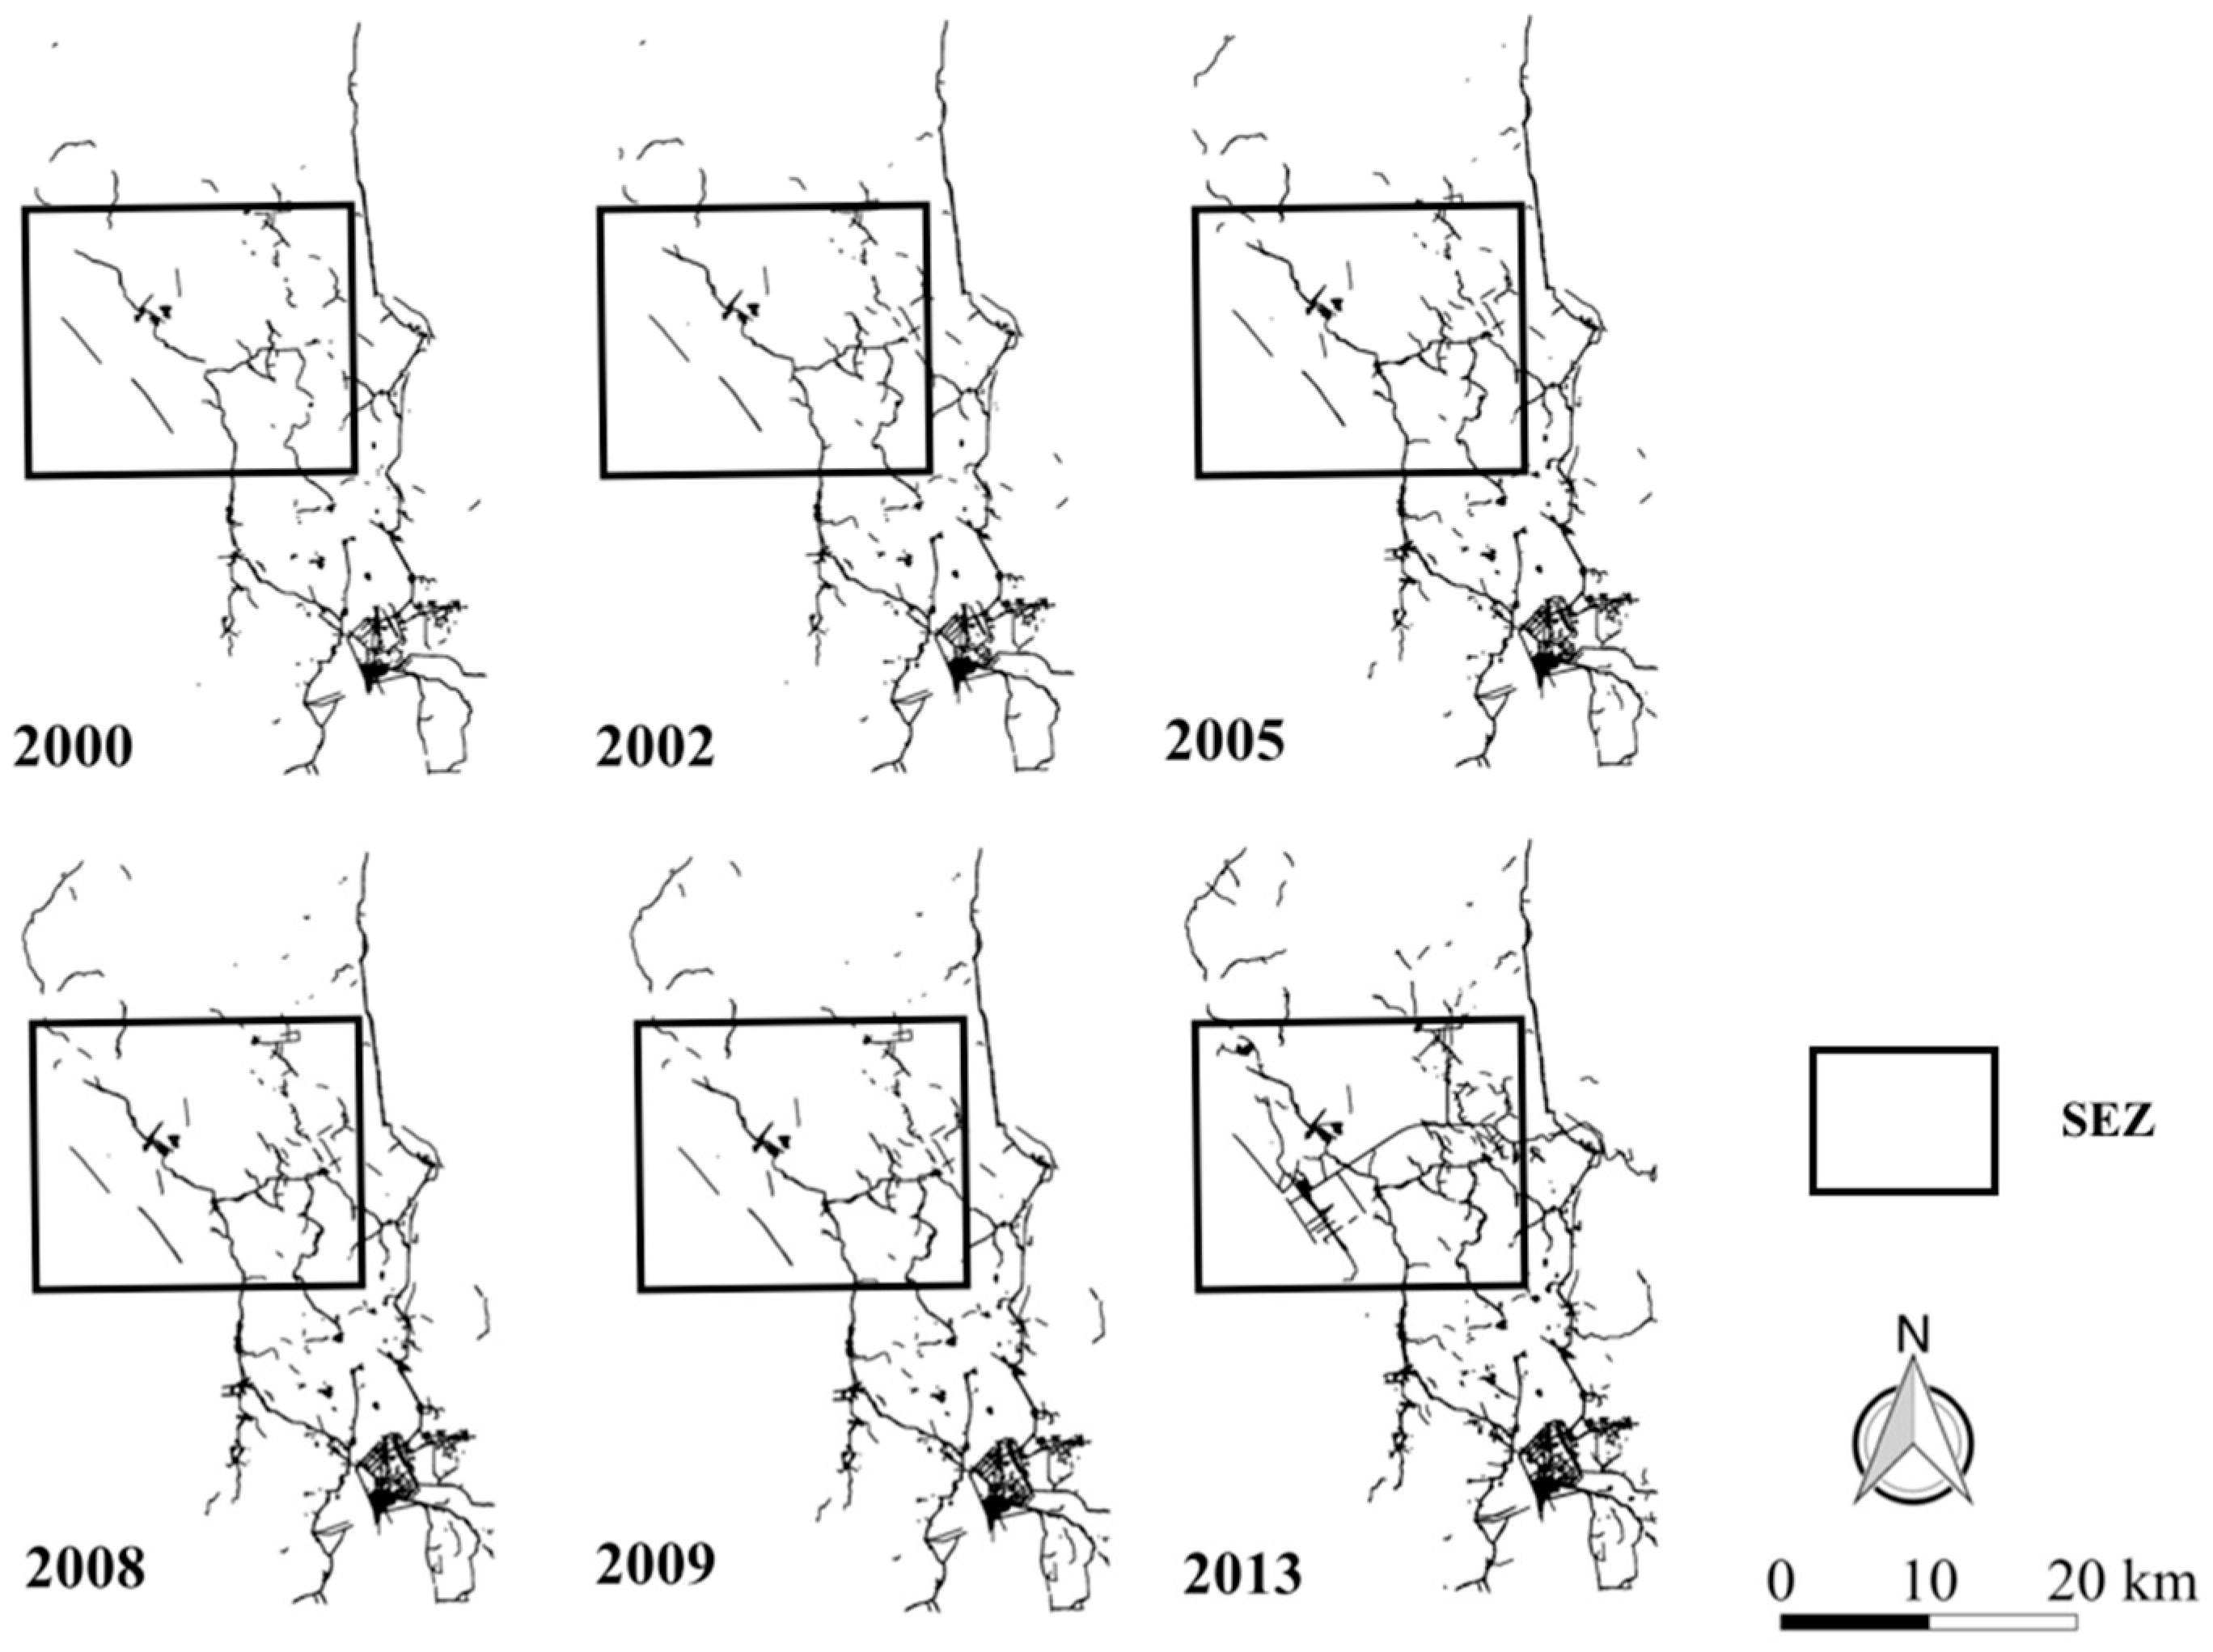
Cloud-free Landsat Thematic Mapper (TM) and Enhanced Thematic Mapper Plus (ETM+) Satellite images from United States Geographic Survey (USGS) were used for finding out land cover changes in time-series. Landsat imagery is freely available and commonly used for detecting land cover changes in time-series. The satellite images were taken in December 2000, 2002, 2005, 2008, 2009 and 2013 with a resolution of 30 × 30 m in the World Geodetic System 84 (WGS84) geographic coordinate reference system and utilized for digitizing urban areas by human visual interpretation.
3. Methodology
3.1. Overall Methodological Workflow
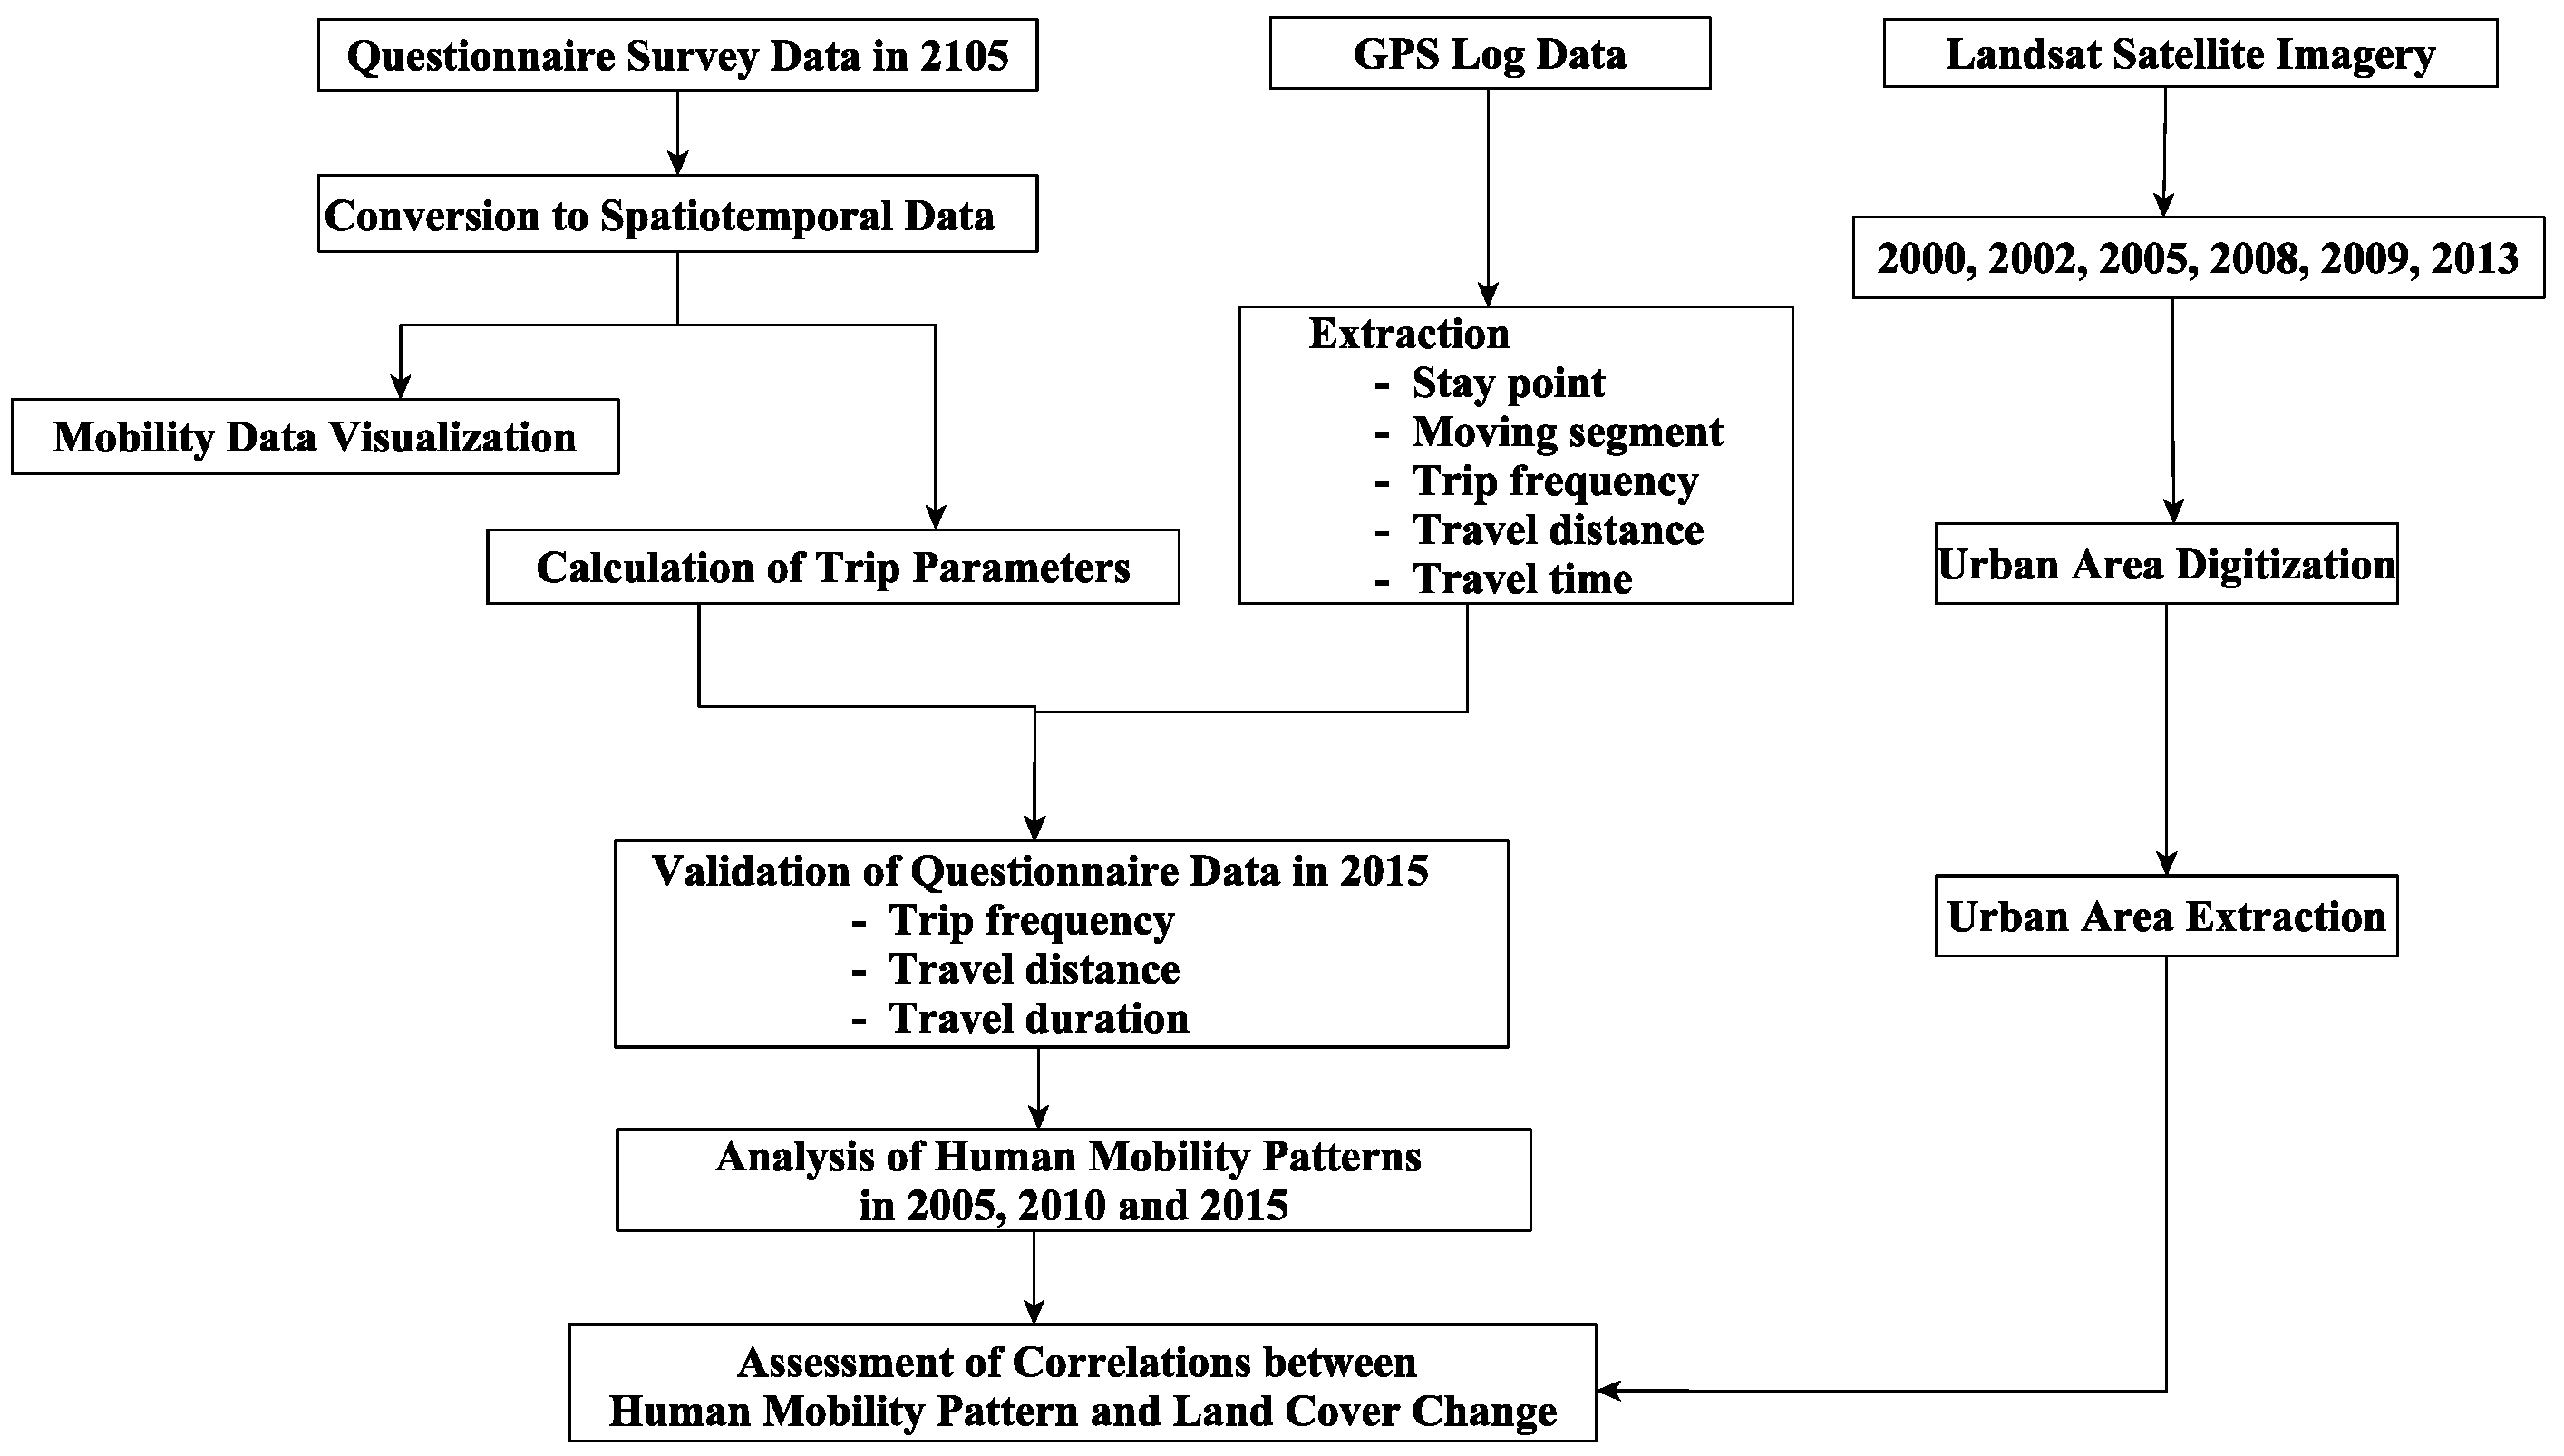
Figure 2 below is the overall methodological workflow used in this study. The workflow focuses on five major steps to achieve the primary objective of extracting local interaction under rapid socio-economic transformations. First, face-to-face questionnaire-based human mobility data is converted to spatiotemporal data and visualized in an animation format. Furthermore, selected trip parameters such as trip frequency, travel distance, and travel time are manually counted. Second, stay points and moving segments are extracted from the GPS log data to find the selected trip parameters. Third, the questionnaire-based human mobility data for 2015 is validated based on the selected parameters by GPS log data. Fourth, the mobility patterns in the year 2005, 2010, and 2015 obtained from the questionnaires are analyzed based on socio-economic parameters. Fifth, urban area is extracted through digitization from the Landsat satellite imagery by year and its correlation with the average travel distance was assessed. The methods according to the major steps of the flow are explained in the following sections.
3.2. Conversion of Questionnaire-Based Mobility Data to Spatiotemporal Data
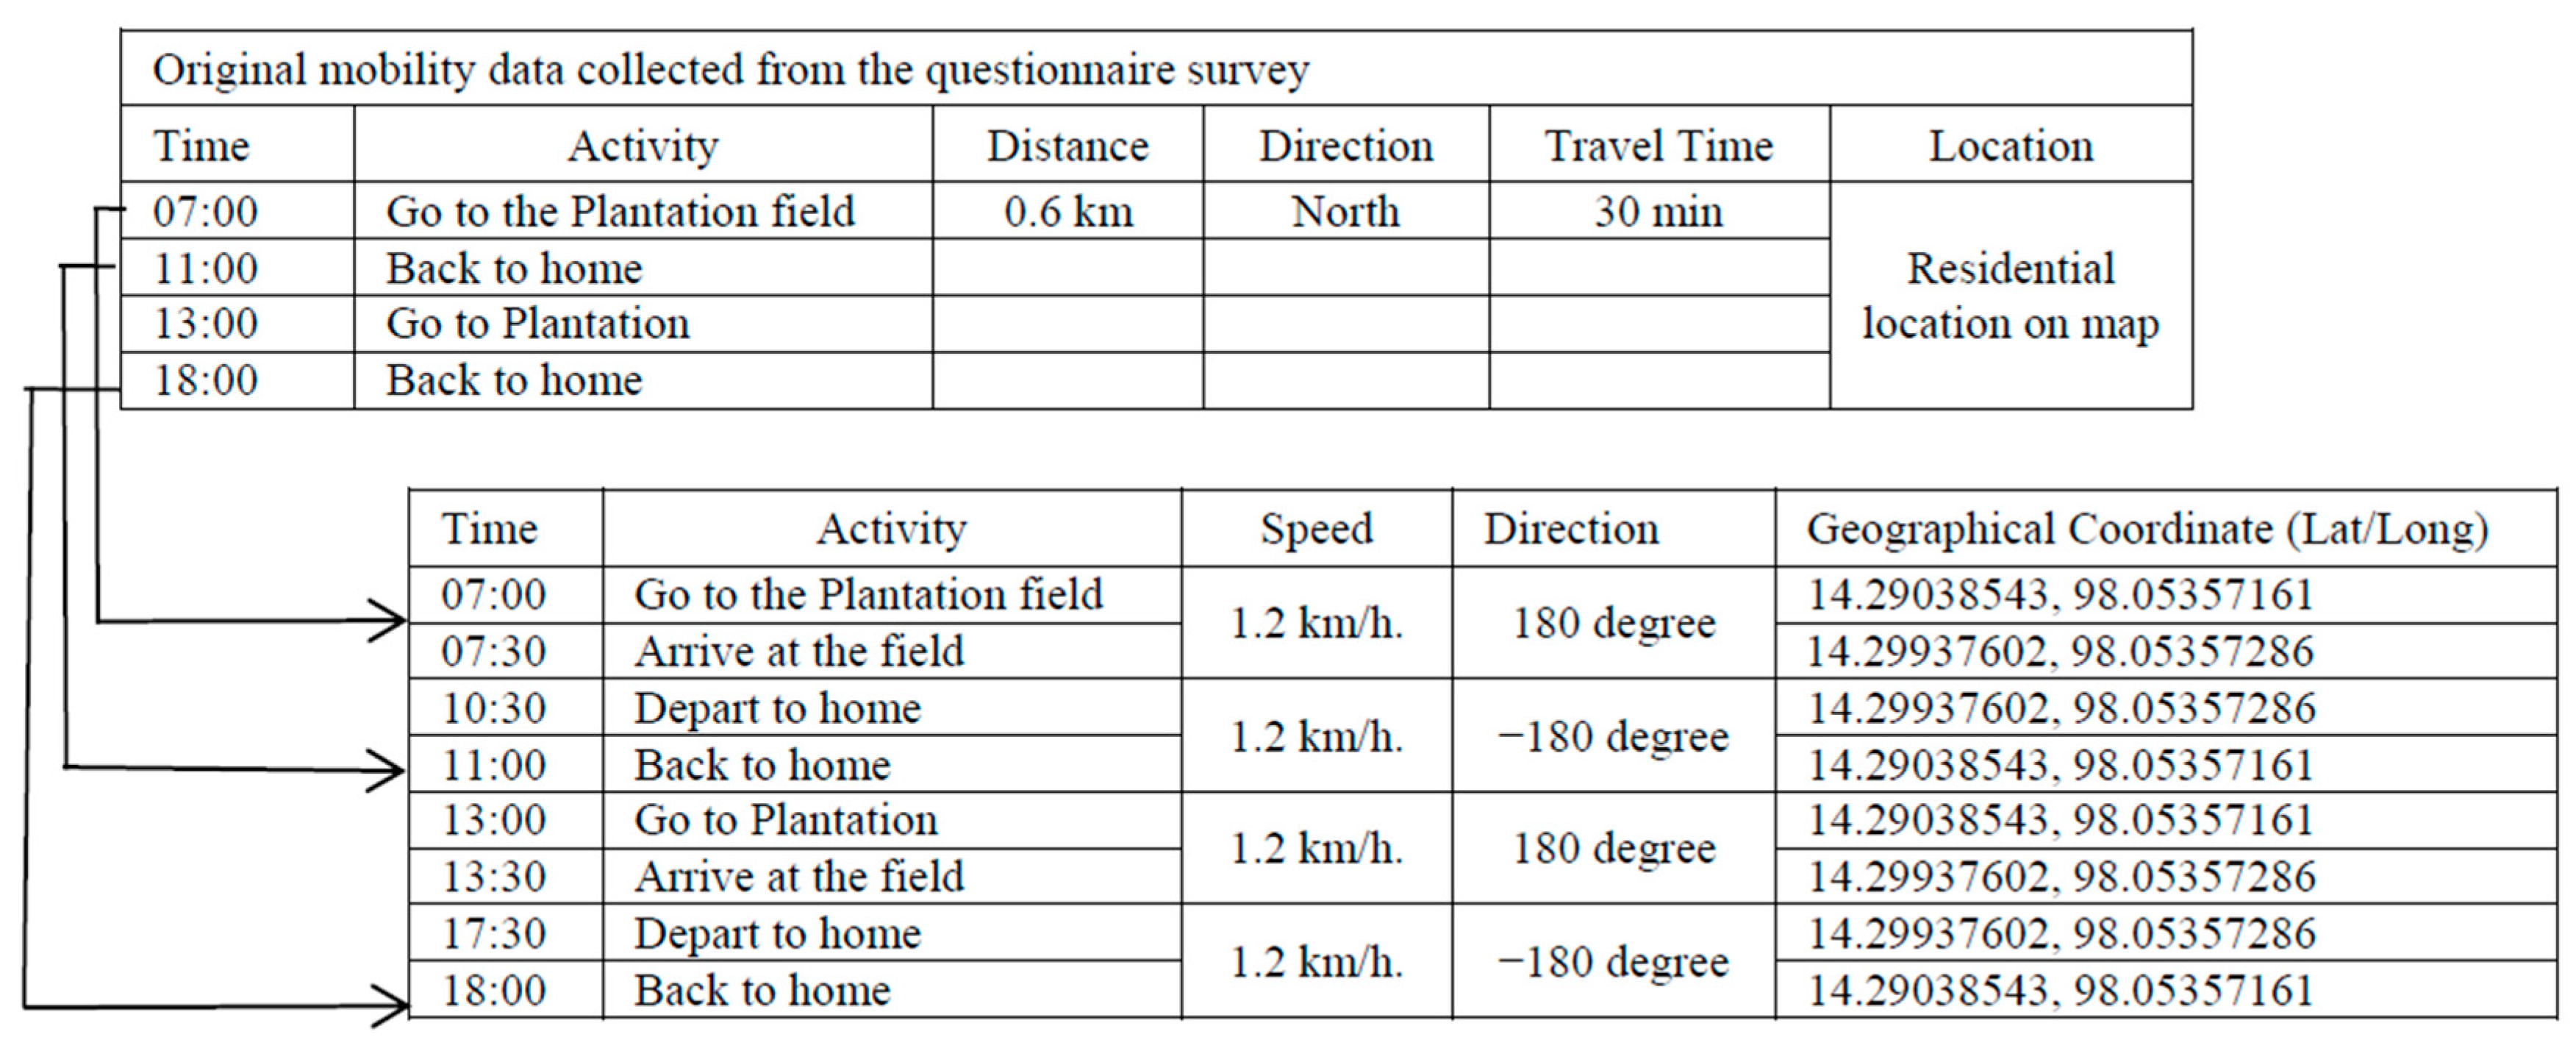
To obtain a clearer picture of the mobility patterns of local villagers, mobility information such as travel origin, destination, distance, direction, transportation mode and travel time in the year 2005, 2010 and 2015 was collected through the questionnaire survey. As described in Section 2.3, respondents followed a defined pattern of work in the weekdays, their mobility was indicative of their regular social and economic engagements. This information is converted to spatiotemporal information by developing an algorithm. Furthermore, the converted data is visualized in a moving format such as an animation which enables one to compare historical changes in daily mobility among local respondents. During the conversion, the geographical coordinates of original residential locations are found on a map. Additionally, that of destination and travel speed are determined by distance and direction, and time and distance, respectively. For example, in Figure 3, the sample departs for the plantation field at 7:00 a.m., located 0.6 km north from the residence, walking 30 min to reach the field. In this case, arriving time to the plantation field, speed per hour, direction and a geographic coordinate of the field are determined as 07:30 a.m., 1.2 km/h, 180 degrees, and 14.29937602, 98.05357286, respectively. All identified spatiotemporal data are listed in a timestamp and saved in a comma-separated value (CSV) format. Simultaneously, a personal profile such as age, sex, marital status, education level, household status, occupation and household income, were also integrated with the file.
The trip frequency, the total travel distance, and travel time are manually calculated from the questionnaire survey and listed in excel format (Table 1). In this study, a single trip is defined as starting from a location to a destination, such as from home to workplace. The total trip frequency, distance, and time are summed for further data validation.
3.3. Stay Point and Moving Segment Extraction from GPS-Based Mobility Data
After the mobility data is obtained with GPS loggers, spatiotemporal data such as time, latitude and longitude are extracted from the devices. The break up of the mobility segment is performed to find the stay points. In this study, stay point extraction with outlier detection and removal technique [11] are employed using the following Equation (1):
where the parameters Dthreh, considerable maximum distance as a stay point, and Tthreh, minimum time spending at the same place, are adjustable. In this study, a stay point is detected if Tthreh > 20 min and Dthreh ≤ 300 m, as these parameters show smaller the average differences between the two datasets. Based on the data manipulation, stay points are extracted and are listed by start-time, end-time, duration, distance in meters, average speed in km/h and the total number of stay points. Additionally, outlier detection and noise removal technique are applied by using standard deviation (σ).
Distance (pstart, pend) < Dthreh and TimeDiff (pstart, pend) > Tthreh
Once the stay points are extracted from the GPS data, the moving segments can be extracted. The extracted parameters in this study are the total travel distance in meters, travel time in minutes, starting time, ending time, average speed km/h and total points. These parameters are calculated for a single mobility by utilizing Java language. The selected parameters such as trip frequency, total travel distance and total travel time from the GPS data were summarized by utilizing the PostgreSQL.
3.4. Differences Calculation of Two Data Sets and Mobility Analysis in Time-Series
After processing the two data sets, the following Equation (2) was employed to calculate the differences between the two data sets by the trip frequency, travel distance and travel time.
Relative Change (x, y) = Absolute difference/Max (x, y) × 100 = |Δ|/Max (x, y) × 100
Based on the level of differences, the average travel distance in the year 2005, 2010 and 2015 obtained from the questionnaire survey is analyzed in time-series. In this process, mobility made out of villages such as in Yangon and Thailand, and unfixed mobility such as daily employment at various places within or outside the villages, are excluded.
3.5. Urban Area Mapping and Its Relation to Mobility Patterns
This study uses two different definitions; urban and non-urban area. Urban areas can be defined by physical aspects such as built-up environment consisting of no-vegetation, human-constructed elements (e.g., roads, buildings, runways, and industrial facilities) while non-urban areas have opposite characteristics (e.g., open spaces, forest, and agricultural fields) [33]. The target area of 35 × 55 km is divided into smaller areas of 5 × 5 km each, generating a total of 462 scenes. Different band combinations are helpful for highlighting different features on the ground, and an application of a near-infrared or shortwave infrared color composite can emphasize contrast between materials [34]. The standard infrared false color composite Red:Green:Blue (R:G:B) = 4:3:2 is applied in this study. The urban areas are digitized with reference maps such as Google Maps, Openstreet Maps, and Bing Maps.
After extracting the vector files, the urban areas are calculated in the timeline by utilizing GIS. The change in the average travel distance in the year 2005, 2010 and 2015 is additionally assessed with the extracted urban area in time-series. Regression analysis is performed to interpolate the missing values needed for a further correlation analysis.
4. Results and Discussion
4.1. Conversion and Visualization of Questionnaire-Based Human Mobility Data
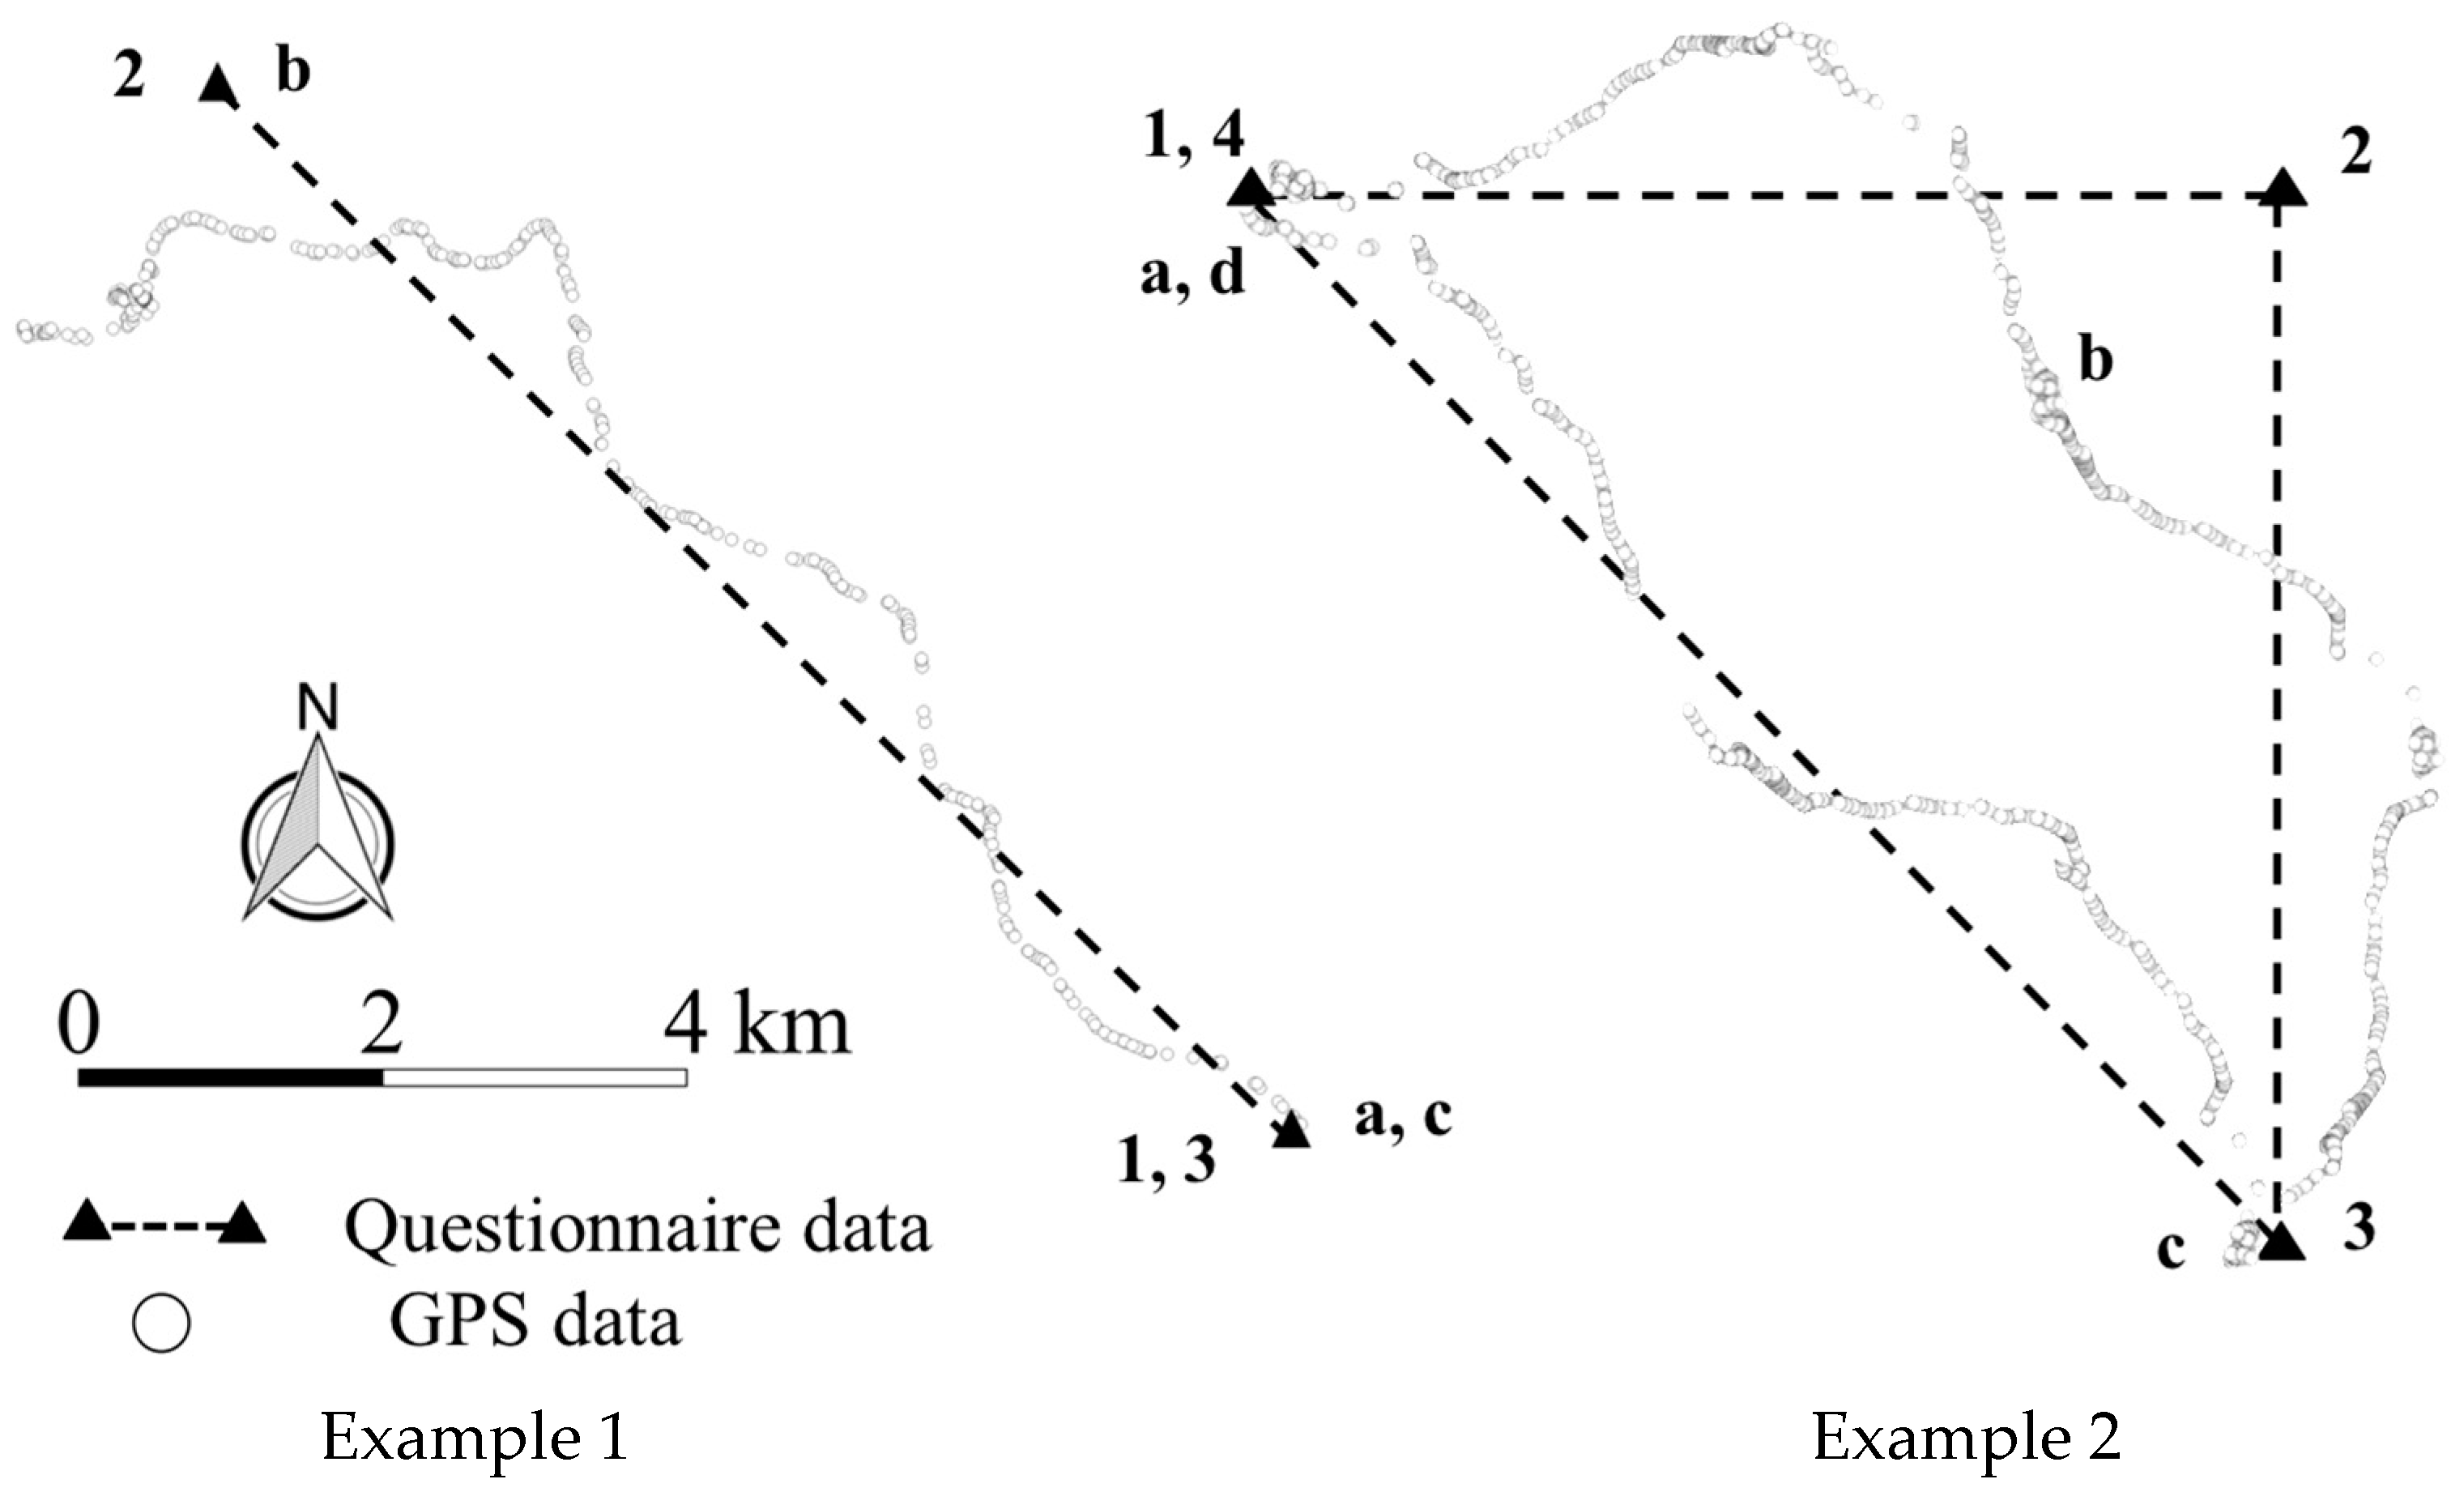
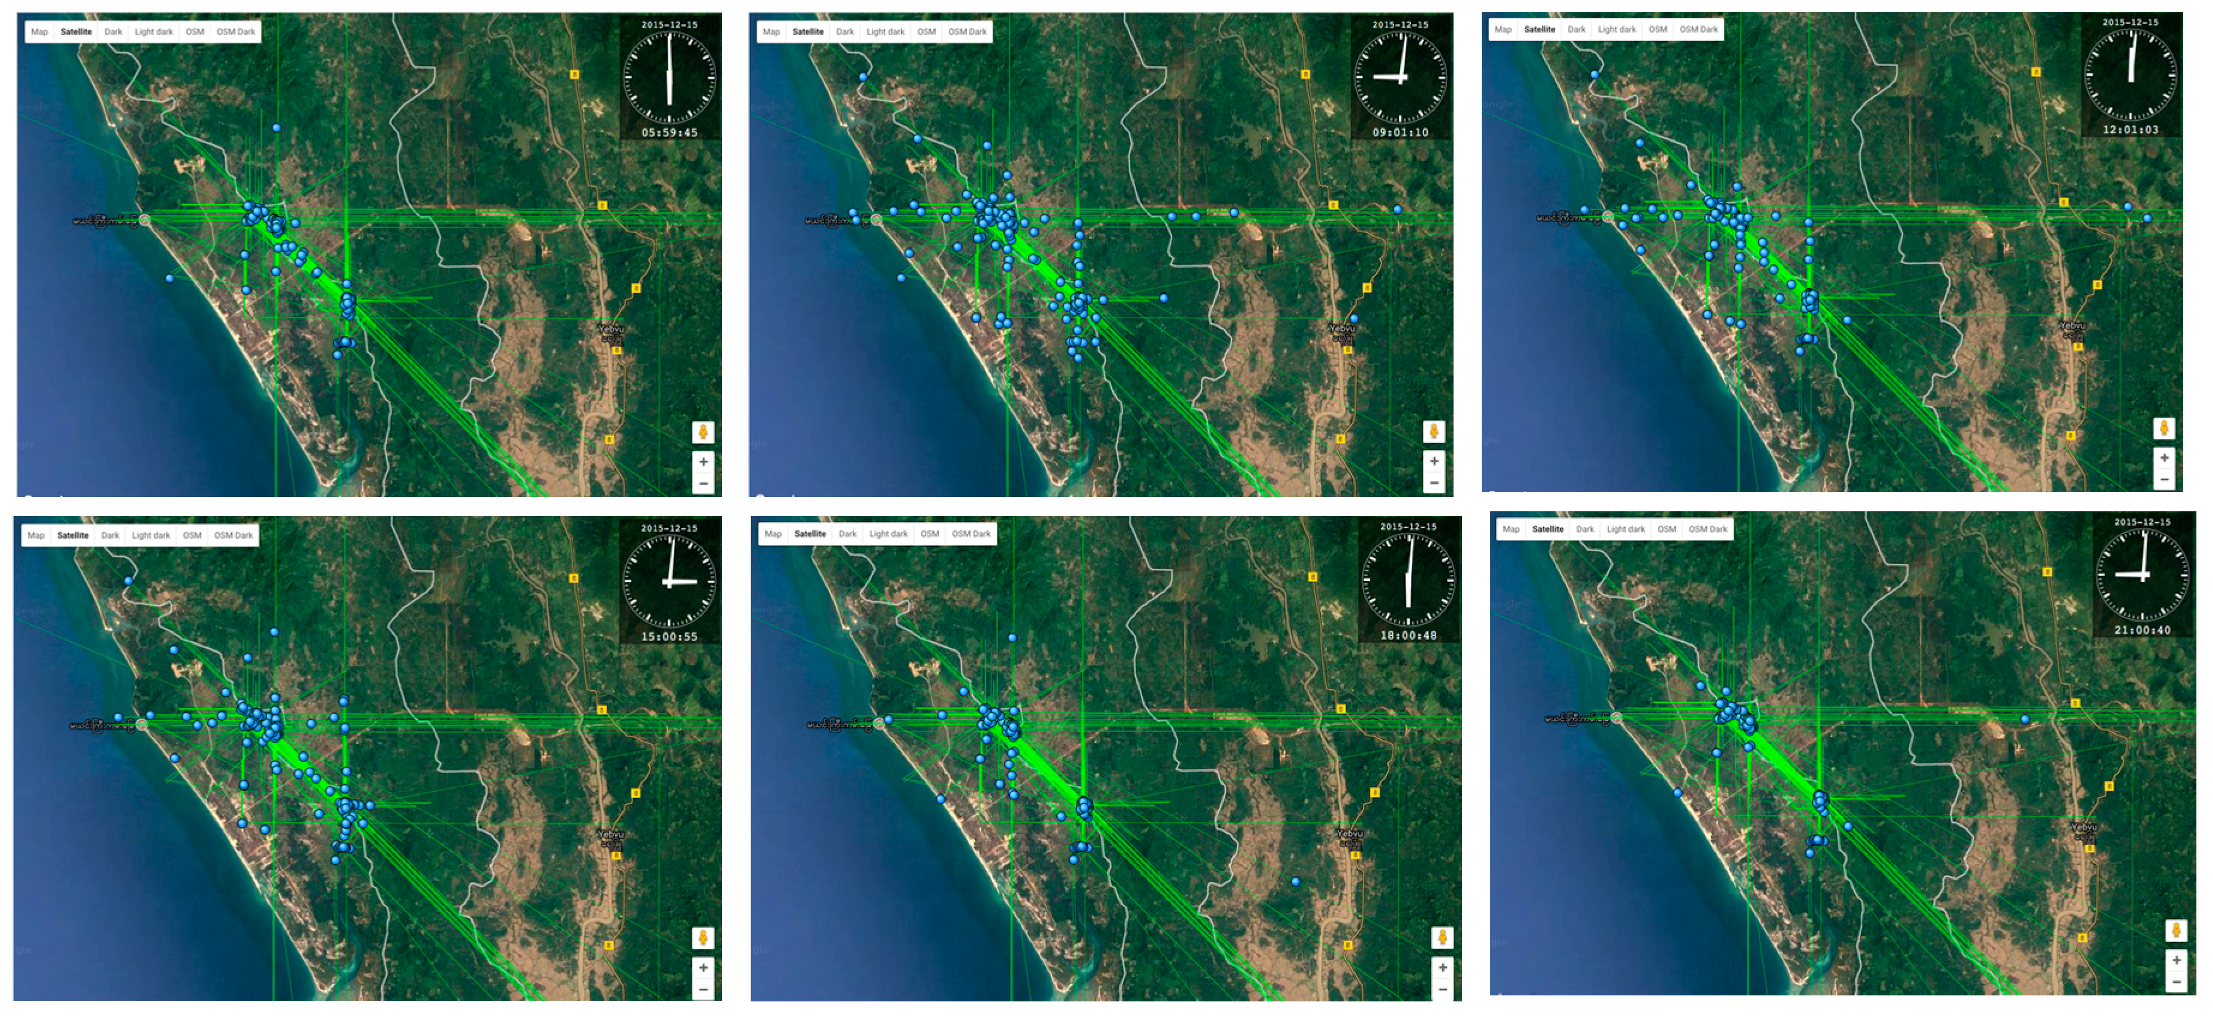
The human mobility data is converted to the spatiotemporal data as described in Section 3.2 and visualized together with GPS-based mobility data. Figure 4 shows that the questionnaire-based human mobility data of Example 1 consists of 3 waypoints, and that of Example 2 is 4 waypoints. The number and alphabet described next are the trip order. Figure 5 provides the visualization of questionnaire data resulting at 6:00 a.m., 9:00 a.m., 12:00 p.m., 15:00 p.m., 18:00 p.m., and 21:00 p.m. Those mobility data can also be displayed according to the attributes obtained from the questionnaire survey.
It can be said that questionnaire-based human mobility data are successfully converted by the proposed methodology and ambiguous human mobility from the local knowledge are visualized. This conversion of human mobility data is significant in areas where neither significant landmarks nor GIS data is well developed. Even though traditional mobility data such as questionnaire survey and diary can only be displayed at the individual level [35], this method enables a large volume of mobility data to be visualized simultaneously and also compare mobility patterns in time-series. Therefore, this contributes to discovering changes of human mobility patterns. Illustrative visualization is easy to understand, and more information can be obtained for a better understanding of the underlying tendency behind the data [9]. The workflow can be applied to other areas where topological representation plays a significant role, to symbolize rural human mobility and its change.
4.2. Validation of Questionnaire-Based Mobility Data by GPS Logger-Based Mobility Data
To validate the questionnaire-based human mobility data, the average differences between two data sets were calculated based on the daily aggregate as described in Section 3.4. This reveals a total of 532 trips, with a total 1768.3 km travel distance and 7263.0 min of travel time from the questionnaire survey. While data extracted from the GPS logs shows a total of 924 moving trips. Among these identified moving trips, travel time less than 1.5 min, GPS points recorded less than 18, and the average speed more than 75 km/h were excluded. As a result, the data from the GPS logs was summarized as a total of 368 trips, 2231.3 km travel distance and 7217.4 min of travel time. There were significant differences in mean trip frequency and travel distance between questionnaire and GPS-based trip data (t = 5.826, p < 0.005, t = −3.655, p < 0.005, respectively). The average trip frequency and travel distance for questionnaire-based trip data were 0.689 times and −11,529.3 km higher than that of GPS-based mobility data, respectively. While any significant difference was not found in mean travel time (t = 0.105, p > 0.001).
The result shows the average differences between the two data sets as 25.1%, 33.3% and 36.0% by trip frequency, travel distance and travel time, respectively (Table 2). Those differences between the two data sets can be generated from the different definition given to the parameters during the data processing and that of single mobility recognized by the local villagers. Several studies conducted in the developed countries such as Australia, United States of America and the United Kingdom show much larger differences in travel time between GPS and self-reported data, 75.4%, 62.4%, 46.7%, respectively [23]. In this line, the lower magnitude of differences between two data sets allows our study to take the questionnaire-based human mobility data in the year 2005, 2010 and 2015 to assess the change in time-series.
4.3. Change of Mobility Patterns
Changes in the daily travel patterns in the year 2005, 2010 and 2015 are described in Table 3. The mean daily trip frequency between 2005 and 2010 is not different (F = 38.736, p > 0.005); however, that of 2010 and 2015 show significant differences. While, travel distances increase yearly, and the changes are 1.5 and 2.6 times in the year 2005–2010 and 2010–2015, respectively. The mean travel distance between the year 2005 and 2010 is not different; however, that of 2010 and 2015 shows significant differences (F = 24.646, p < 0.005). Travel time does not show a significant difference over a period of 10 years (F = 3.030, p > 0.005). Based on the trend, it can be said that the largest change of mobility change is the increase of travel distance which has resulted from the change in travel status and transport modes. Table 4 describes travel status and transport mode by year, of which the travel status is comprised of non-travel and travel including walking, traveling by motorbike, car or other modes such as animal-drawn carts and ferry. Non-travel indicates staying at home for the whole day, which can be an important parameter to indicate the changes in regular social and economic engagement associated with the development. Non-travel was decreased from the year 2005 (30.0%) to 2015 (18.3%). Furthermore, the motorbike mode increased 5.5 times from the year 2005 (9.2%) to 2015 (50.6%). The change of transport mode from walking to motorbike riding, was largely observed among females. Project-induced employment opportunities such as local project staff, surveyor, and road construction workers largely contributed to this mobility increase with the change of transport mode. It can be confirmed that as the travel distance increased, the travel status and transport mode also changed. Even though daily travel time does not show a significant difference over 10 years, travel distance per day largely increased due to the increased use of motorbike. This may lead to socio-economic benefits such as reduced time and costs [36], which may positively contribute to poverty reduction in terms of reducing isolation and improving villagers’ access to goods and services [37] in this urban formation stage.
Sex and age were the important parameters for assessing diverse impacts from socio-economic development, and useful insights could be extracted from the human mobility perspective. Therefore, the daily travel distances in the year 2005, 2010 and 2015 and its increasing rate during 2005–2010 and 2010–2015 were compared with respect to sex and age (Table 5). In Table 5, the average male travel distance during 2005–2010 and 2010–2015 increased by 2.6 and 1.7 times and that of females by 1.6 and 2.6 times, respectively.
The notable increase in the female age group of 16–20 years during 2010–2015 was found due to occupational changes from being a student to working in agriculture, non-agriculture and other activities. Several females travel to a city university, thus making the search for higher education one of the main driving factors for this age group. The higher rate of increase for the female age group of 21–30 years during 2010–2015 (4.9 and 3.7 times, respectively) was found to be a result of their engagement in project-related employment, including as office staff and as laboratory workers at the project camp which required traveling by motorbike to the workplace. On the other hand, for the male age group of 31–40 and 41–50 years during 2005–2010 increased by 3.0 and 3.3, respectively, due to the increased use of motorbikes. The higher increase for the female age group of 31–40 years during 2010–2015 was found as a result of increased mobility to the city for business work. This tendency in this age group can also be found in the female age group of 41–50 years, showing increases of 2.8 times. Furthermore, the male age group of 51–60 years during 2010–2015 years increased by 3.0 times. This notable increase is found as a result of increased engagement in non-agricultural activities, such as driving taxis, resulting in business expansion. Moreover, the increases in the male travel distances during 2005–2010 could be the result of increased use of motorbike mode without significant changes in occupation. No significant changes were found among the male age groups of 31–40 years (1.3 times), 41–50 years (1.2 times) and above 61 years (1.4 times). Similarly, insignificant changes were observed for the female age group of 51–60 years (0.4 times) and above 61 years (1.1 times) due to non-significant changes in occupation and transport mode.
The above analysis enriches our knowledge about the diverse interaction of local villagers along with the socio-economic transformation, which is neither focused nor derived from the existing dataset. Local mobility patterns have been gradually restructured according to the surrounding socio-economic transformations, which was also found in the context of industrialization and penetration of exterior market [2,38]. In addition, these changes affect local villagers’ mobility pattern differently and indeed diverse mobility changes have been observed with respect to social parameters such as age group and sex. Understanding human mobility patterns and their changes can be closely linked to local livelihood and its change. In the long-term development, the Dawei project in Myanmar facilitates the opening of the Southern Economic Corridor, which can be a significant linkage between Mekong-India Economic Corridor overpassing the Indian Ocean and further strengthening regional connectivity [39]. According to the rapid and massive project development, which will be further accelerated in the near future, it is expected that local livelihood will be diversely restructured from traditional agricultural activities to non-farm activities. Therefore, this human mobility analysis would provide some initial insights into the dynamics of interaction of local villagers in the rapid developmental context. Furthermore, it would also provide significant monitoring of the opportunities and vulnerabilities of the local population.
4.4. Application of Mobility Patterns to Land Cover Change
Identifying a long-term human mobility change by merging both questionnaire survey and GPS data enabled researchers to conduct further analysis associated with socio-economic parameters such as income, population, economic growth and land use change to find a relationship. As one of the applications, the travel distances were further assessed together with the urban area detected from the Landsat satellite imagery. In this study, 3 years’ travel distance data identified in Section 4.3 was utilized for a correlation analysis. Travel distances associated with urban area growth will reach saturation point in the future; however, this correlation analysis provides a useful insight to understand human mobility behavior under the stage of urban formation.
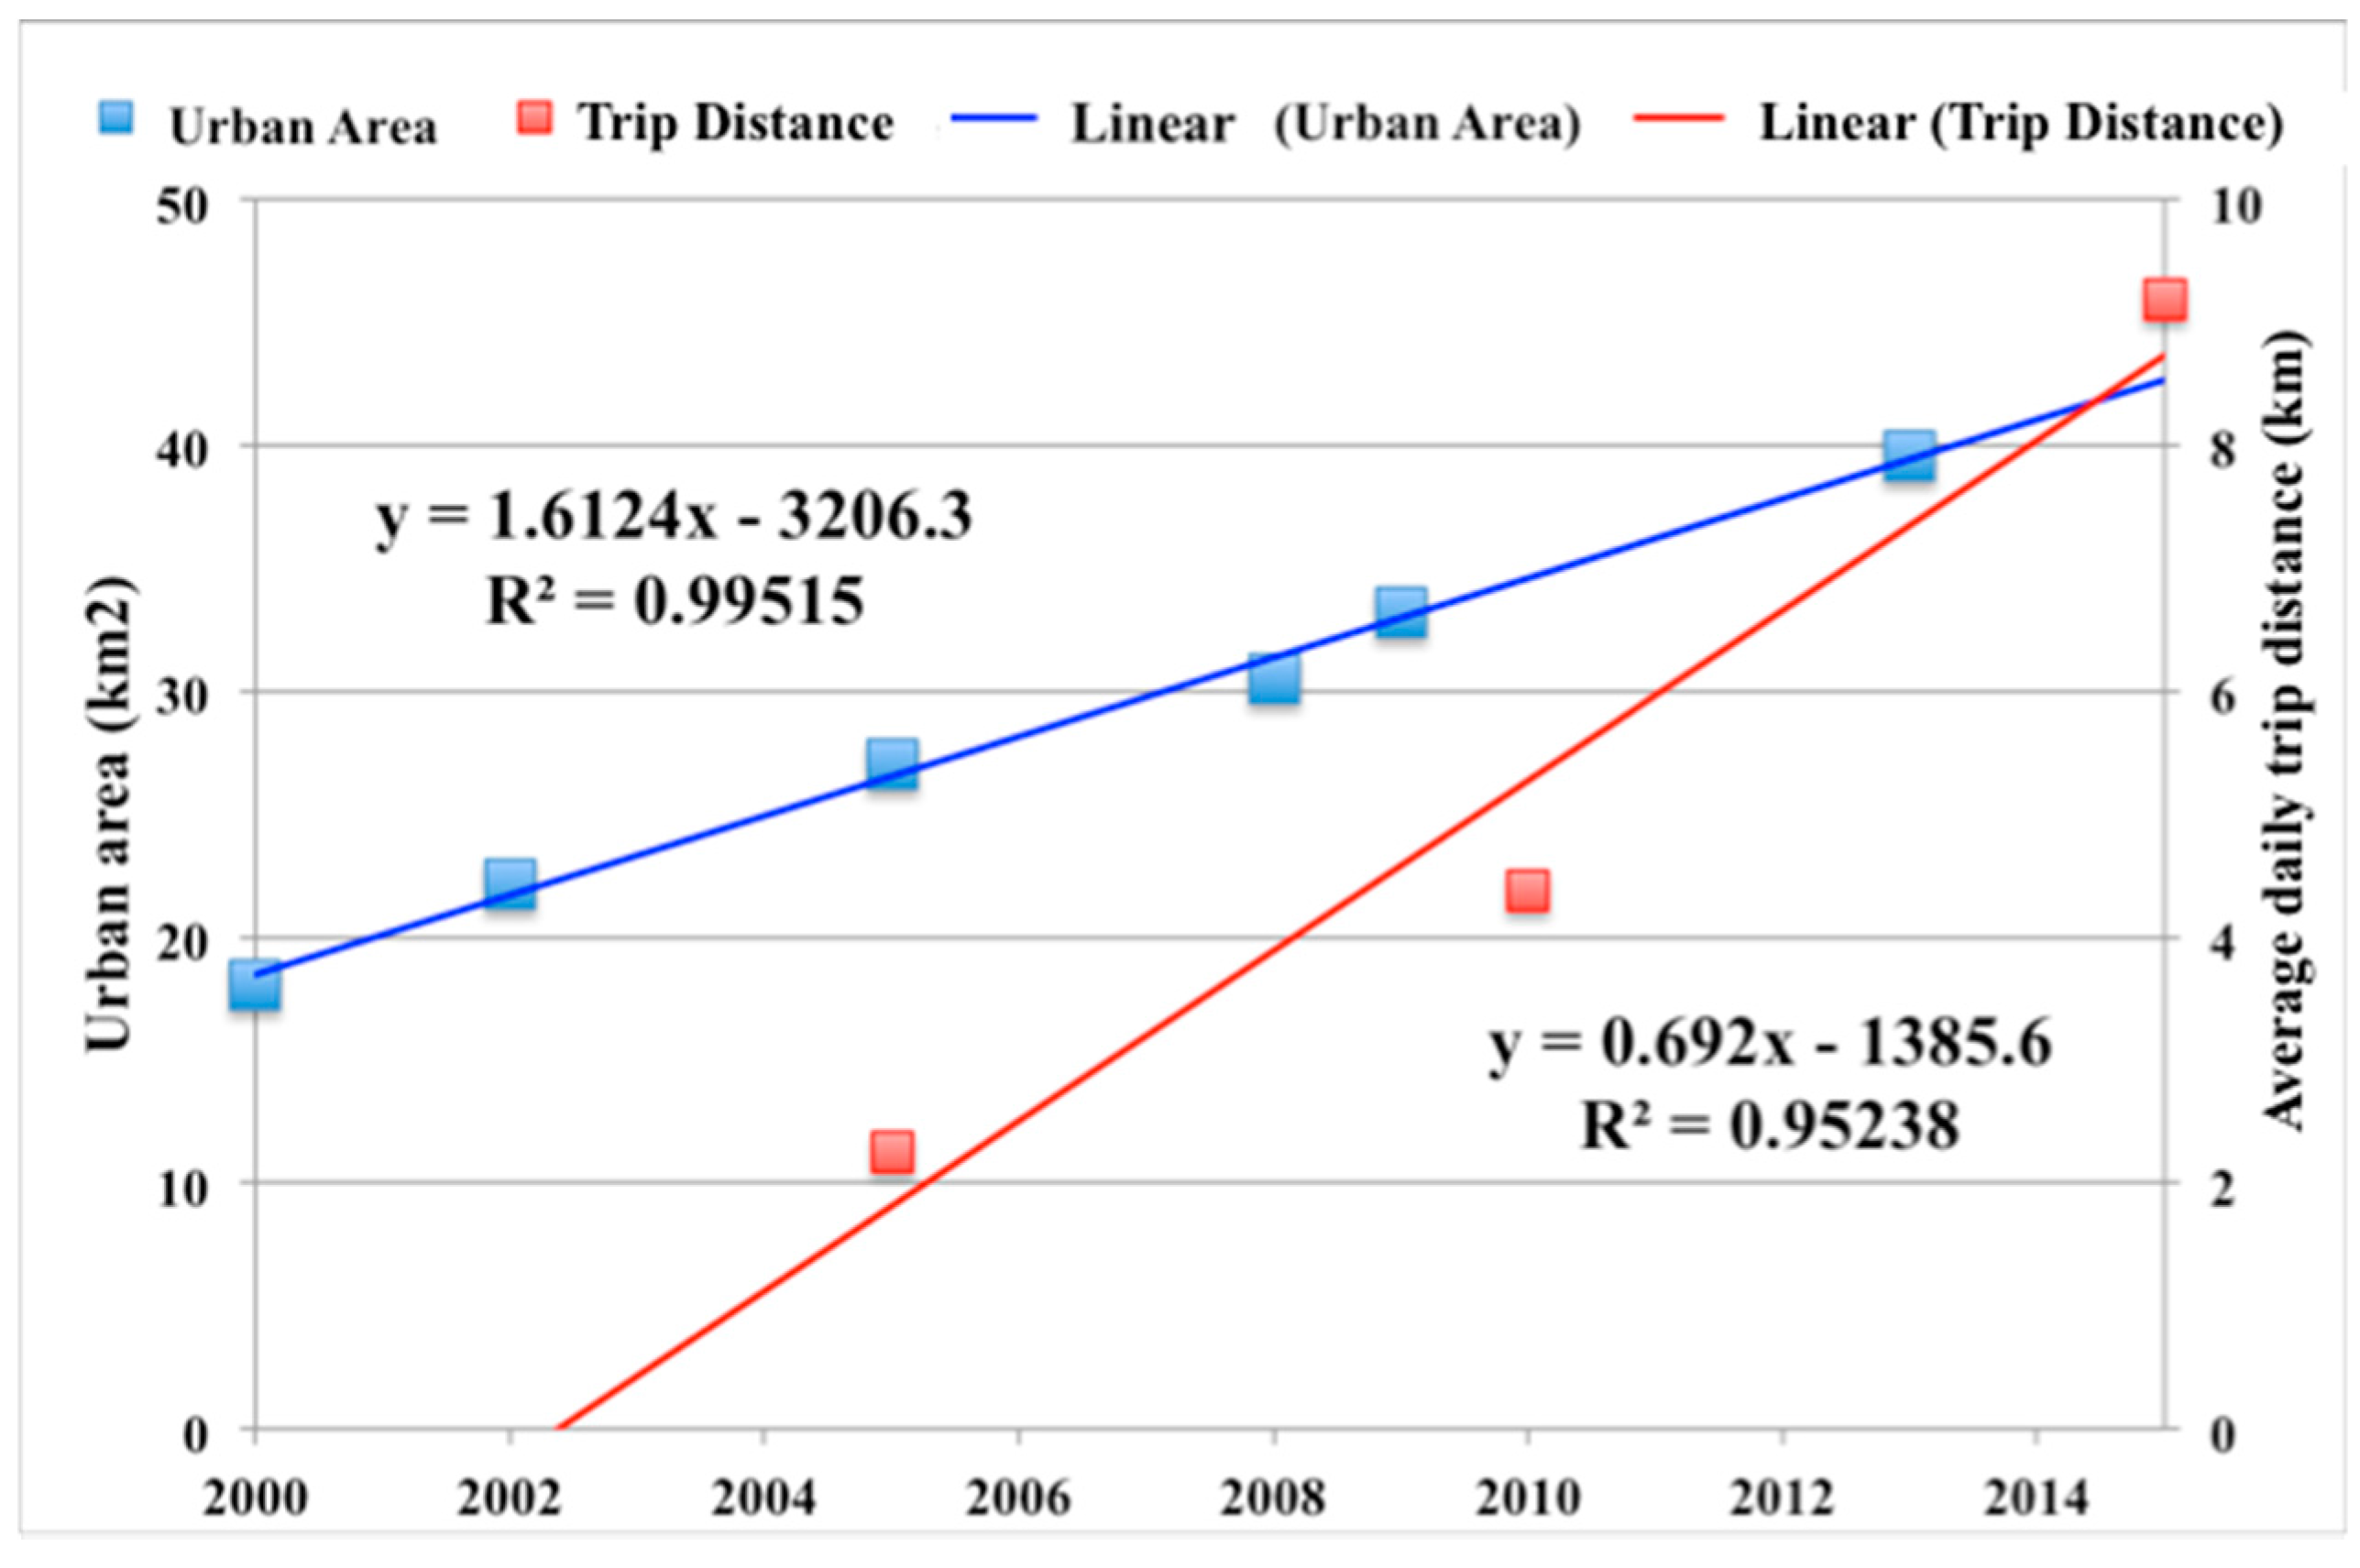
The urban areas extracted in time-series are 18.02 km2, 22.19 km2, 27.05 km2, 30.54 km2, 33.17 km2 and 39.56 km2 in the year 2000, 2002, 2005, 2008, 2009 and 2013, respectively (Figure 6). Based on the recognized urban area, the correlation between daily travel distance and the urban area was assessed. Regression analysis was conducted to interpolate both data from 2000 to 2015. The result of the regression analysis indicated that the two values are both positively related to a correlation coefficient of r2 = 0.99515 (urban area) as well as r2 = 0.95238 (average travel distance) (Figure 7). Furthermore, the result from the correlation analysis showed a correlation coefficient value of 1.0, indicating an adamant relation between two values.
According to the above analyses, it can be concluded that travel distance of local population has been associated with substantial changes in the increase of the urban area in the stage of urban formation in our study area. This travel distance is expected to be increased with the creation of economic activities along with further urban growth. The result may support the argument that mobility developments associated with new road increased travel distance among local villagers associating with well-paid working opportunities, catalyzing for economic development by restructuring local mobility pattern [25,40]. Overlapping trip trajectory with urban area map extracted from higher resolution satellite imagery further helps to explain diverse trip characteristics and its changes in the future.
Along with the project infrastructure development, the number of vehicles and its moving capacity will be largely improved. This larger increase of vehicles and travel time induced by infrastructure development can directly be indicative of generating accident [41], health risks such as air pollution [42], and local climate and ecological system changes [43] in the study area. Therefore, there must be continuously studies on further local impacts on environment, health and life style, and human mobility perspective would provide useful insights explaining reactions of the local population.
5. Conclusions
The technological development for tracking human mobility data by GPS-equipped devices such as mobile phone and taxi provides opportunities to study human mobility pattern. This contributes to the understanding of the interactions of local villagers under rapid socio-economic and environmental transformations. In this paper, questionnaire-based human mobility data was indexed and merged with GPS logger-based mobility data to analyze a long-term human mobility pattern associated with socio-economic development. A brief workflow is proposed to index questionnaire-based human mobility data and assess a long-term human mobility pattern by social parameters. A case study of DSEZ in Myanmar is conducted to illustrate the approach. Questionnaire-based human mobility data can be associated with GPS data, and diverse mobility patterns are found by social parameters. In addition, the highest correlation is found between the identified long-term human mobility and urban area.
Human mobility can be a useful parameter for extracting local interaction under rapid socio-economic and environmental transformations. As transformations in the study area will be extremely accelerated in the future, exploring human mobility patterns help in understanding local activities and their changes at a community level. Accumulated data further enables measurements of the sustainability of the rural community associated with the rapid changes. Furthermore, exploring diverse individual mobility patterns within a community together with economic parameters provides a useful insight for identifying the vulnerable population and helping to challenge rural sustainability.
This methodology can be used for understanding changes of livelihood and its monitoring in other places where topological representation is greatly required due to lack of historical and geoinformatics data. Especially, in areas with rapid socio-economic changes resulting in the establishment of SEZs in Southeast Asia such as Cambodia and Laos, the methodology can be applicable. Human mobility perspective can be a significant parameter to understanding a development process of rural community associated with the rapid change and provide useful insight for challenging rural sustainability.
Author Contributions
Satomi Kimijima contributed to design the research, conduct, data collection and data analysis. Masahiko Nagai provided conceptual advice and critical comments.
Conflicts of Interest
The authors declare no conflict of interest.
References
- Saith, A. The Rural Non-Farm Economy: Processes and Policies; ILO: Geneva, Switzerland, 1992. [Google Scholar]
- Leinbach, T.R. Mobility in development context: Changing perspectives, new interpretations, and the real issues. J. Transp. Geogr. 2000, 8, 1–9. [Google Scholar] [CrossRef]
- Wilson, J. Measuring Personal Travel and Goods Movement: A Review of the Bureau of Transportation Statistics’ Surveys; National Research Council: Ottawa, ON, Canada, 2004.
- Zimowski, M.; Tourangeau, R.; Ghadialy, R.; Pedlow, S. Non Response in Household Travel Surveys; Federal Highway Administration: Washington, DC, USA, 1997; Volume 60615.
- Wolf, J.; Guensler, R.; Bachman, W. Elimination of the travel diary: Experiment to derive trip purpose from global positioning system travel data. Transp. Res. Rec. 2001, 1768, 125–134. [Google Scholar] [CrossRef]
- McGowen, P.; McNally, M. Evaluating the potential to predict activity types from GPS and GIS data. In Proceedings of the Transportation Research Board 86th Annual Meeting, Washington, DC, USA, 21–25 January 2007. [Google Scholar]
- Chen, C.; Gong, H.; Lawson, C.; Bialostozky, E. Evaluating the feasibility of a passive travel survey collection in a complex urban environment: Lessons learned from the New York City case study. Transp. Res. Part A 2010, 44, 830–840. [Google Scholar] [CrossRef]
- Stopher, P.; FitzGerald, C.; Zhang, J. Search for a global positioning system device to measure person travel. Transp. Res. Part C 2008, 16, 350–369. [Google Scholar] [CrossRef]
- Andrienko, G.; Andrienko, N.; Augustin, S. Visual analytics tools for analysis of movement data. ACM SIGKDD Explor. Newsl. 2007, 9, 38–46. [Google Scholar] [CrossRef]
- Andrienko, N.; Andrienko, G. Visual analytics of movement: An overview of methods, tools and procedures. Inf. Vis. 2013, 12, 3–24. [Google Scholar] [CrossRef]
- Witayangkurn, A.; Horanont, T.; Ono, N.; Sekimoto, Y.; Shibasaki, R. Trip reconstruction and transportation mode extraction on low data rate GPS data from mobile phone. In Proceedings of the International Conference on Computers in Urban Planning and Urban Management, Utrecht, The Netherlands, 2–5 July 2013; pp. 1–19. [Google Scholar]
- Lwin, K.K.; Murayama, Y. Person trip data browser, analyzer and space-time visualizer. In Proceedings of the 2015 2nd IEEE International Conference on Spatial Data Mining and Geographical Knowledge Services (ICSDM), Fuzhou, China, 8–10 July 2015; pp. 12–17. [Google Scholar]
- Wendy, B.; Maat, K. Deriving and validating trip purposes and travel modes for multi-day GPS-based travel surveys: A large-scale application in The Netherlands. Transp. Res. Part C 2009, 17, 285–297. [Google Scholar]
- Gong, H.; Chen, C.; Bialostozky, E.; Lawson, C.T. A GPS/GIS method for travel mode detection in New York City. Comput. Environ. Urban Syst. 2012, 36, 131–139. [Google Scholar] [CrossRef]
- Chung, E.-H.; Shalaby, A. A trip reconstruction tool for GPS-based personal travel surveys. Transp. Plan. Technol. 2005, 28, 381–401. [Google Scholar] [CrossRef]
- Stenneth, L.; Wolfson, O.; Yu, P.S.; Xu, B. Transportation mode detection using mobile phones and GIS information. In Proceedings of the 19th ACM SIGSPATIAL International Conference on Advances in Geographic Information Systems, Chicago, IL, USA, 1–4 November 2011; p. 54. [Google Scholar]
- Asakura, Y.; Hato, E. Tracking survey for individual travel behaviour using mobile communication instruments. Transp. Res. Part C 2004, 12, 273–291. [Google Scholar] [CrossRef]
- Asakura, Y.; Iryo, T. Analysis of tourist behaviour based on the tracking data collected using a mobile communication instrument. Transp. Res. Part A 2007, 41, 684–690. [Google Scholar] [CrossRef]
- Phithakkitnukoon, S.; Horanont, T.; Witayangkurn, A.; Siri, R.; Sekimoto, Y.; Shibasaki, R. Understanding tourist behavior using large-scale mobile sensing approach: A case study of mobile phone users in Japan. Pervasive Mob. Comput. 2015, 18, 18–39. [Google Scholar] [CrossRef]
- Gong, L.; Morikawa, T.; Yamamoto, T.; Sato, H. Deriving personal trip data from GPS data: A literature review on the existing methodologies. Procedia 2014, 138, 557–565. [Google Scholar] [CrossRef]
- Yang, X.; Zhao, Z.; Lu, S. Exploring spatial-temporal patterns of urban human mobility hotspots. Sustainability 2016, 8, 674. [Google Scholar] [CrossRef]
- Calabrese, F.; Ratti, C.; Colonna, M.; Lovisolo, P.; Parata, D. Real-time urban monitoring using cell phones: A case study in Rome. IEEE Trans. Intell. Transp. Syst. 2011, 12, 141–151. [Google Scholar] [CrossRef]
- Kelly, P.; Krenn, P.; Titze, S.; Stopher, P.; Foster, C. Quantifying the difference between self-reported and global positioning systems-measured journey durations: A systematic review. Transp. Rev. 2013, 33, 443–459. [Google Scholar] [CrossRef]
- Stopher, P.; FitzGerald, C.; Xu, M. Assessing the accuracy of the Sydney Household Travel Survey with GPS. Transportation 2007, 34, 723–741. [Google Scholar] [CrossRef]
- Won, S.; Kim, S. Mobility is in the eye of the beholder: A comparison of travel patterns and urban spatial use between migrants and the original residents of Danang, Vietnam. Cities 2017, 67, 63–73. [Google Scholar] [CrossRef]
- Liu, W.; Lu, H.; Sun, Z.; Liu, J. Elderly’s travel patterns and trends: The empirical analysis of Beijing. Sustainability 2017, 9, 981. [Google Scholar] [CrossRef]
- Sekine, Y. Land confiscations and collective action in Myanmar’s Dawei special economic zone area: Implications for rural democratization. In Proceedings of the Global Governance/Politics, Climate Justice & Agrarian/Socialjustice: Linkages and Challenges, The Hague, The Netherlands, 4–5 February 2016. [Google Scholar]
- Kruewan, M. Thailand Development Policy for Neighboring Countries: Dawei Development Project Case Study; Thailand Ministry of Finance: Bangkok, Thailand, 2014.
- Ministry of Economic Trade and Industry. Research on Technical Evaluation for Promoting Dawei SEZ Development in FY2014; Ministry of Economic, Trade and Industry: Tokyo, Japan, 2015.
- Shekhar, S.; Coyle, M.; Goyal, B.; Liu, D.R.; Sarkar, S. Data models in geographic information systems. Commun. ACM 1997, 40, 103–111. [Google Scholar] [CrossRef]
- Mobile Action. MobileAction Technology—i-gotU Official Site. Available online: http://www.i-gotu.com/ (accessed on 17 September 2015).
- Bricka, S.G.; Sen, S.; Paleti, R.; Bhat, C.R. An analysis of the factors influencing differences in survey-reported and GPS-recorded trips. Transp. Res. Part C 2012, 21, 67–88. [Google Scholar] [CrossRef]
- Miyazaki, H.; Kimijima, S.; Nagai, M.; Iwao, K.; Shibasaki, R. Crowd-sourcing GIS for global urban area mapping. In Proceedings of the 33rd Asian Conference Remote Sensing, Pattaya, Thailand, 26–30 November 2012; p. A4-2. [Google Scholar]
- Japan Association on Remote Sensing. Remote Sensing Note; Japan Association on Remote Sensing: Tokyo, Japan, 1993. [Google Scholar]
- Yu, H.; Shaw, S. Representing and visualizing travel diary data: A spatio-temporal GIS approach. In Proceedings of the 2004 ESRI International User Conference, San Diego, CA, USA, 9–13 August 2004; pp. 1–13. [Google Scholar]
- Bryceson, D.F.; Bradbury, A.; Bradbury, T. Roads to poverty reduction? Exploring rural roads’ impact on mobility in Africa and Asia. J. Dev. Policy Rev. 2008, 26, 459–482. [Google Scholar]
- Fernando, P.; Porter, G. Balancing the Load: Women, Gender and Transport; Zed Books: London, UK, 2002. [Google Scholar]
- Leinbach, T.R. Transport and third world development: Review, issues, and prescription. Transp. Res. Part A 1995, 29, 337–344. [Google Scholar] [CrossRef]
- Asian Development Bank. Myanmar in Transition; Asian Development Bank: Manila, Philippines, 2011. [Google Scholar]
- IIssah, T.; Khan, Y.; Sasaki, K. Do migrants react to infrastructure difference between urban and rural areas? Development of an extended Harris-Todaro model. Rev. Urban Reg. Dev. Stud. 2005, 17, 68–88. [Google Scholar] [CrossRef]
- Cervero, R. Linking urban transport and land use in developing countries. J. Transp. Land Use 2013, 6, 7–24. [Google Scholar] [CrossRef]
- Tung, H.D.; Tong, H.Y.; Hung, W.T.; Anh, N.T.N. Development of emission factors and emission inventories for motorcycles and light duty vehicles in the urban region in Vietnam. Sci. Total Environ. 2011, 409, 2761–2767. [Google Scholar] [CrossRef] [PubMed]
- Kityuttachai, K.; Tripathi, N.K.; Tipdecho, T.; Shrestha, R. CA-Markov analysis of constrained coastal urban growth modeling: Hua hin Seaside City, Thailand. Sustainability 2013, 5, 1480–1500. [Google Scholar] [CrossRef]
Figure 1.
DSEZ.
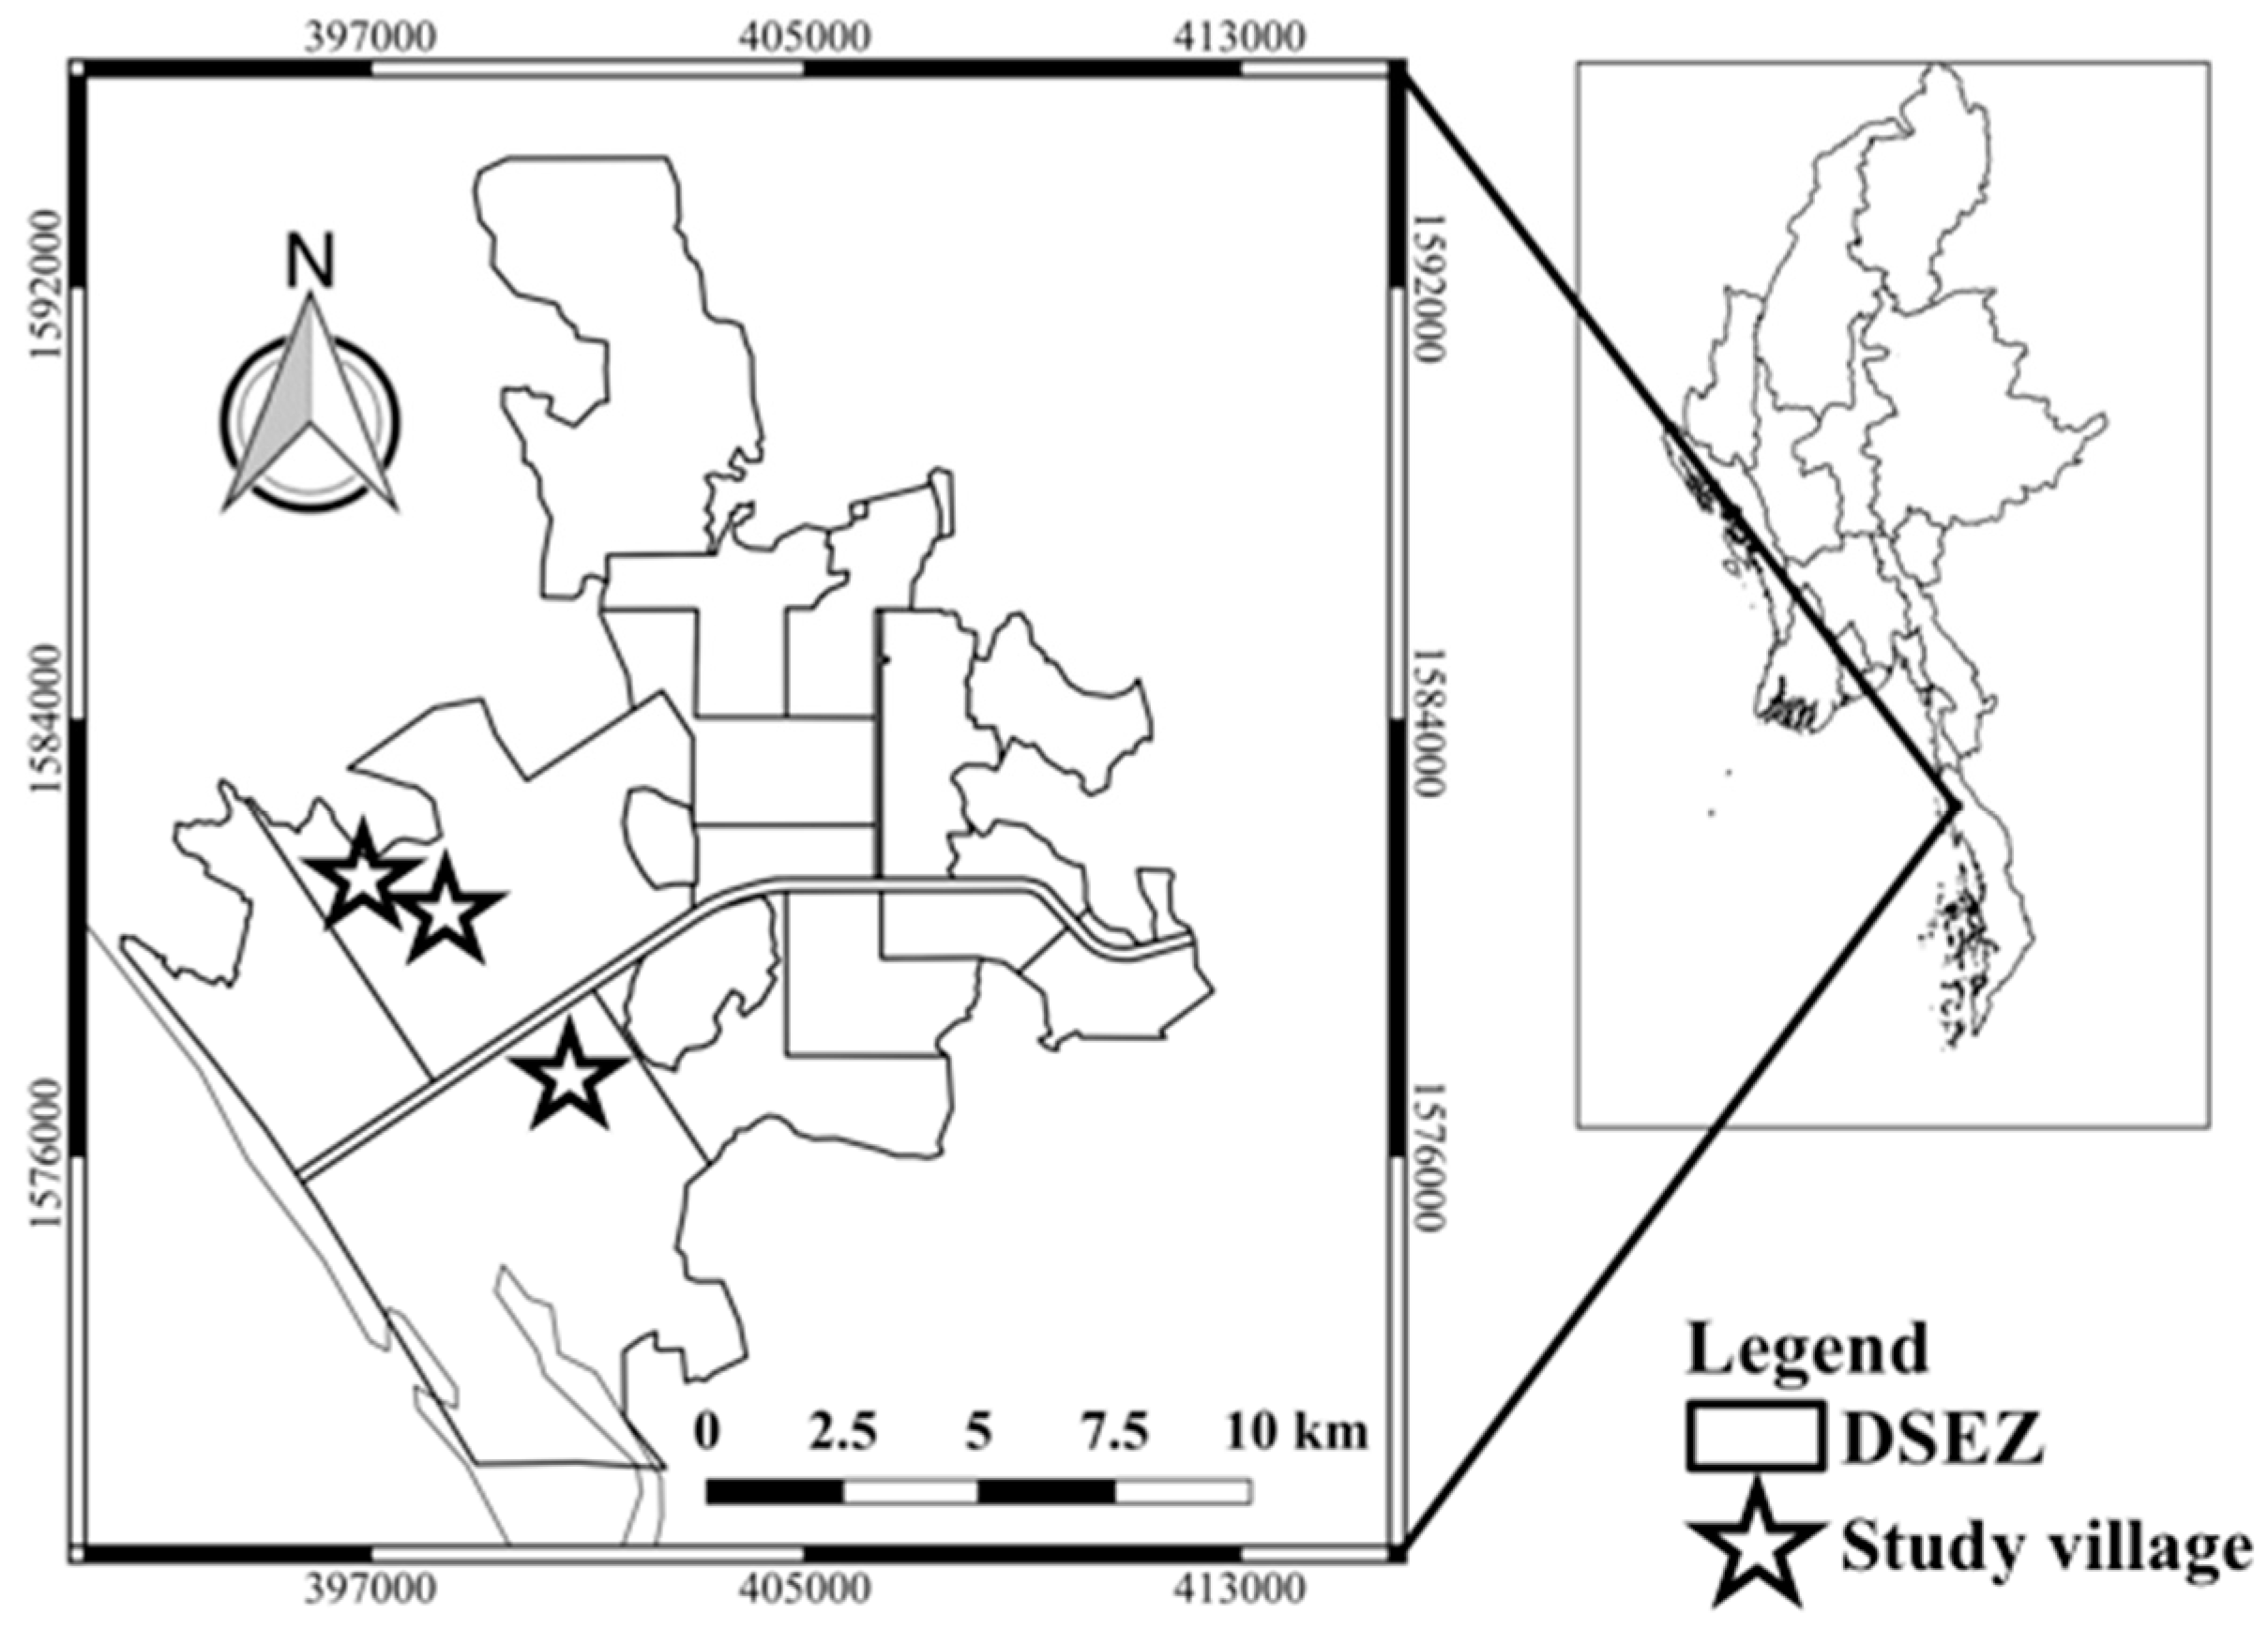
Figure 2.
Overall methodological workflow.

Figure 3.
Conversion of mobility data from non-spatial to spatiotemporal data.

Figure 4.
Conversion of the questionnaire-based mobility data and its comparison to the GPS data.

Figure 5.
Human mobility Visualization at 6:00 a.m., 9:00 a.m., 12:00 p.m., 15:00 p.m., 18:00 p.m., and 21:00 p.m.
Figure 5.
Human mobility Visualization at 6:00 a.m., 9:00 a.m., 12:00 p.m., 15:00 p.m., 18:00 p.m., and 21:00 p.m.

Figure 6.
Urban area detected by the Landsat satellite imagery by Human Visual Interpretation.

Figure 7.
The relationship between daily human mobility and urban area by year.


Table 1.
Extraction of trip details from questionnaires.
| Time | Activity | Frequency | Distance | Time |
|---|---|---|---|---|
| 07:00 | Go to the Plantation field | 1 | 0.6 km | 30 min |
| 07:30 | Arrive at the field | |||
| 10:30 | Depart to home | 1 | 0.6 km | 30 min |
| 11:00 | Back to home | |||
| 13:00 | Go to Plantation | 1 | 0.6 km | 30 min |
| 13:30 | Arrive at the field | |||
| 17:30 | Depart to home | 1 | 0.6 km | 30 min |
| 18:00 | Back to home and stay | |||
| Total | 4 | 2.4 km | 120 min |
Table 2.
The average daily aggregated difference between two data sets.
| Mobility Patterns | Average Differences (%) |
|---|---|
| Trip frequency | 25.1 |
| Travel distance | 33.3 |
| Travel time | 36.0 |
Table 3.
Average daily trip frequency, travel distance and travel time by year.
| 2005 | 2010 | 2015 | |
|---|---|---|---|
| Trip frequency | 1.9 | 1.7 | 3.0 |
| Travel distance (km) | 2.4 | 3.6 | 9.2 |
| Travel time (min) | 33.7 | 42.4 | 45.9 |
Table 4.
Travel Status and Transport mode by year (%).
| 2015 | 2010 | 2015 | ||
|---|---|---|---|---|
| Non-travel | Stay | 30.0 | 30.7 | 18.3 |
| Travel | Walk | 57.6 | 42.7 | 27.8 |
| Bicycle | 3.2 | 7.7 | 1.1 | |
| Motorbike | 9.2 | 17.4 | 50.6 | |
| Car | - | - | 2.0 | |
| Others | - | 1.6 | 0.3 |
Table 5.
Increase rate of daily travel distance.
| Age | 2005–2010 | 2010–2015 | ||
|---|---|---|---|---|
| Male | Female | Male | Female | |
| (A) 16–20 | 3.6 | 3.3 | 1.7 | 2.9 |
| (B) 21–30 | 1.2 | 1.5 | 1.9 | 4.9 |
| (C) 31–40 | 3.0 | 0.5 | 1.3 | 3.7 |
| (D) 41–50 | 3.3 | 1.2 | 1.2 | 2.8 |
| (E) 51–60 | 1.5 | 1.3 | 3.0 | 0.4 |
| (F) 61< | 3.0 | 1.7 | 1.4 | 1.1 |
| Average | 2.6 | 1.6 | 1.7 | 2.6 |
© 2017 by the authors. Licensee MDPI, Basel, Switzerland. This article is an open access article distributed under the terms and conditions of the Creative Commons Attribution (CC BY) license (http://creativecommons.org/licenses/by/4.0/).
Share and Cite
MDPI and ACS Style
Kimijima, S.; Nagai, M. Human Mobility Analysis for Extracting Local Interactions under Rapid Socio-Economic Transformation in Dawei, Myanmar. Sustainability 2017, 9, 1598. https://doi.org/10.3390/su9091598
AMA Style
Kimijima S, Nagai M. Human Mobility Analysis for Extracting Local Interactions under Rapid Socio-Economic Transformation in Dawei, Myanmar. Sustainability. 2017; 9(9):1598. https://doi.org/10.3390/su9091598
Chicago/Turabian StyleKimijima, Satomi, and Masahiko Nagai. 2017. "Human Mobility Analysis for Extracting Local Interactions under Rapid Socio-Economic Transformation in Dawei, Myanmar" Sustainability 9, no. 9: 1598. https://doi.org/10.3390/su9091598
Note that from the first issue of 2016, this journal uses article numbers instead of page numbers. See further details here.