Numerical Simulation of a Dual-Chamber Oscillating Water Column Wave Energy Converter


1
State Key Laboratory of Coastal and Offshore Engineering, Dalian University of Technology, Dalian 116024, China
2
Offshore Renewable Energy Research Center, Dalian University of Technology, Dalian 116024, China
3
State Key Laboratory of Hydrology-Water Resources and Hydraulic Engineering, Hohai University, Nanjing 210098, China
*
Author to whom correspondence should be addressed.
Sustainability 2017, 9(9), 1599; https://doi.org/10.3390/su9091599
Submission received: 16 August 2017
/
Revised: 2 September 2017
/
Accepted: 5 September 2017
/
Published: 7 September 2017
(This article belongs to the Special Issue Wave Energy Technologies: A Sustainable Energy Source)
Abstract
:The performance of a dual-chamber Oscillating Water Column (OWC) Wave Energy Converter (WEC) is considered in the present study. The device has two sub-chambers with a shared orifice. A two-dimensional (2D) fully nonlinear numerical wave flume based on the potential-flow theory and the time-domain higher-order boundary element method (HOBEM) is applied for the simulation. The incident waves are generated by using the immerged sources and the air-fluid coupling influence is considered with a simplified pneumatic model. In the present study, the variation of the surface elevation and the water column volume in the two sub-chambers are investigated. The effects of the chamber geometry (i.e., the draft and breadth of two chambers) on the surface elevation and the air pressure in the chamber are investigated, respectively. It is demonstrated that the surface elevations in the two sub-chambers are strongly dependent on the wave conditions. The larger the wavelength, the more synchronous motion of the two water columns in the two sub-chambers, thus, the lager the variation of the water column volume.
Keywords:
wave energy converter; OWC; dual-chamber; HOBEM; hydrodynamic performance; fully nonlinear1. Introduction
For the next leap in power technologies to become a sustainable society, we are under obligation not only to cope with the warming of the global environment but also to conserve the natural ecosystem and coexist with nature [1]. Renewable energies have gained great deal of attention and deserved a substantial body of research, due to their non-polluting nature and environment friendliness. Wave energy is considered to be one of the most promising forms of clean renewable energy because of its high energy flux density and low negative environmental impact. To harvest the wave energy, various types of WECs have been proposed. Although it may cause noise pollution and damage the natural beauty of a seascape, featured by high efficiency and structure simplicity, the OWC device becomes one of the most favorable wave energy converters [2]. The feasibility of OWCs has been studied recently in a low energetic sea [3].
Generally, an OWC device consists of a partially submerged air chamber, an air turbine and a generator. The water free surface inside the chamber moves up and down due to the incoming incident waves. The air pressure inside the chamber has alternating pressure fluctuations due to the motion of the water surface. This internal pressure fluctuation runs the air above the internal free surface inside the enclosed chamber through the turbine, which eventually drives the electrical generator to produce electricity. A great volume of researches has been carried out to investigate the efficiency of OWCs analytically [4,5,6,7], numerically [8,9,10,11,12] and experimentally [13,14,15,16,17,18,19], most of which focus on the single chamber device. Generally, for a single chamber OWC, it has been recognized that if the device is to be an efficient absorber, it should operate at near-resonance conditions [20,21,22,23]. To enhance the performance of the OWC devices, the multi-chamber OWC concept has been proposed. Falcão [24] performed a theoretical analysis of the ocean wave energy absorption by a periodic linear array of OWCs of arbitrary plan form in constant depth. Nader et al. [25] studied the efficiency of arrays of OWC devices using finite element method. They found that the presence of neighboring OWCs has a significant influence on the power capture efficiency of individual devices, even for large separations, and that the optimal pneumatic damping for OWCs in an array may differ from that of an isolated OWC with the same dimensions. Nihous [26] analytically investigated wave power extraction by arbitrary arrays of non-diffracting OWCs. O’Boyle et al. [27] experimentally investigated the wave field variations around arrays of OWC WECs. They found that the wave disturbance pattern is highly dependent on the array layout, the ratio of wavelength to device spacing, and the applied PTO damping. The principle of double chamber OWC device’s operation has been studied by Boccotti [28], Boccotti et al. [29] and Wilbert et al. [30]. They observed that relative opening depth (i.e., bottom open depth/water depth) have strong effects on hydrodynamic energy conversion capacity of the device. Rezanejad et al. [31] and Rezanejad et al. [32] analytically and numerically analyzed the hydrodynamic efficiency of a dual-chamber OWC placed over stepped bottom. They found that a dual-chamber OWC device on the stepped sea bottom can improve the performance of the device significantly in a wide range of frequencies, as compared with the single chamber case. He et al. [33] also found that the dual chambers could widen the efficiency bandwidth of power extraction in their experimental study of floating box-type breakwaters with dual pneumatic chambers. Wang et al. [34] numerically studied the hydrodynamic efficiency of the dual-chamber OWC device and reported that a proper set of two sub-chambers can increase the general hydrodynamic efficiency of the OWC device. Due to the fact that the hydrodynamic efficiency is determined by both the surface elevation and air pressure inside the chamber. To get a better understand of the hydrodynamic performance of the proposed dual-chamber OWC device. New results of the surface elevation and the air pressure in the chamber are given in the present paper as an extended study of the previous work [34].
This paper considers a dual-chamber OWC by a fully nonlinear numerical model. The device has two chambers with a shared orifice as shown in Figure 1. At various wave conditions, effects of the chamber geometry (i.e., the draft and breadth of two chambers) on the surface elevation and the air pressure in the chamber are systematically investigated. The following contents are organized as follows. The numerical model is described in Section 2. The relating results and discussions are given in Section 3. Finally, conclusions are shown in Section 4.
2. Numerical Model
To investigate the hydrodynamic performance of the proposed dual-chamber OWC device, the two-dimensional fully nonlinear numerical model based on the potential theory and the time-domain HOBEM by Ning et al. [11] is extended here to simulate the interaction of the wave and the dual-chamber OWC device by adding a barrier wall in the single chamber device. The sketch of the flume is shown in Figure 1. A Cartesian coordinate system, Oxz, is used with its origin on the still water level, and the z-axis pointing upward. The average water depth is denoted by h, while b1 and b2 are two chamber breadths; c1 and c2 represent thicknesses of two barrier walls and d1 and d2 are barrier wall drafts. Ld is the length of the sponge layer, Bo is the breadth of the orifice, and hc is the height of the chamber above the still water level.
Energy loss occurs both at the entrance when incident waves enter the chamber and inside the chamber after wave generate an up-and-down motion of free surface within the chamber [35,36]. This is the preliminary stage of design. To simplify the simulation, the potential fluid theory is adopted. An artificial damping coefficient μ2 is applied to the free surface condition inside the chamber to model the viscous effect due to the water viscosity and flow separations [11]. Then, the fluid is assumed to be incompressible, inviscid, and the fluid motion is irrotational. Therefore, the fluid motion can be described by a velocity potential ϕ related to the fluid velocity. In the numerical model, immerged sources are distributed in the fluid domain to generate incident waves, and a sponge layer with coefficient μ1 is applied at the left end of the flume to absorb reflected waves from the OWC device. The source strength is directly controlled by the horizontal fluid speed (corresponding to the wave to be generated), which is given as the second-order Stokes analytical solution in the present study. Then, the velocity potential satisfies the Poisson equation, and the following fully-nonlinear free surface boundary conditions can be obtained:
where X(x, z) is the position vector of a fluid particle on the free surface and X0 = (x0, 0) is the initial static position of the fluid particle, η the vertical elevation of the free surface, ρ the water density, g the gravitational acceleration and μ1 the damping coefficient defined by:
where x1 is the starting position of sponge layer, ω is the angular frequency, and Ld is the length of the sponge layer set as 1.5 times the wavelength (i.e., 1.5 L, where L is the wavelength).
p is the relative air pressure. It is set to be zero outside of the chamber. Inside the chamber, because the two chambers shared an orifice, the pneumatic pressure inside the chamber are the same. According to previous experimental observation [37,38,39], the pressure inside the chamber can be reasonably modeled as linearly proportional to the air velocity within the air orifice. What’s more, in our previous experimental study [17], the numerical simulation with linear pneumatic pressure model shows good agreement with the experimental results. Thus, in the present study, the linear pressure law is implemented in the numerical model as:
where Cdm is the linear pneumatic damping coefficient and Ud is the air flow velocity in the orifice. The wave conditions and geometric parameters of the device of the present simulation are based on our previous experimental setup [17]. For small scaled simulation, the air compressibility can be ignored within the air chamber [39,40,41]. Based on the incompressibility assumption of the air inside the chamber, the air flow velocity Ud can be expressed as follows:
where ΔV = Vt+Δt − Vt represents the change of air volume in the chamber within each time step Δt. So is the cross-sectional area of the air orifice, and in the 2D model, it is equal to the breadths of orifice Bo.
All simulations start with the initial state
On implementation of the boundary element method (BEM)—also known as the boundary integral equation method—only the boundary of the solution domain has to be discretized into elements. In the present simulation, the HOBEM (i.e., three-node line elements used to discretize the boundary surface) is used to simulate the fully nonlinear numerical wave flume in the time domain. The length of the numerical wave flume is 5 L, in which 1.5 L at the left side is used as the sponge layer. In all cases, there are 30 elements per wave length on the free surface, 15 elements are distributed on each barrier wall surface, and 10 elements are used across the depth of the numerical wave flume. For each case, 30 wave periods are simulated with a time step of Δt = T/80. More information about the numerical model can be found in references [11,17].
3. Results and Discussions
In the present paper, part of the OWC device’s dimensions are set as following: air orifice breadth So = 0.0036 m, chamber height hc = 0.2 m and barrier wall thickness c1 = c2 = 0.04 m. The water depth h is 0.8 m. Fourteen wave periods T in the range of (0.95 s, 2.35 s) are considered with the incident wave amplitude Ai kept constant at 0.03 m. The breadths of two sub-chambers and the drafts of the two barrier walls are varied and their effects on the free surface elevation and air pressure inside the chamber are investigated. To simplify the simulation, the numerical parameters (i.e., Cdm and μ2) are chosen as that in the single chamber with the front wall draft d = 0.14 m and chamber breadths b = 0.55 m in reference [17].
3.1. Water Volume Variation Inside the Chambers
Generally, when investigating the performance of an OWC device with a single chamber, the motion of the free surface inside the chamber is represented by that at the chamber-center [13,17]. To check whether the method is also suitable for the dual-chamber device, two different methods were adopted to calculate oscillating water column volumes in the chambers. One is by integrating the free surface along the chamber width direction directly (i.e., integral method). The volume in chamber 1, chamber 2 and the total volume in both chambers are represented by V1, V2 and V, respectively. The other is by using the free surface elevation at the chamber center multiplied by the chamber breadth (i.e., center point represented method). The volume in chamber 1, and chamber 2 are represented by η1b1 and η2b2, respectively.
By choosing b1:b2 = 1:3, b1 + b2 = 0.55 m and d1 = d2 = 0.14 m, Figure 2 and Figure 3 show the comparisons of the time series of the oscillating water column volumes at T = 1.49 s and the maximum value of the oscillating water column volumes by using the two methods, respectively. The two figures show that the oscillating water column volumes obtained by the two methods agree well to each other in both the chambers. And the maximum relative error (i.e., |ηnbn − Vn|/Vn, where, n is the number of the chamber) between the two methods is less than 5%. Thus, the free surface elevation at the chamber center can be used to represent the overall effect of the surface motion in the dual-chamber OWC device.
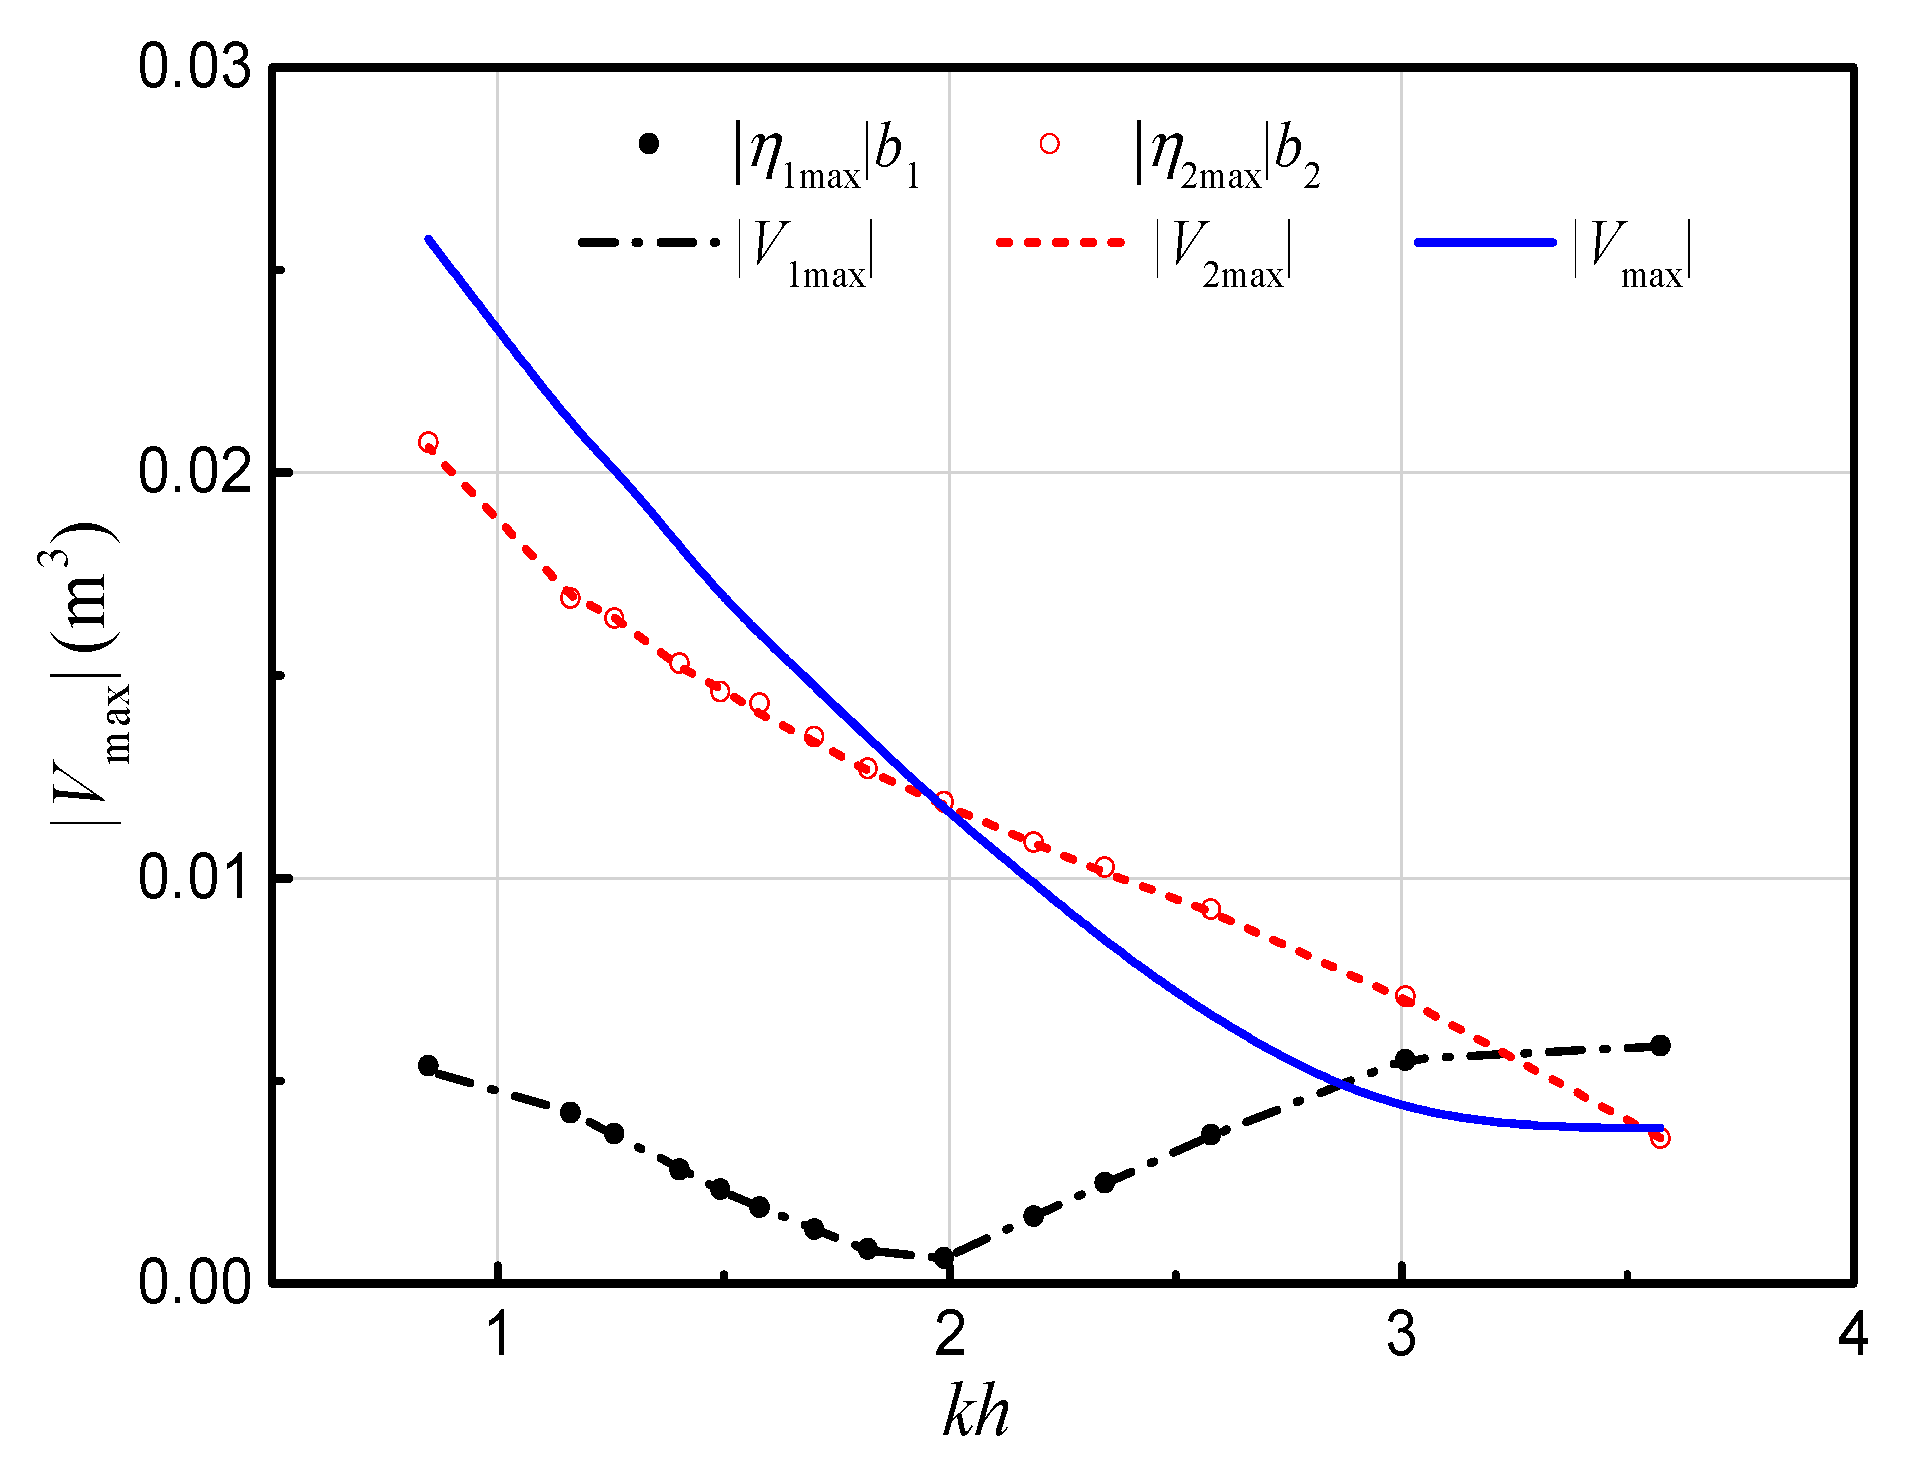
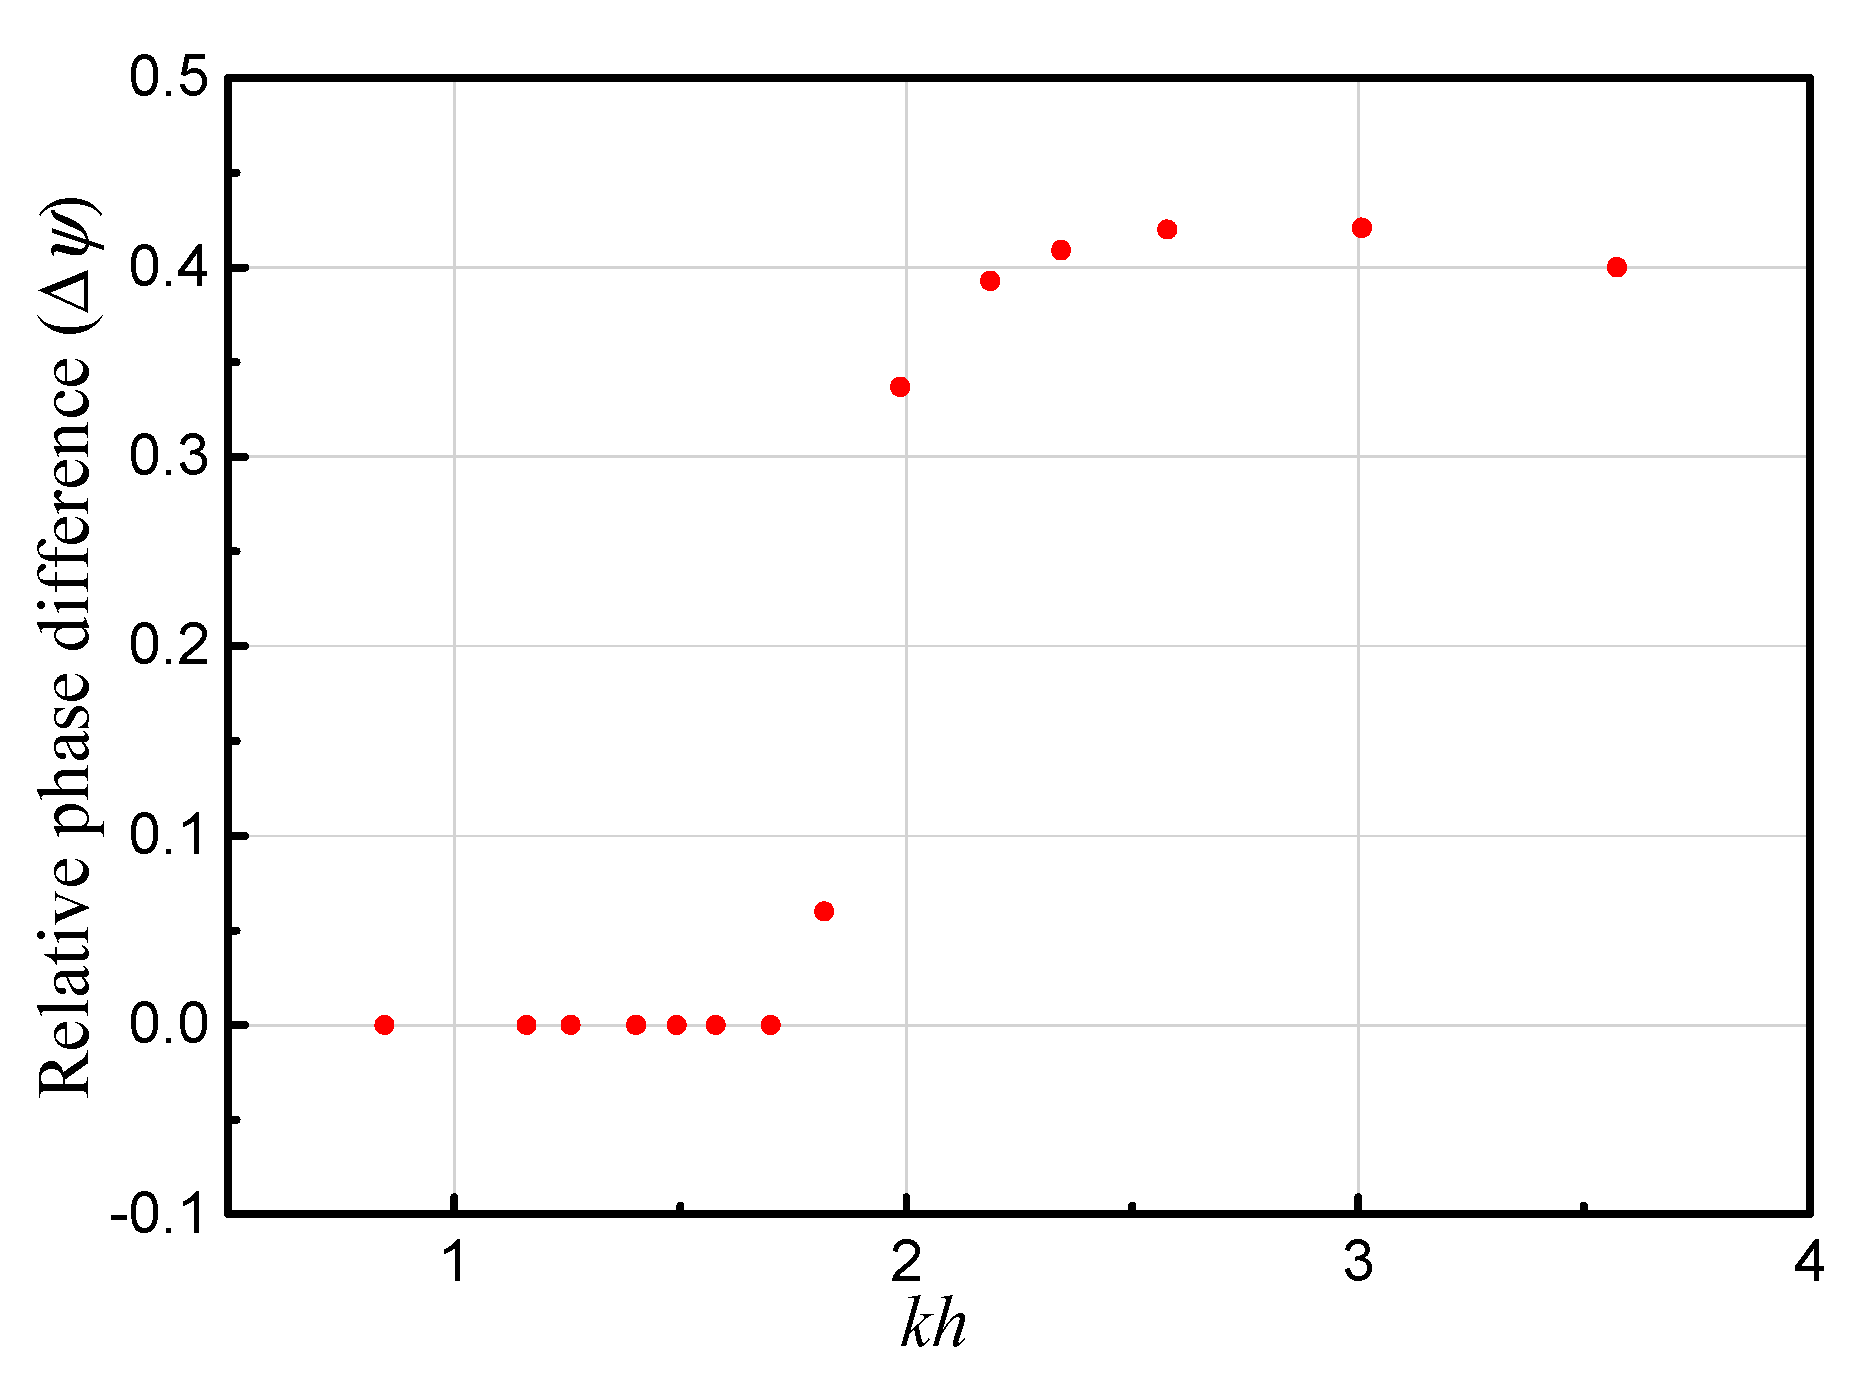
Further, from Figure 2 we can see that the water column volume in chamber 1 is very small when compared to that in the chamber 2. In this case, the surface motion in the two chambers are in phase. Thus, the total variation water column volume is the sum of the volumes of the two sub-chambers. From Figure 3 we can see that the water column volume in chamber 1 (i.e., V1) decreases with non-dimensional wave frequency (i.e., kh, where k is the wave number) first to a minimum value and increases with wave frequency thereafter. In high frequency region, the waves can hardly enter chamber 2 and most transmitted waves in the device are trapped in chamber 1 because the wave transmission ability is weak. Thus, V1 shows a large value in high frequency region. What’s more, V1 also shows a relative large value in low frequency region due to the strong transmission ability of long waves. The total water column volume (i.e., V) and the water column volume in chamber 2 (i.e., V2) decreases with the increasing of the wave frequency. V shows a large value (even larger than both V1 and V2) in low frequency region. While in the high frequency region, it shows a much smaller value. In some cases, it is even smaller than either of the water column volumes in the two sub-chambers (i.e., V1 and V2). The relative phase difference Δψ (i.e., |ψ1 − ψ2|/T, where ψ1 and ψ2 are the phase of surface elevation at the center of chamber 1 and 2, respectively) between the surface elevation at chamber 1 and chamber 2 center versus kh is shown Figure 4. As can be seen in the figure, Δψ shows a very small value in low frequency region, that is to say the motion of the surface in the two sub-chambers is synchronous under long waves; while it shows a relative larger value in the high frequency region, i.e., the motion of the surfaces in the two chambers is out of phase. These explain well why the total water column volume V shows a relative larger value in low frequency region and a smaller value in the high frequency region.
3.2. Surface Elevation in Chambers
3.2.1. Effects of Chamber Breadths
Figure 5 shows the effects of the chamber breadths on the surface elevation in the chambers. The total chamber breadth is set to be constant as b1 + b2 = 0.55 m, while the remaining geometrical parameters and wave conditions are kept the same as those in Figure 2. The surface elevation in chamber 1 decreases with wave frequency first to a minimum value and increases with wave frequency thereafter as shown in Figure 5a. The explanation for this phenomenon is the same as that for the variation of the water column volume in chamber 1 as described before. As shown in Figure 5b, the surface elevation in chamber 2 shows an overall decreasing tendency with the increasing of wave frequency. However, a slight increment is also observed. This is because the incident wave frequency is near the natural frequency of water column in chamber 2, which can be estimated by:
where ω0 is the natural angular frequency and S is the area of air chamber. What’s more, under the same wave condition, the surface elevations in chamber 2 decrease with the barrier wall 2 closer to the barrier wall 1 (i.e., increasing of the second chamber breadth b2). This means that the existence of the barrier wall 2 with a proper position can attenuate the fluctuation of the water column in the chamber 2 in some extent. Meanwhile, according to the previous study by Rezanejad et al. [42] and Wang et al. [34], a closer deployment of the two barrier walls can lead to a larger efficiency during resonance. Additionally, in both figures, there is a slight curve shift to the left-hand side as b2 increases. However, the shift is slight, which is due to the fact that the characteristic of the oscillating water column changes little because the length and the volume of the total water column are not change.
3.2.2. Effects of Barrier Wall Drafts
Effects of the chamber drafts on the surface elevation in the chambers are investigated in this subsection. Chamber breadths are set as constants: b1:b2 = 1:3 and b1 + b2 = 0.55 m. Other geometrical parameters and wave conditions are kept the same as those in Figure 2.
Figure 6 shows the effects of the chamber drafts on the surface elevation in the chamber 1. In Figure 6a, the draft of the barrier 2 d2 is fixed at 0.14 m (i.e., d2/h = 0.175), while the relative draft of barrier 1(i.e., d1/h) varies from 0.175 to 0.75. When d1 is close to d2 (i.e., d1/h = 0.175 and 0.25), the surface elevation in chamber 1 decreases with kh to the minimum value and then increases with kh. The explanation for this phenomenon is also similar to that for the variation of the water column volume in chamber 1 as described before. However, when d1 is much larger than d2 (i.e., d1/h = 0.50 and 0.75), the surface elevation in chamber 1 shows a general trend of decreasing with the increasing of kh. This is because: on the one hand, the waves transmitted into chamber decrease with the increasing of the wave frequency due to its weaker transmitted ability; on the other hand, the reflected waves increase with the increasing draft of barrier wall 1.
In Figure 6b, the relative draft of barrier 2 (i.e., d2/h) varies from 0.175 to 0.75, while the draft of the barrier 1 (i.e., d1) is fixed at 0.14 m. In these cases, the surface motion insider chamber 1 become more complex because the draft of barrier 2 is larger than the draft of barrier 1 (i.e., d2 ≥ d1). The increasing process of the surface elevation can be obviously observed. There are mainly two sources of the waves in chamber 1: the transmitted waves and the reflected waves by the barrier wall 2. The combined actions of the two parts waves in chamber 1 causes the proposed increasing phenomenon. With the draft d2 increases, the waves enter chamber 2 for longer waves, i.e., for lower values of kh. Thus, a dramatic curve shifts to the left-hand side as d2 increasing.
Figure 7 shows the effects of the chamber drafts on the surface elevation in the chamber 2. In Figure 7a, the draft of the barrier 2 (i.e., d2) is fixed at 0.14 m, while the relative draft of barrier 1 (i.e., d1/h) varies from 0.175 to 0.75. While in Figure 7b, the draft of the barrier 1 (i.e., d1) is fixed at 0.14 m, while the relative draft of barrier 2 (i.e., d2/h) varies from 0.175 to 0.75. The surface elevation in chamber 2 shows a decreasing tendency with the increase of the kh as shown in Figure 7a,b. This is mainly due to the reason that the transmission ability of the waves decreases with increasing wave frequency kh. It also could be noticed that with the increasing of the drafts of the barrier walls, the surface elevations in chamber 2 generally decreases. This is because no matter the draft of barrier 1 or barrier 2 increases, the waves reflected by the barrier walls increase. Thus, the waves transmitted in chamber 2 decrease.
3.3. Air Pressure in Chamber
3.3.1. Effects of Chamber Breadths
The effects of the chamber breadths on the air pressure in chambers is shown in Figure 8. The total chamber breadth is set to be constant as b1 + b2 = 0.55 m, while the remaining geometrical parameters and wave conditions are kept the same as those in Figure 2. It is found that the maximum air pressure increases with the increasing of the second chamber breadth b2. Among these considered cases, the chamber breadth ratio of b1:b2 = 1:3 leads to the highest air pressure. When the total chamber width is kept constant, a closer deployment of two barrier walls (i.e., b1:b2 = 1:3 in the present study) tends to lead to a larger air pressure during resonance. As shown in Figure 5, in the high frequency region, the surface elevation in the chamber 1 increases with the increasing of the second chamber breadth b2, while that in chamber 2 shows a reverse trend. What’s more, there exists phase difference between the surface elevation in the two sub-chambers in the high frequency as can be seen in Figure 4. Thus, the variation of total water volume in the chamber decreases. As the result, the reduction of the minimum air pressure with the increasing of the second chamber breadth in the high frequency region is also observed. However, the effect of the chamber width on the air pressure is weak, which is due to the fact that the total volume of the enclosed air in the chamber is not changed though the position of the barrier wall 2 is changed.
3.3.2. Effects of Barrier Wall Drafts
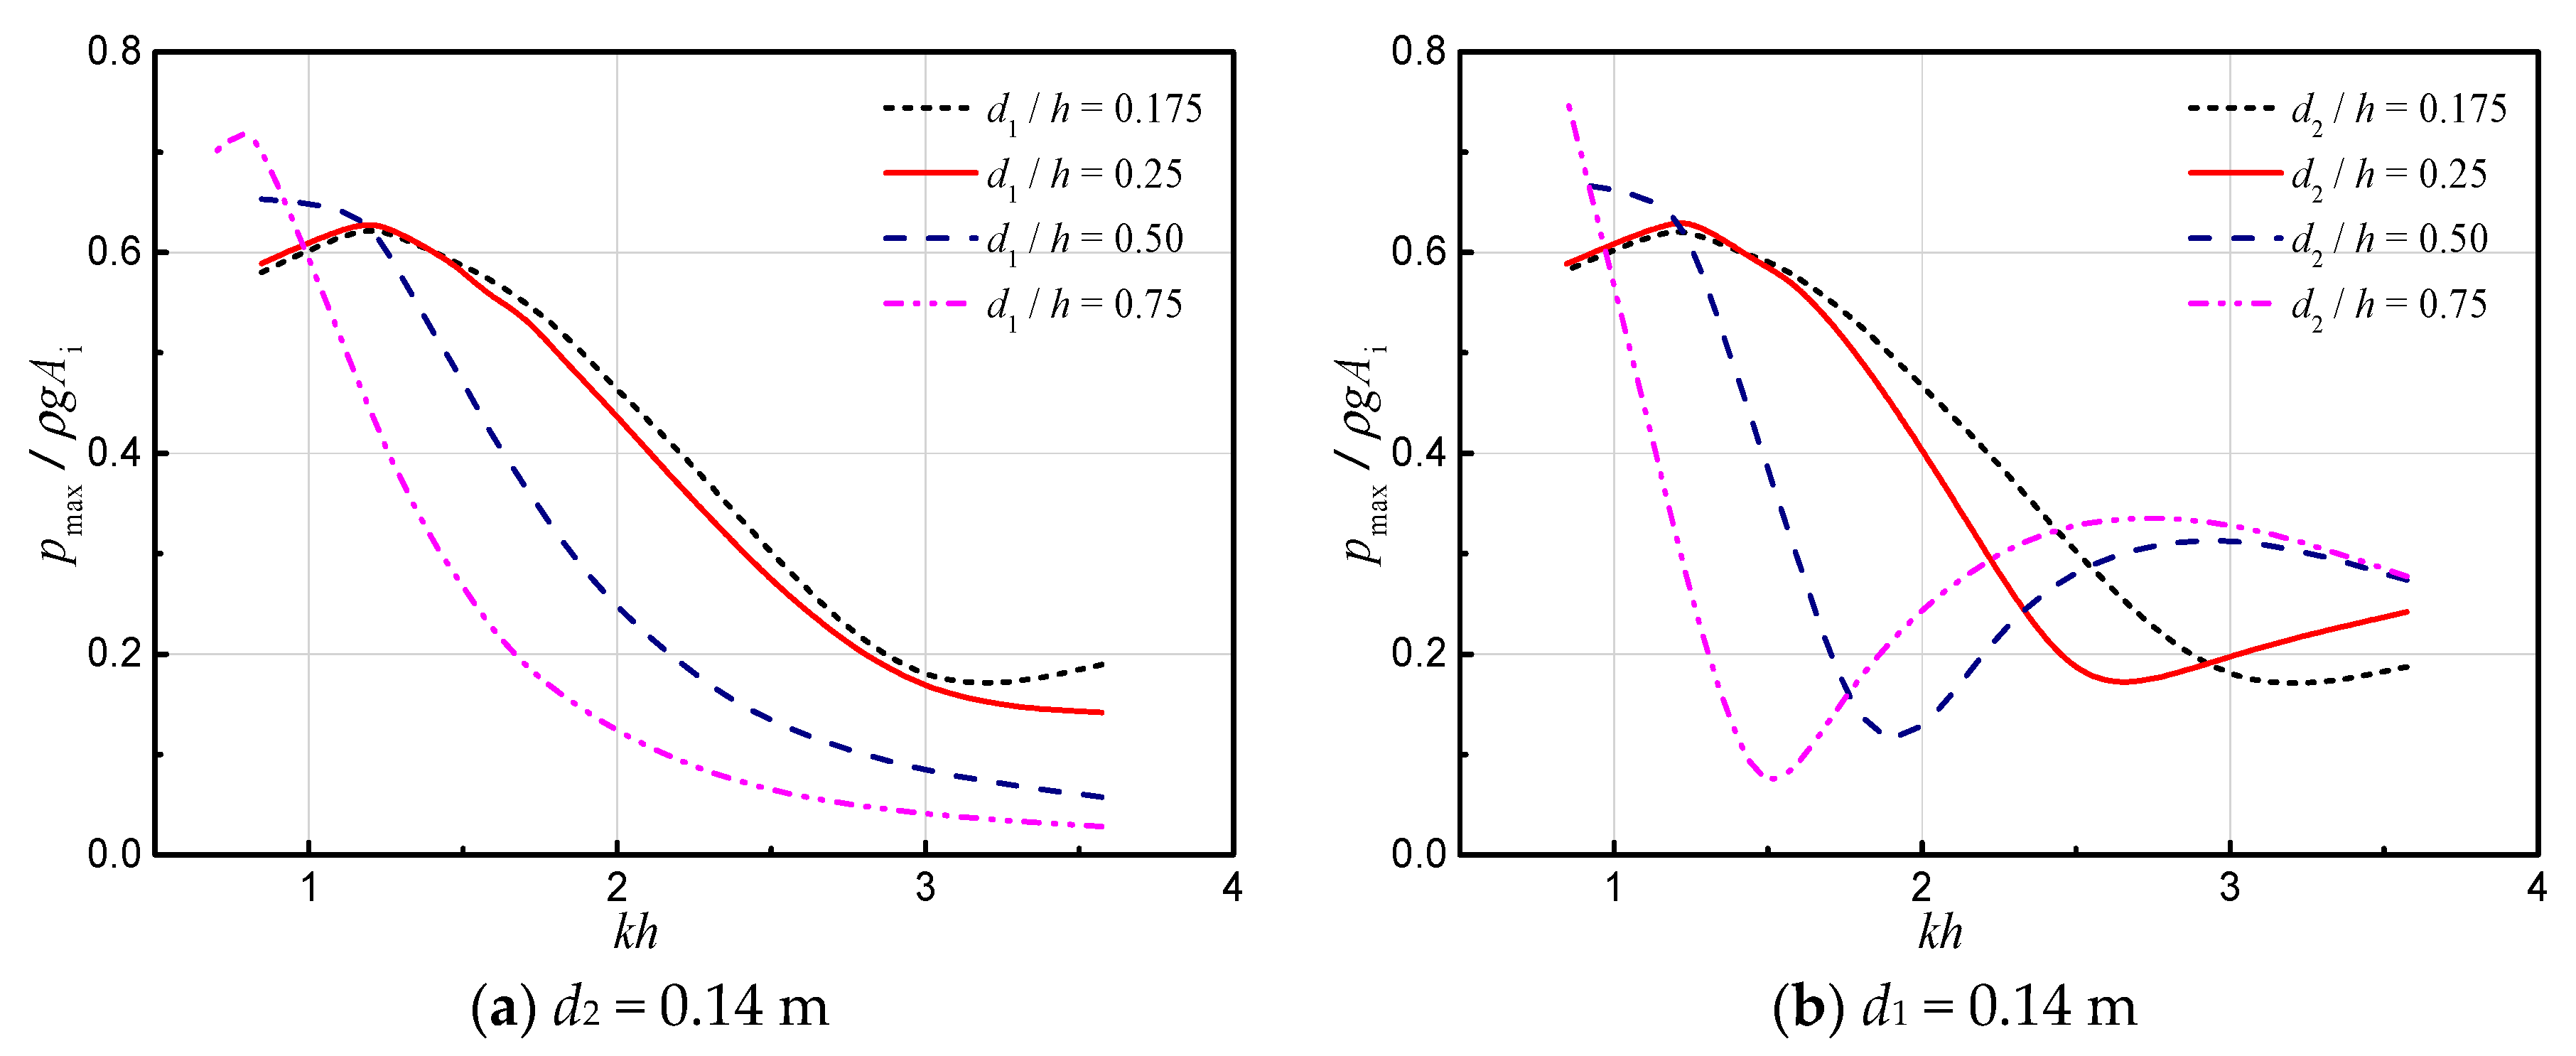
Figure 9 shows the effect of the barrier wall drafts on the air pressure in chambers. In Figure 9a, the draft of the barrier 2 is fixed as d2 = 0.14 m, while the relative draft of barrier 1 (i.e., d1/h) varies from 0.175 to 0.75. It shows that the air pressure in the chamber reduces significantly as the draft of barrier 1 increases in a certain frequency region. This is due to the fact that the wave energy reflected by the barrier 1 increases with increasing draft of barrier wall 1. In Figure 9b, the draft of the barrier 1 is fixed as d1 = 0.14 m, while the relative draft of barrier 2 (i.e., d2/h) varies from 0.175 to 0.75. Figure 9b shows that there is an increasing air pressure process after it decreases to the minimum with the increasing of kh. In high frequency region, though the surface elevation in chamber 2 changes little, it has a large fluctuation in chamber 1. Thus, the motion of the surface elevation in chamber 1 contributes to the air pressure increasing in the chamber. This further leads to an increment of the hydrodynamic efficiency of the device as described in the previous study [34]. That is to say, the hydrodynamic performance of the device can be improved for short waves (i.e., high frequency waves) by adding a barrier wall with proper draft in the air chamber. It should be note that, the improvement is limited.
4. Conclusions
The OWC device with two sub-chambers which shared an orifice is considered in the present paper. A fully-nonlinear numerical wave flume based on the potential-flow theory and the time-domain higher-order boundary element method is applied for the simulation. Under various wave conditions, effects of the chamber geometry (i.e., the draft and breadth of two chambers) on the surface elevation and air pressure in the chambers are investigated numerically.
The overall effect of the surface motion in the chamber is represented by the free surface elevation at chamber center. Before this, the comparison between the water volume variation in chambers calculated by the integral method and the center point represented method are carried out. The results show that the oscillating water column volumes obtained by the two methods agree well to each other in both chambers.
The surface elevations in the two sub-chambers are strongly dependent on the wave conditions. The larger the wavelength, the more synchronous motion of the two water columns, thus, the lager the variation of the water column volume in the chamber. The horizontal position of the barrier wall 2 (i.e., the sub-chamber breadths) has little effect on the air pressure, while it has significant effect on the surface elevation in the chambers. When the draft of barrier wall 1 is larger than the draft of barrier wall 2, the air pressure and the surface elevations in the two sub-chambers decrease with the increase of draft of barrier wall 1. However, when the draft of barrier wall 2 is larger than the draft of barrier wall 1, the motion of the surface elevation inside the chambers become much more complex, and it is the same with air pressure. It is found that the existence of the barrier wall 2 with a proper horizontal position can not only improve the hydrodynamic efficiency, but also attenuate the fluctuation of the water column in the chamber 2 in some extent. Additionally, in the high frequency region, with the increasing draft of barrier wall 2, both the surface elevation and the air pressure show an increasing process. That is to say, the hydrodynamic performance of the device can be improved for short waves (i.e., high frequency waves) by adding a barrier wall with proper draft in the air chamber. It should be note that, the improvement is limited.
Note that, the results presented are based on the OWC device with two sub-chambers which shared an orifice and numerical simulation. It still requires further research to optimize the performance of the OWC device. In the future, the dual-chamber OWC device with two independent orifices will be numerically and experimentally investigated.
Acknowledgments
The authors would like to acknowledge the financial support of the National Natural Science Foundation of China (Grant Nos. 51679036 and 51490672), the Royal Academy of Engineering under the UK-China Industry Academia Partnership Programme (Grant No. UK-CIAPP\73) and the support of the Fundamental Research Funds for the Central Universities.
Author Contributions
Dezhi Ning designed the study and supervised the work. Rongquan Wang performed the simulation and drafted the manuscript. Chongwei Zhang put forward the proposed problem and reviewed the manuscript. All authors read and approved the manuscript.
Conflicts of Interest
The authors declare no conflict of interest.
References
- Murakami, T.; Imai, Y.; Nagata, S.; Takao, M.; Setoguchi, T. Experimental Research on Primary and Secondary Conversion Efficiencies in an Oscillating Water Column-Type Wave Energy Converter. Sustainability 2016, 8. [Google Scholar] [CrossRef]
- Delaure, Y.M.C.; Lewis, A. 3D hydrodynamic modelling of fixed oscillating water column wave power plant by a boundary element methods. Ocean Eng. 2003, 30, 309–330. [Google Scholar] [CrossRef]
- Naty, S.; Viviano, A.; Foti, E. Wave Energy Exploitation System Integrated in the Coastal Structure of a Mediterranean Port. Sustainability 2016, 8, 1342. [Google Scholar] [CrossRef]
- Mccormick, M.E. Modified Linear-Analysis of a Wave-Energy Conversion Buoy. Ocean Eng. 1976, 3, 133–144. [Google Scholar] [CrossRef]
- Evans, D.V. The Oscillating Water Column Wave-energy Device. IMA J. Appl. Math. 1978, 22, 423–433. [Google Scholar] [CrossRef]
- Falcão, A.F.O.; Sarmento, A. Wave generation by a periodic surface pressure and its application in wave-energy extraction. In Proceedings of the 15th International Congress of Theoritical and Applied Mechanics, Toronto, ON, Canada, 17–23 August 1980. [Google Scholar]
- Evans, D.V. Wave-Power Absorption by Systems of Oscillating Surface Pressure Distributions. J. Fluid Mech. 1982, 114, 481–499. [Google Scholar] [CrossRef]
- Zhang, Y.L.; Zou, Q.P.; Greaves, D. Air–water two-phase flow modelling of hydrodynamic performance of an oscillating water column device. Renew. Energy 2012, 41, 159–170. [Google Scholar] [CrossRef]
- Teixeira, P.R.F.; Davyt, D.P.; Didier, E.; Ramalhais, R. Numerical simulation of an oscillating water column device using a code based on Navier–Stokes equations. Energy 2013, 61, 513–530. [Google Scholar] [CrossRef]
- Luo, Y.Y.; Wang, Z.W.; Peng, G.J.; Xiao, Y.X.; Zhai, L.M.; Liu, X.; Zhang, Q. Numerical simulation of a heave-only floating OWC (oscillating water column) device. Energy 2014, 76, 799–806. [Google Scholar] [CrossRef]
- Ning, D.Z.; Shi, J.; Zou, Q.P.; Teng, B. Investigation of hydrodynamic performance of an OWC (oscillating water column) wave energy device using a fully nonlinear HOBEM (higher-order boundary element method). Energy 2015, 83, 177–188. [Google Scholar] [CrossRef]
- Elhanafi, A.; Fleming, A.; Macfarlane, G.; Leong, Z. Numerical hydrodynamic analysis of an offshore stationary–floating oscillating water column–wave energy converter using CFD. Int. J. Nav. Arch. Ocean 2017, 9, 77–99. [Google Scholar] [CrossRef]
- Morris-Thomas, M.T.; Irvin, R.J.; Thiagarajan, K.P. An investigation into the hydrodynamic efficiency of an oscillating water column. J. Offshore Mech. Arct. Eng. 2007, 129, 273–278. [Google Scholar] [CrossRef]
- Gouaud, F.; Rey, V.; Piazzola, J.; Van Hooff, R. Experimental study of the hydrodynamic performance of an onshore wave power device in the presence of an underwater mound. Coast. Eng. 2010, 57, 996–1005. [Google Scholar] [CrossRef]
- He, F.; Huang, Z.H.; Law, A.W.K. Hydrodynamic performance of a rectangular floating breakwater with and without pneumatic chambers: An experimental study. Ocean Eng. 2012, 51, 16–27. [Google Scholar] [CrossRef]
- He, F.; Huang, Z.H.; Law, A.W.K. An experimental study of a floating breakwater with asymmetric pneumatic chambers for wave energy extraction. Appl. Energy 2013, 106, 222–231. [Google Scholar] [CrossRef]
- Ning, D.Z.; Wang, R.Q.; Zou, Q.P.; Teng, B. An experimental investigation of hydrodynamics of a fixed OWC Wave Energy Converter. Appl. Energy 2016, 168, 636–648. [Google Scholar] [CrossRef]
- Viviano, A.; Naty, S.; Foti, E.; Bruce, T.; Allsop, W.; Vicinanza, D. Large-scale experiments on the behaviour of a generalised Oscillating Water Column under random waves. Renew. Energy 2016, 99, 875–887. [Google Scholar] [CrossRef]
- Vyzikas, T.; Deshoulieres, S.; Barton, M.; Giroux, O.; Greaves, D.; Simmonds, D. Experimental investigation of different geometries of fixed oscillating water column devices. Renew. Energy 2017, 104, 248–258. [Google Scholar] [CrossRef]
- El Marjani, A.; Castro Ruiz, F.; Rodriguez, M.A.; Parra Santos, M.T. Numerical modelling in wave energy conversion systems. Energy 2008, 33, 1246–1253. [Google Scholar] [CrossRef]
- Drew, B.; Plummer, A.R.; Sahinkaya, M.N. A review of wave energy converter technology. Proc. Inst. Mech. Eng. A J. Power Energy 2009, 223, 887–902. [Google Scholar] [CrossRef]
- Falcão, A.F.D. Wave energy utilization: A review of the technologies. Renew. Sustain. Energy Rev. 2010, 14, 899–918. [Google Scholar] [CrossRef]
- Iturrioz, A.; Guanche, R.; Lara, J.L.; Vidal, C.; Losada, I.J. Validation of OpenFOAM® for Oscillating Water Column three-dimensional modeling. Ocean Eng. 2015, 107, 222–236. [Google Scholar] [CrossRef]
- Falcão, A.F.D. Wave-power absorption by a periodic linear array of oscillating water columns. Ocean Eng. 2002, 29, 1163–1186. [Google Scholar] [CrossRef]
- Nader, J.R.; Zhu, S.P.; Cooper, P.; Stappenbelt, B. A finite-element study of the efficiency of arrays of oscillating water column wave energy converters. Ocean Eng. 2012, 43, 72–81. [Google Scholar] [CrossRef]
- Nihous, G.C. Wave power extraction by arbitrary arrays of non-diffracting oscillating water columns. Ocean Eng. 2012, 51, 94–105. [Google Scholar] [CrossRef]
- O’Boyle, L.; Elsäßer, B.; Whittaker, T. Experimental Measurement of Wave Field Variations around Wave Energy Converter Arrays. Sustainability 2017, 9, 70. [Google Scholar] [CrossRef]
- Boccotti, P. Caisson breakwaters embodying an OWC with a small opening—Part I: Theory. Ocean Eng. 2007, 34, 806–819. [Google Scholar] [CrossRef]
- Boccotti, P.; Filianoti, P.; Fiamma, V.; Arena, F. Caisson breakwaters embodying an OWC with a small opening—Part II: A small-scale field experiment. Ocean Eng. 2007, 34, 820–841. [Google Scholar] [CrossRef]
- Wilbert, R.; Sundar, V.; Sannasiraj, S.A. Asymmetry Effect on Hydrodynamic Characteristics of Double Chamber Oscillating Water Column Device. J. Ocean Mech. Aero. 2014, 5, 1–17. [Google Scholar]
- Rezanejad, K.; Bhattacharjee, J.; Soares, C.G. Stepped sea bottom effects on the efficiency of nearshore oscillating water column device. Ocean Eng. 2013, 70, 25–38. [Google Scholar] [CrossRef]
- Rezanejad, K.; Bhattacharjee, J.; Soares, C.G. Analytical and numerical study of dual-chamber oscillating water columns on stepped bottom. Renew. Energy 2015, 75, 272–282. [Google Scholar] [CrossRef]
- He, F.; Leng, J.; Zhao, X. An experimental investigation into the wave power extraction of a floating box-type breakwater with dual pneumatic chambers. Appl. Ocean Res. 2017, 67, 21–30. [Google Scholar] [CrossRef]
- Wang, R.Q.; Ning, D.Z.; Zhang, C.W. Numerical Investigation of the Hydrodynamic Performance of the Dual-Chamber Oscillating Water Columns. In Proceedings of the 27th International Ocean and Polar Engineering Conference, San Francisco, CA, USA, 25–30 June 2017; pp. 66–70. [Google Scholar]
- Mitchell Ferguson, T.; Penesis, I.; Macfarlane, G.; Fleming, A. A PIV investigation of OWC operation in regular, polychromatic and irregular waves. Renew. Energy 2017, 103, 143–155. [Google Scholar] [CrossRef]
- Kuo, Y.S.; Chung, C.Y.; Hsiao, S.C.; Wang, Y.K. Hydrodynamic characteristics of Oscillating Water Column caisson breakwaters. Renew. Energy 2017, 103, 439–447. [Google Scholar] [CrossRef]
- Gato, L.M.C.; de Falcão, A.F.O. Aerodynamics of the wells turbine. Int. J. Mech. Sci. 1988, 30, 383–395. [Google Scholar] [CrossRef]
- Suzuki, M.; Arakawa, C. Guide vanes effect of Wells turbine for wave power generator. Int. J. Offshore Polar 2000, 10, 153–159. [Google Scholar]
- Falcão, A.F.O.; Henriques, J.C.C. Model-prototype similarity of oscillating-water-column wave energy converters. Int. J. Mar. Energy 2014, 6, 18–34. [Google Scholar] [CrossRef]
- Elhanafi, A.; Macfarlane, G.; Fleming, A.; Leong, Z. Scaling and air compressibility effects on a three-dimensional offshore stationary OWC wave energy converter. Appl. Energy 2017, 189, 1–20. [Google Scholar] [CrossRef]
- Elhanafi, A.; Macfarlane, G.; Fleming, A.; Leong, Z. Investigations on 3D effects and correlation between wave height and lip submergence of an offshore stationary OWC wave energy converter. Appl. Ocean Res. 2017, 64, 203–216. [Google Scholar] [CrossRef]
- Rezanejad, K.; Bhattacharjee, J.; Soares, C.G. Analytical and Numerical Study of Nearshore Multiple Oscillating Water Columns. J. Offshore Mech. Arct. Eng. 2016, 138, 021901. [Google Scholar] [CrossRef]
Figure 1.
Sketch of the numerical wave flume.
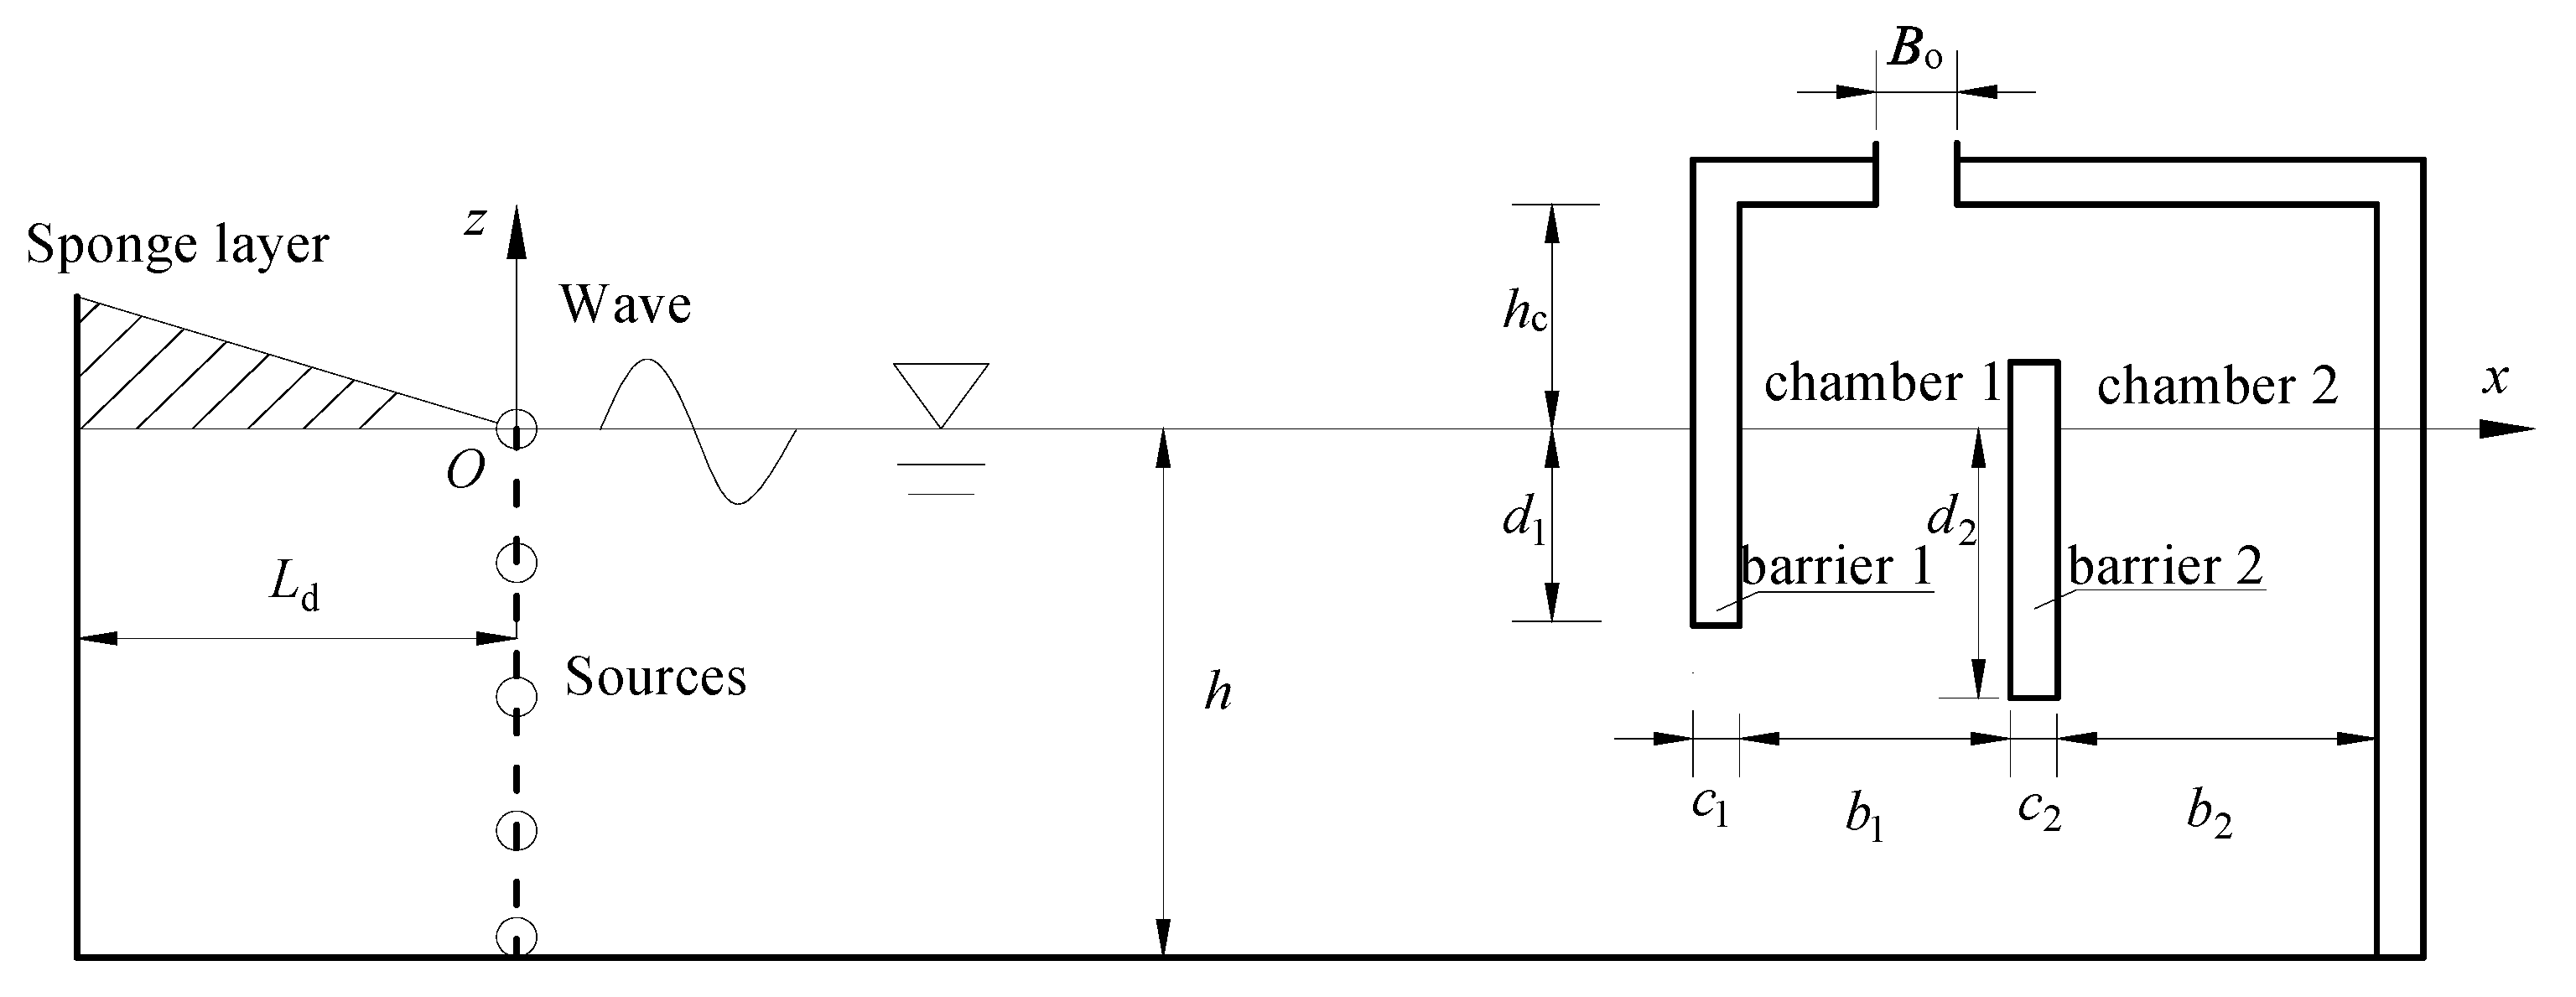
Figure 2.
Comparison of the time series of the oscillating water column volumes at T = 1.490 s (b1:b2 = 1:3, b1 + b2 = 0.55 m).
Figure 2.
Comparison of the time series of the oscillating water column volumes at T = 1.490 s (b1:b2 = 1:3, b1 + b2 = 0.55 m).
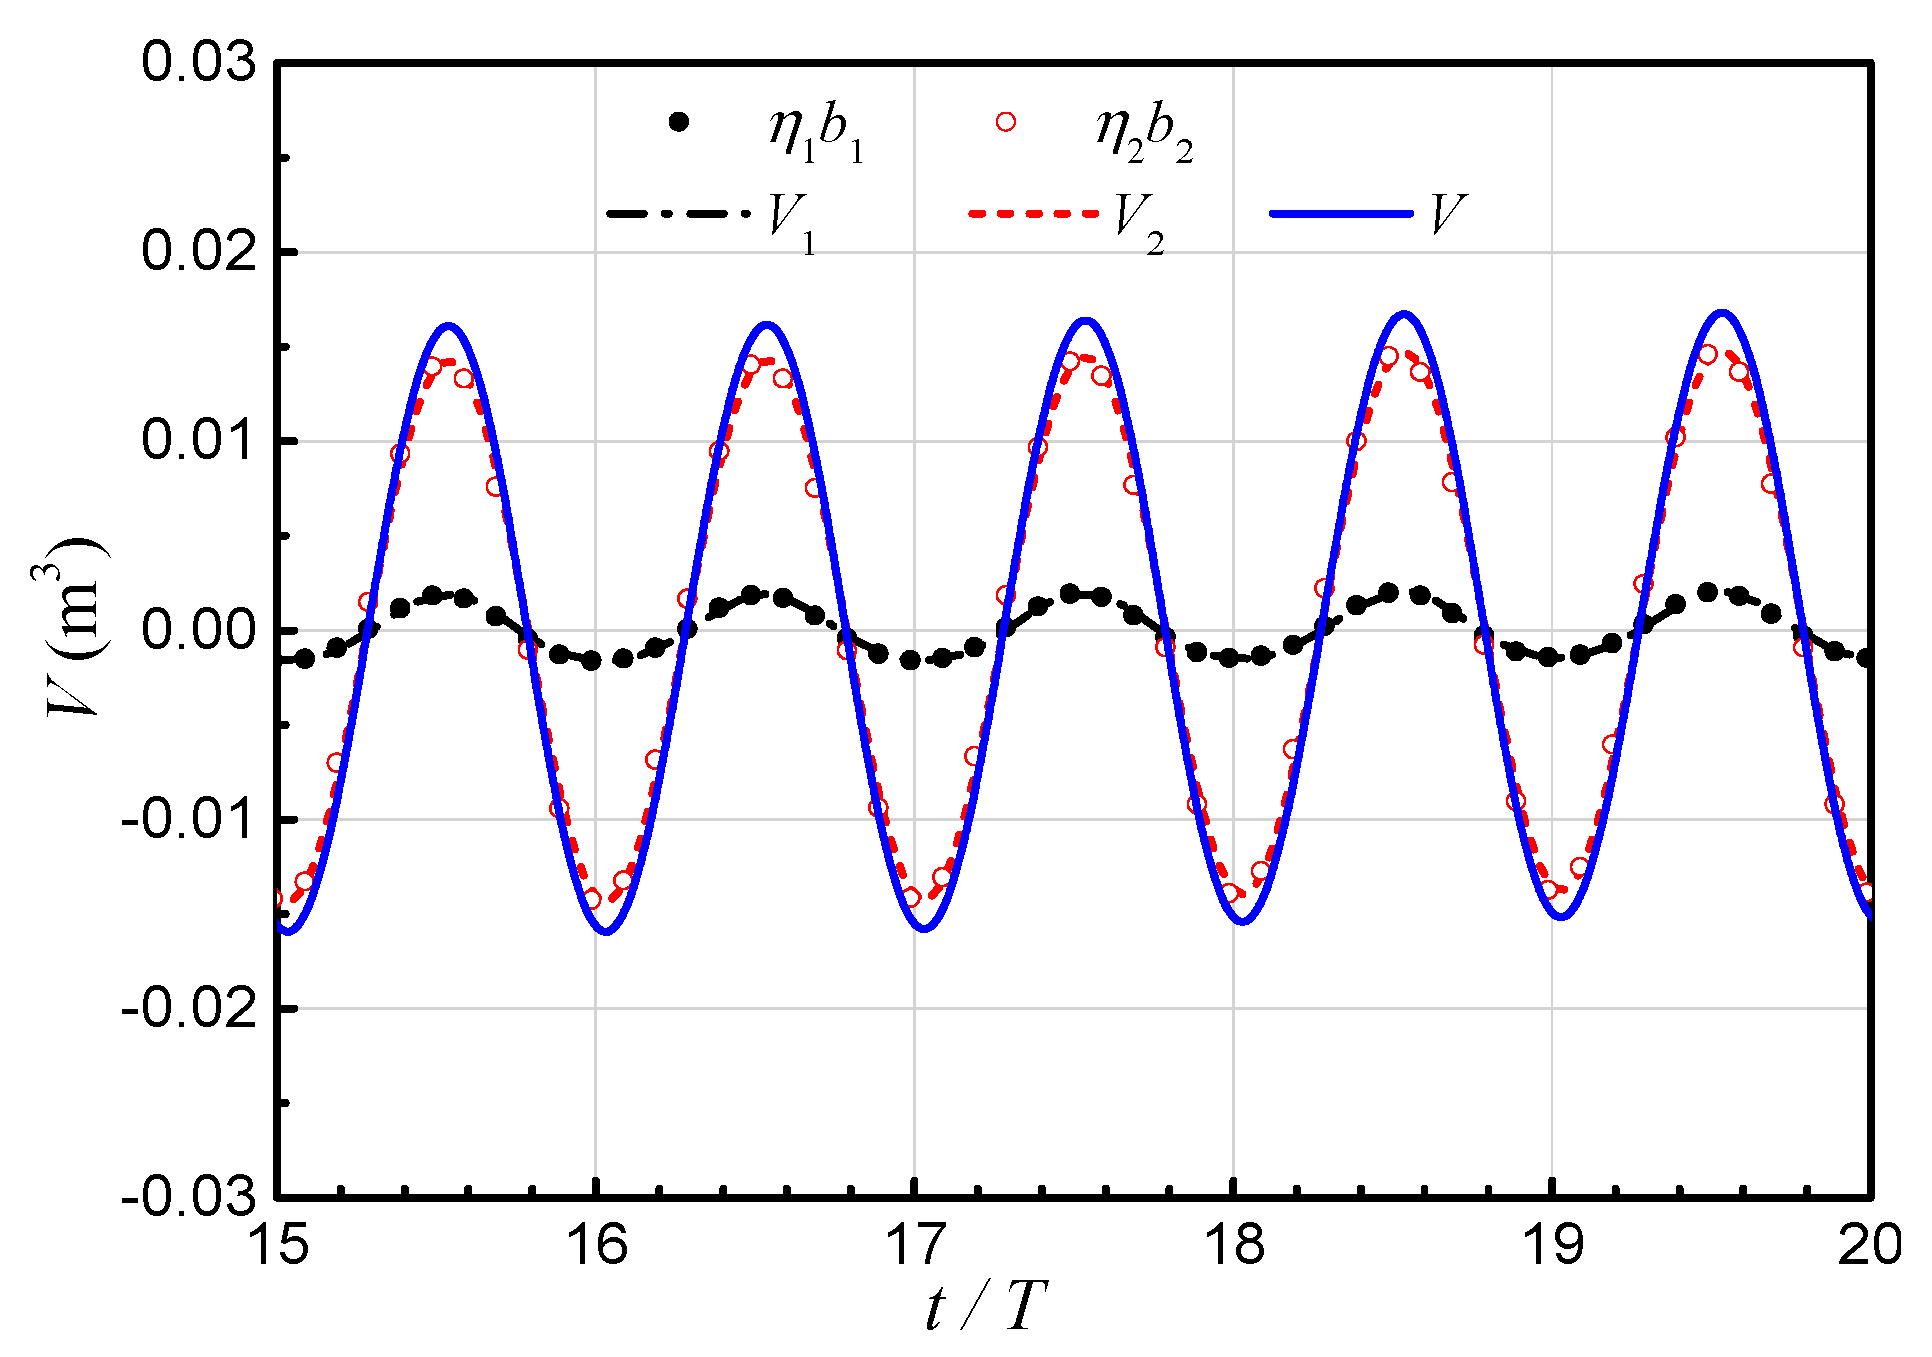
Figure 3.
Comparison of the maximum value of the oscillating water column volumes (b1:b2 = 1:3, b1 + b2 = 0.55 m).
Figure 3.
Comparison of the maximum value of the oscillating water column volumes (b1:b2 = 1:3, b1 + b2 = 0.55 m).

Figure 4.
Relative phase difference between the surface elevation at chamber 1 and chamber 2 center versus kh (b1:b2 = 1:3, b1 + b2 = 0.55 m).
Figure 4.
Relative phase difference between the surface elevation at chamber 1 and chamber 2 center versus kh (b1:b2 = 1:3, b1 + b2 = 0.55 m).

Figure 5.
Effects of chamber breadths on the surface elevation in the (a) chamber 1 (b) chamber 2 with b1 + b2 = 0.55 m (d1 = d2 = 0.14 m).
Figure 5.
Effects of chamber breadths on the surface elevation in the (a) chamber 1 (b) chamber 2 with b1 + b2 = 0.55 m (d1 = d2 = 0.14 m).
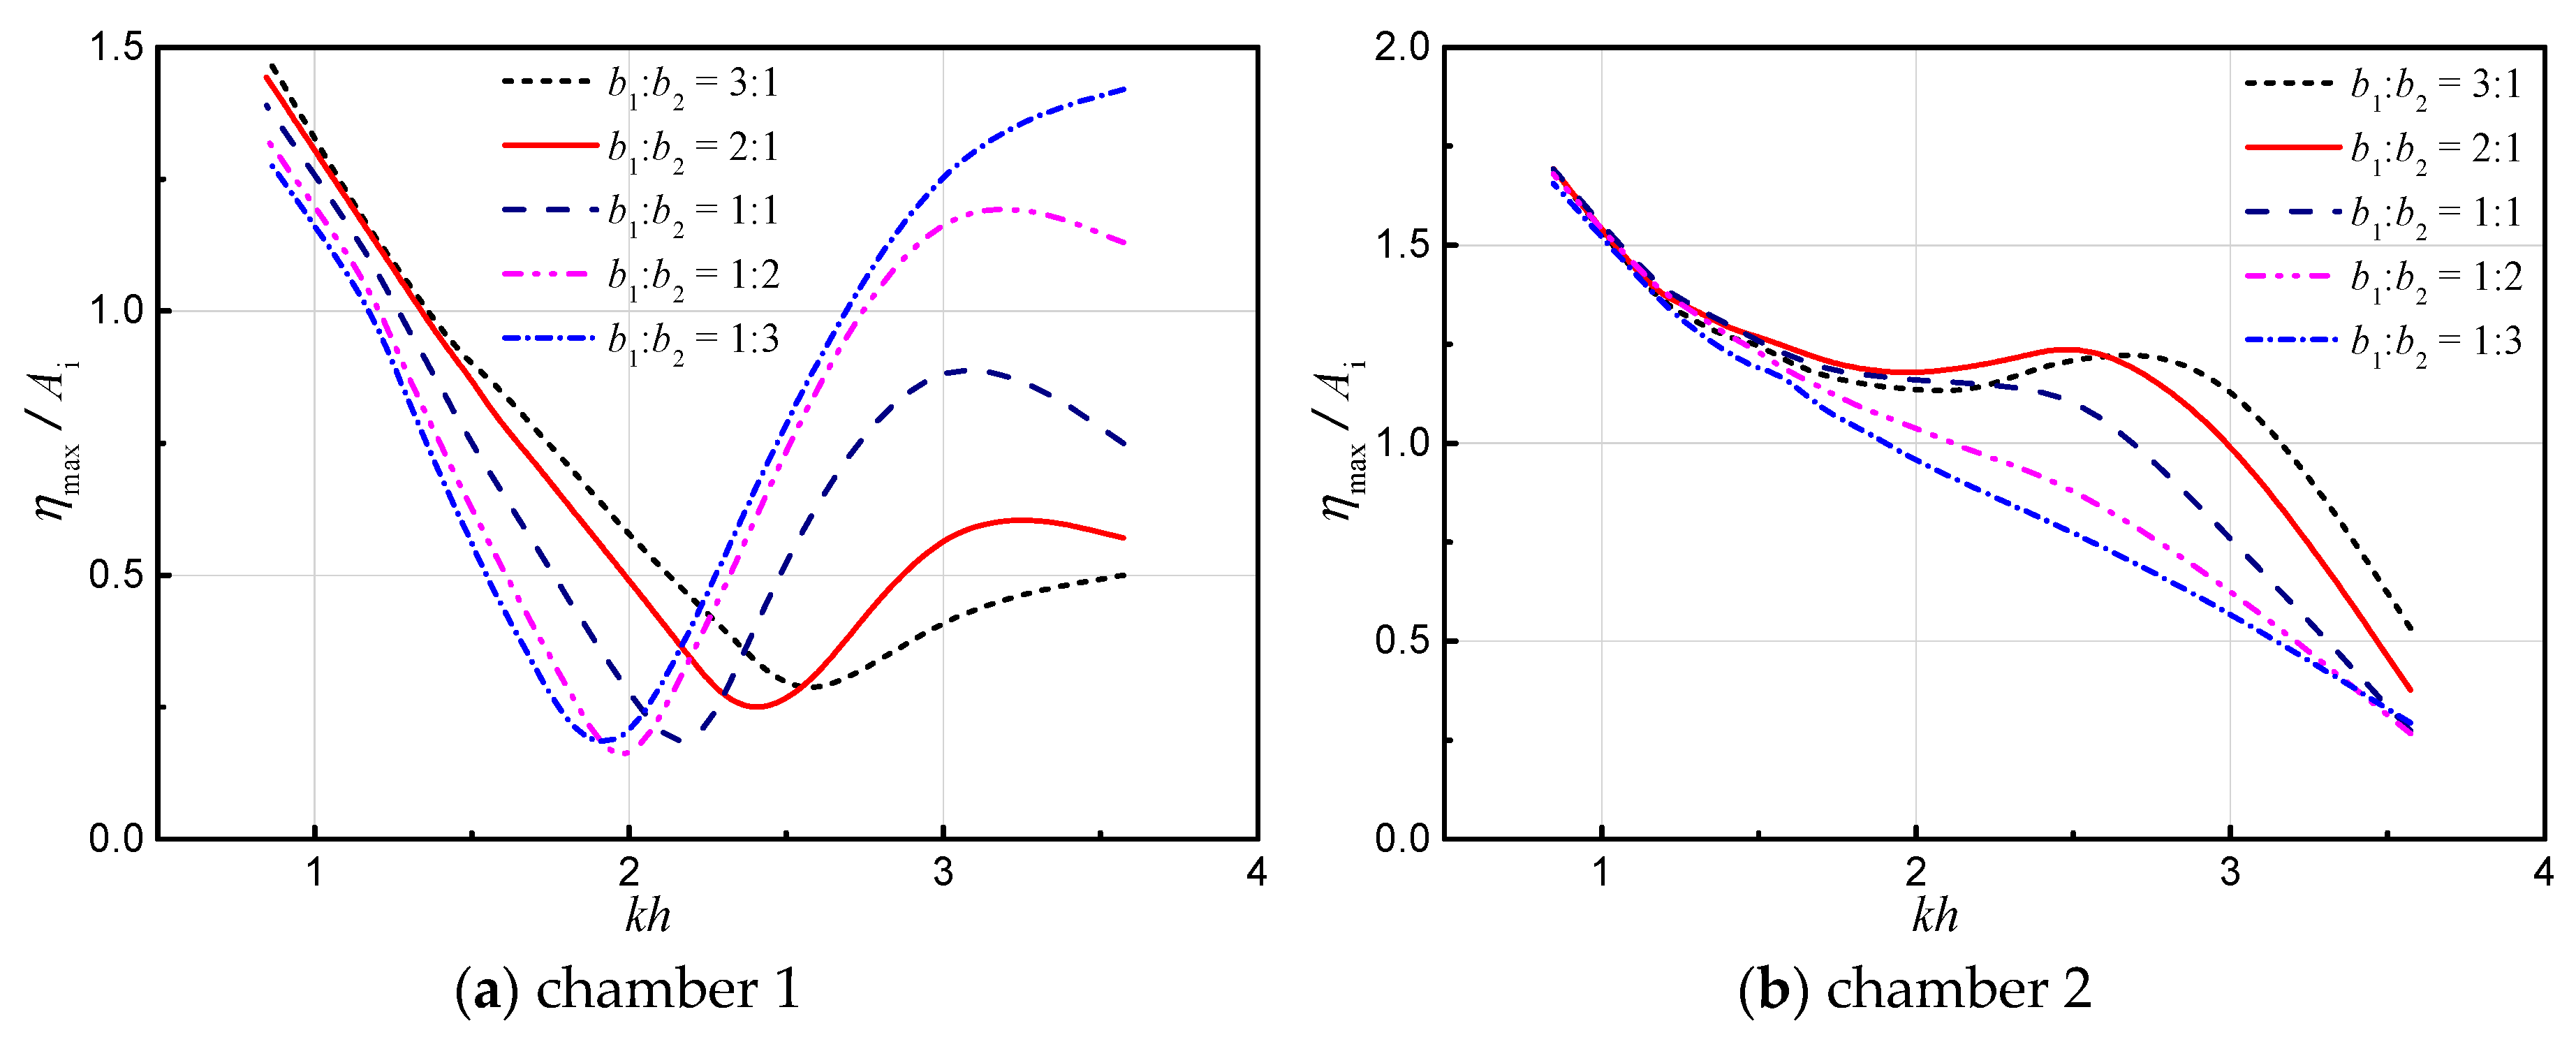
Figure 6.
Effects of barrier wall drafts on the free surface in the chamber 1 (b1:b2 = 1:3, b1 + b2 = 0.55 m).
Figure 6.
Effects of barrier wall drafts on the free surface in the chamber 1 (b1:b2 = 1:3, b1 + b2 = 0.55 m).
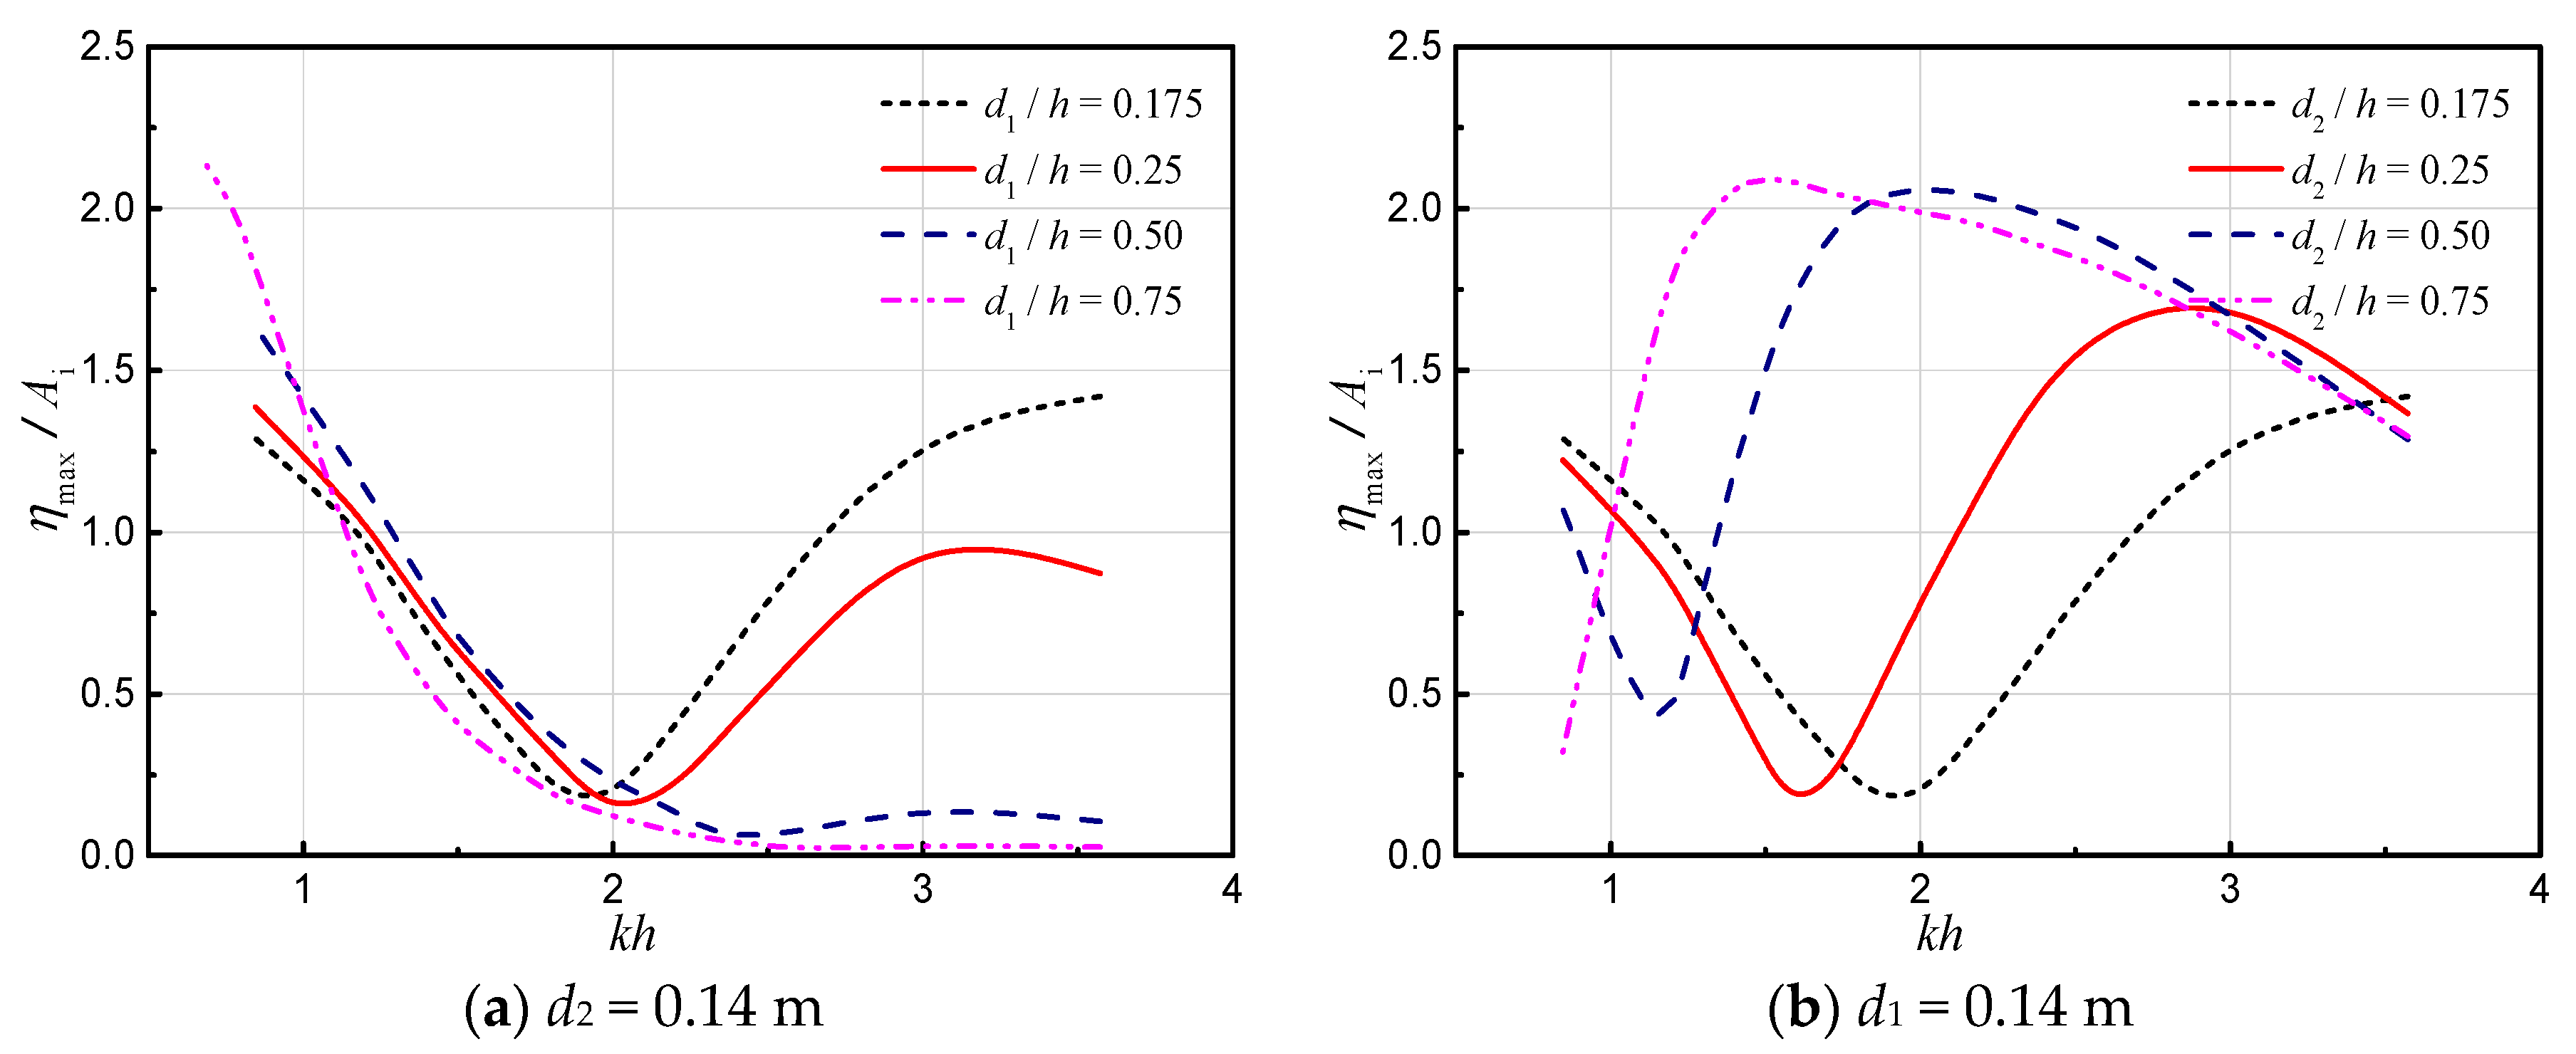
Figure 7.
Effects of barrier wall drafts on the free surface in the chamber 2 (b1:b2 = 1:3, b1 + b2 = 0.55 m).
Figure 7.
Effects of barrier wall drafts on the free surface in the chamber 2 (b1:b2 = 1:3, b1 + b2 = 0.55 m).
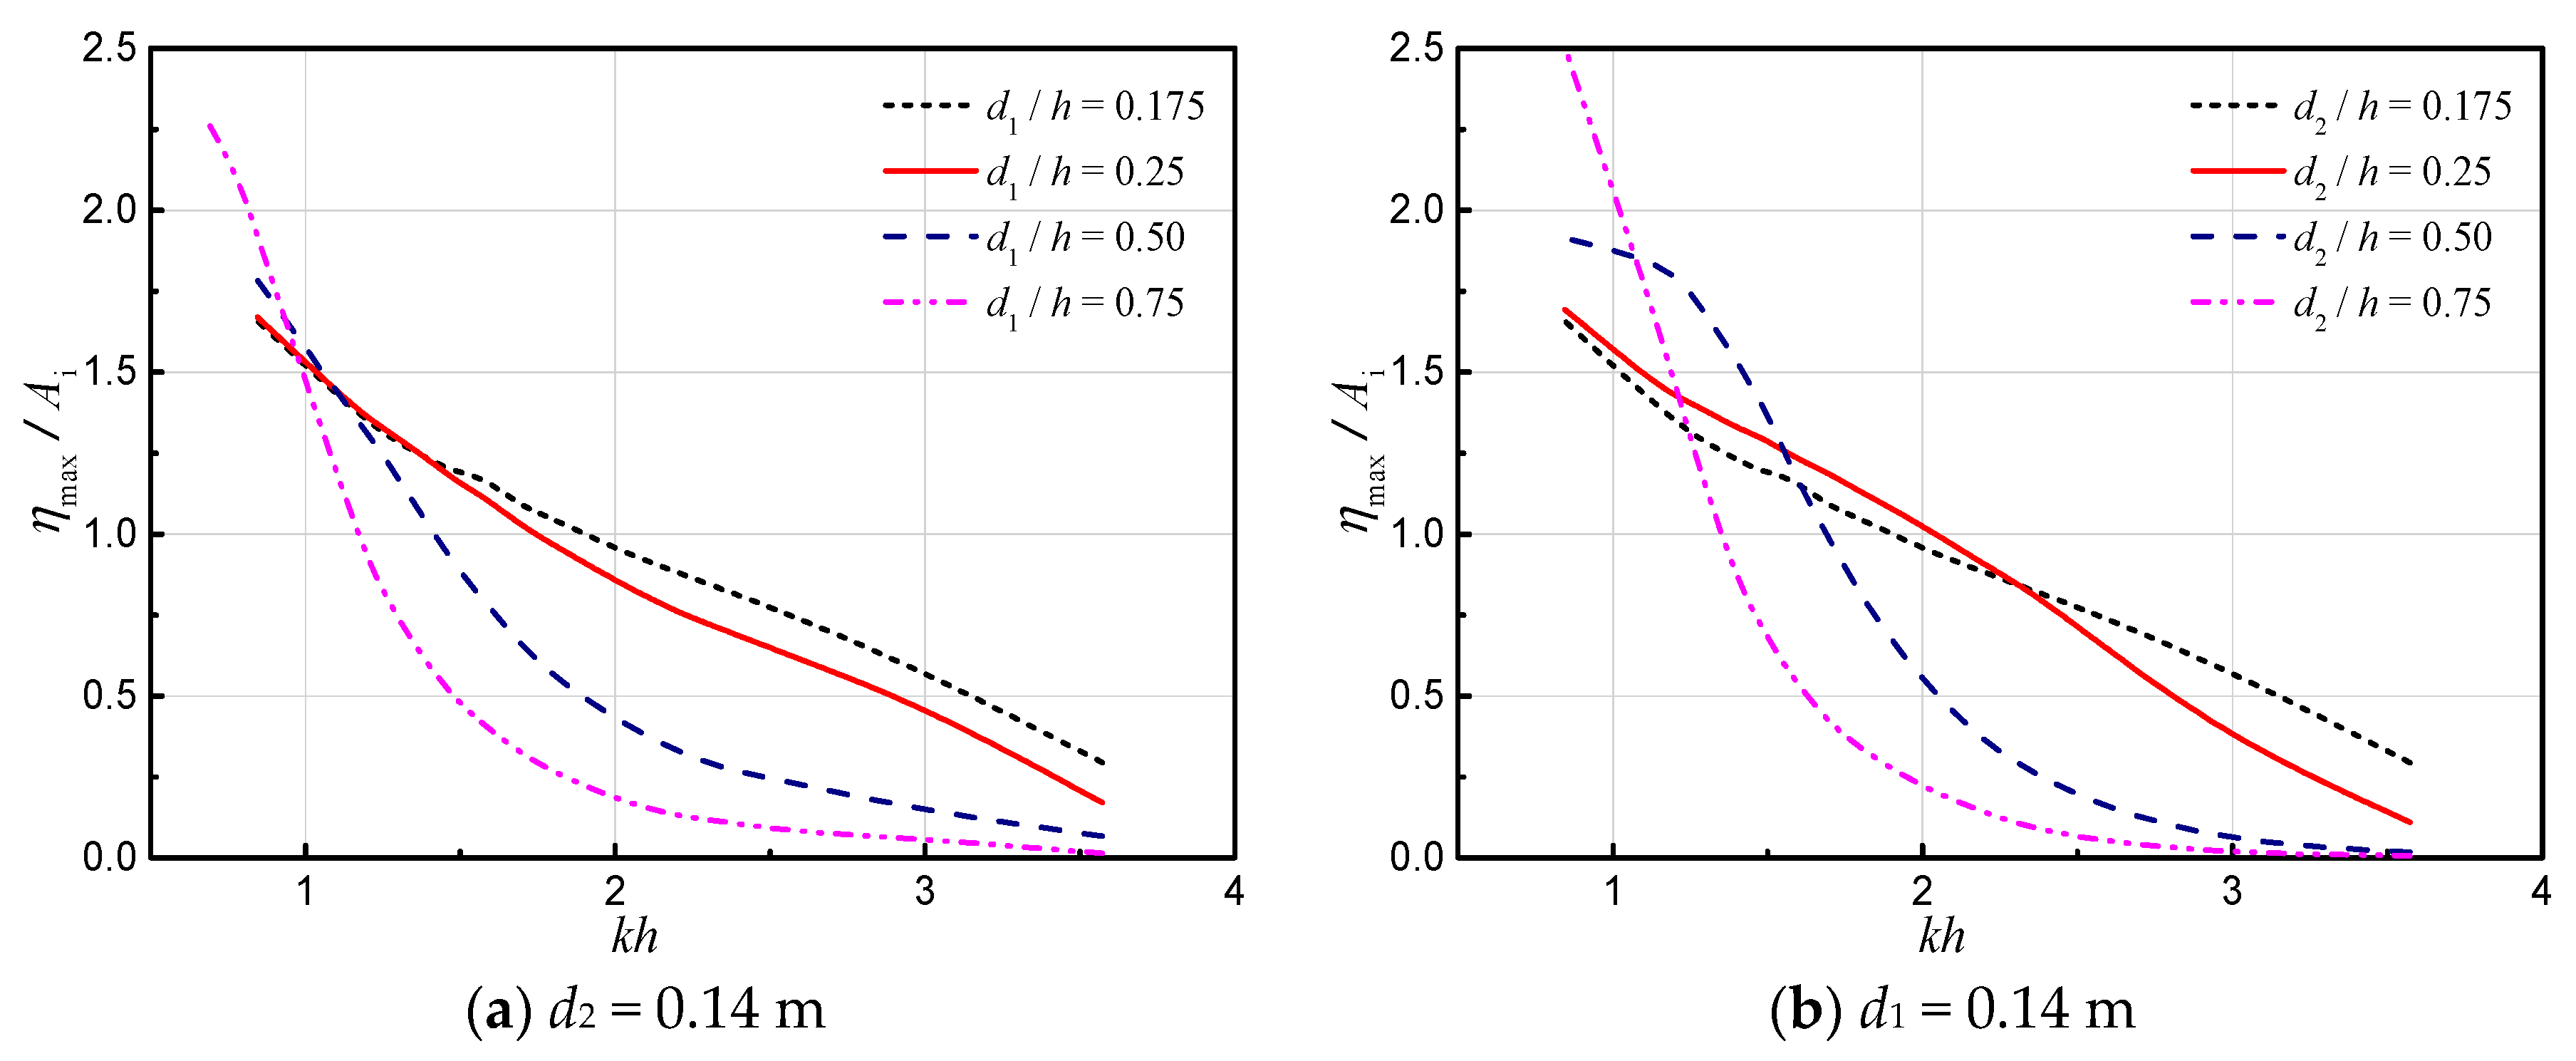
Figure 8.
Effects of chamber breadths on the air pressure in the chambers (d1 = d2 = 0.14 m).
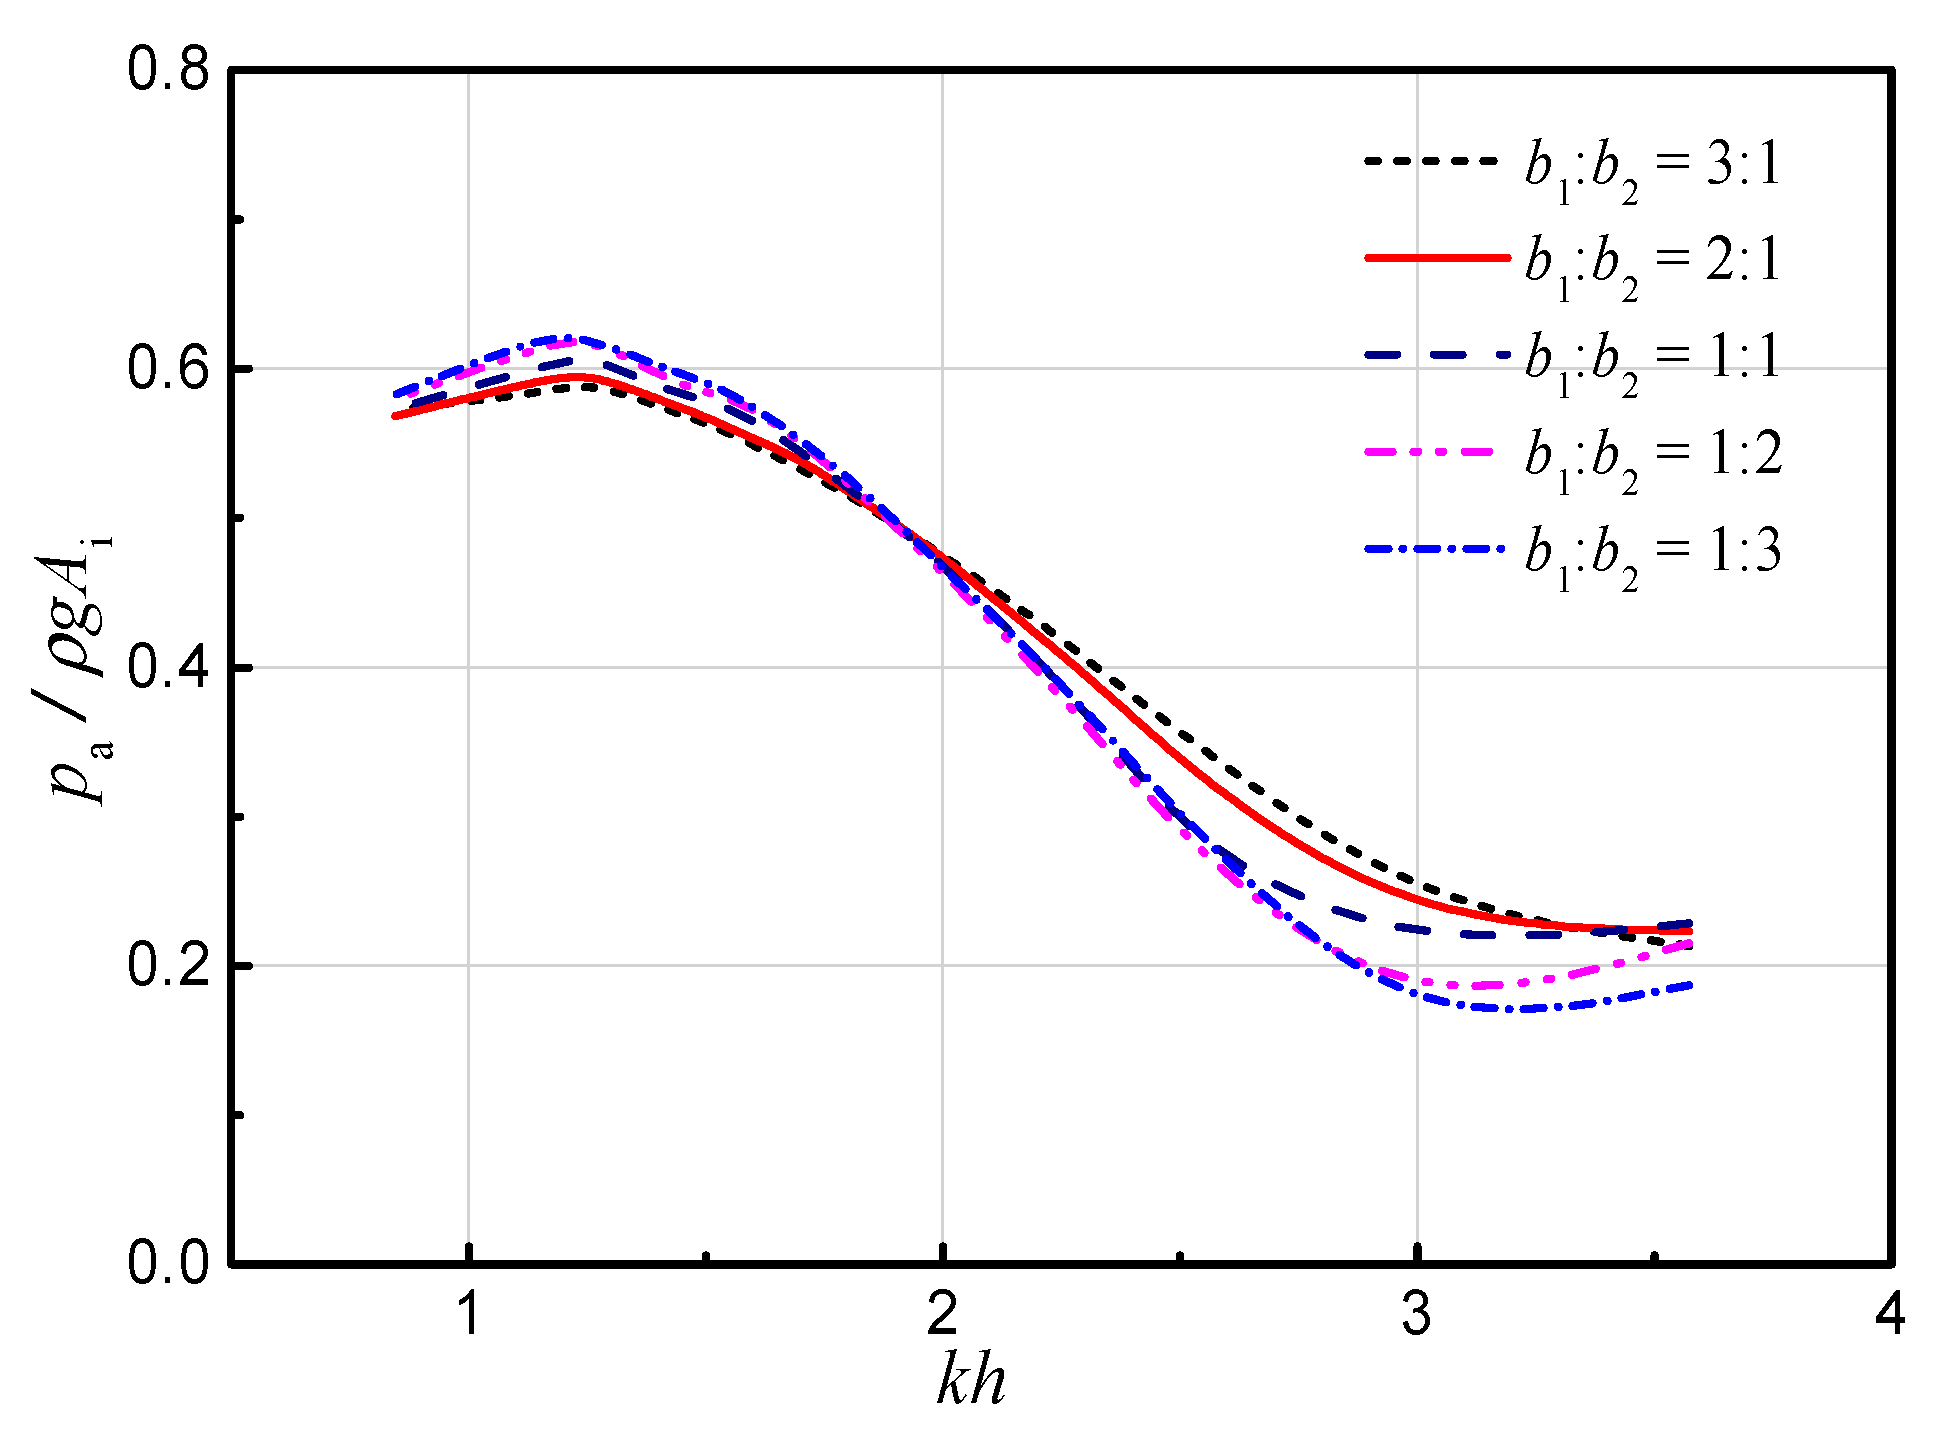
Figure 9.
Effects of barrier wall drafts on the air pressure in the chambers (b1:b2 = 1:3, b1 + b2 = 0.55 m).
Figure 9.
Effects of barrier wall drafts on the air pressure in the chambers (b1:b2 = 1:3, b1 + b2 = 0.55 m).

© 2017 by the authors. Licensee MDPI, Basel, Switzerland. This article is an open access article distributed under the terms and conditions of the Creative Commons Attribution (CC BY) license (http://creativecommons.org/licenses/by/4.0/).
Share and Cite
MDPI and ACS Style
Ning, D.; Wang, R.; Zhang, C. Numerical Simulation of a Dual-Chamber Oscillating Water Column Wave Energy Converter. Sustainability 2017, 9, 1599. https://doi.org/10.3390/su9091599
AMA Style
Ning D, Wang R, Zhang C. Numerical Simulation of a Dual-Chamber Oscillating Water Column Wave Energy Converter. Sustainability. 2017; 9(9):1599. https://doi.org/10.3390/su9091599
Chicago/Turabian StyleNing, Dezhi, Rongquan Wang, and Chongwei Zhang. 2017. "Numerical Simulation of a Dual-Chamber Oscillating Water Column Wave Energy Converter" Sustainability 9, no. 9: 1599. https://doi.org/10.3390/su9091599
Note that from the first issue of 2016, this journal uses article numbers instead of page numbers. See further details here.