Impact of Firms’ Cooperative Innovation Strategy on Technological Convergence Performance: The Case of Korea’s ICT Industry


Major of Intellectual Property, College of Economics & Business Administration, Kyonggi University, 154-42 Gwanggyosan-ro, Yeongtong-gu, Suwon-si, Gyeonggi-do 16227, Korea
Sustainability 2017, 9(9), 1601; https://doi.org/10.3390/su9091601
Submission received: 26 July 2017
/
Revised: 31 August 2017
/
Accepted: 4 September 2017
/
Published: 7 September 2017
(This article belongs to the Special Issue Entrepreneurial Sustainability: New Innovative Knowledge)
Abstract
:Various strategies and policies have been established to facilitate technological convergence as it becomes increasingly important. However, the current status and progress direction of technological convergence is still not clear, as it is difficult to define and measure convergence phenomena. In this situation, this study examines how technological convergence has continued in Korea’s information and communication technology (ICT) industry, and, further, which cooperative innovation strategies are more effective in technological convergence. In this study, the convergence level of Korean ICT is measured using patent data from 2011 to 2015. Further, this study analyzes the impact of cooperative innovation strategies on Korean ICT convergence. It is believed that, by classifying technological convergence patent applications by the scope of convergence, the declining inter-field and inter-sector technological convergence has caused a decrease in the number of technological convergence patent applications since 2011. An analysis of the correlations between the strategies and performance of technological convergence indicates that ICT firms’ licensing activities play a positive role in creating technologically convergent performance. Specifically, cooperative innovation strategies for not only licensing but also external research contracts and joint research are determined to positively affect performance in inter-sector technological convergence. Meanwhile, only the licensing strategy in inter-field convergence correlates with technological convergence performance. These results will help interpret the driving forces of technological convergence.
1. Introduction
With accelerating technological convergence and intensifying market competition, firms are pursuing open innovation by sharing their own knowledge and strategically utilizing external capabilities, rather than traditional, internal, and closed research and development (R&D) [1]. Open innovation can be broadly defined as a cooperative innovation strategy that organizationally encourages the exploration of internal and external knowledge sources, and creates new cooperative or business opportunities by efficiently integrating them with a firm’s own capabilities.
Open innovation research began in the early 2000s with conceptual studies [1,2,3], and empirical studies were conducted in earnest after the mid-2000s [4,5,6,7,8,9,10,11]. However, many previous studies primarily analyzed the determinants that affect cooperative innovation strategy. Further, these studies verified results through case studies of big companies or by using questionnaire surveys. Thus, only a few empirical researchers have identified the correlations between a firm’s cooperative innovation strategies and its performance by utilizing actual data, and no scientific consensus exists regarding these results [12,13,14].
Additionally, previous research has explained the results of changes in innovation strategy based on the “outcomes” of management and finance, such as sales, new product release times, or profit, among others. Thus, one limitation in current research involves a lack of direct explanation regarding how open innovation strategies affect technological “output”. Further, few studies analyze cooperative innovation strategies’ effects on technological convergence, which has only recently attracted attention as it is difficult to measure and quantify its results. Although some studies [15,16,17] attempt to quantitatively analyze technological convergence through various methodologies, these only approach a phenomenological analysis of the level or pattern of technological convergence. Therefore, further research is still required in areas that remain unexplored in academia, such as the drivers of technological convergence and innovation strategies’ impact on technological convergence.
Therefore, this study measures the convergence levels of Korean information and communication technology (ICT) using patent data, and analyzes cooperative innovation strategies’ impact on Korean ICT convergence. The differentiation and novelty in this research is as follows: First, the result of technological convergence in Korean ICT firms is measured through bibliographic patent data, and this paper introduces this as a dependent variable to evaluate the performance of firms’ innovation strategies. Further, previous studies have evaluated cooperative behavior from the perspectives of financial performance, business performance, or improving production efficiency [18,19,20,21,22,23,24]. However, it has recently become more important to measure and evaluate technological convergence output, as firms have continued to strengthen their technologies, knowledge, and competencies to sustainably develop through technological convergence. This enables a firm to expand its opportunities to interact with other firms, supplement its deficient assets, and explore new markets and technological alternatives [25,26,27].
Second, this study is noteworthy as it identifies the effect of firms’ strategic innovation activities as the driving force of technological convergence, which amplifies prior phenomenological analyses of technological convergence. This study expects to broaden the discussion of cooperative innovation strategies in the absence of a clear academic consensus on these strategies’ effects, as aforementioned, by empirically analyzing cooperative innovation strategies’ results from the technological convergence perspective.
Third, this paper measured technological convergence levels based on bibliographic patent information, and further refined the types of cooperative innovation strategies to enhance the sophistication of its empirical analysis. Many previous studies qualitatively addressed innovation strategies, and some empirical studies treated them as dummy variables, which led a limitation to understanding cooperative innovation strategies’ intensity effects [14]. Additionally, Laursen and Salter (2006) [8], and Keupp and Grossmann (2009) [28] studied the breadth and depth of cooperative innovation, but failed to analyze performance according to the detailed types of collaborative innovation. In this situation, this study can provide important implications for the impact of cooperative innovation strategies because it analyzes the types and significances of appropriate cooperative innovation strategies according to the extent of technological convergence.
2. Research Framework Based on Previous Studies
2.1. Identification of Technological Convergence Trend
After the first definition of convergence in the literature, as proposed by Nathan Rosenberg in the 1960s, many discussions have taken place in both academia and industry, but the definition of convergence is still ambiguous [15]. Nevertheless, as the phenomenon of convergence has recently accelerated, and various methodologies have emerged to demonstrate convergence, similarities between have been formed regarding its definitions. Generally, convergence is defined as creating new value by integrating heterogeneous technology, products, and industries [15,29].
The importance of the early preemption of converged technology is especially emphasized, as technological convergence has been regarded as a key driver of next-generation technological innovation [15,30,31]. Therefore, technological convergence is not merely an ideological concept, but develops as a major strategic consideration, inevitably encountered in actual R&D. Actually, the Korean government has implemented national master plan supporting R&D project for technological convergence since 2008 [32], and especially emphasized ICT convergence such as Internet of things (IoT), big data, cloud computing, and artificial intelligence (AI). However the current status and progress direction of technological convergence is still not clear, as it is difficult to define and measure convergence phenomena as mentioned above.
To reinforce R&D performance and establish policies to formulate technological convergence ecosystems, an analysis for determining technological convergence trends needs to be preemptively performed. Therefore, this paper aims to empirically analyze technological convergence phenomenon in Korea as a following research question. This paper focuses on technological convergence in ICT industry because the Korean government regards it as a core domain for facilitating technological convergence, and ICT convergence, combining ICT with other technologies, has continuously increased providing bundled digital products and services to consumers in the integrated ICT ecosystem [33,34]. Additionally, ICT is a technology with the highest proportion of the Patent Cooperation Treaty (PCT) patent applications (39.0%) in 2013 [35].
Question 1. What are technological convergence trends in the Korean ICT industry?
To solve this question, it is important to determine how to measure the phenomenon of technological convergence. Continuous academic efforts have been made to measure the convergence phenomenon. The method of measuring convergence differs depending on how to determine the level and range of convergence—science level, technology level, and industrial level—and co-classification analysis and co-citation analysis using patent bibliographic information are widely used to measure technological convergence [15,16,17,32,36].
Curran and Leker (2011) [15] noted that the classification codes assigned to patents include characteristics of technology. Moreover, the patent given multiple classification codes has various technical characteristics, which enables a co-classification analysis to measure the degree of technological convergence. The authors measured technological convergence between the technologies, as applied to smartphone products.
Geum et al. (2012) [16] measured convergence between information and bio technology by using detailed technology information from the International Patent Classification (IPC) and US Patent Classification (USPC) systems. Further, Choi et al. (2014) [36] proposed an improved method to measure technological convergence in all industries by using a co-classification analysis method; they applied this to analyze the technological convergence patterns in major industries in Korea, such as the machinery, electronics, instrument, and chemistry industries.
These co-classification analyses—using patent classification codes as proposed by Curran and Leker (2011), Geum et al. (2012), and Choi et al. (2015) [15,16,17] to measure the degree of technological convergence—have been attracting more attentions than co-citation analysis by the following advantages.
First, the co-classification analysis uses the patent classification code in the bibliographic information of the patent, which is set through a systematic process by specialized patent examiners for each patent. Therefore, information reliability for analysis is relatively higher than that of co-citation analysis, so the characteristics of technological convergence can be explained more precisely [36]. Second, patent applicant has a tendency to reduce citation information as much as possible because it is related with legal problem of invention. Therefore, co-citation analysis may underestimate convergence phenomenon [36,37,38].
2.2. Impact Analysis of Cooperative Innovation Strategies on Technological Convergence
First, collaborative R&D is a cooperative activity in the technology acquisition stage that can create innovation with external parties. This includes joint research, joint training (learning), and research groups [39,40,41]. A firm can acquire external technology and knowledge and enhance its research competency through joint, contract research with universities, subcontractors, and competitors [42,43]. This can also create innovation by transferring technology from these entities [44]. Additionally, cooperate activities through user participation in R&D, from prototype verification or field testing to direct participation, can have positively impact both product and process innovation [45,46].
Alternatively, a firm can induce collaborative innovation, from the technology acquisition stage to the utilizing of these technological assets. This is accomplished through intellectual property transaction strategies, in which the firm purchases licenses from other firms or sells its licenses. Purchasing licenses from other firms involves transferring technology to the inside, as an outsourcing of others’ R&D performance, rather than a firm relying exclusively on its own R&D. Conversely, the sale of a firm’s licenses means that companies can consider external organizations as business counterparts in commercializing their internal technologies and applications [7]. Licensing of ideas and intellectual property rights can more efficiently propel the acquisition and utilization of innovation performance by supplementing a lack of technology, knowledge, capabilities, or assets, and quickly spreading knowledge within companies and industries [47].
It is necessary to create profit from innovation in the technology commercialization stage by commercializing the knowledge and innovation possessed through joint ventures and spinoffs [48,49]. The firm in this stage attempts to co-create innovation by mutually exchanging key elements of success with heterogeneous firms and industries [50,51,52].
Many empirical studies have attempted to identify the correlation between firms’ cooperative innovation strategies and their performance. Tsai and Wang (2009) [53] used an industry analysis with low- and middle-level technology in Taiwan to demonstrate that innovation performance is high when working with external partners and strengthening internal R&D. An empirical analysis of Dutch innovating firms by Belderbos et al. (2004) [5] also indicated that collaboration with competitors, suppliers, customers, and universities led to improved productivity in labor and innovative sales. The authors emphasized that collaboration with suppliers and competitors has been successful in incremental innovation, while customers and universities have been found to contribute to radical innovation. Additionally, empirical studies of firms’ performance—according to the number of cooperation targets, diversity of the cooperation, and the network’s degree of cooperation—reveal a positive correlation between the cooperative innovation strategy and innovation performance [6,10,54].
Alternatively, several researchers note that external technology cooperation does not significantly affect innovation performance. Eisenhardt and Tabrizi (1995) [55] found that knowledge exchange and integration with partner firms had little impact on technological innovation. Moreover, open innovation strategies seem to strengthen reliance on other firms’ resources [56], or even negatively impacts innovation performance, depending on the cooperation partner [9,57].
These authors however did not consider detailed cooperation strategies, as previous studies have illuminated cooperative innovation itself. Therefore, they have not pinpointed effective and efficient cooperative innovation strategies for corporate performance. Therefore, as the second research question, this study investigates the convergence performance according to the types of cooperative innovation strategies.
Question 2. Among firms’ cooperative innovation strategies, which are more effective for technological convergence?
In this paper, the types of cooperative innovation strategy are licensing, external research contracts, joint research, joint ventures, mergers and acquisition, and others. As cooperative innovation strategies, they emerged from the technology acquisition stage to the technology commercialization stage, and were selected based on Megantz’s (1996, 2002) [58,59] studies. Megantz (1996, 2002) [58,59] distinguished six cooperative innovation strategies according to the risks and rewards of technology transfer: sales, strategic alliances, licensing, joint ventures, acquisitions, and new ventures. The author suggested that strategies for the commercialization stage, such as new ventures and acquisitions, are relatively high in both risks and rewards, while sales and strategic alliances as technology acquisition stage strategies are relatively low. Further, he argues that as licensing has moderate risks and rewards, firms can use licensing as a useful cooperation strategy when complementary assets are strong but technology is low, and vice versa. This study expects to verify Megantz’s discussions in terms of technological convergence.
Development uncertainty and risk especially increases with the convergence of different technologies, and firms are often faced with difficulties in convergence innovation due to a lack of technology, experience, and complementary assets in other areas. The larger is the heterogeneity in converging technologies, the greater are the transaction costs and the costs of constructing complementary assets. Instead, level of outcome on heterogeneous convergence may be higher than that on monotonous and homogeneous convergence, which indicates that a firm’s innovation strategy may differ depending on the extent and scope of technological convergence [32]. Lee et al. (2017) [32] identified the effects of cooperative R&D projects’ characteristics on the level of ICT convergence, and found that the project duration and small and medium firm’s participation can positively influence to accomplish the higher level of technological convergence. However, they did not determine the effect of cooperative innovation strategy on the level of technological convergence. Therefore, as the last research question, this paper tries to find out how the cooperative innovation strategy can be changed according to the level of technological convergence.
Question 3. How does a firm’s cooperative innovation strategy depend on the scope of technological convergence?
3. Methodology
3.1. Measurement of Technological Convergence
This study measures technological convergence through a co-classification analysis including each firm’s patent application data, as suggested by [15,16,17]. Korea Enterprise Data, a professional agency of database and survey, provides the patent application data, which contains International Patent Classification (IPC) codes, including technical attributes. This enables the measurement of degrees of technological convergence by analyzing the system in which the IPC codes’ technical attributes are classified. The co-classification analysis must use the linkage system between IPC codes and technology domains to extract technical attribute information from a patent’s IPC code; therefore, this paper introduces the IPC-Technology Concordance Table, as published by the World Intellectual Property Organization [60]. All the IPC codes are noted in this table and classified into 35 detailed fields in five sectors: Electrical Engineering, Instruments, Chemistry, Mechanical Engineering, and Other Fields (Appendix A).
The technological convergence measurement process is as follows: First, the IPC code extracted from each firm’s patent is allocated to a field, of 35 in six sectors, as classified by the IPC-Technology Concordance Table. If a certain patent has multiple IPCs belonging to different field classifications in the same sector, this patent can be defined as having “inter-field technological convergence”. Further, if they belong to different field classifications in different sectors, this can be defined as “inter-sector technological convergence”. Consequently, this assumes a binary value of one if a patent belongs to inter-field or inter-sector technological convergence, and zero otherwise. Figure 1 illustrates the technological convergence identification process.
For example, if a patent has two IPCs, such as G09F and H04L, then its technology attribute may belong to both the “audio-visual technology and “digital communication” fields. However, as the two fields are within the electrical engineering sector, this case includes inter-field technological convergence. Alternatively, if a patent has multiple IPCs, such as H04L and C07G, one belongs to the “digital communication” field in the electrical engineering sector, and the other falls into the “biotechnology” field in the chemistry sector. Therefore, this can be considered as inter-sector technological convergence. Additionally, a patent with more than three IPCs may be identified as having both inter-field and inter-sector technological convergence if the two IPCs belong to different fields in the same sector, but the remaining IPC belongs to a different field in a different sector.
This paper incorporated Choi and coworkers’ (2015) research [17] to calculate the degree of technological convergence by counting the number of technological convergence patent applications and the total patent applications, as follows:
where is the degree of technological convergence of ICT firm i and application year t, and and , respectively, indicate the number of technological convergence patents and the total number of patents from ICT firm i and application year t.
This paper analyzed 3154 firms classified as ICT industry by the Korean Standard Industrial Classification system (KSIC) with more than one patent having multiple IPCs from 2011 to 2015. ICT-based technological convergence, the so-called “Smart Revolution”, was introduced in the late 2000s with the spread of smart devices and the advancement of networks. In keeping with this trend, many developed countries established action plans and supporting programs, and the Korean government has continuously implemented “national master plan for technological convergence” in 2008, “basic plan for object communications” in 2009, and “basic plan for Internet of Things” in 2014 to strengthen the competitiveness of the R&D for ICT convergence. This paper focuses on the trend of technological convergence during 2011–2015 when patents were applied as a result of ICT convergence under these policies. Technological convergence was consequently measured through the co-classification analysis of 15,770 samples for 3154 firms over five years.
3.2. Establishing an Integrated Database and Variables
This study’s major objective involves investigating ICT firms’ cooperative innovation strategies and analyzing how they relate to the results of converged innovation activities. It is necessary to combine firms’ financial and business information with its patent information by using the firm name or business code as a connection link to control for the influence of firms’ basic elements on technological convergence performance. Additionally, a survey of sample ICT firms’ cooperative innovation activities is inevitable, as it is difficult to grasp this information from a financial, business, or patent database. Therefore, this study surveyed cooperative innovation activities in 200 of the 3154 ICT firms using a random sampling method. The selected 200 firms belong to ICT industry, and have at least one patent with two IPCs during 2011–2015. The survey was conducted by questionnaire through telephone interview and e-mail contact between 11 July 2015 and 10 October 2015. The questionnaire is composed of 19 items (for the full questionnaire, please contact the corresponding author), and, among them, important items related to this study are addressed in Appendix C. The results were linked to the surveyed firms’ financial, business, and patent data, as Figure 2 illustrates.
The number of patents identified as inter-field and inter-sector technological convergence by the process noted in Figure 1 can be used as dependent variables in determining converged innovation performance. Additionally, the survey results from the aforementioned 200 firms account for levels of six cooperative innovation strategies, which are explanatory variables: licensing, external research contracts, joint research, joint ventures, mergers and acquisition, and others.
This paper also controlled for a firm’s general characteristics by introducing total capital and the total number of employees, as it is difficult to clearly distinguish input, strategy, cooperation, and performance for technological convergence from general development processes [36]. A detailed description of the variables is given in Table 1.
This paper also considers a time-lag issue between technological strategy implementations and their results. Several studies have attempted to determine the time lags between R&D activity and patenting, and discovered that it is difficult to pinpoint exact time lags, but both time-lagged and contemporaneous effects significantly exist between R&D activity and patenting [61,62]. Additionally, the WIPO (2011) [63] assumes a one-year time lag between R&D investment and patent application. This paper considers these studies to assume that cooperative innovation strategies can influence patent applications with both contemporaneous and one-year lagged effects.
Table 2 illustrates the basic statistics of these variables:
3.3. Estimation Methods
The dependent variables, or technological convergence, provide the count data as the number of patents identified as a result of converged innovation. The count data attributes are generally discrete and non-linear [64], which makes these independent of time, unlike continuous variables that depend on time. Therefore, the Poisson model is widely used, as this involves an analysis of count data that does not reflect continuity over time. This also incorporates a distribution of an event’s probability of occurrence (dependent variable), under the assumption that the event’s occurrence time is random and independent [65]. The Poisson model is known to demonstrate estimation results superior to the ordinary least squares (OLS) model for a regression analysis of count data [36].
The Poisson model considers the distribution of the probability that a dependent variable has a value in the form of a count , given the rate at which events occur over a period of time, or the mean value (expectation), assuming that the event is time-independent. This is called the Poisson distribution, which can be expressed by the following Equation (2):
This equation implies that the probability that the dependent variable for observation i equals the value of the count type , and this is determined by the mean (expected) value at which the event occurs and the count value . In other words, the probability distribution, in that the dependent variable is the same as the count value , can be regarded as following the Poisson distribution by the mean value at which the event occurs. The Poisson distribution at this time is equally dispersed, as . Further, the mean (expected) value at which the event occurs can be estimated as noted in Equation (3), by several explanatory variables:
This equation is a function that performs a regression analysis on the mean value (expectation) of an event occurrence for observation i with explanatory variables and regression coefficients. This Poisson model estimates regression coefficients not with the least squares estimation method, but the maximum likelihood estimation method, as the Poisson model has no error term, contrary to general linear regression analyses [36].
Alternatively, the Poisson distribution is based on the equal dispersion assumption, but the value of the dependent variable when analyzing actual data is often biased toward a specific value, such as zero or one. Therefore, if such a situation occurs, dispersion may become over-dispersion that exceeds the average, and a complementary model is needed to reflect this problem [64].
The negative binomial distribution expands the Poisson distribution affected by into a distribution affected by ; here is a random variable with . Therefore, the expectation in the negative binomial distribution is that equals that of the Poisson distribution; however, the variance is larger than the mean value, as , which satisfies the over-dispersion assumption (Cameron and Trivedi, 2010). If the in this case follows the gamma distribution of , the negative binomial distribution can be expressed as Equation (4):
where is the gamma integral, and the negative binomial distribution indicates . If the variance of converges to zero, or , then the negative binomial distribution equals the Poisson distribution; thus, the Poisson distribution is a special model of the negative binomial distribution. A regression analysis of the negative binomial distribution can be similarly estimated using the Poisson model process as demonstrated in Equation (3), and by setting as a constant [64].
4. Empirical Results
4.1. Result of Technological Convergence
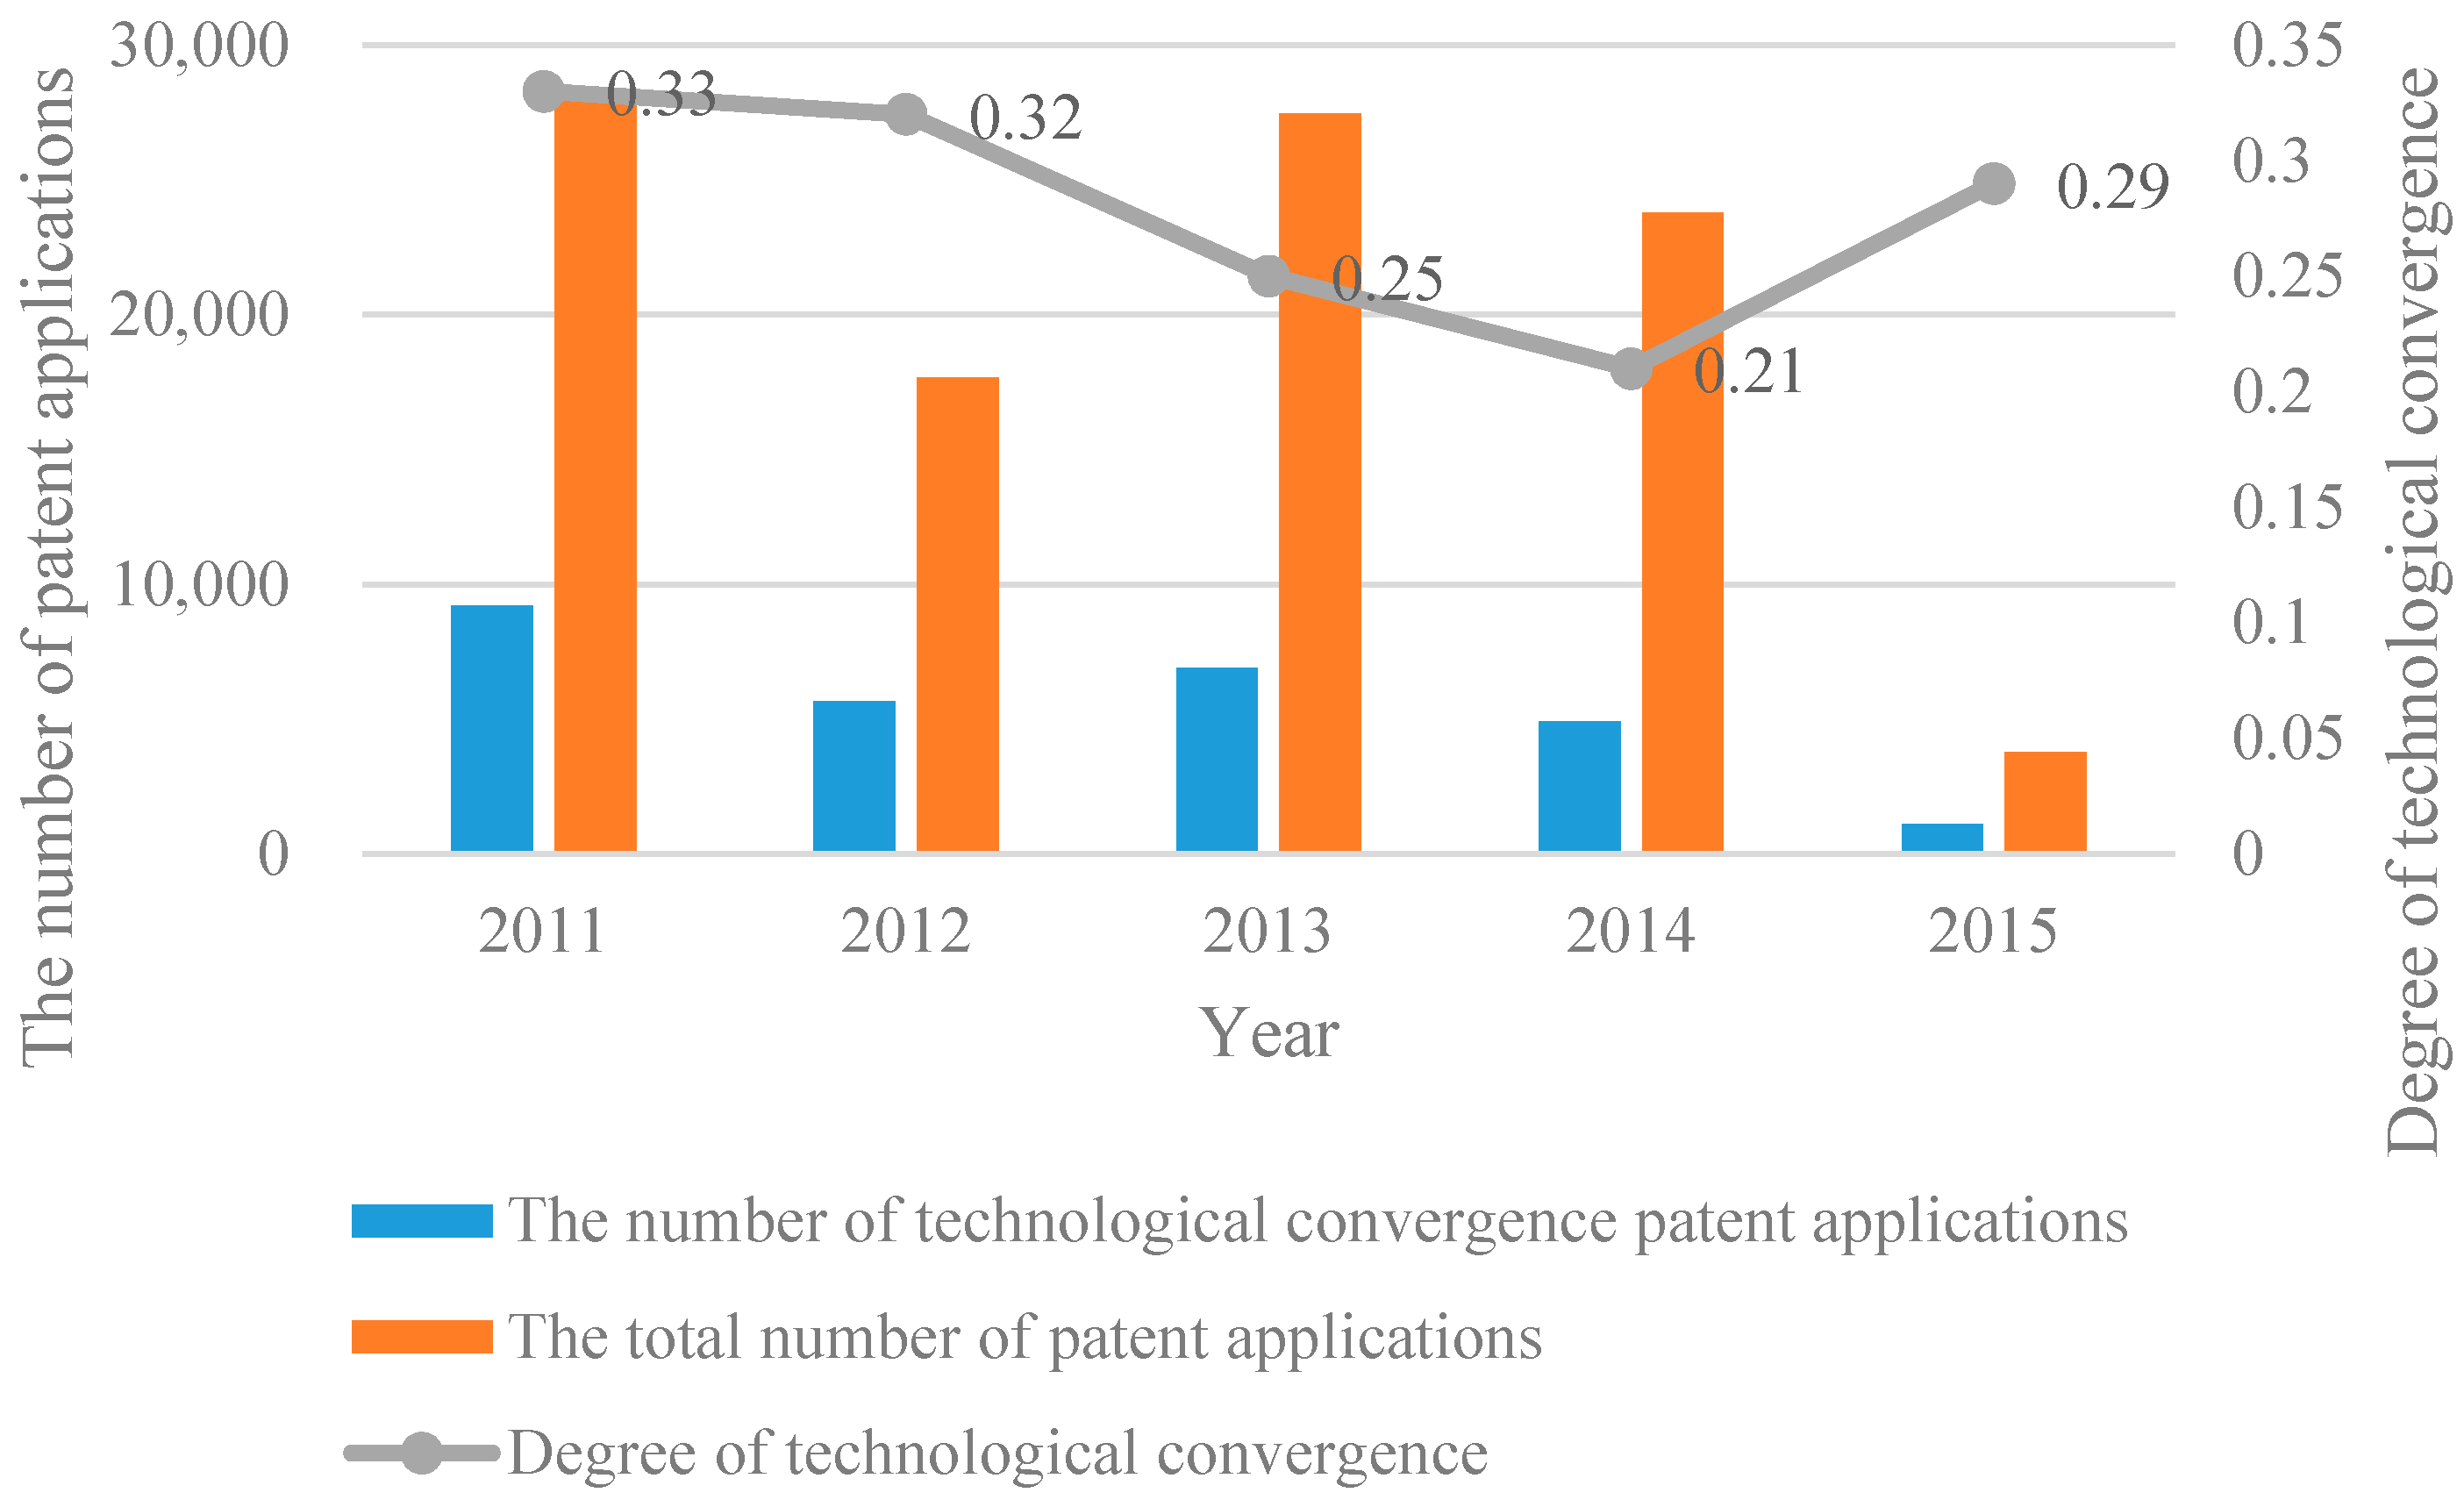
As a result of identifying the technological convergence for 3154 ICT firms, the following patent applications were judged as exhibiting inter-field or inter-sector technological convergence: 9211 in 2011, 5645 in 2012, 6885 in 2013, 4897 in 2014, and 1084 in 2015. The total patent applications and technological convergence patent applications merged in 2015 are inferior to those in other years due to incomplete patent application statistics, according to the most recent database year in 2015. As Table 3 and Figure 3 illustrate, the number of ICT firms’ technological convergence patent applications positively correlates with the total number of patent applications, and has gradually decreased since 2011. As the number of technological convergence patent applications in 2014 decreased by 47% compared to 2011—although 2013 has rebounded compared to the previous year—the output of converged innovation activities in the Korean ICT industry has significantly decreased. Additionally, the degree of technological convergence also declined, from 0.33 in 2011 to 0.21 in 2014, and rebounded to 0.29 in 2015. However, regarding the incomplete patent application statistics in 2015, the degree of technological convergence from 2011 to 2014 has also continuously decreased, as mentioned above.
It is believed that, as a result of identifying technological convergence patent applications by the scope of convergence, the decreasing inter-field and inter-sector technological convergence since 2011 has induced a decrease in the number of technological convergence patent applications. Additionally, one can observe a gradual decrease in the gap in patent applications between the two technological convergence levels, although the number of inter-field technological convergence patent applications was significantly greater than the inter-sector until 2012. As Table 4 and Figure 4 indicate, the degrees of technological convergence on both the inter-sector and inter-field levels reveal a decreasing tendency, but the width of decrease on the inter-field level is relatively larger than on the inter-sector level.
These results are parallel the results from Choi and coworkers’ (2015) study [17], which suggested that technological convergence in ICT has progressed more than other technologies since the early 2000s, with a focus on “digitally enhanced cordless telecommunications” in Korea [66]. As their study’s data and results are presented as of 2010, the progressive decline in the degree of ICT convergence can be explained by the maturation of both ICT technology and its industry.
4.2. Impact Assessment of Firms’ Cooperative Innovation Strategies
This paper examined the correlation between technological convergence and cooperative innovation strategies using a Poisson model and negative binomial model. (This paper also shows the result excluding observations of 2015 having incomplete patent application statistics in Appendix B. Although there are some differences in the coefficient value and significance due to the changes in the observations, overall results are parallel to the results including 2015 by showing significance of licensing strategy in all type of convergence and that of joint research strategy in inter-sector technological convergence (in Poisson model).) A log-likelihood ratio (LR) test was conducted to determine the model’s fit. Consequently, the null hypothesis, which noted that the variance of the error term is zero (), was rejected at the 1% significance level. This is because the p-values in both the Poisson and negative binomial model were less than 0.01, which indicates the two models are suitable for the analysis. Specifically, the negative binomial model can be considered as more suitable than the Poisson model, as the over-dispersion parameter was estimated as non-zero at the 1% significance level.
Table 5 displays the results of the cooperative innovation strategies’ impacts on overall technological convergence performance. Licensing was found to be the cooperative innovation strategy positively affecting the increase in technological convergence patents in both the Poisson and negative binomial models. On the one hand, regarding the contemporaneous (T) and one-year lagged (T-1) periods, the licensing activity positively affected technological convergence performance at the 1% and 5% significance levels, respectively, through which one can infer that ICT firms’ convergence activities are primarily accompanied by a licensing process. These results agree with Choi and coworkers’ (2014) study [46], which posits that the introduction of external technology can strengthen technologically convergent performance.
On the other hand, the one-year lagged Poisson model revealed that the effects of both joint research and licensing increase technological convergence performance. This reflects one trend, in that many ICT firms often externally collaborate through technological convergence with universities and research institutes to overcome heterogeneous technologies, poor experiences, and insufficient capabilities and assets. However, the strategies that firms can utilize in the technology commercialization stage, such as joint ventures and mergers and acquisitions, do not significantly affect technological convergence. Total capital and laborers, which represent a firm’s size and capability, significantly affect technological convergence; it can be confirmed that innovation activities as well as the firm’s intrinsic characteristics have some influence on technological convergence.
Unexpectedly, as shown in Table 6, the cooperative innovation strategies that assist a firm in improving inter-sector technological convergence performance are identified as both licensing and joint research. The estimation results’ levels of significance differ by model and time lag, but all conditions’ results demonstrate licensing and joint research’s positive effects on technological convergence. Additionally, the Poisson model, assuming contemporaneous effects, indicates that external research contracts also have positive and significant effects.
As mentioned above, a firm is motivated to decrease costs and enhance its capability in inter-sector convergence, as greater technological heterogeneity induces greater transaction costs and increases the necessity of complementary assets. Therefore, this may motivate a firm to become involved in early technology acquisition through collaborative R&D, such as external research contracts and joint research. Alternatively, such cooperative innovation strategies as joint ventures and mergers and acquisitions still have no significant effect on inter-sector convergence.
In Table 7, one can also observe that licensing activities only have a significant effect on the increase in inter-field technological convergence. Thus, it may be more suitable to implement other strategies, such as outsourcing R&D results and externally transferring knowledge and intellectual property, rather than becoming involved in the early stages of technology acquisition. As inter-field convergence has relatively less heterogeneity, transaction costs, and a need for complementary assets than inter-sector convergence, firms can choose efficient licensing strategies in terms of risks and rewards, as suggested by Megantz (2002) [53]. Moreover, these results are consistent with results from Choi et al. (2014) [46], in that the external transfer of technology plays an important role in inter-field convergence. However, the result must be carefully considered that cooperative innovation activities, such as joint ventures and mergers and acquisitions, are not determined to be significant strategies in inter-field convergence.
5. Conclusions
As a new engine for sustainable growth, ICT-based technological convergence is emphasized as other industries advance and the ICT industry matures. As technological convergence becomes increasingly important, many technological convergence strategies and policies have been established to facilitate this. This paper considered this situation by starting with questions regarding how technological convergence has continued in the Korean ICT industry, and which cooperative innovation strategies are more effective for technological convergence. This paper solves these questions by defining technological convergence and measuring its performance using patent data. Additionally, surveys of a large number of firms’ cooperative innovation strategies—as well as linking the results with technological convergence data—facilitated an analysis of the correlation between cooperative innovation activities and technological convergence.
The Korean government has continuously implemented various plans and programs for technological convergence since 2008, and total R&D investment in Korea had been increased from 58,427 million dollars (US dollar, 2010 constant price and purchasing power parity) in 2011 to 73,720 million dollars in 2015 [67]. According to the results of this study, however, the performance of technological convergence during same period emerged to be unsatisfactory by showing that the degrees of technological convergence on both the inter-sector and inter-field levels reveal a decreasing tendency. Although the result is based on patent application information, this study suggests that the effect of the convergence policy of the country needs to be verified. To do this, various indicators and elaborate tools that can observe and measure the outcome of technological convergence should be developed, and this study is expected to provide an important step in developing such indicators and tools.
On the other hand, the analysis results indicate that despite the trend of declining technological convergence ICT firms’ licensing activities play a positive role in creating technological convergent performance. Licensing is perceived as a more efficient and effective strategy for technology acquisition and utilization in the rapidly changing ICT industry, as this can decrease the direct cost burden of R&D and the risks of technology uncertainty, instead of paying royalties to the licensor. This study’s results empirically confirm that this licensing strategy can assist in creating technological convergence. It indicates that Megantz’s discussions for a firm to use licensing as a useful cooperation strategy can be also adopted in terms of technological convergence.
Specifically, regarding inter-sector technological convergence, cooperative innovation strategies that involve licensing, external research contracts, and joint research were determined to positively affect technological convergence performance. This is because it is more efficient for firms with inter-sector convergence having larger technological heterogeneity to use strategies that involve them in cooperative activities to acquire basic and original technologies to decrease their transaction costs and enhance their capabilities. Therefore, external research contracts and joint R&D, which are less risky and more research-oriented than licensing, also appear to be major innovation strategies in inter-sector convergence.
Meanwhile, licensing strategies only correlated with inter-field technological convergence performance. Thus, ICT firms may prefer licensing strategies to quickly and easily acquire technology while avoiding technological risk and market uncertainty, rather than other inter-field convergence strategies, in which technological heterogeneity is relatively small. Alternatively, the strategies focusing on commercialization, such as joint ventures and mergers and acquisitions, among others, did not significantly correlate with technological convergence performance.
These differences in the effect of the cooperative innovation strategy depending on convergence level revealed in this study make an implication that the government’s policy or the firm’s innovation strategy should be differentiated according to the purpose and scope of convergence. In other words, in the convergence between heterogeneous areas, cooperation efforts from the technology acquisition stage and systems for supporting them are needed, and it is important to activate licensing, which is a major strategy of technology utilization stage, in the convergence between homogeneous areas.
It is noteworthy that this study attempted to empirically measure this conceptual technological convergence phenomenon using patent data. Moreover, this study empirically analyzed cooperative innovation strategies’ impacts on technological convergence performance, as these strategies have been discussed both theoretically and qualitatively. However, this paper has some limitations, as the regression analysis does not reflect all ICT firms despite substantial patent data, but rather, 200 samples due to the survey’s difficulty. Further, significant zero data exist in the dependent and explanatory variables’ data. It is anticipated that more comprehensive results can be obtained if more data are supplemented and a more refined analysis model can be applied in the future.
Acknowledgments
This work was supported by Kyonggi University Research Grant 2016.
Author Contributions
Kyunam Kim, the first and corresponding author, contributed to the completion of the research through the entire process of the paper—the concept, design, data work, analysis, and writing.
Conflicts of Interest
The author declares no conflict of interest.
Appendix A

Table A1.
IPC-Technology Concordance Table published by World Intellectual Property Organization.
| Sector | Field | IPC | |
|---|---|---|---|
| 1 | Electrical engineering | Electrical machinery, apparatus, energy | F21H, F21K, F21L, F21S, F21V, F21W, F21Y, H01B, H01C, H01F, H01G, H01H, H01J, H01K, H01M, H01R, H01T, H02B, H02G, H02H, H02J, H02K, H02M, H02N, H02P, H05B, H05C, H05F, H99Z |
| 2 | Audio-visual technology | G09F, G09G, G11B, H04N 3, H04N 5, H04N 7, H04N 9, H04N 11, H04N 13, H04N 15, H04N 17, H04N 101, H04R, H04S, H05K | |
| 3 | Telecommunications | G08C, H01P, H01Q, H04B, H04H, H04J, H04K, H04M, H04N 1, H04Q | |
| 4 | Digital communication | H04L, H04N 21, H04W | |
| 5 | Basic communication processes | H03B, H03C, H03D, H03F, H03G, H03H, H03J, H03K, H03L, H03M | |
| 6 | Computer technology | G06C, G06D, G06E, G06F, G06G, G06J, G06K, G06M, G06N, G06T, G10L, G11C | |
| 7 | IT methods for management | G06Q | |
| 8 | Semiconductors | H01L | |
| 9 | Instruments | Optics | G02B, G02C, G02F, G03B, G03C, G03D, G03F, G03G, G03H, H01S |
| 10 | Measurement | G01B, G01C, G01D, G01F, G01G, G01H, G01J, G01K, G01L, G01M, G01N 1, G01N 3, G01N 5, G01N 7, G01N 9, G01N 11, G01N 13, G01N 15, G01N 17, G01N 19, G01N 21, G01N 22, G01N 23, G01N 24, G01N 25, G01N 27, G01N 29, G01N 30, G01N 31, G01N 35, G01N 37, G01P, G01Q, G01R, G01S, G01V, G01W, G04B, G04C, G04D, G04F, G04G, G12B, G99Z | |
| 11 | Analysis of biological materials | G01N 33 | |
| 12 | Control | G05B, G05D, G05F, G07B, G07C, G07D, G07F, G07G, G08B, G08G, G09B, G09C, G09D | |
| 13 | Medical technology | A61B, A61C, A61D, A61F, A61G, A61H, A61J, A61L, A61M, A61N, H05G | |
| 14 | Chemistry | Organic fine chemistry | A61K 8, A61Q, C07B, C07C, C07D, C07F, C07H, C07J, C40B |
| 15 | Biotechnology | C07G, C07K, C12M, C12N, C12P, C12Q, C12R, C12S | |
| 16 | Pharmaceuticals | A61K 6, A61K 9, A61K 31, A61K 33, A61K 35, A61K 36, A61K 38, A61K 39, A61K 41, A61K 45, A61K 47, A61K 48, A61K 49, A61K 50, A61K 51, A61K 101, A61K 103, A61K 125, A61K 127, A61K 129, A61K 131, A61K 133, A61K 135, A61P | |
| 17 | Macromolecular chemistry, polymers | C08B, C08C, C08F, C08G, C08H, C08K, C08L | |
| 18 | Food chemistry | A01H, A21D, A23B, A23C, A23D, A23F, A23G, A23J, A23K, A23L, C12C, C12F, C12G, C12H, C12J, C13B 10, C13B 20, C13B 30, C13B 35, C13B 40, C13B 50, C13B 99, C13D, C13F, C13J, C13K | |
| 19 | Basic materials chemistry | A01N, A01P, C05B, C05C, C05D, C05F, C05G, C06B, C06C, C06D, C06F, C09B, C09C, C09D, C09F, C09G, C09H, C09J, C09K, C10B, C10C, C10F, C10G, C10H, C10J, C10K, C10L, C10M, C10N, C11B, C11C, C11D, C99Z | |
| 20 | Materials, metallurgy | B22C, B22D, B22F, C01B, C01C, C01D, C01F, C01G, C03C, C04B, C21B, C21C, C21D, C22B, C22C, C22F | |
| 21 | Surface technology, coating | B05C, B05D, B32B, C23C, C23D, C23F, C23G, C25B, C25C, C25D, C25F, C30B | |
| 22 | Micro-structural and nano-technology | B81B, B81C, B82B, B82Y | |
| 23 | Chemical engineering | B01B, B01D 1, B01D 3, B01D 5, B01D 7, B01D 8, B01D 9, B01D 11, B01D 12, B01D 15, B01D 17, B01D 19, B01D 21, B01D 24, B01D 25, B01D 27, B01D 29, B01D 33, B01D 35, B01D 36, B01D 37, B01D 39, B01D 41, B01D 43, B01D 57, B01D 59, B01D 61, B01D 63, B01D 65, B01D 67, B01D 69, B01D 71, B01F, B01J, B01L, B02C, B03B, B03C, B03D, B04B, B04C, B05B, B06B, B07B, B07C, B08B, C14C, D06B, D06C, D06L, F25J, F26B, H05H | |
| 24 | Environmental technology | A62C, B01D 45, B01D 46, B01D 47, B01D 49, B01D 50, B01D 51, B01D 52, B01D 53, B09B, B09C, B65F, C02F, E01F 8, F01N, F23G, F23J, G01T | |
| 25 | Mechanical engineering | Handling | B25J, B65B, B65C, B65D, B65G, B65H, B66B, B66C, B66D, B66F, B67B, B67C, B67D |
| 26 | Machine tools | A62D, B21B, B21C, B21D, B21F, B21G, B21H, B21J, B21K, B21L, B23B, B23C, B23D, B23F, B23G, B23H, B23K, B23P, B23Q, B24B, B24C, B24D, B25B, B25C, B25D, B25F, B25G, B25H, B26B, B26D, B26F, B27B, B27C, B27D, B27F, B27G, B27H, B27J, B27K, B27L, B27M, B27N, B30B | |
| 27 | Engines, pumps, turbines | F01B, F01C, F01D, F01K, F01L, F01M, F01P, F02B, F02C, F02D, F02F, F02G, F02K, F02M, F02N, F02P, F03B, F03C, F03D, F03G, F03H, F04B, F04C, F04D, F04F, F23R, F99Z, G21B, G21C, G21D, G21F, G21G, G21H, G21J, G21K | |
| 28 | Textile and paper machines | A41H, A43D, A46D, B31B, B31C, B31D, B31F, B41B, B41C, B41D, B41F, B41G, B41J, B41K, B41L, B41M, B41N, C14B, D01B, D01C, D01D, D01F, D01G, D01H, D02G, D02H, D02J, D03C, D03D, D03J, D04B, D04C, D04G, D04H, D05B, D05C, D06G, D06H, D06J, D06M, D06P, D06Q, D21B, D21C, D21D, D21F, D21G, D21H, D21J, D99Z | |
| 29 | Other special machines | A01B, A01C, A01D, A01F, A01G, A01J, A01K, A01L, A01M, A21B, A21C, A22B, A22C, A23N, A23P, B02B, B28B, B28C, B28D, B29B, B29C, B29D, B29K, B29L, B99Z, C03B, C08J, C12L, C13B 5, C13B 15, C13B 25, C13B 45, C13C, C13G, C13H, F41A, F41B, F41C, F41F, F41G, F41H, F41J, F42B, F42C, F42D | |
| 30 | Thermal processes and apparatus | F22B, F22D, F22G, F23B, F23C, F23D, F23H, F23K, F23L, F23M, F23N, F23Q, F24B, F24C, F24D, F24F, F24H, F24J, F25B, F25C, F27B, F27D, F28B, F28C, F28D, F28F, F28G | |
| 31 | Mechanical elements | F15B, F15C, F15D, F16B, F16C, F16D, F16F, F16G, F16H, F16J, F16K, F16L, F16M, F16N, F16P, F16S, F16T, F17B, F17C, F17D, G05G | |
| 32 | Transport | B60B, B60C, B60D, B60F, B60G, B60H, B60J, B60K, B60L, B60M, B60N, B60P, B60Q, B60R, B60S, B60T, B60V, B60W, B61B, B61C, B61D, B61F, B61G, B61H, B61J, B61K, B61L, B62B, B62C, B62D, B62H, B62J, B62K, B62L, B62M, B63B, B63C, B63G, B63H, B63J, B64B, B64C, B64D, B64F, B64G | |
| 33 | Other fields | Furniture, games | A47B, A47C, A47D, A47F, A47G, A47H, A47J, A47K, A47L, A63B, A63C, A63D, A63F, A63G, A63H, A63J, A63K |
| 34 | Other consumer goods | A24B, A24C, A24D, A24F, A41B, A41C, A41D, A41F, A41G, A42B, A42C, A43B, A43C, A44B, A44C, A45B, A45C, A45D, A45F, A46B, A62B, A99Z, B42B, B42C, B42D, B42F, B43K, B43L, B43M, B44B, B44C, B44D, B44F, B68B, B68C, B68F, B68G, D04D, D06F, D06N, D07B, F25D, G10B, G10C, G10D, G10F, G10G, G10H, G10K | |
| 35 | Civil engineering | E01B, E01C, E01D, E01F 1, E01F 3, E01F 5, E01F 7, E01F 9, E01F 11, E01F 13, E01F 15, E01H, E02B, E02C, E02D, E02F, E03B, E03C, E03D, E03F, E04B, E04C, E04D, E04F, E04G, E04H, E05B, E05C, E05D, E05F, E05G, E06B, E06C, E21B, E21C, E21D, E21F, E99Z |
Source: WIPO(2008) [60].
Appendix B
Table A2.
Analysis result excluding observations of 2015.
| Model | Poisson Model | N.B Model | |||||
|---|---|---|---|---|---|---|---|
| Dependent Variable | Technological Convergence | Inter-Sector Technological Convergence | Inter-Field Technological Convergence | Technological Convergence | Inter-Sector Technological Convergence | Inter-Field Technological Convergence | |
| Explanatory Variables | Licensing | 0.166 *** | 0.162 *** | 0.167 *** | 0.203 *** | 0.183 ** | 0.211 ** |
| (0.000) | (0.000) | (0.001) | (0.003) | (0.025) | (0.034) | ||
| External research contracts | 0.020 | 0.036 | 0.006 | 0.010 | 0.046 | −0.031 | |
| (0.424) | (0.248) | (0.865) | (0.853) | (0.471) | (0.638) | ||
| Joint research | 0.108 | 0.220* | 0.048 | 0.125 | 0.235 | 0.032 | |
| (0.306) | (0.066) | (0.767) | (0.466) | (0.233) | (0.900) | ||
| Joint ventures | −13.900 | −13.711 | −10.630 | −19.684 | −18.499 | −13.548 | |
| (0.991) | (0.992) | (0.977) | (0.999) | (0.999) | (0.993) | ||
| Mergers and acquisitions | 0.062 | −0.048 | 0.097 | 0.276 | 0.196 | 0.239 | |
| (0.763) | (0.871) | (0.729) | (0.390) | (0.639) | (0.587) | ||
| Others | 0.018 | −0.033 | −0.004 | 0.009 | −0.063 | 0.019 | |
| (0.936) | (0.919) | (0.989) | (0.980) | (0.885) | (0.969) | ||
| Control Variables | Total capital | 3.85 × 10⁻⁸ *** | 4.29 × 10⁻⁸ *** | 3.14 × 10⁻⁸ *** | 3.79 × 10⁻⁸ *** | 3.93 × 10⁻⁸ *** | 3.71 × 10⁻⁸ *** |
| (0.000) | (0.000) | (0.000) | (0.000) | (0.000) | (0.000) | ||
| Total laborers | −0.002 *** | −0.003 *** | −0.001 | −0.001 | −0.003 | −0.000 | |
| (0.009) | (0.003) | (0.450) | (0.344) | (0.110) | (0.806) | ||
| Year Dummy | 2012 | −0.240 ** | −0.293 * | −0.177 | −0.147 | −0.174 | −0.128 |
| (0.030) | (0.053) | (0.238) | (0.393) | (0.421) | (0.587) | ||
| 2013 | −0.398 *** | −0.381 ** | −0.471 *** | −0.306 * | −0.237 | −0.463 * | |
| (0.001) | (0.014) | (0.004) | (0.082) | (0.278) | (0.062) | ||
| 2014 | −0.390 *** | −0.166 | −0.626 *** | −0.297 * | −0.021 | −0.580 ** | |
| (0.001) | (0.257) | (0.000) | (0.093) | (0.921) | (0.022) | ||
| Constant | −0.296 *** | −0.883 *** | −0.927 *** | −0.417 *** | −0.997 *** | −1.027 *** | |
| (0.000) | (0.000) | (0.000) | (0.002) | (0.000) | (0.000) | ||
| Observation | 754 | 754 | 754 | 754 | 754 | 754 | |
| LR ratio | 215.09 | 140.73 | 88.93 | 74.73 | 53.02 | 38.14 | |
Note: (1) The numbers in parentheses are p-values. (2) *, **, and *** indicate significance at the 10%, 5%, and 1% levels, respectively.
Appendix C. Questionnaire for Survey
Part A. Innovation Activity and Strategy
A1.
Please check V in your R&D stage or goal. (Duplicate selectable).
| ① Based technology research | ② Applied technology research | ③ Development of new technology | ④ Improvement of existing technology | |
|---|---|---|---|---|
| R&D stage |
A2.
Please address your business results and patent achievements for the past five years (2011–2015).
A2.
Please address your business results and patent achievements for the past five years (2011–2015).
| Year | 2011 | 2012 | 2013 | 2014 | 2015 | |
|---|---|---|---|---|---|---|
| Domestic patent applications | ||||||
| Overseas patent applications | ||||||
| Patents owned | Number of cumulative patents | |||||
| Adjacency between fields of patent | ① Very high ② High ③ Modest ④ Low ⑤ Very low | |||||
| Sales | ||||||
| Exports | ||||||
A3.
Please check V if you have the following experience of self-execution. (Duplicate selectable).
| ① Research | ② Pilot test | ③ Development products (Certification/Standardization) | ④ Production and commercialization | ⑤ Distribution and marketing | |
|---|---|---|---|---|---|
| Firm experience |
A4.
What is the main purpose of your innovation activity in the past 5 years (2011–2015)?
| Main purpose of innovation | Whether to perform (Y/N) | Low<-----------Importance----------->High | |||||
|---|---|---|---|---|---|---|---|
| (1) Substitute existing products/diversify products | Y | N | ① | ② | ③ | ④ | ⑤ |
| (2) Expansion and maintenance of market share | Y | N | ① | ② | ③ | ④ | ⑤ |
| (3) Pioneering new markets | Y | N | ① | ② | ③ | ④ | ⑤ |
| (4) Quick response to consumer needs | Y | N | ① | ② | ③ | ④ | ⑤ |
| (5) Improving production efficiency | Y | N | ① | ② | ③ | ④ | ⑤ |
| (6) Expanding production capacity | Y | N | ① | ② | ③ | ④ | ⑤ |
| (7) Improving work environment/safety | Y | N | ① | ② | ③ | ④ | ⑤ |
| (8) Response domestic and overseas regulations | Y | N | ① | ② | ③ | ④ | ⑤ |
A5.
Have you implemented any of the following cooperative strategy for your innovation activities over the past five years? If so, how many have you done on each of the following?
A5.
Have you implemented any of the following cooperative strategy for your innovation activities over the past five years? If so, how many have you done on each of the following?
| Cooperative innovation strategy | 2011 | 2012 | 2013 | 2014 | 2015 |
|---|---|---|---|---|---|
| (1) Licensing | |||||
| (2) External research contracts | |||||
| (3) Joint research | |||||
| (4) Joint venture | |||||
| (5) Mergers and acquisitions | |||||
| (6) others |
References
- Chesbrough, H.W. The Era of Open Innovation. MIT Sloan Manag. Rev. 2003, 44, 35–41. [Google Scholar]
- Chesbrough, H.W. Open Innovation; Harvard University Press: Boston, MA, USA, 2003. [Google Scholar]
- Von Hippel, E.; von Krogh, G. Free revealing and the private-collective model for innovation incentives. R&D Manag. 2006, 36, 295–306. [Google Scholar]
- Sánchez, A.M.; Pérez, M.P. Cooperation and the ability to minimize the time and cost of new product development within the Spanish automotive supplier industry. J. Prod. Innov. Manag. 2003, 20, 57–69. [Google Scholar] [CrossRef]
- Belderbos, R.M.; Carree, B.; Lokshin, H. Cooperative R&D and firm performance. Res. Policy 2004, 33, 1477–1492. [Google Scholar]
- Faems, D.; Van Looy, B.; Debackere, K. Inter-organizational collaboration and innovation: Toward a portfolio approach. J. Prod. Innov. Manag. 2005, 22, 238–250. [Google Scholar] [CrossRef]
- Chesbrough, H.W.; Crowther, A.K. Beyond high-tech: Early adopters of Open Innovation in other industries. R&D Manag. 2006, 36, 229–236. [Google Scholar]
- Laursen, K.; Salter, A. Open for innovation: The role of open innovativeness in explaining innovation performance among U.K. manufacturing firms. Strateg. Manag. J. 2006, 27, 131–150. [Google Scholar] [CrossRef]
- Nieto, M.J.; Santamaría, L. The importance of diverse collaborative networks for the novelty of product innovation. Technovation 2007, 27, 367–377. [Google Scholar] [CrossRef]
- Arranz, N.; Arroyabe, J.C.F. The choice of partners in R&D cooperation: An empirical analysis of Spanish firms. Technovation 2008, 28, 88–110. [Google Scholar]
- Lichtenthaler, U. Integrated roadmaps for open innovation. Res. Technol. Manag. 2008, 51, 45–49. [Google Scholar]
- Stanko, M.; Calantone, R. Controversy in Innovation Outsourcing Research: Review, Synthesis and Future Direction. R&D Manag. 2011, 41, 8–20. [Google Scholar]
- Kim, S.H.; Kim, J.H. An Exploratory Study on the Performance of Open Product Innovation: Product Innovation Strategy, Source and Partner Contribution Perspectives. Korean J. Bus. Adm. 2011, 24, 685–703. [Google Scholar]
- Back, C.W.; Noh, M.S. The effect of firm’s R&D investment strategies on managerial performance. Innov. Stud. 2014, 9, 29–48. [Google Scholar]
- Curran, C.S.; Leker, J. Patent indicators for monitoring convergence—Examples from NFF and ICT. Technol. Forecast. Soc. Chang. 2011, 78, 256–273. [Google Scholar] [CrossRef]
- Geum, Y.; Kim, C.; Lee, S.; Kim, M. Technological Convergence of IT and BT: Evidence from Patent Analysis. ETRI J. 2012, 34, 439–449. [Google Scholar] [CrossRef]
- Choi, J.Y.; Jeong, S.K.; Kim, K.N. A study on Diffusion Pattern of Technology Convergence: Patent Analysis for Korea. Sustainability 2015, 7, 11546–11569. [Google Scholar] [CrossRef]
- Venkatraman, N.; Ramanujam, V. Measurement of Business Performance in Strategy Research: A Comparison of Approaches. Acad. Manag. Rev. 1986, 11, 801–814. [Google Scholar]
- Lussier, R.N. Non-financial Business Success versus Failure Prediction Model. J. Small Bus. Manag. 1995, 33, 8–20. [Google Scholar]
- Wright, M.; Robbie, K. Venture capital and private equity: A review and synthesis. J. Bus. Financ. Account. 1998, 25, 521–570. [Google Scholar] [CrossRef]
- Alemany, L.; Martí, J. Productivity growth in Spanish venture-backed firms. In Venture Capital in Europe; Gregoriou, G.N., Kooli, M., Kraeussl, R., Eds.; Elsevier: Amsterdam, The Netherlands, 2006; pp. 100–114. [Google Scholar]
- Chemmanur, T.J.; Krishnan, K.; Nandy, D. How does venture capital financing improve efficiency in private firms? A look beneath the surface. Rev. Financ. Stud. 2011, 24, 4037–4090. [Google Scholar] [CrossRef]
- Croce, A.; Martí, J.; Murtinu, S. The impact of venture capital on the productivity growth of European entrepreneurial firms: ‘Screening’ or ‘value added’ effect? J. Bus. Ventur. 2013, 28, 489–510. [Google Scholar] [CrossRef]
- Heil, M. Finance and Productivity: A Literature Review; OECD Economics Department Working Papers No. 1374; OECD Publishing: Paris, France, 2017. [Google Scholar] [CrossRef]
- Yoffie, D.B. Competing in the age of digital convergence. Calif. Manag. Rev. 1996, 4, 31–53. [Google Scholar] [CrossRef]
- Wolbring, G. Why NBIC? Why human performance enhancement? Eur. J. Soc. Sci. Res. 2008, 21, 25–40. [Google Scholar] [CrossRef]
- Jeong, S.; Kim, J.C.; Choi, J.Y. Technology convergence: What developmental stage are we in? Scientometrics 2015, 104, 841–871. [Google Scholar] [CrossRef]
- Keupp, M.M.; Gassmann, O. Determinants and archetype users of open innovation. R&D Manag. 2009, 39, 331–341. [Google Scholar]
- Hacklin, F. Management of Convergence in Innovation: Strategies and Capabilities for Value Creation beyond Blurring Industry Boundaries: Contributions to Management Science; Springer: Berlin, Germany, 2008. [Google Scholar]
- Athreye, S.; Keeble, D. Technology convergence, globalisation and ownership in the UK computer industry. Technovation 2000, 20, 227–245. [Google Scholar] [CrossRef]
- Roco, M.C.; Bainbridge, W.S. Converging Technologies for Improving Human Performance; National Science Foundation: Arlington, VA, USA. Available online: http://www.nsf.gov/crssprgm/nano/activities/ct05_flyer_rev54.pdf (accessed on 26 July 2017).
- Lee, H.; Kim, P.R.; Zo, H. Impact of cooperative R&D projects on ICT-based technology convergence. ETRI J. 2017. [Google Scholar] [CrossRef]
- Basole, R.C.; Rouse, W.B. Complexity of service value networks: Conceptualization and empirical investigation. IBM Syst. J. 2008, 47, 53–70. [Google Scholar] [CrossRef]
- Basole, R.C.; Park, H.; Barnett, B.C. Coopetition and convergence in the ICT ecosystem. Telecommun. Policy 2015, 39, 537–552. [Google Scholar] [CrossRef]
- OECD StatExtracts. Patent by Technology. 2014. Available online: http://stats.oecd.org/index.aspx (accessed on 26 July 2017).
- Choi, J.Y.; Moon, H.S.; Jo, Y.A.; Jeong, S.K. An Analysis on the Trends and Determinants of Technology Convergence of Korea; Research paper 2014-709; Korea Institute for Industrial Economics & Trade: Seoul, Korea, 2014. [Google Scholar]
- Gambardella, A.; Giuri, P.; Luzzi, A. The market for patents in Europe. Res. Policy 2007, 36, 1163–1183. [Google Scholar] [CrossRef]
- Karvonen, M.; Kassi, T. Patent citations as a tool for analysing the early stages of convergence. Technol. Forecast. Soc. Chang. 2013, 80, 1094–1107. [Google Scholar] [CrossRef]
- Rosenfeld, S.A. Does cooperation enhance competitiveness? Assessing the impacts of inter-firm collaboration. Res. Policy 1996, 25, 247–263. [Google Scholar] [CrossRef]
- Okamuro, H. The Effects of Inter-Firm Cooperation: A Comparative Analysis of Small and Large Firms Using Micro Data; COE/RES Discussion Paper No. 66; Hitotsubashi University: Tokyo, Japan, 2004. [Google Scholar]
- Okamuro, H. Cooperative R&D by SMEs and Intellectual Property. Proc. Jpn. Acad. Small Bus. Stud. 2005, 24, 3–16. [Google Scholar]
- Schartinger, D.; Rammer, C.; Fischer, M.M.; Fröhlich, J. Knowledge interactions between universities and industry in Austria: Sectoral patterns and determinants. Res. Policy 2002, 31, 303–328. [Google Scholar] [CrossRef]
- Tether, B. Who co-operates for innovation, and why: An empirical analysis. Res. Policy 2002, 31, 947–967. [Google Scholar] [CrossRef]
- Santoro, M.D.; Chakrabarti, A.K. Firm Size and Technology Centrality in Industry-University Interactions. Res. Policy 2002, 31, 1163–1180. [Google Scholar] [CrossRef]
- Rosenberg, N. Learning by using. In Inside the Black Box: Technology and Economics; Cambridge University Press: Cambridge, UK, 1982; pp. 120–140. [Google Scholar]
- Lilien, G.L.; Morrison, P.D.; Searls, K.; Sonnack, M.; von Hippel, E. Performance assessment of the lead user idea-generation process for new product development. Manag. Sci. 2002, 48, 1042–1059. [Google Scholar] [CrossRef]
- Robertson, P.L.; Patel, P.R. New wine in old bottles: Technological diffusion in developed economies. Res. Policy 2007, 36, 708–721. [Google Scholar] [CrossRef]
- Gassmann, O.; Enkel, E. Towards a theory of open innovation: Three core process archetypes. In Proceedings of the R&D Management Conference, Lisbon, Portugal, 6–9 July 2004. [Google Scholar]
- Lichtenthaler, U.; Ernst, H. External technology commercialization in large firms: Results of a quantitative benchmarking study. R&D Manag. 2007, 37, 383–397. [Google Scholar]
- Vanhaverbecke, W.; Van de Vrade, V.; Chesbrough, H.W. Understanding the advantages of open innovation practices in corporate venturing in terms of real options. Creat. Innov. Manag. 2008, 17, 251–258. [Google Scholar] [CrossRef]
- Chesbrough, H.W. Why companies should have open business models. MIT Sloan Manag. Rev. 2007, 48, 22–28. [Google Scholar]
- Enkel, E.; Gassmann, O.; Chesbrough, H.W. Open R&D and open innovation: Exploring the phenomenon. R&D Manag. 2009, 39, 311–316. [Google Scholar]
- Tsai, K.H.; Wang, J.C. External technology sourcing and innovation performance in LMT sectors: An analysis based on the Taiwanese Technological Innovation Survey. Res. Policy 2009, 38, 518–526. [Google Scholar] [CrossRef]
- Becker, W.; Dietz, J. R&D cooperation and innovation activities of firms-evidence for the German manufacturing industry. Res. Policy 2004, 33, 209–223. [Google Scholar]
- Eisenhardt, K.M.; Tabrizi, B.N. Accelerating adaptive process: Product innovation in the global computer industry. Adm. Sci. Q. 1995, 40, 84–110. [Google Scholar] [CrossRef]
- Witzeman, S.; Slowinski, G.; Dirkx, R.; Gollob, L.; Tao, J.; Ward, S.; Miraglia, S. Harnessing external technology for innovation. Res. Technol. Manag. 2006, 49, 19–27. [Google Scholar]
- Caloghirou, Y.; Kastelli, I.; Tsakanikas, A. Internal capability and external knowledge sources: Compliments or substitutes for innovative performance? Technovation 2004, 24, 29–39. [Google Scholar] [CrossRef]
- Megantz, R.C. How to License Technology; John Wiley & Sons: New York, NY, USA, 1996. [Google Scholar]
- Megantz, R.C. Technology Management, Developing and Implementing Effective Licensing Programs; John Wiley & Sons: New York, NY, USA, 2002. [Google Scholar]
- World Intellectual Property Organisation (WIPO). Concept of a Technology Classification for Country Comparisons; WIPO: Karlsruhe, Germany, 2008. [Google Scholar]
- Pakes, A.; Griliches, Z. Patents and R&D at the firm level: A first report. Econ. Lett. 1980, 5, 377–381. [Google Scholar]
- Hall, B.H.; Griliches, Z.; Hausman, J.A. Patents and R&D: Is there a lag? Int. Econ. Rev. 1986, 27, 265–284. [Google Scholar]
- World Intellectual Property Organization (WIPO). World Intellectual Property Indicators; WIPO Economics & Statistics Series (WIPO Publication No. 941E); World Intellectual Property Organization (WIPO): Geneva, Switzerland, 2011. [Google Scholar]
- Cameron, A.C.; Trivedi, P.K. Microeconometrics Using Stata, Revised Edition; Stata Press: College Station, TX, USA, 2010. [Google Scholar]
- Osgood, D.W. Poisson-based regression analysis of aggregate crime rates. J. Quant. Criminol. 2000, 16, 21–43. [Google Scholar] [CrossRef]
- Tuttlebee, W.H.W. Cordless Telecommunications Worldwide; Springer: Berlin, Germany, 1996; ISBN 978-3-540-19970-0. [Google Scholar]
- OECD StatExtracts. Gross Domestic Expenditure on R-D by Sector of Performance and Source of Funds. 2017. Available online: http://stats.oecd.org/ (accessed on 26 July 2017).
Figure 1.
Identification of technological convergence using patent data.
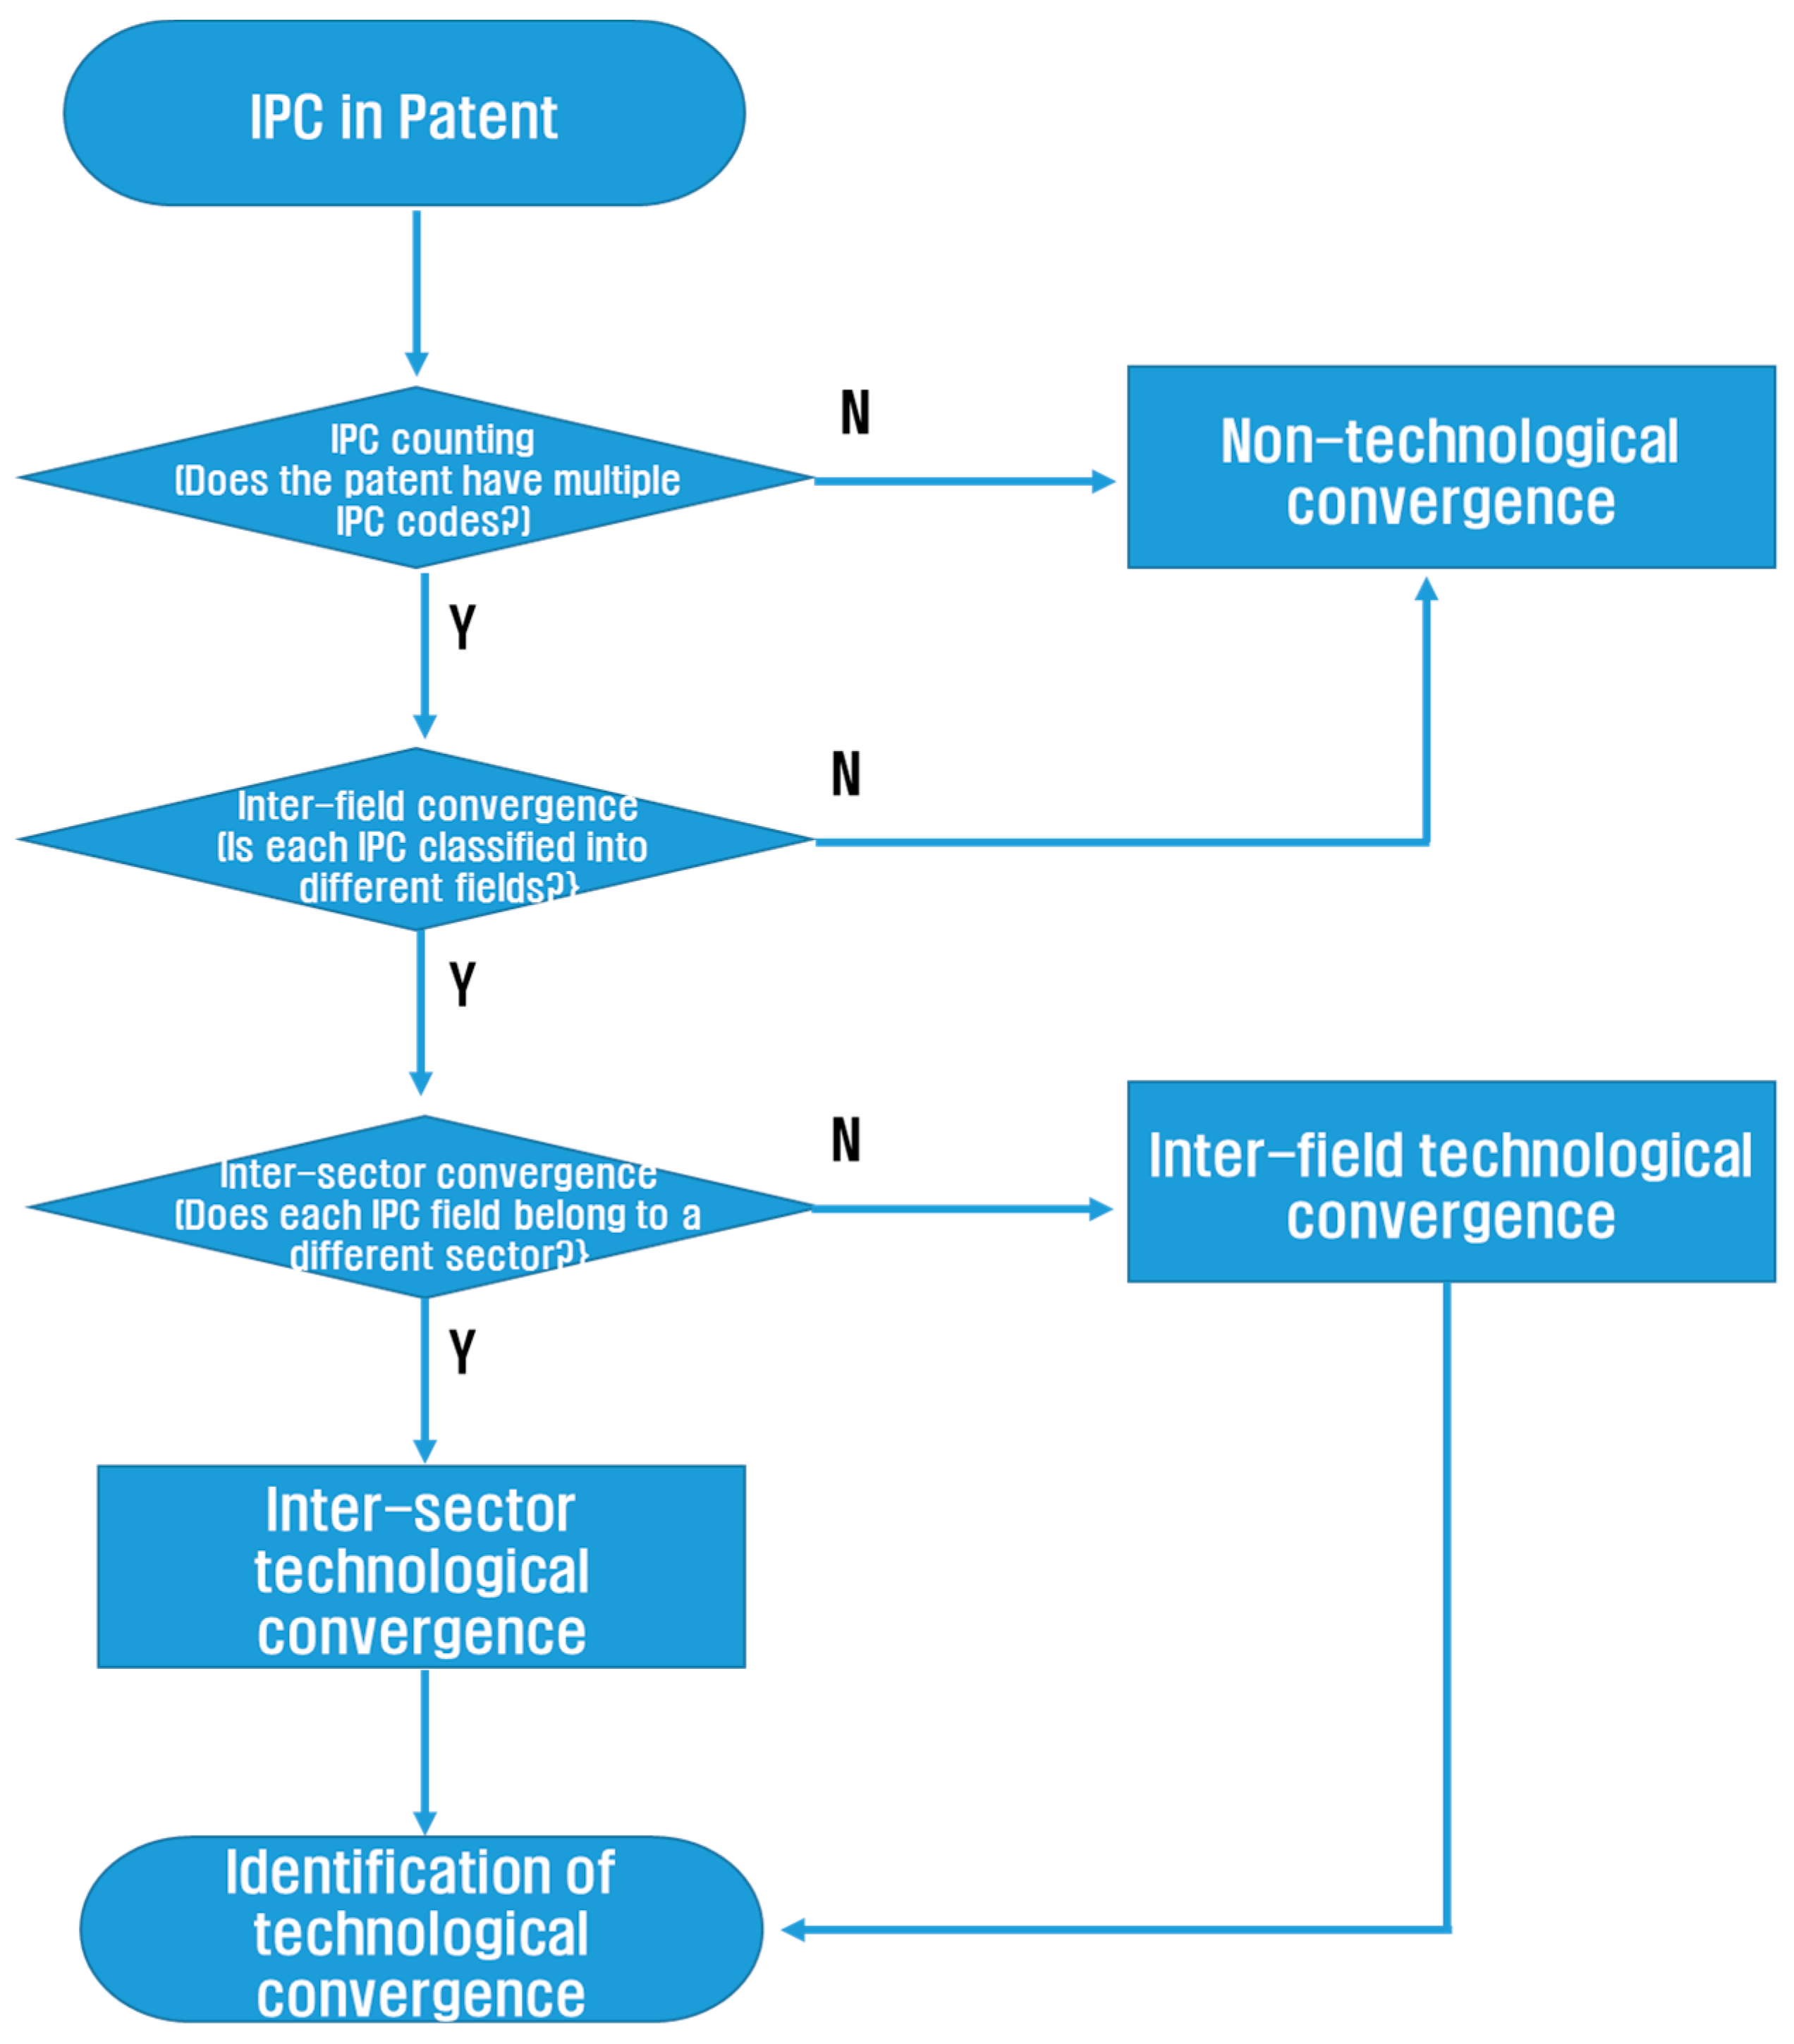
Figure 2.
Integrated database.
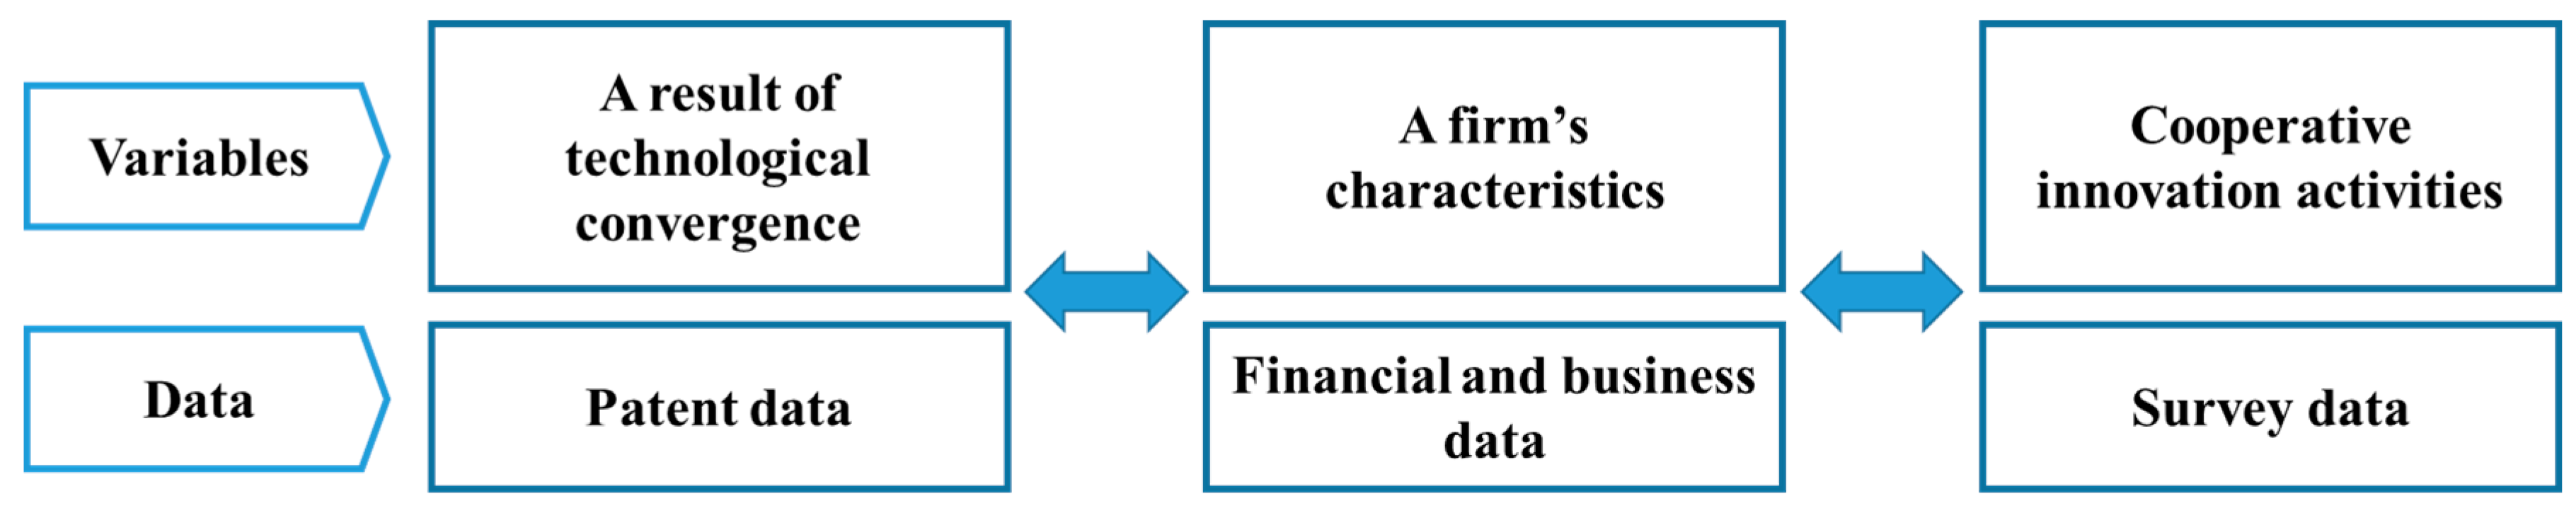
Figure 3.
Technological convergence trends in the Korean ICT industry.

Figure 4.
Technological convergence trends by scope in the Korean ICT industry.
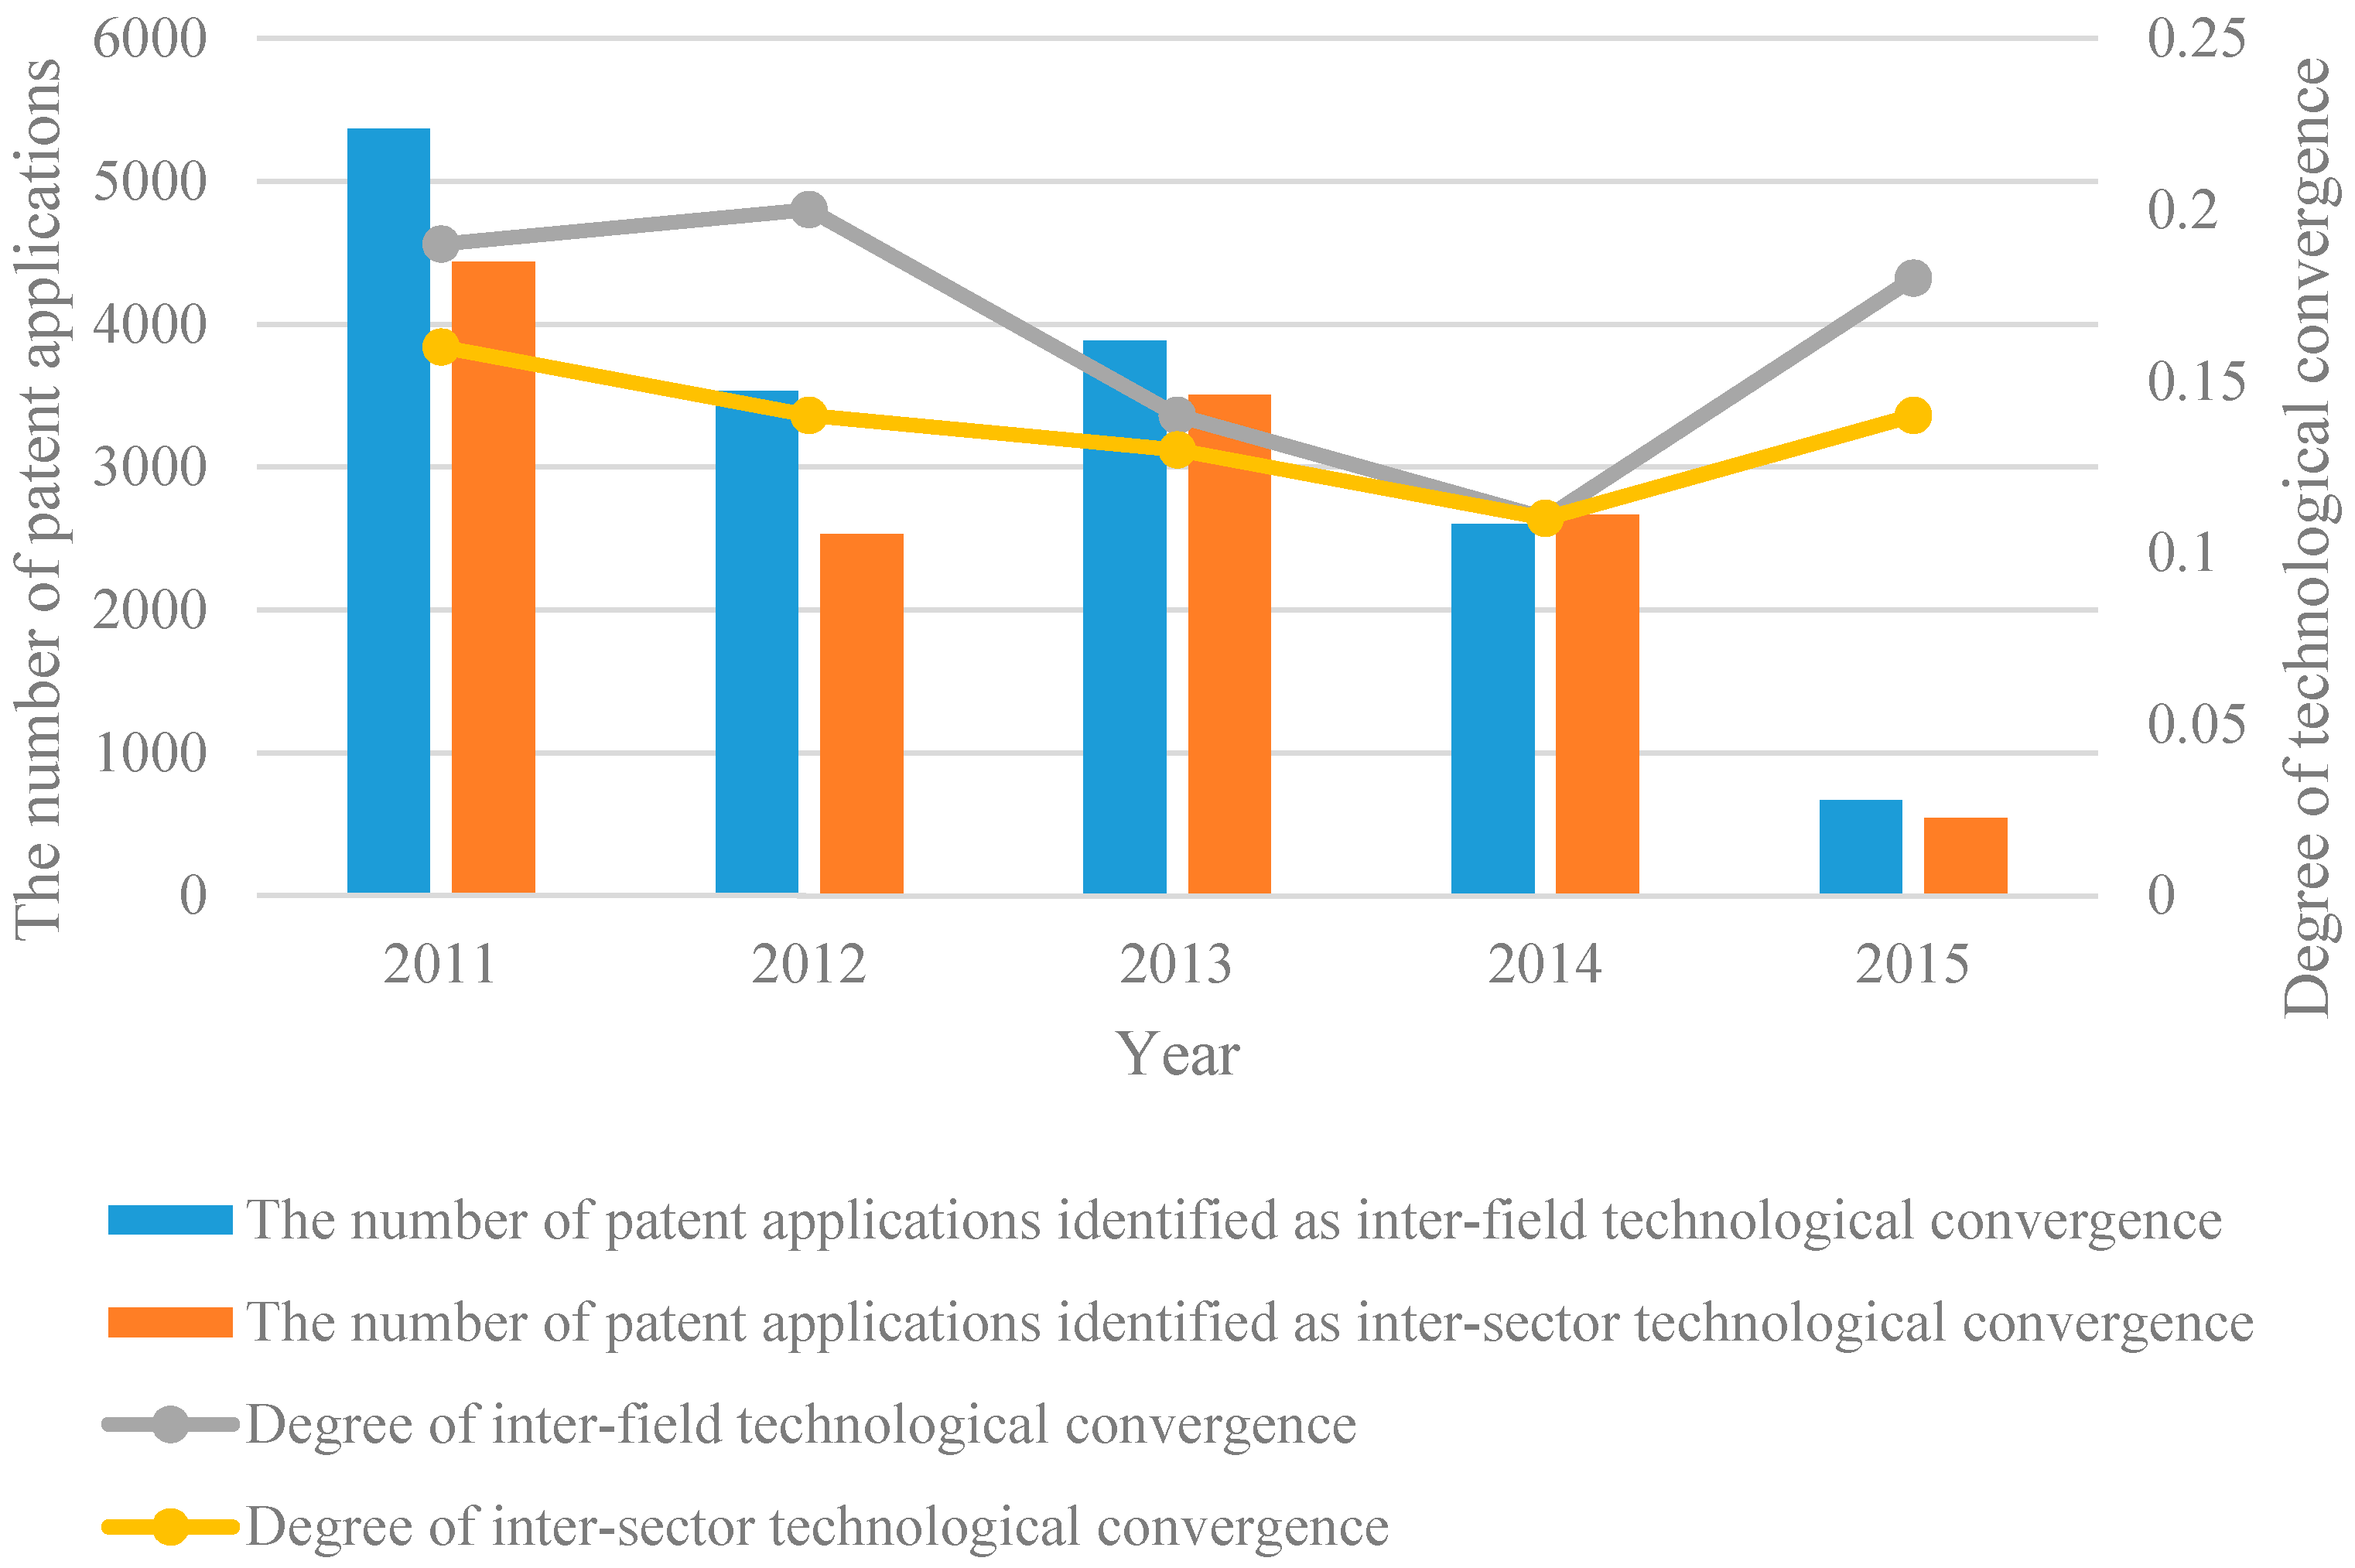
Table 1.
Descriptions of variables.
| Variables | Description | |
|---|---|---|
| Dependent Variables | Technological convergence | The number of patent applications identified as exhibiting technological convergence |
| Inter-sector technological convergence | The number of patent applications identified as exhibiting inter-sector technological convergence | |
| Inter-field technological convergence | The number of patent applications identified as exhibiting inter-field technological convergence | |
| Explanatory Variables | Licensing | The number of technology transfers by licensing |
| External research contracts | The number of outsourced external research contracts | |
| Joint research | The number of joint research projects conducted with external research institutes | |
| Joint ventures | The amount of technical commercialization after joint venture enterprise establishment | |
| Mergers and acquisitions | The number of innovative firm acquisitions to introduce promising technologies | |
| Others | The quantity of other external cooperation | |
| Control Variables | Total capital | Total firm capital noted in financial statements |
| Total laborers | The number of employees noted in financial statements | |
| Time effect | Year dummy during 2011–2015 |
Table 2.
Basic statistics of variables.
| Variables | Observations | Mean | Standard Deviation | Min. | Max. |
|---|---|---|---|---|---|
| Technological convergence | 1000 | 0.67 | 1.44 | 0 | 12 |
| Inter-sector technological convergence | 1000 | 0.39 | 1.03 | 0 | 11 |
| Inter-field technological convergence | 1000 | 0.33 | 0.98 | 0 | 12 |
| Licensing | 1000 | 0.19 | 0.87 | 0 | 10 |
| External research contracts | 1000 | 0.19 | 0.87 | 0 | 15 |
| Joint research | 1000 | 0.1 | 0.41 | 0 | 5 |
| Joint ventures | 1000 | 0.003 | 0.05 | 0 | 1 |
| Mergers and acquisitions | 1000 | 0.01 | 0.14 | 0 | 2 |
| Others | 1000 | 0.02 | 0.21 | 0 | 3 |
| Total capital | 954 | 1.4 × 10⁷ | 2.41 × 10⁷ | 8973 | 3.31 × 10⁸ |
| Total laborers | 970 | 50.76 | 65.48 | 0 | 375 |
Table 3.
Technological convergence identification results.
| Year | 2011 | 2012 | 2013 | 2014 | 2015 |
|---|---|---|---|---|---|
| Number of patent applications identified as technologically convergent | 9211 | 5645 | 6885 | 4897 | 1084 |
| Total patent applications | 27,958 | 17,651 | 27,477 | 23,801 | 3782 |
| Degree of technological convergence | 0.33 | 0.32 | 0.25 | 0.21 | 0.29 |
Table 4.
Result of identifying technological convergence by its scope.
| Year | 2011 | 2012 | 2013 | 2014 | 2015 | |
|---|---|---|---|---|---|---|
| Inter-sector technological convergence | Number of patent applications | 4435 | 2530 | 3505 | 2669 | 543 |
| Degree of technological convergence | 0.16 | 0.14 | 0.13 | 0.11 | 0.14 | |
| Inter-field technological convergence | Number of patent applications | 5367 | 3531 | 3886 | 2603 | 668 |
| Degree of technological convergence | 0.19 | 0.20 | 0.14 | 0.11 | 0.17 | |
Table 5.
Analysis results of the correlations between cooperative innovation strategies and technological convergence.
Table 5.
Analysis results of the correlations between cooperative innovation strategies and technological convergence.
| Model | Poisson Model | N.B. Model | |||
|---|---|---|---|---|---|
| Dependent Variable | Technological Convergence | Technological Convergence | |||
| Time Lags of Explanatory Variables | T | T-1 | T | T-1 | |
| Explanatory Variables | Licensing | 0.158 *** | 0.145 *** | 0.173 *** | 0.162 ** |
| (0.000) | (0.000) | (0.005) | (0.038) | ||
| External research contracts | 0.037 | −0.027 | 0.006 | −0.063 | |
| (0.119) | (0.485) | (0.913) | (0.317) | ||
| Joint research | 0.145 | 0.210 * | 0.205 | 0.298 | |
| (0.129) | (0.095) | (0.178) | (0.123) | ||
| Joint ventures | −11.855 | −11.779 | −15.857 | −15.922 | |
| (0.978) | (0.989) | (0.996) | (0.998) | ||
| Mergers and acquisitions | 0.067 | −0.086 | 0.280 | 0.129 | |
| (0.739) | (0.730) | (0.398) | (0.718) | ||
| Others | −0.096 | −0.264 | −0.092 | −0.199 | |
| (0.672) | (0.442) | (0.779) | (0.647) | ||
| Control Variables | Total capital | 1.43 × 10⁻⁸ *** | 1.28 × 10⁻⁸ *** | 3.31 × 10⁻⁸ *** | 3.34 × 10⁻⁸ *** |
| (0.000) | (0.000) | (0.000) | (0.000) | ||
| Total laborers | 0.002 *** | 0.001 ** | −0.001 | −0.001 | |
| (0.001) | (0.025) | (0.664) | (0.471) | ||
| Year Dummy | 2012 | −0.224 ** | −0.147 | ||
| (0.044) | (0.406) | ||||
| 2013 | −0.363 *** | −0.089 | −0.303 * | −0.139 | |
| (0.002) | (0.460) | (0.093) | (0.447) | ||
| 2014 | −0.365 *** | −0.148 | −0.296 | −0.156 | |
| (0.002) | (0.225) | (0.102) | (0.393) | ||
| 2015 | −1.897 *** | −1.540 *** | −1.702 *** | −1.540 *** | |
| (0.000) | (0.000) | (0.000) | (0.000) | ||
| Constant | −0.300 *** | −0.466 *** | −0.418 *** | −0.521 *** | |
| (0.000) | (0.000) | (0.002) | (0.000) | ||
| Observation | 924 | 731 | 924 | 731 | |
| LR ratio | 249.59 | 149.78 | 117.35 | 85.99 | |
Note: (1) The numbers in parentheses are p-values. (2) *, **, and *** indicate significance at the 10%, 5%, and 1% levels, respectively.
Table 6.
Analysis results of the correlations between cooperative innovation strategies and inter-sector technological convergence.
Table 6.
Analysis results of the correlations between cooperative innovation strategies and inter-sector technological convergence.
| Model | Poisson Model | N.B. Model | |||
|---|---|---|---|---|---|
| Dependent Variable | Inter-Sector Technological Convergence | Inter-Sector Technological Convergence | |||
| Time Lags of Explanatory Variables | T | T-1 | T | T-1 | |
| Explanatory Variables | Licensing | 0.163 *** | 0.162 *** | 0.175 ** | 0.183 * |
| (0.000) | (0.001) | (0.020) | (0.056) | ||
| External research contracts | 0.052 * | 0.006 | 0.033 | −0.028 | |
| (0.090) | (0.891) | (0.596) | (0.721) | ||
| Joint research | 0.274 * | 0.364 *** | 0.342 * | 0.450 * | |
| (0.010) | (0.009) | (0.053) | (0.056) | ||
| Joint ventures | −15.598 | −13.587 | −19.390 | −17.096 | |
| (0.996) | (0.996) | (0.999) | (0.999) | ||
| Mergers and acquisitions | −0.075 | −0.186 | 0.209 | 0.218 | |
| (0.799) | (0.558) | (0.630) | (0.630) | ||
| Others | −0.164 | −12.726 | −0.145 | −16.255 | |
| (0.610) | (0.980) | (0.733) | (0.996) | ||
| Control Variables | Total capital | 1.44 × 10⁻⁸ *** | 1.21 × 10⁻⁸ *** | 3.74 × 10⁻⁸ *** | 3.45 × 10⁻⁸ *** |
| (0.000) | (0.000) | (0.000) | (0.000) | ||
| Total laborers | 0.001 ** | 0.001 | −0.002 | −0.002 | |
| (0.045) | (0.181) | (0.143) | (0.213) | ||
| Year Dummy | 2012 | −0.272 * | −0.180 | ||
| (0.073) | (0.424) | ||||
| 2013 | −0.345 ** | −0.025 | −0.241 | −0.035 | |
| (0.026) | (0.878) | (0.287) | (0.883) | ||
| 2014 | −0.144 | 0.123 | −0.030 | 0.162 | |
| (0.326) | (0.433) | (0.892) | (0.481) | ||
| 2015 | −1.758 *** | −1.312 *** | −1.605 *** | −1.381 *** | |
| (0.000) | (0.000) | (0.000) | (0.000) | ||
| Constant | −0.892 *** | −1.103 *** | −0.998 *** | −1.139 *** | |
| (0.000) | (0.000) | (0.000) | (0.000) | ||
| Observation | 924 | 731 | 924 | 731 | |
| LR ratio | 146.12 | 93.66 | 81.70 | 58.45 | |
Note: (1) The numbers in parentheses are p-values. (2) *, **, and *** indicate significance at the 10%, 5%, and 1% levels, respectively.
Table 7.
Analysis results of the correlations between cooperative innovation strategies and inter-field technological convergence.
Table 7.
Analysis results of the correlations between cooperative innovation strategies and inter-field technological convergence.
| Model | Poisson Model | N.B. Model | |||
|---|---|---|---|---|---|
| Dependent Variable | Inter-Field Technological Convergence | Inter-Field Technological Convergence | |||
| Time Lags of Explanatory Variables | T | T-1 | T | T-1 | |
| Explanatory Variables | Licensing | 0.155 *** | 0.141 ** | 0.169 * | 0.163 |
| (0.001) | (0.021) | (0.051) | (0.137) | ||
| External research contracts | 0.022 | −0.113 | −0.024 | −0.130 | |
| (0.540) | (0.187) | (0.717) | (0.185) | ||
| Joint research | 0.106 | 0.108 | 0.162 | 0.227 | |
| (0.460) | (0.595) | (0.463) | (0.420) | ||
| Joint ventures | −10.698 | −10.549 | −14.579 | −16.249 | |
| (0.978) | (0.987) | (0.996) | (0.999) | ||
| Mergers and acquisitions | 0.112 | −0.039 | 0.244 | 0.048 | |
| (0.685) | (0.915) | (0.583) | (0.925) | ||
| Others | −0.095 | 0.141 | −0.103 | 0.122 | |
| (0.769) | (0.672) | (0.820) | (0.803) | ||
| Control Variables | Total capital | 1.32 × 10⁻⁸ *** | 1.28 × 10⁻⁸ *** | 2.58 × 10⁻⁸ *** | 2.97 × 10⁻⁸ *** |
| (0.000) | (0.000) | (0.002) | (0.001) | ||
| Total laborers | 0.002 ** | 0.001 | 0.001 | -0.000 | |
| (0.012) | (0.183) | (0.578) | (0.887) | ||
| Year Dummy | 2012 | −0.167 | −0.115 | ||
| (0.267) | (0.630) | ||||
| 2013 | −0.445 *** | −0.222 | −0.423 * | −0.289 | |
| (0.006) | (0.183) | (0.089) | (0.240) | ||
| 2014 | −0.609 *** | −0.442 ** | −0.551 ** | −0.457 * | |
| (0.000) | (0.013) | (0.031) | (0.070) | ||
| 2015 | −1.961 *** | −1.718 *** | −1.774 *** | −1.653 *** | |
| (0.000) | (0.000) | (0.000) | (0.000) | ||
| Constant | −0.931 *** | −1.024 *** | −1.037 *** | −1.095 *** | |
| (0.000) | (0.000) | (0.000) | (0.000) | ||
| Observation | 924 | 731 | 924 | 731 | |
| LR ratio | 121.83 | 76.16 | 58.47 | 45.14 | |
Note: (1) Numbers in parentheses are p-values. (2) *, **, and *** indicate significance at the 10%, 5%, and 1% levels, respectively.
© 2017 by the author. Licensee MDPI, Basel, Switzerland. This article is an open access article distributed under the terms and conditions of the Creative Commons Attribution (CC BY) license (http://creativecommons.org/licenses/by/4.0/).
Share and Cite
MDPI and ACS Style
Kim, K. Impact of Firms’ Cooperative Innovation Strategy on Technological Convergence Performance: The Case of Korea’s ICT Industry. Sustainability 2017, 9, 1601. https://doi.org/10.3390/su9091601
AMA Style
Kim K. Impact of Firms’ Cooperative Innovation Strategy on Technological Convergence Performance: The Case of Korea’s ICT Industry. Sustainability. 2017; 9(9):1601. https://doi.org/10.3390/su9091601
Chicago/Turabian StyleKim, Kyunam. 2017. "Impact of Firms’ Cooperative Innovation Strategy on Technological Convergence Performance: The Case of Korea’s ICT Industry" Sustainability 9, no. 9: 1601. https://doi.org/10.3390/su9091601
Note that from the first issue of 2016, this journal uses article numbers instead of page numbers. See further details here.