Regional Difference and Evolution and Convergence of Innovation Capability in China: Research on Space and Factorial Levels

1
Hubei Institute of Economic and Social Development, Central China Normal University, Wuhan 430079, China
2
Economics and Management School, Wuhan University, Wuhan 430079, China
*
Author to whom correspondence should be addressed.
Sustainability 2017, 9(9), 1644; https://doi.org/10.3390/su9091644
Submission received: 12 August 2017
/
Revised: 10 September 2017
/
Accepted: 12 September 2017
/
Published: 19 September 2017
(This article belongs to the Section Economic and Business Aspects of Sustainability)
Abstract
:Nowadays, in China, there exist obvious regional economic differences. However, narrowing such differences involves solving the problem of regional innovation differences. Furthermore, regional innovation capability disparity is an important factor in explaining the imbalances between regional economic development and international economic development. Hence, the study first adopts the Theil index decomposition formula to analyze innovation difference and evolution law in China and its four regions during 1998–2013 from the perspective of high-tech industries. The study explains the reasons for the differences in regional innovation capability on the spatial and factorial levels. The study then analyzes the convergence of innovation capability on different space-scales by applying the spatial panel of the β convergence model. The analyses show that 2007 was the important inflection point in China’s regional innovation capability difference pattern; since then, the convergence speed of regional innovation capability has accelerated significantly.
1. Introduction
This study aims to examine the innovation differences between regions as well as the corresponding evolution law and influencing factors, specifically based on space and factorial perspectives. Additionally, the study focuses on national and regional innovation capacity convergence to consider how far innovation capital input, R&D manpower input, and innovation culture impact this convergence. The motive power of innovation in science and technology (hereinafter referred to as “sci-tech”) is indispensable for regional development and national prosperity, and the economic growth theory views such innovation as the core factor in regional economic development [1]. Therefore, whether a region is competitive in an increasingly fierce market or can maintain sustainable economic growth depends on its innovation capability.
The reasons for disparate development between regions are both superficial and deep. The superficial reason is simply the economic differences between regions. The deep reason is the innovation difference between regions and the difference between regional innovation resources and the active level of innovation activity [2]. From the perspective of a country, the more developed its regions are, the further its innovation capability and active level of innovation factors will proceed. The United States, for example, is highly developed in many of its regions, and its innovation capability and level of innovation factors are correspondingly advanced. The United States experiences disparate development between regions because of both of the above mentioned reasons. From the perspective of a region, the innovation difference can be regarded as a main reason for regional economic differences [3], and thus the regional economic growth pole and regional innovation growth pole are super-positioned in geographical space [4]. In China, the Bohai Rim, one of the nation’s three economic growth poles, has both economic and innovation advantages. The Bohai Rim hosts Zhongguancun, the first National Demonstration Zone, which has the most comprehensive scientific training systems and talent pool and possesses the soundest systems for the exchange of property rights and scientific and technological service. Thus, the first step in narrowing the regional economic differences is solving the problem of regional innovation differences. Furthermore, differences in regional innovation capability are an important factor in explaining the imbalances between regional economic development and international economic development [5]. Therefore, this study attempts to focus on the measurement of innovation disparity and the mechanism behind this disparity.
As illustrated below, in terms of innovation disparity, previous studies focused on regional comparison and tended to emphasize descriptive comparative analysis of the innovation status. They seldom utilized the professional gap measurement method to measure regional differences in China’s innovation capability, and studies analyzing the difference evolution law are relatively few. Moreover, a deep understanding of the “space” and “factor” mechanisms, which result in such difference, is also scarce.
To solve these problems in the research status quo, this study proceeds along two main lines: (i) research on regional innovation capacity differences in China and its eastern, middle, western, and northeastern regions, as well as its evolution law and related factors’ contributions, by adopting the Theil index and its decomposition formula; and (ii) research on national and regional innovation capacity convergence, as well as how far innovation capital input, R&D input, and innovation culture impact this convergence, by using the spatial panel β convergence model. Specifically, spatially, the study divides innovation capacity disparity into that within a region and between regions. Besides, from the factorial view, the study divides innovation disparity into the capacity–capital ratio, capital–labor ratio, innovation–personnel ratio, and capacity–personnel ratio.
This study chooses the Theil index spatial and factorial decomposition for the following reasons. First, the Theil index can be decomposed and added, which makes it possible to decompose the research object. In fact, it is a popular approach to apply the Theil index in measuring economic disparity [6]. Second, current research studies usually start with spatial or factorial dimensions to analyze innovation capacity. However, spatial and factorial decompositions enable us to discover potential reasons influencing innovation capacity and the degree to which they contribute. Specifically, the research investigates the mechanism that leads to China’s regional innovation disparity, with consideration of differences in the space and factor scales. Third, conclusions regarding which spatial and factorial reasons influence the disparity innovation capacity offer implications for policymakers.
As for the innovation index, the study is based on the assumption that the high-tech industry is the most important part in a regional innovation system and is the best carrier of sci-tech and economic integration. Besides, their innovation level directly represents the maturity of the regional innovation capability and the regional innovation system. Thus, the study chooses to analyze China’s regional innovation problem on the space and factorial levels. By constructing a method for measuring differences in regional innovation capability, analyzing the reasons, and finding a way to narrow such differences, some suggestions on policymaking will be offered to local governments.
The remainder of the paper is organized as follows. Section 2 reviews the literature on innovation capacity disparity. Section 3 provides an overview of the data and a number of descriptive statistics and describes the variables used in the Theil index model along with the theoretical framework. Section 4 analyzes the convergence of regional innovation capability difference variations based on the factors’ decomposition. Section 5 presents the conclusions and discusses their policy implications.
2. Literature Review
2.1. Review of Regional Innovation Comparison
Because of the coupling of innovation resource endowment and the characteristics of administrative economic areas, innovation has obvious regional differences. These differences lead to a series of regional innovation comparisons. Research on regional innovation comparison can be divided into comparisons of (for instance) innovation structure, innovation efficiency, and innovation capacity.
Differences in regional innovation structure are reflected in the structural differences of sci-tech human resources and sci-tech funding sources in the input structure. The sci-tech manpower input structural difference is determined mainly by comparing regional differences in the proportion of R&D personnel input and sci-tech human resource input [7] and by the educational level in regional sci-tech manpower input [8]. The comparison of sci-tech funding sources mainly examines regional differences in the level of governmental funds supporting sci-tech input [9] and in enterprises’ self-raised funds [10].
As the research field matures, comparison of regional innovation difference is no longer confined to simple comparison of the innovation structure. Rather, it begins to explore the innovation efficiency comparison. Specifically, innovation efficiency comparisons specialize in approaches that estimate how far innovation inputs have been turned into outputs. In fact, since the dawn of the 21st century, a variety of parametric, non-parametric, and other comprehensive estimation efficiency methods have been introduced into the input and output fields, and this has made regional innovation efficiency comparison the new hotspot of the research [11,12,13,14,15]. In terms of non-parametric estimation, Qiao and Wang adopted the three-stage DEA and DEA-window analysis to evaluate the innovation efficiency [15]. From the perspective of parametric estimation, Cao and Yu improved the stochastic frontier analysis model by combining it with the projection pursuit model to analyze innovation efficiency and its affecting factors [16]. Some scholars combined parametric and non-parametric estimation—for instance, Wang et al. combined the stochastic frontier approach and the Malmquist method to estimate the innovation efficiency of China’s provinces and analyze their differences [17].
2.2. Literature on Regional Innovation Capacity Disparity
As stated previously, the literature focuses on innovation efficiency and innovation structure; however, innovation capacity should be highlighted in innovation disparity. Comparisons of innovation capacity focus on indices and factors influencing such ability difference [18].
Regarding indices to explain the regional comparison of innovation, the literature presents a range of approaches. Patent output is generally used as a comparative index of regional innovation capability [19,20,21]. For example, based on the invention patent data from 1988 to 2008, Chen evaluates and compares the innovation potential of 31 provincial regions of China [19]. Except for patent applications, Cao and Qing focus on the new product output value of large and medium-sized industrial enterprises to measure regional innovation differences and find interregional differences, with differences in the eastern region dominating the total difference [22]. Some scholars focus on innovation input, output, and growth to reflect innovation capacity disparity. Gilman applied a series of data to compare the innovation input, output, and growth rates of the United States, Britain, Russia, Japan, Korea, Singapore, China, the European Union, and the Organization for Economic Cooperation and Development (OECD); he concluded that the world’s innovation geography layout had changed and that China, along with some of its neighbors in Asia, will be the emerging growth region in the future [10]. Additionally, Wang et al. used the patent authorization ratio and duration of patents as measurement indices to investigate the innovation quality difference between some typical cites; however, they found that patent authorization could not be used to indicate innovation quality difference [23]. Considering that one or two indices are unable to reveal regional innovation ability, some scholars constructed an index system to study regional innovation [24,25]. Liu and Li adopted sci-tech personnel and 13 other indices to analyze the disparity and trends in provincial innovation ability in China. They found that the eastern and western regions of China each played a significant role in the overall innovation ability disparity [24]. Huang and Yang constructed an evaluation index system of regional innovation capacity from the innovation input capacity, output capacity, diffusion, and environmental endurance [25].
To analyze innovation disparity, we should not only focus on how to choose the appropriate index for analyzing innovation spatial disparity but also uncover the causes of these disparities.
The existing literature attempted to reveal what causes innovation disparity.
First, scholars adopted various types of approaches to analyze innovation capacity spatial difference. Jiang analyzed different levels of regional innovation, as well as spatial and temporal evolution in China for 2001–2011, by adopting the method of exploratory spatial data analysis and multiple linear regression analysis [26]. Chen evaluated and compared the innovation potential of 31 provincial regions of China with the help of a geographic information system [19]. Cao and Qin used the Theil coefficient model to measure the regional differences in patent applications and the new product output value of large and medium-sized industrial enterprises from 1990 to 2008; they concluded that interregional differences and differences in the eastern region dominate the total difference [22]. Xiao, Du and Dai adopts the coefficient of variation space Markov chains and spatial autocorrelation and other methods to analyze Chinese regional innovation differences [27].
Second, as for “factors” influencing innovation ability disparity, scholars argued from different perspectives. In terms of the input perspective, foreign direct investment [28] and scale and productivity of the input [29] influence innovation capacity, while R&D investment and the number of related staff, namely, human input, are fundamental factors leading to this form of disparity [30]. From the industrial perspective, industrial clusters influence innovation capacity [31]. Feldman concluded that geographic clustering and the coordinating functions of a variety of supply factors play a significant role in this disparity [32], while Scott and Storper believed that technological markets and social networks are crucial to the regional innovation ability [33,34]. Starting from traditional disparity factors, Zhang concluded that supply-demand and policy and innovation interactions, which increase the returns of innovation on the spatial level and in the regional prime cost of innovation, are important reasons for China’s spatial concentration of innovation activity [35]. Gao analyzed the effect of the use of patent documents on regional innovation and found the effect to be significantly positive [36].
From the spatial perspective, scholars studied how regional innovation is affected by international technology spillover [37] and the spatial spillover effect of innovation [38].
Besides, from the cultural perspective, Shao et al. found that inertia has a huge influence on innovative activities and that these are closely related to the local accumulation of culture [39]. Thus, a disparity in these factors would lead to regional innovation disparity. The administrative influence also influences regional innovation capacity. Different government interventions will have various impacts on regional innovation [40,41].
3. Methods and Data Summary
3.1. Regional Innovation Capability Difference Measurement Method and Decomposition
Nowadays, there exist several measurement methods for regional development difference, including the Gini index, Ricci–Schutz correlation coefficient, Theil index, variation coefficient method, etc. This study selects the Theil index to decompose research objects. Since this method is mature and can be looked up in the literature, its merits are considered here only briefly.
Assume Yij is the innovation capability of j province in i district, so the sum of the research object is
and that of the total population is
where is the population of j province in i district.
Then, the Theil index of regional innovation capability difference is
Meanwhile, the Theil index can be decomposed into within-group () and between-group () as
and the difference of i district is
The difference of all regions is
The traditional Theil index decomposition just analyzes the contribution degree of the spatial factor acting on the difference [42]. By drawing lessons from the idea behind the Theil index, we can analyze the degree of the contribution made by each factor to the regional innovation capability difference from the aspect of total factors. According to the regional innovation production function proposed by [43], the main factors affecting innovation capability are capital input and manpower input. and are, respectively, the innovation capital input and innovation manpower input of j province in i district, so C and H are, respectively, total capital input and total manpower input. Then, the Theil index can be decomposed as
In Equation (5), is the deviation degree of innovation capability and capital input, which could be deemed as the effect innovation capital input has on the regional innovation capability difference. is the impact the proportion of regional sci-tech personnel has on the regional innovation capability difference. is the impact innovation manpower input has on the regional innovation capability difference.
3.2. Index Selection and Data Source
3.2.1. Selection and Preprocessing of the Statistical Index
On the theme of measuring China’s regional innovation capability difference, according to the previous equations and Theil index decomposition, the invention patent is usually selected to represent regional innovation capability [44]. However, the nature of innovation should not be limited to sci-tech output but should also include sci-tech economic behavior capability. This capability is whatever puts the sci-tech achievement into practice and generates economic and social value. Based on this, this study preprocesses the regional hi-tech industry invention patent (P) and new products’ gross sales (G) and then constructs a compound index to represent innovation capability. The calculations are as follows:
- (i)
- Smooth process of the new product value. To eliminate the influence of price on new product value, while considering that price fluctuations in China have certain regional differences, the consumer price index for each year in each district is selected as the smooth coefficient, and 1998 is chosen as the time point in constant prices.
- (ii)
- Dimensionless process of the index. To eliminate the dimension differences and preserve data information, the study, respectively, selects the proportion of invention patent authorization in the whole country and the proportion of new product value, instead of the initial index.
- (iii)
- Consider the weighted average of the two preprocessed indices as regional value Y.
When selecting the regional population index, most literature generally applied the population index in the region [45,46]. However, the statistical caliber of this index in China’s statistical yearbooks is based on hukou instead of permanent residents, which obviously results in a deviation in calculating the regional development difference (since China has great regional differences and high floating population in the regions, if we calculate the regional population just by hukou, the contribution of the floating population to regional economic development will obviously not be reflected). Thus, instead of the population index, we select the quantity of hi-tech industry practitioners for the following reasons. First, the statistical caliber of practitioner quantity can avoid the limitation of hukou and can truly reflect the scale of industrial development in the region. Second, this study analyzes the problem from the industrial perspective, and selecting the quantity of hi-tech industry practitioners is compatible with this perspective. Similarly, to eliminate differences in unit measurement, N is the percentage of hi-tech industry practitioners over the total population.
For the capital input index, commonly adopted indices include R&D expenditure, expenditure on introduction of new technology, etc. We focus on the regional innovation capability, and its core value is R&D activity. Moreover, R&D activities in the sci-tech field are total activities that relate to increasing total knowledge, developing new applications by adopting such knowledge, and conducting basic research to apply research and experimental development [47]. Hence, selecting R&D activity is optimal. Meanwhile, as Griliches and Wu pointed out, R&D activity has a continuous impact on knowledge production, so R&D stock should be selected to replace the current input [30,48]. Referring to the calculation by Wu (2008), the equation of R&D capital stock is
where is the R&D capital stock of i province in t period, Eit is the R&D expenditure of the current period, and δ is the depreciation rate.
Based on this, the calculation of R&D capital stock still needs to be deflated to calculate R&D stock in the base period. On the one hand, the deflation of R&D input follows the same method and process of new product value deflation in order to ensure the consistency this study aims for in dealing with the value index. On the other hand, the designed calculation equation of R&D stock (to be consistent with the research period of the article, 1998 was selected as the base period) in the base period is
where is the average growth rate of all the periods (K) before the base period. In this study, the average growth rate of 5% is the one commonly used in references [12]. Existing literature often set at 15% or 25%, and considering [49], is set at 15%. The reason is that we should consider that internationally a 25% depreciation rate is commonly set in light of patent data. However, in China, the situation in relation to setting the range and statistic caliber of patent data is quite different from international standards (in China, patents also include the utility model and appearance design, apart from invention patent itself). C is the percentage of calculated R&D capital stock of all regions over national capital stock.
Finally, manpower input selects the internationally commonly used statistic indicator of R&D activity personnel equivalent to the full-time equivalent, as it reflects the sum workload of R&D full-time personnel (the cumulated working hours of staff who are engaged in R&D activities for the full-year account for 90% or above) and reflects the workload of part-time personnel, which is converted by the actual working hours. Referring to the previous context, H is the percentage of the R&D activity personnel of all regions who are equivalent to full-time personnel across the country.
3.2.2. Data Source
The relevant statistical data used in this study are from the China Statistic Yearbook, China High-tech Statistical Yearbook, and China Statistical Yearbook on Science and Technology. Considering the availability of data and the functioning cycle of the economy (especially the western development strategy), the revitalization plan for northeast China, and the middle-rise strategy that has been implemented by the Chinese government since 1998, the research period is set from 1998 to 2013. The study follows the categorization of China’s regions in the China Statistic Yearbook (2014)—namely, eastern, middle, western, and northeastern. The eastern region includes Beijing, Tianjin, Hebei, Shanghai, Jiangsu, Zhejiang, Fujian, Shandong, Guangdong, and Hainan; the middle region, Shanxi, Inner Mongolia, Anhui, Jiangxi, Henan, Hubei, and Hunan; the western region, Guangxi, Chongqing, Sichuan, Guizhou, Yunnan, Shaanxi, Gansu, Qinghai, Ningxia, and Xinjiang; and the northeastern region, Liaoning, Jilin, and Heilongjiang. As the data for Tibet are deficient, Tibet is not considered here (apart from Tibet, values of “0” were adjusted to “0.001” in this study to avoid the situation of operating no solution).
4. Regional Innovation Capability Difference, Evolution, and Decomposition
4.1. The Evolution Trend and Spatial Factor Decomposition of the Regional Innovation Capability Difference
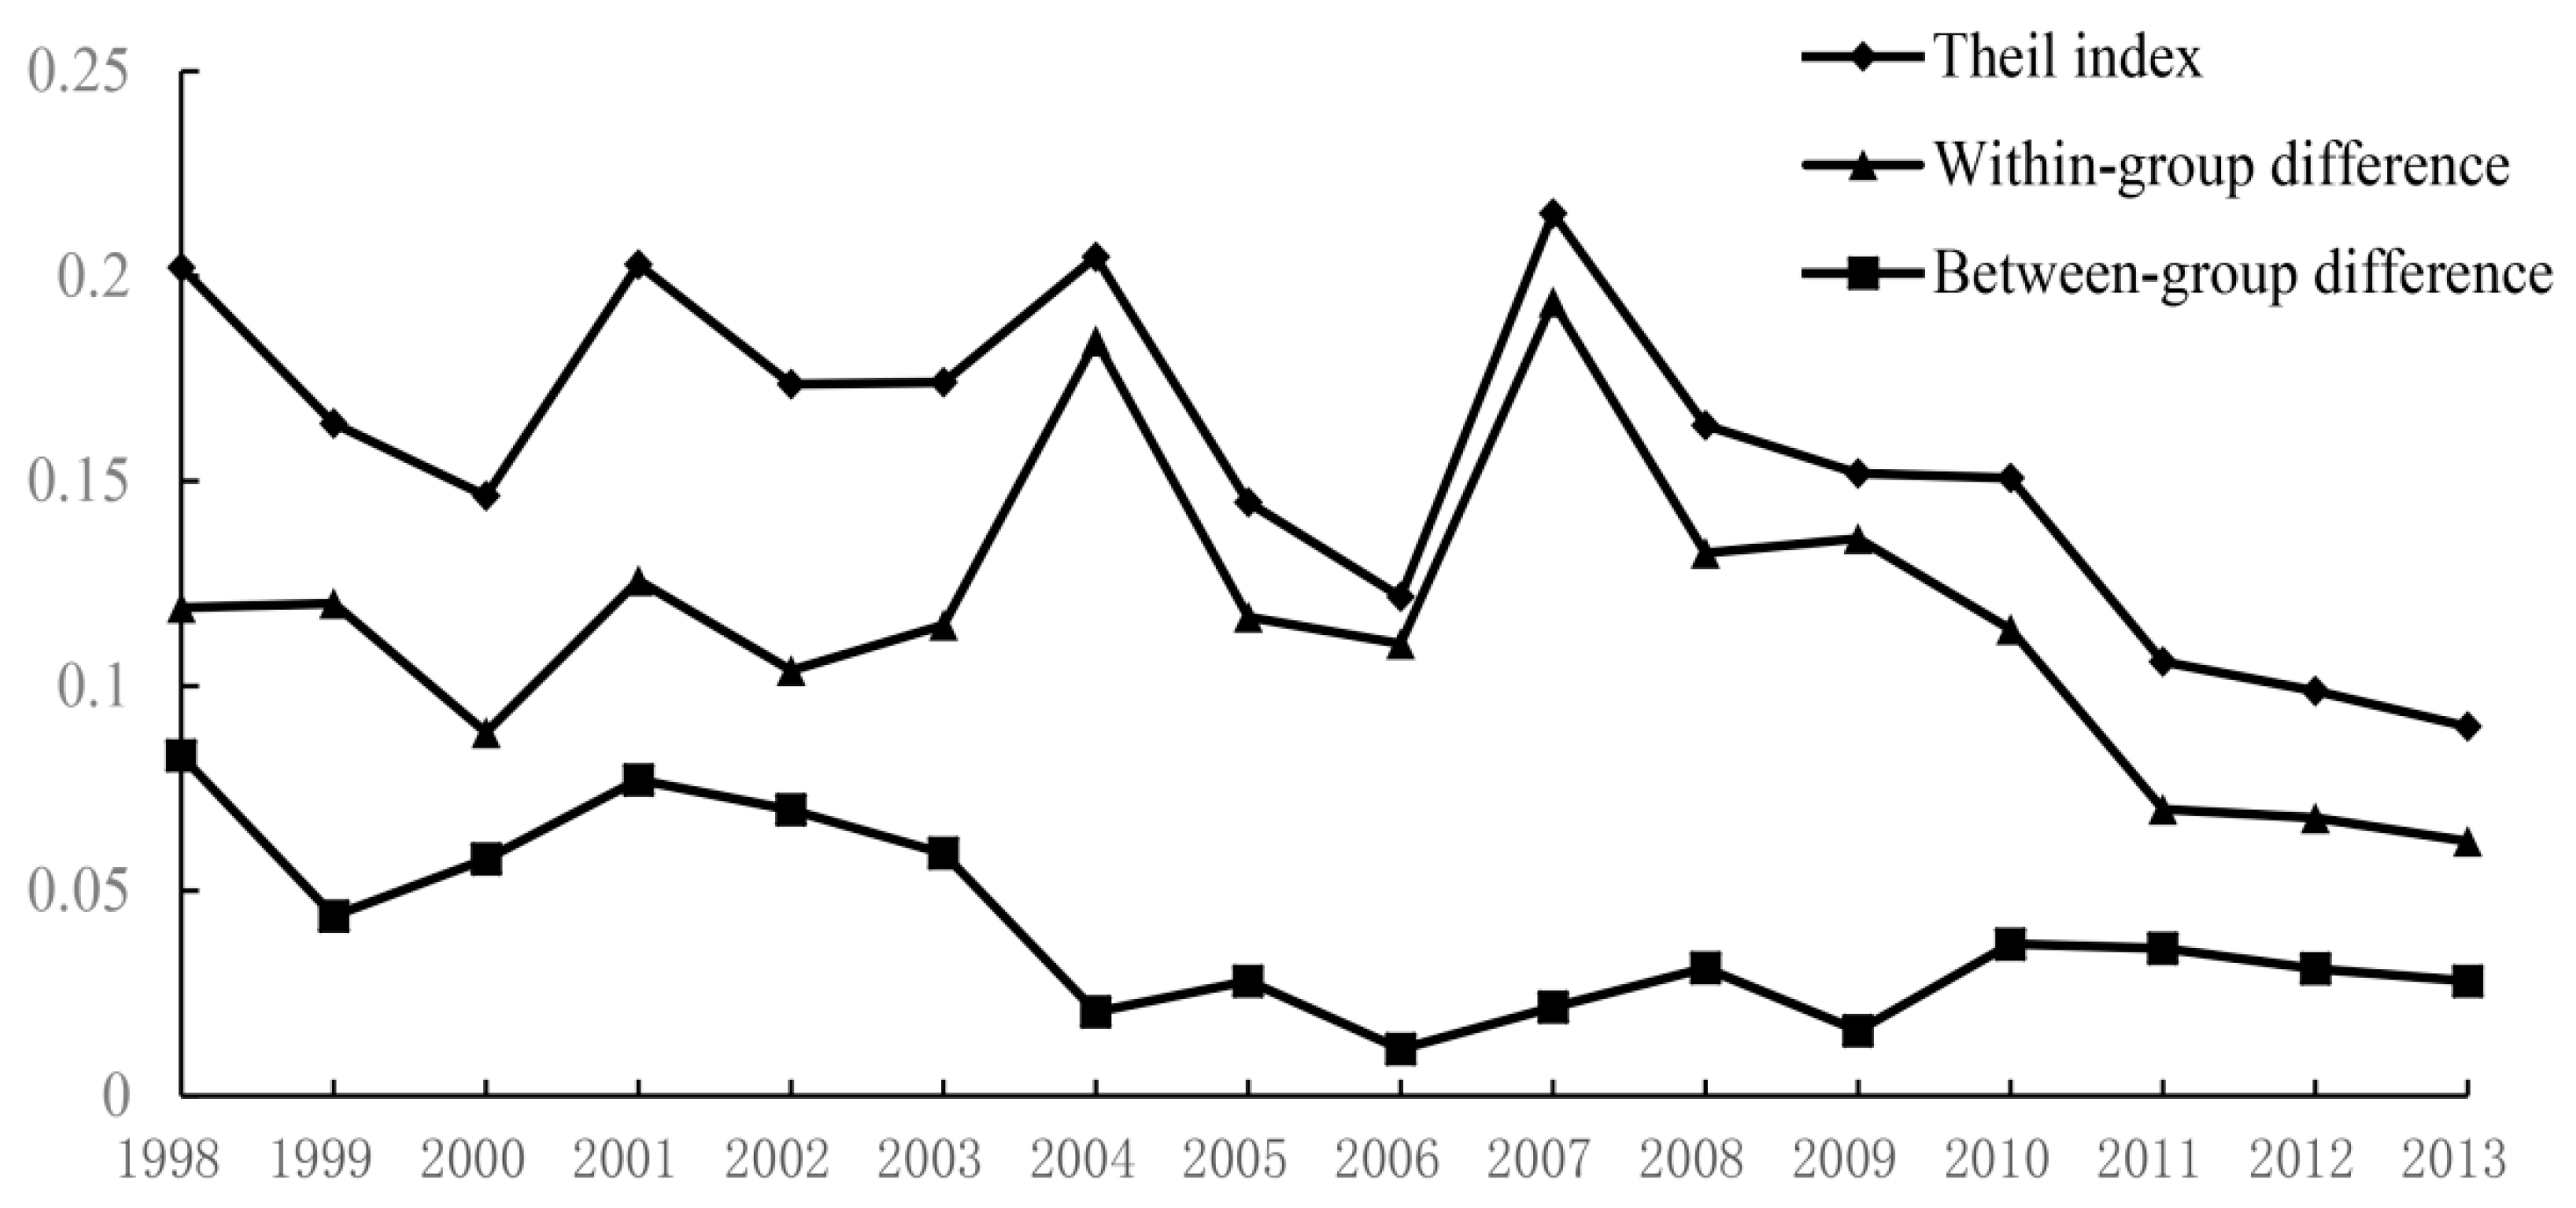
Using the correlation equation of the Theil index to calculate the evolution trend of China’s regional innovation capability difference (Figure 1) in the period of 1998–2013, we can divide the evolution trend over these 16 years into two stages. The first stage is 1998–2006, during which the Theil index shows cyclical fluctuation, and the fluctuation cycle approximates every three years; the second stage is 2007–2013, during which the Theil index decreases year after year from 0.215 to 0.090, and the regional innovation capability difference shows a shrinking trend year by year. This means that a series of regional equilibrium strategies and reforms in the sci-tech system have had positive effects on the collaborative promotion of regional innovation capability.
After analysis from the spatial perspective, the regional innovation difference can be decomposed into and . Table 1 provides the calculated values of these two and their contribution ratio to regional difference. In conjunction with Figure 1 and Table 1, it can be seen, in one aspect, that the within-group difference of China’s regional innovation capability remained relatively stable after 2004 and that the general trend was declining while fluctuating. Moreover, the average for over 10 years was 0.0261; in another aspect, we can see that the evolution trend of the between-group difference was highly consistent with the evolution of China’s regional innovation capability difference, and the annual within-group difference was greater than the annual between-group difference. Furthermore, presented a rapid declining trend after 2007, which was the main reason for the narrowing of China’s regional innovation capability in this period.
Analyzing from the contribution perspective, the general trend is that the Theil index’s contribution of the within-group difference to China’s regional innovation capability is less than that of the between-group difference, although heterogeneity does exist in different periods. In the years 1998–2003, while the contribution of the between-group differences dropped from 41.07% to 34.00%, the average contribution degree reached 38.02%; in the period of 2004–2009, the contribution degree of the within-group difference made by the Theil index was about 10%, and the average contribution degree was just 11.39%. The contribution of the within-group difference was 7.8 times that of the between-group difference. In 2010–2013, the contribution degree of the within-group difference rose substantially from 24.54% to 31.08%, and the average contribution degree of the between-group difference and within-group difference was, respectively, 30.25% and 69.75%. These data illustrate that the main reason for the unevenness in China’s regional innovation capability is the imbalance in innovation capability of the four regions (eastern, middle, western, and northeastern). Thus, reducing the within-group difference is the primary method to narrow down regional innovation capability difference and promote regional innovation capability development.
Further, we refine from within-group the eastern, middle, western, and northeastern regions. As depicted in Table 1, the regional innovation capability difference of the northeastern region was the smallest, as its Theil index average was 0.056. The eastern region ranked second, with an average of 0.1013, followed by the western region with an average of 0.1347. The middle region had the largest difference, as its Theil index average was 0.1894. From this, we may divide the Theil index trends of the eastern and northeastern regions into two stages. The first stage is from 1998 to 2007, when the Theil index of the eastern region rose in waves, but the northeastern region declined with fluctuations. The second stage is 2007–2013. During this stage, by contrast, the eastern region declined, while the northeastern region rose in waves. The Theil index of the middle and western regions did not show the obvious characteristics of convergence and divergence. However, the trends are relatively stable after 2008, with the middle region presenting the divergence trend and the western region gradually showing a trend of convergence in regional innovation capability. Comparing their Theil indices with those of northeastern and eastern regions, we believe that the Theil indices in the middle and western regions fluctuate on a high level, which indicates that their contribution to China’s regional innovation capability difference is far beyond those of the eastern and northeastern regions.
4.2. The Factors’ Decomposition Analysis of the Regional Innovation Capability Difference
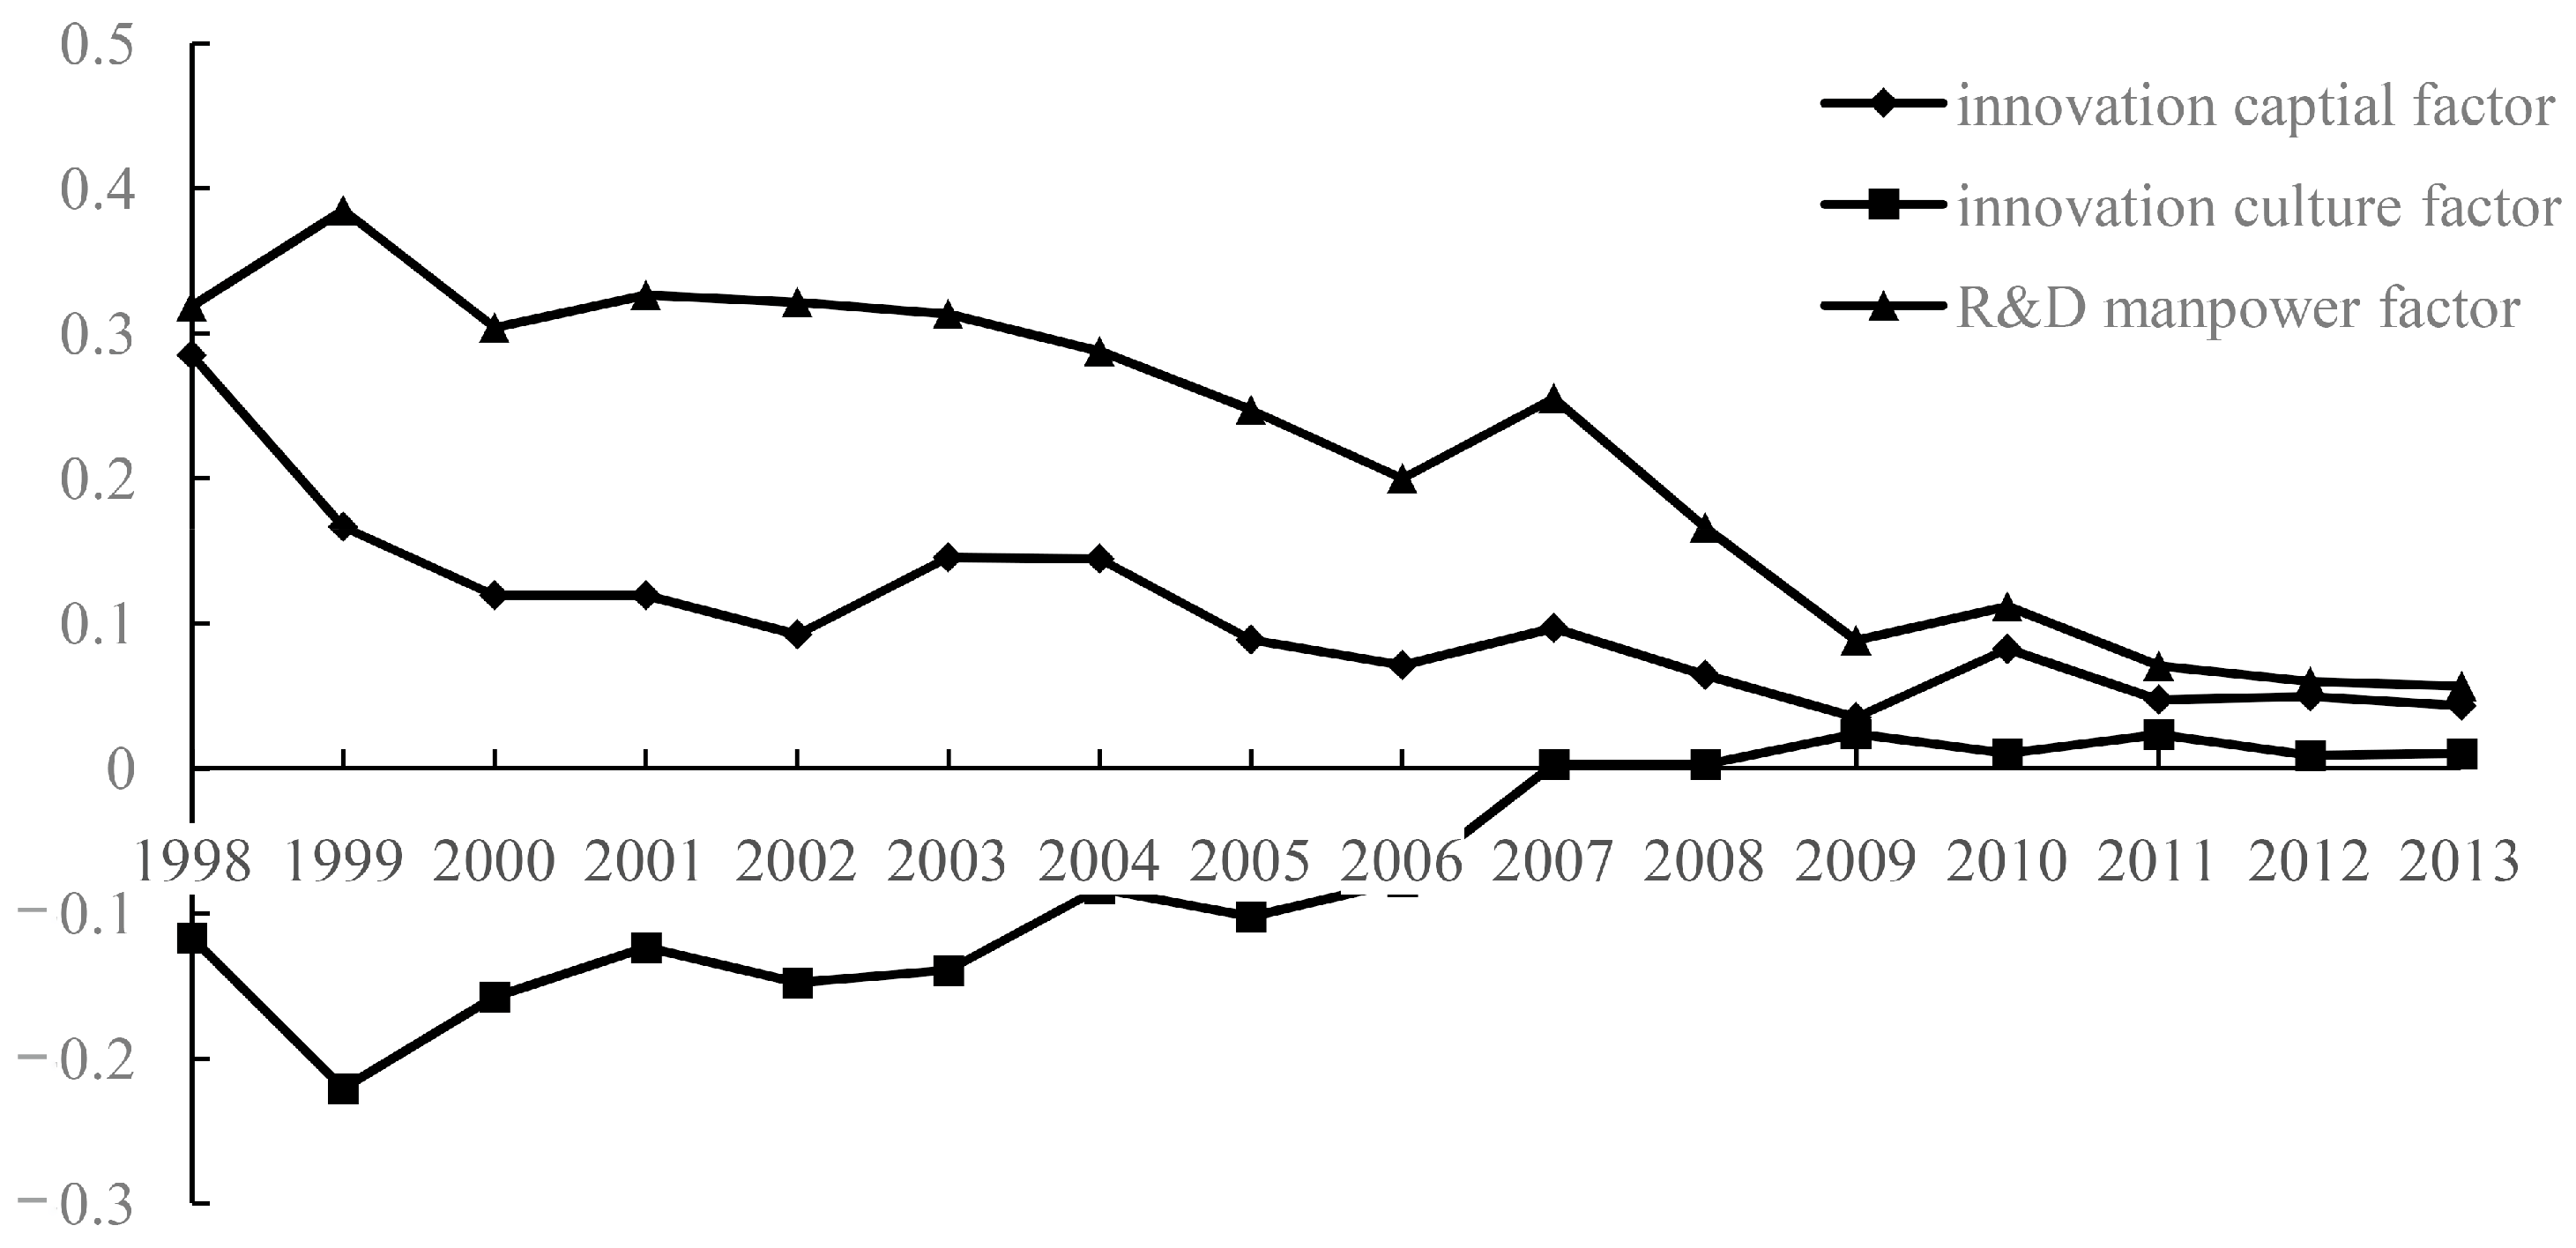
The within-group difference is the main factor leading to regional difference from the spatial perspective, but the essence of regional innovation capability should still adhere to the operation law; that is, it should be factor-driven. After analyzing the contribution of the factors to the regional innovation capability difference from the perspective of factors, according to Equation (5), we decompose the Theil index of regional innovation capability difference into innovation capital factor , innovation culture factor , and R&D manpower factor . (The proportion of R&D personnel in the hi-tech industry reflects the degree of recognition of innovation. However, what underlies the degree of recognition of innovation is innovative behavior, which itself results from a culture of innovation that drives innovation, subject to the external environment. Thus, we may believe that this index represents the innovation cultural factor.) Their dynamic variation rule can be seen in Figure 2. From Figure 2, we may find that both and showed a decreasing trend, while showed the obvious increasing tendency. However, their relationship with each other and with the Theil index of regional innovation capability had no general correlation. The inflection point of appeared in 2002 and 2007, and its evolution trend first decreased, then fluctuated and decreased again; showed a monotonous increasing tendency that was relatively stable, and 2007 was the turning point from “negative” to “positive”. had two obvious cycles. The first cycle was from 2000 to 2006 with its index decreasing from 0.3039 to 0.1997 in a parabolic fashion. The second cycle was from 2007 to 2013, with its index decreasing gradually from 0.2553 to 0.0568. Analyzing their economic significances, the Theil index average contribution rates of , , and in this entire study period were 64.57%, −46.53%, and 146.53%, respectively, which indicates that innovation capital and R&D human resource input are the dominant factors of regional innovation capability difference. After 2007, the contribution level of innovation capital and innovation culture to regional innovation capability difference remained stable, with the average contribution rate of innovation capital and culture being, respectively, 43.17% and 4.19%.
To find the deeper reason for regional innovation capability difference, it is necessary to narrow the space scale. For this reason, Equation (5) is applied to calculate the impacts that relevant factors from the four internal regions have on innovation capability difference (Table 2). Judging from the general trend, except in the northeastern region, and in the other regions showed a fluctuating decreasing tendency, and presented a fluctuating increasing trend. Compared with this, the fluctuation of , , and in the northeastern region was relatively flat. Specifically, was the main reason for the fluctuations in the eastern region’s innovation capability difference during 1998–2008. The contribution of , , and to regional innovation capability difference fluctuation shows a convergence trend after 2008, illustrating that the leading factor of innovation capability difference fluctuation in the eastern region has shifted from the R&D manpower factor to a combination of capital, culture, and R&D manpower factors. In the middle region, and were the main causes of fluctuation in regional innovation capability difference before 2008, but the leading factor changed to after 2008. This shows that innovation culture is the leading factor enlarging the regional innovation capability difference of the middle region. However, the fluctuation in innovation capability difference of the western and northeastern regions was always co-led by and in this research period, which indicates that the capital and R&D manpower factors were the core factors determining the regional innovation capability difference fluctuation in these two regions over the 16 years. It also indicates that the contribution of these two factors to the two regions’ innovation capability difference was relatively stable.
5. Convergence Research on the Factor Decomposition of Regional Innovation Capability Variations
By analyzing the Theil index, we may draw the following conclusions. From the national perspective, the differences in China’s regional innovation capability were gradually decreasing from 1998 to 2013, especially after 2007. However, from the regional perspective, the three regions other than the middle region showed a certain tendency to converge. Does Chinese regional innovation capability fluctuation really show the characteristics of convergence? If so, what type of convergence might it be—global absolute convergence or club convergence? Which factors that affect regional innovation difference push the convergence of regional innovation capability? Answering these questions will help the country understand the role of innovation capability factors in regional collaborative innovation from the macro level, and it will provide some theoretical suggestions for the Chinese government to formulate a regional innovation policy. These are questions this study aims to resolve. The next part connects the regional innovation capability variation and factors’ decomposition to innovation convergence, focusing on the role of the innovation capital factor, R&D manpower factor, and innovation cultural factor in innovation capability convergence.
5.1. Construction of the Spatial Panel of the β Convergence Model
The most common convergence forms are convergence and convergence. Since innovation has certain characteristics of agglomeration and spillover [4], adopting the convergence model, which considers spatial effect, is more suitable. Chen, Pan, and others have applied the spatial econometric approach to study the problem of Chinese regional innovation convergence [2,50]; however, there are two shortcomings in the current studies. One is that the design of the spatial weight matrix , which is based on the adjacency relation, is not in accordance with the multi-dimensional condition of knowledge spillover. According to the perspective of Boschma [51], knowledge spillover should not only consider the adjacency relation, because the adjacency relation itself is neither the necessary nor the sufficient condition of spillover formation; therefore, other adjacent dimensions must be enhanced to promote knowledge spillover. The other shortcoming is lack of analysis of the impact each contribution factor of innovation capability has on convergence. Thus, to conduct an overall investigation of the mechanism of regional innovation capability convergence, this study combines the modeling approach of convergence with the spatial panel model and builds a convergence model (since innovation involves qualitative change, the unobservable individual effect generally has spatial autocorrelation, which is why this study chooses KKP as the fundamental model.) based on the KKP model (Kapoor, Kelejian and Prucha model) [52]. The specific model (Model Y) is as follows:
In Equation (8), is the identity matrix; WN is the spatial weight matrix; is the regional innovation capability of region in period; and , , and are parameters to be estimated. If , convergence will exist in regional innovation capability. and represent different types of space effects whose numerical magnitudes reflect the strength of the space effects.
When researching the impact each factor has on regional innovation capability convergence, we refer to related research ideas [53]. Based on Equation (8), we apply (model C), (model H), and (model N) to replace to measure the roles the innovation capital factor, R&D manpower factor, and innovation culture factor play in regional innovation capability convergence.
To ascertain the spatial weight matrix , Wang proposed four dimensions (geographic distance, economic distance, technology distance, and industrial distance) and their calculation methods [54]. Combined with the research object, the spatial correlation of regional innovation capability presents innovation spillover, which shows the typical “first law of geography”. It is also affected by the regional absorptive capacity, which consists of the comprehensive results of regional economic development, R&D input, talent reserve, and other factors. However, according to the personnel classification effect in the new-new economic geography theory, regional economic development is the first factor of regional absorptive capacity because excellent talents tend to work in developed areas based on benefit maximization; hence, we apply the complex index, which is the average index of geographic distance and regional economic development level, to reflect the spatial correlation of regional innovation capability. Its calculated equation is as follows:
where is the GDP average of region in the calculation period, and is the straight-line distance between the provincial capital of region and the provincial capital of region (the straight-line distance of the capitals between the regions is calculated using a program provided by the website www.jisuan.info). is standardized according to row.
On selecting an estimation method and model, this study chooses to use maximum likelihood estimation, considering that applying the method of ordinary least squares will result in bias in the estimation results because of spatial correlation in the estimation model. The first step is to calculate (, and are the variance of random error term and in Equation (8)). We ascertain the optimal equation model by judging the magnitude and significance of . If can pass the significance test, it means the significance of is not equal to 0, so that we should choose the random effects regression equation as the interpretation equation [55]; and if it cannot pass the significance test, the fixed effect regression equation is much better. Based on this, we further analyze the models of individual fixed effect, time fixed effect, and dual fixed effect. By judging the effectiveness and goodness of fit, the optimal equation is chosen as the interpretation model for this study.
5.2. Analyses of Empirical Results
Through the spatial data analysis software in R language, including packages of splm, spam, spdep and others, this study conducts parameter estimation on Equation (8) and its alternative factors’ econometric model (Table 3).
We can draw some conclusions from the results of the parameter estimation. From the national perspective, China’s regional innovation capability increase presented a slower convergence in 1998–2013, and this convergence was not significant. Moreover, only the capital factor drove the slow convergence in regional innovation capability increase, but it was not significant. Taking the influence of regional heterogeneity into account, we need to reduce the space scale to conduct further research. From the regional perspective, the internal space correlation coefficients of the eastern, middle, western, and northeastern regions were approximately 0 and not significant, which means that the KKP model as well as its estimation method were not suitable in analyzing the regional convergence of innovation capability from a regional perspective. Thus, to analyze innovation capability convergence from the regional perspective, this study adopts the panel data model and chooses the optimal model from the random effect model and fixed effect (time fixed effect, individual effect, and dual-fixed effect) using the Hausman test and the index of goodness of fit (Adjusted R2). From the estimation results (Table 3), the regional innovation capability increase of the eastern, western, and northeastern regions presented a significant convergence, while convergence in the middle region was slower and not significant. This means that the club convergence situation does exist in the increase of China’s regional innovation capability, since the regional economic development and regional innovation environment have great differences stemming from China’s large geographical size. Analyzing from the factor perspective, capital and manpower factors play a positive role in the innovation capability convergence of the eastern, western, and northeastern regions. However, the convergence of the middle region will be triggered by the local innovation culture.
Combining Figure 1 and Figure 2, we performed further research on the convergence of regional innovation capability changes after the inflection year of 2007. Its estimation method and strategy of choosing an optimal model are consistent with the description in the paragraph above where the study analyzes innovation capability convergence from the regional perspective, and the results are presented in Table 4. From the national perspective, China’s regional innovation capability increase during 2007–2013 presented a significant convergence with the speed of 0.102, which is obviously faster than that in the period of 1998–2013. This illustrates that the coordinated strategy for developing China’s regional innovation capability has achieved a lot since the Eleventh Five-Year Plan. However, 29.8 years are still required to approach half the degree of convergence. From the perspective of the contribution made by convergence factors, the capital and culture factors played a prominent role in regional innovation capability. From the regional perspective, the four regions presented a significant convergence tendency in those seven years, especially in the convergence speeds of the middle, western, and northeastern regions. These were, respectively, 0.821, 1.343, and 1.443, or 4.1 times, 6.7 times, and 7.2 times the speed of the eastern region. From the perspective of factor contribution, innovation capital, R&D manpower, and innovation culture factors made positive contributions to innovation capability convergence in every region, apart from the middle region. In the middle region, only the capital factor drove the convergence.
5.3. Further Analysis of the Results
Analyzing from the perspective of spatial relations, the increase in regional innovation capability has significant spatial correlation from the perspective of a country. The λ and ρ values of all the models in the four regions nearly approximated to 0 and are not significant, which illustrates that the interaction of the inter-regional capability increase with innovation factors in the four regions was weak. Considering the theoretical basis of constructing WN, we hold the view that China’s current inter-regional cooperation on innovation extends across a wide range. There are two aspects to this cooperation. The first aspect is the sci-tech cooperation phenomenon known as “flowers blossom inland, weeds yield fruit in the coastal region”. Although the inland area possesses solid strength in basic research, the related system in the downstream stage of the innovation value chain is far behind the pace of basic research, which results in the economic value of sci-tech achievements in the coastal area. Thus, the “hang upside-down” pattern of income distribution has been formed.
The second aspect is the supportive relationship of inland and coastal innovation cooperation. The channel of innovation spillover is not determined simply by geographic location, but by industrial transfers in which the eastern region drives innovation upgrades in the western and northeastern regions. However, due to the similarity of industrial structure, especially the homogeneity of innovation source layout and the competitive relationship of government performance assessment, the innovation spillover of each internal province in the eastern, middle, and western regions was not significant, which indicates that the cooperation mechanism on inter-regional innovation in the four regions is unsound and the linkage effect of cooperation is not significant.
From a dynamic perspective, after minifying the time scale, the convergence significance and convergence speed of China’s regional innovation capability have evidently been enhanced, both from the national and regional perspectives, which indicates that the convergence level of China’s regional innovation capability has been greatly improved since 2007. Taking the characteristic “time lag” of innovation input into account and comparing China’s sci-tech innovation development environment and policy changes in the period of 1998–2005 with those in the period of 2005–2013, we believe that the new round of national and local independent innovation capability construction since 2006 (especially after implementation of the Medium- and Long-Term Science and Technology Plan of China) has had a positive effect on enhancing inter-regional innovation capability collaborative promotion. Combining this with the research objective of this article, we think that the supportive policy toward new strategic industries in sci-tech not only helps build an innovative region but also drives the promotion and balanced development of regional innovation capability through innovation-driven strategy, which has a profound influence on strategies for harmonious inter-regional development. Analyzing from the spatial and factorial perspectives, we draw the following conclusions. (i) Taken as a whole, the function of the capital factor and the innovation culture factor on driving the balanced development of China’s regional innovation capability is being strengthened. The Theil index capital factor in particular has presented a steady downward tendency since 2007. This indicates that a series of balanced investment layouts and industry transfer, as well as sustained local government investment in sci-tech input, have been good for reducing regional innovation capability difference in China. It also indicates that the capital factor has been the first factor in pushing forward regional coordinated development. (ii) From the regional perspective, the roles of the factors of capital, R&D manpower, and innovation culture, which have had an effect on the club convergence of innovation capability, have shown an increasing tendency everywhere except in the middle region. However, the labor factor does not have a distinct impact on regional innovation capability convergence at the national level. This may be because of the regional heterogeneity of R&D human resources in the eastern, middle, western, and northeastern regions. Actually, since economic development, research culture, and management level have differences, our regional sci-tech talents have shown regional difference in both quantity and structure. For example, the quality and quantity of sci-tech talent reserves in the eastern region are far higher than those of the reserves in the middle and western regions. However, the talent structure in the middle and western regions is unbalanced as well, and in some provinces, such as Hubei, Shanxi, and Sichuan, the talent reserve is relatively concentrated. This may be the main reason for the convergence differences of the talent factor in the two hierarchy models.
6. Conclusions and Suggestions
This study analyzes the pattern, evolution trend, and convergence of China’s regional innovation capability difference during 1998–2013 from the national and regional scales, and analyzes the impact of the factors of innovation capital, R&D manpower, and innovation culture on the regional innovation capability development pattern and on its convergence from the factor perspective. The empirical study yielded four conclusions. (i) The difference of China’s regional innovation capability has gradually declined, and within-group makes a great contribution to the difference. However, the convergence of regional innovation capability was not obvious during 1998–2013. (ii) The differences of capital input and R&D manpower input are the main factors of regional innovation capability difference; the contributions of the three factors to the innovation capability of China’s four regions (eastern, middle, western, and northeastern) are quite different. Moreover, there is a certain relationship between innovation capability promotion and the internal and external development environment of innovation capability. (iii) Although China’s regional innovation capability does not have global convergence, it had club convergence during 1998–2013. Innovation capital and R&D human resources make a significant contribution to club convergence. (iv) The year 2007 is the important inflection point for the pattern of China’s regional innovation capability difference. Each regional innovation capability has increased rapidly, and the pace of backward regions is increasing, and they are catching up with the leading regions. Meanwhile, as space heterogeneity characterized innovation talent, its impact on the convergence of innovation capability from the national perspective is not the same as that from the regional perspective.
To promote China’s regional coordinated development in accordance with these analytical conclusions, we make the following political suggestions from the perspective of innovation.
- i.
- The operational idea of regional innovation system construction, that is, government leadership, enterprise participation, sci-tech innovation, and industry realization, should be insisted upon. The change in the convergence speed of China’s regional innovation capability difference shows that a lot has been achieved through the development idea, which is, through the central and local governments adopting the regional innovation policy and regional innovation layout to promote regional enterprise technology, achieve regional industrial upgrades, and realize inter-regional collaborative innovation. Thus, we should stick to the policy system of regional innovation system construction that has been implemented since China’s eleventh Five-Year Plan to drive enterprise technology upgrades and high-tech industrialization through government design and policy guidance. We should also strive to achieve the sci-tech progress-led multi-regional innovation development pattern.
- ii.
- System obstacles to knowledge factor mobility should be reduced, and the regional absorptive capacity should be strengthened to promote regional knowledge spillover. All the cities in the four regions should grasp the opportunities offered by the regional integration development strategies being implemented nationally: the Coordinated Development of Beijing-Tianjin-Hebei, Integration of the Yangtze River Delta, Silk Road Economic Belt, and the Yangtze River Economic Zone, among others. They should consider setting up specialized agencies to make plans for regional innovation development in order to guide each region in innovative economic construction, promote rational innovation factors such as mobility, and improve the efficiency of innovation resource allocation through innovation factor mobility driving inter-regional knowledge spillover.
- iii.
- The source channels of sci-tech input need to be broadened, and the sci-tech input system with its regional innovation chain needs to be improved accordingly. Since the capital factor plays a boosting role in regional innovation capability convergence, all the regions should still attach great importance to improving capital input and financing innovation capability through multiple channels. To support regional innovation capability construction, we may also consider reducing the risk of investors when investing in innovation. We may consider attracting more investors to join the investment in the innovation lifecycle through the leverage effect of magnifying fiscal sci-tech investments, including construction of institutions, investment diversification, designation of investment income-sharing mechanisms, and others.
- iv.
- The middle, western, and northeastern regions should tailor measures to suit local conditions and give overall consideration to the fundamental work construction of innovation talent, innovation culture, and innovation industry to lay a good foundation for narrowing the innovation difference with the eastern region. We can consider selecting cities in the middle, western, and northeastern regions, such as Wuhan, Chongqing, Chengdu, Xi’an, or Harbin, as regional innovation centers. We can strengthen the hatching efforts of the regions, especially their exploration of the economic value of innovation achievements and their construction of a regional provincial innovation fragmentation system with a clear division of labor and moderate competition, to foster an innovation cooperation system and improve the inter-regional innovation cooperation effect.
Acknowledgments
This work was supported by China Scholarship Council Project under Grant No. 201706775007; Hubei Province Think Tank Project under Grant No. HBSXK201619; China Postdoctoral Science Foundation under Grant No. 2016M602330; National Natural Science Foundation of China under Grant No. 61702207 and No. 41501141; and Social Science Foundation of China under Grant No. 16BGL200.
Author Contributions
All co-authors drafted and revised the article together. All authors contributed to the writing of this paper and approved the final manuscript.
Conflicts of Interest
The authors declare no conflict of interest.
References
- Li, G.P.; Wang, C.Y. The spatial characteristics and time-space evolution of China’s provincial innovation input—Based on empirical analysis of explorative spatial data. Geogr. Res. 2012, 31, 95–106. [Google Scholar]
- Chen, X.D.; Wang, L. Club convergence of regional innovation in China based on patent indicator. China Soft Sci. 2007, 10, 76–85. [Google Scholar]
- Liefner, I.; Hennemann, H. Structural holes and new dimensions of distance: The spatial configuration of the scientific knowledge network of China’s optical technology sector. Environ. Plan. A 2011, 4, 810–829. [Google Scholar] [CrossRef]
- Quatraro, F. Knowledge Structure and Regional Economic Growth: The French Case; Emerald Publishing: Cambridge, UK, 2011. [Google Scholar]
- Fagerberg, J. Technology and international differences in growth rates. J. Econ. Lit. 1994, 7, 1147–1175. [Google Scholar]
- Shorrocks, A.F. The class of additively decomposable inequality measures. Econometrica 1980, 48, 613–626. [Google Scholar] [CrossRef]
- Wu, H.C.; Liu, S.F. Evaluation on the R and D relative efficiency of different areas in China based on improved DEA model. R&D Manag. 2007, 19, 108–112. [Google Scholar]
- Bai, J.H. Human capital, R&D and productivity growth—Based on the panel data of Chinese provinces. J. Shanxi Financ. Econ. Univ. 2011, 12, 18–25. [Google Scholar]
- Bai, J.H.; Li, J. Governmental R and D financial aid—Based on empirical analysis from efficiency perspective. J. Financ. Res. 2011, 6, 181–193. [Google Scholar]
- Gilman, D. The New Geography of Global Innovation; Goldman Sachs: New York, NY, USA, 2010. [Google Scholar]
- Eberhardt, H. Untested Assumptions and Data Slicing: A Critical Review of Firm-Level Production Function Estimators; University of Oxford: London, UK, 2010. [Google Scholar]
- Cheng, L.W.; Sun, W.; Wang, J.Y. High-tech industry innovation efficiency of factor market from the incomplete perspective—Based on the comparison of the DEA-Windows’ domestic and foreign investment allocation efficiency and scale efficiency in three stages. Stud. Sci. Sci. 2011, 29, 930–938. [Google Scholar]
- See, K.F.; Li, F. Total factor productivity analysis of the UK airport industry: A Hick-Moorsteen index method. J. Air Transp. Manag. 2015, 43, 1–10. [Google Scholar] [CrossRef]
- Yang, R.D. Study on the total productivity of Chinese manufacturing enterprises. Econ. Res. J. 2015, 2, 61–74. [Google Scholar]
- Qiao, Y.B.; Wang, Y.Y. The evaluation of innovation efficiency in China based on three-stage DEA-windows. Sci. Sci. Manag. S T 2017, 38, 88–97. [Google Scholar]
- Cao, X.; Yu, J. Regional innovation efficiency in China from the green low—Carbon perspective. China Popul. Res. Environ. 2015, 25, 10–19. [Google Scholar]
- Wang, R.Q.; Peng, L.T.; Jiang, N. Analysis and test about efficiency of regional creativity basing on the SFA and malmquist method. Sci. Manag. S.T. 2010, 31, 121–128. [Google Scholar]
- Dovle, E.; O’Connor, F. Innovation capacities in advanced economies: Relative performance of small open economies. Res. Int. Bus. Financ. 2013, 1, 106–123. [Google Scholar]
- Chen, J. Spatial structure of regional innovation of china and contributing factors. Syst. Eng. 2011, 29, 41–48. [Google Scholar]
- Li, X.D.; Li, N.; Bai, J.H.; Xie, Z.Q. Study on the R and D innovation efficiency of high-tech industry in China. China Soft Sci. 2011, 2, 52–61. [Google Scholar]
- Ding, J.; Hunag, R.; Lv, L.C. Multiscale analysis of innovation difference in the Yangtze River economic belt based on the number of patents. Res. Environ. Yangtze Basin 2016, 25, 868–876. [Google Scholar]
- Cao, Y.; Qin, Y.X. Measurable analysis on the difference changes of regional innovation capability based on the dynamic performance in China. China Popul. Res. Env. 2012, 22, 164–169. [Google Scholar]
- Wang, X.Q.; Xu, W.X. China’s inter-provincial trade panel and interaction model analysis under multi-dimensional distance. China Ind. Econ. 2014, 3, 31–42. [Google Scholar]
- Liu, C.P.; Li, Q.B. Multi-indexes measurement on regional economic disparity based on provincial panel data. Stat. Decis. 2012, 8, 83–85. [Google Scholar]
- Huang, D.S.; Yang, C.F. Study on the convergence of regional innovation capacity based on spatial effect. Sci. Tech. Econ. 2017, 31, 44–48. [Google Scholar]
- Jiang, T.Y. Study on spatial and temporal evolution and factors of regional innovation in China. Econ. Geogr. 2013, 33, 22–29. [Google Scholar]
- Xiao, G.; Du, D.B.; Dai, Q.W. Chinese regional innovation differences in temporal and spatial evolution. Sci. Res. Manag. 2016, 37, 42–50. [Google Scholar]
- Lv, G.F.; Wu, C.; Li, X.W. Research on foreign direct investment’s role in regional innovation capacity. Macroeconomics 2013, 6, 104–111. [Google Scholar]
- Wei, S.H.; Wu, G.S.; Lv, X.L. The determinants of regional innovation capability—Comment on the regional gap of innovation capability in China. China Soft Sci. 2010, 9, 76–85. [Google Scholar]
- Griliches, S. Issues in assessing the contribution of R&D to productivity growth. Bell J. Econ. 1979, 10, 92–116. [Google Scholar]
- Jiang, M.H.; Jia, X.H. The mechanism on industrial clusters’ impact on regional innovation capacity based on C-D production function: An empirical study. China Soft Sci. 2013, 6, 154–162. [Google Scholar]
- Feldman, M.P. The geographic sources of innovation: Technological infrastructure and product innovation in the United States. Ann. Assoc. Am. Geogr. 1994, 84, 210–229. [Google Scholar] [CrossRef]
- Scott, A.J. New Industrial Space; Pion: London, UK, 1988. [Google Scholar]
- Storper, M. The Regional World: Territorial Development in a Global Economy; The Guilford Press: New York, NY, USA, 1997. [Google Scholar]
- Zhang, Z.R. Regional difference mechanism of innovation in China—A case study from the perspective of new economic geography. Soft Sci. 2013, 6, 64–68. [Google Scholar]
- Gao, H. Effects of the use of patent documents on China’s regional innovation. Tech. Manag. Res. 2017, 4, 48–51. [Google Scholar]
- Jin, Q.H.; Yan, T.H. International technology spillover and regional innovation ability—An Empirical analysis based on the perspective of intellectual property. J. Int. Trade 2017, 3, 14–25. [Google Scholar]
- Li, C.; Qin, C.L.; Ren, J.H. Spatial spillovers, proximity and regional innovation: Evidence from China. Forum Sci. Tech. China 2017, 1, 47–52. [Google Scholar]
- Shao, Y.F.; Fan, Q.L.; Tang, X.W. The influencing factors of regional innovation capacity based on the endogenous growth model. Sci. Res. Manag. 2011, 32, 28–33. [Google Scholar]
- Tan, J.T.; Zhang, P.Y.; Li, Y. Spatio-temporal characteristics of regional innovation performance and its influencing factors in China. Sci. Geogr. Sin. 2016, 36, 39–46. [Google Scholar]
- Zhang, P.; Wu, J.N. Government intervention, resource curse and regional innovation: An empirical research based on the provincial panel data from Mainland China. Sci. Res. Manag. 2017, 38, 62–69. [Google Scholar]
- Gao, F. Double factors decomposition of space and power in China’s regional economic gap. Econ. Sci. 2012, 5, 5–17. [Google Scholar]
- Romer, P.M. Endogenous technological change. J. Political Econ. 1990, 98, 71–102. [Google Scholar] [CrossRef]
- Guan, J.C.; He, Y. The international comparative study on connection of science—technology—economy and innovation performance. J. Manag. Sci. China 2009, 12, 61–77. [Google Scholar]
- Zhang, Q.H. Regional inequality in contemporary China. Ann. Econ. Financ. 2012, 13, 113–137. [Google Scholar]
- Li, C.; Gibson, J. Rising regional inequality in China: Fact or artifact? World Dev. 2013, 47, 16–29. [Google Scholar] [CrossRef]
- Su, Y.; Li, B.Z.; Yu, D.K. Measure and equity of regional innovation system’s knowledge stock. China Soft Sci. 2012, 5, 157–174. [Google Scholar]
- Wu, Y.B. Evaluating technical efficiency and technical progress. J. Quant. Tech. Econ. 2008, 25, 67–79. [Google Scholar]
- Xiao, Z.L.; Feng, S.X.; Han, S.F. Efficiency measurement and improved method analysis of China’s high-tech industry two stages—Based on improving SBM directional distance function empirical. Ind. Econ. Res. 2012, 4, 10–18. [Google Scholar]
- Pan, X.F.; Zhang, W.W. China’s regional innovation convergence analysis basing on the perspective of spatial effect. J. Ind. Eng. Eng. Manag. 2013, 27, 63–67. [Google Scholar]
- Boschma, R. Proximity and innovation: A critical assessment. Reg. Stud. 2005, 39, 61–74. [Google Scholar] [CrossRef]
- Millo, G.; Piras, P. Splm: Spatial panel data models in R. J. Stat. Softw. 2012, 47, 1–38. [Google Scholar] [CrossRef]
- Zhang, X.L. Regional economic convergence mechanism in the Yangtze River delta: 1993~2006. J. World Econ. 2010, 3, 126–141. [Google Scholar]
- Wang, C.F.; Xu, H.B.; Zhang, G.P. Research of the gap of city’s innovation capability—An empirical study based on patent quality. J. Shandong Univ. 2014, 1, 74–80. [Google Scholar]
- Elhorst, J.P. Spatial Econometrics—From Cross-Sectional Data to Spatial Panels; Springer: London, UK, 2014. [Google Scholar]
Figure 1.
The evolution trend of China’s regional innovation capability difference during 1998–2013.
Figure 1.
The evolution trend of China’s regional innovation capability difference during 1998–2013.

Figure 2.
The trend and factors’ decomposition of China’s regional innovation capability difference in 1998–2013.
Figure 2.
The trend and factors’ decomposition of China’s regional innovation capability difference in 1998–2013.


Table 1.
The spatial factors decomposition of China’s regional innovation capability difference.
| Year | Absolute Value | Contribution Degree | |||||||
|---|---|---|---|---|---|---|---|---|---|
| Innovation Difference Value in Regions | |||||||||
| Eastern | Middle | Western | Northeastern | ||||||
| 1998 | 0.2021 | 0.1191 | 0.0830 | 0.0366 | 0.1798 | 0.3429 | 0.0762 | 58.93 | 41.07 |
| 1999 | 0.1641 | 0.1202 | 0.0439 | 0.0567 | 0.3439 | 0.3085 | 0.0473 | 73.25 | 26.75 |
| 2000 | 0.1464 | 0.0886 | 0.0578 | 0.0631 | 0.2421 | 0.1429 | 0.1417 | 60.52 | 39.48 |
| 2001 | 0.2028 | 0.1257 | 0.0771 | 0.1041 | 0.2571 | 0.2275 | 0.1277 | 61.98 | 38.02 |
| 2002 | 0.1736 | 0.1038 | 0.0698 | 0.0860 | 0.0956 | 0.3028 | 0.0855 | 51.18 | 48.82 |
| 2003 | 0.1741 | 0.1149 | 0.0592 | 0.1097 | 0.1512 | 0.1952 | 0.0590 | 66.00 | 34.00 |
| 2004 | 0.2047 | 0.1842 | 0.0205 | 0.1976 | 0.1915 | 0.0980 | 0.0460 | 89.99 | 10.01 |
| 2005 | 0.1448 | 0.1168 | 0.0280 | 0.1253 | 0.0768 | 0.0654 | 0.0427 | 90.63 | 9.37 |
| 2006 | 0.1217 | 0.1103 | 0.0114 | 0.1160 | 0.1655 | 0.0575 | 0.0128 | 90.63 | 9.37 |
| 2007 | 0.2153 | 0.1937 | 0.0216 | 0.2149 | 0.1067 | 0.0488 | 0.0061 | 89.97 | 10.03 |
| 2008 | 0.1636 | 0.1324 | 0.0312 | 0.1407 | 0.0874 | 0.0792 | 0.0108 | 80.93 | 19.07 |
| 2009 | 0.1519 | 0.1360 | 0.0159 | 0.0953 | 0.1777 | 0.0569 | 0.0199 | 89.53 | 10.47 |
| 2010 | 0.1508 | 0.1138 | 0.0370 | 0.1070 | 0.1638 | 0.0637 | 0.0410 | 75.46 | 24.54 |
| 2011 | 0.1059 | 0.0699 | 0.0360 | 0.0606 | 0.2288 | 0.0587 | 0.0547 | 66.01 | 33.99 |
| 2012 | 0.0988 | 0.0678 | 0.0310 | 0.0541 | 0.2816 | 0.0548 | 0.0594 | 68.62 | 31.38 |
| 2013 | 0.0901 | 0.0621 | 0.0280 | 0.0532 | 0.2810 | 0.0535 | 0.0580 | 68.92 | 31.08 |
Table 2.
The decomposition of four Chinese regions’ regional innovation capability difference factors in 1998–2013.
Table 2.
The decomposition of four Chinese regions’ regional innovation capability difference factors in 1998–2013.
| Year | Eastern Region | Middle Region | Western Region | Northeastern Region | ||||||||
|---|---|---|---|---|---|---|---|---|---|---|---|---|
| 1998 | 0.0971 | −0.0704 | 0.1070 | 0.2639 | −0.1752 | 0.3550 | 0.5862 | −0.0898 | 0.4328 | 0.6965 | −0.6466 | 0.7228 |
| 1999 | 0.0413 | −0.0097 | 0.0673 | 0.2317 | −0.1657 | 0.5097 | 0.7573 | −0.6262 | 0.9346 | 0.0439 | 0.0160 | 0.0313 |
| 2000 | 0.0328 | 0.0217 | 0.0414 | 0.3625 | −0.2245 | 0.4666 | 0.4897 | −0.5509 | 0.6939 | 0.0958 | 0.0858 | 0.0560 |
| 2001 | 0.0368 | 0.0395 | 0.0651 | 0.3158 | 0.0266 | 0.2306 | 0.5516 | −0.5230 | 0.7505 | 0.0512 | 0.0379 | 0.0898 |
| 2002 | 0.0366 | −0.0021 | 0.0882 | 0.0754 | 0.0552 | 0.0404 | 0.5458 | −0.2805 | 0.5834 | 0.0018 | 0.0792 | 0.0063 |
| 2003 | 0.1039 | −0.0403 | 0.1500 | 0.2180 | −0.0120 | 0.1633 | 0.3532 | −0.1436 | 0.3388 | 0.0132 | −0.0095 | 0.0684 |
| 2004 | 0.1098 | 0.0327 | 0.1652 | 0.0842 | −0.0533 | 0.2448 | 0.3559 | −0.2150 | 0.3130 | 0.0962 | −0.0421 | 0.0880 |
| 2005 | 0.0612 | −0.0024 | 0.1277 | 0.0562 | −0.0066 | 0.0834 | 0.2085 | −0.0928 | 0.1581 | 0.0003 | 0.0142 | 0.0286 |
| 2006 | 0.0514 | 0.0008 | 0.1153 | 0.0387 | 0.0743 | 0.0912 | 0.2159 | −0.2169 | 0.2745 | 0.1304 | −0.1980 | 0.2108 |
| 2007 | 0.0791 | 0.0168 | 0.1981 | 0.0933 | −0.0277 | 0.1344 | 0.1396 | −0.1016 | 0.1504 | 0.1267 | −0.1978 | 0.2040 |
| 2008 | 0.0403 | 0.0179 | 0.1229 | 0.0612 | 0.0243 | 0.0631 | 0.1336 | 0.0046 | 0.0745 | 0.0904 | −0.0942 | 0.1160 |
| 2009 | 0.0119 | 0.0309 | 0.0641 | 0.0445 | 0.0983 | 0.0794 | 0.1475 | −0.0132 | 0.0701 | 0.0904 | −0.1552 | 0.1160 |
| 2010 | 0.0409 | 0.0384 | 0.0687 | 0.0398 | 0.1077 | 0.0561 | 0.2363 | −0.0505 | 0.1132 | 0.0685 | −0.1476 | 0.1886 |
| 2011 | 0.0237 | 0.0266 | 0.0340 | 0.0301 | 0.1748 | 0.0540 | 0.1523 | −0.2136 | 0.2723 | 0.0517 | −0.0444 | 0.1210 |
| 2012 | 0.0252 | 0.0218 | 0.0321 | 0.0455 | 0.2219 | 0.0597 | 0.1077 | −0.0382 | 0.0930 | 0.0846 | 0.0174 | 0.0419 |
| 2013 | 0.0248 | 0.0210 | 0.0301 | 0.0441 | 0.2107 | 0.0503 | 0.1032 | −0.0357 | 0.1210 | 0.0789 | 0.0201 | 0.0628 |
Table 3.
Econometric estimation of China’s regional innovation capability convergence model in 1998–2013.
Table 3.
Econometric estimation of China’s regional innovation capability convergence model in 1998–2013.
| Region | Period | 1998–2013 (KKP Model) | 1998–2013 (Other Models) | |||||||||
|---|---|---|---|---|---|---|---|---|---|---|---|---|
| Model | Adjusted-R2 | Hausman | ||||||||||
| Country | Y | −0.148 | −0.023 | 0.579 *** | −0.999 *** | 0.061 * | ||||||
| (0.20) | (0.29) | (0.00) | (0.00) | (0.09) | ||||||||
| C | −0.055 | −0.002 | 0.588 *** | −0.999 *** | 0.054 | −0.04 | 0.386 *** | −1.247 *** | 0.571 | |||
| (0.63) | (0.93) | (0.00) | (0.00) | (0.11) | (0.84) | (0.01) | (0.00) | |||||
| H | −0.178 | 0.016 | −0.999 *** | 0.583 *** | 0.070 * | |||||||
| (0.49) | (0.53) | (0.00) | (0.00) | (0.07) | ||||||||
| N | 0.073 | 0.021 | 0.030 *** | −0.025 | 0.006 | 0.023 | −0.315 ** | −0.308 | 0.663 | |||
| (0.45) | (0.21) | (0.00) | (0.45) | (0.78) | (0.16) | (0.06) | 0.272 | |||||
| Eastern region | Y | −0.093 | −0.028 | 0.000 | 0.000 | 0.007 | −0.032 * | 0.575 | 23.4 *** | |||
| (0.36) | (0.22) | (0.90) | (0.73) | (0.85) | (0.10) | (0.00) | ||||||
| C | −0.101 | −0.024 | 0.000 | 0.000 | 0.000 | −0.376 *** | 0.641 | 17.1 *** | ||||
| (0.24) | (0.27) | (0.74) | (0.94) | (0.95) | (0.00) | (0.00) | ||||||
| H | −0.117 | −0.022 | 0.000 | 0.000 | 0.000 | −0.335 *** | 0.711 | 2.54 * | ||||
| (0.31) | (0.42) | (0.96) | (0.94) | (0.71) | (0.00) | (0.09) | ||||||
| N | −0.025 | −0.016 | 0.000 | 0.000 | 0.001 | −0.023 | −0.016 | 0.255 | 0.271 | |||
| (0.70) | (0.27) | (0.94) | (0.76) | (0.79) | (0.72) | (0.28) | (0.60) | |||||
| Middle region | Y | −0.310 | −0.026 | 0.000 | 0.000 | 0.000 | −0.165 | −0.001 | 0.553 | 1.53 | ||
| (0.48) | (0.70) | (0.88) | (0.68) | (0.98) | (0.69) | (0.98) | (0.22) | |||||
| C | −0.038 | 0.025 | 0.000 | 0.000 | 0.000 | 0.053 | 0.042 | 0.478 | 1.64 | |||
| (0.93) | (0.70) | (0.76) | (0.85) | (0.97) | (0.90) | (0.51) | (0.20) | |||||
| H | −0.095 | 0.016 | 0.000 | 0.000 | 0.000 | 0.054 | 0.041 | 0.487 | 0.903 | |||
| (0.83) | (0.82) | (0.77) | (0.55) | (0.64) | (0.90) | (0.52) | (0.34) | |||||
| N | 0.009 | 0.001 | 0.000 | 0.000 | 0.037 | 0.052 * | 0.417 | 3.69 ** | ||||
| (0.93) | (0.97) | (0.86) | (0.90) | (0.55) | (0.07) | (0.05) | ||||||
| Western region | Y | −0.935 *** | −0.104 ** | 0.000 | 0.000 | 0.056 | −0.725 ** | −0.082 * | 0.781 | 1.72 | ||
| (0.01) | (0.04) | (0.36) | (0.23) | (0.38) | (0.04) | (0.10) | (0.19) | |||||
| C | −0.671 ** | −0.064 | 0.000 | 0.000 | 0.000 | −0.309 *** | 0.523 | 22.43 *** | ||||
| (0.04) | (0.21) | (0.95) | (0.96) | (0.97) | (0.00) | (0.00) | ||||||
| H | −0.462 | −0.011 | 0.000 | 0.000 | 0.000 | −0.397 *** | 0.717 | 32.33 *** | ||||
| (0.32) | (0.87) | (0.89) | (0.78) | (0.22) | (0.00) | (0.00) | ||||||
| N | 0.171 | 0.053 | 0.000 | 0.000 | 0.000 | −0.049 | 0.32 | 2.84 * | ||||
| (0.63) | (0.32) | (0.25) | (0.17) | (0.34) | (0.56) | (0.09) | ||||||
| Northeastern region | Y | −0.942 ** | −0.194 ** | 0.000 | 0.000 | 0.000 | −0.684 *** | 0.414 | 13.56 *** | |||
| (0.04) | (0.04) | (0.85) | (0.58) | (0.99) | (0.00) | (0.00) | ||||||
| C | −0.847 * | −0.173 * | 0.000 | 0.000 | 0.000 | −0.668 *** | 0.401 | 11.72 *** | ||||
| (0.06) | (0.06) | (0.97) | (0.12) | (0.49) | (0.00) | (0.00) | ||||||
| H | −0.777 ** | −0.167 ** | 0.001 | −0.001 | 0.000 | −0.721 *** | 0.362 | 13.44 *** | ||||
| (0.04) | (0.04) | (0.20) | (0.18) | (0.31) | (0.00) | (0.00) | ||||||
| N | 0.201 | 0.040 | 0.001 | −0.161 *** | 0.000 | 0.057 | 0.378 | 3.77 ** | ||||
| (0.40) | (0.42) | (0.12) | (0.00) | (0.99) | (0.55) | (0.49) | ||||||
Note: The symbol of ***, ** and * indicates 1%, 5% and 10%, respectively. Due to the limited space, the process of selecting optimal model is omitted.
Table 4.
Econometric estimation of China’s regional innovation capability convergence model in 2007–2013.
Table 4.
Econometric estimation of China’s regional innovation capability convergence model in 2007–2013.
| Region | Model | Adjusted-R2 | Hausman | |||||
|---|---|---|---|---|---|---|---|---|
| Country | Y | −0.501 *** | −0.097 *** | −0.282 | 0.148 | 0.191 * | ||
| (0.006) | (0.000) | (0.749) | (0.818) | (0.090) | ||||
| C | −0.419 ** | −0.067 ** | −0.403 | 0.240 | 0.182 * | |||
| (0.019) | (0.015) | (0.607) | (0.628) | (0.100) | ||||
| H | 0.102 | 0.033 | 0.565 *** | −0.999 * | 0.166 | |||
| (0.568) | (0.333) | (0.005) | (0.070) | (0.127) | ||||
| N | −0.267 *** | −0.062 *** | 0.089 | −0.822 | 0.000 | |||
| (0.006) | (0.000) | (0.800) | (0.830) | (0.984) | ||||
| Eastern region | Y | −0.559 *** | −0.182 *** | 0.461 | 0.504 | |||
| (0.000) | (0.000) | (0.478) | ||||||
| C | −0.409 *** | 0.624 | 29.414 *** | |||||
| (0.000) | (0.000) | |||||||
| H | −0.236 ** | −0.064 ** | 0.709 | 0.009 | ||||
| (0.047) | (0.019) | (0.923) | ||||||
| N | −0.395 *** | 0.603 | 24.212 *** | |||||
| (0.000) | (0.000) | |||||||
| Middle region | Y | −0.560 *** | 0.572 | 12.373 *** | ||||
| (0.000) | (0.000) | |||||||
| C | −0.745 | −0.133 * | 0.814 | 1.698 | ||||
| (0.130) | (0.097) | (0.193) | ||||||
| H | −0.228 | 0.471 | 11.574 *** | |||||
| (0.316) | (0.000) | |||||||
| N | 0.205 | 0.393 | 7.545 *** | |||||
| (0.127) | (0.005) | |||||||
| Western region | Y | −0.739 *** | 0.607 | 71.55 *** | ||||
| (0.000) | (0.000) | |||||||
| C | −1.077 *** | 0.670 | 95.41 *** | |||||
| (0.000) | (0.000) | |||||||
| H | −0.959 *** | 0.572 | 64.12 *** | |||||
| (0.000) | (0.000) | |||||||
| N | −0.106 ** | 0.105 | 60.11 *** | |||||
| (0.020) | (0.000) | |||||||
| Northeastern region | Y | −0.764 *** | 0.667 | 25.318 *** | ||||
| (0.001) | (0.000) | |||||||
| C | −0.960 *** | 0.584 | 15.23 *** | |||||
| (0.002) | (0.000) | |||||||
| H | −0.593 ** | 0.423 | 13.17 *** | |||||
| (0.017) | (0.000) | |||||||
| N | −0.463 * | 0.551 | 21.27 *** | |||||
| (0.080) | (0.000) |
Note: (1) The symbol of ***, ** and * indicates 1%, 5% and 10% respectively. Due to the limited space, the process of selecting optimal model is omitted. (2) Since N>>T and T is relatively smaller, space random effect model is selected to avoid the far loss of degree of freedom [55]. Due to the limited space, the process of selecting optimal model is omitted.
© 2017 by the authors. Licensee MDPI, Basel, Switzerland. This article is an open access article distributed under the terms and conditions of the Creative Commons Attribution (CC BY) license (http://creativecommons.org/licenses/by/4.0/).
Share and Cite
MDPI and ACS Style
Xiao, Z.; Du, X.; Wu, C. Regional Difference and Evolution and Convergence of Innovation Capability in China: Research on Space and Factorial Levels. Sustainability 2017, 9, 1644. https://doi.org/10.3390/su9091644
AMA Style
Xiao Z, Du X, Wu C. Regional Difference and Evolution and Convergence of Innovation Capability in China: Research on Space and Factorial Levels. Sustainability. 2017; 9(9):1644. https://doi.org/10.3390/su9091644
Chicago/Turabian StyleXiao, Zelei, Xinya Du, and Chuanqing Wu. 2017. "Regional Difference and Evolution and Convergence of Innovation Capability in China: Research on Space and Factorial Levels" Sustainability 9, no. 9: 1644. https://doi.org/10.3390/su9091644
Note that from the first issue of 2016, this journal uses article numbers instead of page numbers. See further details here.