Assessing Structural Connectivity of Urban Green Spaces in Metropolitan Hong Kong


1
State Key Laboratory of Earth Surface Processes and Resource Ecology, School of Natural Resources, Faculty of Geographical Science, Beijing Normal University, Beijing 100875, China
2
Department of Geography, The University of Hong Kong, Hong Kong, China
*
Author to whom correspondence should be addressed.
Sustainability 2017, 9(9), 1653; https://doi.org/10.3390/su9091653
Submission received: 12 August 2017
/
Revised: 11 September 2017
/
Accepted: 13 September 2017
/
Published: 19 September 2017
(This article belongs to the Section Sustainable Urban and Rural Development)
Abstract
:Connectivity is a vital element in landscape structure because of its importance in species–landscape interactions. Connectivity analysis of green spaces in urban landscapes, especially in high-density cities such as Hong Kong, differs from that of habitats in natural or rural landscapes. Using the human being as the target species, we formulated with GIS techniques a resistance weight, a structural connectivity index and an ecological barrier effect index to assess connectivity of green spaces. Two factors were included in the modeling, namely the resistance of different land uses related to human activities, and the distance between different urban green spaces. We analyzed the relationships between the connectivity index of green spaces and green cover, elevation, building density and population density. Our results indicate that low connectivity usually occurs in both old and new town centers with high building density and low green cover, and in areas occupied by land uses with a high resistance weight. However, urban density may not necessarily have a negative influence on the structural connectivity of green spaces. Green cover also may not necessarily have positive impact on connectivity if the green spaces have a poor spatial pattern. Adding more green stepping stones, large green spaces and green corridors to form greenways and shortening the distance between urban green spaces can offer a spatial-planning strategy to increase the green space connectivity in Hong Kong. The study provides insights to optimize connectivity of green spaces to improve the urban living environment in high-density metropolises.
1. Introduction
Connectivity is a key characteristic of the ecological network [1] and is the basic principle for regional, urban, land use and infrastructure plans at the strategic and landscape levels [2,3]. Landscape connectivity, which was firstly introduced in 1984 by G. Merriam [4], is defined as “a functional parameter that measures the processes of sub-populations of organisms’ interconnection to a functional demographic unit” [5]. It involves linkages of habitats, species, communities and ecological processes at multiple spatial and temporal scales, and influences biophysical processes and biogeochemical functions [6]. Connectivity includes structural and functional connectivity. Structural connectivity is the physical connectivity and can be measured by assessing configuration, proximity or connectivity among landscape elements (edge or patch) along with landscape structure. Functional connectivity is the behavioral response to the landscape elements [7]. It can be analyzed by a species’ movement behavior in the landscape by testing dispersal success, search time and cell immigration, and comparing movement frequencies and weighing distances between points [8,9]. Previous researches have addressed the definition and application of landscape connectivity especially structural connectivity [7,10]. They focus on forming ecological network [10], analyzing the effects of connectivity on focal species or biodiversity [8,11]; increasing ecosystem services [12], factors influencing connectivity [3,13], relationships between connectivity and urban green infrastructure [14], etc. However, few studies touched on the assessment of structural connectivity of green spaces and the underlying factors in extremely dense cities such as Hong Kong, using people as the target population moving among the green patches. Here, green space is defined as the natural environment covered by trees, shrubs, grasses and climbing plants. Green cover is the percentage of green space area to total land area.
In the urban context, connectivity of green spaces not only increases green cover, improves micro-climate and other ecological functions [15], but also puts people closer to nature to usher better physical and mental health [16]. It also provides better living environment and increases economic values such as urban landscape quality and tourism potential. Understanding the distribution and connectivity of green spaces could help identifying critical habitat patches to maintain the connectivity [17] to enhance people’s enjoyment and recreation. Most studies of landscape connectivity were confined to a natural or rural landscape [5,18]. For the built environment, people are the target species moving through the built-up matrix among the green spaces. Some land uses can hinder people’s access to green spaces [19] and produce different barrier effects [2,13,20].
A livable residential area is expected to have a high green cover with diverse vegetation configurations of trees, shrubs, herbs, lawns, climbers and perhaps also bamboos. The green spaces should be well connected and distributed throughout the built-up areas, including urban parks, sitting out areas, children’s playgrounds, side yards, roadsides, and green strips adjoining buildings. In topographically rugged areas such as Hong Kong, elevation and landform may play significant roles in the development of green spaces. The spatial pattern of green spaces can considerably influence connectivity and patronage. However, it remains unclear how the green spaces were structurally connected, and whether the green cover, elevation and urban density (indicated by population density and building density) play significant roles in connectivity in compact cities [21].
Models based on GIS technology and other disciplines such as cellular automation models [22], CONNECT models [23], conductance index [24] and other derived models [25] are useful in assessing landscape connectivity and setting up networks within heterogeneous landscapes. The development of the connectivity models usually requires spatial data on land use maps, barrier or resistance index and habitat distributions. In this study, the resistance of land uses related to people’s activities were analyzed using PathDistance module in ArcGis 9.0 to model the ecological barrier effect index and the structural connectivity index of green spaces in the built environment in Hong Kong, assisted by the techniques of “3S” and statistics. The study aims at providing recommendations to enhance structural connectivity of green spaces and to improve the quality of the urban living environment in compact cities such as Hong Kong.
2. Materials and Methods
2.1. Study Area
Hong Kong is one of the most densely populated cities having experienced rapid urbanization in the world. It has followed the high-rise, high-density and multiple intensive land-use development modes during the latter part of the 20th century, and demonstrates almost all the attributes of a compact city [26]. Built-up areas in Hong Kong are characterized by skyscrapers, narrow roads and pedestrian walkways, intense air pollution, and an extreme shortage of green cover. Green spaces are integral to the daily life and work of the residents and influence the quality of urban life. Most residential areas have few green spaces, punctuated by some elevated greeneries in small pots on the balconies, windowsills and building roofs, and occasional climbers on small pergolas in the sitting out areas. The congested residential areas are attributed to population as well as building density. Furthermore, the terrain of Hong Kong is rugged with about 30% steeper than 30°, with little natural flat land in Hong Kong Island (HKI) and Kowloon (K), where the majority of population lives. The rugged topography, which has 80% of the land as steep hillslopes, severely restricts the supply of easily developable lands, but provides a green hilly backdrop to the city [27]. The connectivity of green spaces is especially important for local residents to experience nature and alleviate mental and physical press in built-up areas [28].
Table 1 displays the areas, population density and green cover of typical towns in the built-up areas of Hong Kong. Of the 13 selected towns, only three towns, Southern, Tai Po and Tsuen Wan, have higher green cover than the national standard for garden city in China. Only Southern and Tai Po have higher green cover per capita than the national standard for garden city in China. The old Yau Tsim Mong represents the town with lowest green cover and one of the lowest green cover per capita of. Kwai Tsing represents the first generation new town with lower population density and higher green cover than most other towns; Tai Po represents the second generation new town with highest green cover and green cover per capita of the new towns. Tseung Kwan O represents the latest generation new town with one of the lowest population densities and higher green cover and green cover per capita than most other towns.
2.2. Modeling Ecological Barrier Effect Index and Connectivity Index
Orthophoto and B5000 digital maps with 0.5-m resolution were purchased from the Hong Kong government. Then GIS techniques were used to derive maps of green spaces (to calculate green cover) and other land uses such as buildings and different kinds of roads to obtain their distributions. Elevation information was extracted from the LANDFILL layers of the B5000 digital maps in five categories: 0–100, 100–200, 200–400, 400–700, and >700 m. To facilitate calculation, these landfill data were standardized as values between 0 and 1, and the average values for each cell are retained. Thus, the corresponding standardized values of elevation are 0.05, 0.15, 0.3, 0.55, and 0.85. The Tertiary Planning Unit/Street Block system (TPUs) with 2015 population data [29,30] was used as the basic unit to calculate population density and building density. Building area is defined as the area limited by building block outline and building outline under elevated structure. This definition is derived from the data of BLDG.cov of B5000 digital maps. In the same file, buildings are classified into several types: BP, building block outline; and BUP, building outline under elevated structure. BP and BUP are used to calculate the building areas.
Building density was formulated as follows [30]:
where in the given TPU, BDi is the building density in land use i, and is measured in meters; BHij is the building height of building j in land use i, and is measured in meters; BAij is the building area (including the areas of BP and BUP) of building j in land use i, and is measured in square meters (m2); and ALUi: the area of land use i, and is measured in square meters (m2).
Table 2 summarizes the resources and references of data collection and analyses of green cover, elevation, population density and building density.
The path distance module in ArcGIS 9.0 calculates the least-accumulative-cost distance to the nearest sources with the original source layer (green space map), the surface elevation layer, and the cost raster layer (resistance weight map, defined as below). Thus, it was used to model the barrier effect index and structural connectivity index. To facilitate explanations and comparisons, a decimal scale method and a Napierian logarithm with a natural log scale [2] were used in the models.
2.2.1. Defining Resistance Weight (RW)
Resistance weight (RW) was defined as an index used to assess the relative restriction imposed by different land uses on people’s access to the green spaces. It is a relative value and can be used in comparative analysis. Its value is assumed to range between 0 and 1. It was calculated based on a rating and weighting method (RAW method) [31,32] (for a review of this popular method and its application, see [33]), the Delphi method [34] and former studies such as those on transportation [35]. A land use with insignificant or no resistance to pass through is assigned a RW of 0, and a land use with the highest resistance (no way to pass through) is given a RW of 1 (Table 3). A land use that has limited passage is given a RW of 0–1 according to the transit time. The resistance weight map, which is one of the three maps used in path distance module to model the barrier effect index, was formed with RWs of different land uses (Table 3).
2.2.2. Modeling Ecological Barrier Effect Index (EBEI)
Barrier effect index is usually calculated using the Cost Distance module in ArcGIS [37,38]. In this study, using human being as target species, we introduced accumulative cost distance, the Path Distance function module in ArcGIS 9.2, to describe the accumulative barrier effect of different land uses, and to model the structural connectivity of green spaces in Hong Kong.
The barrier effect index (BEI) is modeled as follows:
where, for the given area, BEIi is the barrier effect index; di is the path distance; and dmax and dmin are the maximum and minimum path distances, respectively.
As mentioned above, in addition to the barrier effects of land uses, travel cost and time consumption are also important factors affecting the connectivity of urban green spaces. Thus, the landscape connectivity of urban green spaces is not only determined by the barrier effect of land uses, but also the nearest neighbor distance (nd) between different green spaces, which is calculated by analyzing the distances between the centroid of one piece of green space and the centroid of the nearest green space.
For a given region j, the DI is modeled as
where DIj is the total distance between different urban green spaces in region j; ndi is the average Euclidean distance from the centroid of one piece green space to the centroid of the nearest green space; ndj is the summation of all average Euclidean distances from the centroid of one piece of green space to the centroid of the nearest green space in region j; and ndmax and ndmin are the corresponding maximum and minimum distances between different urban green spaces in the given area, respectively.
The ecological barrier effect index (EBEI) is then formulated by summing BEI and DI. For the given area, the ecological barrier effect index is modeled as follows:
where EBEIj is the ecological barrier effect index between different urban green spaces in region j; BEIij is the barrier effect index in region j; and n is the number of green spaces in region j.
2.2.3. Modeling Structural Connectivity Index
For region j, the structural connectivity index (CI) is modeled as
where CIj is the structural connectivity index of green spaces in region j, where the value of CI ranges from 0 to 10; and EBEImax and EBEImin are the corresponding maximum and minimum ecological barrier effect indices in the given area.
2.2.4. Assessment on the Factors Influencing the Green Space Connectivity
To test the hypothesis that green cover, elevation and urban density play significant roles in green space connectivity, the relationships between the connectivity index of green spaces and green cover, population density, building density and elevation were analyzed based on TPUs. Because the factors are related to each other, partial correlation analysis in SPSS 16.0 was used.
3. Results
3.1. Distributions of Green Cover, Population Density and Building Density and Their Relationships
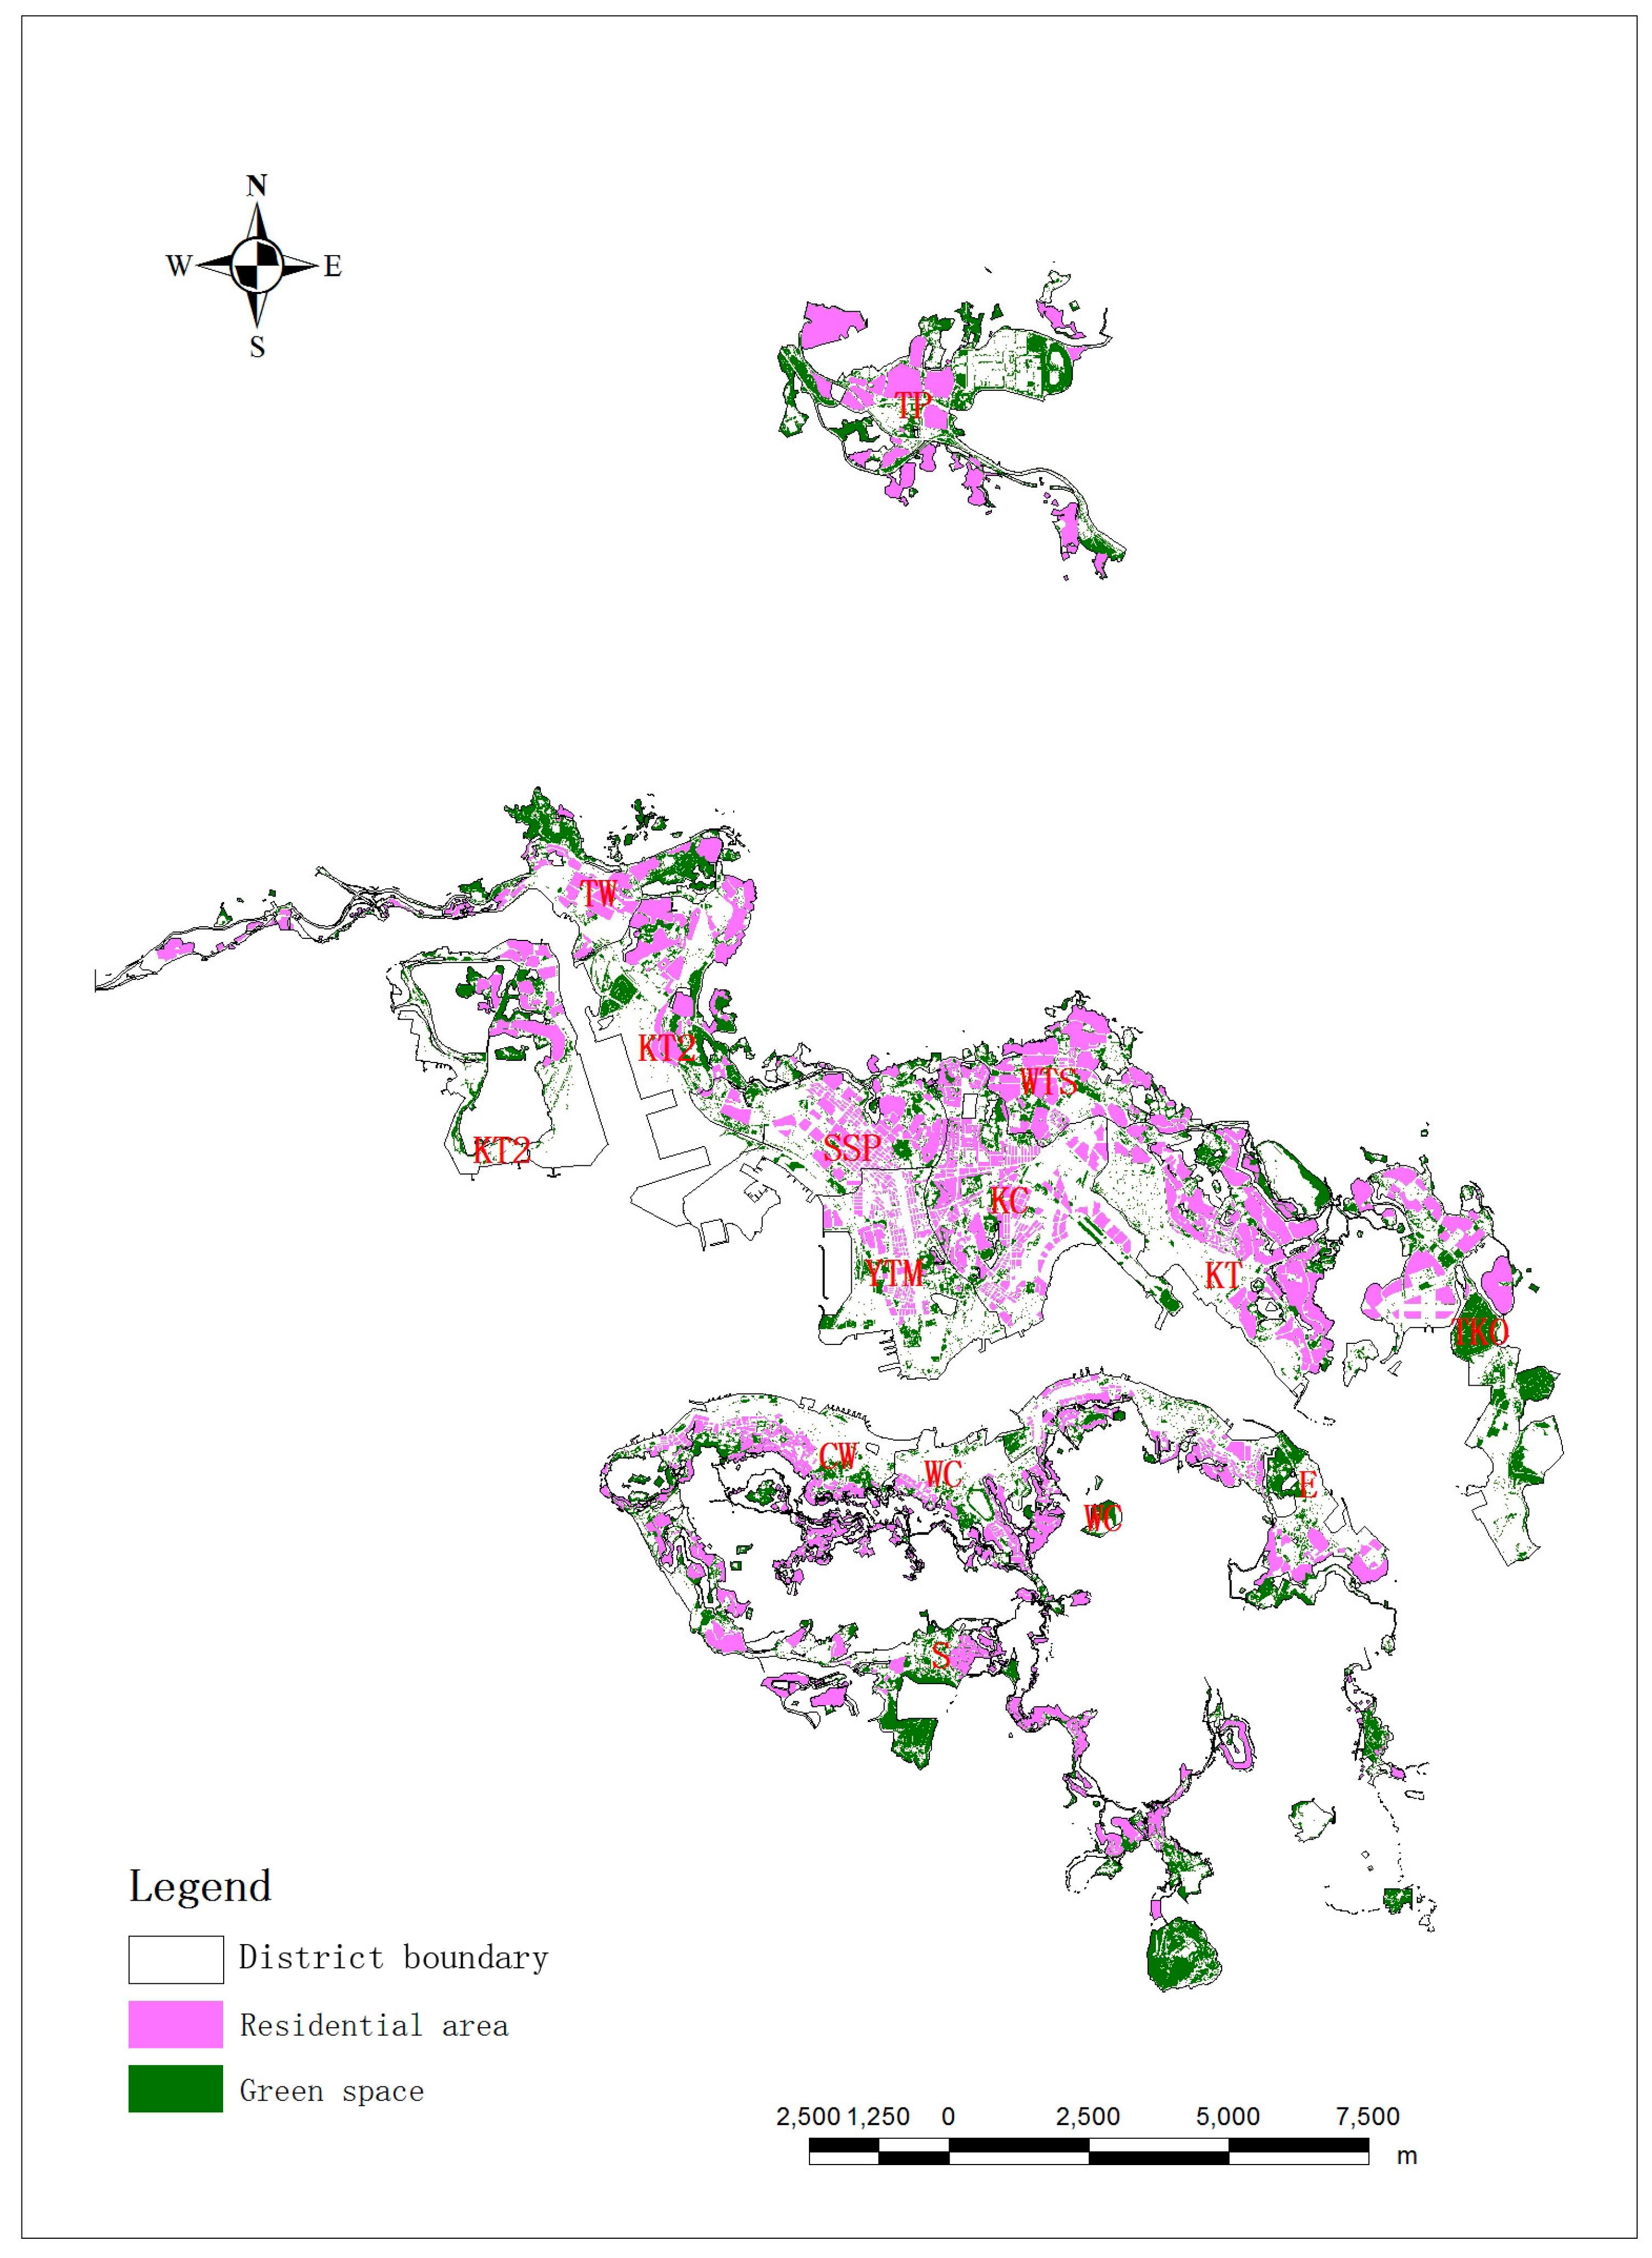
Figure 1 displays the distributions of residential areas and green spaces in the towns. Figure 1 shows that residential areas are distributed along the seaside in old towns and at the centers of new towns. However, the green spaces are largely concentrated in the urban fringe and protected areas. The new towns all have higher percentage green cover than most old towns. Along the coastline in the built-up areas, green spaces are highly fragmented or even non-existent.
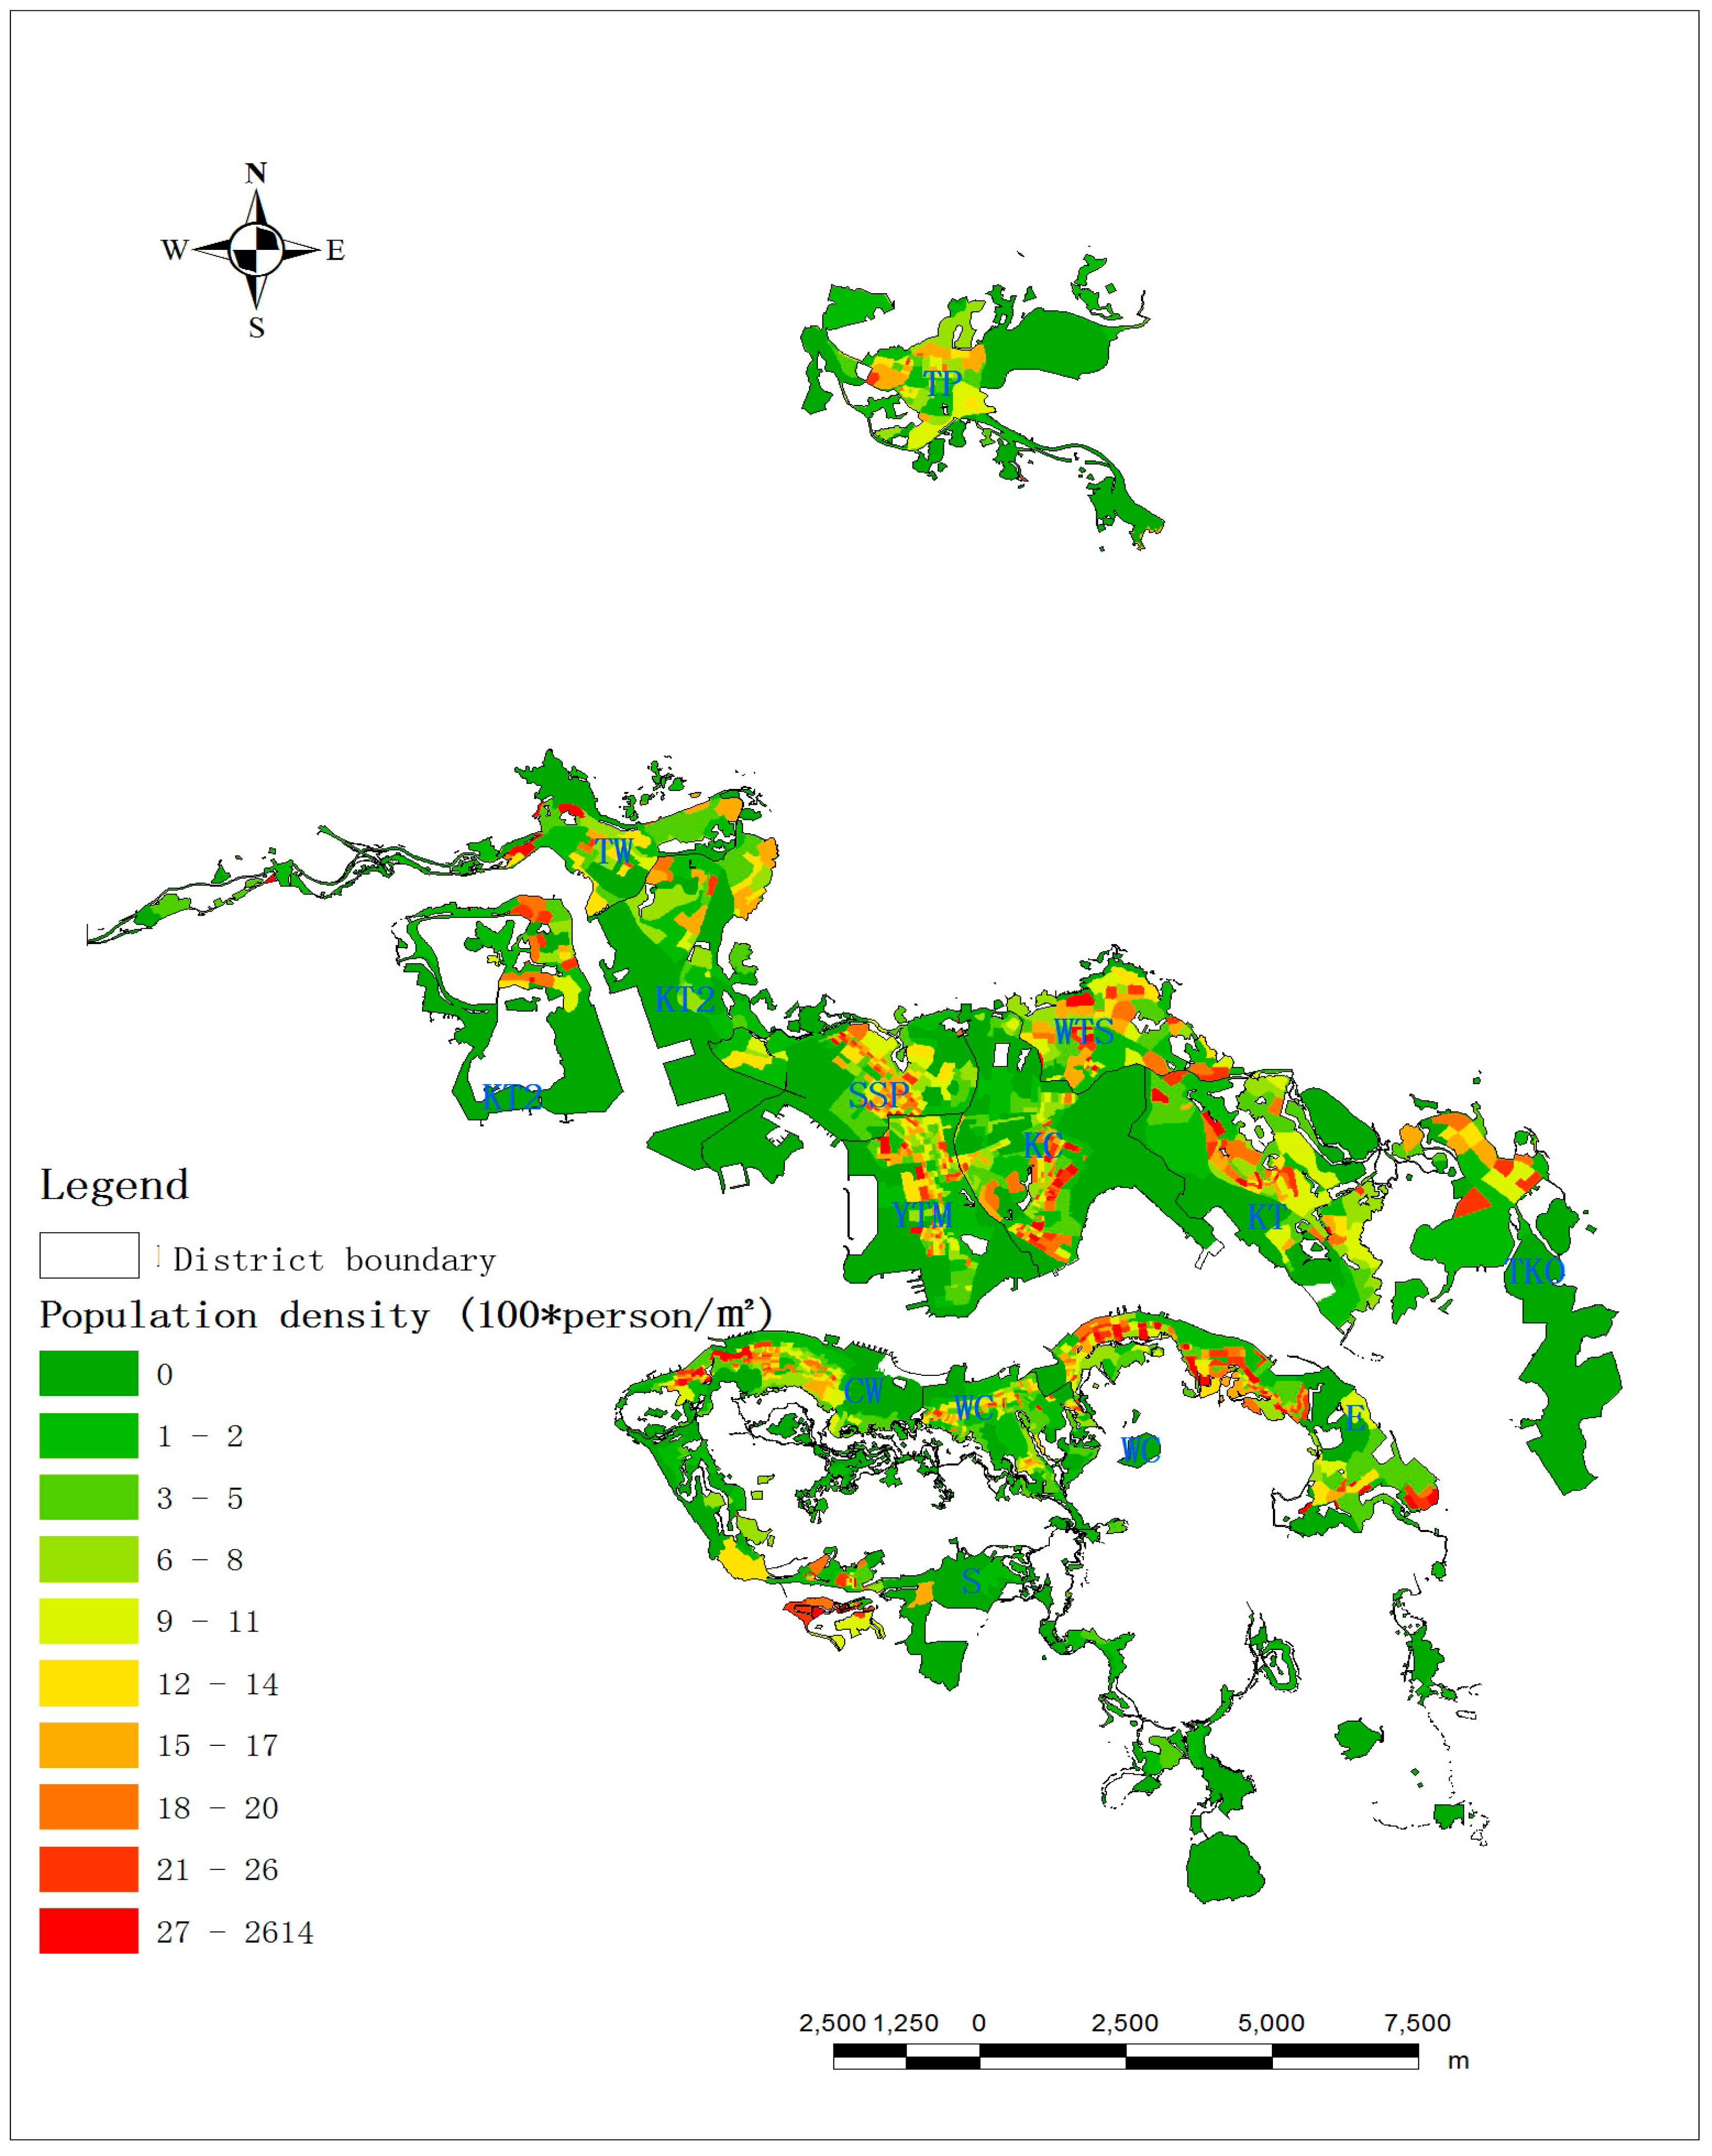
Figure 2 and Figure 3 display the distributions of population density and building density based on TPUs in Hong Kong. Figure 2 displayed that the population is concentrated in the built-up areas of Kowloon, in some parts of the districts in New Territories and along the coastline of Hong Kong Island. Some regions have comparatively higher population density, such as the center of Tai Po, Kwun Tong and Tseung Kwan O, most part of Yau Tsim Mong, Wong Tai Sin, Sham Shui Po, Kowloon City and Eastern, along the coastline of Central and Western and Wan Chai, and the small southeastern part of Southern. The distribution of building density is similar to the distribution of population density. The buildings are concentrated in Kowloon, along the coastline of Hong Kong Island and in some parts of the districts in New Territories. Most part of Central and Western, center of Wong Tai Sin, a small part of northeastern Kwai Tsing have higher building densities. Most parts of Southern, Central and Western, Wan Chai, Kwun Tong and Tseung Kwan O have comparatively lower building densities.
Table 4 shows the Pearson correlation relationships between green cover, green cover per capita, population density and building density in the built-up areas of Hong Kong. Both population density and building density play weak or very weak negative roles in green cover per capita in almost all districts except Wong Tai Sin (the role is positive). They also play strong positive roles in green cover in Wong Tai Sin, Kowloon and the whole study area with r values within 0.6–1.0 [39]. In most other districts, the roles of population density (except in Central and Western, Southern and Kowloon City) and building density are always weak or very weak with r values below 0.6. Elevation always plays positive roles in green cover per capita in most districts except Tseung Kwan O. The roles are strong or very strong in Eastern, Sham Shui Po, Wong Tai Sin and Kowloon. The roles are moderate in Central and Western, Wan Chai, Kwun Tong, Kwai Tsing and the whole study area.
3.2. Distributions of Distance Index and Connectivity Index
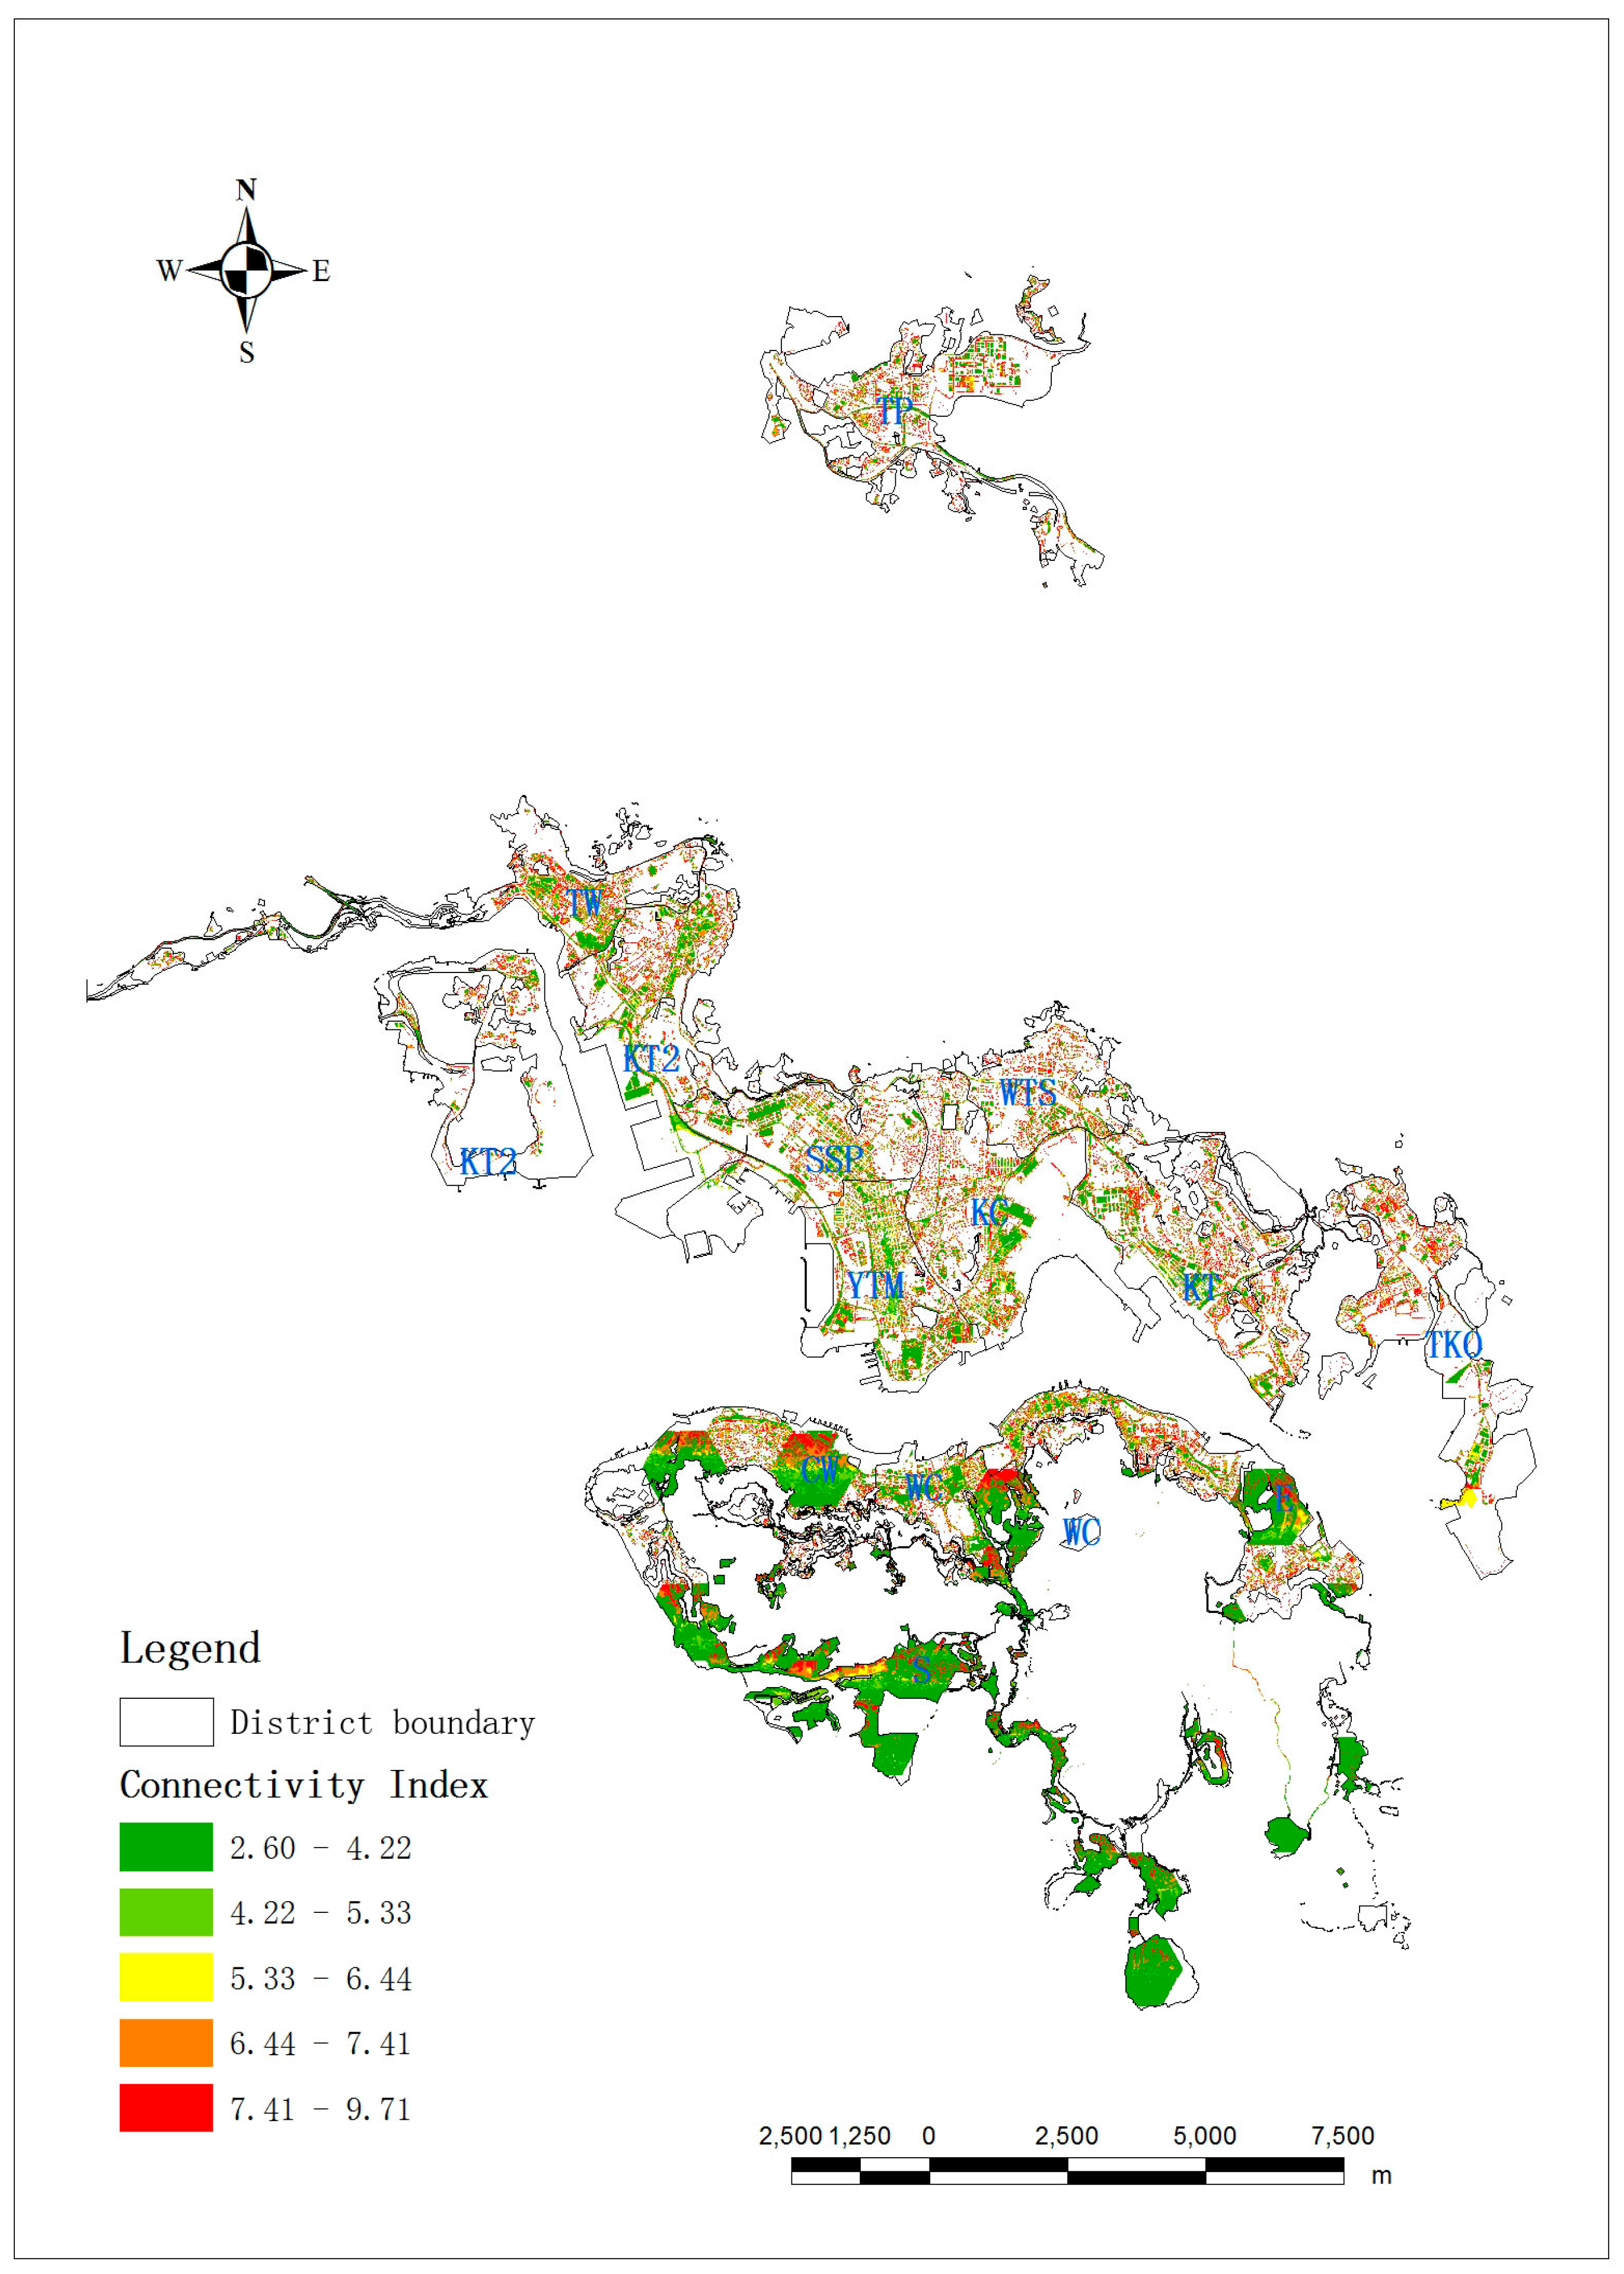
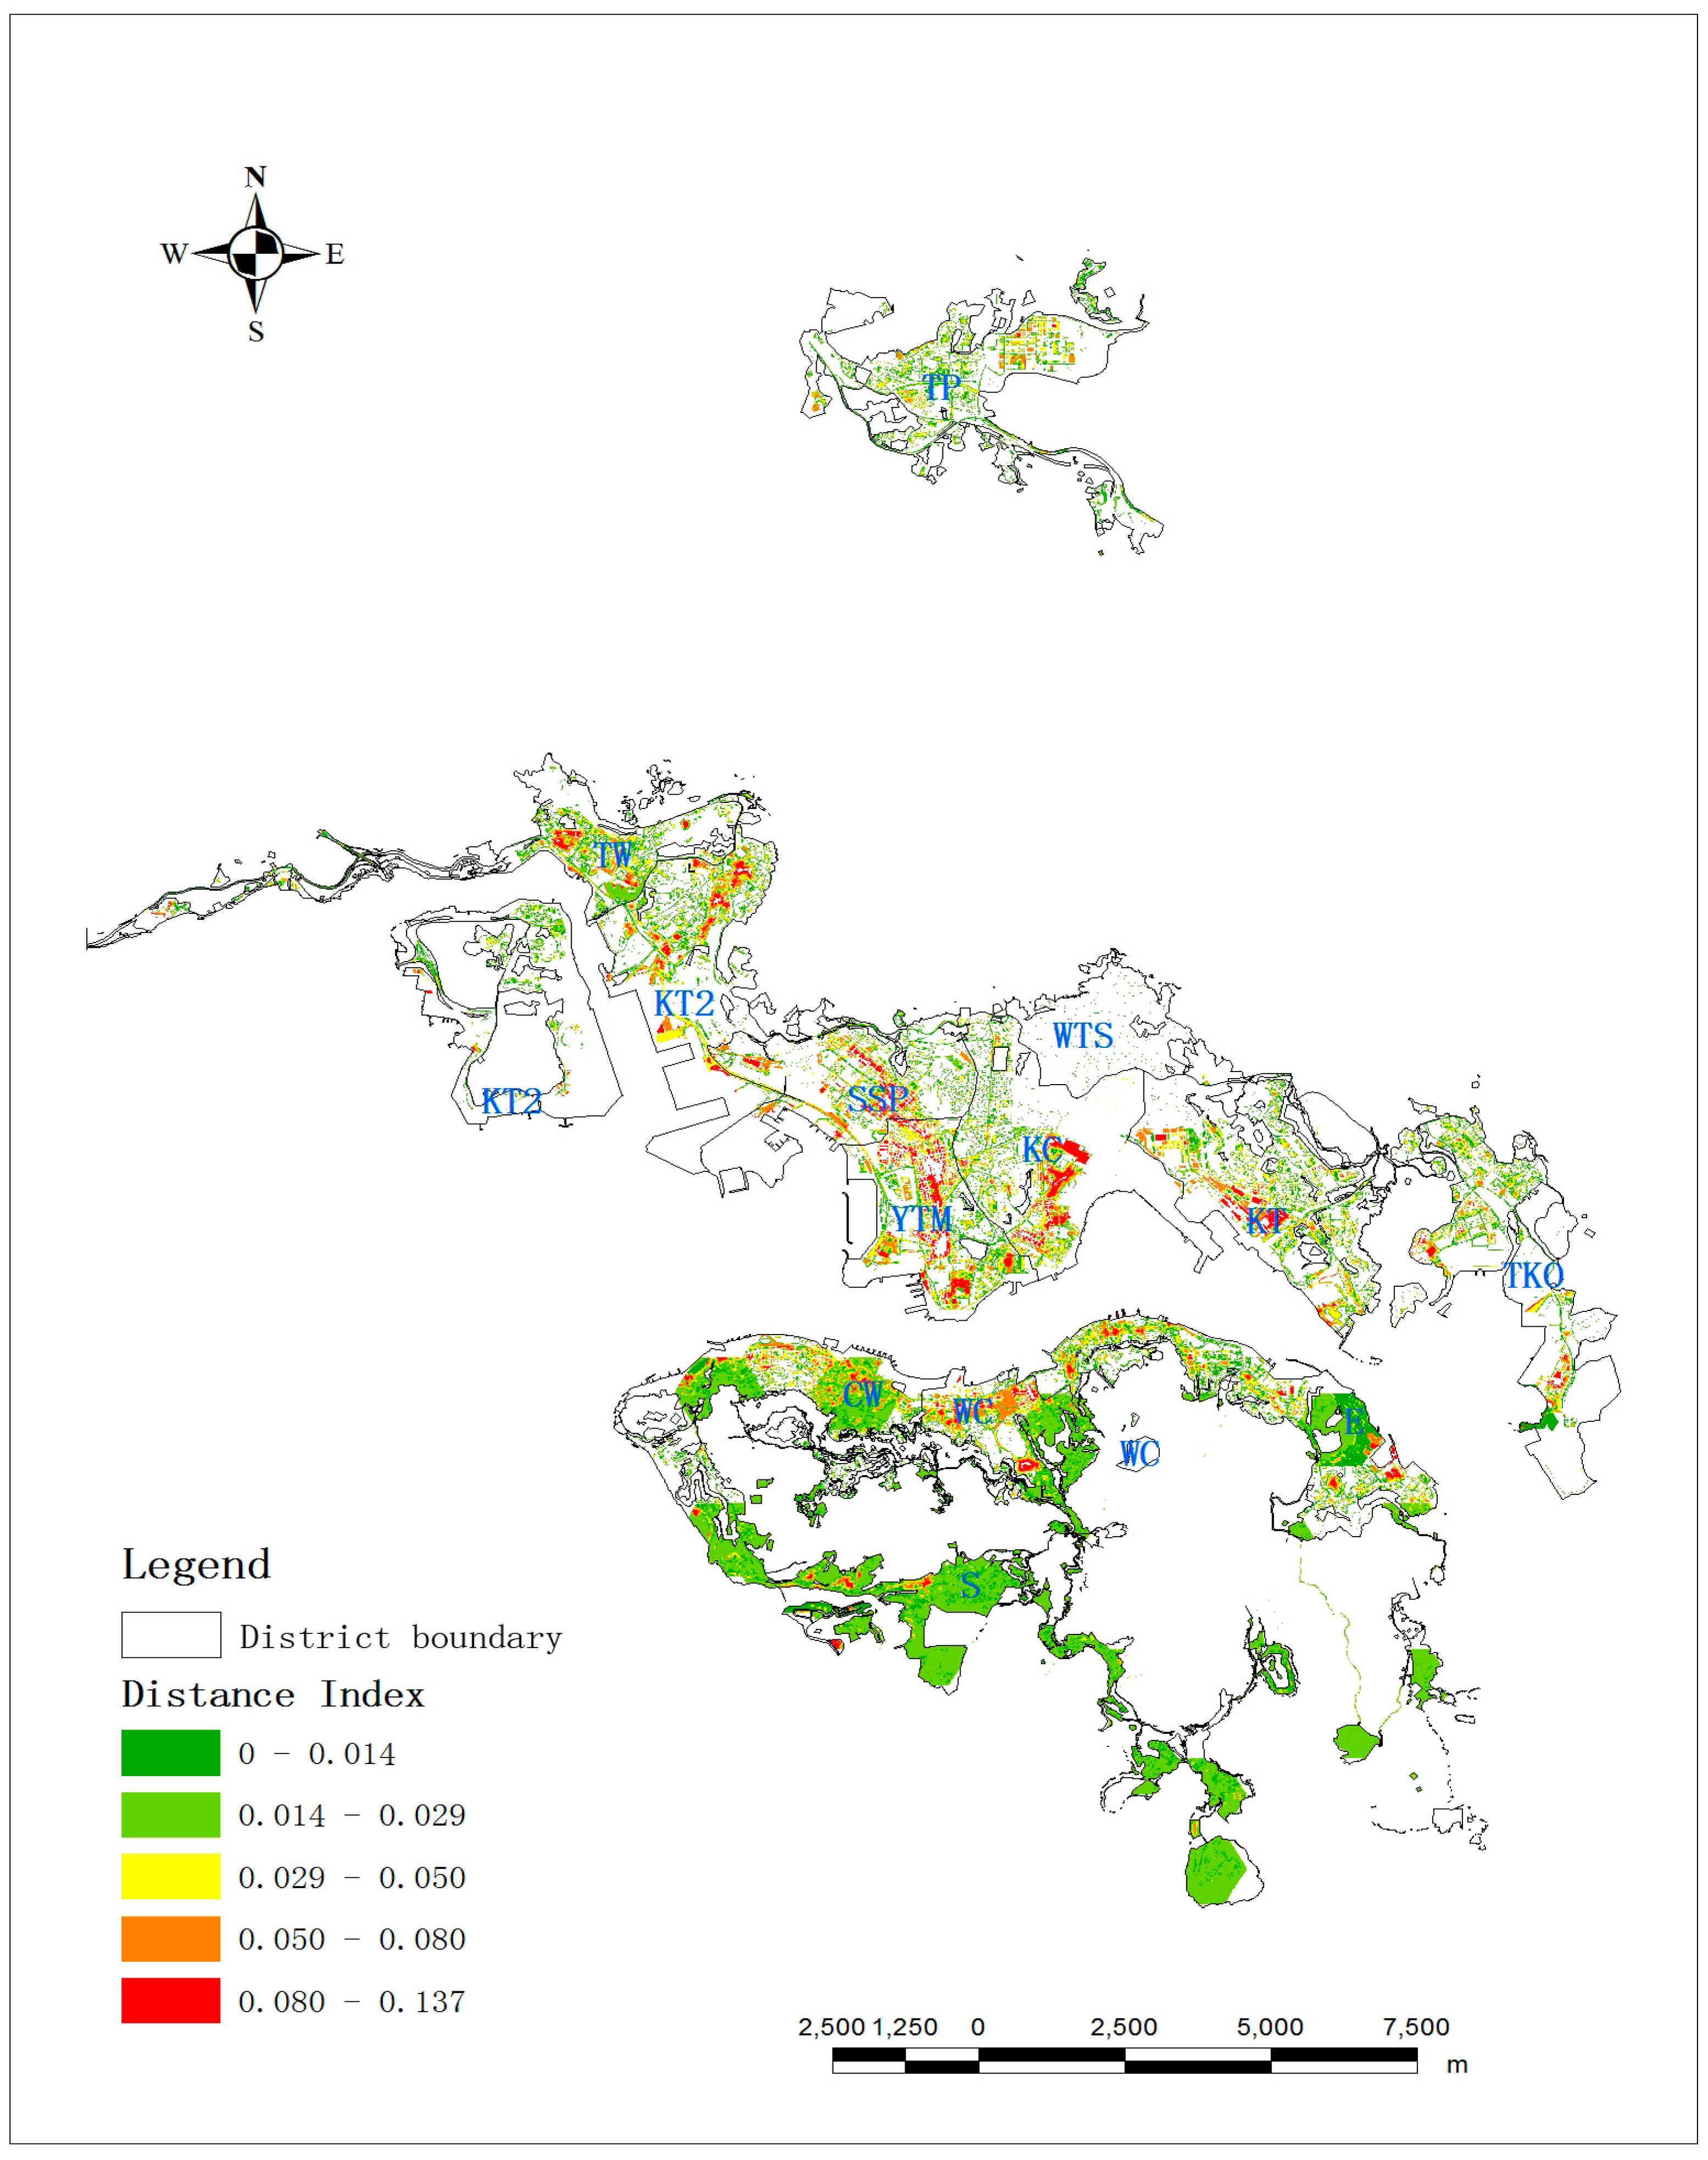
Figure 4 and Figure 5 display the distributions of the distance index (DI) between different urban green spaces and the connectivity index respectively. Figure 4 displayed that most town centers especially Yau Tsim Mong, Tsuen Wan and Wan Chai have higher values of DI than other areas. Figure 5 indicates that the spatial pattern of green space connectivity differs among towns. Low connectivity usually occurs at town centers, especially of the old towns, and areas occupied by land uses with high resistance weight values, or with high building density and low green cover. Some regions, especially those in the town centers of Kwai Tsing and Tsuen Wan, have extremely low connectivity of green spaces. The old town centers, especially those along the seaside, have extremely low connectivity of green space. On the contrary, the town centers, especially in the second and latest generation new towns of Tai Po and Tseung Kwan O, have comparatively higher connectivity of green spaces.
3.3. Factors Influencing the Spatial Pattern of Green Space Connectivity
The Pearson correlation coefficients between connectivity index and green cover, building density, population density and elevation (Table 5) demonstrate that the connectivity of green spaces is negatively (positively only in Tsuen Wan and Kwai Tsing) and moderately or strongly influenced by the elevation in almost all the districts including both old and new towns, except Wong Tai Sin and Kwun Tong, where the terrain is less rugged. Building density only plays a negative and weak or very weak role in the connectivity of green spaces in the old towns of Kowloon city, Yau Tsim Mong and Sham Shui Po in Kowloon. Population density only plays a negative and weak role in the connectivity of green spaces in the old towns of Kowloon City, Sham Shui Po and Kwun Tong.
In the old towns of Hong Kong Island, only elevation’s role in the connectivity index of green spaces is strongly significant (except in Central and Western) because most green spaces are located in the hills where many residential sites are developed. In the old towns in Kowloon, elevation also plays a negative and strong role in green space connectivity in Kowloon, Yau Tsim Mong and Sham Shui Po. The roles of building density and/or population density are always weak or very weak. Thus, too some extent, urban dense may hinder the access of residents to green spaces and decrease the utilization of public facilities located in the green spaces in some part of Kowloon. However, in the most populated town, Wong Tai Sin, no factor plays a significant role in the connectivity index of green spaces. Thus, dense population may not be a necessary factor that negatively influences the structural connectivity of green spaces.
In most new towns with comparatively better designed green spaces and more spaces in the New Territories, only green cover plays a positive and weak or moderate role in the connectivity of green spaces. On the contrary, in Tsuen Wan, which has comparatively higher green cover than other districts, the weak role of green cover in the connectivity of green spaces is negative, because of the uneven distribution of green spaces (Figure 1). Thus, green cover is not necessarily positively related to the green space connectivity if the layout of green spaces is not appropriately arranged to facilitate connectivity.
4. Discussion and Conclusions
4.1. Increasing Structural Connectivity of Green Spaces in Hong Kong
Due to the uneven distribution of factors such as green cover, elevation, population density and building density, their roles in green space connectivity varied with districts. Since the green covers in Yau Tsim Mong and Kowloon in general are extremely low, the positive roles of population density and building density on the green cover indicate that there are still many chances to improve the current conditions of urban green spaces, especially in the less dense places (both less in population density and building density). In Hong Kong Island with rugged terrain, elevation significantly influences the green space connectivity. In the New Territories with high allocation of green spaces, green cover plays a significant role in the green space connectivity. In Kowloon, heavily dense land uses greatly hinder the green space connectivity. However, in Wong Tai Sin, dense population may not play significant roles on the green space connectivity. Thus, measures to increase connectivity of green spaces should also vary with districts.
Highly dense population of an area may not be a key factor on the connectedness of green spaces when the green cover is high and the green spaces are appropriately distributed to facilitate connectivity. Strategies such as setting up green connectors to bridge the green spaces and shorten the distances between different urban green spaces are appropriate strategies to increase the structural connectivity of green spaces in high-density cities such as Singapore [40]. Measures to implement these strategies include constructing greenways or green corridors [41] along the seaside, rivers, roads and around the urban fringe, setting up green stepping stones between separated green spaces [1], enlarging the existing green sites, adding more green cover, providing more access points or entrances to green spaces [30], and increasing green cover in the residential areas. Besides the technical measures, government policy should also be modified to enhance the connectivity of green spaces. For example, the latest planning of Hong Kong Government encouraging private-sector participation in place promotion and urban marketing along the strategic waterfront locations may deprive the right of underprivileged communities to conveniently access public green spaces [42]. To solve this problem, public sector led Strategic Urban Design Approach could be used for urban renewal in Hong Kong [43].
4.2. Challenges and Strategies to Form Greenways in Enhancing Urban Structural Connectivity of Green Spaces
Greenways are linear or striped green spaces that can enhance urban structural connectivity of green spaces. In a human-dominated landscape, especially in a city, greenways are narrow and play an important role in maintaining the natural landscape and preserving biodiversity [44,45], although few greenways have been established and the green spaces in built-up areas are small and fragmented in Hong Kong [30]. The city has many chances to form greenways. According to geographical location, four kinds of potential greenways are identified in the study area: coastal, roadside, industrial, and urban fringe [46] (Table 6).
Coastal greenway is a network of “open” spaces compatible with human uses along the coastline that can provide beautiful landscapes and act as green buffers between the sea and nearby land uses [47]. Hong Kong has about 955 km of coastlines. Since no residential buildings are allowed normally to be constructed at the waterfront, more spaces can be allocated for green spaces along the seaside in Hong Kong. An attempt at connecting these green spaces with existing parks and other recreational areas (such as public gardens, trails, bike-ways, promenade walks, etc.) to form more continuous greenways should be carried out [47]. Hong Kong Government has executed a latest planning and development strategies at expanding a network of new open spaces at strategic waterfront locations and near commercial/business zones [42]. This will support establishing a coastal greenway system. Two kinds of special green spaces called green belts and amenity areas are found in the urban fringes or urban buffer areas [48]. They offer the potential sites to install greenways, since more undeveloped spaces can be found at the urban fringe.
Industrial greenways are green corridors surrounding the factories, storages and along the roadside in the industrial estates. The spaces for the industrial estates are not as compact as those in the built-up areas and more green spaces can be introduced to form greenways. The proposed industrial greenways are a little different from other kinds because they do not only provide recreational, aesthetical and ecological functions such as those in the built environment, but more importantly, they remove multiple air pollutants and abate noise to improve the working environment. Furthermore, they provide important links and corridors to introduce wildlife into urban areas through the trunk road [48]. Thus, they are the essential passages for species flows and dispersion in the green network to increase biodiversity occurrence and penetration and improve ecological functions in a city. Similarly, urban buffer greenways also furnish bridges for the movement of wildlife species and are channels to introduce fauna and flora into the built environment and bring urban life closer to the nature. Further studies should focus on designing and implementing these greenways to improve connectivity.
Previous researches have studied the characteristics and measures of transforming green spaces and green corridors into greenways [1,48,50]. A city with a permeating network of greenways linking green-space patches can reduce the distance between people and green sites, and improve notably connectivity and hence usage. Based on the experience from these studies, and assisted by the steps of forming greenways mentioned above, the greenways could be inserted in Hong Kong by connecting the existing green spaces with the potential ones along roadsides and coasts, and in industrial areas and urban fringes. Further studies should focus on designing these greenways to improve connectivity, such as incorporating the greenways into a master plan and designing them in a 3-D infrastructure.
Acknowledgments
Special thanks are given to the Department of Geography, the University of Hong Kong, which purchased the digital data from the government. The research is supported by Key Projects of National Natural Science Foundation of China (Project Nr. 41530747) and Project supported by State Key Laboratory of Earth Surface Processes and Resources Ecology (2017-FX-01(1)).
Author Contributions
Yuhong Tian and C. Y. Jim conceived, designed and wrote the experiments; Yiqing Liu performed the experiments; and Hanzhang Song contributed reagents/materials/analysis tools.
Conflicts of Interest
The authors declare no conflict of interest.
References
- Zhang, L.; Wang, H. Planning an ecological network of Xiamen Island (China) using landscape metrics and network analysis. Landsc. Urban Plan. 2006, 78, 449–456. [Google Scholar] [CrossRef]
- Marulli, J.; Mallarach, J.M. A GIS methodology for assessing ecological connectivity: Application to the Barcelona Metropolitan Area. Landsc. Urban Plan. 2005, 71, 243–262. [Google Scholar] [CrossRef]
- Brodie, J.F.; Paxton, M.; Nagulendran, K.; Balamurugan, G.; Clements, G.R.; Reynolds, G.; Jain, A.; Hon, J. Connecting science, policy, and implementation for landscape-scale habitat connectivity. Conserv. Biol. 2016, 30, 950–961. [Google Scholar] [CrossRef] [PubMed]
- Merriam, G. Connectivity: A fundamental ecological characteristic of landscape pattern. In Methodologies in Landscape Ecological Research and Planning, Proceedings of the 1st International Seminar on Methodology in Landscape Ecological Research and Planning, Roskilde, Denmark, 15–19 October 1984; Brandt, J., Agger, P., Eds.; Roskilde University: Roskilde, Denmark, 1984. [Google Scholar]
- Taylor, P.D.; Fahrig, L.; Henein, K.; Merriam, G. Connectivity is a vital element of landscape structure. Oikos 1993, 68, 571–573. [Google Scholar] [CrossRef]
- Brierley, G.J.; Fryirs, K.; Jain, V. Landscape connectivity: The geographic basis of geomorphic application. Area 2006, 38, 165–174. [Google Scholar] [CrossRef]
- Goodwin, B.J. Is landscape connectivity a dependent or independent variable? Landsc. Ecol. 2003, 18, 687–699. [Google Scholar] [CrossRef]
- Tischendorf, L.; Fahrig, L. How should we measure landscape connectivity? Landsc. Ecol. 2000, 15, 633–641. [Google Scholar] [CrossRef]
- Mimet, A.; Clauzel, C.; Foltete, J.C. Locating wildlife crossings for multispecies connectivity across linear infrastructures. Landsc. Ecol. 2016, 31, 1955–1973. [Google Scholar] [CrossRef]
- Huse, B.; Szabo, S.; Deak, B.; Tothmeresz, B. Mapping an ecological network of green habitat patches and their role in maintaining urban biodiversity in and around Debrecen city (Eastern Hungary). Landsc. Ecol. 2016, 57, 574–581. [Google Scholar] [CrossRef]
- Ziolkowska, E.; Ostapowicz, K.; Radeloff, V.C.; Kuemmerie, T.; Sergiel, A.; Zwijacz-Kozica, T.; Zieba, F.; Smietana, W.; Selva, N. Assessing differences in connectivity based on habitat versus movement models for brown bears in the Carpathians. Landsc. Ecol. 2016, 31, 1863–1882. [Google Scholar] [CrossRef]
- Gray, M.E.; Diskson, B.G. Applying fire connectivity and centrality measures to mitigate the cheatgrass-fire cycle in the arid West, USA. Landsc. Ecol. 2016, 31, 1681–1695. [Google Scholar] [CrossRef]
- Keeley, A.T.H.; Beier, P.; Gagnon, J.W. Estimating landscape resistance from habitat suitability: Effects of data sources and nonlinearities. Landsc. Ecol. 2016, 31, 2151–2162. [Google Scholar] [CrossRef]
- Rolf, W.; Peters, D.; Lenz, R.; Pauleit, S. Farmland—An elephant in the room of urban green infrastructure? Lessons learned from connectivity analysis in three German cities. Ecol. Indic. 2017, in press. [Google Scholar] [CrossRef]
- Pascual-Hortal, L.; Saura, S. Comparison and development of new graphy-based landscape connectivity indices: Towards the priorization of habitat patches and corridors for conservation. Landsc. Ecol. 2006, 21, 959–967. [Google Scholar] [CrossRef]
- Jim, C.Y.; Chen, S.S. Comprehensive greenspace planning based on landscape ecology principles in compact Nanjing city, China. Landsc. Urban Plan. 2003, 65, 95–116. [Google Scholar] [CrossRef]
- Pascual-Hortal, L.; Saura, S. Impact of spatial scale on the identification of critical habitat patches for the maintenance of landscape connectivity. Landsc. Urban Plan. 2007, 83, 176–186. [Google Scholar] [CrossRef]
- Campbell, S.; Guary, P.; Mitrovski, P.J.; Mulder, R. Genetic differentiation among populations of a specialist fishing bat suggests lack of suitable habitat connectivity. Biol. Conserv. 2009, 142, 2657–2664. [Google Scholar] [CrossRef]
- Debinski, D.M.; Holt, R.D. A survey and overview of habitat fragmentation experiments. Conserv. Biol. 2000, 14, 342–355. [Google Scholar] [CrossRef]
- Sun, D.; Dawson, R.; Li, H.; Wei, R.; Li, B. A landscape connectivity index for assessing desertification: A case study of Miqin County, China. Landsc. Ecol. 2007, 22, 531–543. [Google Scholar] [CrossRef]
- Lojǎ, C.L.; Grǎdinaru, S.R.; Onose, D.A.; Vânǎu, G.O.; Tudor, A.C. The potential of school green areas to improve urban green connectivity and multifunctionality. Urban For. Urban Green. 2014, 13, 704–713. [Google Scholar]
- Czárán, T.; Bartha, S. Spatiotemporal dynamic models of plant populations and communities. Trends Ecol. Evol. 1992, 7, 38–42. [Google Scholar] [CrossRef]
- Villalba, S.; Gulinck, H.; Verbeylen, G.; Matthysen, E. Relationship between patch connectivity and the occurrence of the European red squirrel, Sciurus vulgaris, in forest fragments within heterogeneous landscapes. In Key Concepts in Landscape Ecology, Proceedings of the 1998 European Congress of the International Association for Landscape Ecology, Preston, UK, 3–5 September 1998; Dover, J.W., Bunce, R.G.H., Eds.; IALE UK: Nottingham, UK, 1998; pp. 205–220. [Google Scholar]
- Mui, D.B.; Caverhill, B.; Johnson, B.; Fortin, M.J.; He, Y. Using multiple metrics to estimate seasonal landscape connectivity for Blanding’s turtles (Emydoidea blandingii) in a fragmented landscape. Landsc. Ecol. 2016, 32, 531–546. [Google Scholar] [CrossRef]
- Saura, S.; Pascual-Hortal, L. A new habitat availability index to integrate connectivity in landscape conservation planning: Comparison with existing indices and application to a case study. Landsc. Urban Plan. 2007, 83, 91–103. [Google Scholar] [CrossRef]
- Ganesan, S.; Lau, S.S.Y. Urban Challenges in Hong Kong: Future Directions for Design. Urban Des. Int. 2000, 5, 3–12. [Google Scholar] [CrossRef]
- Jim, C.Y. The urban forestry programme in the heavily built-up milieu of Hong Kong. Cities 2000, 17, 271–283. [Google Scholar] [CrossRef]
- Namini, E.K.; Nakhai, J. Development of Green Space on Improvement of City Quality and Its Importance in Urban Life (Case Study: Beside Milad Hospital (Chamran-Tehran Autobahn), District 2 Tehran). Available online: https://www.ijhcs.com/index.php/ijhcs/article/view/914 (accessed on 18 September 2017).
- Census and Statistics Department. Hong Kong Annual Digest of Statistics. 2017. Available online: http://www.censtatd.gov.hk/hkstat/sub/sp20.jsp?productCode=B1010003 (accessed on 8 March 2017).
- Tian, Y.H.; Jim, C.Y.; Tao, Y.; Shi, T. Landscape ecological assessment of green space fragmentation in Hong Kong. Urban For. Urban Green. 2011, 10, 79–86. [Google Scholar] [CrossRef]
- Hopkins, L.D. Methods of generating land suitability maps: A comparative evaluation. J. Am. Inst. Plan. 1977, 43, 386–400. [Google Scholar] [CrossRef]
- Yu, W.; Li, B.; Yang, X.; Wang, Q. A development of a rating method and weighting system for green store buildings in China. Renew. Energy 2015, 73, 123–129. [Google Scholar] [CrossRef]
- Xiang, W.N. A theoretical framework for weight value set construction in land suitability assessment. Environ. Plan. B Plan. Des. 2000, 27, 599–614. [Google Scholar] [CrossRef]
- Linstone, H.A.; Turoff, M. The Delphi Method Techniques and Application; Addison-Wesley Publishing Company: Reading, MA, USA, 1975. [Google Scholar]
- Dieleman, F.; Dijst, M.; Burghouwt, G. Urban form and travel behavior: Microlevel household attributes and residential context. Urban Stud. 2002, 39, 507–5252. [Google Scholar] [CrossRef]
- Lai, M.L.; Kim, Y. Use and perception of podium gardens in residential neighborhoods in Hong Kong. Sustainability 2017, 9, 57. [Google Scholar] [CrossRef]
- Drielsma, M.; Marrion, G.; Ferrier, S. The spatial links tool: Automated mapping of habitat linkages in variegated landscape. Ecol. Model. 2007, 200, 403–411. [Google Scholar] [CrossRef]
- Eycott, A.E.; Marzano, M.; Watts, K. Filling evidence gaps with expert opinion: The use of Delphi analysis in least-cost modeling for functional connectivity. Landsc. Urban Plan. 2011, 103, 400–409. [Google Scholar] [CrossRef]
- Evans, D.H. Uggooloceras oblatum gen. and sp. Nov., an annulate orthocerid (Orthocerida, Nautiloidea) from the Llanvirn Series of County Mayo. Iran J. Earth Sci. 1996, 15, 71–76. [Google Scholar]
- Briffett, C.; Sodhi, N.; Yuen, B.; Kong, L. Green corridors and the quality of urban life in Singapore. In Proceedings of the 4th International Urban Wildlife Symposium, Tucson, AZ, USA, 1–5 May 1999; pp. 56–63. [Google Scholar]
- Noss, R.F. Landscape connectivity: Different functions at different scales. In Landscape Linkages and Biodiversity: Defenses of Wildlife; Hudson, W.E., Ed.; Island Press: Washington, DC, USA, 1991. [Google Scholar]
- Tang, B.S. Expanding the inequitable spatial distribution of public open space in Hong Kong. Lands Urban Plan. 2017, 161, 80–89. [Google Scholar] [CrossRef]
- Choy, H.T. Urban Renewal in Hong Kong—Toward a Strategic Urban Design Approach. Master’s Thesis, The University of Hong Kong, Hong Kong, China, 1997. [Google Scholar]
- Fumagalli, N.; Toccolini, A. Relationship between greenways and ecological network: A case study in Italy. Int. J. Environ. Res. 2012, 6, 903–916. [Google Scholar]
- Liu, K.; Siu, K.W.M.; Gong, X.Y.; Gao, Y.; Lu, D. Where do network really work? The effects of the Shenzhen greenway network on supporting physical activities. Landsc. Urban Plan. 2016, 152, 49–58. [Google Scholar] [CrossRef]
- Taylor, J.; Paine, C.; Fitzgibbon, J. From greenbelt to greenways: Four Canadian case studies. Lands. Urban Plan. 1995, 33, 47–64. [Google Scholar] [CrossRef]
- Ferreira, J.C.; Silva, C.; Tenedorio, J.A.; Pontes, S.; Encarnação, S.; Marques, L. Coastal greenways: Interdisplinarity and integration challenges for the management of developed coastal areas. J. Coast. Res. 2006, 39, 1833–1837. [Google Scholar]
- Planning Department, HKSAR. Hong Kong Planning Standards and Guidelines. 2016. Available online: http://www.pland.gov.hk/pland_en/tech_doc/hkpsg/full/index.htm (accessed on 28 August 2017).
- Viles, R.L.; Rosier, D.J. How to use roads in the creation of greenways: Case studies in three New Zealand landscape. Lands. Urban Plan. 2001, 55, 15–27. [Google Scholar] [CrossRef]
- Levin, N.; Lahav, H.; Ramon, U.; Heller, A.; Nizry, G.; Tsoar, A.; Sagi, A. Landscape continuity analysis planning in Israel. Landsc. Urban Plan. 2007, 79, 53–64. [Google Scholar] [CrossRef]
Figure 1.
Distribution of residential areas and green spaces in built-up areas in Hong Kong (district: CW: Central and Western; WC: Wan Chai; S: Southern; E: Eastern; KC: Kowloon City; YTW: Yau Tsim Mong; SSP: Sham Shui Po; WTS: Wong Tai Sin; KT: Kwun Tong; TW: Tsuen Wan; KT2: Kwai Tsing; TP: Tai Po; TKO: Tseung Kwan O).

Figure 2.
Distribution of population density based TPUs in Hong Kong (for the abbreviations of districts and the corresponding names, refer to Figure 1).
Figure 2.
Distribution of population density based TPUs in Hong Kong (for the abbreviations of districts and the corresponding names, refer to Figure 1).

Figure 3.
Distribution of building density based TPUs in Hong Kong (for the abbreviations of districts and the corresponding names, refer to Figure 1).
Figure 3.
Distribution of building density based TPUs in Hong Kong (for the abbreviations of districts and the corresponding names, refer to Figure 1).

Figure 4.
The distribution of the distance index in built-up areas of Hong Kong (for the abbreviations of districts and the corresponding names, refer to Figure 1).
Figure 4.
The distribution of the distance index in built-up areas of Hong Kong (for the abbreviations of districts and the corresponding names, refer to Figure 1).

Figure 5.
Distribution of connectivity index of green spaces in the built-up areas in Hong Kong (for the abbreviation of districts and the corresponding names, refer to Figure 1).
Figure 5.
Distribution of connectivity index of green spaces in the built-up areas in Hong Kong (for the abbreviation of districts and the corresponding names, refer to Figure 1).

Table 1.
Area and green cover in the built up areas in the main towns of Hong Kong.
| Region | District | Township | Area (km2) | Population Density (10,000 Person/km2) * | Green Cover (%) | Green Cover per Capita (m2) |
|---|---|---|---|---|---|---|
| Hong Kong Island | Central & Western | Old town | 6.47 | 4.05 | 24.89 | 6.15 |
| Wan Chai | Old town | 4.79 | 3.49 | 23.50 | 6.73 | |
| Southern | Old town | 11.61 | 2.50 | 44.27 | 17.70 | |
| Eastern | Old town | 7.96 | 7.74 | 23.84 | 3.08 | |
| Kowloon | Kowloon City | Old town | 10.11 | 3.77 | 15.83 | 4.19 |
| Yau Tsim Mong | Old town | 6.79 | 4.15 | 14.45 | 3.48 | |
| Sham Shui Po | Old town | 8.34 | 4.24 | 14.99 | 3.53 | |
| Wong Tai Sin | Old town | 4.92 | 9.04 | 26.37 | 2.92 | |
| Kwun Tong | Old town | 10.99 | 5.36 | 21.50 | 4.20 | |
| The New Territories | Tsuen Wan | First generation new town | 6.37 | 4.33 | 32.09 | 7.41 |
| Kwai Tsing | First generation new town | 16.04 | 2.97 | 21.27 | 7.15 | |
| Tai Po | Second generation new town | 9.32 | 3.34 | 41.60 | 12.47 | |
| Tseung Kwan O | Latest generation new town | 9.65 | 2.77 | 29.55 | 10.67 | |
| Total | 113.64 | 4.15 | 25.91 | 6.28 | ||
| National standard for garden city in China | 30 | 11 | ||||
* Population data (2015) was extracted from [29].
Table 2.
Resources and references of data collection and analyses.
| Factor | Data Resources | References |
|---|---|---|
| Green cover | Interpreted from Orthophoto maps | [30] |
| Population density | Calculated from population data (2015) based on TPUs extracted from B5000 digital maps | [29,30] |
| Building density | Calculated from building information extracted from B5000 digital maps | [30] |
Table 3.
Weight assigned to different levels of resistance to the connectivity to green spaces in different land uses.
Table 3.
Weight assigned to different levels of resistance to the connectivity to green spaces in different land uses.
| Factor | Classification | Weight for Resistance | |
|---|---|---|---|
| Building | Buildings (excluding podiums) in Commercial/Residential regions with passages to facilitate shopping and maximize social interactions | 0.5 | |
| Other buildings (excluding podiums) | 1 | ||
| Podium * gardens in residential regions that only provide services for the residents | 0.9 | ||
| Other podium gardens open to the public | 0.1 | ||
| Other podiums | 1 | ||
| Road | Primary and secondary roads that could be crossed over | CWY (covered walkway) | 0 |
| FBR (footbridge (over road/water)/elevated walkway | 0 | ||
| FP (footpath) | 0 | ||
| PA (pavement) and PAU (pavement under other structure) | 0 | ||
| STP (steps) and SWY(subway) | 0 | ||
| TC (track/bicycle track/racing track) | 0 | ||
| Roads with no accessing parts | Primary roads (expressways, trunk roads, etc.) with 24-h stopping restriction | 0.9 | |
| Secondary roads that people can reach by bus | 0.3 | ||
| Rural roads and other roads | 0.5 | ||
| RAIL East and West Rail lines) | 1 | ||
| Rural roads | Other roads in villages, urban fringe and countryside | 0.3 | |
| Water | Catchwater, fountain, nullah, river, swimming pool, etc. | 1 | |
| Other | Other land uses such as open spaces | 0 | |
* Podium: the space in the intermediate floors of high-rise buildings above the ground level [36].
Table 4.
Pearson correlation analysis of the relationships between population density and building density and total and per capita green cover.
Table 4.
Pearson correlation analysis of the relationships between population density and building density and total and per capita green cover.
| CC | CW | WC | S | E | HKI | KC | YTM | SSP | WTS | KT | K | TW | KT2 | TP | TKO | NT | T |
|---|---|---|---|---|---|---|---|---|---|---|---|---|---|---|---|---|---|
| N1 | 206 | 215 | 121 | 228 | 774 | 252 | 289 | 180 | 70 | 99 | 900 | 76 | 81 | 101 | 31 | 290 | 1965 |
| PD and GC | −0.53 ** | −0.06 | −0.58 ** | −0.34 ** | −0.14 ** | −0.51 ** | −0.12 * | −0.32 ** | 1.00 ** | −0.22* | 0.98 ** | −0.14 | −0.34 ** | −0.15 | −0.6 ** | −0.1 | 0.84 ** |
| N2 | 201 | 206 | 111 | 210 | 729 | 236 | 265 | 171 | 71 | 89 | 832 | 66 | 70 | 98 | 28 | 262 | 1823 |
| PD and GC per capita | −0.36 ** | −0.04 | −0.21 ** | −0.21 ** | −0.06 | −0.27 ** | −0.24 ** | −0.25 ** | 0.3 * | −0.29 ** | ns | −0.2 | −0.29 * | −0.31 ** | −0.27 | −0.23 ** | −0.04 |
| N1 | 206 | 215 | 121 | 228 | 774 | 252 | 289 | 180 | 79 | 99 | 900 | 76 | 81 | 101 | 31 | 290 | 1965 |
| BD and GC | −0.16 * | 0.01 | −0.32 ** | −0.34 ** | −0.18 ** | −0.36 ** | −0.11 | −0.33 ** | 1.00 ** | −0.3 ** | 1.00 ** | −0.17 | −0.15 | −0.34 ** | −0.46 ** | −0.02 | 0.75 ** |
| N2 | 201 | 206 | 111 | 210 | 729 | 236 | 265 | 171 | 71 | 89 | 832 | 66 | 70 | 98 | 28 | 262 | 1823 |
| BD and GC per capita | −0.02 | −0.07 | −0.19 * | −0.2 ** | −0.09 * | −0.23 ** | −0.2 ** | −0.26 ** | 0.31 ** | −0.19 | 0.04 | −0.18 | −0.25 * | −0.2 * | −0.26 | −0.19 ** | ns |
| N3 | 610 | 457 | 974 | 530 | 2571 | 272 | ns | 281 | 203 | 353 | 1392 | 366 | 450 | 412 | 189 | 1417 | 5382 |
| E and GC per capita | 0.46 ** | 0.58 ** | 0.22 ** | 0.61 ** | 0.37 ** | 0.67 ** | ns | 0.62 ** | 0.65 ** | 0.59 ** | 0.72 ** | 0.34 ** | 0.4 ** | 0.23 ** | −0.15 * | 0.27 ** | 0.44 ** |
** Correlation is significant at the 0.01 level (two-tailed); * Correlation is significant at the 0.05 level (two-tailed); N: sample numbers; CC: Pearson correlation coefficient; PD: population density; GC: green cover based on TPU Block System; GC per capita: green cover per capita based on TPU Block System; for the abbreviations of districts and the corresponding names, refer to Figure 1.
Table 5.
Pearson correlation coefficients (CC) between connectivity index of green spaces and building density, population density and elevation.
Table 5.
Pearson correlation coefficients (CC) between connectivity index of green spaces and building density, population density and elevation.
| Building Density | Population Density | Green Cover | Elevation | ||
|---|---|---|---|---|---|
| Hong Kong Island | Central and Western | 0.045 | −0.005 | 0.120 | −0.354 ** |
| Wan Chai | −0.073 | −0.075 | −0.038 | −0.816 ** | |
| Southern | 0.021 | −0.083 | 0.079 | −0.642 ** | |
| Eastern | 0.029 | 0.007 | −0.030 | −0.858 ** | |
| Kowloon | Kowloon City | −0.145 * | −0.389 ** | 0 | −0.767 ** |
| Yau Tsim Mong | −0.175 ** | 0.041 | 0.101 | −0.689 ** | |
| Sham Shui Po | −0.220 ** | −0.274 ** | 0.082 | −0.721 ** | |
| Wong Tai Sin | −0.063 | −0.089 | −0.085 | 0.132 | |
| Kwun Tong | 0.175 | −0.399 ** | 0.204 | 0.179 | |
| The New Territories | Tsuen Wan | 0.034 | 0.122 | −0.243 * | 0.495 ** |
| Kwai Tsing | −0.196 | 0.163 | 0.352 ** | 0.461 ** | |
| Tai Po | 0.116 | 0.148 | 0.318 ** | −0.305 ** | |
| Tseung Kwan O | 0.289 | −0.131 | 0.535 ** | −0.966 ** | |
| Total | −0.013 | −0.024 | −0.004 | −0.443 ** | |
The meanings of * and ** refer to Table 4.
Table 6.
Characteristics and functions of different types of potential greenways identified in Hong Kong (modified from [49]).
Table 6.
Characteristics and functions of different types of potential greenways identified in Hong Kong (modified from [49]).
| Types of Greenways | Type of Corridor | Characteristics and Functions of Greenways |
|---|---|---|
| Coastal greenways | Strip, line | Acting as green buffers to stabilize the coastline, provide beautiful landscapes for amusing, activating, resting and barbecuing, etc., and as green connectors between large green patches. |
| Industrial greenways | Strip, line | Acting as green buffers to purify heavy air pollution and absorb multiple poisonous pollutants and noises to improve the working environment, and introduce wildlife into urban areas |
| Roadside greenways | Line | Acting as green buffers to separate pedestrians from the carriage road and absorb air pollutants. |
| Urban fringe greenways | Strip | Acting as green belts to confine urban growth and as green connectors between countryside and built-up areas to facilitate species communications and expansion. |
© 2017 by the authors. Licensee MDPI, Basel, Switzerland. This article is an open access article distributed under the terms and conditions of the Creative Commons Attribution (CC BY) license (http://creativecommons.org/licenses/by/4.0/).
Share and Cite
MDPI and ACS Style
Tian, Y.; Liu, Y.; Jim, C.Y.; Song, H. Assessing Structural Connectivity of Urban Green Spaces in Metropolitan Hong Kong. Sustainability 2017, 9, 1653. https://doi.org/10.3390/su9091653
AMA Style
Tian Y, Liu Y, Jim CY, Song H. Assessing Structural Connectivity of Urban Green Spaces in Metropolitan Hong Kong. Sustainability. 2017; 9(9):1653. https://doi.org/10.3390/su9091653
Chicago/Turabian StyleTian, Yuhong, Yiqing Liu, C. Y. Jim, and Hanzhang Song. 2017. "Assessing Structural Connectivity of Urban Green Spaces in Metropolitan Hong Kong" Sustainability 9, no. 9: 1653. https://doi.org/10.3390/su9091653
Note that from the first issue of 2016, this journal uses article numbers instead of page numbers. See further details here.