Differences of Cycling Experiences and Perceptions between E-Bike and Bicycle Users in the United States

1
Department of Civil and Environmental Engineering, University of Tennessee, 311 John D. Tickle Building, Knoxville, TN 37996-2313, USA
2
Transportation Research and Education Center, Portland State University, 1900 SW 4th Ave., Portland, OR 97201, USA
3
Bosch eBike Systems Americas, 12 Mauchly Unit E., Irvine, CA 92618, USA
*
Author to whom correspondence should be addressed.
Sustainability 2017, 9(9), 1662; https://doi.org/10.3390/su9091662
Submission received: 1 August 2017
/
Revised: 1 September 2017
/
Accepted: 14 September 2017
/
Published: 19 September 2017
(This article belongs to the Special Issue Sustainability in an Urbanizing World: The Role of People)
Abstract
:E-bikes are bicycles that provide pedal-assistance to aid people in cycling. Because of the potential of promoting sustainable transportation, more attention has been focused on the e-bike market. This paper investigates the differences of the cycling experience and perceptions between e-bike and conventional bicycle users, using samples drawn from independent bicycle dealer customers. A total of 806 respondents in the United States took the on-line survey, including 363 e-bike-owning respondents. The results show that e-bikes play a more important role in utilitarian travel, such as commuting and running errands, compared to a conventional bicycle. Conventional bicycle-owning respondents use their bicycles more for recreation and exercise. Also, e-bike owners tend to bike longer distances and take more trips per week. Both e-bike respondents and bicycle respondents stated that improved health was a key factor for cycling, while Millennials and Generation X respondents cycle to save time and improve the environment. Finally, an ordered logit model is proposed for evaluating factors that influence interest in future e-bike ownership. Travel purpose, e-bike familiarity, annual household income, and education level are statistically significant factors in the model. These findings begin to provide insight and a profile of potential new markets for e-bikes in the United States.
1. Introduction
Shifting people from cars to more sustainable and space-efficient modes of transport can help reduce many transportation and health challenges, including traffic congestion, air pollution, and physical inactivity [1,2]. In most urban transportation systems, there is a growing interest to increase the attractiveness of cycling [1,3]. E-bikes are electric-assist bicycles which can travel longer distances, provide higher mobility, and reduce barriers to users compared to conventional bicycles. E-bikes have been identified as a strategy to increase cycling among advocacy organizations and the public sector, and the majority of the bicycle industry sees e-bikes as a large growth area in the future. In the past decade, more than 150 million e-bikes have been sold [4], most of them in China or other Asian countries to a lesser extent. The e-bike market in Western countries has increased rapidly in recent years. In 2015, 1.2 million e-bikes were sold in Europe alone, and this figure is expected to triple by 2022 [4]. By comparison, the U.S. e-bike industry is still in its infancy, selling about 140,000 e-bikes in 2015 (and growing), while selling about 2.5 million conventional bicycles per year [4]. A very important distinction is that the Chinese e-bike market grew very rapidly through the early 2000s, and has since plateaued at around 30 million sales per year [5]. Those e-bikes are relatively low-cost (usually less than $1000 U.S.) and have evolved in form to resemble scooters that are rarely pedaled [6,7]. The market in Western countries has largely maintained bicycle-style form factors with much higher build quality and associated price, with mainstream e-bikes ranging from $800 to $4000. Most mainstream e-bikes are sold at independent bicycle dealers (IBD), and most bicycle original equipment manufacturers (OEMs) have released e-bike products [8,9].
As the largest and most rapid uptake of alternative-fueled vehicles in the history of motorization, e-bike related research has drawn attention from global researchers focusing on different aspects of their ownership and use. In general, Asian country (e.g., China) studies focus on safety, environmental effects, mode choice, and market growth revolving around the large volumes of e-bikes in China [6]. For the most part, China’s e-bike growth was driven by utilitarian needs for low-cost mobility [10,11]. In contrast, the western e-bike market has been driven, at least so far, by higher income and older adults who use them for recreation, some utility, and extended mobility [1,12,13]. Most European and North American research has been published in the past five years, and focuses on emerging markets, user behavior, health, and the effect on an aging population [6,13,14,15,16,17,18]. Little is known about the different roles e-bikes and conventional bikes play in transportation. This research explores e-bike user behavior by addressing the following questions: what is the difference between e-bike and conventional bicycle users? What are the personal cycling experiences and perceptions of e-bike and conventional bicycle users? Of conventional bicycle users, who are most likely to become future e-bike users?
This study relies on a consumer online survey of e-bike and bicycle users in the United States, with a focus on consumers from IBDs. The purpose of the survey is to understand the differences of cycling experiences and perceptions of e-bike and bicycle users, and future e-bike purchase inclination. The cycling characteristics and behavior of bicycle and e-bike users are compared and analyzed. An ordered logit model of interest in future e-bike ownership is proposed for evaluating factors that influence purchase interest. A brief background of the research motivation and existing e-bike market research is given in the next section, followed by sections covering methods, results and discussion, and conclusions.
2. Background
2.1. E-Bike
An e-bike (as defined here) is a standard pedal bicycle with an electric motor and a rechargeable battery to assist with propulsion [1]. With power assistance, many barriers to cycling are reduced or overcome, including increasing age, physical limitations, hilly terrain, a lack of time, and a lack of fitness or the perception of fitness that is needed to cycle [1,13,14,19,20,21,22]. While power assistance makes riding easier, riders still gain some physical activity benefits by pedaling. Compared to a conventional bicycle, riding an e-bike requires less physical effort, which makes e-bikes attractive to people with a physical limitation or as a rehabilitative tool [6,14,17,23,24], and e-bikes can provide the extra help to transport items or children [12,25]. Some studies have reported that e-bike users had higher enjoyment and comfort [1,13,26]. A few studies have also reported that some e-bikes can substitute for car journeys or become a replacement on the way to motorization [5,13,14]. One promising finding is that e-bikes may reduce the number of trips taken by cars [6]. Few studies have investigated the barriers to e-bike use. A survey conducted in the U.S. identified significant barriers to e-bike use, including the weight of an e-bike, a fear of theft, road danger, and a fear of insufficient battery power [19].
The demographic characteristics of e-bike adopters vary geographically. According to a Californian study, early adopters of e-bike technology are older, better educated, and have a relatively high income, which corresponds with similar results in Australia [13,14]. Meanwhile, a study conducted by Wolf and Seebauer [27] showed that Austrian e-bike users were more likely to have lower educational and income levels than the Austrian population.
In recent years, more research has focused on e-bike-related safety issues, but almost all empirical studies have been related to China, given the relatively larger population of e-bike users [6,28,29,30]. In Europe and North America, some studies point to a potential risk of traffic injuries to road users unaccustomed to higher e-bike speeds [12,13,28,31]. Three empirical studies in the United States and Europe have focused rider behavior, crash data, and hospitalization data, and found that e-bike riders tend to behave very similarly compared to bicyclists in the U.S. [15]. They tend to have similar crash rates, except for slightly higher “dismount” injuries in the Netherlands [31], and in Switzerland they had slightly higher crash rates, but policy distinctions were difficult to draw because almost all crashes were single-vehicle crashes [16,32].
Focusing on the environmental impacts of e-bikes, manufacturing, power plant emissions, and battery disposal could pose some challenges. From a broader view, the environmental impacts of e-bikes are dependent on the modes of transport they replace, since they are becoming a replacement for different types of vehicles [7,33]. E-bikes that replace non-motorized vehicle trips could result in a net negative impact on the environment, if ignoring the effect of food production to generate energy [6]. However, e-bikes are generally very energy efficient and produce fewer emissions (from power plants) than cars travelling the same distance, even if powered from the dirtiest power plants [34].
2.2. North American E-Bike Users
Only a few studies have been conducted to describe how e-bikes are used in North America, and they particularly focus on early adopters. The first and most comprehensive study of users relied on a nationwide online survey of e-bike users, and focused on understanding the factors that influence the purchase and use of e-bikes [1]. Their most important findings were that e-bike early adopters (including about half of the sample that constructed e-bikes with retrofit kits) often used e-bikes to replace car trips and increase the number of trips taken by bicycle. In a more recent study by MacArthur et al. [35], they investigated how different cohorts of employees used e-bikes in their commutes, including how folding e-bikes could influence bike-to-transit opportunities. Again, they found that e-bike users tended to replace car trips, even among conventional bicyclists. Three small-sample studies [13,20,25] found that e-bike users do indeed use e-bikes for broader trip purposes than bicycles. Since those studies were published, the e-bike market has grown and become more mainstream, with major international manufacturers entering the market and conventional bicycle companies adopting an e-assist product line. This research differs from previous studies because it documents the next wave of e-bike adoption in the U.S. using a nationwide survey, explicitly addresses the role of e-bikes and conventional bicycles simultaneously, and explores different cyclists’ perceptions and attitudes toward cycling using the same sampling approach.
3. Method
3.1. Data Collection
An online survey was conducted by Bosch eBike Systems from September 2015 to October 2015. The survey was an end-consumer online survey in the United States, which was distributed via IBDs. This survey intended to explore customers’ perception of e-bikes and conventional bicycles, attempted to reveal bicycle users’ riding habits, and estimated the potential opportunities and barriers to e-bike purchase. The survey questions were developed following an e-bike literature review related to e-bike purchase and riding behavior [1,6,12]. This survey focused on fully assembled e-bikes (e-bike conversions from a standard bicycle were excluded). The entire survey covers four aspects of e-bike and bicycle owners, including household characteristics, cycling experiences and behavior, motives and perception for e-bike use, future e-bike expectation, and purchase interest (for conventional bicycle owners only). Respondents who owned both a bicycle and an e-bike were presented with the e-bike related questionnaire. As an incentive for participation, respondents were entered into a chance to win an e-bike. Table 1 presents an overview summary of the survey scope. The authors acknowledge the limitations of relying solely on this sub-sample, likely missing a large portion of the e-bike market, particularly those purchased online or from big-box stores. As with most survey research, our study could suffer from self-selection bias. However, we think that this sample still represents a large and growing proportion of the current and future bicycle and e-bike markets, by both volume and value. Thus, the insights gained could provide value to public and private sector decision-makers regarding future e-bike ownership and use.
A total of 806 respondents in the U.S. completed the survey. In the survey, 56 respondents claimed that they did not have a bicycle or e-bike. Of those, 47% said that they lived in an area which is not safe to ride, or is too hilly, or that has poor bicycling infrastructure. In addition, 15% of these respondents cannot ride because of physical limitations. Also, there were 15 bicycle respondents which stated that they no longer ride their bicycle because of physical limitations and/or because the area they live in is too hilly. These 56 respondents were excluded from the following analysis. So, the final total sample is 750 respondents. Among them, 387 respondents own conventional bicycles only (BO), 122 respondents own e-bikes only (EO), and 241 respondents own both conventional bicycles and e-bikes (BE). Figure 1 shows the geographic distribution of the survey respondents. This survey covers a wide area in the U.S., with relatively representative distributions and clusters in cycling cities (e.g., Denver/Boulder, Western States, and Northeast).
3.2. Ordinal Logit Model of Interest in E-Bike Purchase in the Future
Among the bicycle-only respondents, we asked about respondents’ interest in purchasing an e-bike in the future. The question “How would you rate your interest in owning an e-bike in the future?” had three possible answers: “Not interested”, “Probably interested”, and “Definitely interested”. The ordered discrete statistical models represent a model in which the dependent variable represents an ordinal outcome. As the interest in e-bike purchase in the future was considered as a three-level ordinal outcome, an ordinal logit model and generalized ordered logit model were considered [36]. The Brant test was used to test the parallel lines (proportional odds) assumption. The Wald test result of p > chi-square is insignificant indicates that the model does not violate the parallel lines (proportional odds) assumption. Furthermore, we tested if individual variables meet the proportional odds assumption [37]. The test results show that no variables violate the proportional odds assumption. The ordinal logit model was used for model development. The equation for the ordinal logit model is [38]:
where j is a category, is a vector of independent variables, is a cut point, and is a vector of coefficients. The probability for any given outcome category j in the ordinal logit model is
where is the logistic cumulative densify function. In our model of interest in e-bike purchase in the future, there are 14 observations with some missing values, leaving 373 observations in the estimated model. Here, Y = 1 represents not interested (N = 5), Y = 2 is probably interested (N = 87), and Y = 3 is definitely interested (N = 281); the predicted probabilities for each category are:
where Y is the future purchase interest level; X is a vector of explanatory factors, such as demographics; and is a set of coefficients of X. An ordered logit model shares one set of coefficients but with different intercepts as cut points and in the above equations [36].
4. Results
4.1. Demographics
The demographic characteristics of the respondents are summarized in Table 2. The three categories of respondents match across many demographic categories. The asterisk indicates statistical significance (p < 0.05) comparing values of BO respondents, EO respondents, and BE respondents. The respondents were predominately male (82%). The percentage of male e-bike respondents (EO 80%, BE 83%) is a little bit lower than that in a survey (85%) conducted by MacArthur et al. in 2013 [1]. More than half of the e-bike respondents were 50–69 years (Baby boomer generation). The percentage of EO who were 35–49 years (12%) is significantly lower than that of BO respondents (21%) and BE respondents (25%, p = 0.011). The percentage of EO who were over 69 years (17%) is significantly higher than that of BO respondents (8%) and BE respondents (13%, p = 0.006). Most respondents had obtained a bachelor degree or advanced degree. Each of the three types of respondents had a wide income range. About 74% of BO respondents’, 78% of EO respondents’, and 77% of BE respondents’ annual household income fall within $20,000 to $140,000. Most EO respondents are couples (51%) living without children in the household (87%). The percentages of the three groups who are living without children that are significantly different (p = 0.003), are the percentages of the three groups who are living alone (p = 0.001). The percentage of EO respondents who own automobiles (43%) is significantly lower than that of BO respondents (76%) and BE respondents (78%, p < 0.001). Despite these differences, in general, we find that the demographics do not vary much between the three types of respondents, particularly on education, household income, and family structure. Although we do not have any data on bicycle ownership, we find that our sample of bicycle-owning respondents is older and potentially more affluent than bicycle commuters and users, who are generally upper-middle income white males [39,40]. This could be an artifact of the sampling approach, again focusing on IBDs, or it could be that our sample reflects ownership and other studies focus on the intensity of utilitarian bicycle use (e.g., commuting).
4.2. Bicycles and E-Bike Use
4.2.1. Cycling Experience
In the cycling experience section of the survey, respondents were asked questions related to their cycling experiences. Cycling experience varied across the respondents, especially between bicycle respondents and e-bike respondents (including EO and BE). The respondents were asked about bicycle or e-bike types. City/commuter bikes made up the highest percentage of e-bike type (33% of EO, 31% of BE), while bicycle types varied, as shown in Figure 2. The asterisk indicates statistical significance (p < 0.05) comparing the values of BO respondents, EO respondents, and BE respondents. The percentages of mountain bikes of the three groups of respondents are statistically different (p = 0.041), and so are percentages of racing/road bikes (p < 0.001) and city/commuter bikes (p < 0.001). The biggest difference between the bicycle and e-bike types was road bike, which includes 18% of BO respondents compared to only 1% of EO respondents and 3% of BE respondents.
One of the early market theories was that e-bike riders generally ride with more physically fit partners. When asked about the respondents’ riding partners, some differences were found to exist among the three respondent groups (Figure 3). Contrary to expectation, 77% of e-bike respondents (EO and BE) indicated that they mostly ride alone compared with 66% of bicycle respondents (p = 0.004). Some differences emerged when the responses were disaggregated by age. Younger respondents (<60 years) were more likely to choose to ride alone than were older respondents (≥60 years) of the three groups, respectively, and especially younger respondents of the e-bike sample. The EO and BE respondents have much larger differences between the percentage of riding alone and not riding alone (68% vs. 32% of EO, 70% vs. 30% of BE) than the difference with BO respondents.
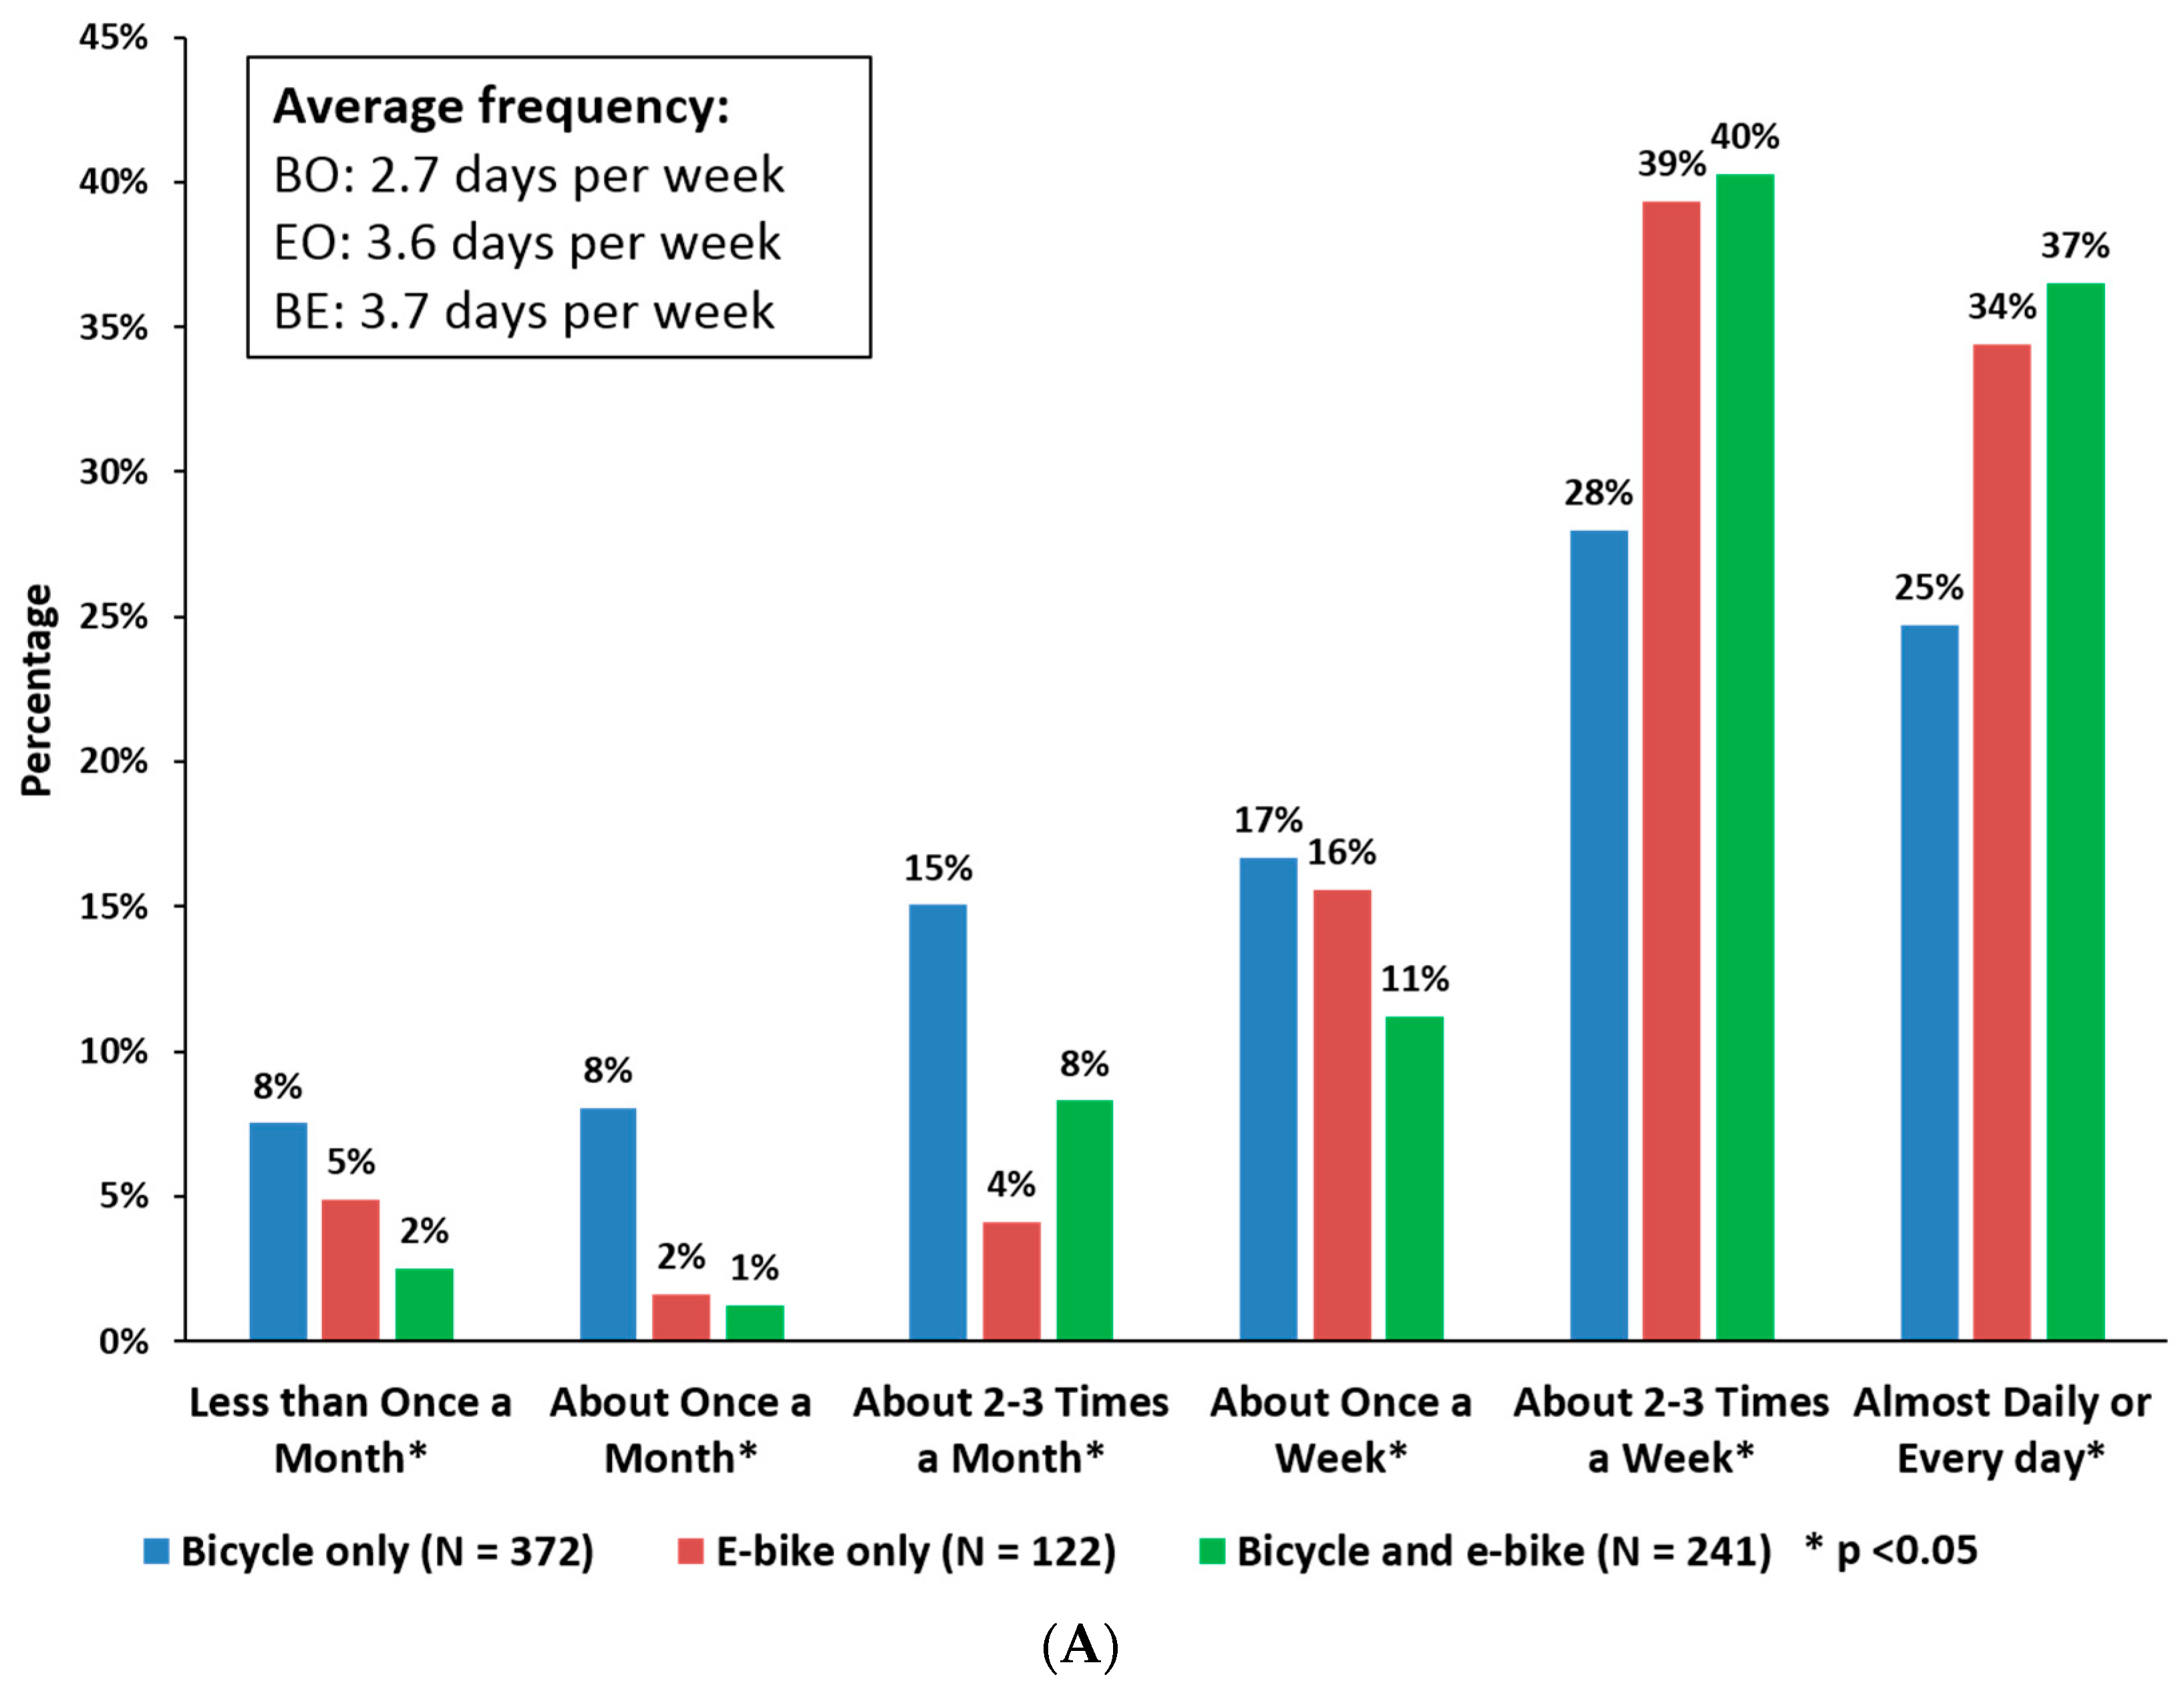
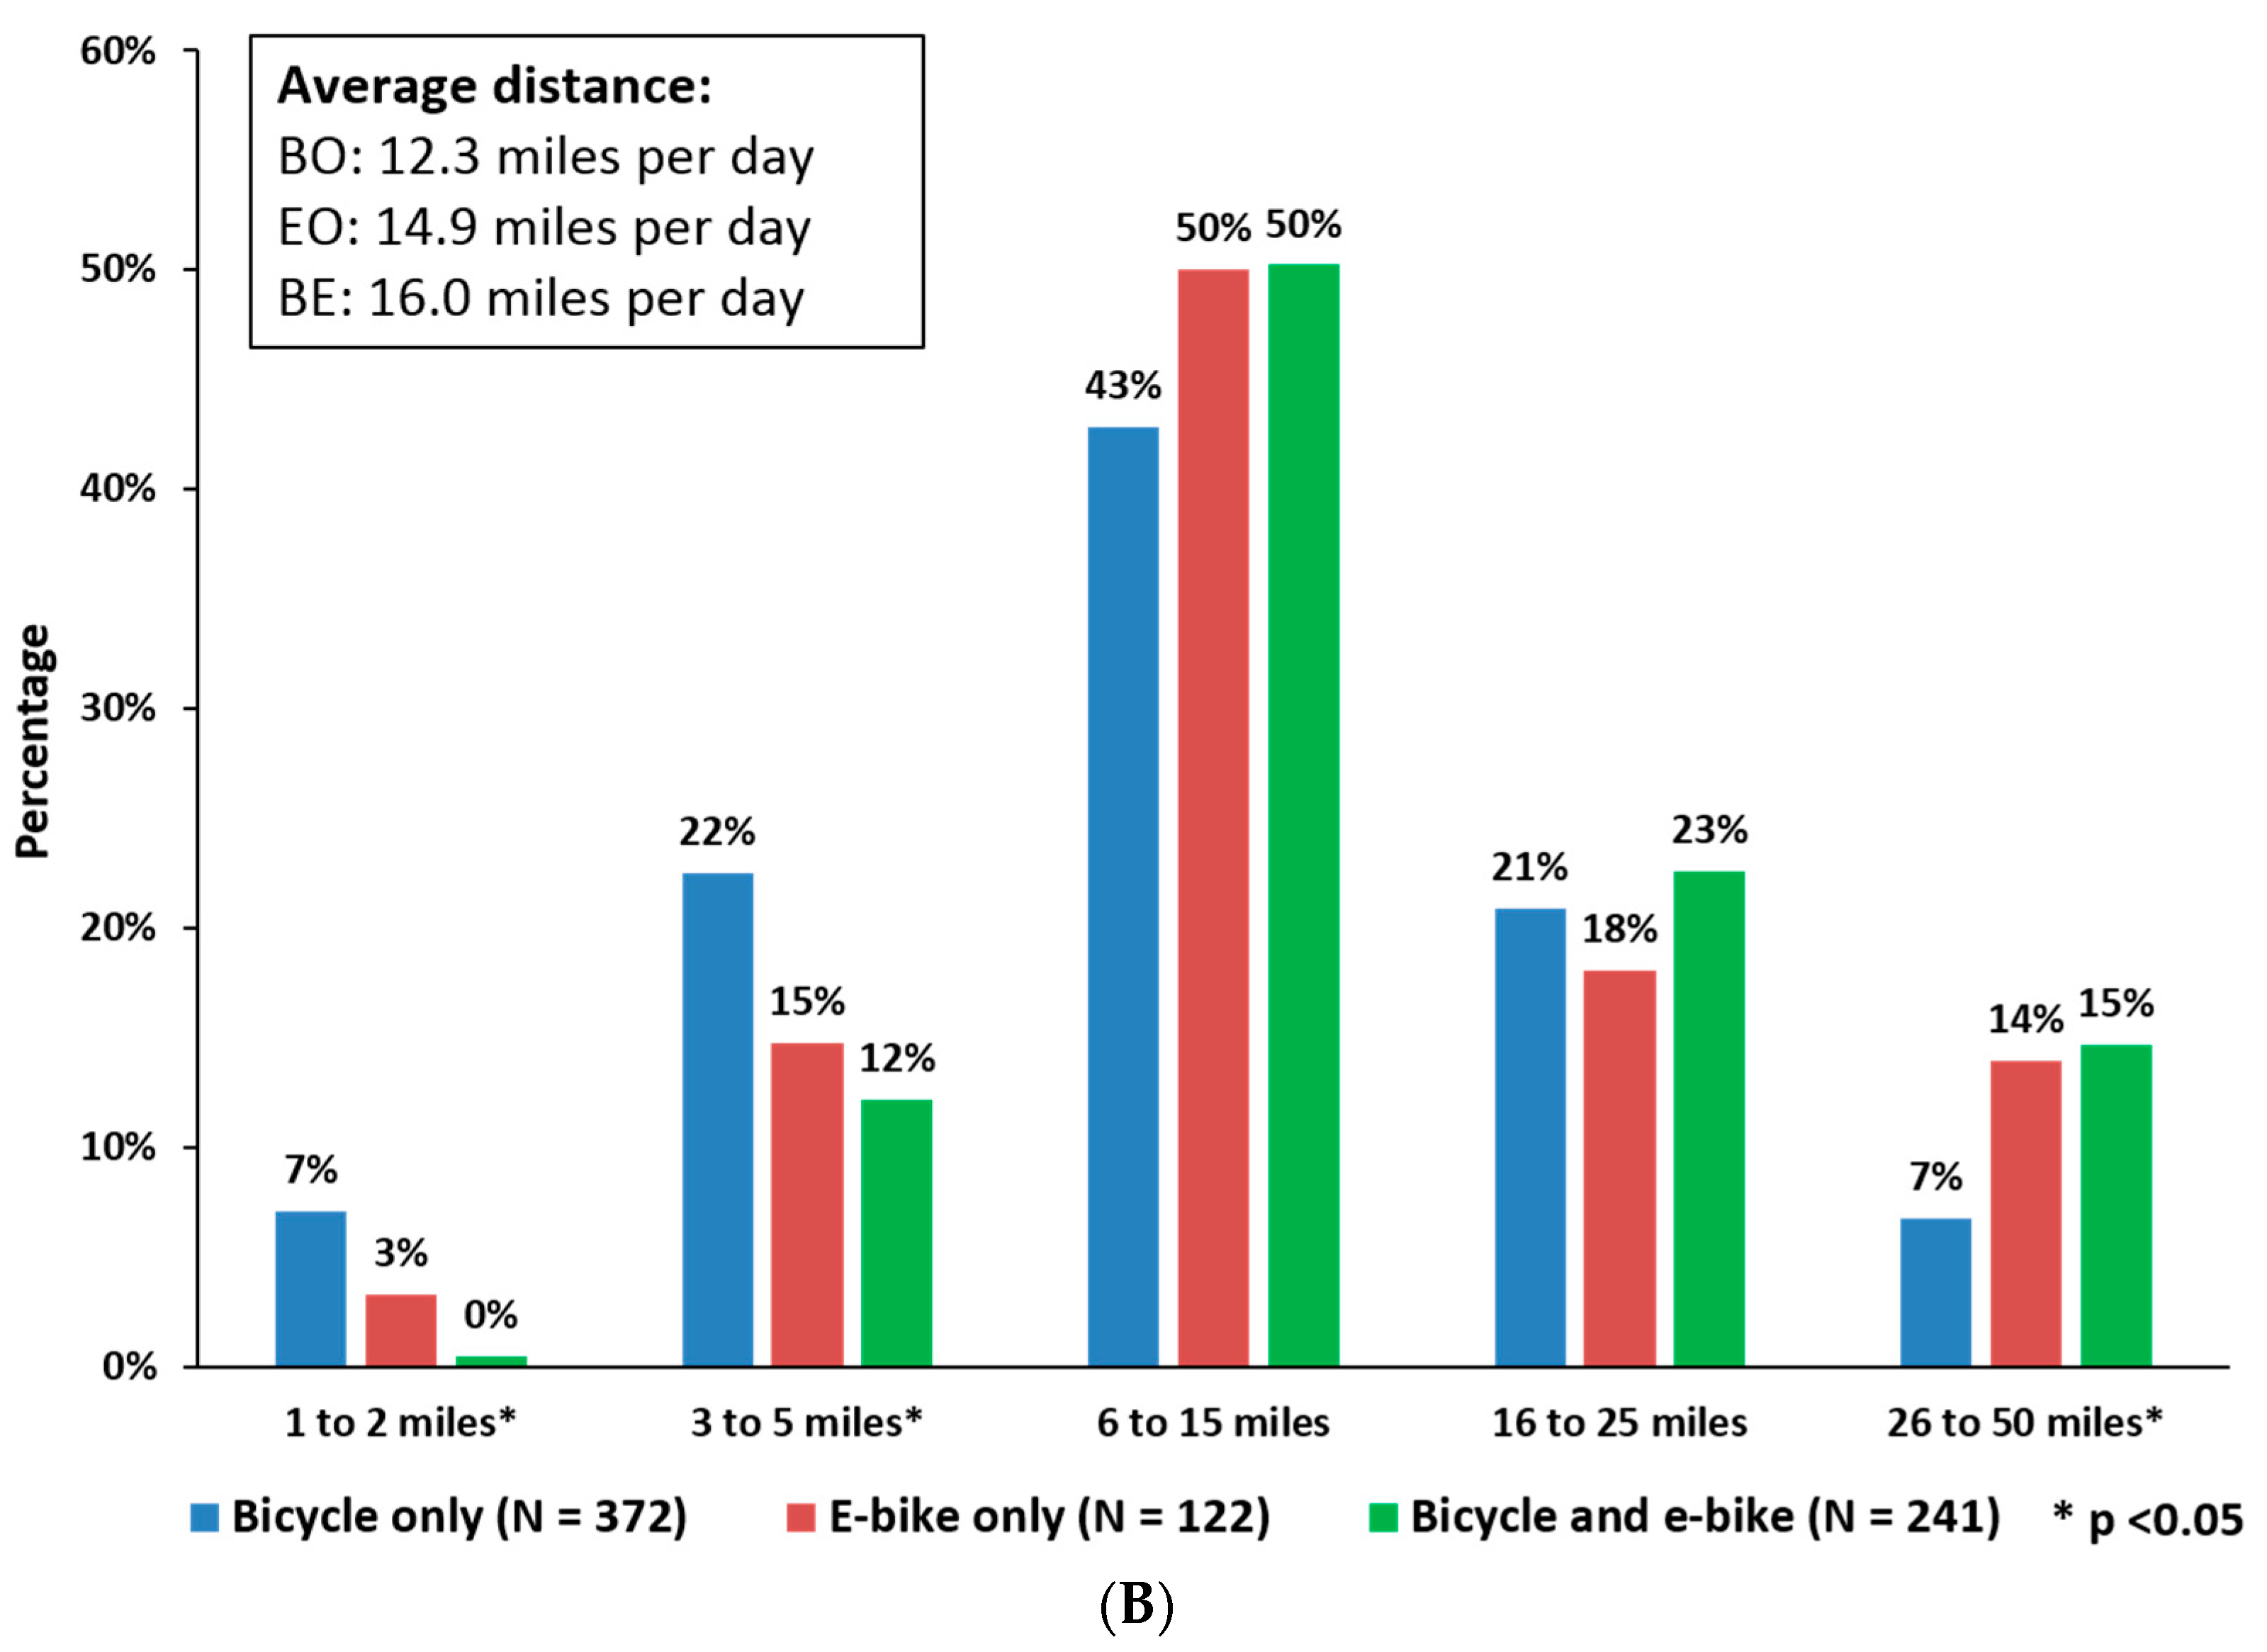
E-bike respondents ride more frequently and farther than respondents with conventional bicycles (Figure 4). The percentages of each category are significantly different among the three respondent groups (p < 0.05). E-bike respondents (EO and BE) rode an average of 3.6/3.7 days per week, while BO respondents rode an average of 2.7 days per week. This is consistent with previous studies [1,13]. About 75% of e-bike riders (EO and BE) rode more than 2–3 times per week, contrasted with only 53% of conventional bicyclists that rode that same frequency. When asked how far they usually travel on a typical day of riding, EO and BE respondents rode an average of 14.9 and 16.0 miles per day, respectively, while BO respondents rode an average of 12.3 miles per day (Figure 4). Still, conventional bicycle riders rode relatively far, perhaps reflecting the more recreational nature of the trips. Taken together, e-bike respondents tend to use their bikes for more utilitarian trips, more frequently, and ultimately traveling farther distances.
4.2.2. Motives and Perception for E-Bike Use
The respondents were asked specifics about how they use their bicycles or e-bikes as a multiple-answer response (Figure 5A) to the question “Which of the following best describe how you use your bike?” This highlights the role e-bikes play in utilitarian travel compared with bicycles, especially for BE respondents who own both conventional bicycles and e-bikes. People without an e-bike were asked what they would anticipate using an e-bike for, if they bought one. Overwhelmingly, respondents expected that e-bikes would be used for utilitarian trips, responding more by a factor of about two or three compared to their bicycle-only responses. Still, they expected that the primary purpose would be for recreation and exercise, matching their bicycle-only response. Bicycle and e-bike responses were disaggregated by generation to investigate the difference of travel purposes and reasons for cycling. Different generation classification is an intuitive age grouping that tends to refer to different life cycles and travel behavior [41]. The generations are usually referred to as the Millennial generation (born 1979–2000), Generation X (born 1965–1978), and Baby boomers (born 1946–1964), though the margins may be a little different [41]. In this paper, the generations were defined according to respondents’ ages when they answered the survey, including Millennials (15–34 years), Generation X (35–49 years), and Baby Boomers (50–69 years). The primary travel purpose of Millennial and Generation X e-bike owners (EO and BE) is commuting, especially those of BE respondents, which is the highest percentage among all possible travel purposes (82%). One quarter of Millennial EO respondents and 57% of Generation X EO respondents use their bikes as their primary means of getting around, which rank as the third and the first highest percentages, respectively. Compared to Baby boomers, Millennials and Generation X use bikes for more utilitarian-related trips, both for bicycle owners and e-bike owners.
The survey queried the reasons for cycling (using a multiple-answer question) as “What are the most important reasons you ride your bike”. The main reasons for cycling are shown in Figure 5B. Interestingly, both e-bike respondents and bicycle respondents cycle for better health (more than 80% of each type’s respondents). Similarly, most respondents ride for fun. When the responses were disaggregated by age group, e-bike owners, especially Millennials and Generation X, cycled for other benefits, rather than just for health and fun. Furthermore, more Millennials and Generation X e-bike respondents ride e-bikes to improve the environment than Baby boomers. Notably, about 91% of Millennials of BE respondents choose cycling to save the environment, which is the highest percentage among all possible cycling reasons.
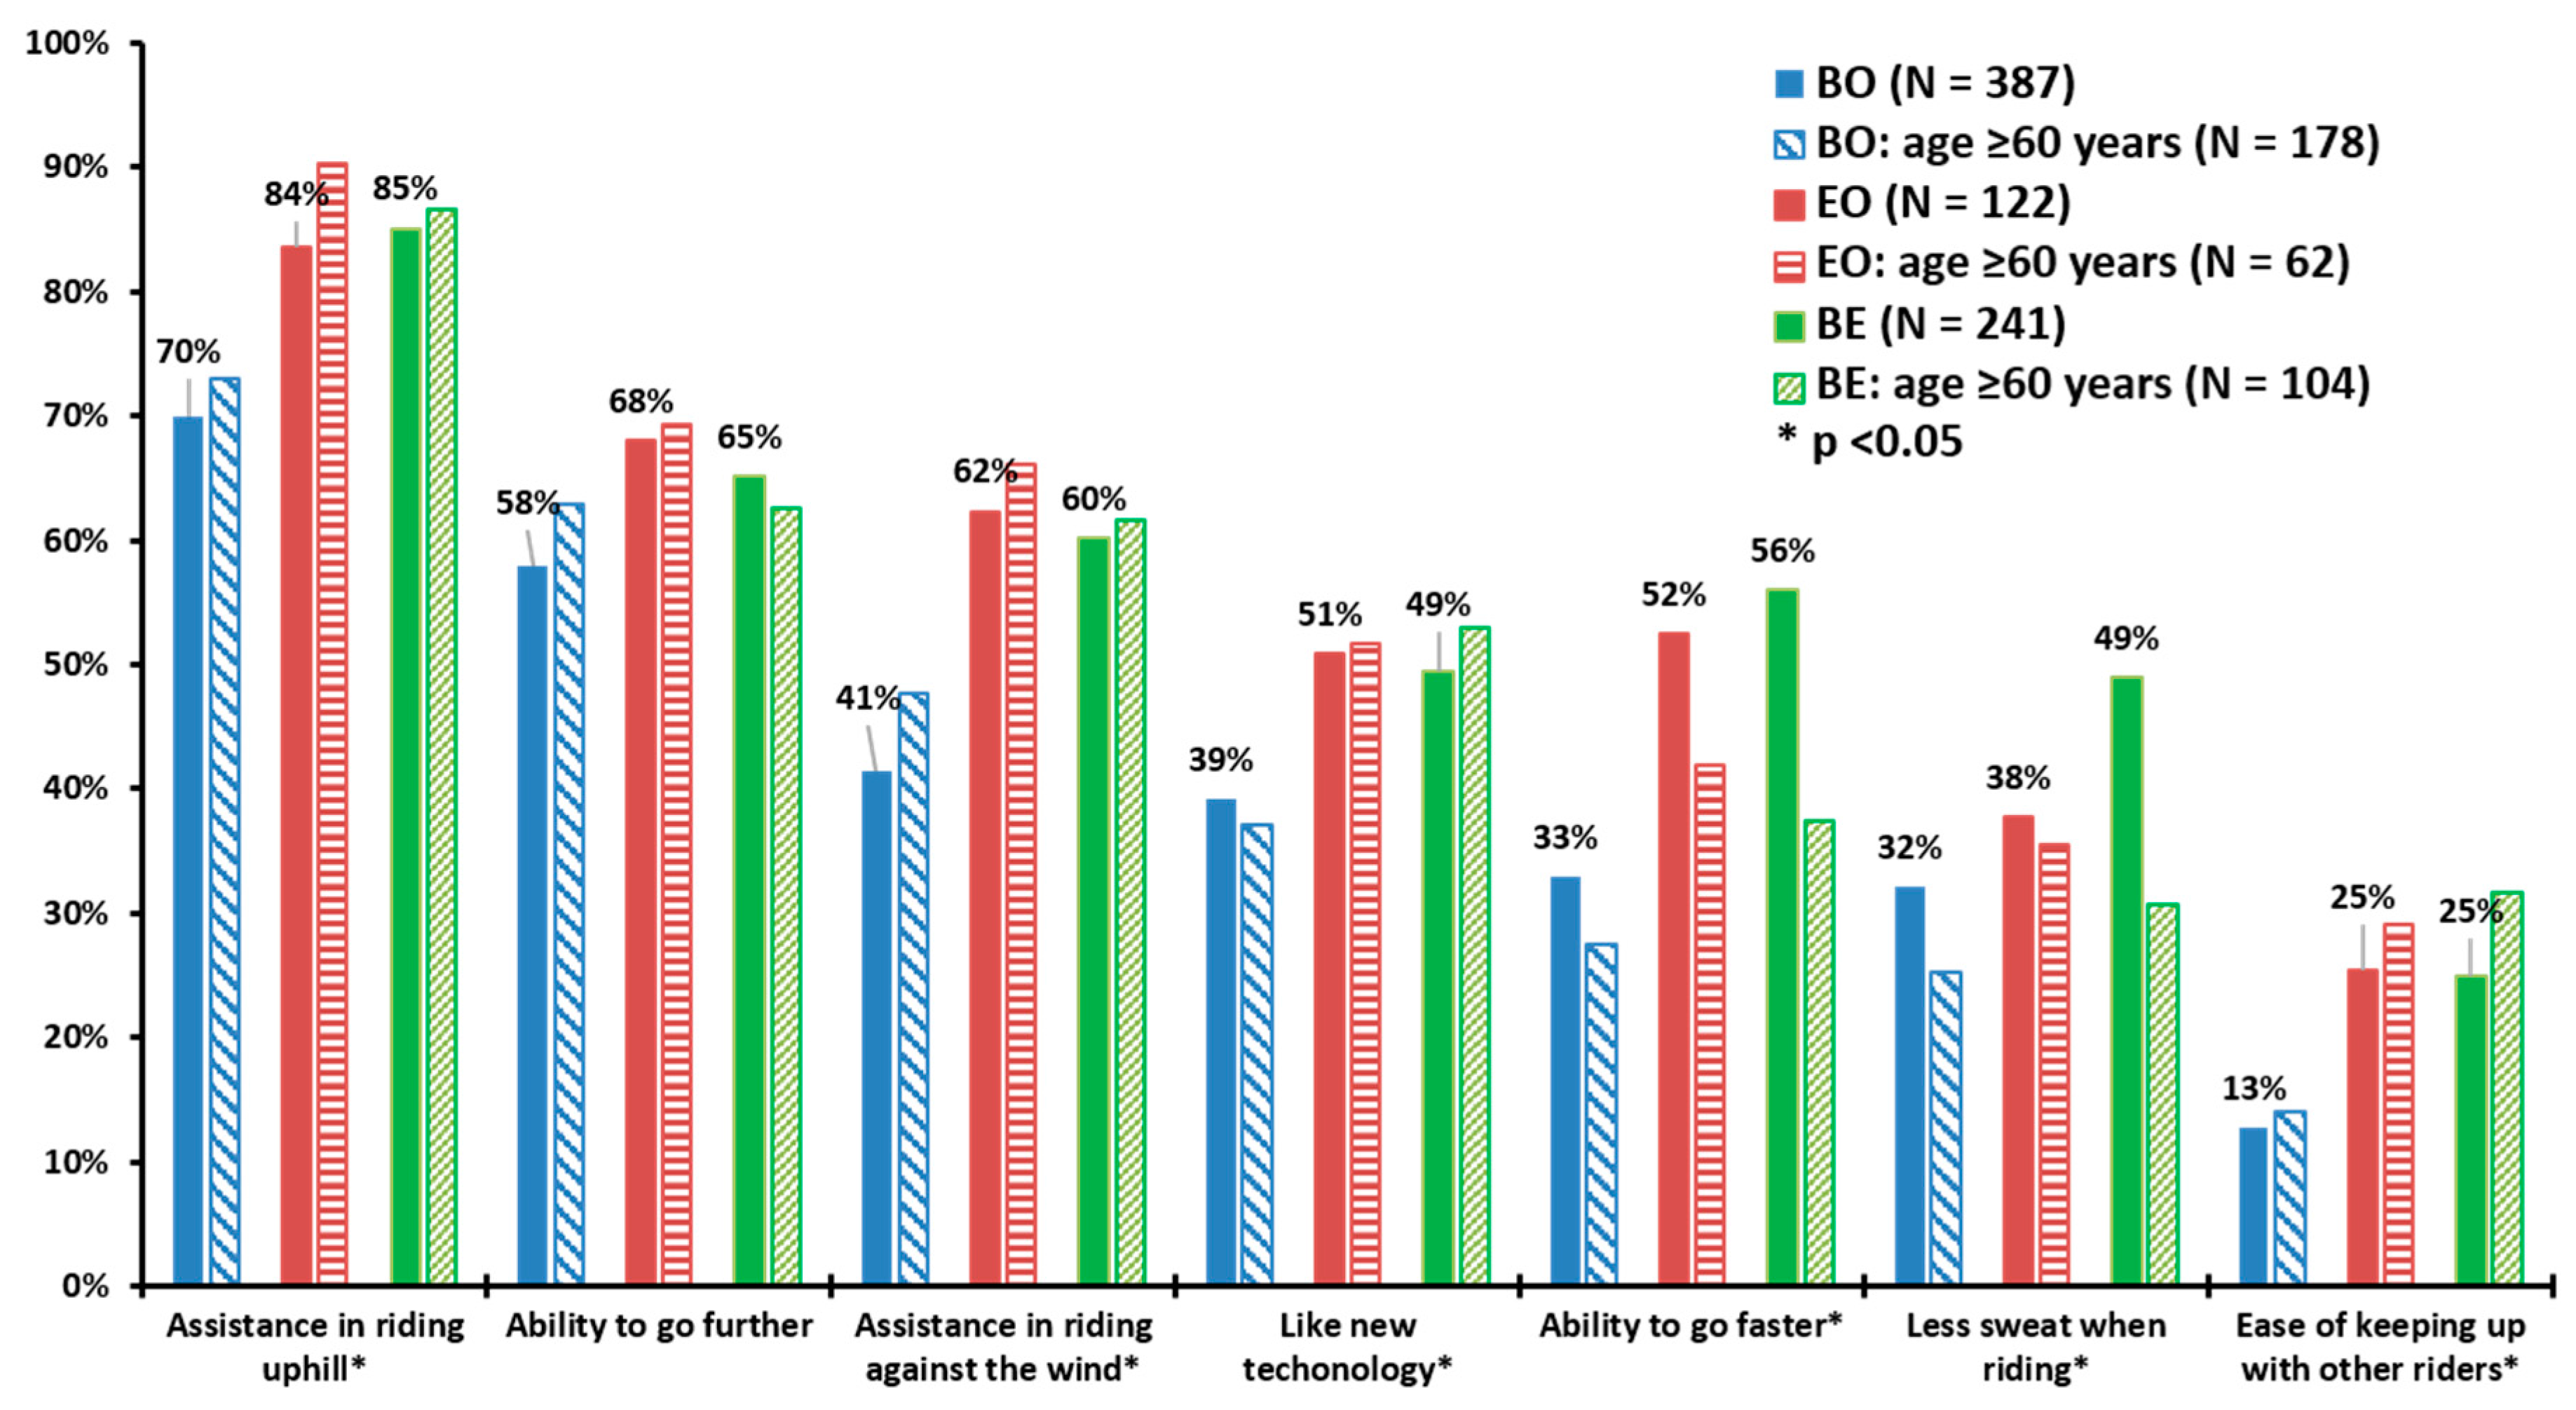
All respondents were asked what factors interest them most about e-bikes (multiple-answer allowed) shown in Figure 6. Significant differences exist between BE respondents and e-bike respondents (EO and BE). It is interesting to observe that current e-bike respondents expected much more from their e-bikes than non e-bike respondents. The most important attributes for e-bike respondents (EO and BE) is that they want assistance riding uphill (84% and 85%, respectively), the ability to go further (68% and 65%, respectively), and they want assistance in riding against the wind (62% and 65%, respectively). Non e-bike respondents, in contrast, answered lower for each of those perceived benefits, in some cases by 20 percentage points. This highlights that BE respondents either do not value those benefits at the same rate as e-bike respondents (likely due to self-selection), or they do not adequately understand the benefits of e-bikes. Some differences also emerged when these responses were tabulated by age. Older respondents were more interested in assistance in riding uphill, assistance in riding against the wind, and in ease of keeping up with other riders compared with the total samples of each type, respectively. Conversely, older respondents were less interested in an ability to go faster and with less sweat when riding compared with younger respondents.
4.2.3. Expectation of E-Bikes
When asked about the primary barrier to owning an e-bike (multiple-answers question), most of the BO respondents (78%) chose “expensive purchase price”, followed by “expensive to maintain” (15%), “no availability in my area” (14%), and “not available in type or style I would want” (13%). Interestingly, only 6% of BO respondents stated that their primary barrier to owning an e-bike was “not a proven technology” and 5% a “concern about safety”. Younger respondents have the highest percentage for “expensive purchase price” and “expensive to maintain”, respectively, which suggests that e-bike industries may need to re-scrutinize or adjust market promotion strategy to attract more younger e-bike users.
The researchers also tried to explore respondents’ expectation of e-bikes by asking them which criteria they feel are most important for an e-bike to have. The top four criteria chosen by BO respondents and e-bike respondents were consistent, including range per battery charge, quality of technical support and service after purchase, lighter weight, and on-board computer features. This is a strong signal to proponents of e-bikes (in the private or public sector) to focus on the top four qualities when marketing to or educating the public.
4.3. Model Result
The demographic characteristics and cycling experiences were tested and tabulated to evaluate the model. Extremely insignificant factors (variables’ p-values > 0.7) were removed. The final model results are shown in Table 3. The likelihood ratio chi-square is 54.42 with a p-value of 0.0006, meaning that the model as a whole is statistically significant.
If respondents use their bicycles for recreation and exercise, the log odds of being at a higher level of interest will decrease by 0.686, which means that these respondents are more likely to be not interested in purchasing an e-bike in the future, and less likely to be definitely interested. The respondents who use their bicycle for racing are less likely to be definitely interested, and more likely to be not interested. These two variables highlight the conflict of marketing e-bikes to recreational or competitive bicycle consumers. The respondents who use their bicycle for running general errands around their residence are more likely to be definitely interested in owning an e-bike in the future. It hints that e-bikes may play an important role in point-to-point travel or can be a substitution for short car trips around home. For male respondents who use their bicycles not for carrying goods or kids, the log odds of being at a higher level of interest will increase by 1.073 compared to a male respondent who uses a bicycle for carrying goods or kids while the other variables in the model are held constant. For female respondents who use a bicycle and do not carry goods or kids, the log odds of being at a higher level of interest will increase by 1.510 over male respondents who use their bicycle for carrying goods or kids. It suggests that males riding bicycles for carrying goods or kids are persons who may not be inclined to use an e-bike, perhaps because they already feel physically fit and capable of meeting their needs with a conventional bicycle. The respondents who ride bicycles for fun are more likely to be interested in an e-bike purchase in the future, and less likely to be not interested. It hints that the power assistance provided by an e-bike may reduce riding effort and make users be more relaxed for fun compared to riding a bicycle. Education level is also a significant variable in the model. Respondents with lower education levels (high school to some college education) have a higher possibility of being interested in an e-bike in the future compared to respondents with a bachelor or advanced level of education.
Familiarity to an e-bike plays an important role in the model. The more familiar with an e-bike, the more interested in owning an e-bike in the future. The coefficients of Familiar, Very Familiar, and Extremely Familiar are positive and significant at a 95% confidence level. For example, a respondent who is extremely familiar with an e-bike results in a 2.272 increase in the log-odds of being at a higher level of interest in owning an e-bike given the other variables are held constant in the model (p = 0.021). The result leads to the importance of e-bike promotion and education by either the public or private sector. As a variable that can be changed by outside influence, familiarity to e-bikes can be improved through many possible ways, such as community outreach activities, pilot experiments, and other methods.
Annual household income also has a statistically significant influence in the model. Compared to the base annual household income below $20,000, families with annual household income from $20,000 to $180,000 are more interested in e-bike purchase in the future, especially families with $20,000 to $60,000, and $100,000 to $180,000 income. Families with the highest income (>180,000 per year) seem to have an insignificant (positive) influence in the model.
There are also some interesting points among the statistically insignificant variables. Respondents who own cars or hybrid-electric automobiles seem to have less interest in e-bike purchase. Also, respondents who rode on mixed hilly or primarily hilly area seem to have more interest in e-bike purchase compared to respondents who rode on a primarily flat area. Among the removed variables, age, bike type, frequency, and riding distance are insignificant with high p-values. However, in Figure 4, we found that the bicycle-only group rode at a lower frequency and a shorter distance than e-bike owners. Cycling experience does not tend to influence e-bike purchase decisions. Age is also an insignificant variable, contrasting with some research that shows that some older people tend to use e-bikes frequently and replace car trips [14]. We also tried to interact age and travel purpose in the model, which was also found to be insignificant.
5. Discussion and Conclusions
The purpose of this paper was to study the differences of cycling experience and perception of e-bike and bicycle users, and factors influencing the e-bike purchase decisions of bicycle users. Our study builds on previous studies exploring e-bike cycling experience and perception. However, this study focused on a comparison of differences of cycling experiences and perceptions between e-bike and bicycle users in the United States, where e-bikes are a new transportation mode. The e-bike market has matured since previous studies. Purpose-built e-bikes capture a large market share, in contrast with about half of the respondents converting conventional bicycles to e-bikes in MacArthur’s study in 2013, the first nationwide survey of e-bike users in North America [1]. Also, our study is the first in the U.S. to evaluate e-bike purchase intention potential using multivariate modelling approaches. While several studies have focused on the role of an e-bike to assist older people to overcome riding barriers and to use for recreational purposes, we found that Millennials and Generation X respondents have some different e-bike cycling motives, such as cycling to save time and improve the environment, rather just to keep healthy [1,14]. Several studies reveal that e-bikes have increased riding rates and distance traveled, supporting our findings [1,12,15].
The data was from a U.S.-based end-consumer online survey that was distributed via IBDs. A total of 806 respondents in the U.S. took the completed survey, in which 387 respondents own regular bicycles, 122 respondents only own e-bikes, and 241 respondents own both bicycles and e-bikes. E-bike and bicycle respondents have similar demographic characteristics, including education level, household income, and family structure. The cycling characteristics and behaviors of bicycle and e-bike users were also compared and analyzed. The e-bike models were predominately city/commuter (33% of EO, 31% of BE) with other commuter and on-road styles, whereas the conventional models varied, having higher numbers of more competitive styles, such as mountain and racing/road. E-bike respondents use their e-bikes more frequently than conventional bicyclists. More than 70% of respondents use their e-bike 2–3 times per week or daily, which correlated to the bike models people own. These findings are in line with the earliest MacArthur et al. survey [1]. When asked how far they usually travel on a typical day of riding, about 70% of e-bike respondents ride 6 to 25 miles a day compared to bicycle respondents (63%). More e-bike respondents (14% of EO and 15% of BE) ride a longer distance (26 to 50 miles) compared with 7% of bicycle respondents (p < 0.05). These results indicate that e-bikes can get more people biking more often, confirming other studies [1,14,27]. There is no obvious difference between EO and BE respondents in riding frequency and riding distance.
E-bikes play a more important role in utilitarian travel, especially for BE respondents, compared with BO respondents. Forty-seven percent of BE respondents used their e-bikes for commuting and for other utilitarian trips, such as running general errands (41%), a primary means of getting around (18%), and carrying goods/kids (20%). Conventional bicycles appear to be used more for recreation and entertainment (82%). EO respondents use e-bikes for more utilitarian travel than BO respondents, but less than BE respondents. This may be because 82% of EO respondents are over 50 years old, and have relatively less utilitarian demand than younger users. Both e-bike respondents and bicycle respondents stated that improved health was a key factor for cycling or riding an e-bike. Like MacArthur et al. [1], improved health and enjoyment of riding (fun) are motivating factors for BO respondents. This might be an important aspect to integrate into wellness and bicycle encouragement programs. Some key factors of intrinsic motivation behavior change are for people to perceive personal benefits and outcomes and for the activity to be inherently enjoyable [42]. Notably, different generations have very different experiences with e-bike use. Younger generations (Millennials and Generations X) use e-bikes primarily for utilitarian travel. For example, 82% of Millennials and Generation X of BE respondents use an e-bike for commuting compared to 36% of baby boomers. Ninety-one percent of Millennials of BE respondents chose “to save the environment” as a cycling reason. Given the benefits of e-bike riding, government policy and industries could focus on different advantages of e-bikes to promote the use of e-bikes to different generations.
When asked about the perception of e-bikes, current e-bike respondents responded more highly than BE respondents to perceived benefits, including “less sweat when riding”, “assistance in riding uphill”, “ability to go faster”, and “like new technology”. The primary barrier to owning an e-bike is the expensive purchase price. Subsidizing could be considered to encourage young people to purchase an e-bike. The top functional criteria for e-bikes are range per battery charge, quality of technical support and service after purchase, lighter weight, and an on-board computer, which were consistent among both e-bike and conventional bicycle owners. Also, BE respondents and e-bike respondents thought that anti-theft devices and motor power greater than 350 W are very important, respectively. These results provide some reference points both for industry and non-government organizations for e-bike marketing and cycling promotion.
An ordered logit model is presented in this paper for evaluating factors that influence interest in future e-bike ownership. Travel purpose, e-bike familiarity, reason for cycling, annual household income, and education level are statistically significant factors in the model. Those respondents who used a bicycle for recreation and exercise or racing are associated with less interest in owning e-bikes; while running general errands or using a bicycle for fun is associated with an increased interest in owning e-bikes. Higher e-bike familiarity, a middle level of annual household income, and lower education levels are associated with an increased interest in owning e-bikes. This is the first study to explore the differences of cycling experience and perception of e-bike and bicycle users, and evaluate e-bike purchase intention potential with a statistical model. These findings begin providing potential new insights for the evolving e-bikes market that has emerged from the utilitarian and on-road recreational riding market. This market parallels the growing electric-assist mountain bike market that is, for the most part, a strictly recreational market.
There are some limitations to this study. First, this study did not draw randomly from U.S. e-bike and bicycle respondents, since the researchers rely on an end-consumer survey that drew from a population of generally older and more affluent consumers who frequent IBDs. Also, the online survey may attract respondents who are interested in owning an e-bike. However, it is difficult to target this nascent market, and many mainstream e-bike companies sell their products through IBDs. We do not reach e-bike (or bicycle) users who buy from internet or big-box stores. A larger sample size from a nationwide study could further improve the veracity or limitations of this study. Still, this study primarily targets first adopters, so any findings should be assessed for this subgroup. We expect that, as e-bikes penetrate deeper into the market, that the use patterns and perceptions could shift. Last, this research relied on stated responses and user-supplied estimates of travel patterns that did not adequately distinguish between activity and mode substitution patterns. Also, weather-related factors are not considered in the study. Additional research should be conducted to quantify mode and activity substitution by e-bike respondents in the U.S. to be more useful for policy-makers (e.g., transportation, health, recreation). Still, this paper provides important new insights into this evolving class of road users that policy-makers are struggling to understand.
Acknowledgments
This work was funded, in part, by the Light Electric Vehicle Education and Research (LEVER) Initiative, a joint effort between the University of Tennessee, Portland State University, Monash University, and industry partnerships. The views expressed in this article are solely those of the authors and do not necessarily reflect the views of the sponsoring organization or the affiliated organizations of the authors.
Author Contributions
Ziwen Ling and Christopher R. Cherry developed the concept, analyzed the data, and wrote the majority of paper. John H. MacArthur revised the paper and wrote a part of the conclusion and introduction. Jonathan X. Weinert organized the data collection effort, developed research questions, and survey design.
Conflicts of Interest
The authors declare no conflict of interest.
References
- MacArthur, J.; Dill, J.; Person, M. Electric bikes in the North America: Results of an online survey. Transp. Res. Rec. J. Transp. Res. Board 2014, 2468, 123–130. [Google Scholar] [CrossRef]
- Yang, C.-W.; Ho, Y.-L. Assessing carbon reduction effects toward the mode shift of green transportation system. J. Adv. Transp. 2016, 50, 669–682. [Google Scholar] [CrossRef]
- Sun, Y.; Mobasheri, A.; Hu, X.; Wang, W. Investigating Impacts of Environmental Factors on the Cycling Behavior of Bicycle-Sharing Users. Sustainability 2017, 9, 1060. [Google Scholar] [CrossRef]
- Citron, R.J.G. Electric Bicycles: Li-Ion and SLA E-Bikes: Drivetrain, Motor, and Battery Technology Trends, Competitive Landscape, and Global Market Forecasts; Navigant Research: Boulder, CO, USA, 2016. [Google Scholar]
- Ling, Z.; Cherry, C.R.; Yang, H.; Jones, L.R. From e-bike to car: A study on factors influencing motorization of e-bike users across China. Transp. Res. Part D Transp. Environ. 2015, 41, 50–63. [Google Scholar] [CrossRef]
- Fishman, E.; Cherry, C. E-bikes in the Mainstream: Reviewing a Decade of Research. Transp. Rev. 2016, 36, 72–91. [Google Scholar] [CrossRef]
- Cherry, C.R.; Yang, H.; Jones, L.R.; He, M. Dynamics of electric bike ownership and use in Kunming, China. Transp. Policy 2016, 45, 127–135. [Google Scholar] [CrossRef]
- Jamerson, F.; Benjamin, E. Electric Bikes Worldwide Reports—Revealing the Revolution in Two Wheel Mobility. 2015. Available online: http://www.ebwr.com/ (accessed on 18 September 2017).
- Jamerson, F.; Benjamin, E. Electric Bikes Worldwide Reports—Light Electric Vehicles/EV Technology. 2013. Available online: http://www.ebwr.com/ (accessed on 18 September 2017).
- Cherry, C.; Cervero, R. Use characteristics and mode choice behavior of electric bike users in China. Transp. Policy 2007, 14, 247–257. [Google Scholar] [CrossRef]
- Weinert, J.; Ma, C.; Yang, X.; Cherry, C. Electric Two-Wheelers in China: Effect on Travel Behavior, Mode Shift, and User Safety Perceptions in a Medium-Sized City. Transp. Res. Rec. J. Transp. Res. Board 2007, 2038, 62–68. [Google Scholar] [CrossRef]
- Jones, T.; Harms, L.; Heinen, E. Motives, perceptions and experiences of electric bicycle owners and implications for health, wellbeing and mobility. J. Transp. Geogr. 2016, 53, 41–49. [Google Scholar] [CrossRef]
- Popovich, N.; Gordon, E.; Shao, Z.; Xing, Y.; Wang, Y.; Handy, S. Experiences of electric bicycle users in the Sacramento, California area. Travel Behav. Soc. 2014, 1, 37–44. [Google Scholar] [CrossRef]
- Johnson, M.; Rose, G. Extending life on the bike: Electric bike use by older Australians. J. Transp. Health 2015, 2, 276–283. [Google Scholar] [CrossRef]
- Langford, B.C.; Chen, J.; Cherry, C.R. Risky riding: Naturalistic methods comparing safety behavior from conventional bicycle riders and electric bike riders. Accid. Anal. Prev. 2015, 82, 220–226. [Google Scholar] [CrossRef] [PubMed]
- Weber, T.; Scaramuzza, G.; Schmitt, K.U. Evaluation of e-bike accidents in Switzerland. Accid. Anal. Prev. 2014, 73, 47–52. [Google Scholar] [CrossRef] [PubMed]
- Langford, B.C.; Cherry, C.R.; Bassett, D.R.; Fitzhugh, E.C.; Dhakal, N. Comparing physical activity of pedal-assist electric bikes with walking and conventional bicycles. J. Transp. Health 2017, in press. [Google Scholar] [CrossRef]
- MacArthur, J.; Kobel, N. Evaluation of an Electric Bike Pilot Project at Three Employment Campuses in Portland, Oregon. In Proceedings of the Transportation Research Board 95th Annual Meeting, Washington, DC, USA, 10–14 January 2016. [Google Scholar]
- Dill, J.; Rose, G. Electric bikes and transportation policy: Insights from early adopters. Transp. Res. Rec. J. Transp. Res. Board 2012, 2314, 1–6. [Google Scholar] [CrossRef]
- Langford, B.; Cherry, C.; Yoon, T.; Worley, S.; Smith, D. North America’s First E-Bikeshare. Transp. Res. Rec. J. Transp. Res. Board 2013, 2387, 120–128. [Google Scholar] [CrossRef]
- Rose, G. E-bikes and urban transportation: Emerging issues and unresolved questions. Transportation 2012, 39, 81–96. [Google Scholar] [CrossRef]
- Fyhri, A.; Heinen, E.; Fearnley, N.; Sundfør, H.B. A push to cycling—Exploring the e-bike’s role in overcoming barriers to bicycle use with a survey and an intervention study. Int. J. Sustain. Transp. 2017, 11, 681–695. [Google Scholar] [CrossRef]
- Gojanovic, B.; Welker, J.; Iglesias, K.; Daucourt, C.; Gremion, G. Electric bicycles as a new active transportation modality to promote health. Med. Sci. Sports Exerc. 2011, 43, 2204–2210. [Google Scholar] [CrossRef] [PubMed]
- Louis, J.; Brisswalter, J.; Morio, C.; Barla, C.; Temprado, J.-J. The electrically assisted bicycle: An alternative way to promote physical activity. Am. J. Phys. Med. Rehabil. 2012, 91, 931–940. [Google Scholar] [CrossRef] [PubMed]
- Thomas, A. A More Sustainable Minivan? An Exploratory Study of Electric Bicycle Use by San Francisco Bay Area Families. In Proceedings of the Transportation Research Board 95th Annual Meeting, Washington, DC, USA, 10–14 January 2016. [Google Scholar]
- Fyhri, A.; Fearnley, N. Effects of e-bikes on bicycle use and mode share. Transp. Res. Part D Transp. Environ. 2015, 36, 45–52. [Google Scholar] [CrossRef]
- Wolf, A.; Seebauer, S. Technology adoption of electric bicycles: A survey among early adopters. Transp. Res. Part A Policy Pract. 2014, 69, 196–211. [Google Scholar] [CrossRef]
- Du, W.; Yang, J.; Powis, B.; Zheng, X.; Ozanne-Smith, J.; Bilston, L.; Wu, M. Understanding on-road practices of electric bike riders: An observational study in a developed city of China. Accid. Anal. Prev. 2013, 59, 319–326. [Google Scholar] [CrossRef] [PubMed]
- Yao, L.; Wu, C. Traffic Safety for Electric Bike Riders in China. Transp. Res. Rec. J. Transp. Res. Board 2012, 2314, 49–56. [Google Scholar] [CrossRef]
- Hu, F.; Lv, D.; Zhu, J.; Fang, J. Related Risk Factors for Injury Severity of E-bike and Bicycle Crashes in Hefei. Traffic Inj. Prev. 2014, 15, 319–323. [Google Scholar] [CrossRef] [PubMed]
- Schepers, J.P.; Fishman, E.; Den Hertog, P.; Wolt, K.K.; Schwab, A.L. The safety of electrically assisted bicycles compared to classic bicycles. Accid. Anal. Prev. 2014, 73, 174–180. [Google Scholar] [CrossRef] [PubMed]
- Papoutsi, S.; Martinolli, L.; Braun, C.T.; Exadaktylos, A.K. E-Bike Injuries: Experience from an Urban Emergency Department: A Retrospective Study from Switzerland. Emerg. Med. Int. 2014, 2014, 850236. [Google Scholar] [CrossRef] [PubMed]
- Campbell, A.A.; Cherry, C.R.; Ryerson, M.S.; Yang, X. Factors influencing the choice of shared bicycles and shared electric bikes in Beijing. Transp. Res. Part C Emerg. Technol. 2016, 67, 399–414. [Google Scholar] [CrossRef]
- Ji, S.; Cherry, C.R.; J. Bechle, M.; Wu, Y.; Marshall, J.D. Electric Vehicles in China: Emissions and Health Impacts. Environ. Sci. Technol. 2012, 46, 2018–2024. [Google Scholar] [CrossRef] [PubMed]
- MacArthur, J.; Kobel, N.; Dill, J.; Mumuni, Z. Evaluation of an Electric Bike Pilot Project at Three Employment Campuses in Portland, Oregon; National Institute for Transportation and Communities (NITC): Portland, OR, USA, 2016; Available online: http://pdxscholar.library.pdx.edu/trec_reports/125/ (accessed on 18 September 2017).
- Washington, S.P.; Karlaftis, M.G.; Mannering, F.L. Statistical and Econometric Methods for Transportation Data Analysis; CRC Press: Boca Raton, FL, USA, 2011. [Google Scholar]
- Williams, R. Gologit2: A Program for Generalized Logistic Regression/Partial Proportional Odds Models for Ordinal Variables. 2005. Available online: http://www.nd.edu/~rwilliam/stata/gologit2.pdf (accessed on 5 May 2017).
- McCullagh, P. Regression models for ordinal data. J. R. Stat. Soc. Ser. B 1980, 42, 109–142. [Google Scholar]
- Pucher, J.; Buehler, R.; Seinen, M. Bicycling renaissance in North America? An update and re-appraisal of cycling trends and policies. Transp. Res. Part A Policy Pract. 2011, 45, 451–475. [Google Scholar] [CrossRef]
- Moritz, W. Survey of North American Bicycle Commuters: Design and Aggregate Results. Transp. Res. Rec. J. Transp. Res. Board 1997, 1578, 91–101. [Google Scholar] [CrossRef]
- Garikapati, V.M.; Pendyala, R.M.; Morris, E.A.; Mokhtarian, P.L.; Mcdonald, N. Activity patterns, time use, and travel of millennials: A generation in transition? Transp. Rev. 2016, 36, 558–584. [Google Scholar] [CrossRef]
- Ryan, R.M.; Deci, E.L. Self-determination theory and the facilitation of intrinsic motivation, social development, and well-being. Am. Psychol. 2000, 55, 68–78. [Google Scholar] [CrossRef] [PubMed]
Figure 1.
Locations of survey respondents (the total sample range of each state is 1 to 172).
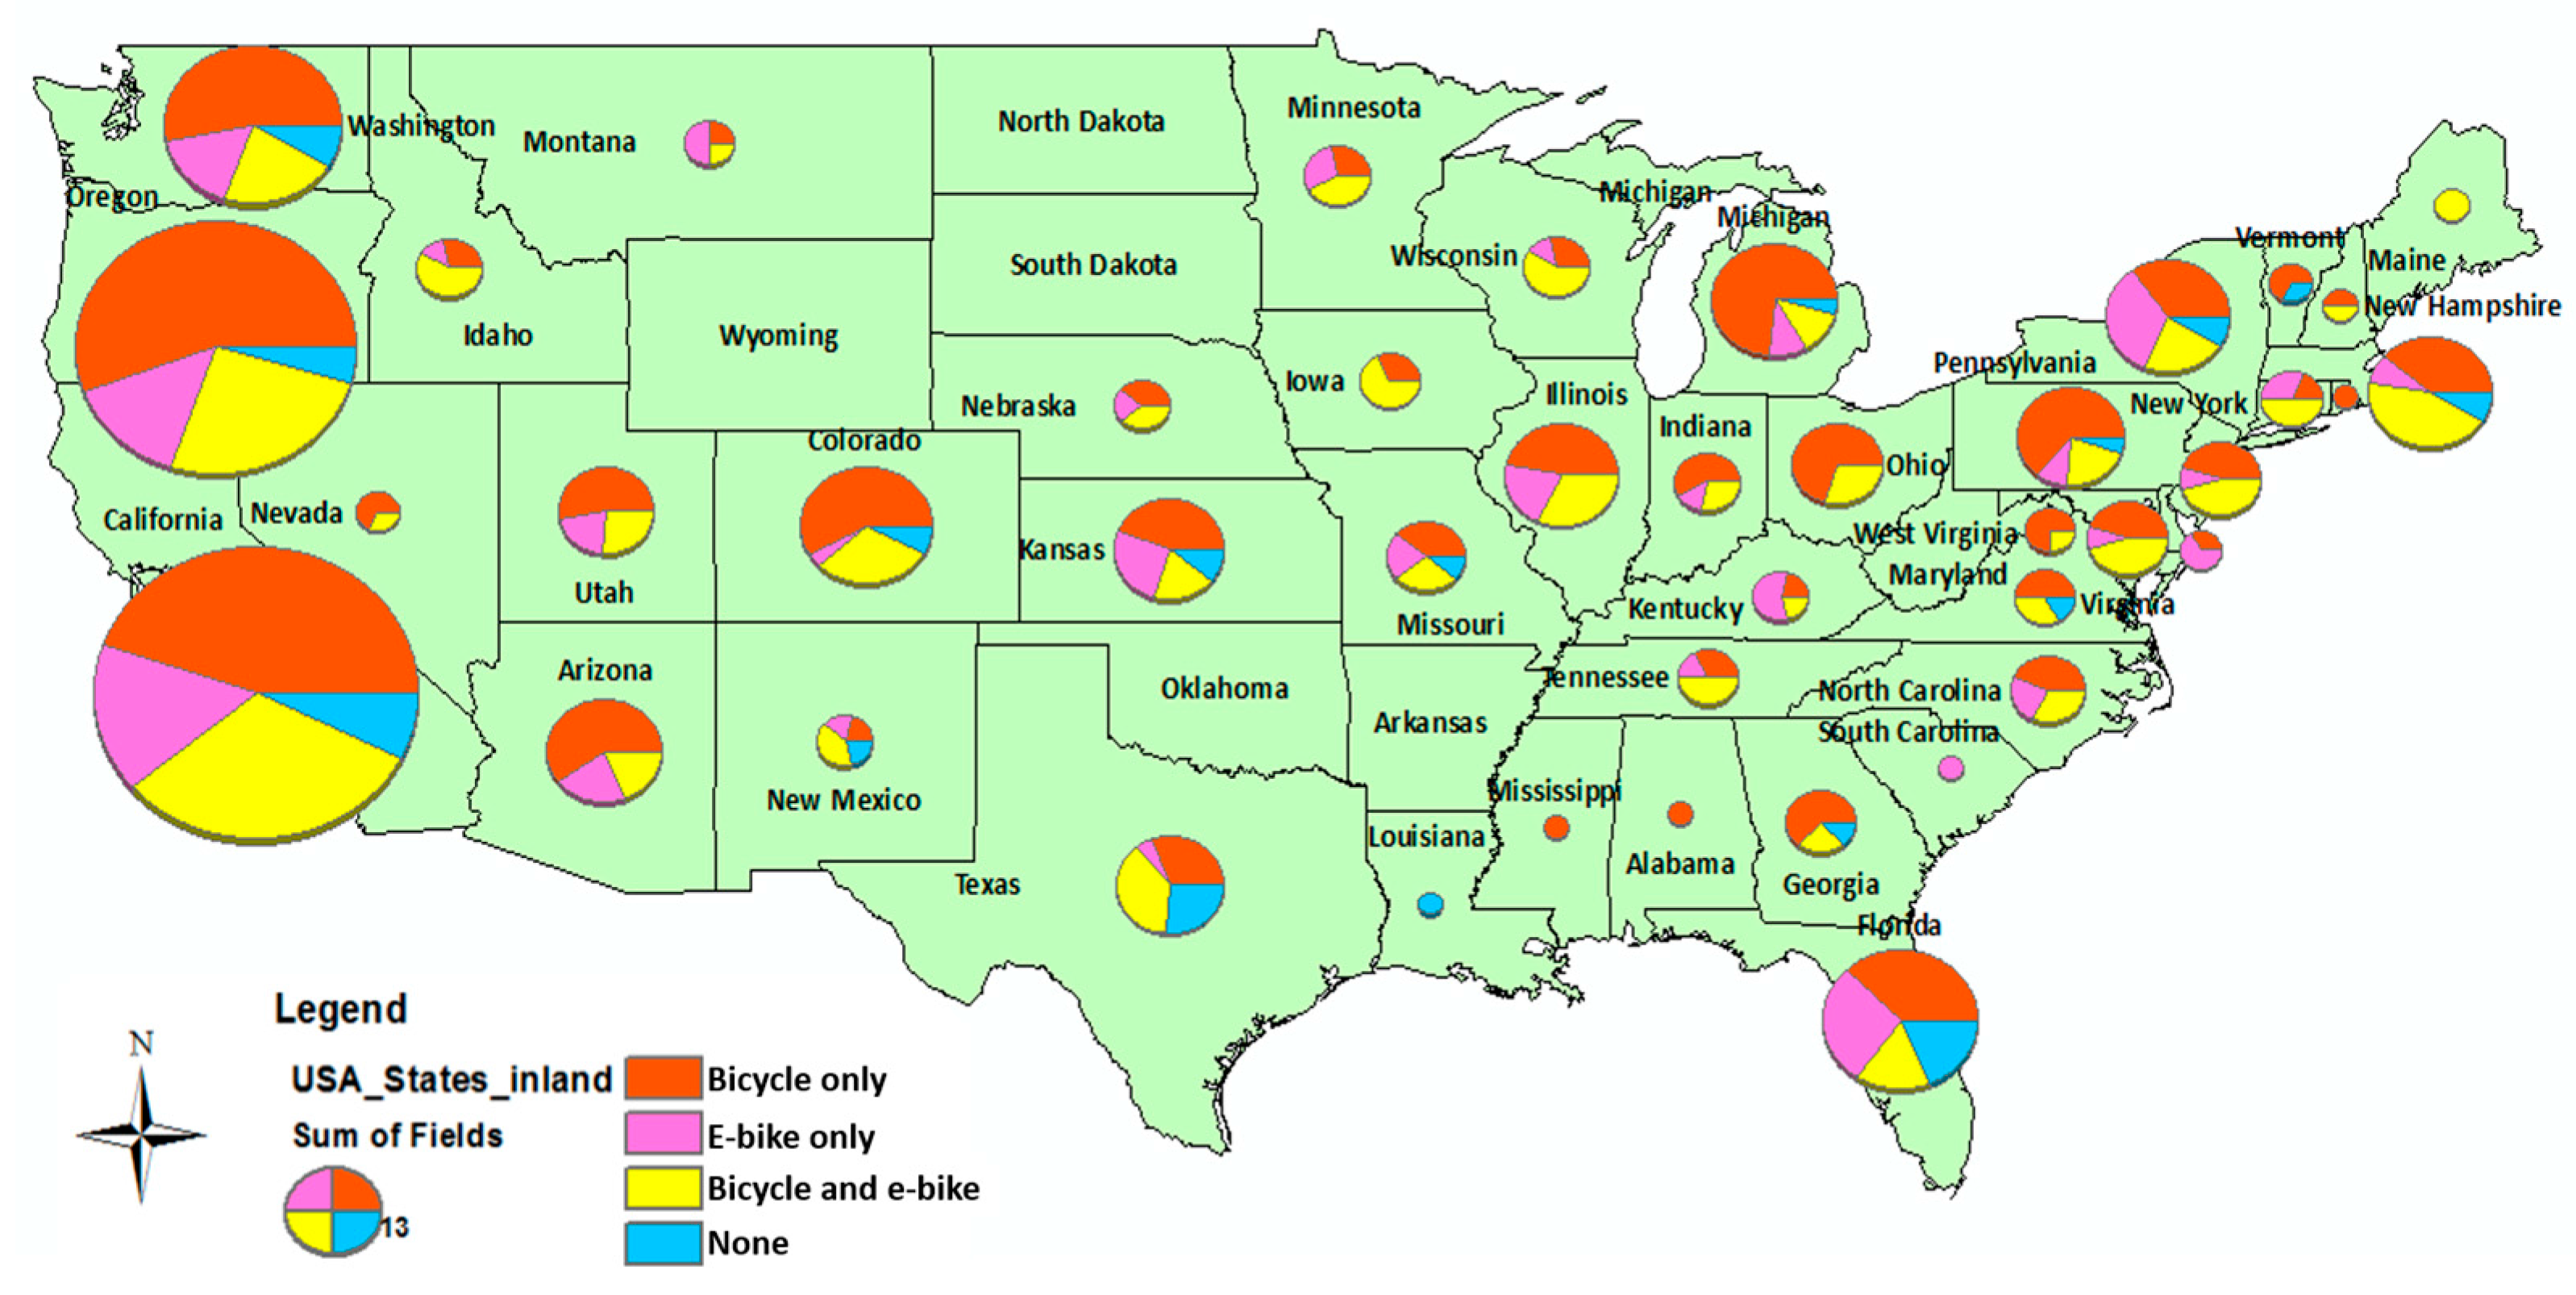
Figure 2.
Conventional bike types of Bicycle only group and e-bike types of EO and BE (the “other” bike type refers to some special bike types which cannot be grouped into current categories e.g., recumbents or custom bicycle types. For the BE category, we only include the e-bike type in this figure).
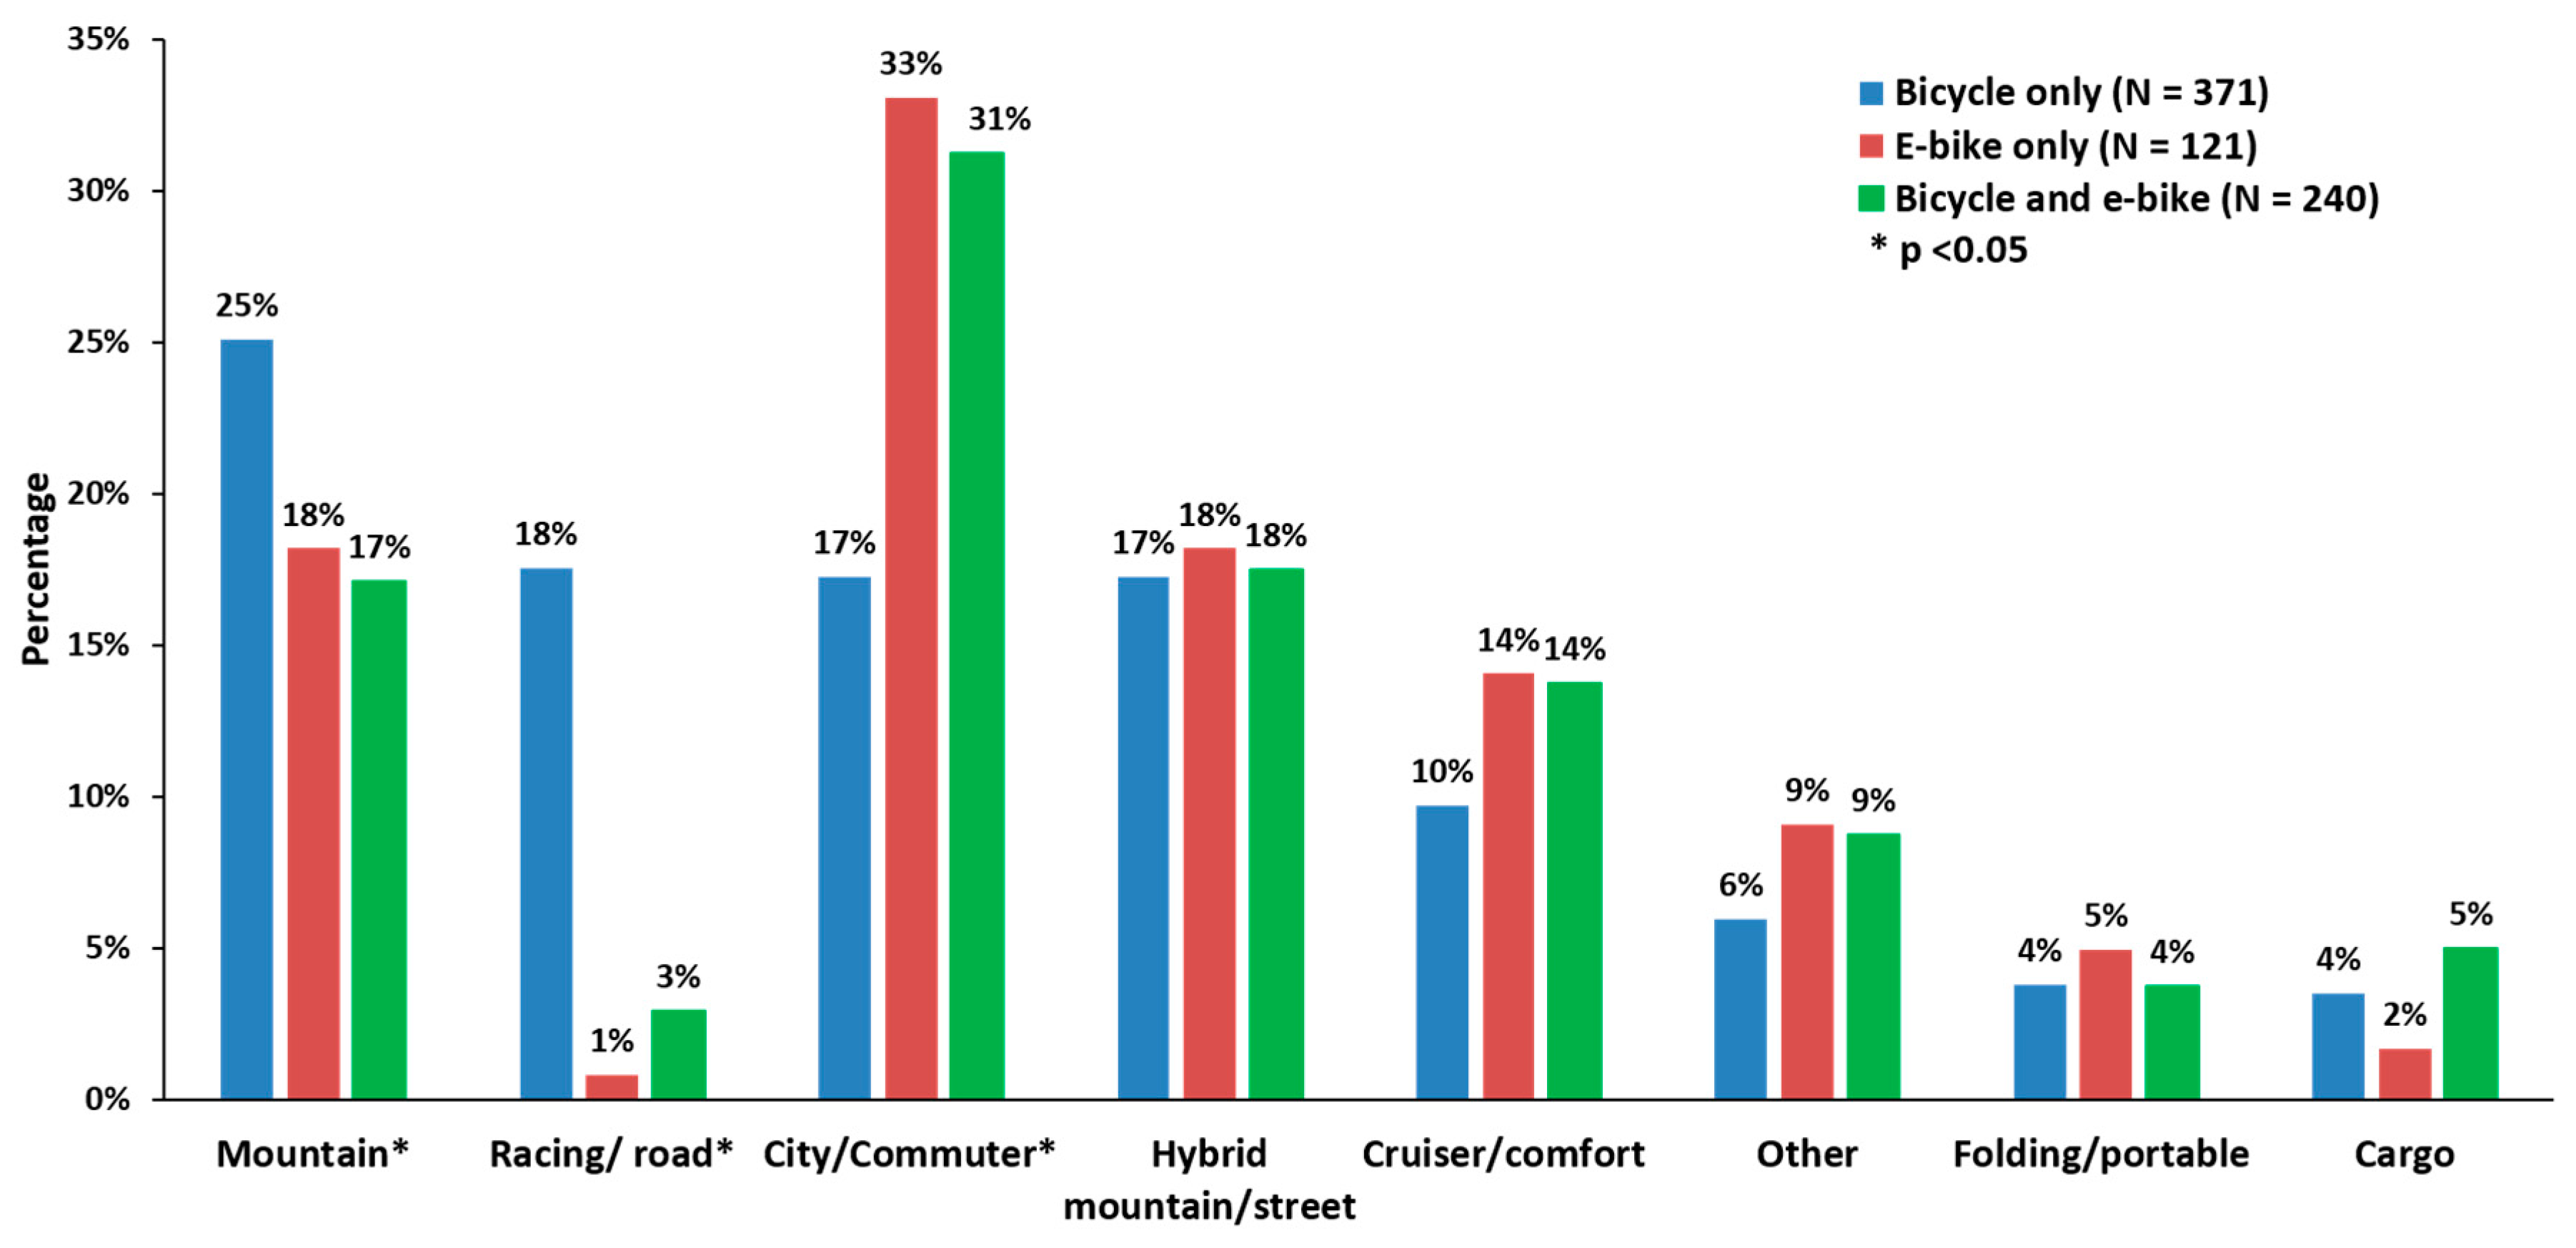
Figure 3.
Riding partner distribution of the three types of respondents.
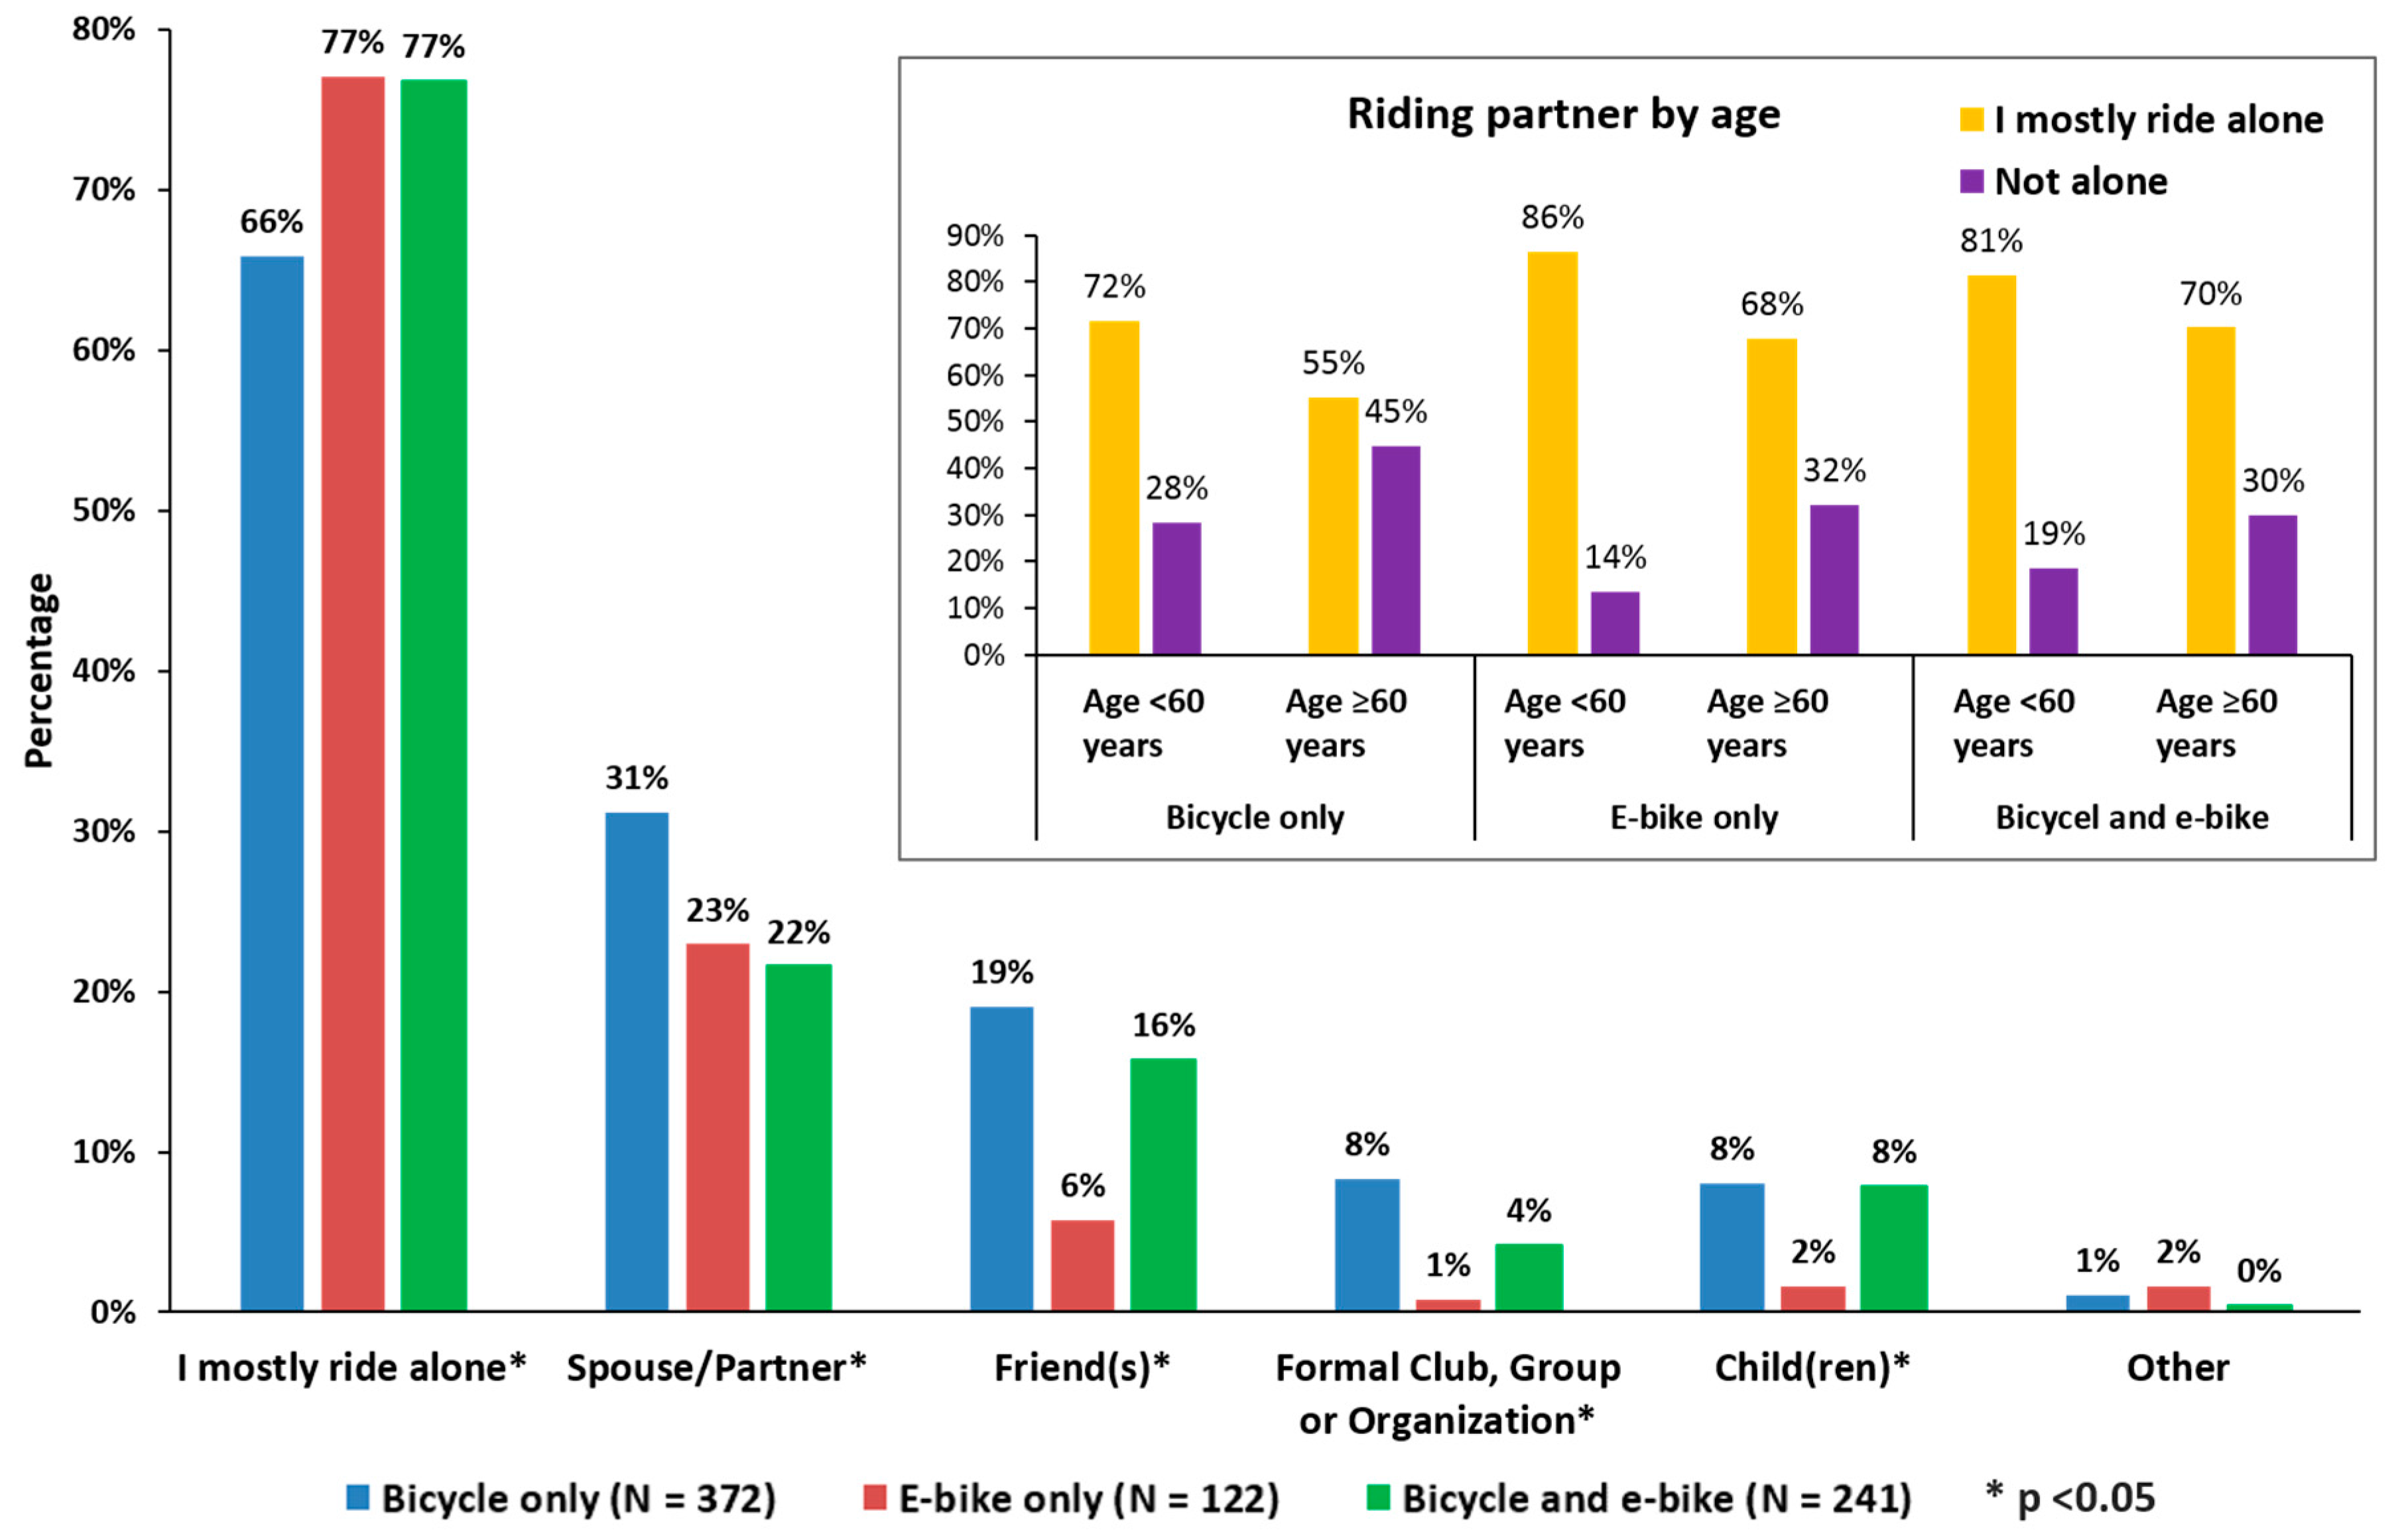
Figure 4.
Comparison of riding frequency (A) and distance (B) of three types’ respondents.


Figure 5.
Comparison of travel purposes (A) and reasons for cycling (B).
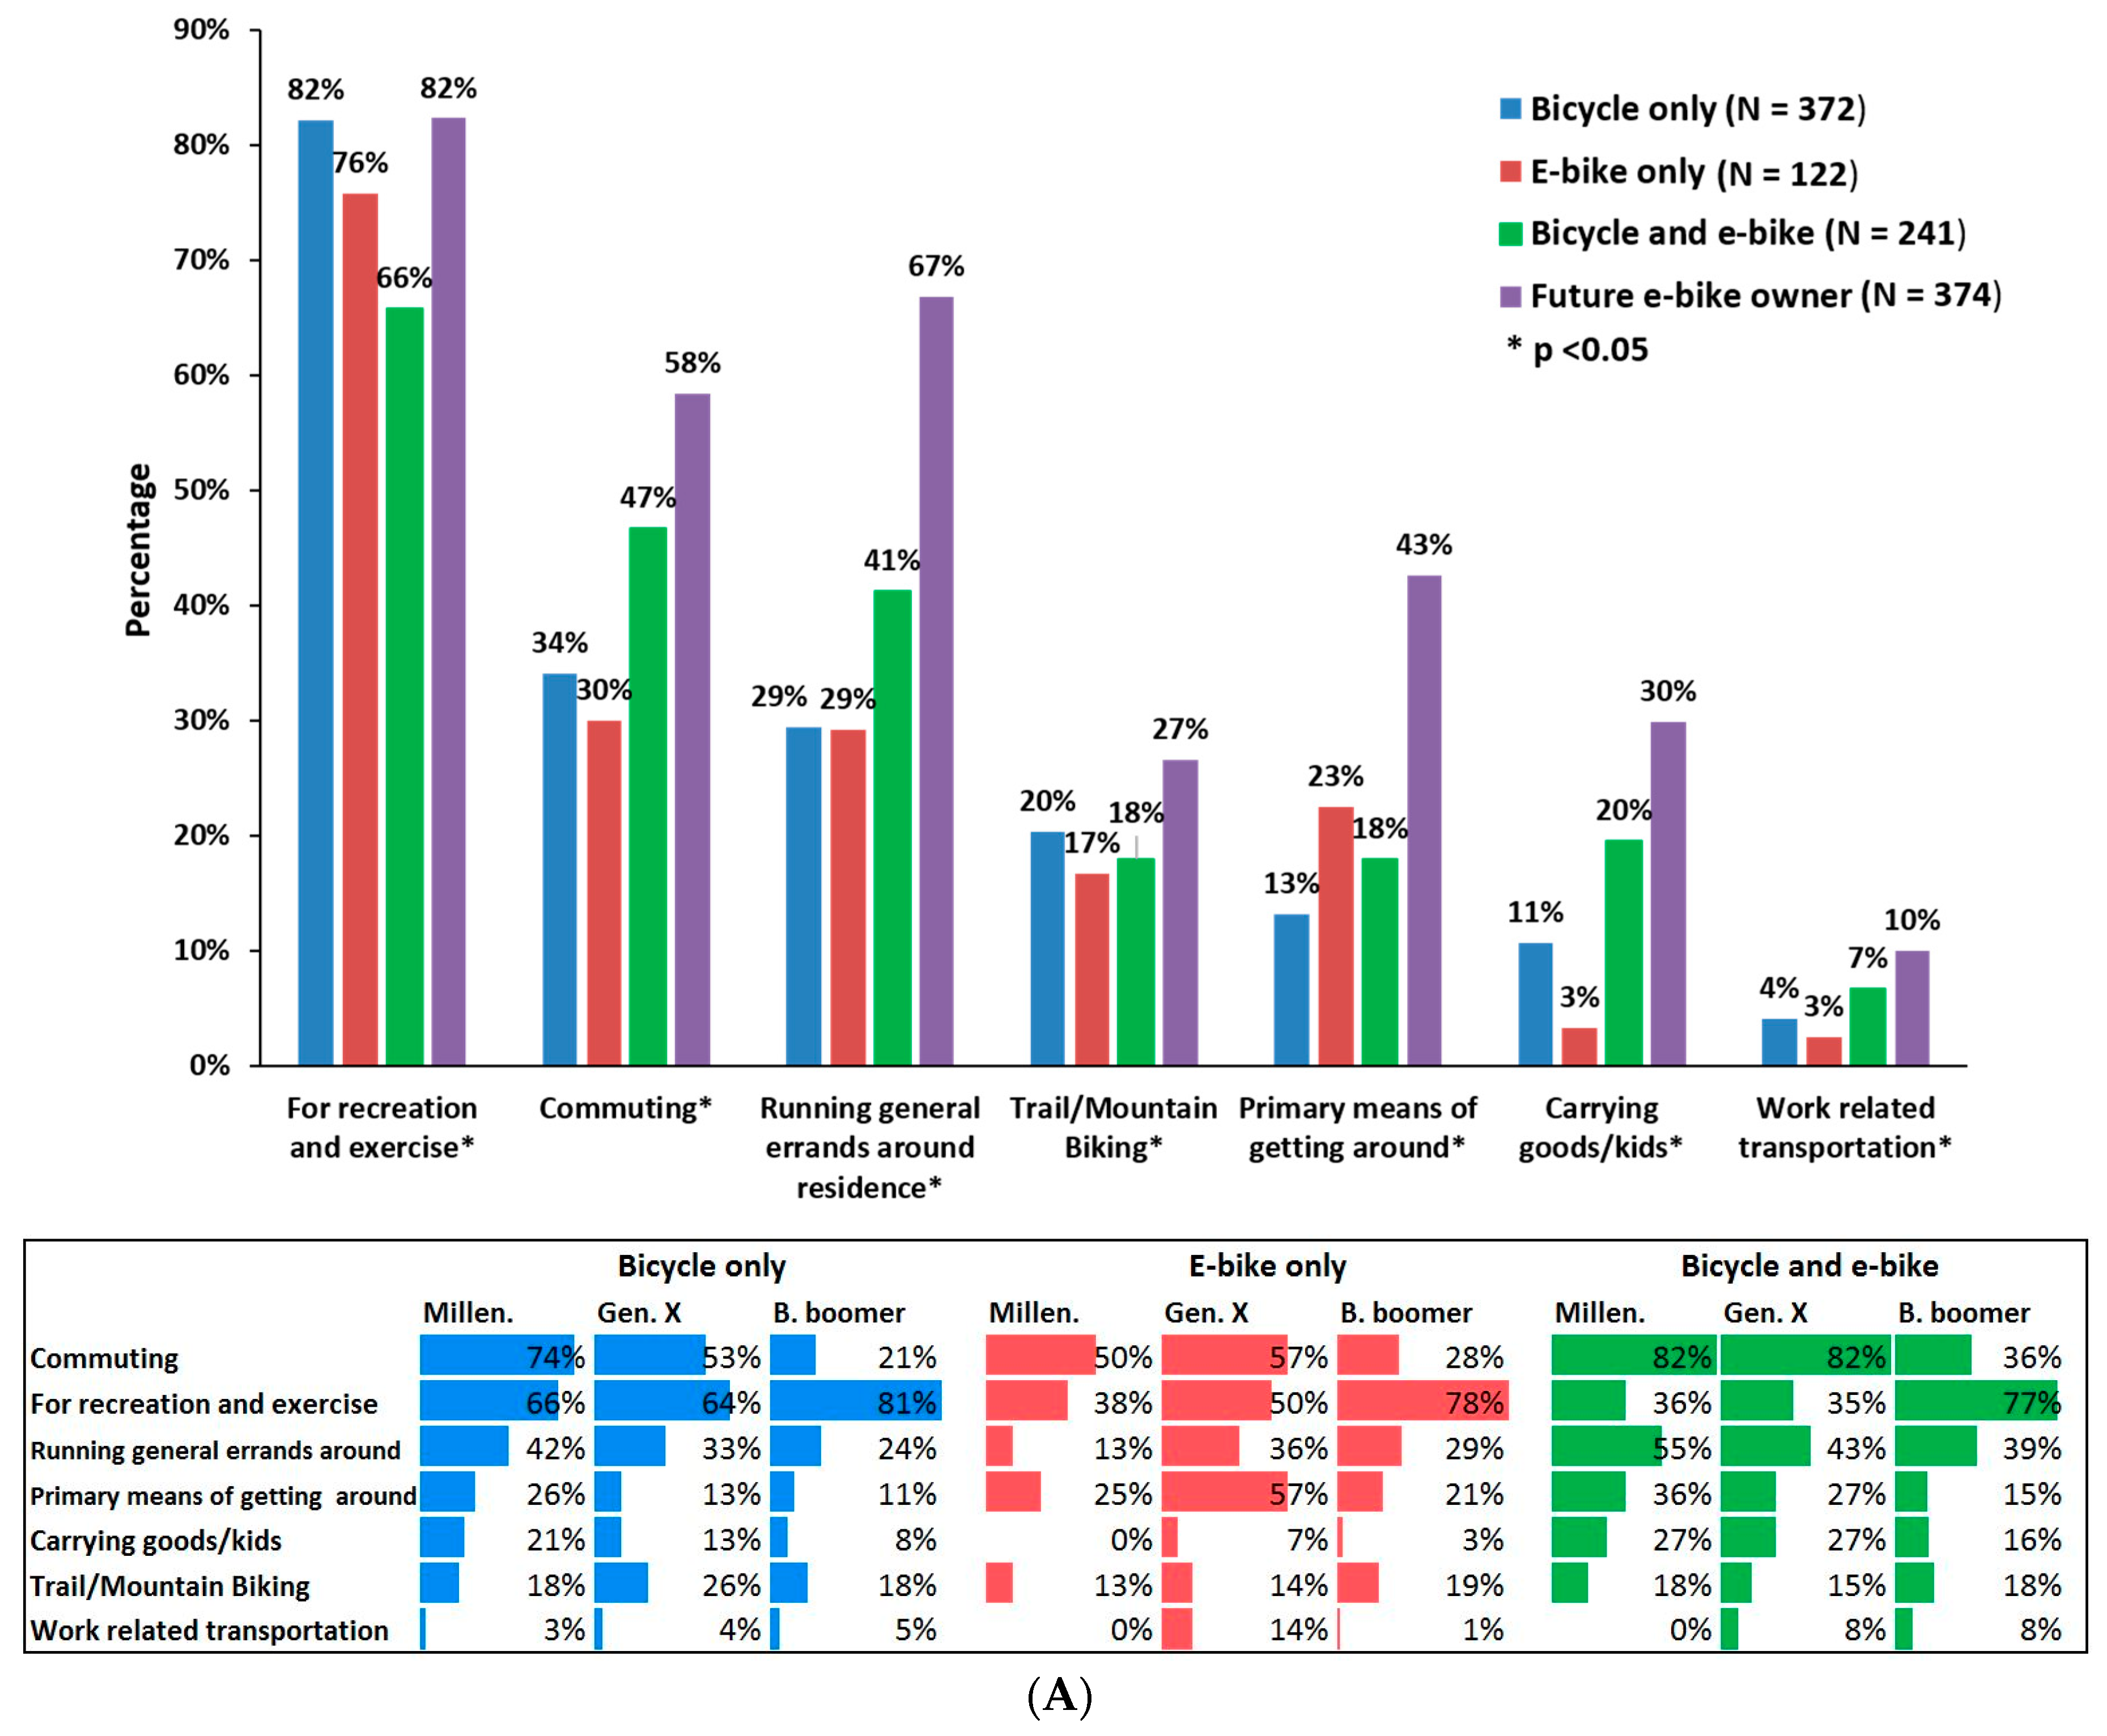
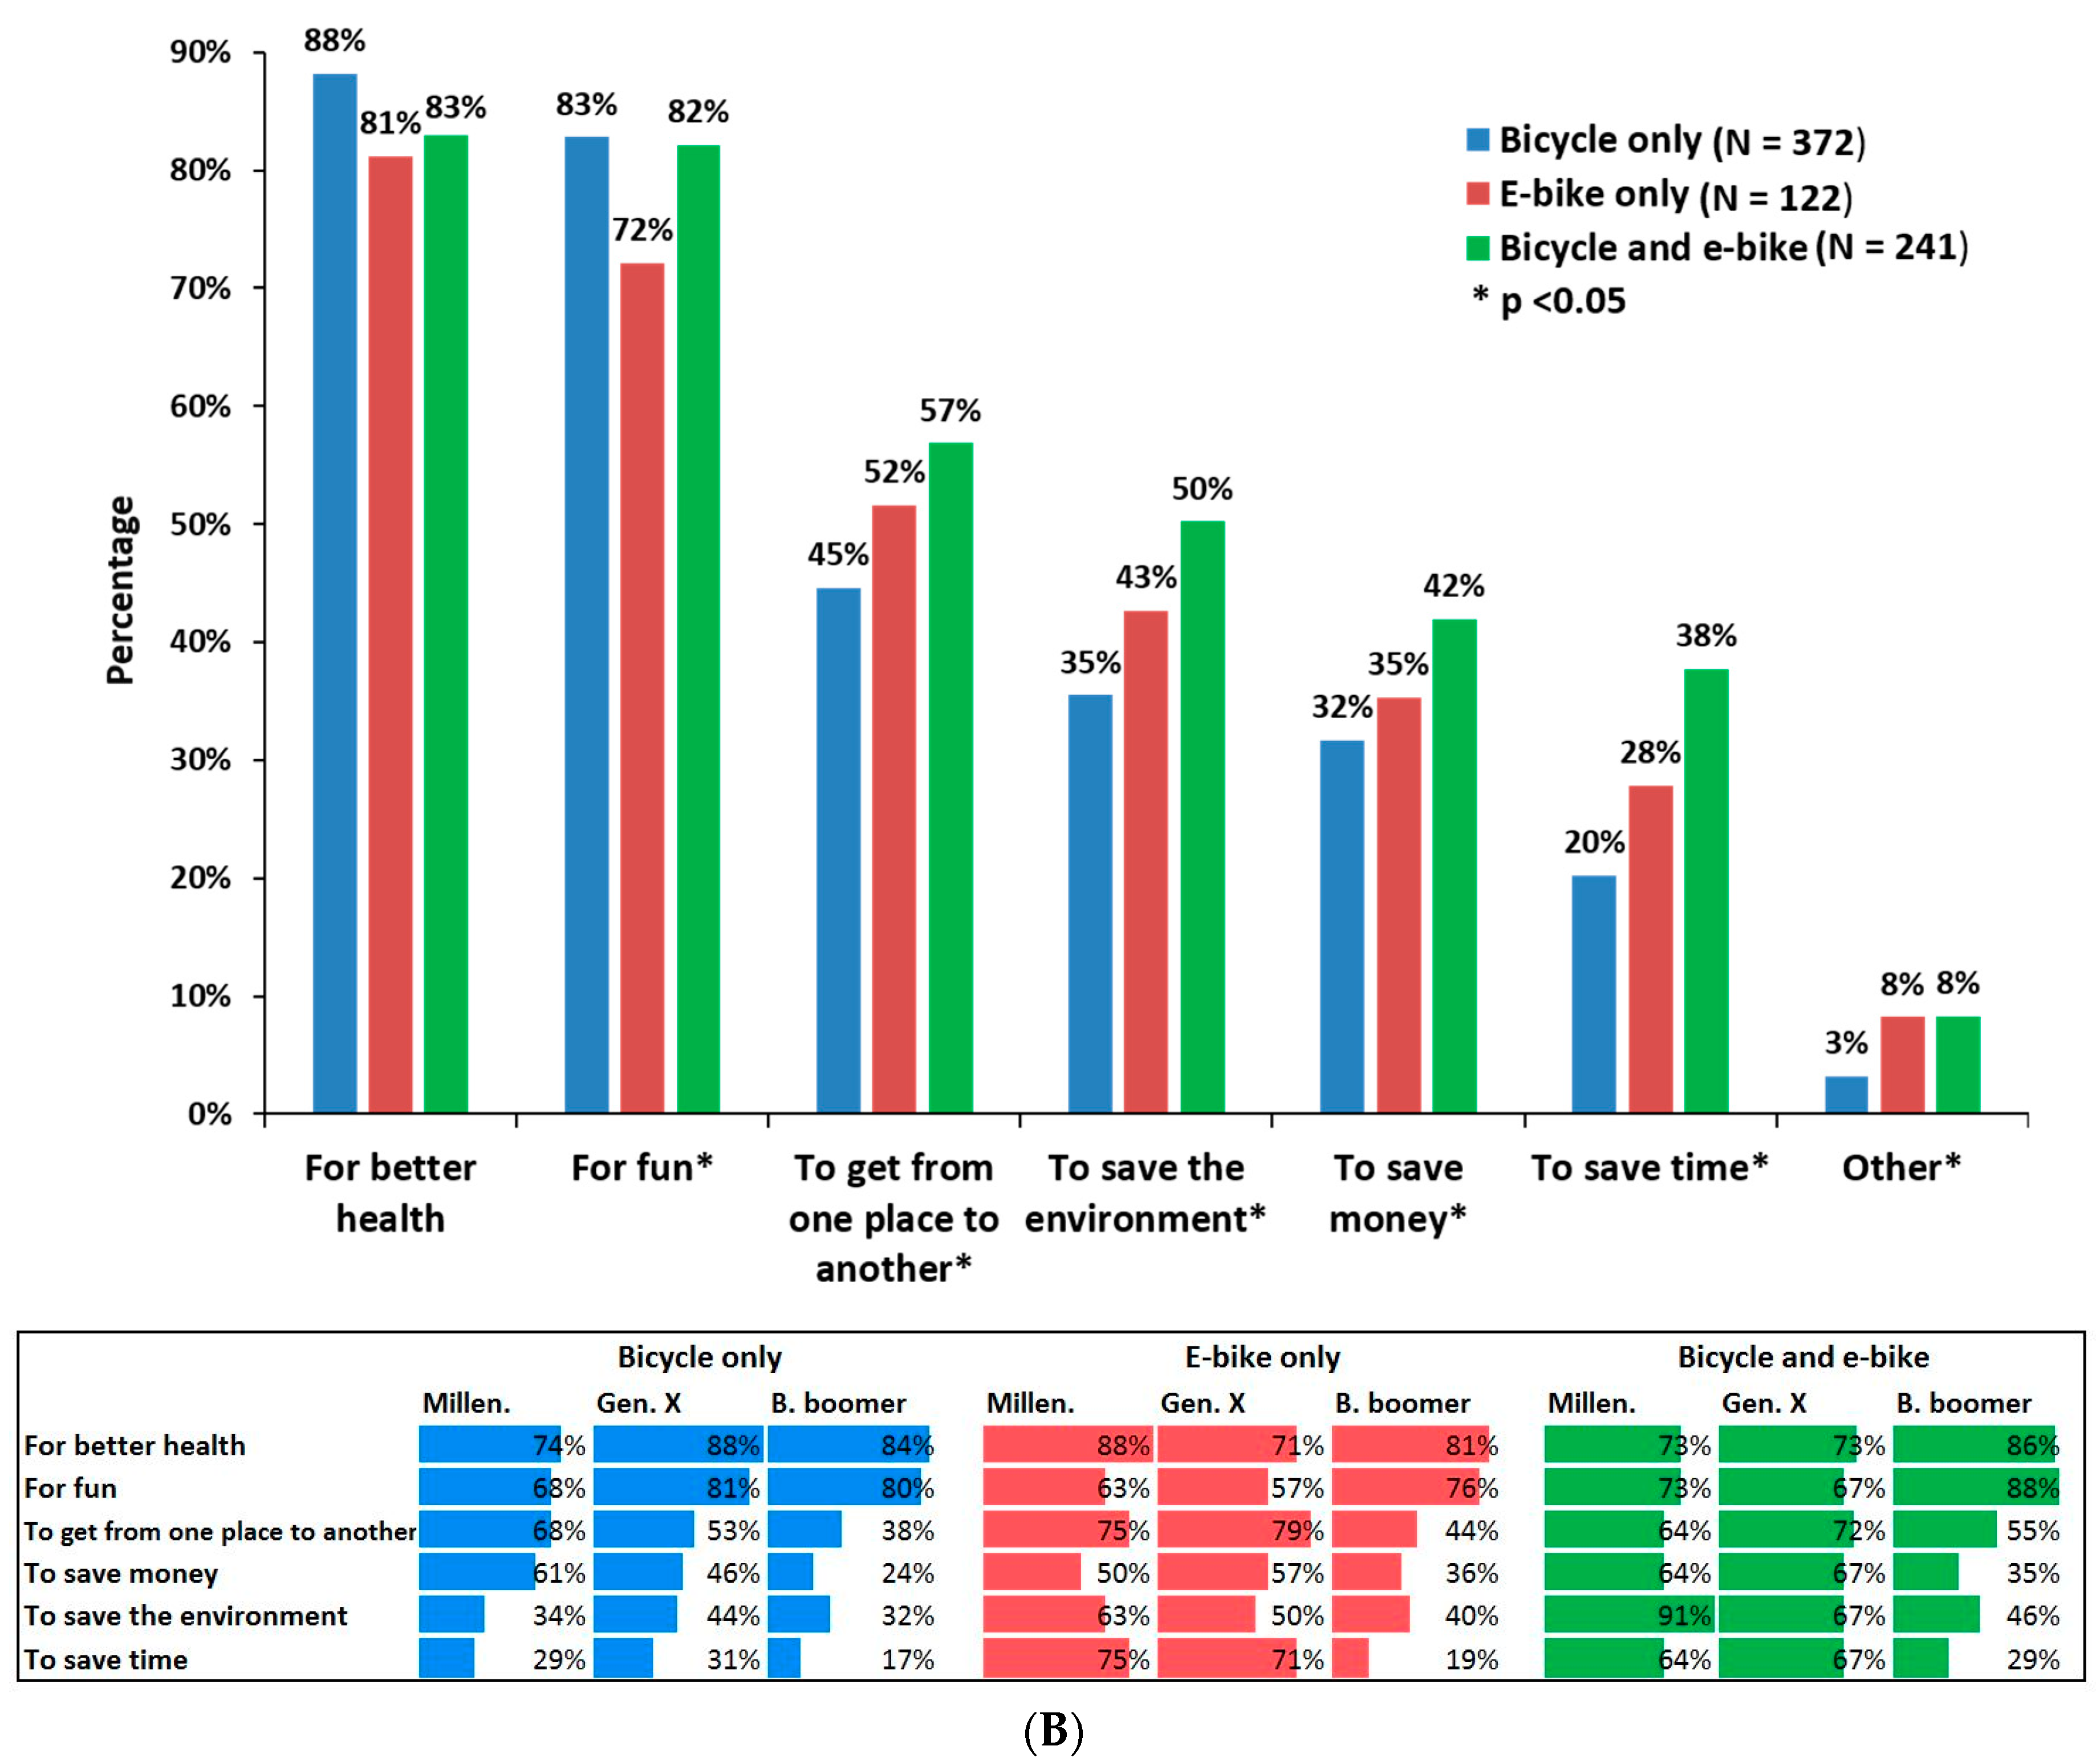
Figure 6.
Reasons to be interested in e-bikes.

Table 1.
Summary of survey scope.
| Survey Component | Factors |
|---|---|
| Cycling experience |
|
| Motives and perception for e-bike |
|
| Expectation of future e-bikes |
|
| Bike purchase |
|
| Demographics |
|
Table 2.
Respondent demographic characteristics.
| Total | Bicycle Only (BO) | E-Bike Only (EO) | Bicycle and E-Bike (BE) | |||||
|---|---|---|---|---|---|---|---|---|
| Variables | Value | % | Value | % | Value | % | Value | % |
| Gender | ||||||||
| Male | 622 | 83% | 323 | 83% | 98 | 80% | 201 | 83% |
| Female | 128 | 17% | 64 | 17% | 24 | 20% | 40 | 17% |
| Age | ||||||||
| Under 18 | 2 | 0% | 1 | 0% | 0 | 0.0% | 1 | 0% |
| 18 to 34 | 55 | 7% | 37 | 10% | 8 | 7% | 10 | 4% |
| 35 to 49 * | 152 | 21% | 78 | 21% | 14 | 12% | 60 | 25% |
| 50 to 69 | 448 | 61% | 233 | 62% | 78 | 64% | 137 | 57% |
| over 69 * | 81 | 11% | 29 | 8% | 21 | 17% | 31 | 13% |
| Education | ||||||||
| High school or less | 37 | 5% | 17 | 4% | 9 | 7% | 11 | 5% |
| Technical Education | 57 | 8% | 34 | 9% | 9 | 7% | 14 | 6% |
| Some college | 181 | 24% | 85 | 22% | 37 | 30% | 59 | 24% |
| Bachelor’s Degree | 243 | 32% | 128 | 33% | 35 | 29% | 80 | 33% |
| Advanced College Degree | 232 | 31% | 123 | 32% | 32 | 26% | 77 | 32% |
| Annual Household Income | ||||||||
| Below $20,000 | 29 | 5% | 16 | 5% | 8 | 8% | 5 | 3% |
| $20,000 to $60,000 | 158 | 26% | 77 | 25% | 29 | 29% | 52 | 27% |
| $61,000 to $100,000 | 174 | 29% | 97 | 31% | 32 | 32% | 45 | 24% |
| $101,000 to $140,000 | 121 | 20% | 55 | 18% | 17 | 17% | 49 | 26% |
| $141,000 to $180,000 | 57 | 9% | 32 | 10% | 6 | 6% | 19 | 10% |
| Above $180,000 | 63 | 10% | 34 | 11% | 9 | 9% | 20 | 11% |
| Household Children under the age of 18 | ||||||||
| None * | 577 | 77% | 300 | 78% | 106 | 87% | 171 | 71% |
| 1 | 71 | 10% | 38 | 10% | 12 | 10% | 21 | 9% |
| 2 | 77 | 10% | 35 | 9% | 4 | 3% | 38 | 16% |
| 3 or more | 21 | 3% | 13 | 3% | 0 | 0% | 8 | 3% |
| No. of people in Household | ||||||||
| 1 * | 111 | 16% | 47 | 12% | 31 | 25% | 33 | 14% |
| 2 | 380 | 54% | 203 | 52% | 62 | 51% | 115 | 48% |
| 3 or more | 215 | 30% | 111 | 29% | 27 | 22% | 77 | 32% |
| Personal vehicle ownership | ||||||||
| Bicycle | 628 | 84% | 387 | 100.0% | - | - | 241 | 100% |
| E-bike | 363 | 48% | - | - | 122 | 100% | 241 | 100% |
| E-scooter | 20 | 3% | 6 | 2% | 1 | 1% | 13 | 5% |
| Scooter | 42 | 6% | 22 | 6% | 5 | 4% | 15 | 6% |
| Regular automobile * | 536 | 71% | 294 | 76% | 53 | 43% | 189 | 78% |
| Hybrid automobile | 80 | 11% | 44 | 11% | 14 | 11% | 22 | 9% |
| Electric automobile | 42 | 6% | 19 | 5% | 3 | 2% | 20 | 8% |
Table 3.
Results of ordered logit model of interest in e-bike purchase in the future.
| Variables | Coef. | Std. Err. | Z-Test | p > |z| | 95% Conf. Interval | |
|---|---|---|---|---|---|---|
| Personally own regular automobile (Yes = 1; no = 0) | −0.379 | 0.363 | −1.050 | 0.296 | −1.090 | 0.332 |
| Personally own hybrid auto (Yes = 1; no = 0) | −0.186 | 0.432 | −0.430 | 0.667 | −1.032 | 0.660 |
| How do use your bicycle? | ||||||
| Carrying goods/kids | ||||||
| Male, carrying goods/kids = no | 1.073 ** | 0.510 | 2.100 | 0.036 | 0.072 | 2.073 |
| Female, carrying goods/kids = no | 1.510 ** | 0.597 | 2.530 | 0.011 | 0.340 | 2.681 |
| Male, carrying goods/kids = yes | base | |||||
| Female, carrying goods/kids = yes | −0.605 | 1.186 | −0.510 | 0.610 | −2.930 | 1.720 |
| For recreation and exercise (Yes = 1; no = 0) | −0.686 * | 0.398 | −1.720 | 0.085 | −1.465 | 0.094 |
| Racing (Yes = 1; no = 0) | −1.426 * | 0.764 | −1.870 | 0.062 | −2.923 | 0.070 |
| Trail/Mountain biking (Yes = 1; no = 0) | 0.245 | 0.376 | 0.650 | 0.516 | −0.493 | 0.983 |
| Running general errands around residence (Yes = 1; no = 0) | 0.730 * | 0.391 | 1.870 | 0.062 | −0.037 | 1.497 |
| What are the most important reason you ride your bicycle? Multiple choices | ||||||
| For Fun (Yes = 1; no = 0) | 0.834 ** | 0.352 | 2.360 | 0.018 | 0.143 | 1.524 |
| To get from one place to another (Yes = 1; no = 0) | 0.432 | 0.319 | 1.350 | 0.176 | −0.194 | 1.057 |
| Familiarity of e-bikes | ||||||
| Not at all familiar (Yes = 1; no = 0) | base | |||||
| Somewhat familiar (Yes = 1; no = 0) | 1.021 | 0.638 | 1.600 | 0.110 | −0.230 | 2.272 |
| Familiar (Yes = 1; no = 0) | 1.371 ** | 0.643 | 2.130 | 0.033 | 0.111 | 2.631 |
| Very familiar (Yes = 1; no = 0) | 1.614 ** | 0.692 | 2.330 | 0.020 | 0.258 | 2.971 |
| Extremely familiar (Yes = 1; no = 0) | 2.272 ** | 0.981 | 2.310 | 0.021 | 0.348 | 4.195 |
| No. of people in household | 0.183 | 0.131 | 1.400 | 0.162 | −0.074 | 0.439 |
| Education level (0: below college degree; 1: ≥ college degree) | −0.811 *** | 0.312 | −2.600 | 0.009 | −1.422 | −0.200 |
| Annual household income | ||||||
| Below $20,000 | base | |||||
| $20,000 to $60,000 | 1.966 *** | 0.711 | 2.760 | 0.006 | 0.572 | 3.360 |
| $61,000 to $100,000 | 1.164 * | 0.683 | 1.700 | 0.088 | −0.175 | 2.503 |
| $101,000 to $140,000 | 1.707 ** | 0.735 | 2.320 | 0.020 | 0.266 | 3.148 |
| $141,000 to $180,000 | 1.749 ** | 0.808 | 2.160 | 0.031 | 0.164 | 3.333 |
| Above $180,000 | 1.105 | 0.762 | 1.450 | 0.147 | −0.389 | 2.600 |
| I prefer not to answer | 1.489 ** | 0.724 | 2.060 | 0.040 | 0.071 | 2.908 |
| Type of terrain | ||||||
| Primarily flat | base | |||||
| Mix of flat and hilly | 0.244 | 0.319 | 0.760 | 0.445 | −0.382 | 0.870 |
| Primarily hilly | 0.935 | 0.594 | 1.570 | 0.116 | −0.230 | 2.099 |
| Cut 1: Not interested to probably interested | −2.218 | 1.282 | −4.731 | 0.295 | ||
| Cut 2: Probably interested to definitely interested | 1.261 | 1.240 | −1.170 | 3.692 | ||
Sample size: 373 Log likelihood = −200.5791; Likelihood ratio chi-square = 54.42; Prob > Chi-square = 0.0006. * p-value ≤0.1, ** p-value ≤0.05, *** p-value ≤0.01.
© 2017 by the authors. Licensee MDPI, Basel, Switzerland. This article is an open access article distributed under the terms and conditions of the Creative Commons Attribution (CC BY) license (http://creativecommons.org/licenses/by/4.0/).
Share and Cite
MDPI and ACS Style
Ling, Z.; Cherry, C.R.; MacArthur, J.H.; Weinert, J.X. Differences of Cycling Experiences and Perceptions between E-Bike and Bicycle Users in the United States. Sustainability 2017, 9, 1662. https://doi.org/10.3390/su9091662
AMA Style
Ling Z, Cherry CR, MacArthur JH, Weinert JX. Differences of Cycling Experiences and Perceptions between E-Bike and Bicycle Users in the United States. Sustainability. 2017; 9(9):1662. https://doi.org/10.3390/su9091662
Chicago/Turabian StyleLing, Ziwen, Christopher R. Cherry, John H. MacArthur, and Jonathan X. Weinert. 2017. "Differences of Cycling Experiences and Perceptions between E-Bike and Bicycle Users in the United States" Sustainability 9, no. 9: 1662. https://doi.org/10.3390/su9091662
Note that from the first issue of 2016, this journal uses article numbers instead of page numbers. See further details here.