Water-Thermal Energy Production System: A Case Study from Norway


Department of Social Sciences, Western Norway University of Applied Sciences, 5063 Bergen, Norway
*
Author to whom correspondence should be addressed.
†
These authors contributed equally to this work.
Sustainability 2017, 9(9), 1665; https://doi.org/10.3390/su9091665
Submission received: 18 August 2017
/
Revised: 6 September 2017
/
Accepted: 13 September 2017
/
Published: 19 September 2017
(This article belongs to the Section Energy Sustainability)
Abstract
:The purpose of this paper is to describe a new way of producing renewable energy based on fjords as a water heater. We will call this system the Water-thermal Energy Production System (WEPS), because the basic idea is to extract heating and cooling energy from water. Although a prototype of WEPS has existed in Norway for more than ten years, a WEPS currently in operation has not been financially analyzed in the literature. Coastal parts of Norway have a potential of 5 TWh of profitable WEPS-facilities, due to convenient access to fjords containing water with stable all-season temperatures of about 4–12 °C when the depth of the water is about 50 m. This stability of the water temperature makes it possible to extract energy from the fjord in a very efficient way. The potential for economically-profitable WEPS in other parts of the world has not been estimated. In order to answer such a question, more research is required. We have conducted a case study of a WEPS located in the Norwegian municipality of Eid. This is the first full-scale Norwegian WEPS, and it has been operating since 2006. The nascent years have passed, and the technology has been in operation for some years. In this paper, we have made an estimate of the business profitability and the external effects based on past empirical evidence and some assumptions about future development in some key figures. The results suggests that WEPS-Eid has been a profitable investment carrying a positive internal rate of revenue, even if the present underutilization in production capacity will continue in the future. Stability in energy prices for heating purposes has also gained customers compared to the more volatile prices of alternative renewable energy, such as hydropower or wind turbines. The negative, external effects in the operating phase from WEPS-Eid are insignificant. Despite the significant profitability of the WEPS facility in Eid, there are two main obstacles for new entrants. There is a lack of relevant operational information for potential investors due to few facilities. This leads to uncertainty, and investments in WEPS appear as a risky business. Secondly, construction of a WEPS requires both big financial investments in digging and facilitating long trenches for a pipeline system and time and effort spent on acquiring the licenses needed for doing this work. A coordinating unit is probably required in order to get the necessary public and private licenses and to reduce fixed costs by coordinating other tasks in the same trenches, such as pipes for water and sewer, fiber cables and tele-cables. In Eid, the local municipal administration was the coordinating unit.
1. Introduction
Energy can be produced by using renewable or nonrenewable sources. Energy production by nonrenewable sources occurs by burning hydrocarbons such as oil, gas or coal. Energy production from renewable energy sources can occur in many different ways. Hydropower, wind, solar and bio energy are some sources of renewable energy.
In this paper, we will describe a new way of producing renewable energy. The idea is that thermal energy in seawater or in a lake can be extracted and used for heating. We will call this system the Water-thermal Energy Production System (WEPS), because the basic idea is to extract heating energy from water. The reason for the name is that the WEPS is very similar to the far more familiar geo-thermal energy production system. Zheng et al. [1] use the name SWHP as an abbreviation for Seawater Heat Pump Systems. However, we claim that WEPS is a better name due to its similarity to the geo-thermal energy production system and since it is possible to use water from a deep lake, as well, not just sea water.
The fjords in western parts of Norway are very deep; usually the depth is several hundred meters. In very deep waters, the range of temperatures is within a 4–6 °C band between cold winter and hot summer. This stability of the water temperature makes it possible to extract energy from the fjord in a very efficient way. A WEPS has been in operation in the municipality Eid in western Norway since 2006. Because of the good performance in Eid, several other WEPS have already been built, or are planned to be built, in other places in Norway.
We have organized the remainder of the paper as follows: A literature review is given in Section 2. A brief history of WEPS-Eid is given in Section 3. We then present a description of WEPS-Eid in Section 4. In Section 5, we present the customers, and in Section 6 and Section 7, we analyze the private profitability and the external effects of WEPS-Eid. In Section 8, we draw some conclusions based on the evidence gathered.
2. Literature Review
Over the last two decades, there has been an accelerating process of substituting energy based on fossil fuels with renewable energy. Lund et al. have made a scenario for Denmark analyzing the consequences for energy consumption and the demand for energy from different sources if the share of renewable energy is increased from the present level of 20 percent to 100 percent within 40 years. Their main scenario indicates that about 25 percent of the Danish building stock could substitute individual gas or oil boilers with district heating [2]. Sarbu et al. have conducted a literature review of Ground-Source Heat Pumps (GSHP) system and pinpoint three main advantages of closed-loop SWHP systems:
- -
- Relatively low investment costs due to low excavation costs compared to most other GSHP systems.
- -
- Small amounts of energy are required for pumping purposes
- -
- Low operating cost.
The main disadvantages of SWHP systems found in the literature are:
- -
- Malfunctioning of the coil-mechanism in public lakes, which can be costly and time consuming to mend.
- -
- There is a wide variation in water temperature due to variations in the air temperature [3].
Kulcar et al. found a positive net present value from investing in heat pumps converting heat from low-temperature geothermal sources to high-temperature heating of buildings in the city of Lendava, Slovenia. The present heating device is based on extraction of energy directly from geothermal water leaving low-temperature water of 42 °C spilling into local water sources. The estimated profitability from installing the new heat pumps is sensitive to the future electricity price, which is assumed to be 0.07 Euro/kWh, and to the discount rate of seven percent [4]. Zheng et al. have compared the technological and economic performance of SWHP systems and Air-to-air Heat Pump systems (ASHP) in the province of Tianjin, China. They concluded that the SWHP system is more energy efficient than the ASHP-system, due to a better thermal performance in low outdoor temperatures. However, high investment costs regarding drilling and building of the pipeline make the economic performance of the ASHP-system better than the SWHP-system [1].
A large-scale renewable energy program using the SWHP system for heating and cooling both commercial and residential buildings in the city of Dalian, China, was launched in 2008. Prior to the implementation, Zhen et al. estimated the technological feasibility and the anticipated economic performance of the SWHP system compared with the coal-fired heating system and the conventional air-conditioning system. They found a positive net present value for the majority of scenarios and both lower annual cost and a shorter pay-back period than investments in conventional heating and cooling systems. Sensitivity analysis indicates, however, that moderate changes in assumptions regarding either electricity prices, interest rates or coal prices may alter the main conclusion that a SWHP system would outperform the traditional systems for heating and cooling buildings in China [5]. Arat et al. analyzed the assumed technological and economic performance of geothermal heating in a residential area in a medium-sized Turkish city driven by a heat pump. If the most cost-efficient solution is selected, the system will maximize the Net Present Value (NPV) when it serves between 7929 and 36,098 households [6].
Oktay et al. and Esen et al. find that Geothermal District Heating (GDHS) of residential houses in urban areas is very efficient compared to the use of coal as residential heating [7,8]. On the other hand, a study conducted by Hukulak et al. shows that geothermal heating plants are less cost efficient than energy processed from brown coal or energy from black coal, but still less expensive than energy based on natural gas, biomass and fuel oil [9]. By conducting a dynamic simulation study on a novel geothermal heating and cooling system close to Naples, Italy, Angrisani et al. found that the profitability is significantly affected by assumptions about prices on natural gas and the geothermal flow rate. However, in the range of change in all relevant parameters between five percent and 100 percent, the pay-back time for the system was within the range of 1.2 years–14 years [10]. Replacement of energy from fossil fuels could, in some countries, be part of a social welfare program. Erdogmus et al. have made an economic assessment of a big geothermal project in Izmir, and by applying a social internal rate of return, they found a positive net present value [11].
3. The Development of the First WEPS in Western Norway
The first attempts to use the fjords as a source of energy in Sogn og Fjordane county goes back to the 1970s. Two WEPS were built in Sogndal municipality by smaller companies. Even though, after more than ten years of operation, the companies claimed that this had been profitable, it did not lead to a boon for businesses and households eager to grasp the opportunities of extracting inexpensive energy from fjords. This may be due to a combination of low electricity prices and good access to free or nearly free firewood in Norway. Up until a few years ago, these small WEPS were only designed for one or two households located right by the seaside.
The development of the WEPS concept in Eid had no link to the small plants that were operating in Sogndal municipality. The idea of utilizing the fjord (Eidsfjorden) as a source of energy in Eid goes back to the 1990s. The local hospital had a limited budget, but needed cooling in the summer. The hospital was just a few hundred meters from the fjord. The hospital asked the local municipal administration if they would consider funding a company aiming at exploiting the energy from the fjord for cooling of the rooms in the hospital in the summer. In the year 2000, the local council founded this company and gave it the name Fjordvarme AS. As we will see, the hospital and other public and private buildings got a WEPS that could be used for both heating and cooling in a very economically-efficient way. In this article, we describe the technology behind this WEPS and the financial results of Fjordvarme, as experienced after several years of operation.
The fjords in western Norway are usually several hundred meters deep with small inter-seasonal temperature variations. In Eid at a 50 m depth, the temperature varies between 8 and 12 °C around the year. This stability in temperature made local engineers believe it was possible to extract thermal energy from the fjord and use it for cooling and warming at a very favorable price.
The planners at Eid realized early that it was necessary to build a large plant. Due to high investment costs, a WEPS has high fixed costs, but very low variable costs. A small-scale WEPS could therefore run into financial deficit despite positive social benefits. A producer surplus in the case of economies of scale was ensured by building a large-scale WEPS.
4. Technical Specifications of the WEPS in Eid
A WEPS is based on the following principles: Water from the sea or from a lake is pumped into a heat exchange unit located in a small shelter on shore. In this unit, the heat from seawater is transferred by using heat exchangers to a closed loop of freshwater (see the Figure 1 and Figure 2 ). The heated freshwater is then pumped from the heat exchange unit to a heat center containing heat pumps. From this heat center, warmed water is then distributed to customers, such as households, institutions and companies, through a small network of pipelines. The energy stored in the warmed water is then transferred to end-users via individual heat exchange units, and cold water is pumped back to the exchange unit. The WEPS may run in heating mode or in cooling mode. The temperatures when in heating or cooling mode are given in Table 1 and Table 2 below.
When in cooling mode, the fjord is used as a heat sink. One may ask: Why install a heat exchanger when the system is in cooling mode? Can the cold fjord water not be used directly? The reason is that the salty water of the fjord will cause problems. In addition, there will be problems with algae.
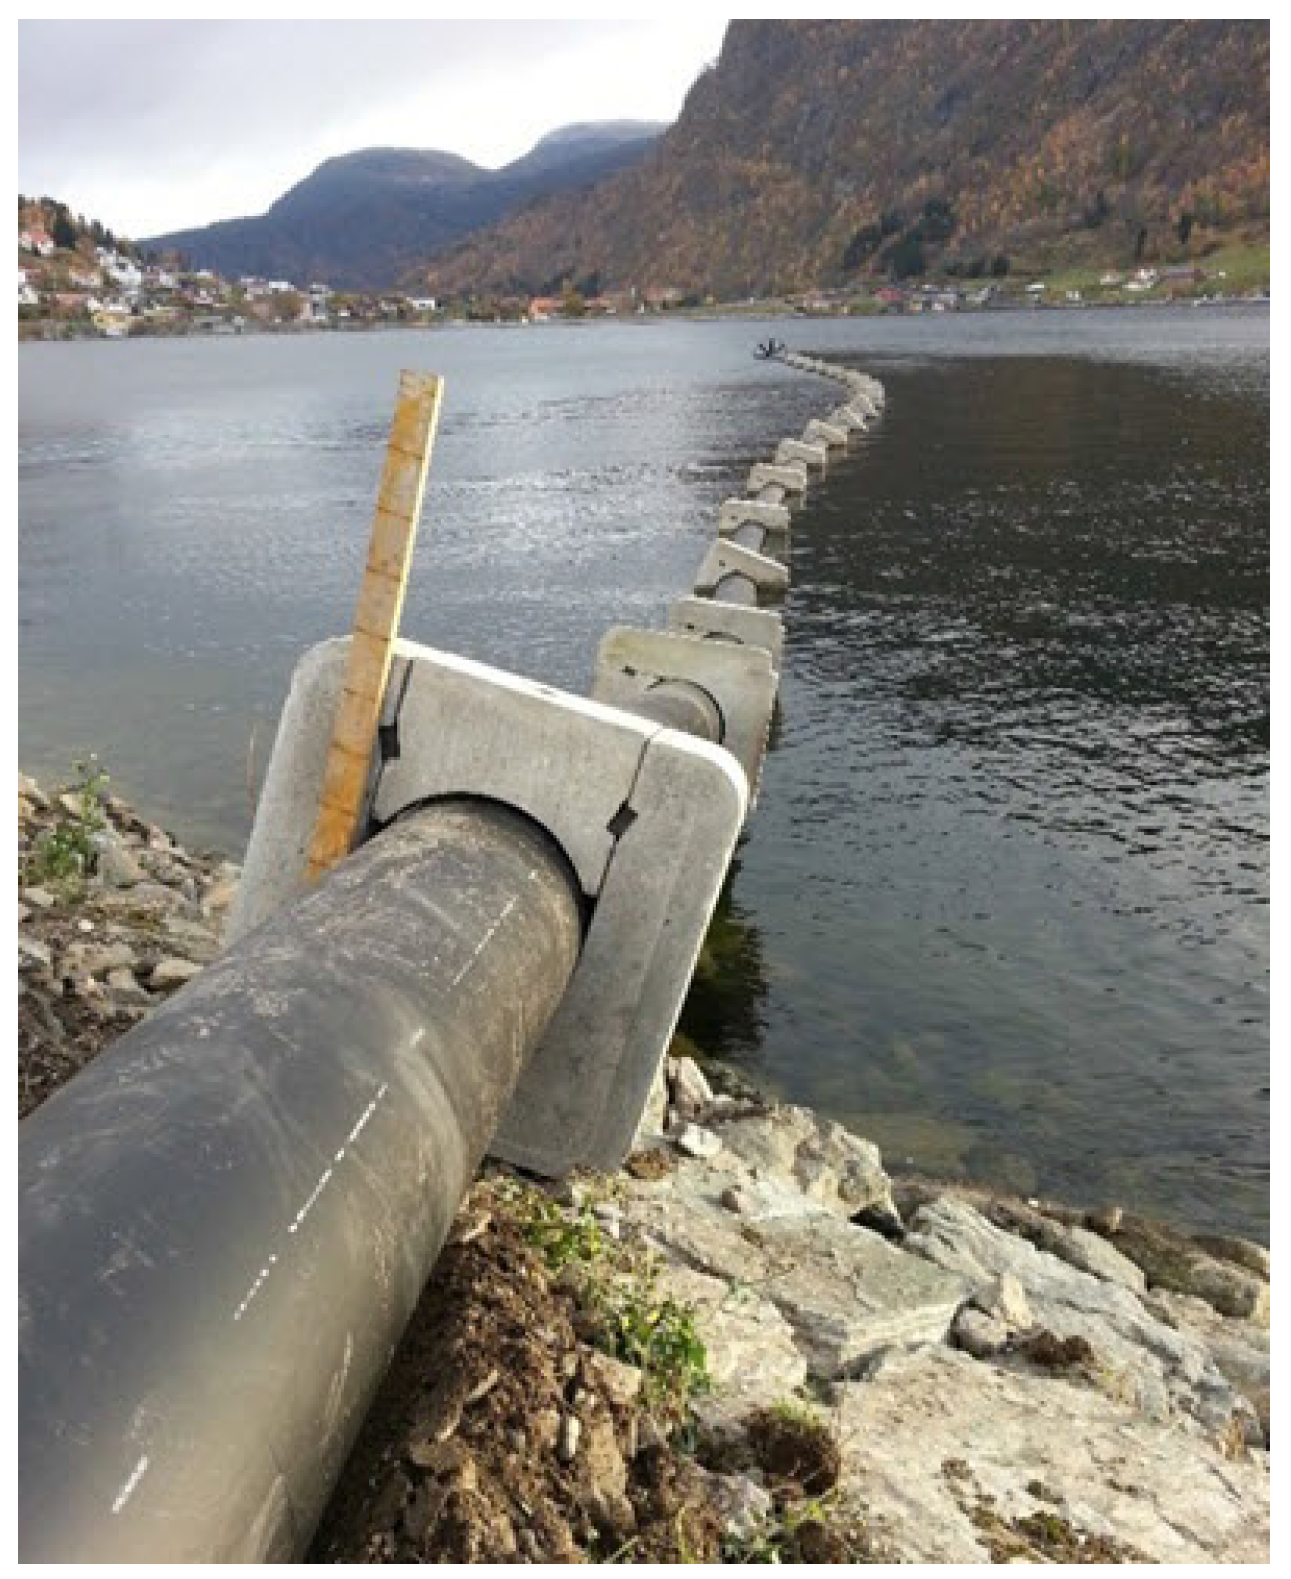
WEPS-Eid takes seawater from the fjord at approximately a 50 m depth. The seawater intake is a hose made of PVC. In order to keep it stable at the seabed, blocks made of concrete were attached to the hose at every second meter. The diameter of the hose is about 60 cm. Figure 1 shows such a hose during the construction period of a WEPS in Sogndal in 2014 before it was filled with seawater and put on the seabed.
The fully-operational WEPS-Eid pumps 546 m of water per hour from the sea to a heat exchange unit on shore. The heat exchange unit is located in a small building of about 50 m. An alternative location of the exchanger would have been underground, but this was not done in Eid. Figure 2 shows the heat exchange system in the Sogndal WEPS built in 2014 by Sognekraft AS.
The seawater emits heat to a closed circuit with fresh water that circulates in a grid on land. The tubes on land transporting fresh water from the heat exchange units have a maximum diameter of 315 mm. These tubes are all dug 100 cm into the ground. The fresh water system is a closed loop, so even if the customers and the heat exchange unit are at different altitudes, the force of gravity will help with circulating the water. Only energy to overcome tube friction is needed to get the water to circulate.
The total pipe length of WEPS-Eid is 18 km. If these pipes are put in the same trench as drinking water pipes, sewers, fiber and electricity cables, the investment costs in WEPS-facilities will be significantly reduced. This is a key issue for local authorities in their planning of new or improved infrastructure.
Due to low temperatures (6–8 °C) in the fresh water circulating from the heat exchange units at the sea shore to the heating center close to the customers, there is no energy loss despite the uninsulated pipelines.
When WEPS-Eid was built, the engineers had to decide if the pipes were to be insulated or not. The temperature in the water that circulates between the heat exchanger and customers maintains a temperature of 6–8 °C depending on the season. Since the pipes are at least 100 cm down in the ground, the engineers assumed that the temperature difference between the water in the pipes and the surroundings would be so small that the heat loss would be insignificant even if the pipes were not isolated. For this reason, it was decided to use uninsulated pipes since this reduced the investment costs. The heat loss due to the uninsulated pipes has never been calculated. Fjordvarme AS, the company that constructed, built and still owns WEPS-Eid, claimed in August 2017 that the loss is so small that they have never observed any problem because of uninsulated pipes. The opportunity to use uninsulated pipes is advantageous for the facility in Eid compared to traditional district heating systems where the circulating water may have temperatures close to 100 °C. Traditional district heating systems require insulated pipes at significantly higher investment costs than a WEPS. However, more research is needed to find the optimal solution when it comes to the question of which pipes should be isolated.
In WEPS-Eid, every customer has his/her own heat pump. The heat pump extracts heat from warmed water released from the heat exchanger. Then, cold water returns from the customer to the heat exchanger. The customer can use a water-to-air heat pump and heat the air inside the house or he/she can use a water-to-water heat pump. In WEPS-Sogndal, all heat pumps are located in a heat center, and only hot water (71 °C) is distributed to the customers (see B in Figure 3). The hot water is used in radiators in offices and other rooms, and some of it is used to heat the air that the ventilation system transports to the rooms in buildings. WEPS-Eid does not have a heat center, while WEPS-Sogndal does have one. The heat center in Sogndal is shown in Figure 4. Empirical experience has shown that the heat center solution is more cost efficient.
WEPS is used both for heating and cooling. To prevent bacterial growth in the pipes and reduce operating costs, oxygen has been removed from the fresh water circulating in the closed land-based circuit. The removal of oxygen is done by a method called catalytic reduction of oxygen in water with hydrogen as a reducing agent. It is a “wet combustion process” presented already in 1967 at a scientific conference in Essen, Germany [12].
If some customers are located more than 50 m above sea level, additional pumps must be installed to increase the water pressure. This will also increase the investment cost. In Eid, all customers live at a very low altitude, only a few meters above sea level, and it was necessary to install additional pressure zones. Neither WEPS-Eid nor WEPS-Sogndal has experience with several pressure zones.
A significant part of the WEPS-infrastructure is dug into the ground and wrapped in sand or gravel, sheltered from extreme weather. The tubes are also highly flexible and, according to the engineers, able to withstand a major earthquake.
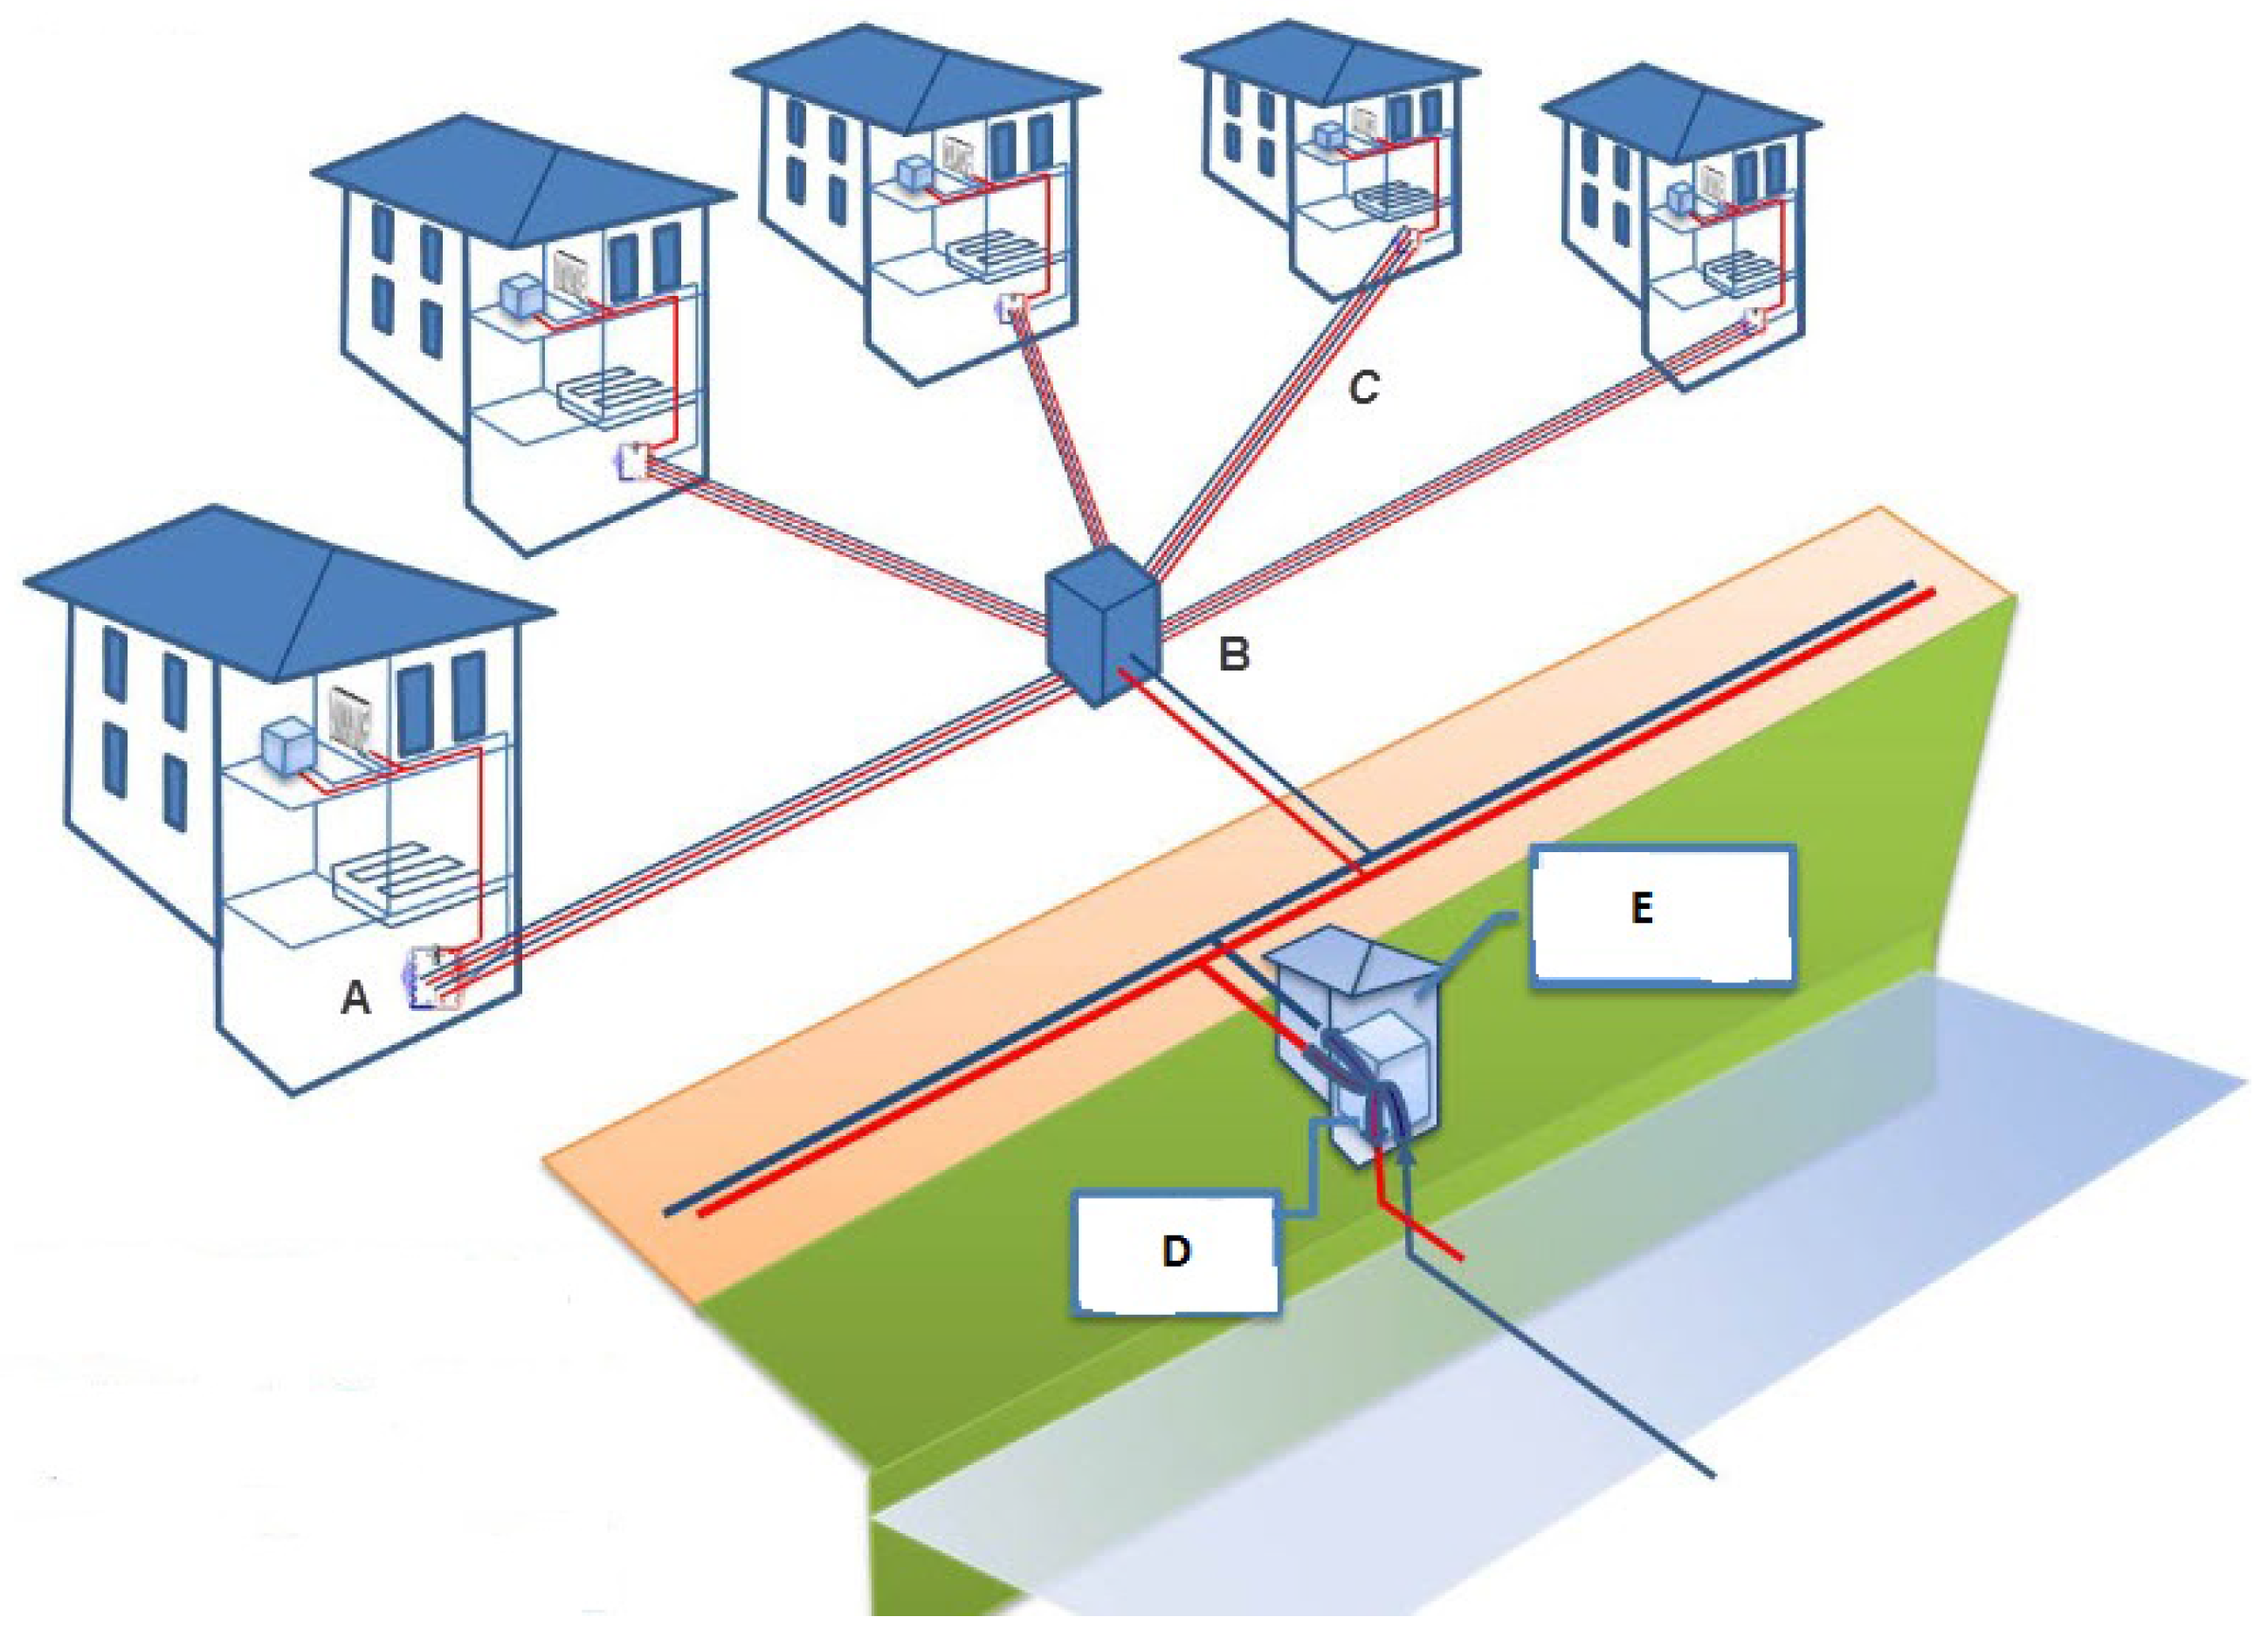
Figure 3 shows a schematic diagram of a WEPS. The pump house (E in Figure 3) may alternatively be located underground and thus be invisible. The customers’ private small-scale heat exchange units are not identical to the traditional, sometimes non-aesthetic and noisy heat pumps attached to outdoor house walls. The WEPS connected small-scale heat exchange units of the customers are located indoors, and the entire infrastructure is therefore sheltered and well protected from bad weather, which implies lower maintenance costs.
In a WEPS construction including a hub for distribution of warmed water to the customers (a heat center), the energy producer is responsible for operating the heat center. Thus, this will generate large-scale economics in operating that part of the infrastructure compared to a situation where each customer has his/her own heat pump. The experience from WEPS-Eid showed that many customers also lacked the knowledge needed to optimize the operation of the heat pump. A heat center will therefore reduce the unit costs of energy produced, and the customers will have lower investment and operating costs because they do not need to buy and operate their own heat pumps.
With reference to Figure 3, from the heat center (B), there are two isolated and two uninsulated pipes to each customer (C). One may question the efficiency of this solution. Perhaps it is more efficient to insulate all pipes and not only two. As long as there is a temperature difference between the water and the surroundings, there will be heat transfer and loss of energy. This loss has not been calculated. More research is required before we can say which solution is the most profitable.
Where there is a short distance between customers, the appropriate solution is to build an infrastructure that includes a heat center. Otherwise, the customers must be sequentially interconnected (like in a daisy chain). This is the case at WEPS-Eid, because of the long distance between some of customers. However, engineers claim that several years of experience have shown that WEPS with a heat center is more energy efficient than a WEPS without this device. In WEPS constructions that include a heat center, customers will use private small-scale heat exchange units connected to local, indoor pipelines in floors, radiators or heater devices. Because of many alternatives for local, domestic infrastructure, it is difficult to estimate the investments costs in local, domestic WEPS infrastructure required by each customer.
5. Customers of WEPS-Eid
WEPS-Eid has been operating for 11 years. The capacity was increased in spring 2017 and provides energy to 53 heat pumps. More than 90,000 m of building facilities are heated by WEPS-Eid [13], including the Opera House, the Eid secondary school, a bathhouse connected to Nordfjord hotel, 15 public building blocks, 15 commercial blocks and 25 residential facilities with a total of 121 residential units. In summer, WEPS is used for cooling.
Through a grid of pipelines dug into the ground, WEPS-Eid is also the heating source for the artificial turf on the local football stadium (Eid idrettspark). In this case, heat pumps are not needed. Only warmed water (8 °C in the winter) from the heat exchanger is needed to keep the football ground free of ice. The costs of keeping the football ground free of ice is therefore very low, but after a heavy snowfall (for instance, more than 30 cm in 24 h), shovels are needed.
WEPS-Eid covers about 90 percent of the customers’ need for energy for heating and cooling purposes. The remaining 10 percent must be supplied from alternative energy sources. During the years of operation, WEPS customers have cut their spending on energy for heating purposes by about 30–50 percent compared to heating by use of hydroelectric energy. The two largest customers, the Eid secondary school and Opera House Nordfjord, purchase an annual average of 98 kWh per m from WEPS. The average, annual energy consumption for similar buildings in Norway is 140 kWh per m. This means that large public buildings using WEPS technology like that developed in Eid could reduce energy costs for heating purposes by 30–50 percent. According to data from the Eid secondary school and Opera House Nordfjord, a WEPS used for cooling purposes has insignificant variable costs. Such tasks can virtually be conducted for free. Nordfjord hospital, a co-founder of WEPS-Eid, has for many years been the most energy-efficient hospital in Norway.
The development of and experiences from WEPS-Eid have drawn both national and international attention. A group consisting of 17 scientists from different countries representing the EU’s research program SECRE (Social Entrepreneurship Community Renewable Energy) visited WEPS-Eid in autumn of 2011. Because of the WEPS, the Eid local council was awarded the prize “local climate 2012” by the environmental organization named ZERO and the organization KS(the Norwegian Association for Municipalities). The success of WEPS-Eid has also inspired a similar project in other local areas. One such project is a WEPS launched in November 2015 and located in the urban settlement of Ulsteinvik in western Norway. This facility is now (August 2017) in operation. In August 2017, more than ten WEPS facilities were either operating or under construction in Norway. The largest WEPS in Norway is now (August 2017) under construction in Førde, a small city in Sogn og Fjordane County. According to the plans, it will start ordinary production in January 2018. The normal production is expected to be 30 GWh.
6. Costs and Benefits of WEPS-Eid
The profitability of any project can be seen from the corporate point of view or from the society’s point of view. Equation (1) below represents the profit function of the society of a WEPS:
where
- the economic surplus for the society
- the consumer surplus [14] of the produced quantity
- the surplus of the producer
- the negative environmental effects measured in money
- other negative external effects measured in money
- positive replacement effects measured in money
Externalities are defined as benefits or costs generated as an unintended by-product of an economic activity that does not accrue to the parties involved in the activity and where no compensation takes place. An externality is positive if some agent’s behavior makes another agent better off and negative if that behavior makes another agent worse off [15]. It is hard to find any production of energy that is completely without unintended side effects. Negative external, environmental effects occur when energy production generates waste in solid, or liquid form or air emissions of harmful substances, or when the processing activities causing noise and other effects, such as shadow casting of wind turbines. Most renewable energy facilities, such as a solar power plant and a wind park are area-intensive, and these activities may squeeze businesses and facilities in other branches out of the area or destroy the habitat of birds and animals. The negative environmental effects may also be related to the transport and other use of fossil fuel. An example of the latter is the poor air quality in some cities in the world due to the extensive use of coal for heating. Similar to all energy-producing facilities, a WEPS has some negative external effects. However, these effects occur during the building phase when pipelines are dug into the ground and the heat exchange unit is under construction. This process creates noise, closed roads and some dust. In the operating phase, a WEPS emits no noise or smell, and except for a house where the heat exchange unit is located, the entire WEPS-facility is invisible. The sole external effect from WEPS when operating is its occupation of space in the fjord where the intake is located. This area could alternatively be used as an anchor site for big ships. The value of this effect is probably insignificant, which implies that a WEPS investment will generate a Pareto improvement: some groups or individuals will gain from WEPS, such as the investors and customers, but no groups or individual will lose.
On the basis of the discussion above, we conclude that the external effects of a WEPS are close to zero, and we may simplify the social profit function given in Equation (1) and write it like this:
Here, b is positive replacement effects measured in money. If the WEPS, for instance, leads to reduced coal production, this will reduce the amount of carbon dioxide released into the atmosphere. b is the benefit to the society from this emission reduction measured in money. Measuring the size of the replacement effect b and the consumer surplus is very difficult, and in this paper, we make no attempt to calculate it. That means we only calculate the surplus of the producer assuming that customers pay the same for the energy as they would have paid if the energy were purchased from others.
7. Business Profitability
In order to estimate the business profitability of WEPS-Eid, we have to calculate the present value of the project based on future cash flow. WEPS-Eid is not yet fully developed, just 58.3 percent of the capacity is used, and there is still vacant capacity for new customers. Due to the underutilization of present capacity, we have made two estimates of the profitability: one estimate assuming that future capacity utilization is equal to the present one (58.3 percent) and another assuming WEPS-Eid to be run at full capacity.
Total investments include all business investment costs in infrastructure such as the heat exchange unit, pipelines and the building and construction work associated with these activities. Included in the investment costs is also the consumers’ investment in local grid infrastructure, i.e., pipelines running from the heat center to the residents and the entire domestic infrastructure, in-house pipelines or other heating accessories and individual heat pumps. The marginal costs were particularly low for WEPS-Eid because this was a joint venture with the local administration, tele-companies and ICT businesses. The local council managed to coordinate the digging and the parallel placement of tele-cables, fiber cables, pipelines for drinking water, sewer and the WEPS.
Assumptions, Net Present Value and Internal Rate of Return
As mentioned above, we will make two calculations: one where we assume that the present production capacity of 58.3 percent of full capacity is not increased and one where additional investment is done and the plant produces at full capacity.
Eid Municipality established two daughter companies, Eid Fjordvarmet KF and Fjordvarme AS, which invested 22 million NOK in WEPS-Eid, while customers have invested 12.6 million NOK. Total investment is then 34.6 million NOK. If the capacity utilization is increased from 58.3 percent–100 percent, this will imply additional investment costs for Eid Municipality of 0.8 million NOK, while new customers will have to invest 9.4 million NOK in domestic infrastructure. This estimate is based on present prices with an increase in these prices by 30 percent to take future technological progress and increases in real wages and in capital prices into account. Total investment for the WEPS-Eid running at full capacity will then be 44.8 million NOK with a 30 percent price increase included.
We have made some assumptions about the project’s lifetime. Because cash flow received or paid in future periods must be discounted to present values, we have to make a timetable for these cash flows and some assumptions regarding the time span of the project. Even if the WEPS construction may have an unlimited lifespan, the lifetime of each of its components is limited. Empirical evidence indicates for instance that heat pumps have a lifespan of about 20 years. In this paper, we make an assumption of a limited lifespan for the WEPS construction of 40 years if annual reinvestment costs are equal to 1.3 million NOK. This estimate is based on annual reinvestments costs on WEPS-Eid from startup until today. The reinvestment costs are assumed to be independent of future capacity utilization. The calculated figure of 1.3 million NOK is the annualized sum that is necessary to invest in order for the plant to have an infinite lifetime.
To calculate cash flow, we need to find the annual operating and maintenance costs associated with WEPS-Eid, and in our estimate, we include all salaries and payments related to operation and maintenance throughout the WEPS lifespan. This applies to both the company Fjordvarme AS and the customers. Based on operational data from WEPS-Eid, we have a good basis for providing a reliable estimate of these costs. The annual operating and maintenance costs connected to WEPS-Eid at full capacity are estimated to be 6.225 million NOK. The annual operating and maintenance costs in 2012 were 3.9 million NOK at 58.3 percent of full capacity, and we assume that this will be the annual operating and maintenance costs in the future if the capacity is unchanged.
To calculate the income, we need to know the energy production and prices. WEPS-Eid’s present energy production equals 10.5 GWh per year. At full capacity, the production level will be about 18 GWh. Due to stable year-to-year fjord temperature, there is only marginal uncertainties regarding production levels.
Gross annual revenues from WEPS are equal to energy produced valued at the market price including grid costs. That is the amount customers would have to pay for energy from other sources in absence of WEPS, their opportunity cost of energy. Based on present grid costs in western Norway, we estimate future grid costs to be 40 cents (of NOK) per kWh. The price of electricity has been low since 2012. New cables from Norway to Germany and Britain are under construction, and the Norwegian electricity market will become more integrated with the European market. The new cables to Germany and Great Britain will be completed by 2020 and 2021, respectively [16]. In August 2017, the spot price of electricity was 25 cents of an NOK per kWh, but we expect that the long-run average price will be 35 cents of an NOK per kWh because of the future integration of the Norwegian and the European electricity market.
Thus, the annual gross revenue from WEPS-Eid at the present production of 10.5 GWh is estimated to be 7.875 million NOK. If production reaches full capacity, the annual income will be 13.5 million NOK.
Due to the long lifespan of a WEPS, we have to make an assumption regarding the expected inflation rate. Besides our assumption of a 30 percent increase in investments cost if WEPS-Eid is extended to full capacity, all future cash flows are assumed to be measured in real terms (inflation adjusted). This means that we have to use a real, not a nominal, discount rate.
By making the assumptions elaborated above, we are now able to estimate real cash flows from the WEPS, but in order to calculate the net present value, we need to estimate the discount rate. The discount rate used in net present value calculations is equal to the return of the best alternative project in the same risk category.
With a project lifespan of 40 years, the project’s net present value is very sensitive to assumptions about the discount rate. According to guidelines from the Norwegian Ministry of Finance issued in 2005 (R-109/2005) [17], the risk-free real discount rate to be used in cost benefit analyses of government-owned projects is two percent, The guidelines stated that a project with average risk should have a risk premium of two percentage points and thus a risk-adjusted discount rate of four percent. The risk premium takes account of uncertainty with regard to future production and future prices.
In our case regarding WEPS-Eid, as we are conducting an ex post analysis of the project, that particular WEPS has already been built, and we know its annual production. Based on several years of information, we have observed marginal variations and uncertainty in the energy production. When making the forecast of future cash flows based on ex post figures and on several years of experience, the non-systematic risk component in our analyses will be significantly reduced. We therefore assume that future risk is not greater than systematic risk for the total Norwegian economy, and we conduct two separate profitability estimations of WEPS-Eid: one where we apply the risk-free real discount rate of two percent ( percent) and one where we add a risk premium of one percent ( percent). The results are shown in Table 3.
The net present value is calculated by using this expression:
where:
- Net present value.
- Annual income as explained in Equation (3).
- Annual maintenance and operating cost.
- Annualized reinvestment costs.
- The cost of capital.
- Total invested capital (capital from owner of WEPS plus all customers).
The results are shown in Table 1, and we see that WEPS-Eid is a very profitable investment with a real internal rate of return of 13.2 percent at full capacity and an internal rate of return of 7.3 percent with a prolongation of the present capacity. In this paper, we do not discuss how profits are shared between the energy producer (Fjordvarme AS owned by Eid Municipality) and the customers.
One of the customers (Moengården) and Fjordvarme AS made a calculation of the experienced profitability of the WEPS-Eid solution. The result is presented in Table 4
According to the Miller–Modigliani theorem, the profitability of a project is independent of the financial structure. In this paper, we do not discuss this distributional effect of the funding because it is irrelevant for the profitability of the project.
In addition to high business profitability in this project, WEPS customers face more stable prices on energy for heating purposes than consumers purchasing hydroelectric energy. A WEPS significantly reduces volatility in energy prices and thereby increases the consumer surplus compared to most other renewable and non-renewable energy sources.
8. Conclusions
This paper shows that WEPS-Eid has turned out to be a profitable business investment for the owners and due to less volatile energy prices, the customers enjoy a higher consumer surplus compared to their counterparts purchasing energy from alternative renewable sources, such as hydroelectric energy or energy from wind turbines. The unintended side effects of WEPS-Eid on individuals besides owners and customers are insignificant, implying that WEPS-Eid has marginal negative or positive external effects. Unlike many public and private projects, WEPS-Eid leaves society with a Pareto improvement; at least one social group (in our case, two groups; investors and customers) is better off, but no group is worse off.
A cost-effective WEPS, such as the one in our case, is based on a fully-developed and tested technology. This means high reliability and stability regarding energy supply to customers besides a high degree of predictability regarding operating and maintenance costs. That means that the volatility of the energy cost of the customers is reduced compared to pure electrical heating where the annual costs may fluctuate with the changes in the weather. It also means that the financial risk associated with an investment in a WEPS-facility will be low.
According to standard economic theory, expected positive profitability will encourage private investors to invest in a project. Why then is WEPS still an underutilized renewable energy source in settlements close to fjords along the Norwegian coastline? We think there are two main factors hampering the WEPS development. First of all, there is a lack of relevant operational information due to few facilities, no empirical evidence regarding technology and maintenance costs; and secondly, the lack of a coordinating unit. The construction of a WEPS requires big financial investments in digging and facilitating long trenches for a pipeline system and time and effort spent on acquiring the licenses and ground needed for doing this work. A coordinating unit acquiring the necessary public and private licenses, closing off roads and railways during the construction period and coordinating the digging with other companies delivering infrastructure, such as water and sewer, fiber cables and tele-cables, could significantly cut private investors’ digging costs and their time spent on coordination and preparations. We think private companies would be unable to conduct this coordination. In Eid, the local municipal administration was the coordinating unit and probably of vital importance for the implantation of WEPS at Eid.
We found very little literature about WEPS or about the economic performance of Seawater Heat Pumps Systems (SWHP). This is an indication that little international research has been done in this field. Coastal parts of Norway have a potential of 5 TWh of profitable WEPS-facilities [13]. We believe that more research is needed to uncover which countries or in which climate zones WEPS may be profitable for society.
Acknowledgments
The authors thank Magne Hjelle and Arild Hjelmeland from Fjordvarme AS, Kåre Fosse from Sognekraft AS, Stephan ter Stege from ReNorway AS, Anne Kristine Vedvik from Statsbygg AS and Ivar Moen from Moengården in Nordfjordeid for their participation and cooperation in data collection.
Author Contributions
The authors contributed equally to this work.
Conflicts of Interest
The authors declare no conflicts of interest.
References
- Zheng, W.; Ye, T.; You, S.; Zhang, H. The thermal performance of seawater-source heat pimp systems in areas of severe cold during winter. Energy Convers. Manag. 2015, 90, 166–174. [Google Scholar] [CrossRef]
- Lund, H.; Möller, B.; Mathiesen, B.V.; Dyrelund, A. The role of district heating in future renewable energy systems. Energy 2010, 35, 1381–1390. [Google Scholar] [CrossRef]
- Sarbu, I.; Sebarchievici, C. General review of ground-source heat pump systems for heating and cooling of buildings. Energy Build. 2014, 70, 441–454. [Google Scholar] [CrossRef]
- Kulcar, B.; Goricanec, D.; Krope, J. Economy of exploiting heat from low-temperature geothermal sources using a heat pump. Energy Build. 2008, 40, 323–329. [Google Scholar] [CrossRef]
- Zhen, L.; Lin, D.M.; Shu, H.W.; Jiang, S.; Zhu, Y.X. District coolong and heating with seawater as heat source and sink in Dalian, China. Renew. Energy 2007, 32, 2603–2616. [Google Scholar] [CrossRef]
- Arat, H.; Arslan, O. Exergoeconomic analysis of district heating system boorsted by the geothermal heat pump. Energy 2017, 119, 1159–1170. [Google Scholar] [CrossRef]
- Esen, H.; Inalli, M.; Esen, M. Technoeconomic appraisal of a ground source heat pump system for a heating season in eastern Turkey. Energy Convers. Manag. 2006, 47, 1281–1297. [Google Scholar] [CrossRef]
- Oktay, Z.; Dincer, I. Exergoeconomic analysis of the Gonen geothermal district heating system for buildings. Energy Build. 2009, 41, 154–163. [Google Scholar] [CrossRef]
- Huculak, M.; Jarczewski, W.; Dej, M. Economic aspects of the use of deep geothermal heat in district heating in Poland. Renew. Sustain. Energy Rev. 2015, 49, 29–40. [Google Scholar] [CrossRef]
- Angrisani, G.; Diglio, G.; Sasso, M.; Calise, F.; d’Accadia, M.D. Design of a novel geothermal heating and cooling system: Energy and economic analysis. Energy Convers. Manag. 2016, 108, 144–159. [Google Scholar] [CrossRef]
- Erdogmus, B.; Toksoy, M.; Ozerdem, B.; Aksoy, N. Economic Assessment of geothermal district heating systems: A case of Balcova-Nardlidere, Turkey. Energy Build. 2006, 38, 1053–1059. [Google Scholar] [CrossRef]
- Niprox. Available online: http://www.niprox.no/nb/niproxmetoden/ (accessed on 29 August 2017).
- Fjordvarme. Available online: http://www.fjordvarme.no/om-selskapet/ (accessed on 29 August 2017).
- Perloff, J.M. Microeconomics with Calculus; Pearson Education Limited: Essex, UK, 2011. [Google Scholar]
- Owen, A.D. Environmental Externalities, Market Distortions and the Economics of Renewable Energy Technologies. Energy J. 2004, 25, 127–156. [Google Scholar] [CrossRef]
- E24. Available online: http://e24.no/privat/stroem/denne-kabelen-oeker-stroemprisen-din/23509067 (accessed on 1 September 2017).
- Regjeringen. Available online: https://www.regjeringen.no/globalassets/upload/fin/vedlegg/okstyring/rundskriv/faste/r_109_2005.pdf (accessed on 1 September 2017).
Figure 1.
This picture was taken during the construction period and shows the hose before it was filled with sea water and sunk to the seabed. For stabilizing purposes, weights made of concrete were attached to the hose. This picture is from a WEPS built in the municipality of Sogndal in 2014 by Sognekraft AS. The picture is used with permission from Sognekraft AS, Norway.

Figure 2.
The heat exchange system on shore. In the lower part of the figure (grey tubes), seawater is pumped from the fjord to the heat exchange units (VVX 1, VVX 2 and VVX 3 in the figure) and back to the sea. Cold water (2–3 °C) is coming from the customers (blue tubes). Warmed water with a temperature of 6–8 °C (red tubes) is pumped to the heat center close to the consumers (A in the figure). The figure is from a WEPS built in Sogndal in 2014 by Sognekraft AS. The picture is used with permission from Sognekraft AS, Norway.
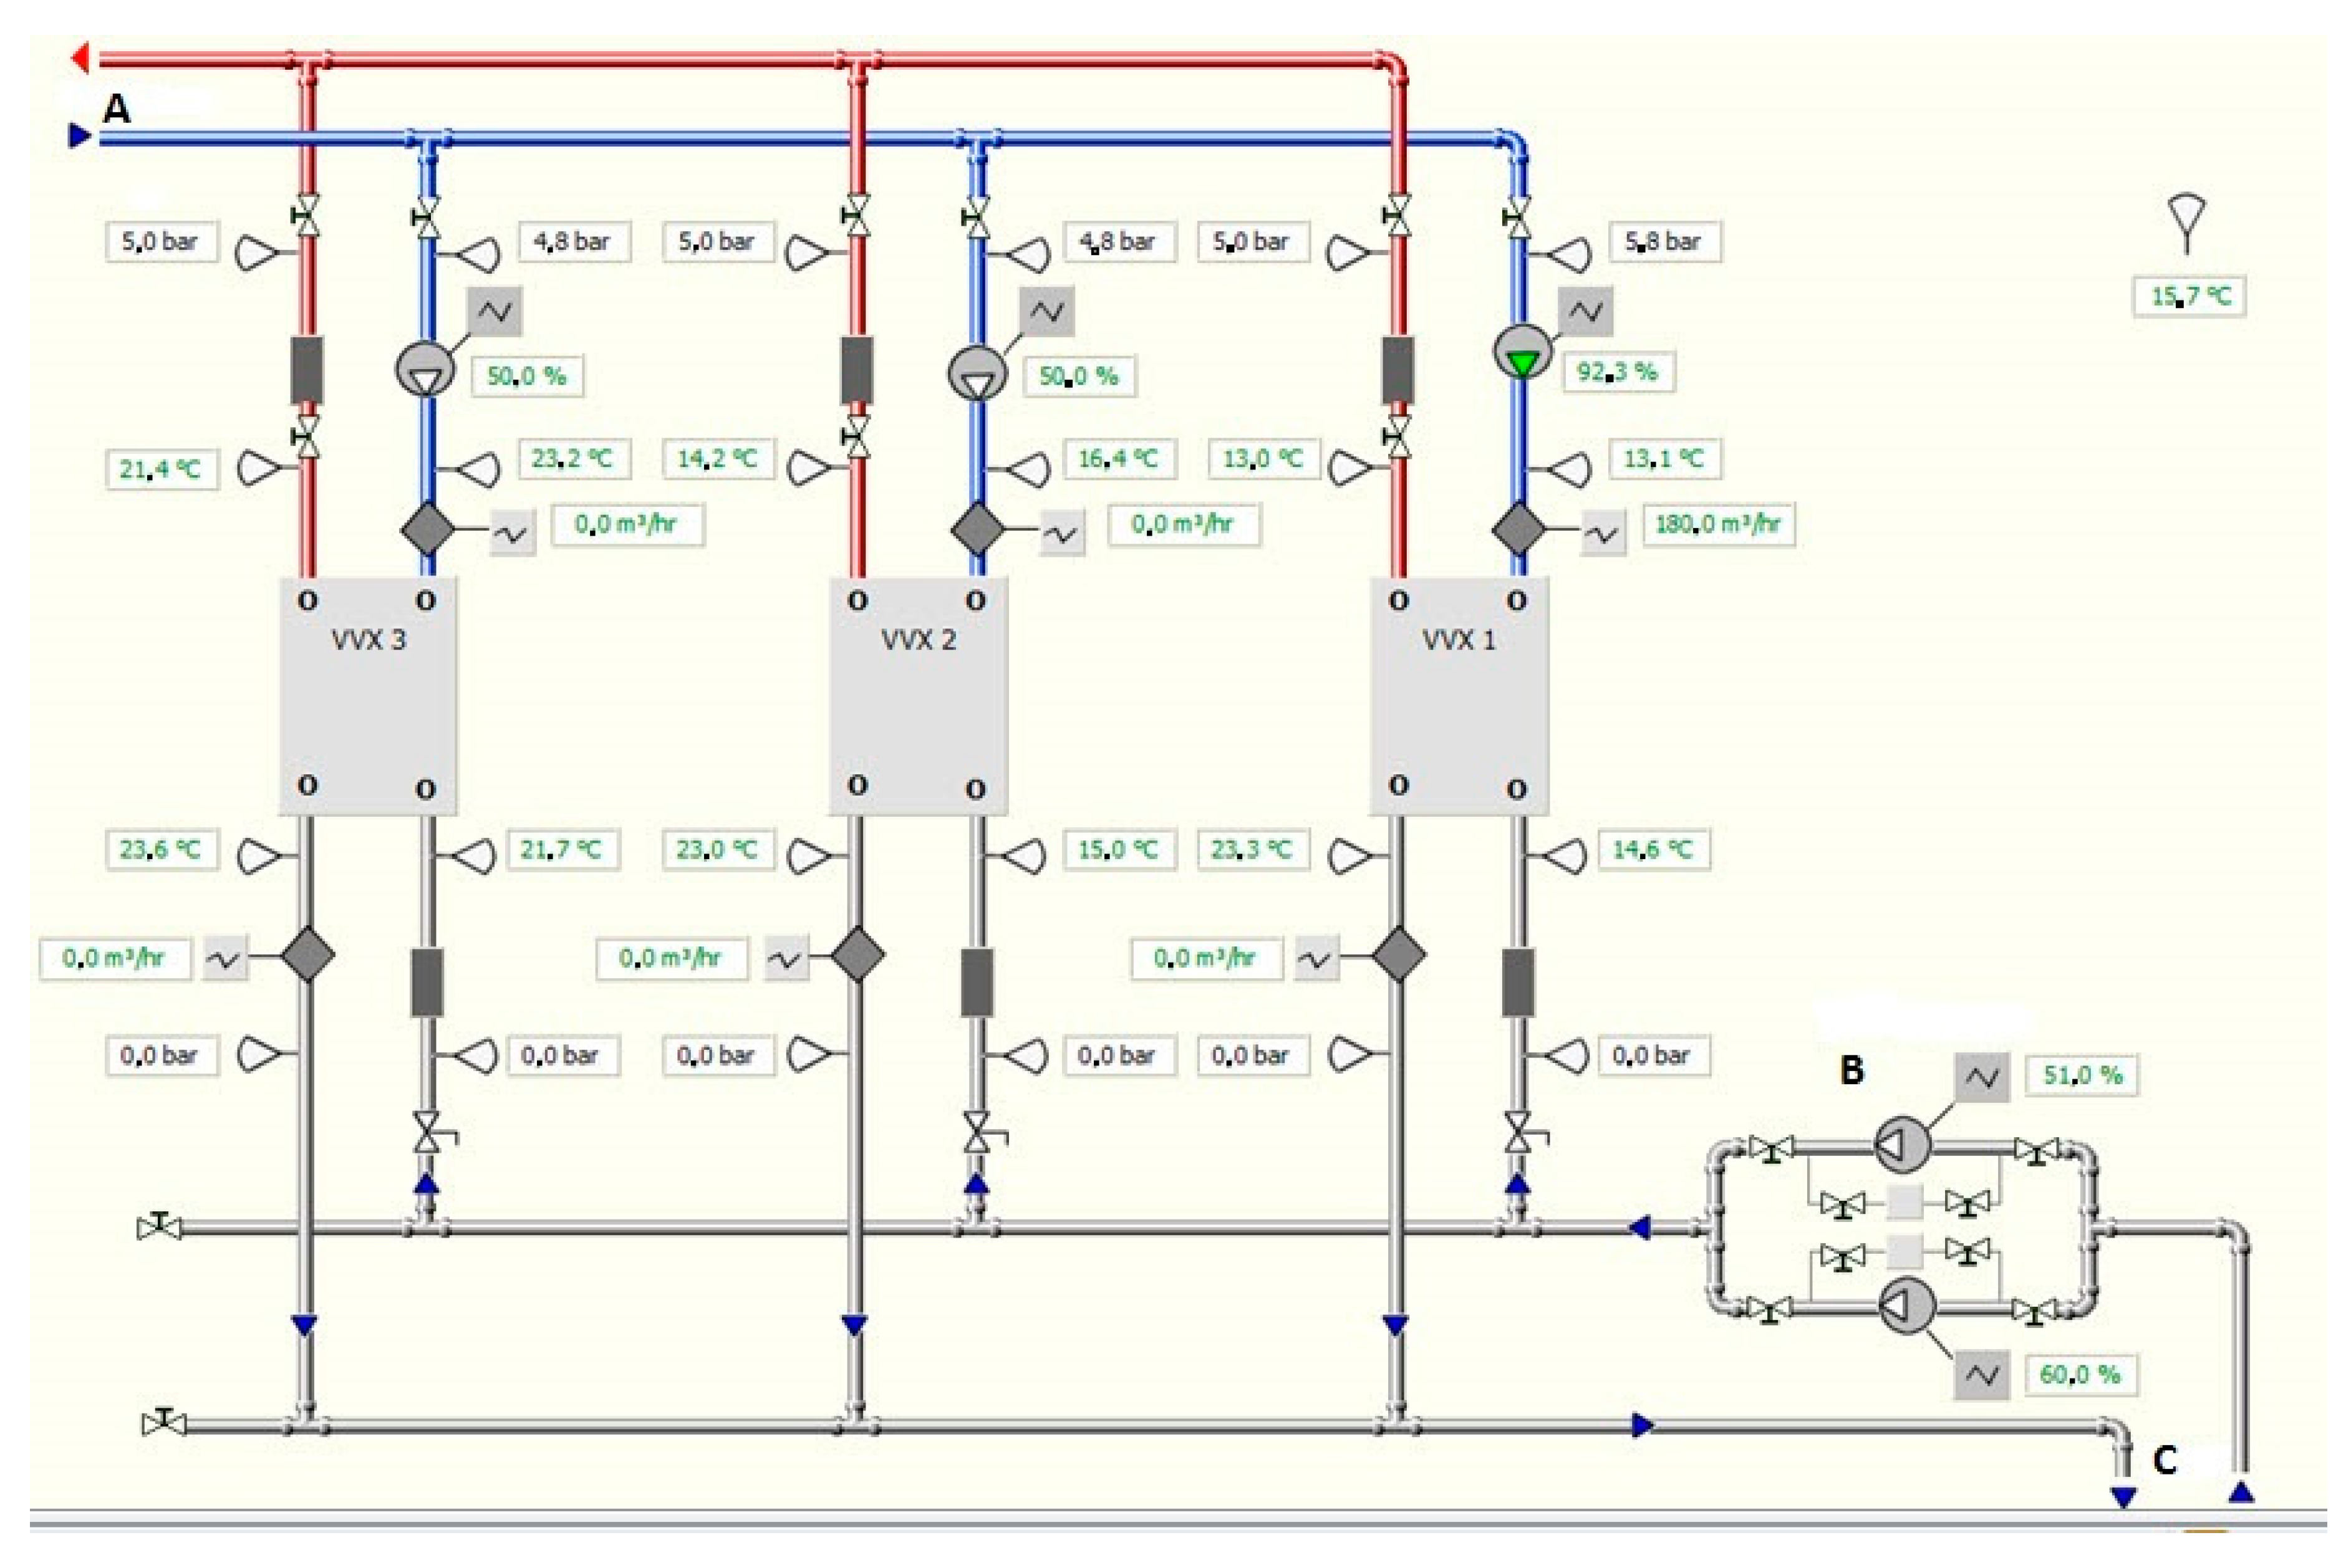
Figure 3.
A draft of the WEPS infrastructure. The figure gives a broad sketch of a WEPS. The heat pumps are located in the heat center (B). From the heat center, there are two isolated and two uninsulated pipes to each customer (C). Each customer has a simple heat exchange unit with an energy meter (A). (E) is the house where the seawater heat exchanger (D) is located.

Figure 4.
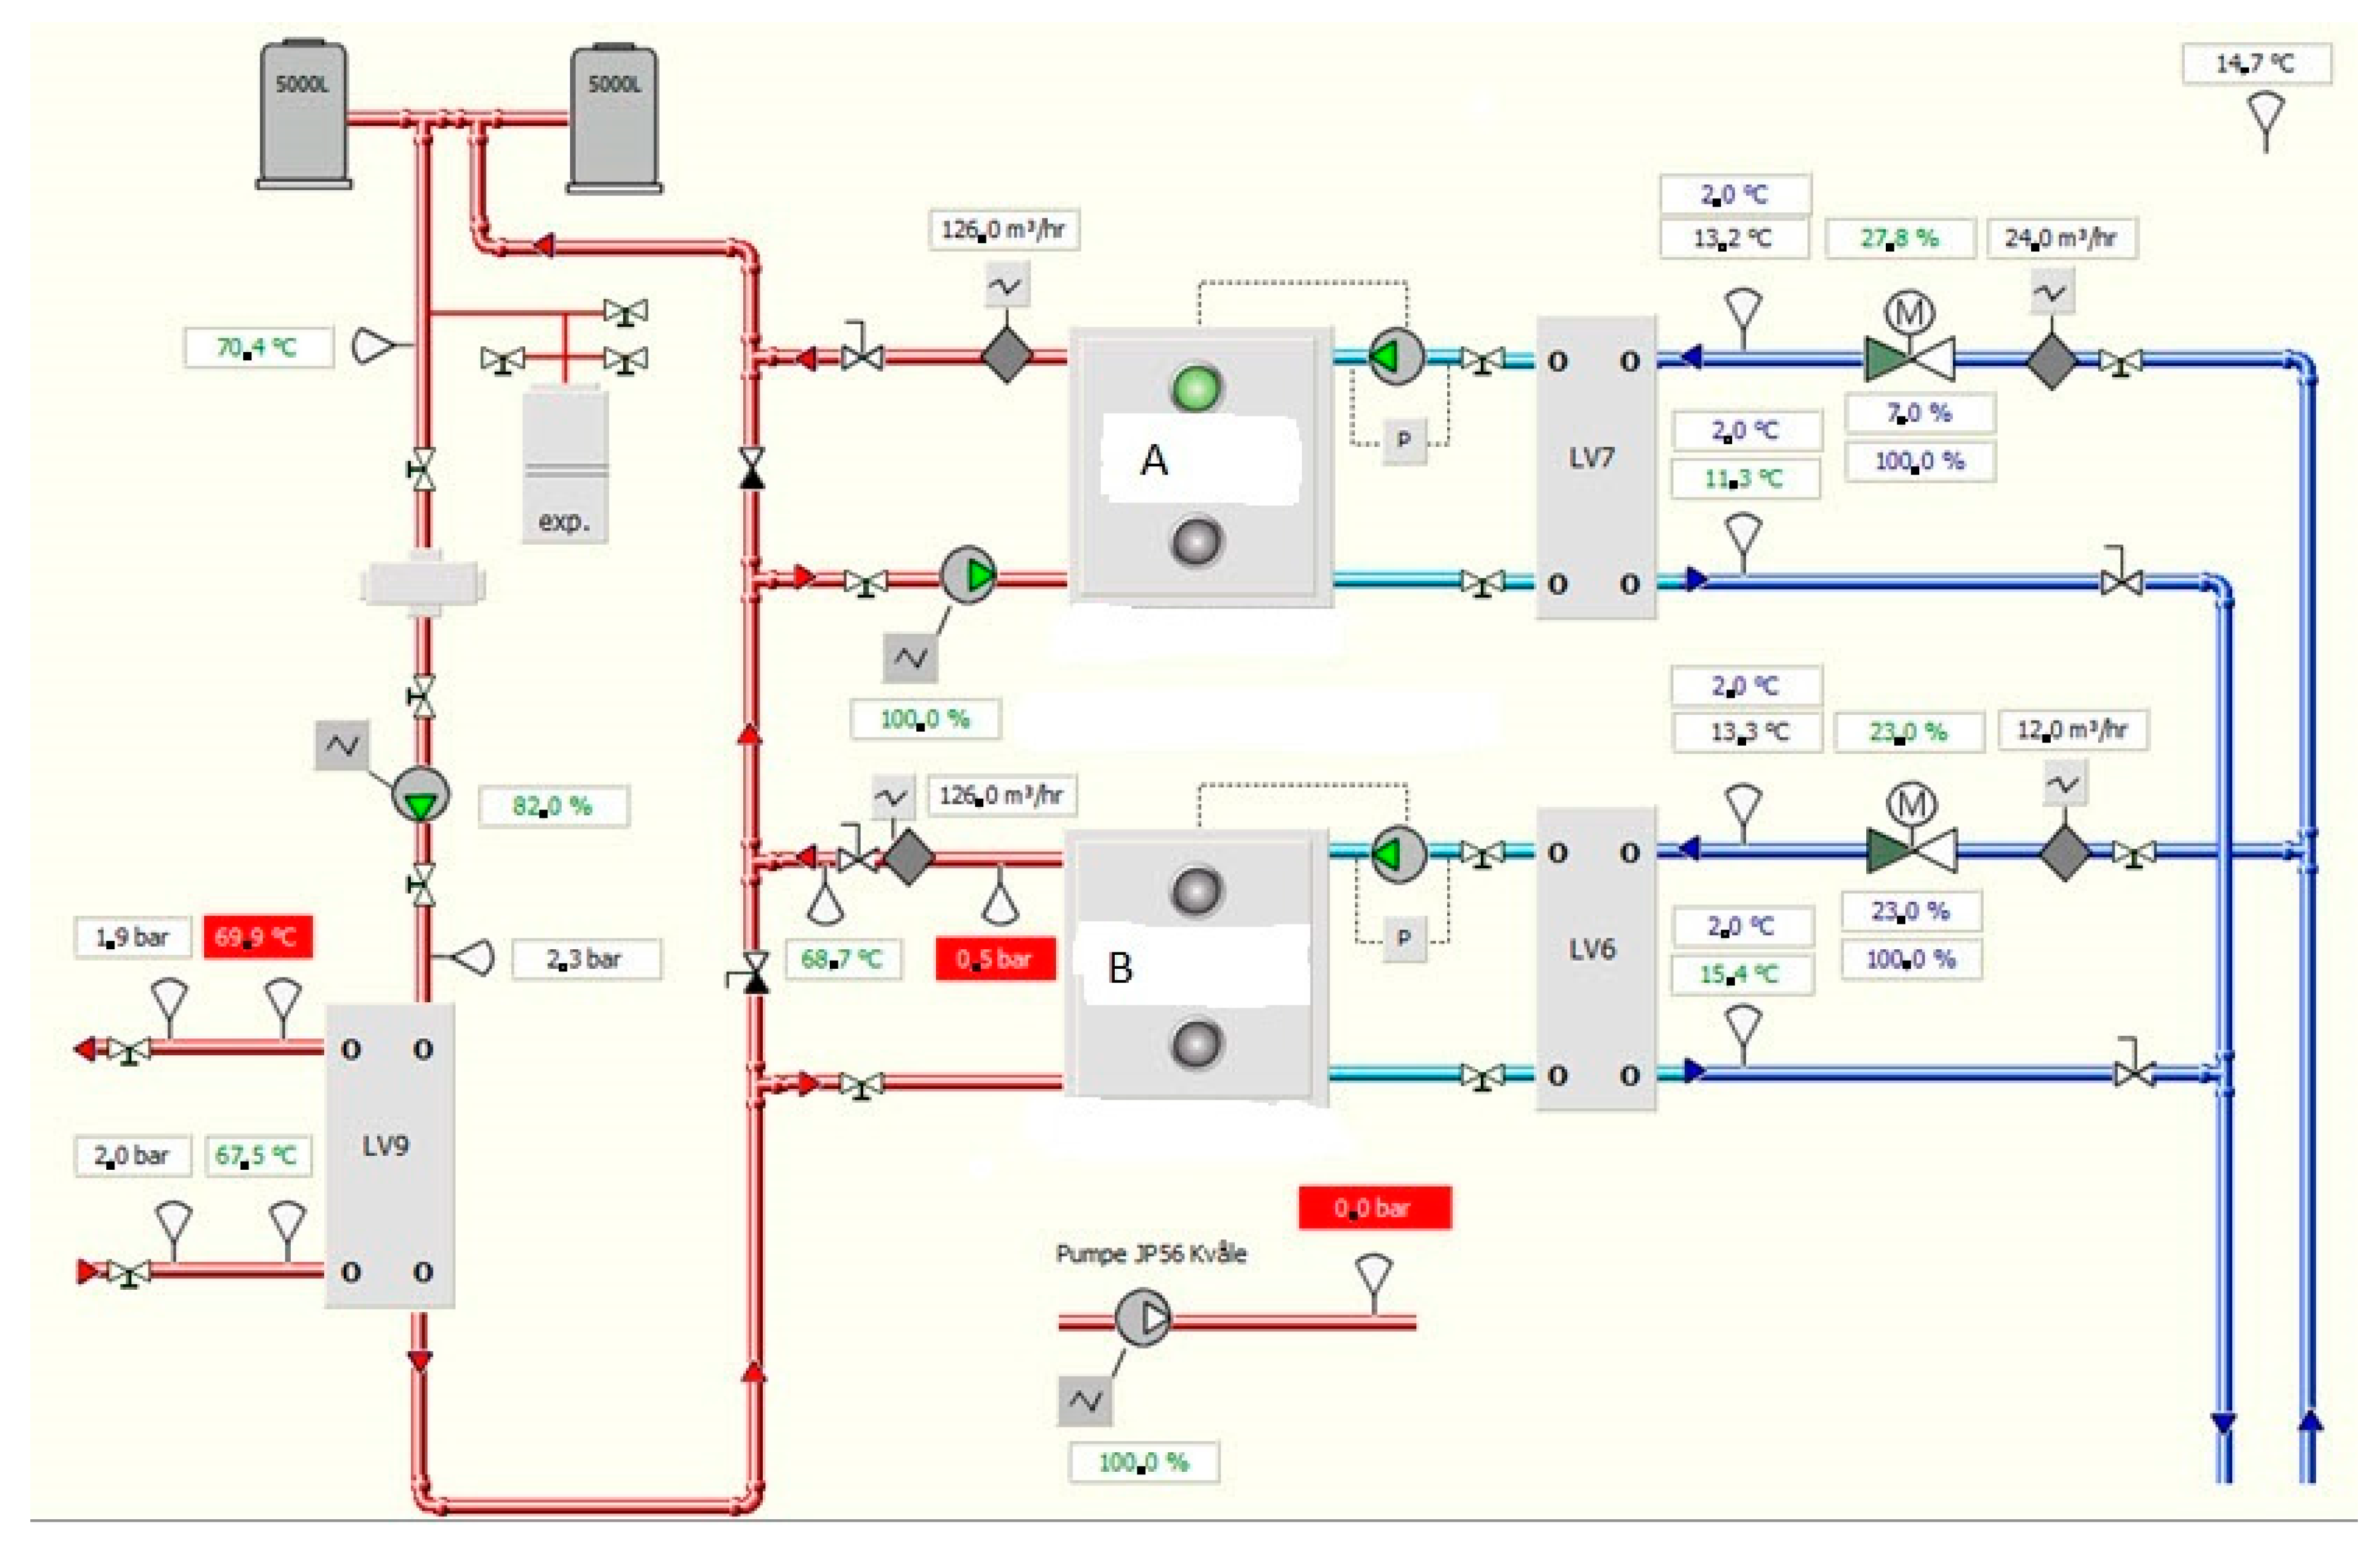
The heat center located close to the customers. In this example, the WEPS system has two heat pumps (A and B in the figure) and two heat exchangers (LV6 and LV7 in the figure). By using two heat pumps and two heat exchangers, it is possible to do maintenance without interrupting the production. Sea water is pumped through the heat exchangers (LV6 or LV7, blue tubes), where heat is transferred to non-salty water. Water is pumped from the heat exchangers (LV6 or LV7, light blue tubes) to the heat pumps (A or B). In the heat pumps, the heat of the water is transferred and increased. The water distributed to customers (red tubes) holds a temperature of about 71 °C. The customers use the hot water in radiators. This figure is based on the WEPS built in Sogndal in 2014 by Sognekraft AS. The picture is used with permission from Sognekraft AS, Norway.
Figure 4.
The heat center located close to the customers. In this example, the WEPS system has two heat pumps (A and B in the figure) and two heat exchangers (LV6 and LV7 in the figure). By using two heat pumps and two heat exchangers, it is possible to do maintenance without interrupting the production. Sea water is pumped through the heat exchangers (LV6 or LV7, blue tubes), where heat is transferred to non-salty water. Water is pumped from the heat exchangers (LV6 or LV7, light blue tubes) to the heat pumps (A or B). In the heat pumps, the heat of the water is transferred and increased. The water distributed to customers (red tubes) holds a temperature of about 71 °C. The customers use the hot water in radiators. This figure is based on the WEPS built in Sogndal in 2014 by Sognekraft AS. The picture is used with permission from Sognekraft AS, Norway.

Table 1.
The temperatures of the water when the Water-thermal Energy Production System (WEPS) is in heating mode. The temperatures may differ a little from these figures during the year. In WEPS-Eid, the temperatures of the water from the heat exchanger to the customer are always 1.5 °C lower than the temperature of the sea water.
| Flow of Water | Temperature |
|---|---|
| Water from the sea to the heat exchanger | 8 °C |
| Water from the heat exchanger to the customer | 6.5 °C |
| Water from the customer to the heat exchanger | 1.5 °C |
Table 2.
The temperatures of the water when the WEPS is in cooling mode. The temperatures may differ a little from these during the year. In August or September, the sea temperature may be 10 °C, while it is usually about 8 °C in June and July. The maximum difference on either side of the temperature of the water to the customer is 1.5 °C.
| Flow of Water | Temperature |
|---|---|
| Water from the sea to the heat exchanger | 8 °C |
| Water from the heat exchanger to the customer | 9.5 °C |
| Water from the customer to the heat exchanger | 11 °C |
Table 3.
Assumptions and calculated results of the WEPS-Eid.
| Assumption: Full Capacity | Assumption: 58.3 Percent Capacity | |
|---|---|---|
| Annual production | 18 GWh | 10.5 GWh |
| Total investment | 44.8 mill NOK NOK | 34.6 mill NOK |
| Project life | 40 years | 40 years |
| Annual revenue | 13.5 mill NOK | 7.875 mill NOK |
| Annual cost of maintenance | 6.225 mill NOK | 3.9 mill NOK |
| Annual reinvestment cost | 1.3 mill NOK | 1.3 mill NOK |
| Risk-free real interest rate | 2 percent | 2 percent |
| Risk premium | 1 percent | 1 percent |
| Price of electricity | 0.75 NOK/kWh | 0.75 NOK/kWh |
| Annual real price increase | 0 | 0 |
| Net present value (r = 2%) | 118.7 mill NOK | 38.6 mill NOK |
| Net present value (r = 3%) | 93.3 mill NOK | 27.2 mill NOK |
| Internal rate of return | 13.2 percent | 7.3 percent |
Table 4.
The table shows the ex post result for one of the customers (Moengården) of WEPS-Eid. The energy requirement is assumed to be 200 kWh per m, identical to the norm for this type of building in Norway. The price of electricity including grid cost is assumed to be 0.9 NOK per kWh. The reduced cooling costs are compared with cooling using electricity. Due to the good results, this customer has in 2017 substantially increased the area where he/she uses WEPS.
| Topic | Results |
|---|---|
| Heated area | 4.800 m |
| Bought energy without WEPS | 960,000 kWh |
| Bought energy with WEPS | 550,000 kWh |
| Saved energy per year | 410,000 kWh |
| Cost reduction per year | 369,000 NOK |
| Operating fee paid to WEPS owner | 43,000 NOK |
| Reduced heating costs per year | 326,000 NOK |
| Reduced cooling costs per year | 250,000 NOK |
© 2017 by the authors. Licensee MDPI, Basel, Switzerland. This article is an open access article distributed under the terms and conditions of the Creative Commons Attribution (CC BY) license (http://creativecommons.org/licenses/by/4.0/).
Share and Cite
MDPI and ACS Style
Idsø, J.; Årethun, T. Water-Thermal Energy Production System: A Case Study from Norway. Sustainability 2017, 9, 1665. https://doi.org/10.3390/su9091665
AMA Style
Idsø J, Årethun T. Water-Thermal Energy Production System: A Case Study from Norway. Sustainability. 2017; 9(9):1665. https://doi.org/10.3390/su9091665
Chicago/Turabian StyleIdsø, Johannes, and Torbjørn Årethun. 2017. "Water-Thermal Energy Production System: A Case Study from Norway" Sustainability 9, no. 9: 1665. https://doi.org/10.3390/su9091665
Note that from the first issue of 2016, this journal uses article numbers instead of page numbers. See further details here.