Deriving Ocean Surface Drift Using Multiple SAR Sensors

1
NASA Goddard Space Flight Center, Greenbelt, Maryland, USA
2
Technology and Science Institute of Northern Taiwan, Taipei, Taiwan
*
Author to whom correspondence should be addressed.
Remote Sens. 2009, 1(3), 266-277; https://doi.org/10.3390/rs1030266
Submission received: 3 June 2009
/
Revised: 9 July 2009
/
Accepted: 9 July 2009
/
Published: 13 July 2009
(This article belongs to the Special Issue Microwave Remote Sensing)
Abstract
:Tracking and monitoring ocean features which have short coherent time periods from sequential satellite images requires that the images have both very high spatial resolutions and short temporal sampling intervals (i.e., repeated cycles). Satellite images from a single sensor in a polar-orbiting satellite usually cannot meet these requirements since high spatial resolution of the sensor may result in relatively long temporal sampling interval and vice versa, such as the case of Synthetic Aperture Radar (SAR). This paper presents a new multi-sensor approach to overcome the long temporal sampling interval associated with a single SAR sensor while taking advantage of high spatial resolution of SAR images for the application of ocean feature tracking. Currently, there are two SAR sensors on different satellites, the European Remote Sensing Satellite-2 (ERS-2) and the ENVIronment SATellite (ENVISAT), having acquisition time offset around 28 minutes with almost exactly the same path. That is, ERS-2 is following ENVISAT with a 28-minutes delay, which is a good time-scale for ocean mesoscale feature tracking. A pair of SAR images from ERS-2 and ENVISAT collected on April 27, 2005 has been chosen to track ocean surface features by using wavelet analysis. As demonstrated in the case studies, this technique is robust and capable to derive ocean surface drift near an oil slick and around a big eddy in the South China Sea (SCS).
1. Introduction
The applications of satellite images are greatly determined by their spatial resolutions and temporal sampling intervals. For ocean features that have long coherent time periods, such as sea-ice in the Arctic, there are many polar-orbiting satellite sensors whose temporal sampling intervals are shorter than the features’ coherent time periods. Therefore, the sequential satellite images from these sensors may be used to track the motion of the ocean/ice features. For example, data from Special Sensor Microwave/Imager (SSM/I), NASA Scatterometer (NSCAT), the “Quick recovery” mission to fill the gap created by the loss of data from NSCAT (QuikSCAT), and Advanced Microwave Scanning Radiometer for EOS (AMSR-E) have been used to derive sea-ice motion data in both the Arctic and the Antarctic regions by a wavelet transform-based ice tracking procedure [1,2,3]. However, if ocean features’ coherent time periods are short, tracking features from sequential images of a single polar-orbiting sensor would require that the satellite images used have very high spatial resolutions and short temporal sampling intervals. This is because the temporal sampling interval of the satellite images must be within the feature’s short coherent time period to ensure that two sequential satellite images contain common feature for tracking [4], and the spatial resolution of satellite images must be fine enough to detect the motion of the feature during tracking period.
Most satellite images from a single polar-orbiting sensor may not have both high spatial resolution and short temporal sampling interval since high spatial resolution would generally result in long temporal sampling interval and vice versa. Thus, sequential satellite images from a single polar-orbiting sensor may not be used to track ocean surface features with short coherent time periods. For example, satellite Synthetic Aperture Radar (SAR) sensors onboard a polar-orbiting satellite have the ability to acquire high spatial resolution images of the Earth’s surface under all weather conditions [5,6], but their temporal sampling intervals (repeated cycles) are generally quite long. SAR images have been used in many applications, such as providing valuable information on the type, condition, and motion of the sea-ice and ships, and surface signatures of swells, wind fronts, oil slicks, bathymetry [6,7], and eddies [5], as well as providing information on the surface signatures of ocean internal waves [2,4,8,9,10,11].
One of the major challenges in mapping surface currents is the resolution of ocean features in both time and space. Computing coastal ocean surface currents from infrared and ocean color satellite imagery has been studied by [12] using the maximum cross-correlation technique. Ocean surface currents have also been derived by [13] using wavelet analysis to track sequential infrared images. They show that wavelet analysis improves the estimated sea surface current field by increasing the number of current vectors about 20% as compared with that using the maximum cross-correlation method. However, these images are always obscured by clouds and darkness, and make it difficult for feature tracking. The recent use of a long-track interferometry in SAR has shown promise for synoptic measurement of ocean surface currents. The design employs a pair of interferometer beams, and each is sensitive to the component of surface Doppler velocity in the direction of beam. An airborne system is in development as reported by [14] on Dual-beam interferometry for ocean surface current vector mapping.
Currently, there are two SAR sensors on polar-orbit which are onboard ERS-2 and ENVISAT and have almost the exactly same flight paths, with ERS-2 following ENVISAT by approximately 28 minutes. The ERS-2, launched in April 1995 by European Space Agency (ESA), has a conventional SAR with a swath of 100 km and a nominal resolution of 25 m. ENVISAT, launched in March 2002, also by ESA, has an Advanced SAR (ASAR) which can operate either with a conventional narrow swath of 100 km and a nominal spatial resolution 25 m or wide swath of 405 km with 100 m resolution. This provides a way to overcome the long temporal sampling intervals associated with a single polar-orbiting SAR sensor while taking advantage of high resolutions of SAR images. That is to use a pair of ERS-2 and ENVISAT conventional SAR images from their sequential visits over same locations in 28 minutes for the application of ocean surface feature tracking.
The difficulty of this multi-sensor approach is to identify and track the common features in a pair of ERS-2 and ENVISAT SAR images. In next section, wavelet transform technique is used to overcome the difficulty in this multi-sensor approach to derive ocean surface drift. Surface drifts near an oil slick and around a big eddy have been derived in Section 3 by using this wavelet transform-based feature tracking procedure from a pair of ENVISAT and ERS-2 SAR images collected on April 27, 2005 in the southern part of Luzon Strait in SCS. For reference, wind data from QuikSCAT are compared with the satellite-derived flow field in Section 4 and the comparison shows a generally consistent flow pattern. Section 5 shows the tracking of ships and ship wakes. Finally, Section 6 provides the discussion and concluding remarks.
2. Image Processing by Wavelet Analysis
To derive ocean surface drift from a pair of ERS-2 and ENVISAT SAR images collected approximately 28 minutes apart, the first step is to co-register these two images. This can be done by mapping the full-resolution ERS-2 and ENVISAT SAR images to a common coordinate system with the same pixel size using the geo-location information provided by the sensors. Since both SAR images have spatial resolution of 25 m, the pixel size chosen for co-registration must be larger than or equal to 25 m so that each pixel in the remapped image within the data coverage area would have at least one data point in the original image. The value of each pixel in the remapped image is taken to be the average of the pixel values of all its data points. In this study the ERS-2 and ENVISAT SAR images are mapped into the longitude and latitude coordinate system with the pixel size of 0.0005° × 0.0005° (roughly 55 m × 55 m). After co-registration, the subscenes of the study area are cut out from the remapped SAR images and used for feature tracking.
Wavelet transforms are analogous to Fourier transform but are localized both in frequency and time. A two-dimensional wavelet transform is a highly efficient band-pass data filter, which can be used to separate various scales of processes [15,16]. For effective identification and tracking of the common features in a pair of chosen subscenes, a two-dimensional Mexican-hat wavelet transform is applied to the subscenes with several spatial scales corresponding to extracted features and filtering out noise in the data [17]. Filtered images have been examined for matching features by using templates. Matched templates are then readily converted to motion vectors and block-averaged onto a chosen grid. In this study, the matching template is a square of 16 × 16 pixels (roughly 0.88 km × 0.88 km) and the grid size is equal to the size of matching template. The choice of template and grid size is the result of the trade-off between higher resolution and better feature tracking capabilities. The detailed procedure and flow chart of wavelet transform-based tracking method has been reported in many papers and is summarized in a book chapter on wavelet analysis of satellite images in ocean applications [18].
For reference, the wavelet transform-based ice tracking method has been developed and used to SSM/I, NSCAT, QuikSCAT, and AMSR-E data to obtain daily sea-ice drift information for both the Arctic and Antarctic. The overall comparison of satellite-derived ice motion with Arctic buoy data shows good agreement [19,20]. The same technique has also been used to chlorophyll-a concentration images provided by Moderate Resolution Imaging Spectroradiometer (MODIS) and Sea-viewing Wide Field-of-view Sensor (SeaWiFS) to derive ocean surface layer drift in a large scale [21]. The surface layer drift derived by the wavelet transform technique shows major oceanographic features, such as the Gulf Stream boundary and a nearby cold-core cyclonic eddy. The qualitative comparison of the satellite-derived surface layer drift with the data from several drifter buoys shows a generally consistent pattern over the east coast of the United States. All these results demonstrate the wavelet-based tracking technique is a robust and useful tool for deriving ocean surface drift.
The accuracy of this feature tracking method is only limited by the persistence of the features, the spatial resolution, and navigational accuracy of satellite data. Since the remapped ERS-2 and ENVISAT SAR images have pixel size of 55 m, the derived surface drift will have maximum speed uncertainty of 3.3 cm/s due to sensor resolution (55 m/28 min = 5,500 cm/1,680 s = 3.3 cm/s). The ERS-2 and ENVISAT SAR Precision Images have maximum geo-location errors of 100 m in range direction and 200 m in azimuth direction [22]. But their geo-location errors over ocean surface are expected to be much smaller because that elevation displacement for SAR images would be small over ocean surface than land. In fact, ERS-2 and ENVISAT SAR Terrain Geocoded Images which are corrected for terrain distortion have geo-location errors less than 50 m. Thus, the geo-location errors of the ERS-2 and ENVISAT SAR Precision Images over ocean surface should be less than 50 m. Therefore, the derived surface drift has the maximum speed uncertainty of 6.0 cm/s due to geo-location error (2 × 50 m/28 min = 10,000 cm/1,680 s = 6.0 cm/s). However, the upper bound of 6.0 cm/s is estimated by assuming the pixel location errors of the feature signatures in the two images due to geo-location errors occur in complete opposite directions. Since both ERS-2 and ENVISAT SAR sensors are designed and operated by ESA and the image acquisition time offset between them is only about 28 minutes, the characteristics of geo-location errors of the two sensors must be quite similar. Then pixel location errors of the feature signatures in two images may occur in a similar fashion. In such a case, the upper bound of speed uncertainty should be largely reduced.
3. Drift near an Oil Slick and around a Big Eddy
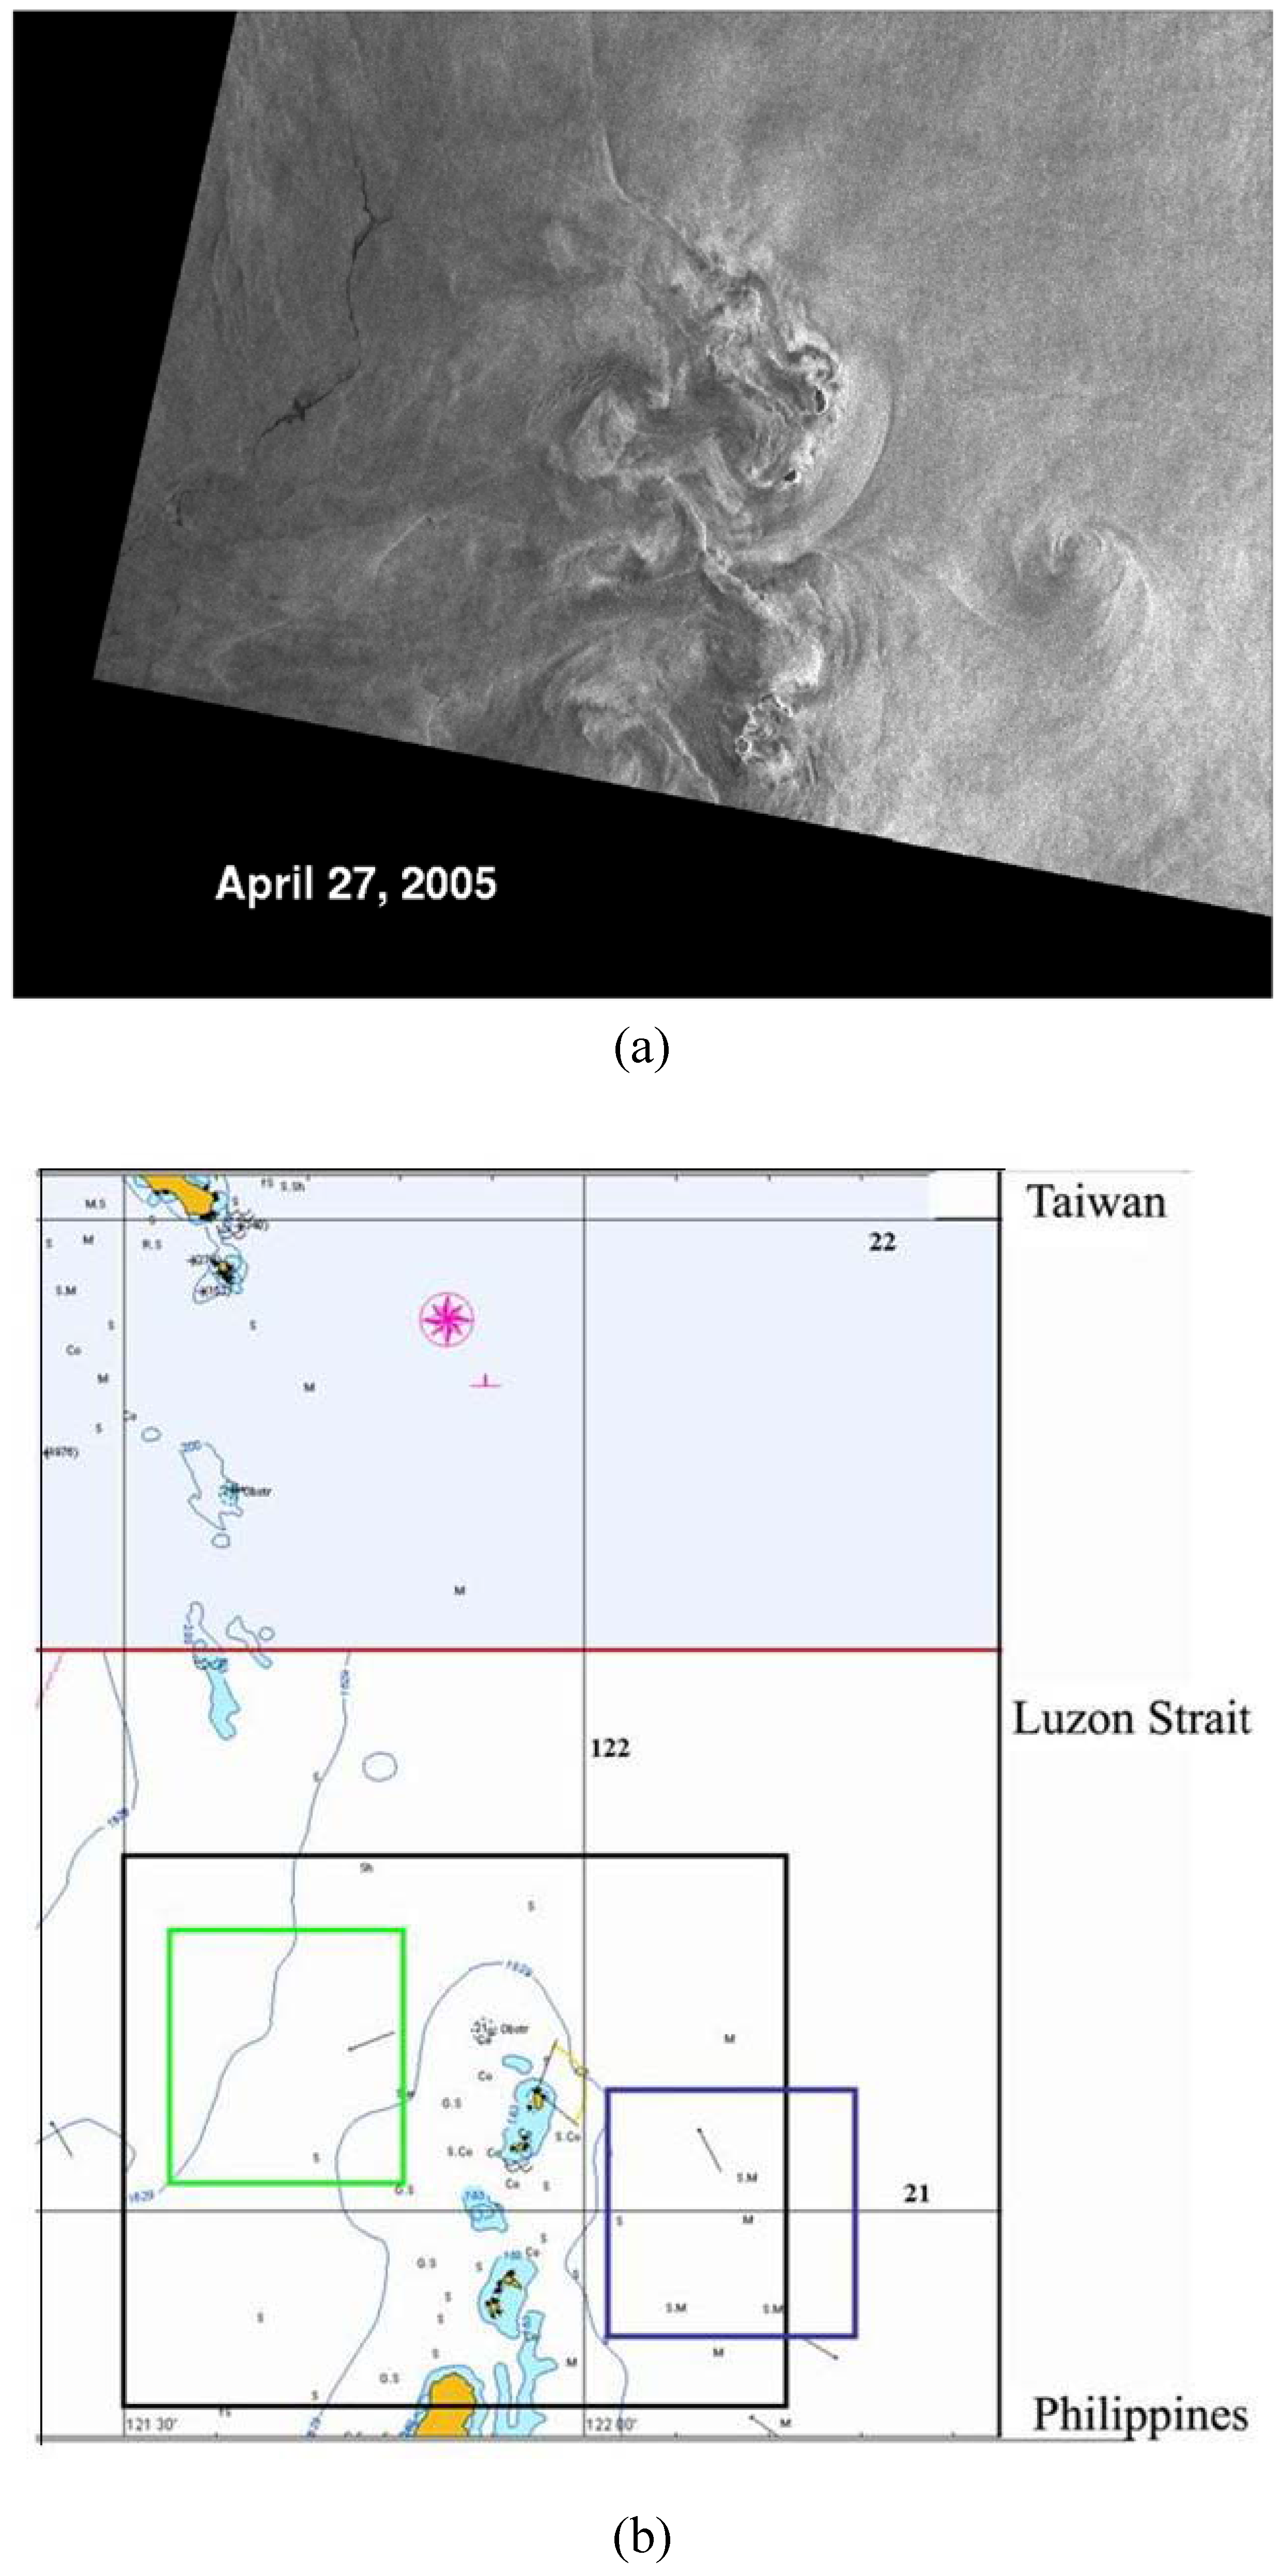
The wavelet transform-based feature tracking procedure has been used to derive surface drift near an oil slick and around a big eddy in the southern part of Luzon Strait near Philippines in SCS. SAR data from ENVISAT and ERS-2 were collected on April 27, 2005 at 01:54 and 02:22 GMT, respectively. Figure 1(a) shows the ERS-2 SAR image (60 km × 80 km) obtained on April 27, 2005 north of Philippines in the Luzon Strait, and Figure 1(b) is the location map with the SAR image coverage area shown in the big black box for reference. The small green and blue boxes are subscene coverage areas for surface slick and eddy tracking study, respectively. A chain of islands in the Luzon Strait can be easily identified in the SAR image. Also, a big eddy (on the east of islands), oil slick (on the west of islands), wave refraction, and fronts around these islands are clearly observed in SAR image as the mesoscale surface features. For deriving the ocean surface drift near the oil slick, a SAR subscene has been selected from each image.
Figure 1.
(a) ERS-2 SAR image (60 km × 80 km) collected on April 27, 2005, north of Philippines in the Luzon Strait, and (b) the location map with the SAR image coverage area shown in the large black box. The small boxes are subscenes coverage areas for surface slick and eddy tracking study.
Figure 1.
(a) ERS-2 SAR image (60 km × 80 km) collected on April 27, 2005, north of Philippines in the Luzon Strait, and (b) the location map with the SAR image coverage area shown in the large black box. The small boxes are subscenes coverage areas for surface slick and eddy tracking study.

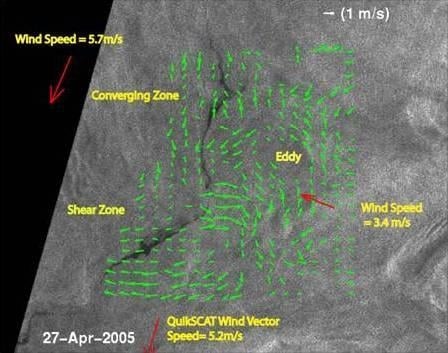
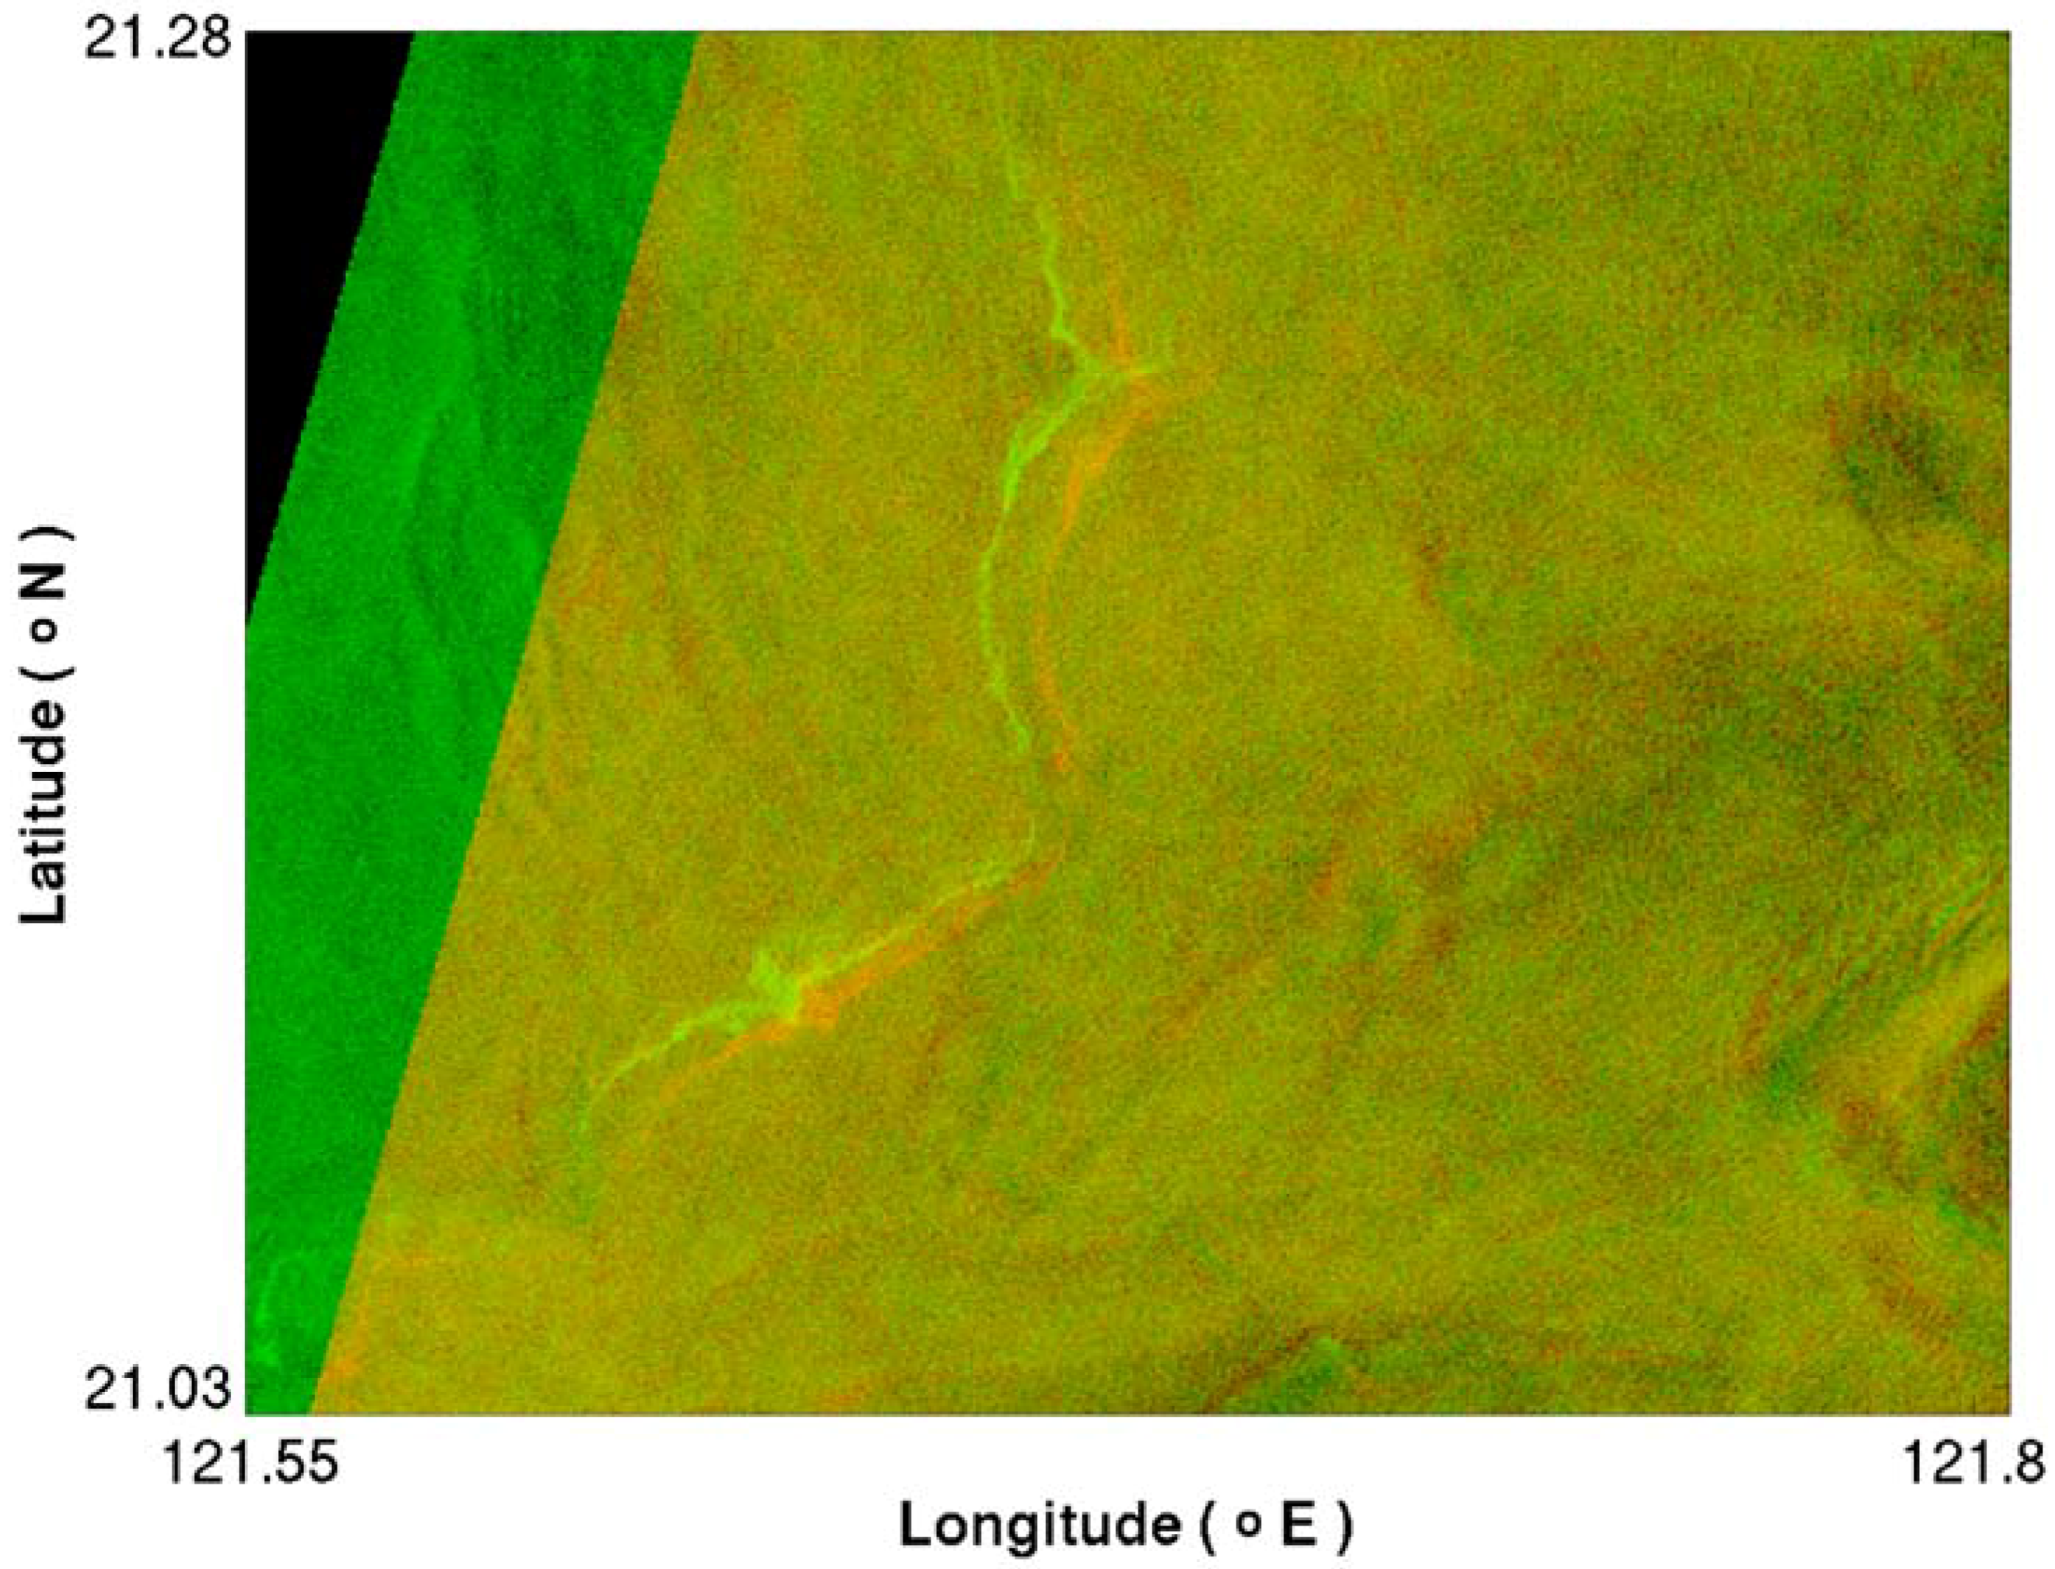
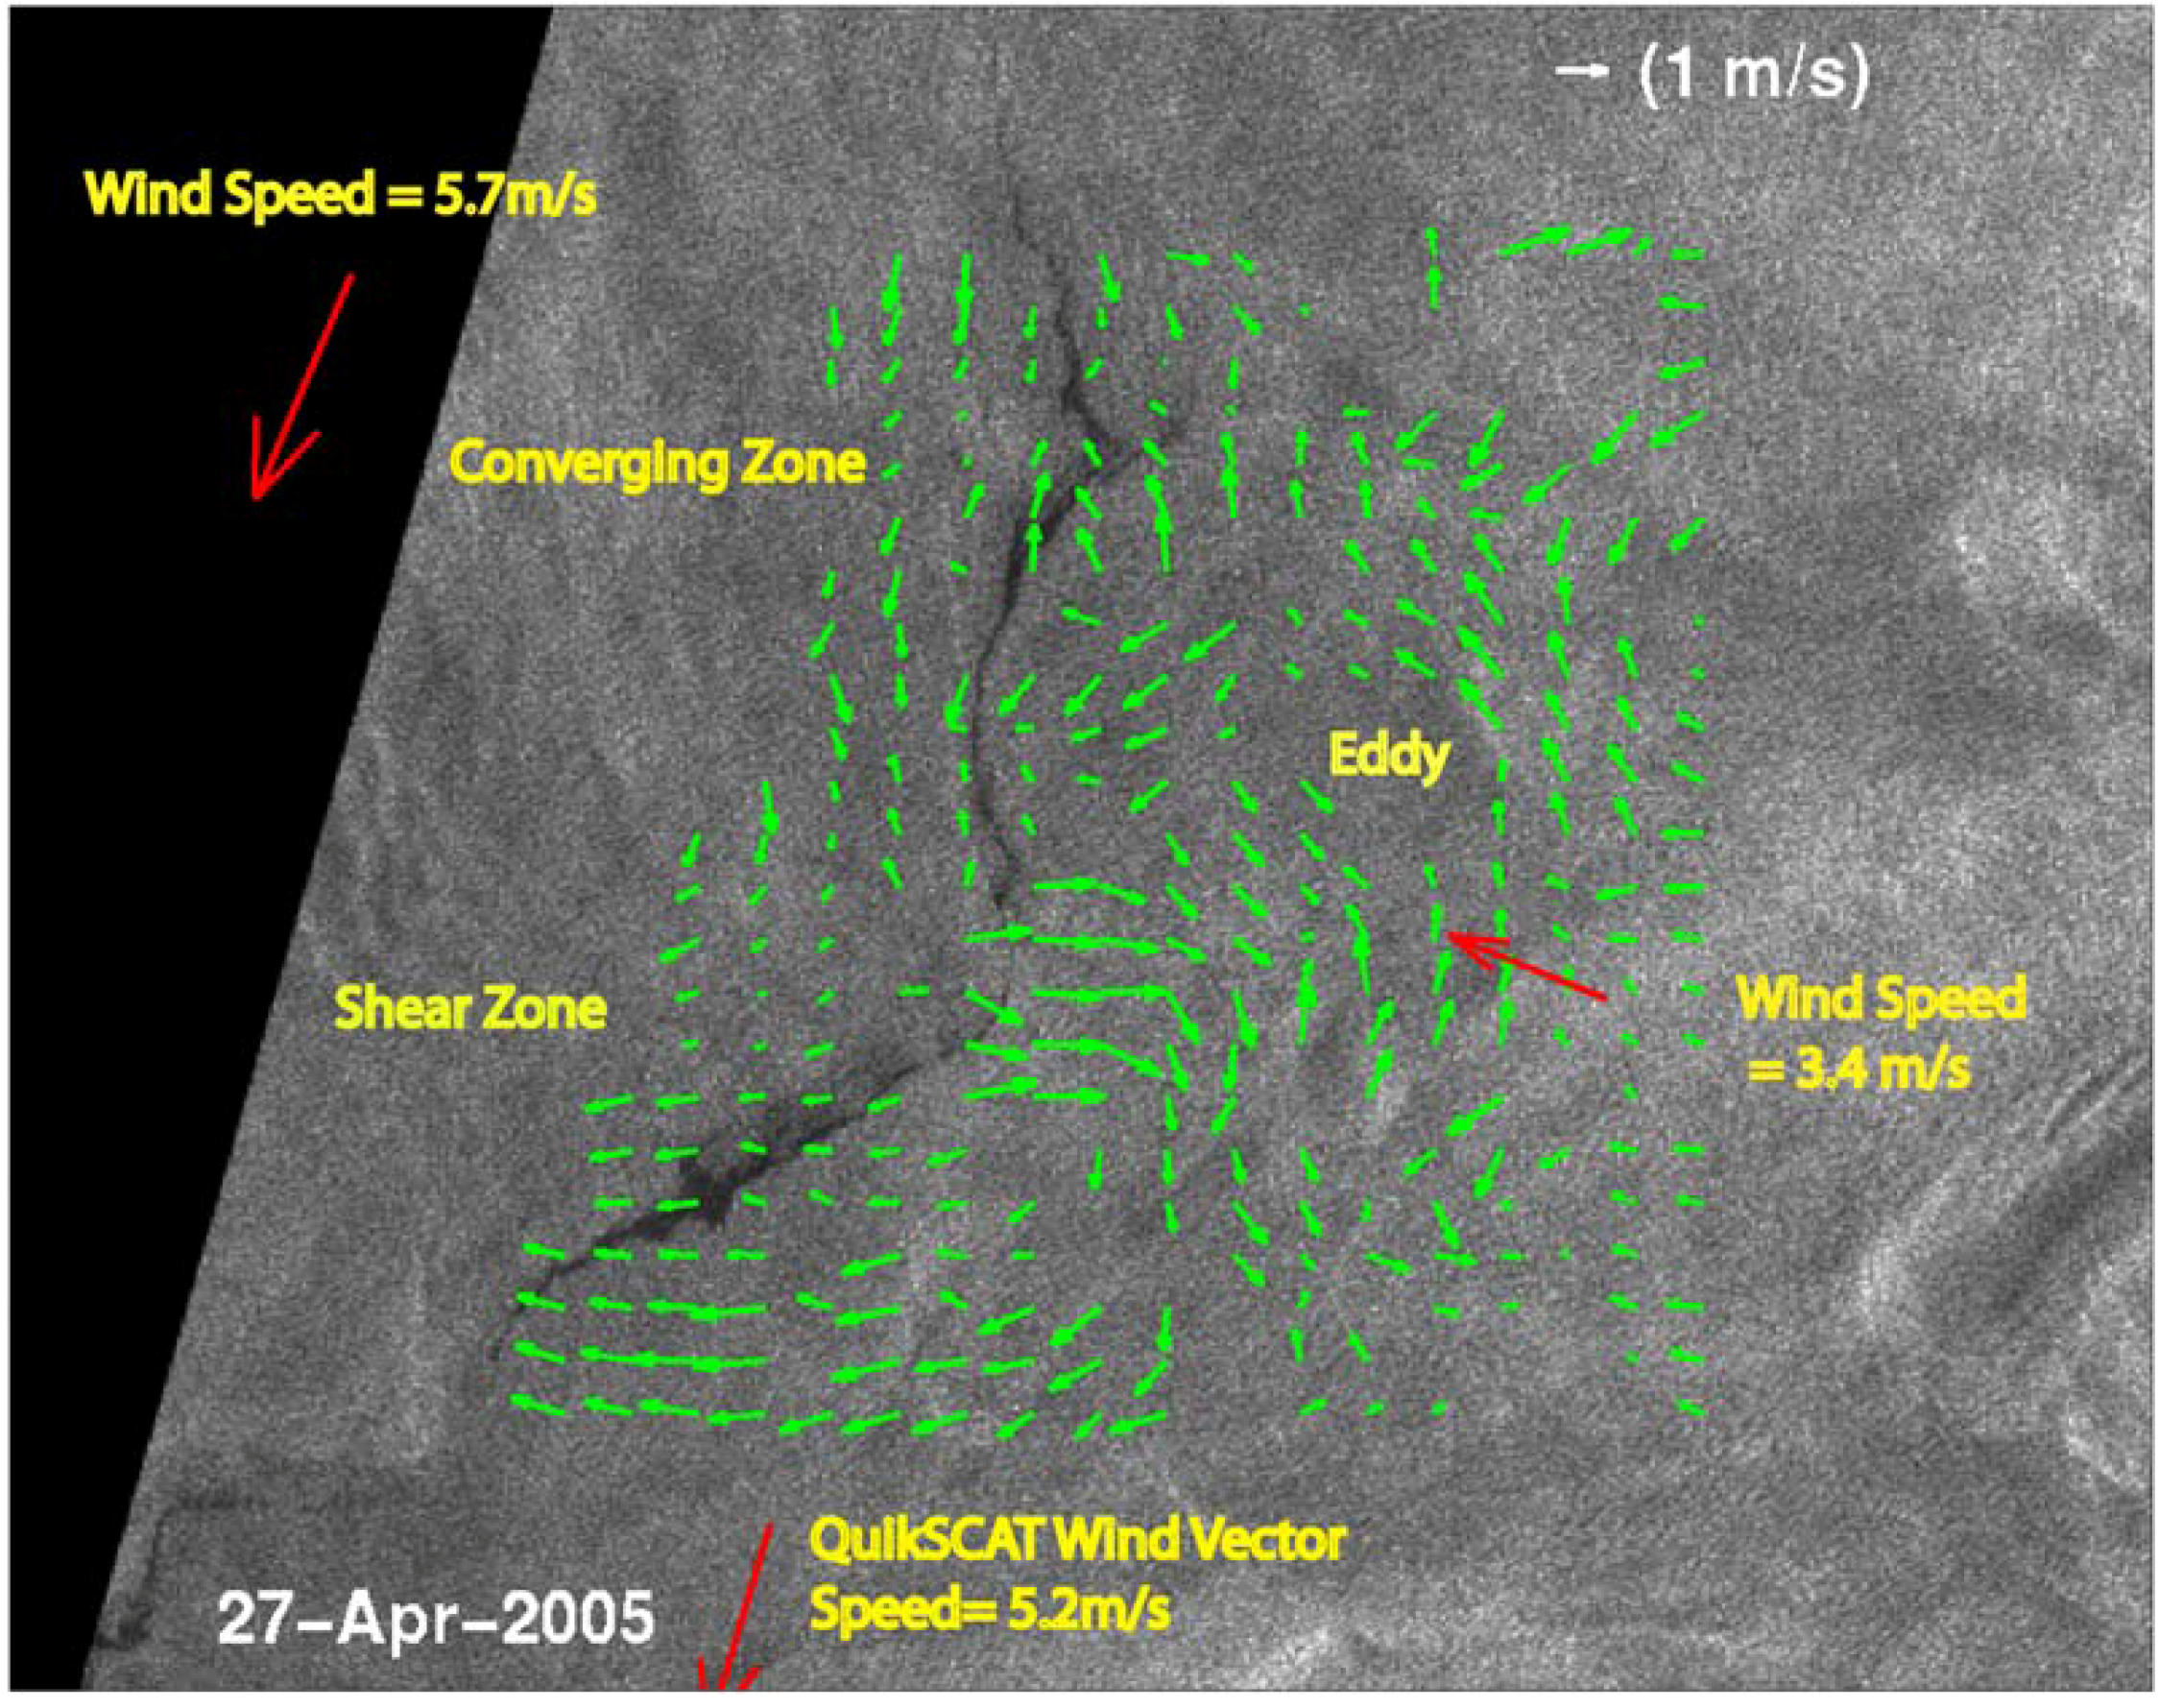
Figure 2 shows the overlay of these two SAR subscenes of ERS-2 (in green) and ENVISAT (in red). The central location of these subscenes is 21.15oN and 121.68oE, and the size is approximately 28.2 km × 28.2 km. The subscene coverage area is shown in the small green box in Figure 1(b). The major oceanographic feature, a long oil slick oriented in north-south direction, can be clearly identified. The phase shift of this oil slick in 28 minutes shows the surface drift pattern due to the advection of surface current. Figure 3 shows the surface drift (green arrows) derived by the wavelet transform-based feature tracking procedure from the two subscenes of ERS-2 SAR and ENVISAT ASAR surface roughness backscattering data in Figure 2. A re-mapped ENVISAT image appears as background to highlight the oil slick. As shown in this figure, the oil slick motion of 1.2 m/s in maximum by surface current advection has been derived and can be clearly identified. Notice that the converging area at the top shows a kink on the oil slick. Also, the shear zone in the middle dilutes and bends the slick near the bottom. Furthermore, on the right-hand side of slick, a small eddy of 10 km in size can be identified from their cyclonic circulation flow pattern. The areas lacking drift vectors in the map indicate the regions where filtered features were not matched.
Figure 2.
Overlay of two SAR subscenes of oil slick collected over the Luzon Strait near Philippines from ERS-2 (in green), and ENVISAT (in red) on April 27, 2005 separated by 28 minutes. The subscene coverage area is shown in the small green box in Figure 1(b).
Figure 2.
Overlay of two SAR subscenes of oil slick collected over the Luzon Strait near Philippines from ERS-2 (in green), and ENVISAT (in red) on April 27, 2005 separated by 28 minutes. The subscene coverage area is shown in the small green box in Figure 1(b).

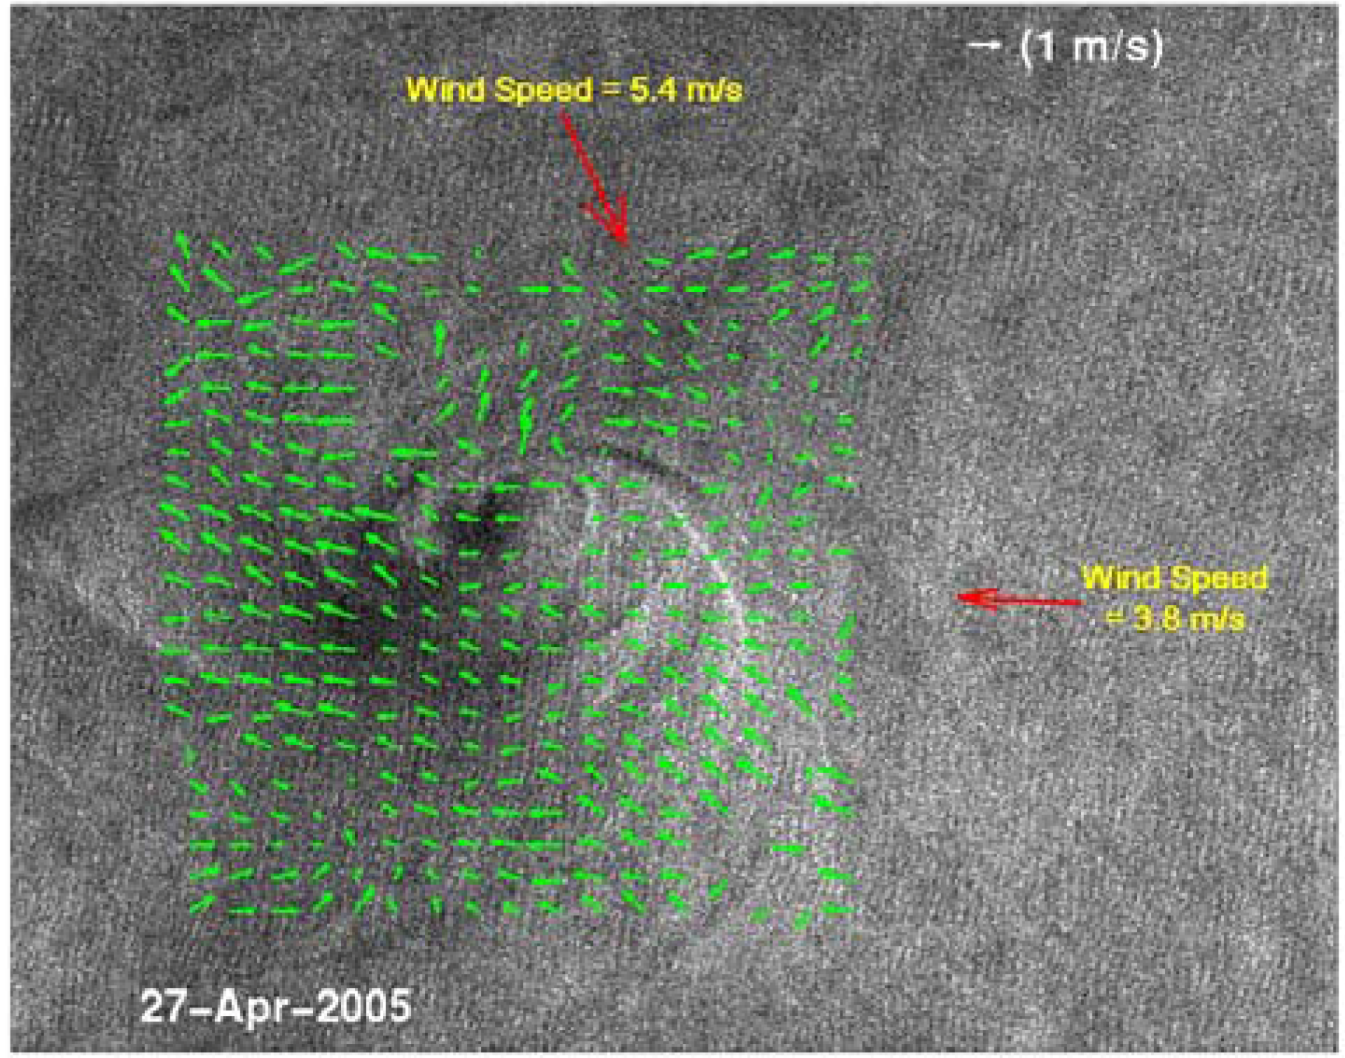
Another case study is around the big eddy shown in Figure 1. A subscene around the big eddy has been chosen from both ERS-2 and ENVISAT images on April 27, 2005. The subscene coverage area is indicated by a small blue box in Figure 1(b). Figure 4 shows the overlaid of two SAR subscenes of ERS-2 (in green) and ENVISAT (in red) for a big cyclonic eddy observed on April 27, 2005. As shown in Figure 4, the two eddy’s center are not coincided and shifted by a large distance due to the surface drift after 28 minutes. Figure 5 shows the surface drift (green arrows) derived by the wavelet-based feature tracking method from these two selected subscene data. The surface drift is dominated by the western current. However, a secondary cyclonic eddy motion can be detected at the northeast of the eddy center with a maximum speed of 0.7 m/s. The results are very noisy due to the low signal-noise-ratio induced by the large swell motion visible in the SAR image.
Figure 3.
Ocean surface drift (green arrows) derived from ERS-2 and ENVISAT SAR data near the oil slick area (ENVISAT image as background). The surface drift unit of 1 m/s is indicated by a white arrow at the top. The QuikSCAT wind data are shown as red arrows.
Figure 3.
Ocean surface drift (green arrows) derived from ERS-2 and ENVISAT SAR data near the oil slick area (ENVISAT image as background). The surface drift unit of 1 m/s is indicated by a white arrow at the top. The QuikSCAT wind data are shown as red arrows.

4. Comparison with Wind Data
For reference, wind data from QuikSCAT on April 27, 2005 are used to compare with the satellite-derived flow field since there are no in-situ measurements of surface drift in this area. The SeaWinds instrument on the QuikSCAT satellite is a special microwave radar that measures near-surface wind speeds and directions under all weather and cloud conditions over Earth’s oceans. Currently, the empirically derived model function has been used to relate normalized radar cross-section with wind speed and direction. For this Level 2B data product, the wind vector is retrieved by fitting the QuikSCAT measurements to the NSCAT-2 geophysical model function that describes the expected radar backscatter as a function of wind speed, wind direction relative to the look angle, and the incidence angle. Similar data products have been extensively examined both by the NASA Jet Propulsion Laboratory QuikSCAT Project and by members of the NSCAT/QuikSCAT Science Team, with results presented at a Calibration/Validation workshop [23]. The wind map has been distributed with a 25 km grid over the ocean surface. In the first case study area, three wind vectors have been identified and shown as red arrows in Figure 3. Similarly, two wind vectors have been identified in the second case study area and shown as red arrows in Figure 5.
The wind speeds and directions for the three wind vectors in Figure 3 from left to right are listed as follows: (a) 5.74 m/s, 198.5o; (b) 5.18m/s, 193o; and (c) 3.4 m/s, 297.27o, where the wind direction of 0 degree implies a flow toward the north. So, the wind vectors (a) and (b) having a speed of 5 to 6 m/s are coming approximately from the North and that is probably why the oil slick is more or less north-south oriented originally. The wind on the right-hand side is relatively weak (3.4 m/s) and coming approximately from the East. Although the wind data are very limited, the comparison shows a qualitatively consistent pattern between wind data and SAR observation, especially for the oil slick feature.
Figure 4.
Overlay of the two SAR subscenes of eddy collected over the Luzon Strait near Philippines from ERS-2 (in green), and ENVISAT (in red) on April 27, 2005 separated by 28 minutes. The subscene coverage area is indicated by a small blue box in Figure 1(b).
Figure 4.
Overlay of the two SAR subscenes of eddy collected over the Luzon Strait near Philippines from ERS-2 (in green), and ENVISAT (in red) on April 27, 2005 separated by 28 minutes. The subscene coverage area is indicated by a small blue box in Figure 1(b).

The wind speeds and directions for the two wind vectors from QuikSCAT in Figure 5 from left to right are listed as follows: (a) 5.44 m/s, 159.5° and (b) 3.8 m/s, 273.57°. In general, they are consistent with those in Figure 3. The wind vector (b) having speed 3.8 m/s is coming from the East and that is probably why the surface drift in Figure 5 is dominated by the western current. The secondary cyclonic eddy motion at the northeast of the eddy center is probably due to the wind vector (a) which is coming approximately from the northwest. The surface drift results are very noisy due to the low signal-to-noise ratio induced by the large swell motion most-likely forced by strong eastern wind.
Figure 5.
Ocean surface drift (green arrows) derived from ERS-2 and ENVISAT SAR data around the eddy area (ENVISAT image as background). The surface drift unit of 1 m/s is indicated by a white arrow at the top. The QuikSCAT wind data are shown as red arrows.
Figure 5.
Ocean surface drift (green arrows) derived from ERS-2 and ENVISAT SAR data around the eddy area (ENVISAT image as background). The surface drift unit of 1 m/s is indicated by a white arrow at the top. The QuikSCAT wind data are shown as red arrows.

5. Ship and Ship Wake Tracking
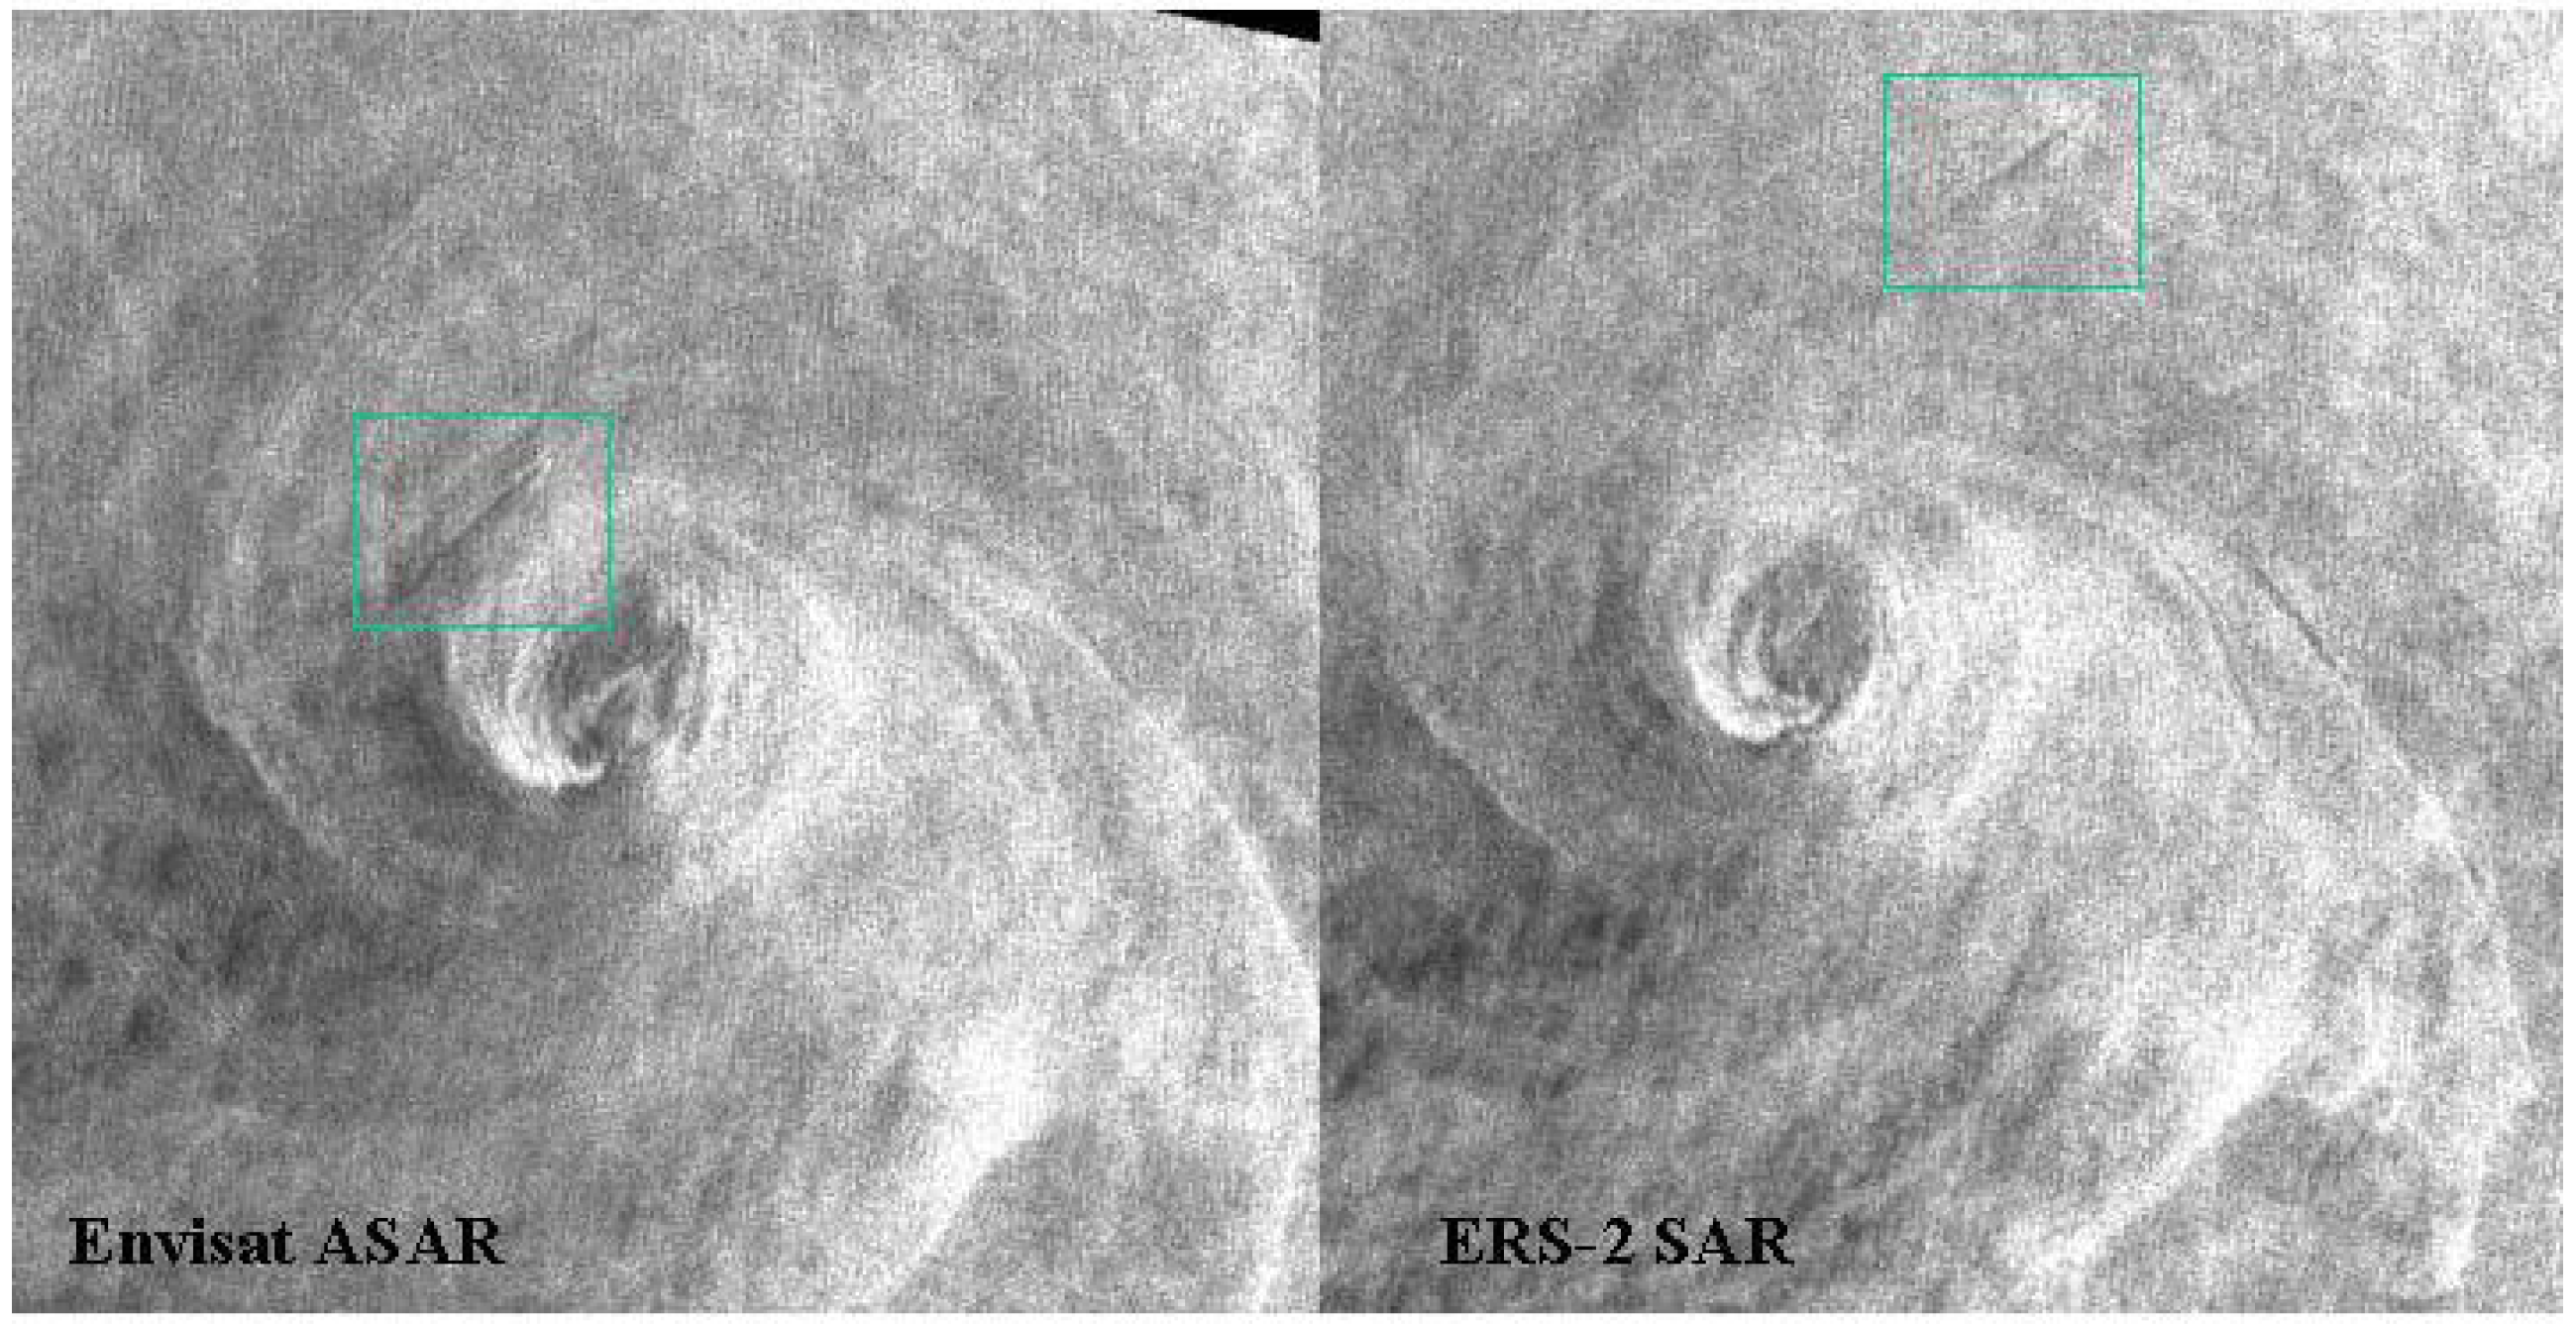
Ships and their wakes can be detected in the high-resolution SAR imagery provided by satellites. In general, a ship is a very effective corner reflector, so ships can be easily observed as a bright spot in the SAR image. But, occasionally, the ship in the SAR image remains almost invisible, and only trailing dark turbulent wakes are seen [24]. Figure 6 shows ENVISAT and ERS-2 28 km × 28 km SAR subscenes obtained on April 27, 2005 north of Philippines in the Luzon Strait. The images cover the area from longitude of 20.61° to 20.86°, and latitude of 122.09° to 122.34°. The mystery ship and its wake in the boxes near the eddy can be tracked easily in these figures. The ship’s speed can be estimated from the distance between ship locations in each SAR image and SAR acquisition time interval (28 minutes) to be 5.94 m/s. Very low backscattering of the ship configuration may have hidden the almost invisible ship from view, or the wake could have been formed, instead, by an underwater vehicle.
Figure 6.
ENVISAT and ERS-2 SAR subscenes (28 km × 28 km) collected on April 27, 2005 north of Philippines in the Luzon Strait. The almost invisible ship and its wake near the eddy can be tracked easily.
Figure 6.
ENVISAT and ERS-2 SAR subscenes (28 km × 28 km) collected on April 27, 2005 north of Philippines in the Luzon Strait. The almost invisible ship and its wake near the eddy can be tracked easily.

6. Discussion and Concluding Remarks
Recent work on deriving ocean surface currents are limited to the use of infrared and ocean color satellite imagery, and interferometry in SAR. The difficulties of feature tracking in a pair of SAR images are the co-registration of images and its low signal-to-noise ratio due to the speckle noise in SAR image. That is why there are only two tracking cases demonstrated near an oil slick and around a big eddy with relatively large signal-to-noise ratio in SAR images. Our work is the first demonstration on deriving ocean surface current using multiple SAR sensors by feature tracking method. This work provides a unique technique whereby current limitations in repeat-pass SAR imaging from a single polar orbiting SAR can be overcome, i.e., for the purpose of tracking features with a short period.
Two SAR sensors on different satellites, ERS-2 and ENVISAT, have almost the exactly same path and an acquisition time difference about 28 minutes, a time period within the coherent time periods of ocean mesoscale features. This study demonstrates that a pair of ERS-2 and ENVISAT SAR images collected approximately 28 minutes apart over same locations can be jointly used in deriving ocean surface drift by the wavelet-based tracking method, and may help to identify oceanic processes such as currents and eddies. Also, this multi-sensor approach is expected to be useful in other applications on feature tracking for the combination of various satellite sensors with similar resolution. Since there are no in-situ measurements or drifter buoy data in this Philippines coast water, further validation and calibration are definitely warranted for future study.
The flow field and surface current in the Luzon Strait is quite strong and complex since many internal tide and nonlinear internal wave packets have been observed in SAR image [2,9] in SCS. Based on the satellite observations, most of internal waves in the northeast part of SCS are propagating westward [25,26]. The wave crest can be as long as 200 km with amplitude of 150 m, due to strong current from the Kuroshio branching out into SCS. These huge internal waves are probably generated from sills between many channels in the Luzon Strait due to branch out of the Kuroshio into SCS. Based on the SAR images collected near the west of Luzon Strait, multiple sources have been identified as the potential generation region [11]. These wave packets from different generation sources are then connected by “hand-in-hand” effect to form a long wave front rapidly and then propagate into the SCS deep basin. By tracking the wave activity, the surface drift pattern derived from satellites can be very useful to study the sources of internal wave generation in the Luzon Strait.
Acknowledgments
The authors would like to thank Wolfgang Lengert of ESRIN in ESA for his encouragement of this research, and Yunhe Zhao for his numerical support. The Reviewers’ comments are also highly appreciated. This work is supported by the U.S. Office of Naval Research (ONR) and Taiwan’s National Science Council (NSC). Both authors are Principal Investigators on ESA projects and all ERS-2 SAR and ENVISAT ASAR data are copyrighted by ESA.
References and Notes
- Liu, A.K.; Cavalieri, D.J. Sea-ice drift from wavelet analysis of DMSP SSM/I data. Int. J. Remote Sens. 1998, 19, 1415–1423. [Google Scholar] [CrossRef]
- Liu, A.K.; Zhao, Y.; Liu, W.T. Sea-ice motion derived from satellite agrees with buoy observations. Eos Trans AGU 1998, 79, 353–359. [Google Scholar] [CrossRef]
- Liu, A.K.; Zhao, Y.; Wu, S.Y. Arctic sea ice drift from wavelet analysis of NSCAT and special sensor microwave imager data. J. Geophys. Res. 1999, 104, 11529–11538. [Google Scholar] [CrossRef]
- Zhao, Y.; Liu, A.K.; Hsu, M.-K. Wave refraction observed from sequential satellite images. Int. J. Remote Sens. 2008, 29, 6381–6390. [Google Scholar] [CrossRef]
- Liu, A.K.; Wu, S.Y. Satellite remote sensing: SAR. Encyclopedia of Ocean Sciences; Steele, J.H., Thorpe, S.A., Turekian, K.K., Eds.; Academic Press: London, UK, 2001; Vol. 5, pp. 2563–2573. [Google Scholar]
- Hsu, M.-K.; Liu, A.K.; Zhao, Y.; Hotta, K. Satellite remote sensing of Spratly Islands using SAR. Int. J. Remote Sens. 2008, 29, 6427–6436. [Google Scholar] [CrossRef]
- Liu, A.K.; Hotta, K.; Hsu, M.-K. Satellite Remote Sensing of Spratly Islands; Tingmao Publish Co.: Taipei, Taiwan, 2007. [Google Scholar]
- Liu, A.K.; Chang, S.Y.; Hsu, M.-K.; Liang, N.K. Evolution of nonlinear internal waves in East and South China Seas. J. Geophys. Res. 1998, 103, 7995–8008. [Google Scholar] [CrossRef]
- Liu, A.K.; Ramp, S.R.; Zhao, Y.; Tang, T.Y. A case study of internal solitary waves during ASIAEX-2001. IEEE J. Ocean Eng. 2004, 29, 1144–1156. [Google Scholar] [CrossRef]
- Hsu, M.K.; Liu, A.K.; Liu, C. A study of internal waves in the China Seas and Yellow Sea using SAR. Continent. Shelf Res. 2000, 20, 389–410. [Google Scholar] [CrossRef]
- Liu, A.K.; Ho, C.-R.; Liu, C.-T. Satellite Remote Sensing of South China Sea; Tingmao Publish Co.: Taipei, Taiwan, 2008. [Google Scholar]
- Crocker, R.I.; Matthews, D.K.; Emery, W.J.; Baldwin, D.G. Computing coastal ocean surface currents from infrared and ocean color satellite imagery. IEEE Trans. Geosci. Remote Sens. 2007, 45, 435–447. [Google Scholar] [CrossRef]
- Du, Y.; Larouche, P.; Vachon, P.W. Multiscale feature tracking in sequential satellite images with wavelet analysis to measure sea surface currents in the Gulf of St. Lawrence. Can. J. Remote Sens. 2007, 33, 534–540. [Google Scholar] [CrossRef]
- Frasier, S.J.; Camps, A.J. Duel-beam interferometry for ocean surface current vector mapping. IEEE Trans. Geosci. Remote Sens. 2001, 39, 401–414. [Google Scholar] [CrossRef]
- Ruskai, M.B.; Beylkin, G.; Coifman, R.; Daubechies, I.; Mallat, S.; Meyer, Y.; Raphael, L. Wavelets and Their Applications; Jones and Bartlett Publishers: Boston, MA, USA, 1992. [Google Scholar]
- Liu, A.K.; Peng, C.Y.; Chang, S.Y.-S. Wavelet analysis of satellite images for coastal watch. IEEE J. Ocean. Eng. 1997, 22, 9–17. [Google Scholar] [CrossRef]
- Wu, S.Y.; Liu, A.K. Toward an automated ocean feature detection, extraction and classification algorithm for SAR imagery. Int. J. Remote Sens. 2003, 24, 935–951. [Google Scholar] [CrossRef]
- Liu, A.K.; Wu, S.Y.; Zhao, Y. Wavelet analysis of satellite images in ocean applications. In Frontiers of Remote Sensing Information Processing; Chen, C.H., Ed.; World Scientific: Singapore, 2003; Chapter 7; pp. 141–162. [Google Scholar]
- Zhao, Y.; Liu, A.K. Validation of sea ice motion from QuikSCAT with those from SSM/I and buoy. IEEE Trans. Geosci. Remote Sens. 2002, 40, 1241–1246. [Google Scholar] [CrossRef]
- Zhao, Y.; Liu, A.K. Arctic sea-ice motion and its relation to pressure field. J. Oceanograph. 2007, 63, 505–515. [Google Scholar] [CrossRef]
- Liu, A.K.; Zhao, Y.; Esaias, W.E.; Campbell, J.W.; Moore, T. Ocean surface layer drift revealed by satellite data. EOS Trans. AGU 2002, 83, 61–64. [Google Scholar] [CrossRef]
- Small, D.; Kosmann, D.; Holzner, J.; Raggam, H.; Pirri, M.; Schubert, A.; Kruettli, U.; Hummelbrunner, W.; Franke, M. ASAR level 1 geolocation. In ENVISAT Calibration Review; ESA-ESTEC, Noordwijk: The Netherlands, 2002. [Google Scholar]
- Chelton, D.B.; Freilich, M.H.; Sienkiewicz, J.M.; von Ahn, J.M. On the use of QuikSCAT scatterometer measurements of surface winds for marine weather prediction. AMS Month. Weather Rev. 2006, 134, 2055–2071. [Google Scholar] [CrossRef]
- Liu, A.K.; Peng, C.Y.; Chang, Y.-S. Mystery ship detected in SAR image. EOS Trans. AGU 1996, 77, 17–18. [Google Scholar] [CrossRef]
- Hsu, M.K.; Liu, A.K. Nonlinear internal waves in the South China Sea. Can. J. Remote Sens. 2000, 26, 72–81. [Google Scholar] [CrossRef]
- Liu, A.K.; Hsu, M.K. Internal wave study in the South China Sea using SAR. Int. J. Remote Sens. 2004, 25, 1261–1264. [Google Scholar] [CrossRef]
© 2009 by the authors; licensee Molecular Diversity Preservation International, Basel, Switzerland. This article is an open-access article distributed under the terms and conditions of the Creative Commons Attribution license (http://creativecommons.org/licenses/by/3.0/).
Share and Cite
MDPI and ACS Style
Liu, A.K.; Hsu, M.-K. Deriving Ocean Surface Drift Using Multiple SAR Sensors. Remote Sens. 2009, 1, 266-277. https://doi.org/10.3390/rs1030266
AMA Style
Liu AK, Hsu M-K. Deriving Ocean Surface Drift Using Multiple SAR Sensors. Remote Sensing. 2009; 1(3):266-277. https://doi.org/10.3390/rs1030266
Chicago/Turabian StyleLiu, Antony K., and Ming-Kuang Hsu. 2009. "Deriving Ocean Surface Drift Using Multiple SAR Sensors" Remote Sensing 1, no. 3: 266-277. https://doi.org/10.3390/rs1030266