Letter

Geo-Wiki.Org: The Use of Crowdsourcing to Improve Global Land Cover

by
Steffen Fritz
1,*,
Ian McCallum
1,
Christian Schill
2,
Christoph Perger
3,
Roland Grillmayer
3,
Frédéric Achard
4,
Florian Kraxner
1 and
Michael Obersteiner
1
1
Forestry Program, International Institute for Applied Systems Analysis, Laxenburg, Austria
2
Department of Remote Sensing and Landscape Information Systems (FeLis), University of Freiburg, Germany
3
University of Applied Sciences Wiener Neustadt for Business and Engineering Ltd., Wiener Neustadt, Austria
4
Institute for Environment and Sustainability, Joint Research Centre of the European Commission, Ispra, Italy
*
Author to whom correspondence should be addressed.
Remote Sens. 2009, 1(3), 345-354; https://doi.org/10.3390/rs1030345
Submission received: 7 July 2009 / Revised: 17 July 2009 / Accepted: 17 July 2009 / Published: 3 August 2009

Abstract

:
Global land cover is one of the essential terrestrial baseline datasets available for ecosystem modeling, however uncertainty remains an issue. Tools such as Google Earth offer enormous potential for land cover validation. With an ever increasing amount of very fine spatial resolution images (up to 50 cm × 50 cm) available on Google Earth, it is becoming possible for every Internet user (including non remote sensing experts) to distinguish land cover features with a high degree of reliability. Such an approach is inexpensive and allows Internet users from any region of the world to get involved in this global validation exercise. The Geo-Wiki Project is a global network of volunteers who wish to help improve the quality of global land cover maps. Since large differences occur between existing global land cover maps, current ecosystem and land-use science lacks crucial accurate data (e.g., to determine the potential of additional agricultural land available to grow crops in Africa), volunteers are asked to review hotspot maps of global land cover disagreement and determine, based on what they actually see in Google Earth and their local knowledge, if the land cover maps are correct or incorrect. Their input is recorded in a database, along with uploaded photos, to be used in the future for the creation of a new and improved hybrid global land cover map.

1. Introduction

Since the popularization of the Internet, the exchange of geographic information has increased exponentially [1] and an enormous resource of volunteered geographic information (VGI) [2] has become available. In particular, due to major advances in technology development along with the emergence of Web 2.0, it is now possible for ordinary citizens to build large datasets, reversing the traditional top-down flow of information. Such development is possible since virtually any information can be geoTagged [3,4].
There is a wide range of different terminology being used to describe the creation of geospatial user-created content. Terms such as crowdsourcing [5], collaboratively contributed geographic information [6], web based public participation geographic information system (GIS) [7], web mapping 2.0 [8], neogeography [9] and volunteered geographic information (VGI) [10] have been used. As outlined by Michael Goodchild, VGI refers explicitly to geospatial data that are voluntarily created by citizens who are untrained in the disciplines of geography, cartography or related fields [11]. This information is built though Citizen Science, which consists of networks of amateur observers who may be skilled and trained [4]. Moreover, the term VGI has been more strictly defined as F-VGI, facilitated VGI. F-VGI is distinguished from ordinary VGI since it requires a facilitator with a predefined set of criteria as part of a pre-established design process [11].Therefore the geospatial land cover validation project described in this paper can be described as F-VGI, since a predefined set of criteria has been used to guide land cover validation.
Current examples of volunteer geography range from applications which are open to all without the need to register, requiring little skill, e.g., wikimapia (wikimapia.org) or those currently still under development, like WikiTerra or Openstreetmap (http://www.openstreetmap.org/), to a narrower target group requiring specific training, qualification or skill – [e.g., the GLOBE program (http://www.globe.gov/), or Christmas bird counts (http://www.audubon.org/Bird/cbc/)], to more specific applications like www.mapaction.org or species occurrence mapping (http://www.geog.ubc.ca/biodiversity/VGI--VolunteerGeographicInformation.html, a very successful and well established site for biologists and people interested in biodiversity). Examples such as openstreetmap show the grassroots re-mapping activities and the promising potential which lies in volunteer contributions of geospatial created user content.
It is therefore somewhat surprising that up until now, the enormous resource of Google maps, Google Earth and Virtual Earth has (beyond simple spatial visualization) hardly been exploited – e.g., in land cover classification and validation. Such exercises are now feasible as images less than 2.5 meter resolution provide very detailed information on actual land cover with global coverage of at least 20% [12] with more high-resolution, up to date images continuously being added. It has been highlighted that internet tools such as Google Earth offer enormous potential for land cover validation [13]. The use of Volunteer Geographic Information for land cover validation studies seems even more relevant as Google Earth has been used for the recent validation of remote sensing derived products e.g., the European forest cover map [14] as well as the latest global land cover map GlobCover [15]. Since Google Earth has proven to be a very useful resource, it opens up the opportunity to harness a wider audience involved in an actual validation exercise. We therefore propose that, in particular, information from Google Earth can be exploited in a much more refined way than currently done and volunteers can be more precisely guided towards providing essential information needed on land cover.
A web-validation tool for land cover is particularly valuable as accurate and up to date information on global land cover plays a very important role in a number of different research fields such as climate change, monitoring of tropical deforestation, land use monitoring and modeling. However, since global land cover datasets still show quite a high degree of disagreement, it would be useful to involve a wider community to validate current global land cover datasets and to provide essential information which can help to improve current global land cover. In addition, this could enable the production of a hybrid land cover map [16] which combines information from a suit of global land cover maps and chooses (for each pixel) the most accurate map.

2. The Geospatial Land Cover Validation Project (Geo-wiki.org)

Based on the Google Earth platform, we have developed a geospatial Wikipedia (www.geo-wiki.org). The tool allows everybody in the world to contribute to spatial validation and is made available to the internet community interested in that task. With an ever increasing amount of very fine spatial resolution images available on Google Earth, it is becoming possible for every internet user (including non remote sensing experts) to distinguish land cover features with a high degree of reliability. Such an approach is inexpensive and allows internet users from any region of the world to get involved in this global validation exercise.

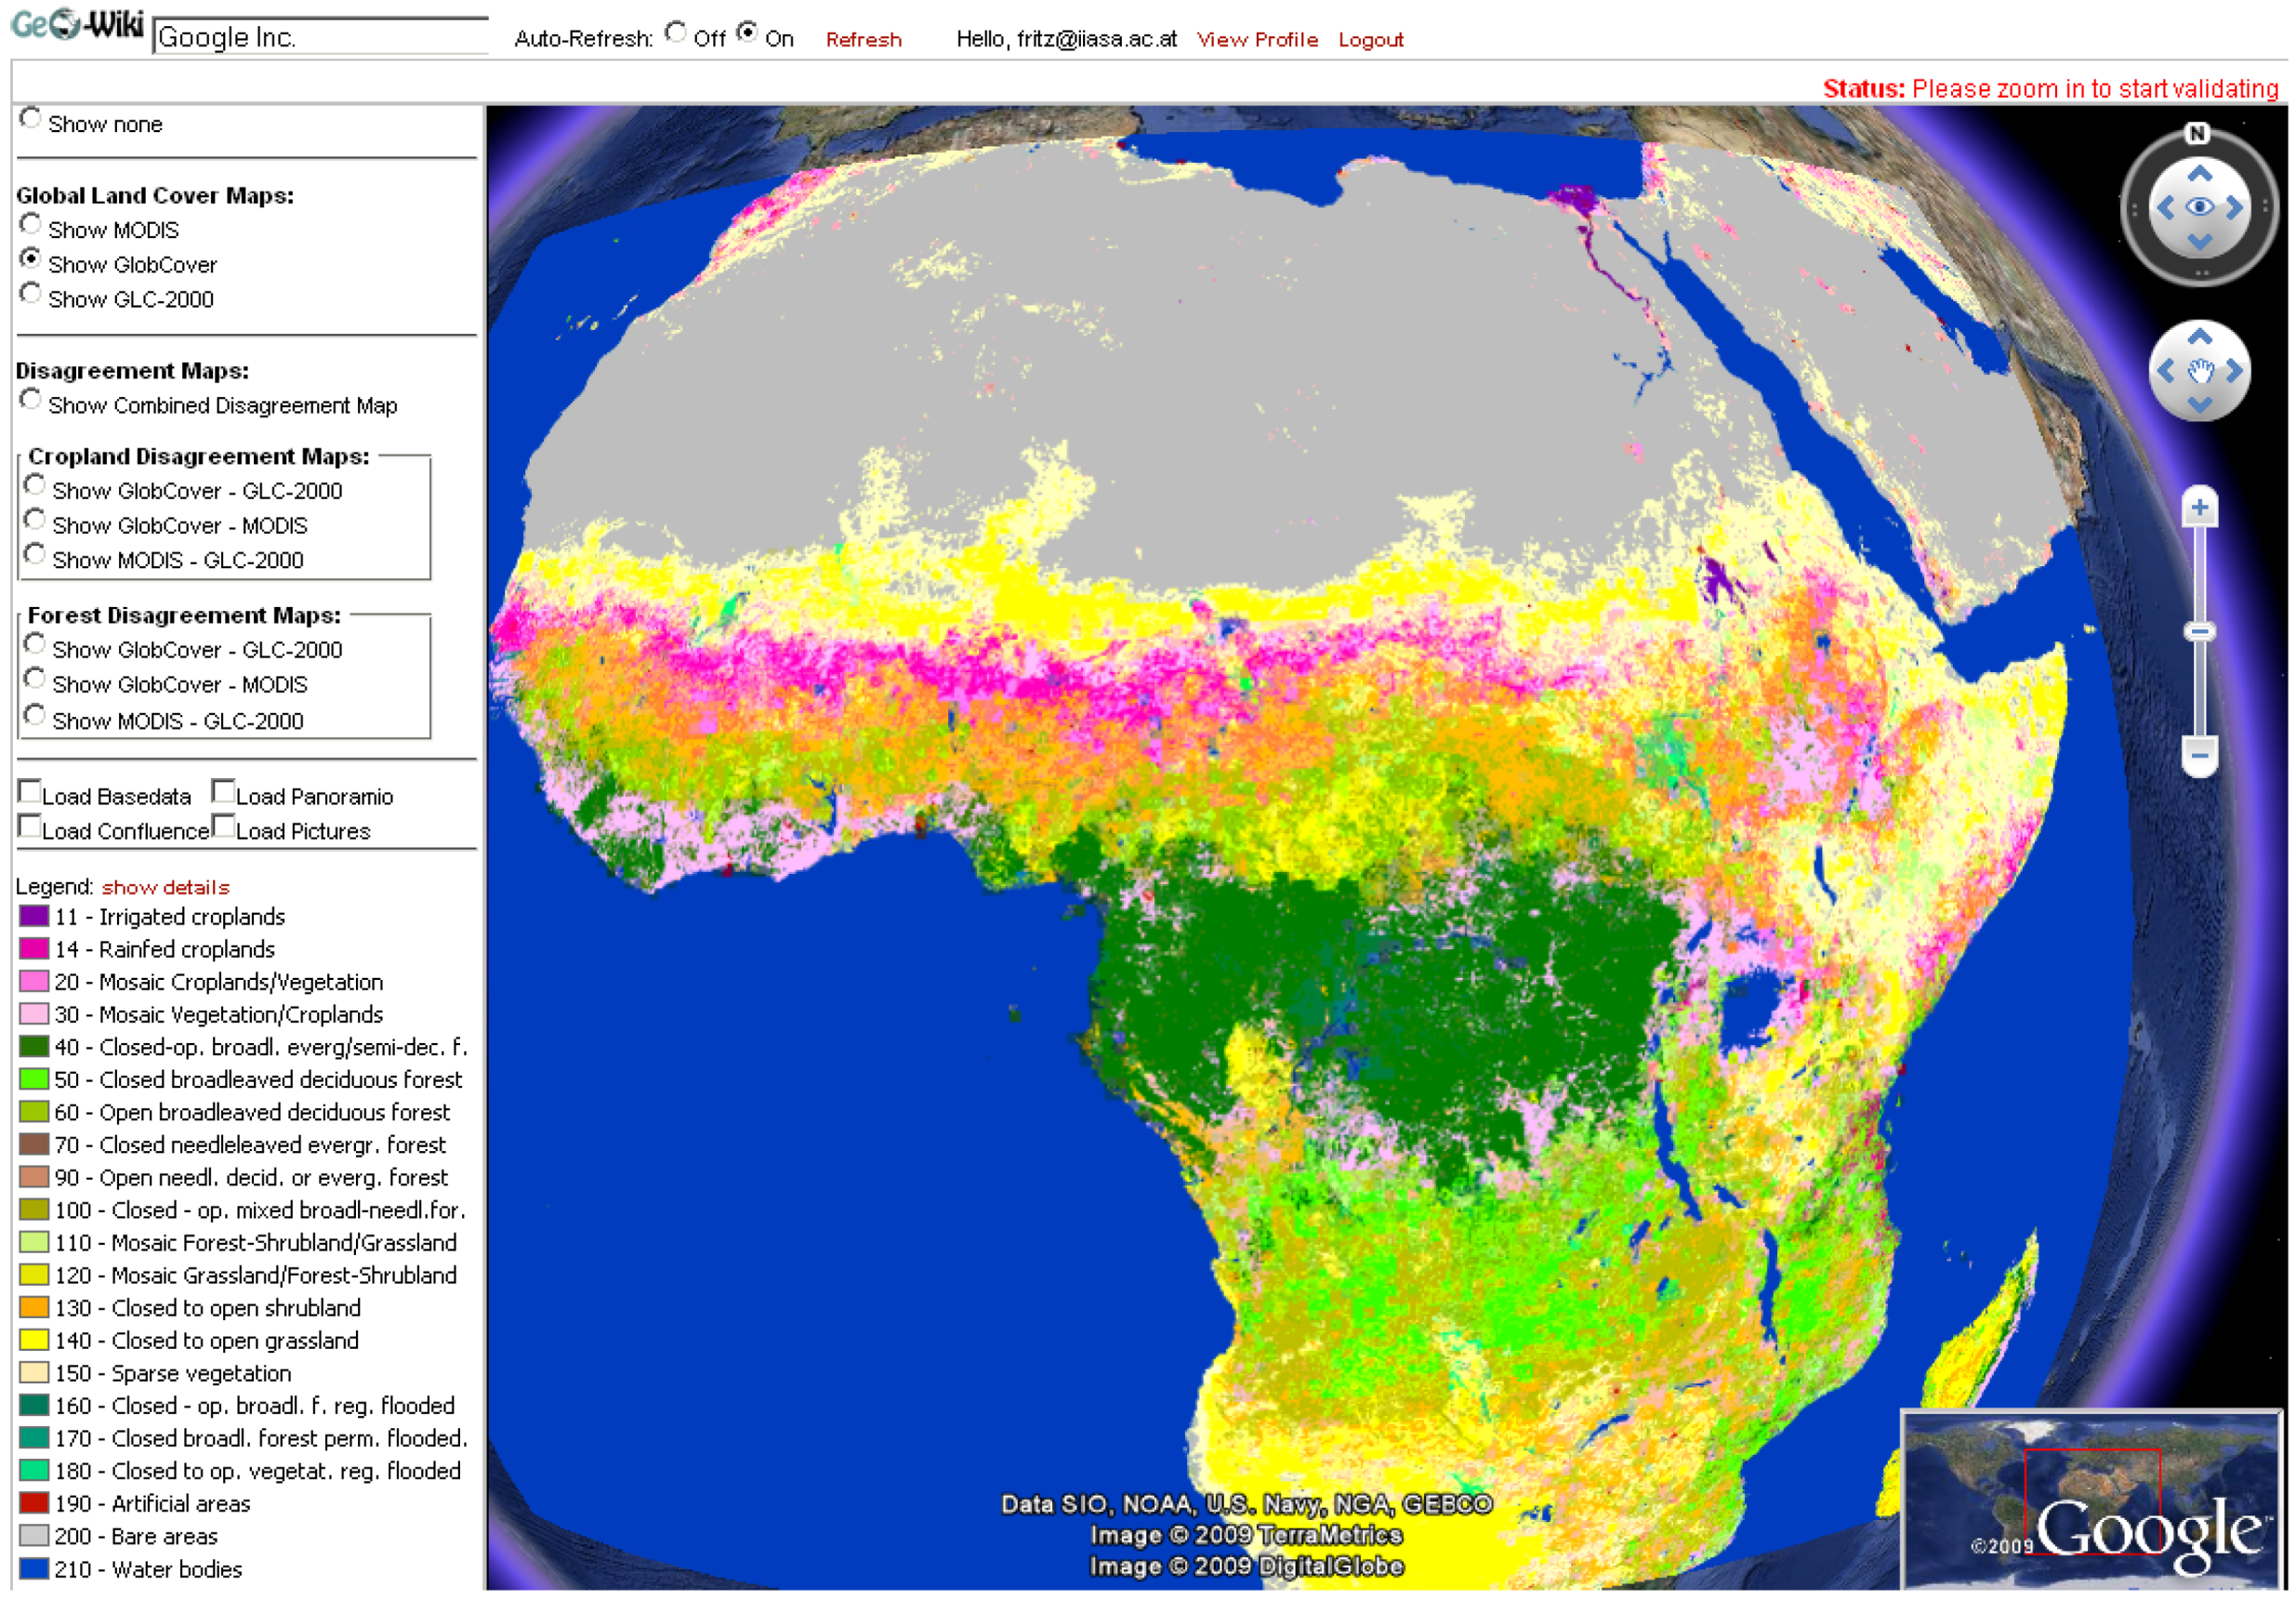
2.1. Visualizing Data

In order to facilitate validation, it is necessary to provide the land cover datasets via a Web Map Service (WMS). A WMS produces map images dynamically from georeferenced data. To access WMS operations, the parameters are submitted to the server using a standard web browser request. By clicking on the different radio buttons, you can visualize three different land cover (e.g., example of GlobCover over Africa shown in Figure 1 as well as the disagreement of datasets on Google Earth).
In the first set of options the three most recent global land cover products, “GLC-2000” [17], “MODIS” [18] and “GlobCover” [19] can be visualized. With this application it is possible to get to the original Pixel level information of these products and to zoom in as far as needed. When clicking on the box to visualize the selected dataset, the associated legend will automatically be provided. A link from the legend classes has been made to a more detailed definition of the legend classes.
Figure 1. Displaying the different land cover classes of GlobCover over Africa.
Remotesensing 01 00345 g001

2.2. Disagreement of Global Land Cover

These three global land cover products have a resolution (at the equator) of 1 km × 1 km for GLC-2000, 500 m × 500 m for MODIS and 300 m × 300 m for GlobCover. In order to be able to show hotspots of disagreement, the maps have been aggregated to a common resolution of 0.125 degrees. According to the definition of the legends using a conservative approach and the possibility that one legend class overlaps with two or more others, this disagreement was captured [20,21]. Disagreement was recorded for two key land cover classes, forests and cropland. Disagreement can be captured even if the legends do not exactly agree. This disagreement layer is the minimum measurable disagreement in the forest domain between the three land cover products as well as in the cropland domain (GLC-2000 versus GlobCover, MODIS versus GlobCover and MODIS versus GlobCover). The map identifying combined disagreement shows the overall disagreement between all the disagreement maps (see Figure 2A). The overall disagreement was derived by summing together the percent disagreement within all the disagreement maps in the cropland as well as in the forest domain. Thresholds used are (i) from 5% to 40% for ‘disagreement’ and (ii) more than 40% for ‘high disagreement’. The different classes are shown in Figure 2A. Cropland disagreement is displayed in yellow tones, forest disagreement in blue tones and both cropland and forest disagreement in orange/red tones. Moreover percent disagreement between pairs of land cover maps (MODIS-GLC-2000, MODIS-GlobCover, GlobCover – GLC-2000) can be visualised in the forest as well as the cropland domain. All results produced here can be explored at geo-wiki.org.
Figure 2. (A) The geo-wiki.org – volunteers have the ability to view both cropland and forest disagreement maps derived from three recent global land cover datasets GLC-2000, MODIS and GlobCover, (B) select and visualize with the help of Google Earth available high resolution images as well as upload or view geo-tagged field pictures (e.g., from Panoramio.com, Confluence.org), and (C) determine which land cover type is found on the ground and decide which dataset is correct, incorrect or if the validater is not sure. Results are recorded in a spatial database.
Remotesensing 01 00345 g002

2.3. Visualizing Baseline Data, Confluence Points and Panoramio

We have also enabled the functionality to display Google Earth planimetric data to be overlaid, including national and sub-national borders, towns and roads.
The field pictures available from the Panoramio web site (see the example in Figure 2B) provide valuable information on how the landscape actually looks on the ground and what type of land cover is found on the ground. At the same time this information has to be used with care as currently there is no indication of the date when the field picture has been taken.
Another option for visualization includes the Degrees Confluence Project (DCP) www.confluence.org, which was launched in 1996. Even though the volunteer participation in this project was quite slow, it has gained momentum in recent years. The DCP is a volunteer-based project that aims to collect onsite information from all latitude-longitude one degree intersections. Visitors to each of these confluences take photographs and write about their journey to the confluence point as well as describe the landscape of the confluence point. The project has involved people all over the world who have voluntarily contributed. It has been shown that the photographs and description of the confluence points can be a valuable resource for land cover validation exercises and accuracy assessments. Recently an accuracy assessment based on the confluence project has been carried out for the GLC-2000 and MODIS maps and for two older global land cover products: the Global land cover of the University of Maryland (UMD) and the Global land cover characteristics database (GLCCD) [22].

2.4. Validation of Global Land Cover Maps

As outlined earlier the particular strength of geo-wiki.org is the possibility for volunteers to validate land cover. It is recommended that unless they have local knowledge, they choose areas that are covered with high resolution images (< 20 m × 20 m). As the user begins to zoom in closer to an area of interest, the status will change from red (Status: please zoom to start validating) to green (Status: validation possible, ALT+ left mouse for pixel-or Ctrl + left mouse button for area validation). When the validation is initiated, the validation tool expands (see Figure 2C). The land cover classes of the three datasets are queried from the database using AJAX-technology (techniques to create interactive web applications).

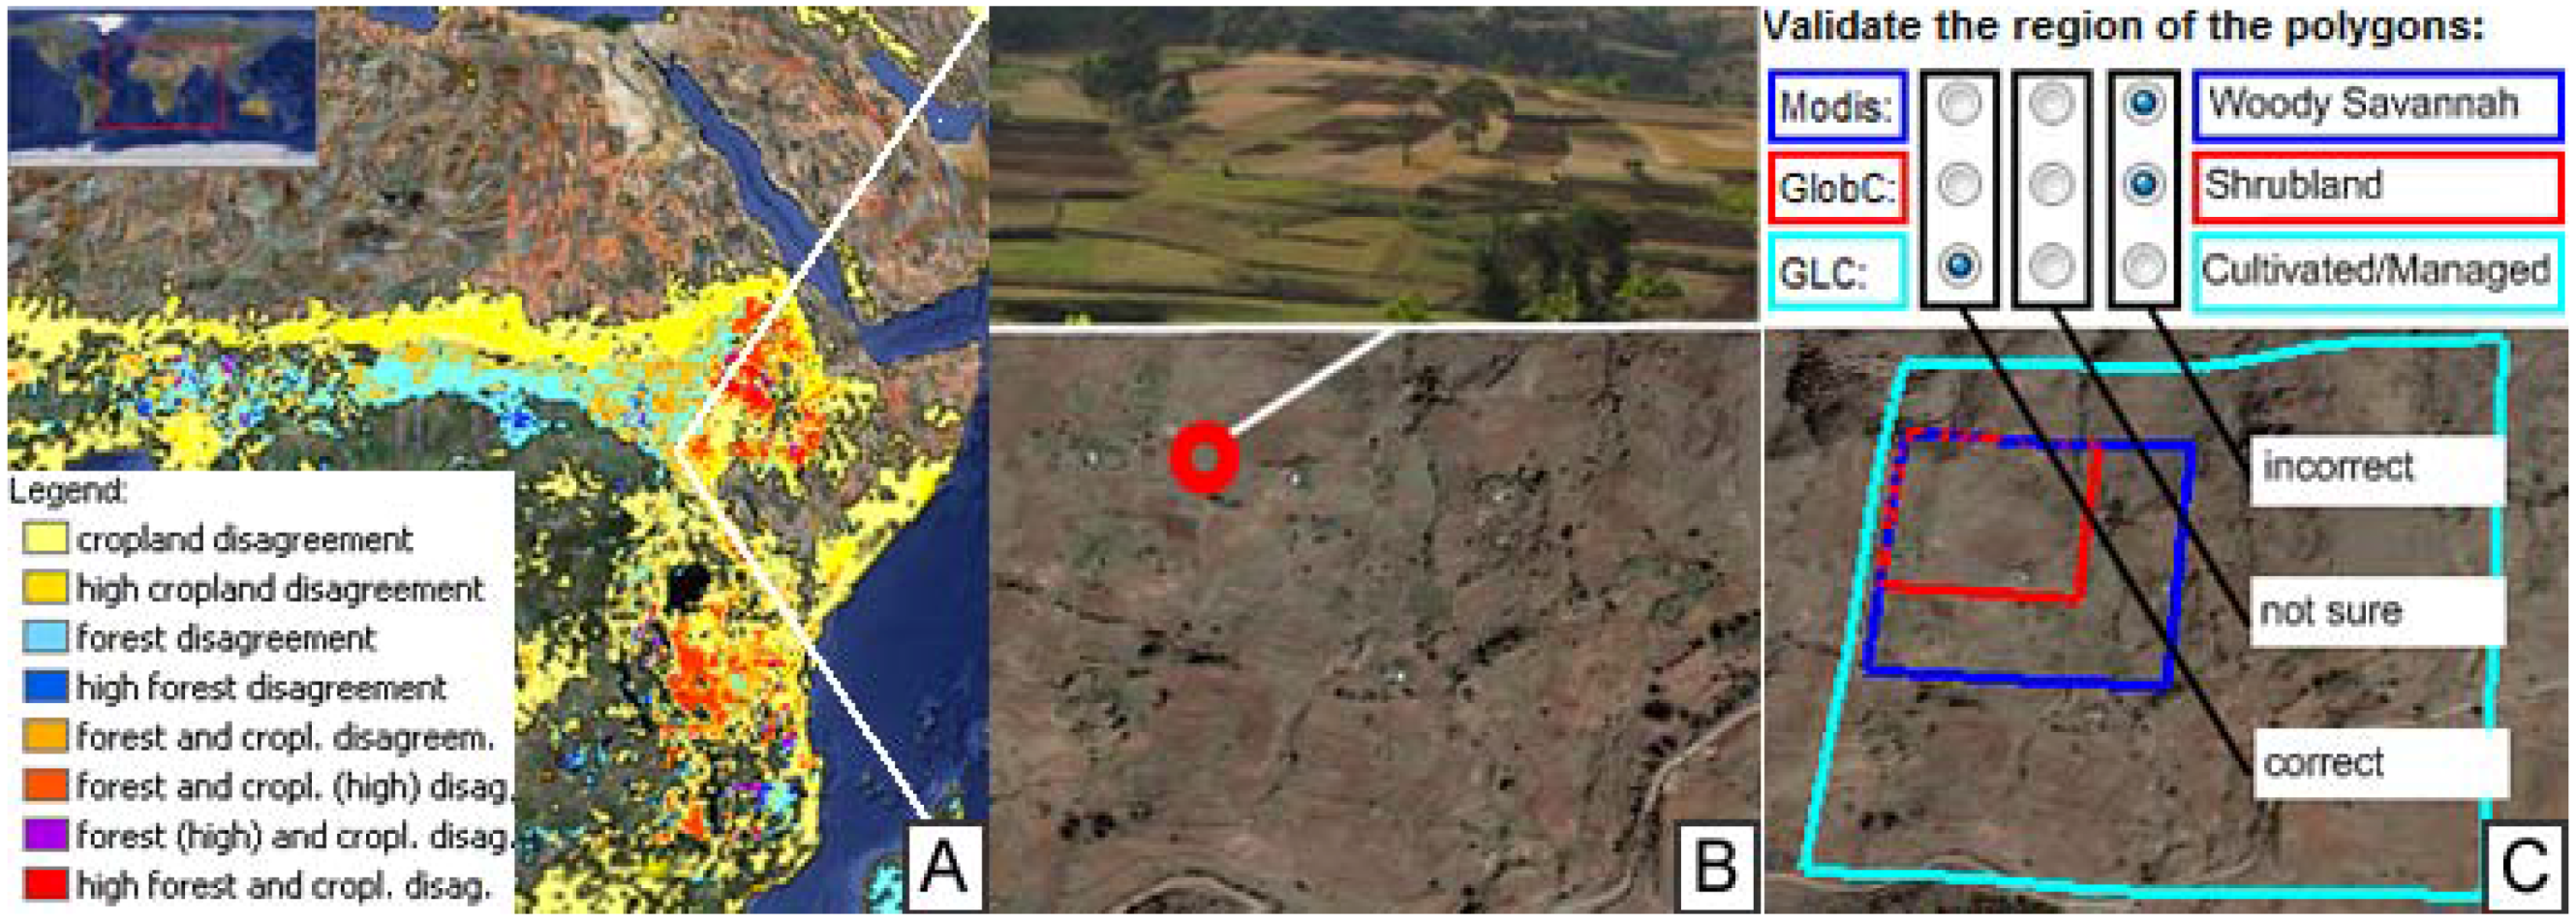
2.5. Pixel Validation

The user presses and holds the ALT-key and clicks on the desired location to validate the land cover pixel where the click location lies. These pixels are displayed in the Google Earth Plug-in. Due to the different resolution of the source land cover datasets, the displayed rectangles are not congruent (see Figure 2C). On the panel located on the right, you will see three validation options: correct, not sure, or incorrect. The pixel outline colours overlayed on Google Eerth match the colours of the classes displayed within the validation menu. Both the name of the datasets (in the left column) and the assigned classes (in the right column) use the same outline colour.

2.6. Area Validation

To start the area validation, the user has to press and hold the Ctrl-key and click in the map to define the first corner of the area. This corner is visualized the same way as the pixel validation (see 2.5). With the second click, the opposite corner of the rectangular validation area is defined, then the extent of the area which the user is going to validate is displayed. In case the land classification of an area for a specific land cover dataset contains more than one different land cover class, the query will reply with the term “heterogeneous block” and the validation for this dataset will not be permitted.

2.7. Supporting Picture Validation

The use of the confluence points (www.confluence.org) for land cover validation [22] has demonstrated that pictures are a very valuable resource for validation activities related to land cover. We have therefore implemented the option for each validation which is undertaken for the three different land cover products to be complemented by pictures. Ideally, these pictures should follow the concept of the confluence project and be taken in all four cardinal directions: north, south, east and west. However, in case this information is not available, but pictures at a specific place are available and geoTagged, they can still be linked to the specific validation squares and the date when the picture was taken can be inserted.

3. Discussion and Conclusions

Traditional approaches of validating and calibrating global land cover have relied mainly on high/medium resolution satellite images such as Landsat TM at 30 m × 30 m in combination with a validation sample using a confusion or error matrix [23,24,25]. With the advent of Google Earth, very high resolution images (< 2.5 meters) are becoming increasingly available and can be visualized free of charge, allowing for the participation of volunteer geographers to participate in the validation as well as classification process of satellite derived products. The traditional approaches of accuracy assessment of land cover are still valid and necessary, but can be complemented by validation exercises by F-VGI. The described tool has shown how global land cover products can be validated and demonstrated the potential for validation of other remotely sensed derived land cover products at the regional or national levels and possibly even local level.
Despite the enormous potential of Google Earth, two main challenges remain. The first challenge is to attract a wide range of volunteers from all over the world such as university students, school children or ordinary citizens who like to get involved in land cover activities. By disseminating educational material and tools outside the scientific community, it could be demonstrated how a wider community could get involved in land cover validation exercises. Competitive games such as those used for most computer games could be implemented to make the challenge of land cover validation more attractive. In terms of possible further low cost outreach facilities, one option would be to use social networks and using existing groups which have been set up – in particular those which include people who have some type of experience in geography, visual image analysis and mapping. For example, Facebook provides an API to build their community features into other web applications just by installing a client library. Facebooks’ login can then easily be integrated into the web application. Imagine the potential if the existing community of internet users and internet game players in particular gets involved in land cover validation exercises and becomes true experts in recognising certain land cover features – becoming useful land spotters.
The second challenge is to be able to guarantee a certain quality and to make sure that the tool is not misused. As discussed by a number of authors, the question of credibility of those public voluntary contributions is crucial. It can be assumed that if the application is designed in a similar way as Wikipedia and entries are to some extent monitored by volunteers and are open to giving additional information by anyone who disagrees with them [10] – the application can become truly successful. In 2005, a special investigation by nature magazine on the use of peer review to compare Wikipedia and Britannica, showed that the difference of accuracy between the two was not great [26] – highlighting the enormous potential Wikipedia type of applications using the internet could have (until recently an untapped resource).
Moreover, there are a number of improvements which can be made to the current web application of Geo-wiki. Currently the tool only allows to judge if the three land cover types provided within a box (corresponding to the three land cover maps visualised on screen) are correct, incorrect or if the validater is not sure. However, in the future it will be possible to select the correct land cover type from a consistent global land cover legend in case the land cover pixel has been identified to be incorrectly labelled. Moreover, depending on the number of validations, it will be necessary to keep track of validations which are based on older images in case new or more up to date images or photos have been added. In this context it is envisaged to extend the current tool to also map land cover change using the latest Google Earth 5.0 beta version, which includes the possibility to display historical time series of images.
Besides of these improvements, geo-wiki could be used in more ways than proposed in this paper. In particular, such a tool can be further developed to suit applications related to forest cover monitoring such as the Remote Sensing Survey (RSS) of the FAO Global Forest Resources Assessment 2010 (FRA 2010) (www.fao.org/forestry/fra2010-remotesensing). The main component of FRA 2010 relies on the collection and compilation of country information through questionnaires, derived from national forest inventory data. The Remote Sensing Survey is a complementary exercise based on the use of Landsat-type satellite imagery with a systematic sampling design on each longitude and latitude intersection. The assessment will have about 13,500 samples over the whole land surface of the Earth, of which about 9,000 samples lie outside deserts for the three dates (1990, 2000 and 2005/2006) [27]. The geo-wiki tool could be used to build confidence of the results of the Remote Sensing Survey and to provide extended validation material for further development of the global survey (e.g., adding year 2010 to the survey) or for intensification at the national level [28].
Furthermore the tool could be modified and adjusted to be used to map indigenous people’s territories and to locate illegal logging activities. For example, a web-tool can be created similar to the Geo-wiki application, so that local people as well as NGOs and international organizations can upload all the existing data on indigenous peoples’ rights and territories which have been publically documented. Within that context, an alert system could be established which can be used to localize and document abusive deforestation or illegal logging activities on a local scale. It will be possible with the application that potential violation of property rights – in particular of indigenous people, is highlighted. This will be in the form of an online alert system to show openly and in near real time on the Web, at which locations deforestation or logging activities are taking place.
There are a number of other issues which need to be addressed, most importantly system maintenance. IIASA is committed in the next years to maintain geo-wiki.org and has secured sufficient financial resources to do so. Information collected through this tool is continuously recorded in a publicly available spatial database. This application complements previous validation exercises of these products and current efforts of the Earth Observation community to develop an improved global land cover validation database. More importantly, it is intended to lead to a hybrid consolidated land cover map, by combining different maps through a geo-statistical method, incorporating the additional land cover information retrieved by the geo-wiki tool.

Acknowledgements

The research leading to these results has received funding from the European Community’s Sixth and Seventh Framework Programme (FP6/FP7) under grant agreement n° 037063 (GOCE), Global Earth Observation – Benefit Estimation: Now, Next and Emerging (GEOBENE) and EuroGEOSS. Furthermore we would like to thank Anssi Pekkarinen for his advice and help. Thanks also to Damien Sulla-Menashe for providing the MODIS 500m-V.5-2005 product.

References and Notes

  1. Goodchild, M.F.; Fu, P.; Rich, P. Sharing geographic information: an assessment of the geospatial one-stop. Ann. Assn. Amer. Geogr. 2007, 97, 250–266. [Google Scholar] [CrossRef]
  2. Flanagin, A.J.; Metzger, M.J. The credibility of volunteered geographic information. GeoJournal 2008, 72, 137–148. [Google Scholar] [CrossRef]
  3. Sui, D.Z. The wikification of GIS and its consequences: or Angelina Jolie’s new tattoo and the future of GIS. Comp. Env. Urb. Sys. 2008, 32, 1–5. [Google Scholar] [CrossRef]
  4. Goodchild, M.F. Citizens as sensors: The world of volunteered geography. GeoJournal 2007, 69, 211–221. [Google Scholar] [CrossRef]
  5. Hudson-Smith, A.; Batty, M.; Crooks, A.; Milton, R. Mapping for the masses: accessing web 2.0 through crowdsourcing. Soc. Sci. Comput. Rev. 2009. [Google Scholar] [CrossRef]
  6. Bishr, M.; Mantelas, L. A trust and reputation model for filtering and classifying knowledge about urban growth. GeoJournal 2008, 72, 229–237. [Google Scholar] [CrossRef]
  7. Carver, S.; Evans, A.; Kingston, R.; Turton, I. Public participation, GIS, and cyberdemocracy: evaluating on-line spatial decision support systems. Environ. Plan. B-Plan. Design 2001, 28, 907–921. [Google Scholar] [CrossRef]
  8. Haklay, M.; Singleton, A.; Parker, C. Web mapping 2.0: the neogeography of the GeoWeb. Geogr. Compass 2008, 2, 2011–2039. [Google Scholar] [CrossRef]
  9. Walsh, J. The beginning and end of neogeography. GEO: connexion 2008, 7, 28–30. [Google Scholar]
  10. Goodchild, M.F. Commentary: whither VGI? GeoJournal 2008, 72, 239–244. [Google Scholar] [CrossRef]
  11. Seeger, C.J. The role of facilitated volunteered geographic information in the landscape planning and site design process. GeoJournal 2008, 72, 199–213. [Google Scholar] [CrossRef]
  12. Potere, D. Horizontal positional accuracy of google earth’s high-resolution imagery archive. Sensors 2008, 8, 7973–7981. [Google Scholar] [CrossRef]
  13. Butler, D. The web-wide world. Nature 2006, 439, 776–778. [Google Scholar] [CrossRef] [PubMed]
  14. Pekkarinen, A.; Reithmaier, L.; Strobl, P. Pan-European forest/non-forest mapping with Landsat ETM+ and CORINE Land Cover 2000 data. ISPRS J. Photogramm. 2009, 64, 171–183. [Google Scholar] [CrossRef]
  15. Defourny, P.P.; Schouten, L.; Bartalev, S.; Bontemps, S.P.; Caccetta, P.; de Wit, A.J. W.P.; Di Bella, C.P.; Gérard, B.P.; Giri, C.P.; Gond, V.P.; Hazeu, G.W.P.; Heinimann, A.P.; Herold, M.P.; Knoops, J.P.; Jaffrain, G.P.; Latifovic, R.P.; Lin, H.P.; Mayaux, P.P.; Mücher, C.A.P.; Nonguierma, A.P.; Stibig, H.P.; Van Bogaert, E.P.; Vancutsem, C.P.; Bicheron, P.P.; Leroy, M.P.; Arino, O.P. Accuracy Assessment of a 300 m Global Land Cover Map: The GlobCover Experience. 2009. Available online: http://dup.esrin.esa.it/files/project/131-176-149-30_2009512134035.pdf (accessed on 30 June 2009).
  16. See, L.M.; Fritz, S. A method to compare and improve land cover datasets: application to the GLC-2000 and MODIS land cover products. IEEE Trans. Geosci. Remot. Sen. 2006, 44, 1740–1746. [Google Scholar] [CrossRef]
  17. Bartholomé, E.; Belward, A.S. GLC2000: a new approach to global land cover mapping from earth observation data. Int. J. Remote. Sens. 2005, 26, 1959–1977. [Google Scholar] [CrossRef]
  18. Friedl, M.A.; McIver, D.K.; Hodges, J.C.F.; Zhang, X.Y.; Muchoney, D.; Strahler, A.H.; Woodcock, C.E.; Gopal, S.; Schneider, A.; Cooper, A.; Baccini, A.; Gao, F.; Schaaf, C. Global land cover mapping from MODIS: algorithms and early results. Remote. Sens. Environ. 2002, 83, 287–302. [Google Scholar] [CrossRef]
  19. Arino, O.; Bicheron, P.; Achard, F.; Latham, J.; Witt, R.; Weber, J.L. The most detailed portrait of Earth. Available online: http://www.esa.int/esapub/bulletin/bulletin136/bul136d_arino.pdf (accessed on 30 June 2009).
  20. McCallum, I.; Obersteiner, M.; Nilsson, S.; Shvidenko, A. A spatial comparison of four satellite derived 1 km global land cover datasets. Int. J. Applearth. Obs. Geonif. 2006, 8, 246–255. [Google Scholar] [CrossRef]
  21. Fritz, S.; See, L. Identifying and quantifying uncertainty and spatial disagreement in the comparison of Global Land Cover for different applications. Global Change Biolo. 2008, 14, 1057–1075. [Google Scholar] [CrossRef]
  22. Iwao, K.; Nishida, K.; Kinoshita, T.; Yamagata, Y. Validating land cover maps with Degree Confluence Project information. Geophys. Res. Lett. 2006, 33, L23404. [Google Scholar] [CrossRef]
  23. Eva, H.D.; Belward, A.S.; De Miranda, E.E.; Di Bella, C.M.; Gond, V.; Huber, O.; Jones, S.; Sgrenzaroli, M.; Fritz, S. A land cover map of South America. Glob. Change Biol. 2004, 10, 731–744. [Google Scholar] [CrossRef]
  24. Mayaux, P.; Bartholomé, E.; Fritz, S.; Belward, A. A new land-cover map of Africa for the year 2000. J. Biogeogr. 2004, 31, 861–877. [Google Scholar] [CrossRef]
  25. Mayaux, P.; Eva, H.; Gallego, J.; Strahler, A.H.; Herold, M.; Agrawal, S.; Naumov, S.; De Miranda, E.E.; Di Bella, C.M.; Ordoyne, C.; Kopin, Y.; Roy, P.S. Validation of the global land cover 2000 map. IEEE Trans. Geosci. Remot. Sen. 2006, 44, 1728–1737. [Google Scholar] [CrossRef]
  26. Giles, J. Wikipedia rival calls in the experts. Nature. 2006, 443, 493. [Google Scholar] [CrossRef] [PubMed]
  27. Ridder, R. Options and recommendations for a global remote sensing survey of forests. Forest Resources Assessment; Food and Agriculture Organization of the United Nations: Rome, Italy, 2007. [Google Scholar]
  28. Eva, H.D.; Carboni, S.; Achard, F.; Stach, N.; Durieux, L.; Faure, J.-F.; Mollicone, D. Monitoring forest areas from continental to territorial levels using a sample of medium spatial resolution satellite imagery. ISPRS International Journal of Photogrammetry & Remote Sensing. (in press)

