1. Introduction
This paper presents a Ship Monitoring System (SIMONS) that combines the information inferred from Synthetic Aperture Radar (SAR) data [
1] with transponder-based polls [such as the Automatic Identification System (AIS) from the International Maritime Organization (IMO) [
2]]. In contrast to other monitoring approaches, SAR images are the main channel whereas AIS reports are the complementary one. SIMONS has been developed in the framework of the MARISS project [
3]. This project is part of the series of projects (IMPAST, LIMES,…) promoted by the European Commission (EC) to develop efficient and reliable ship monitoring. The main goal is to provide authorities with a system that controls all the activities of ships and permits them to verify law compliance. Other benefits would be to protect the ecosystem, to provide surveillance along the transportation corridors, to monitor illegal immigration and to assure sustainable economic development.
The first operational services were developed in the early nineties and rely on the usage of active on-board transponders. There, GPS-based receivers provide real-time ship status to monitoring centers via satellite communications. Such systems have proven to be very accurate for supporting decision making but present an intrinsic limitation, which is related to the transponder itself. Certainly, ships are located if these devices are active, in such a way that any (accidental or intended) malfunction prevents the system from tracking them. Such lack of independence is not desirable for a service intended to support law enforcement. More reliable solutions should be developed and SAR can be essential in this situation.
SAR is a microwave coherent remote sensing technology able to provide 2D reflectivity images of large scenes with fine resolutions and 24-hour all-weather sensing capability. It overcomes the lack of independence of transponders, but needs image analysis and post-processing techniques to infer all the required information. This implies the usage of models and parametric solutions that are affected by limiting factors. The most important ones are image resolution, speckle noise and image distortions due to the dynamic environment [
1], which add uncertainty to the final reports. Currently, SAR has been partially exploited in the field of ship monitoring, tackling minor issues such as the detection of large ships. No information regarding ships categories, coastline detection, the detection of small ships and the confidence on the detected spots is availabel yet under an operational basis.
The monitoring system presented in this paper tries to overcome all of these limitations so that the gap in ship monitoring could be filled. It uses a state-of-the-art SAR Ship Detection and Classification Algorithm (SIDECAR), jointly with an advanced web interface to disseminate the results. The main goals are to drop the dependence on transponders, to provide a friendly and secure environment, to infer a reliable and complete set of information layers and to design a set of tools to support decision making. Recent feedback with users has confirmed that all of these goals have been achieved.
In this manuscript, the main elements of SIMONS are described, jointly with some processing examples applied to ENVISAT and ERS data. Cross-check of the results with ground-truth AIS-polls is also included to show ship detection and classification performance. Note, however, that the paper does not cover the inherent problem of SAR related to the sparseness of the overpasses. It is assumed that SIMONS is embedded in a monitoring service where this issue is solved. In real applications, a proper solution could rely on a multi-sensor approach or an always-on station airborne SAR.
2. System Overview
SIMONS has been programmed with independent modules according to the task to develop.
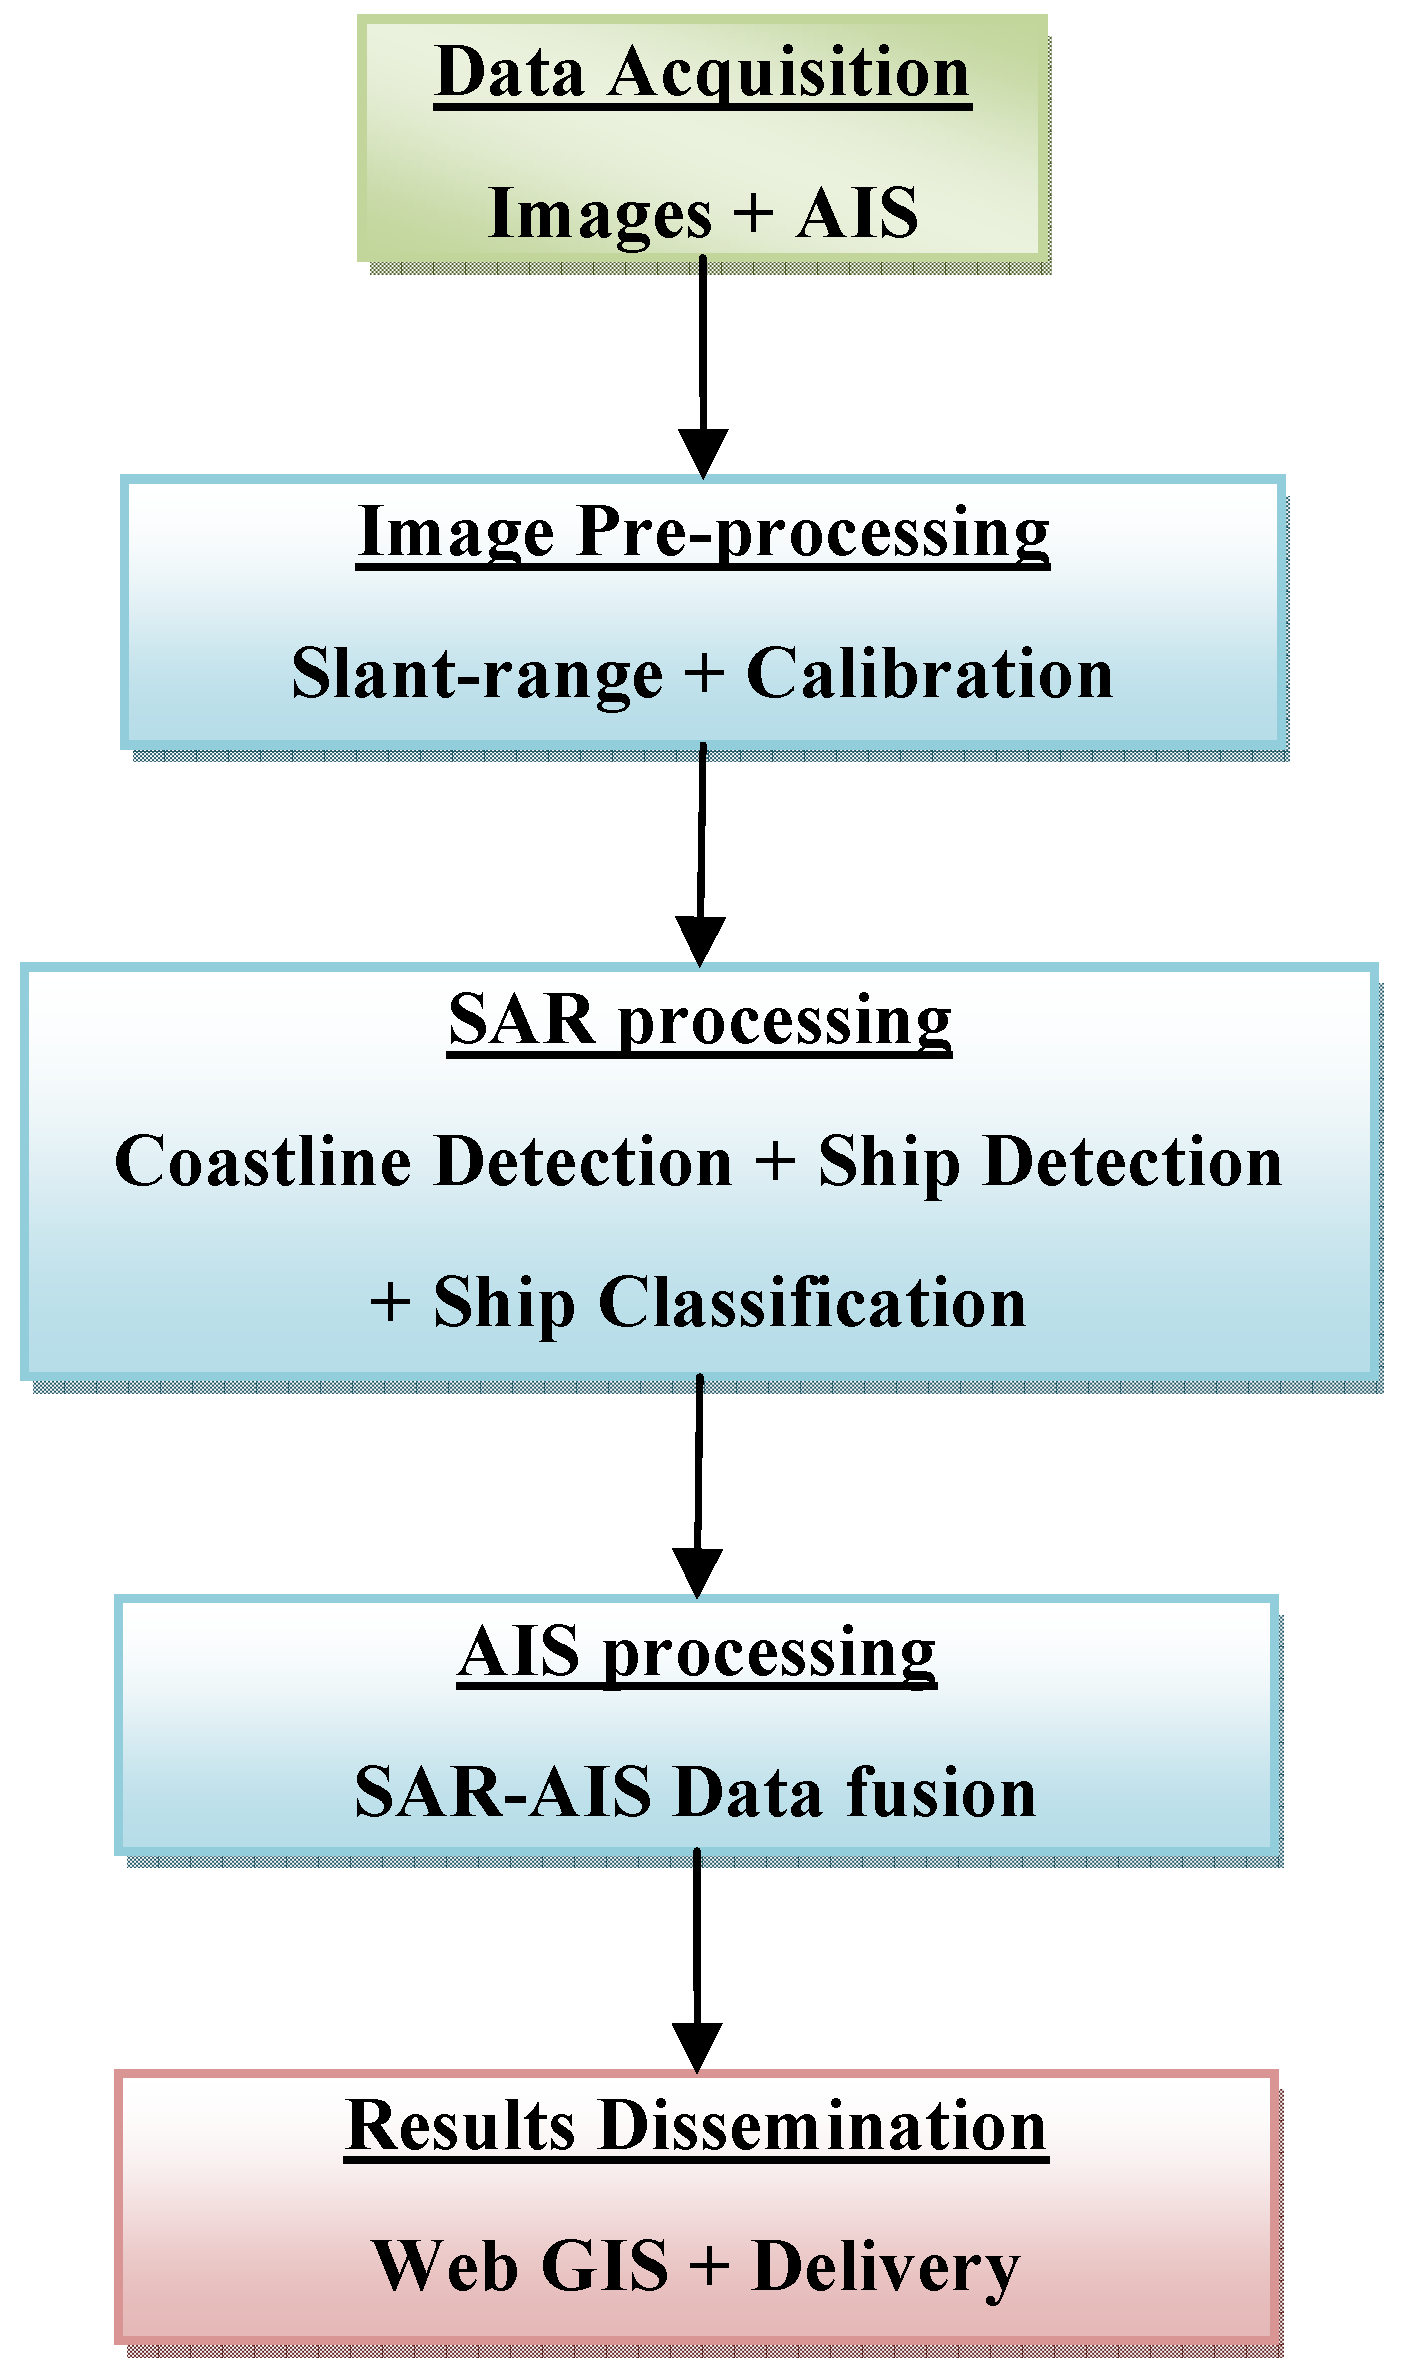
Figure 1 presents a summary of the main blocks gathered in three basic stages, namely:
Data acquisition. This stage regards data input ingestion, both from SAR satellite images and transponder polls (mainly AIS). Data acquisition is automatically done via dedicated FTP links each time new datasets are availabel. Three types of streams are adopted, namely:
- ○
SAR images from different sensors with meta-data extraction. Accepted formats are ENVISAT .N1, and ERS .JP2 and .E2. New formats, such as TerraSAR-X and ALOS-PALSAR, will be included in a near future.
- ○
Satellite AIS streams obtained via communication satellite links.
- ○
Coastal AIS streams acquired via coastal on-ground stations.
Data Processing. Three main tasks are defined, namely:
- ○
Pre-processing that erases undesired image aberrations that can affect the final performance of the system. Main efforts are focused to compensate the slant-range dependent reflectivity pattern and to calibrate the images, if not done so.
- ○
SAR processing that isolates all the information needed from SAR images. This task uses the three CD, SD and SC modules. The first module (CD) isolates the coastline with an algorithm that evaluates the gradient variances of the reflectivity information. It is supported by external shape files when necessary. The second module (SD) detects the ships with a multi-scale approach involving wavelets. This allows the enhancement of those spots having a specific reflectivity and morphological pattern. To avoid confusion with ship-like features and reduce false alarms, a confidence parameter is defined from the wavelet processing parameters. Finally, the third module (SC) analyzes the distribution of the reflectivity values along the SAR ship signature to make ship categorization via fuzzy logic.
- ○
AIS’ processing that correlates ship detection reports with AIS polls. The slant-range projection and the azimuth shifts caused by targets in motion are taken into account.
Result Dissemination. This stage delivers final products to users via an advanced and user-friendly web interface. It works on a common Geographic Information System (GIS) platform with OpenSource standards that are compliant with OGC. Different layers of information can be managed, such as GeoTIFF reflectivity images, detected coastline, ships data (location, bearing, category and dimensions) and the confidence of each ship report.
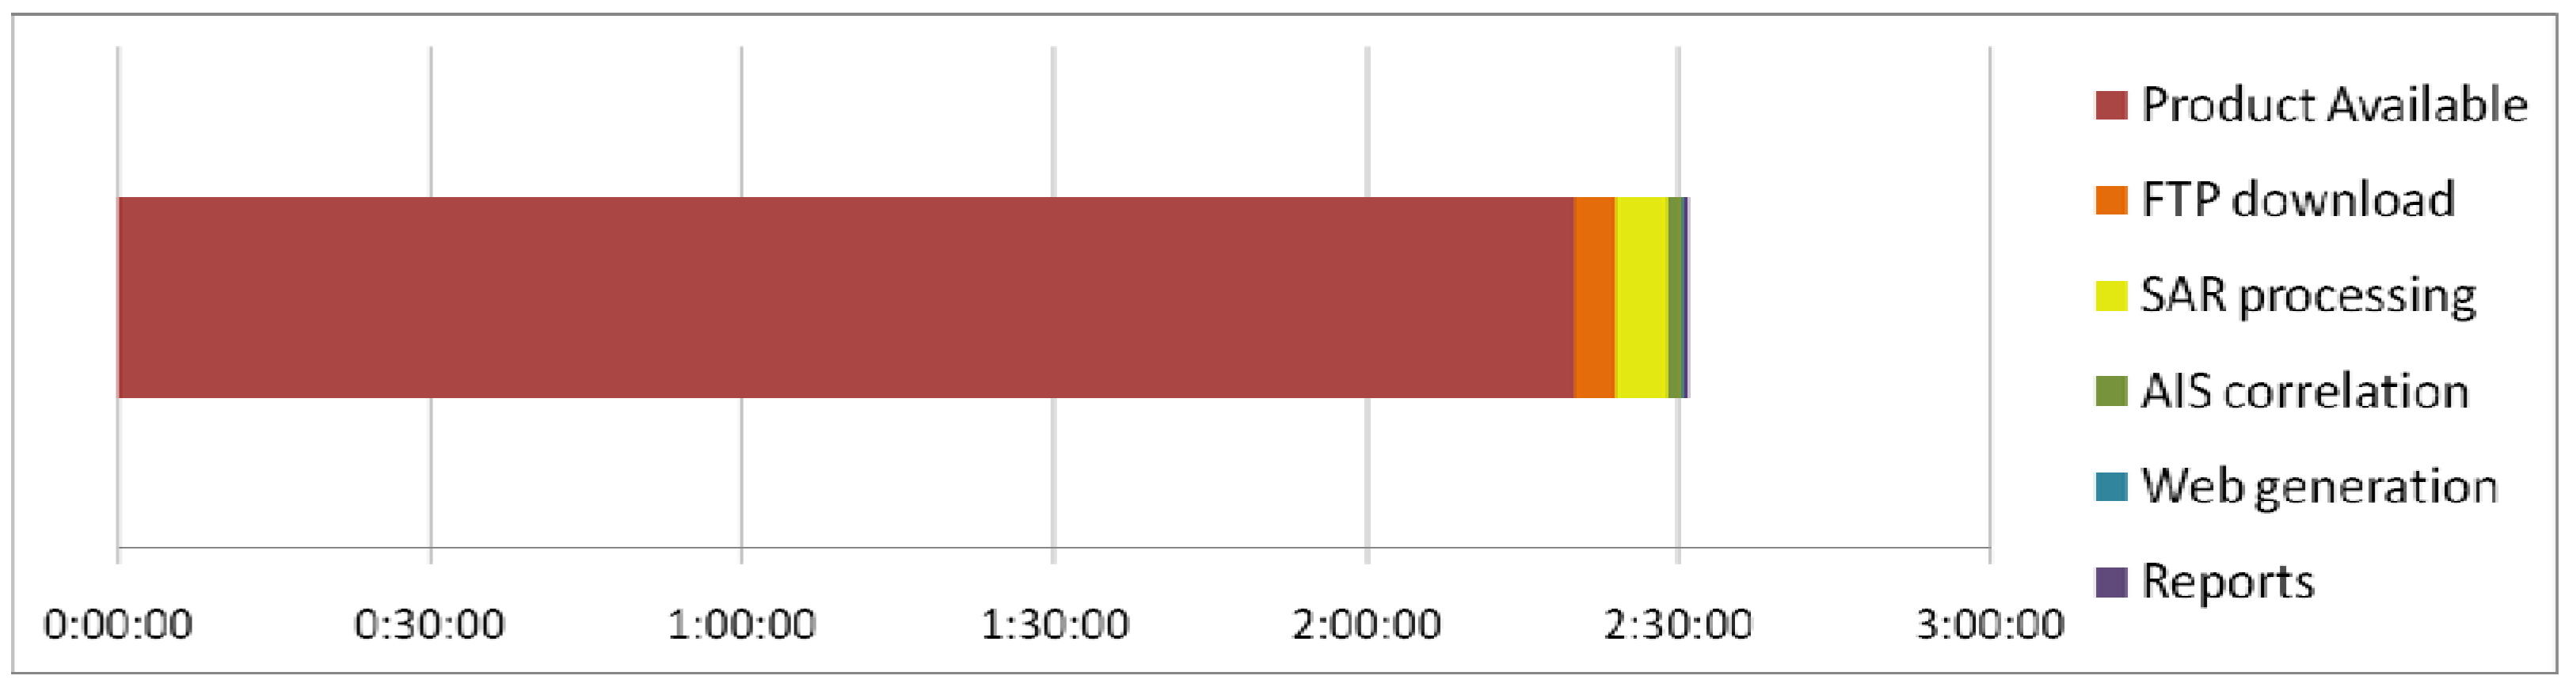
SIMONS has been designed to be modular, flexible, reliable and unsupervised. The processing chain is fully-automatic and needs less than 10 min to deliver final products to users (compliant with NRT). In some cases, however, delivery time has been penalized by unexpected delays on data reception. As shown in
Figure 2 , delays of two and a half hours have been registered due to problems on the provider side. This limitation is expected to be resolved as otherwise, it could affect the performance of future applications such as route tracking. System capabilities have been checked by Spanish police authorities (Guardia Civil) and naval forces. Currently, they are using SIMONS for operational purposes and they have found it very useful for supporting decision making. Their feedback has allowed the development of some added-value tools that support data analysis. For instance, alarm generation that filters useless information according to user profile and enhances the requested layers.
Figure 1.
High level scheme of SIMONS.
Figure 1.
High level scheme of SIMONS.
Figure 2.
Timing in data processing for generating products.
Figure 2.
Timing in data processing for generating products.
3. Data Processing
This section describes the main data processing modules. All of them account for efficient memory management routines. The modules are:
Pre-processing
Land masking.
Ship detection.
Ship classification.
AIS correlation.
Report generation.
3.1. Image Pre-Processing
Input images are pre-processed to avoid certain reflectivity aberrations. The tasks are:
The compensation of the linear variation of the reflectivity information along the slant-range dimension. This is performed by multiplying each azimuth line at range position ri with a constant Ci. This constant is computed as the ratio between the mean value of the whole image and the mean of all the values within the azimuth line ri.
The application of the calibration constants to retrieve the Radar Cross Section (RCS).
The erasing of guard bands at image edges with null values. Some data present areas at image edges with no useful information. They are erased with morphological operations.
3.2. Land Masking
Coastline detection algorithm can operate with two modes, namely:
Shape. This mode uses external coastline shape files that limit land extension via collections of latitude and longitude pairs. The higher the number of points, the higher the accuracy on isolating the sea from the land. Right now, the system comprises a World file with medium resolution and a Spanish file with very fine resolution. As such, this mode is simple and efficient and normally needs coordinate system transformations to adopt the reference used in SAR images. However, it has an important limitation that results from the fact that performance depends excessively on the availabel resolution. Certainly, the distance between two pairs shall be as fine as possible in order to avoid false alarms (see
Figure 3). This especially applies for small islands and irregular shores, which, in general, are not precisely mapped. The experience acquired with SIMONS has shown that resolutions worse than 25 m are not desirable.
Image. This mode adopts image processing techniques to isolate the coastline with no additional (external) information. In the current version, land is isolated from the sea by evaluating RCS gradients. The procedure can be summarized as follows:
- ○
Moving windows of specific size are used to locally evaluate RCS histograms.
- ○
The information inferred from all the sub-images is analyzed to evaluate whether there are two histogram clusters with differentiated mean RCS values (land and sea) or not.
- ○
If the sea is present in the scenario, then a mask is generated to filter out sea areas, i.e. those pixels that fall into the histogram cluster with the lowest mean RCS.
- ○
Mask perimeter is isolated with an algorithm based on Geodesic Active Contours [
4].
- ○
Finally, coastline perimeter is refined by applying some morphological constraints. There are two main rules, which permit the suppression of sea areas within closed land surfaces and of those objects with a perimeter to area ratio higher than a fixed threshold.
For images with standard quality, the algorithm becomes very accurate. But for images with noisy reflectivity information or inaccurate calibration, some limitations are observed. To solve this issue, an improved version based on wavelets is being defined. Until it becomes operational, inaccuracies are solved by supporting image processing with shape files.
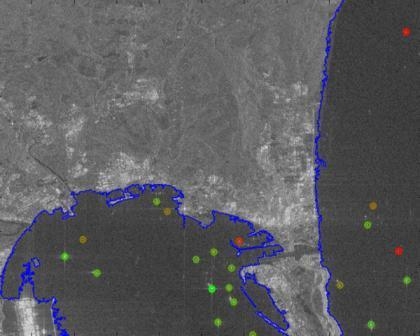
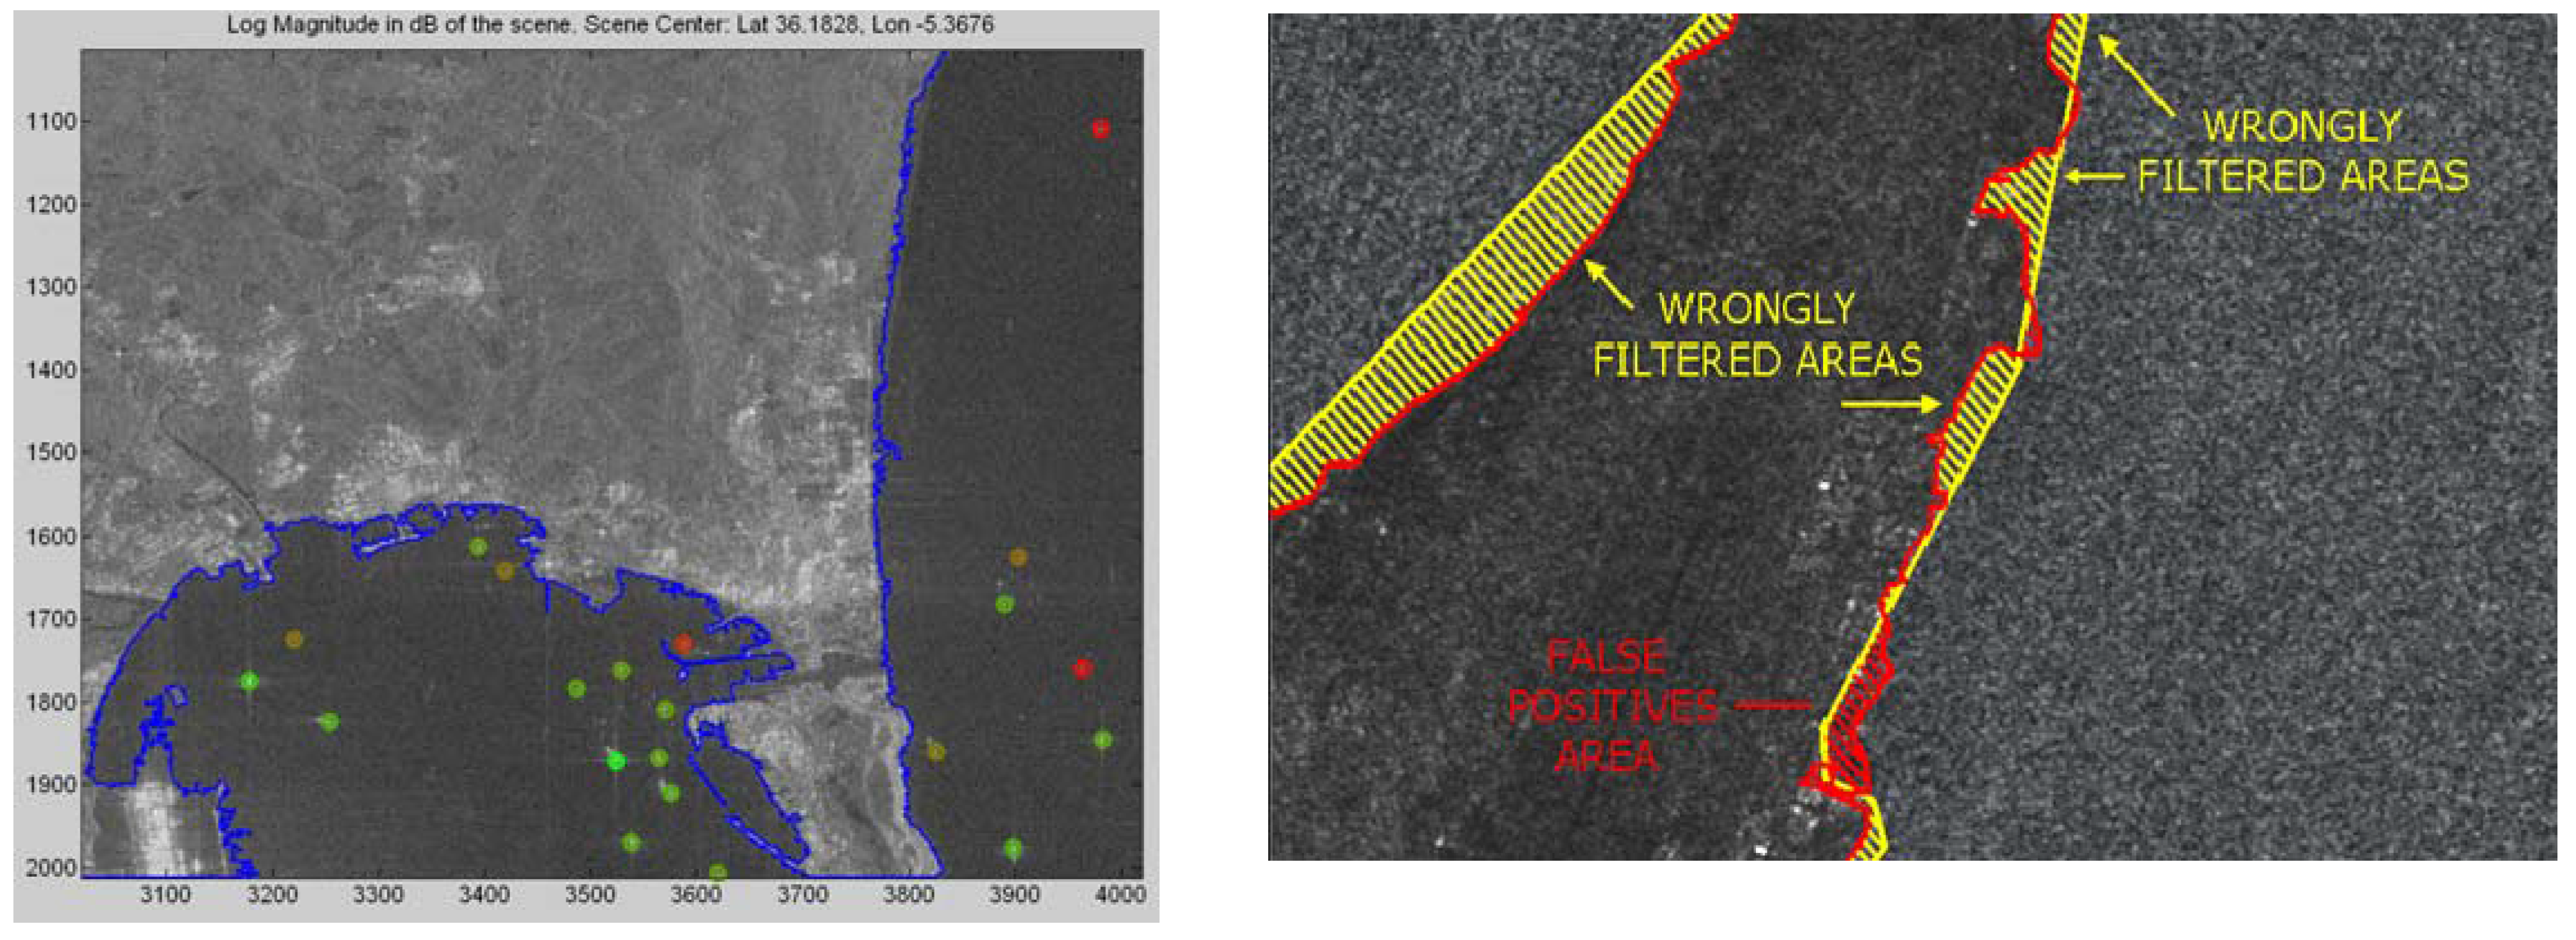
Figure 3 (left) shows an example of coastline isolation (blue line) with the algorithm developed for SIDECAR. The image corresponds to an ENVISAT set of the bay of Gibraltar imaged in Image Precision Mode at 27-12-2007. As observed, coastline is perfectly isolated, even in difficult harbor areas.
Figure 3 (right) shows the differences between shape files and image processing. There, a coastline detection algorithm (red line) avoids the wrongly filtered areas (where sea is assumed to be land) and false positives (where land is assumed to be sea) that a low resolution shape file (yellow line) can cause. This indicates how careful the usage of shape files shall be.
Figure 3.
Snapshot of coastline isolation (blue line) for an ENVISAT image of the bay of Gibraltar (left). Differences between image (red line) and shape (yellow line) processing modes (right).
Figure 3.
Snapshot of coastline isolation (blue line) for an ENVISAT image of the bay of Gibraltar (left). Differences between image (red line) and shape (yellow line) processing modes (right).
3.3. Ship Detection
Ship detection is performed with the Wavelet Transform (WT) [
5], a mathematical tool that permits the decomposition of a generic function into a base of simple ones. These basic functions are localized in the spatial and wave-number domains and can be defined in such a way that each one takes a specific portion of this space. These portions are known as
scales and are characterized by the ratios between the resolutions adopted in both domains. For instance, scales can be defined with fine resolution in the spatial domain but worse value in the frequency one and vice versa. Note that WT is an extension of the Fourier Transform where the signal is analyzed with a unique scale.
Among all the wavelets variants, the Stationary Wavelet Transform 2D (SWT2) is specially suited for images because permits the processing of 2D features. This allows the definition of advanced morphological analysis that isolates particular features according to the patterns captured along the different scales. This is the case of ships that present a marked
coherent response in contrast to the noise-like
incoherent behavior of the sea [
6]. Such characteristics have been exploited in the approach recently proposed by UPC [
6] to enhance ship reflectivity contrast. Two advantages are identified:
No fine thresholding is needed as the dynamic range between the reflectivity values of ship and sea signatures (i.e. the contrast among signatures) is notably increased.
The processing approach is extremely simple as the main operation relies on a pointwise multiplication among all the products of the considered scales. This is complemented with the operations inherent in WT processing, i.e. the transformation from space to wavelet domain and vice versa. The result is an image where the 2-D local maxima indicate ship location.
In SIDECAR, a variant of the previous approach has been defined in order to add features useful for the operational case. Instead of the pointwise multiplication, particular combinations of the different sub-products at the first scale are applied. They exploit the properties of WT for which the products of each scale can also be obtained via a recursive filtering of the original image with series of low and high frequency filters [
5]. As low- and high-frequency filtering is applied along rows and columns, four products result. With them, SIDECAR follows the following simple procedure:
The two products derived from low- (A, H) and high-frequency (V, D) filtering applied along image rows are multiplied among them.
The Inverse WT is applied to these two sets and two intermediate images are generated in the spatial domain.
In each image, ship presence is identified by clusters of local maxima. The center of each cluster (in fact, the actual ship location) is localized by using the MATLAB
© cluster procedure that links pairs of points according to a Euclidean distance. The kernel of this function is a linkage method that generates a hierarchical cluster tree from the previous distances. The number of clusters is determined by iterating the previous procedure with an increasing number of maximum clusters, still the difference between two of them is below a fixed threshold. This value is tuned according to experience and the processing of some test samples. The overall ship detection report is stored in a database where possible duplicates are erased (ships located in both intermediate images). This method provides two advantages:
- 1)
Proximity. The previous algorithm provides a manner to detect close targets without losing the capability to detect small and low reflective ships. The threshold fixing the ending criteria in the cluster procedure quantifies the performance of the algorithm for both items. In [
6], this trade-off is not easy to reach because the larger the scale, the better the sensitivity to detect small targets, but the worse the capability to isolate close targets, and vice versa.
- 2)
Confidence. According to the characteristics of the local maxima indicating the presence of a potential ship, a confidence parameter C can be defined indicating the percentage of certainty that the algorithm has in labeling the detected spot as a ship. The range of values taken by C permits different situations, for instance:
Ship-like sea aberrations causing false alarms (wave crests) ➔ C < 0.4.
Small ships with low dispersion ➔ 0.4 < C < 0.7.
Ships visible by eye inspection ➔ C > 0.7.
The confidence parameter has been found to be very useful for supporting classification and defining alarms. It helps the operators to do better decision making as the efforts can be focused to particular targets according to the confidence values that they take.
Figure 4 shows an example of ship detection carried out by SIDECAR for an ESA ENVISAT image covering the surroundings of Gibraltar, Spain, with Image Precision Mode at 27-12-2007. As observed, ship detection performs very well because all the ships identified by eye inspection are located as well as other ones with low RCS. In all the cases, the confidence levels given to each detection permit the identification of which type of ship could be behind. Especially interesting are the two spots cruising from South to North and labeled by white rectangles. The associated features and the confidence assigned by the system make them potential candidates to be clandestine boats boarding illegal immigrants. But without ground-truth such an assertion is difficult to formulate.
3.4. Ship Classification
Ship classification is performed by analyzing the distribution of RCS throughout the signature isolated in the SAR image. Two main blocks can be identified, Parameters retrieval and Fuzzy logic processing.
Figure 4.
Snapshots of ship detection performed by SIDECAR for two sections of an ENVISAT image of the Strait of Gibraltar.
Figure 4.
Snapshots of ship detection performed by SIDECAR for two sections of an ENVISAT image of the Strait of Gibraltar.
3.4.1. Parameters retrieval
In this block, the following main steps are required, namely:
Signature isolation. Ship signature is isolated from the surrounding sea by applying the same method used for land masking. Now, clusters with higher reflectivity pertain to the ship signature, instead of being land. Some morphological constraints are applied to erase clusters of pixels with no relation to the ship signature. The most important ones are the analysis of the relative distance among the different clusters and the checking of the reflectivity values.
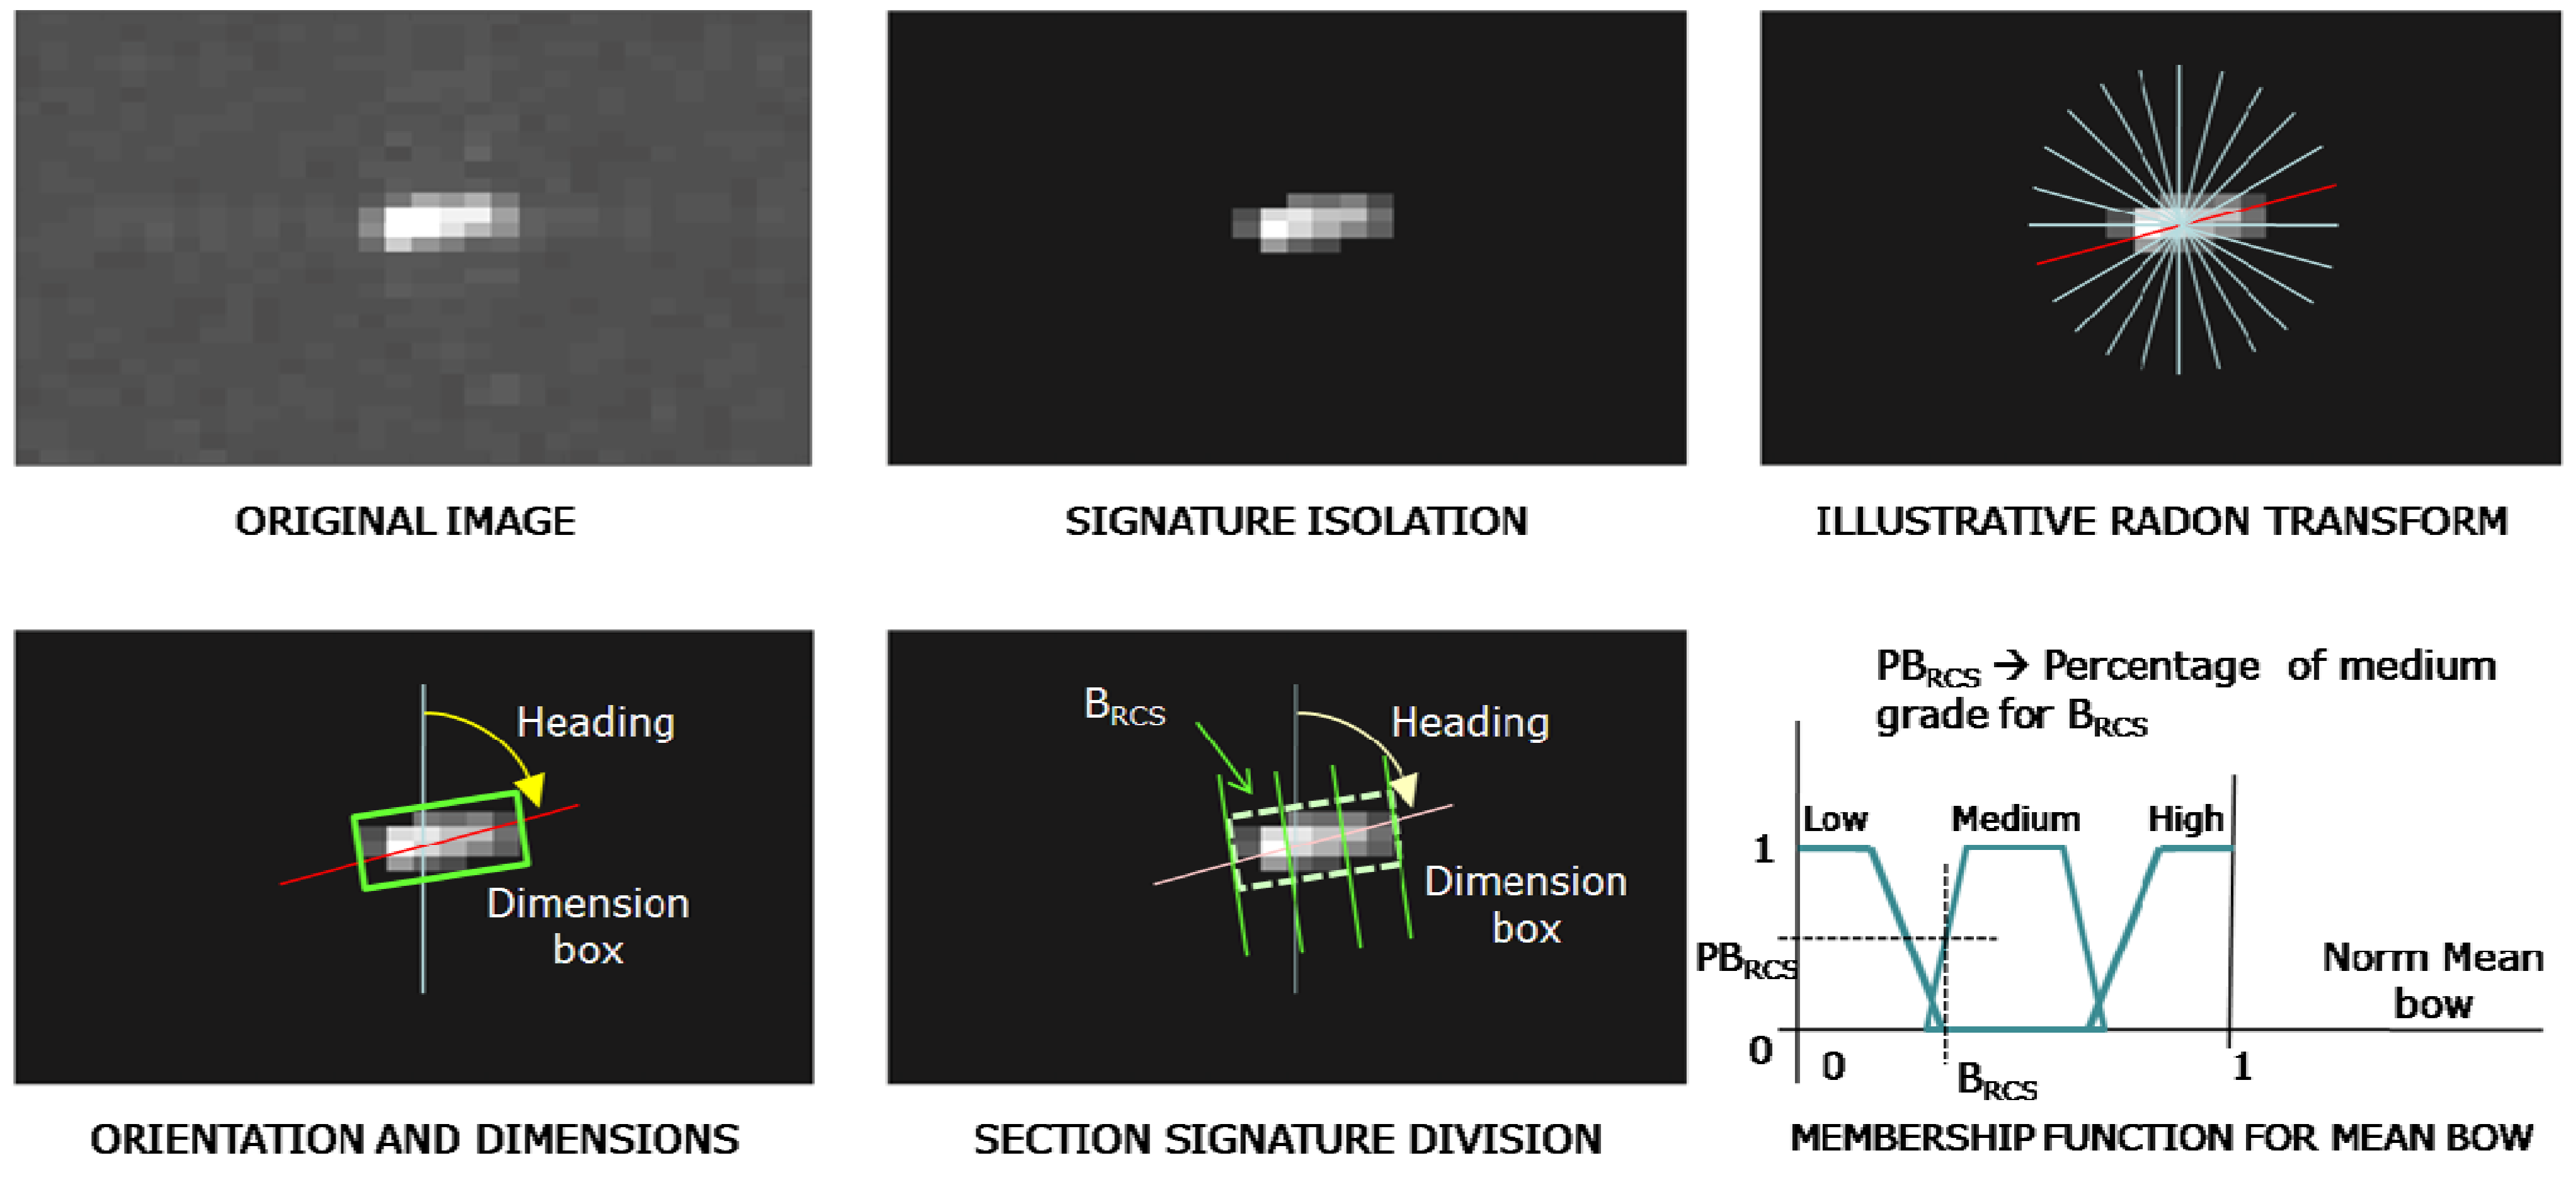
Heading retrieval. Ship heading is estimated via the Radon Transform [
7]. Qualitatively, this mathematical tool permits the projection of the image into a set of oriented lines and the calculation of the related correlation coefficient (see
Figure 5). Therefore, the lines providing the highest correlation values indicate the tentative orientation of the linear features included in the image. The angular step between successive reference lines is user-fixed and depends on the requested accuracy. A value of one degree is fairly normal.
Dimensions retrieval. Ship dimensions are estimated by counting the number of pixels along the bow-stern (length) and port-starboard (breadth) axis. For making this process easier, the ship signature is rotated so that the bow-stern axis is vertical.
Signature division. In order to evaluate the RCS of the ship signature, the isolated feature is divided into three sections with approximately the same area: bow, middle and stern (see
Figure 5). For each one, a mean value is retrieved, which is normalized to the maximum value of the signature. Fuzzy logic is then applied to find which category from the reference ones best fits the reflective and geometrical characteristics of the isolated target. See
Table 1 for a summary of the reference categories, which are defined according to official classifications.
3.4.2. Fuzzy logic processing
Once all the previous parameters are estimated, fuzzy logic is used to apply the decision rule. In simple words, fuzzy logic is the theory for which classical binary levels are extended to continuum grades of intermediate memberships [
8]. So, the conventional crisp of full-membership and non-membership levels (0 and 1) is overcome to handle imprecise information. The number of levels is known as grades, which are defined by membership functions. Such functions provide the percentage of each input to be a member of each grade. The number of grades, the shape of membership functions and the percentage of overlap are flexible and updated according to the application to develop. They conform what is known as fuzzy “set”. More than one parameter can be evaluated by fuzzy rules, which outputs can be diversely combined via “if-then” statements.
In the case of SIDECAR, the normalized RCS of bow (B
RCS), middle (M
RCS) and stern (S
RCS) sections are the inputs to the fuzzy rules. For each one, three grades are considered (low, medium and high) with the membership functions shown in
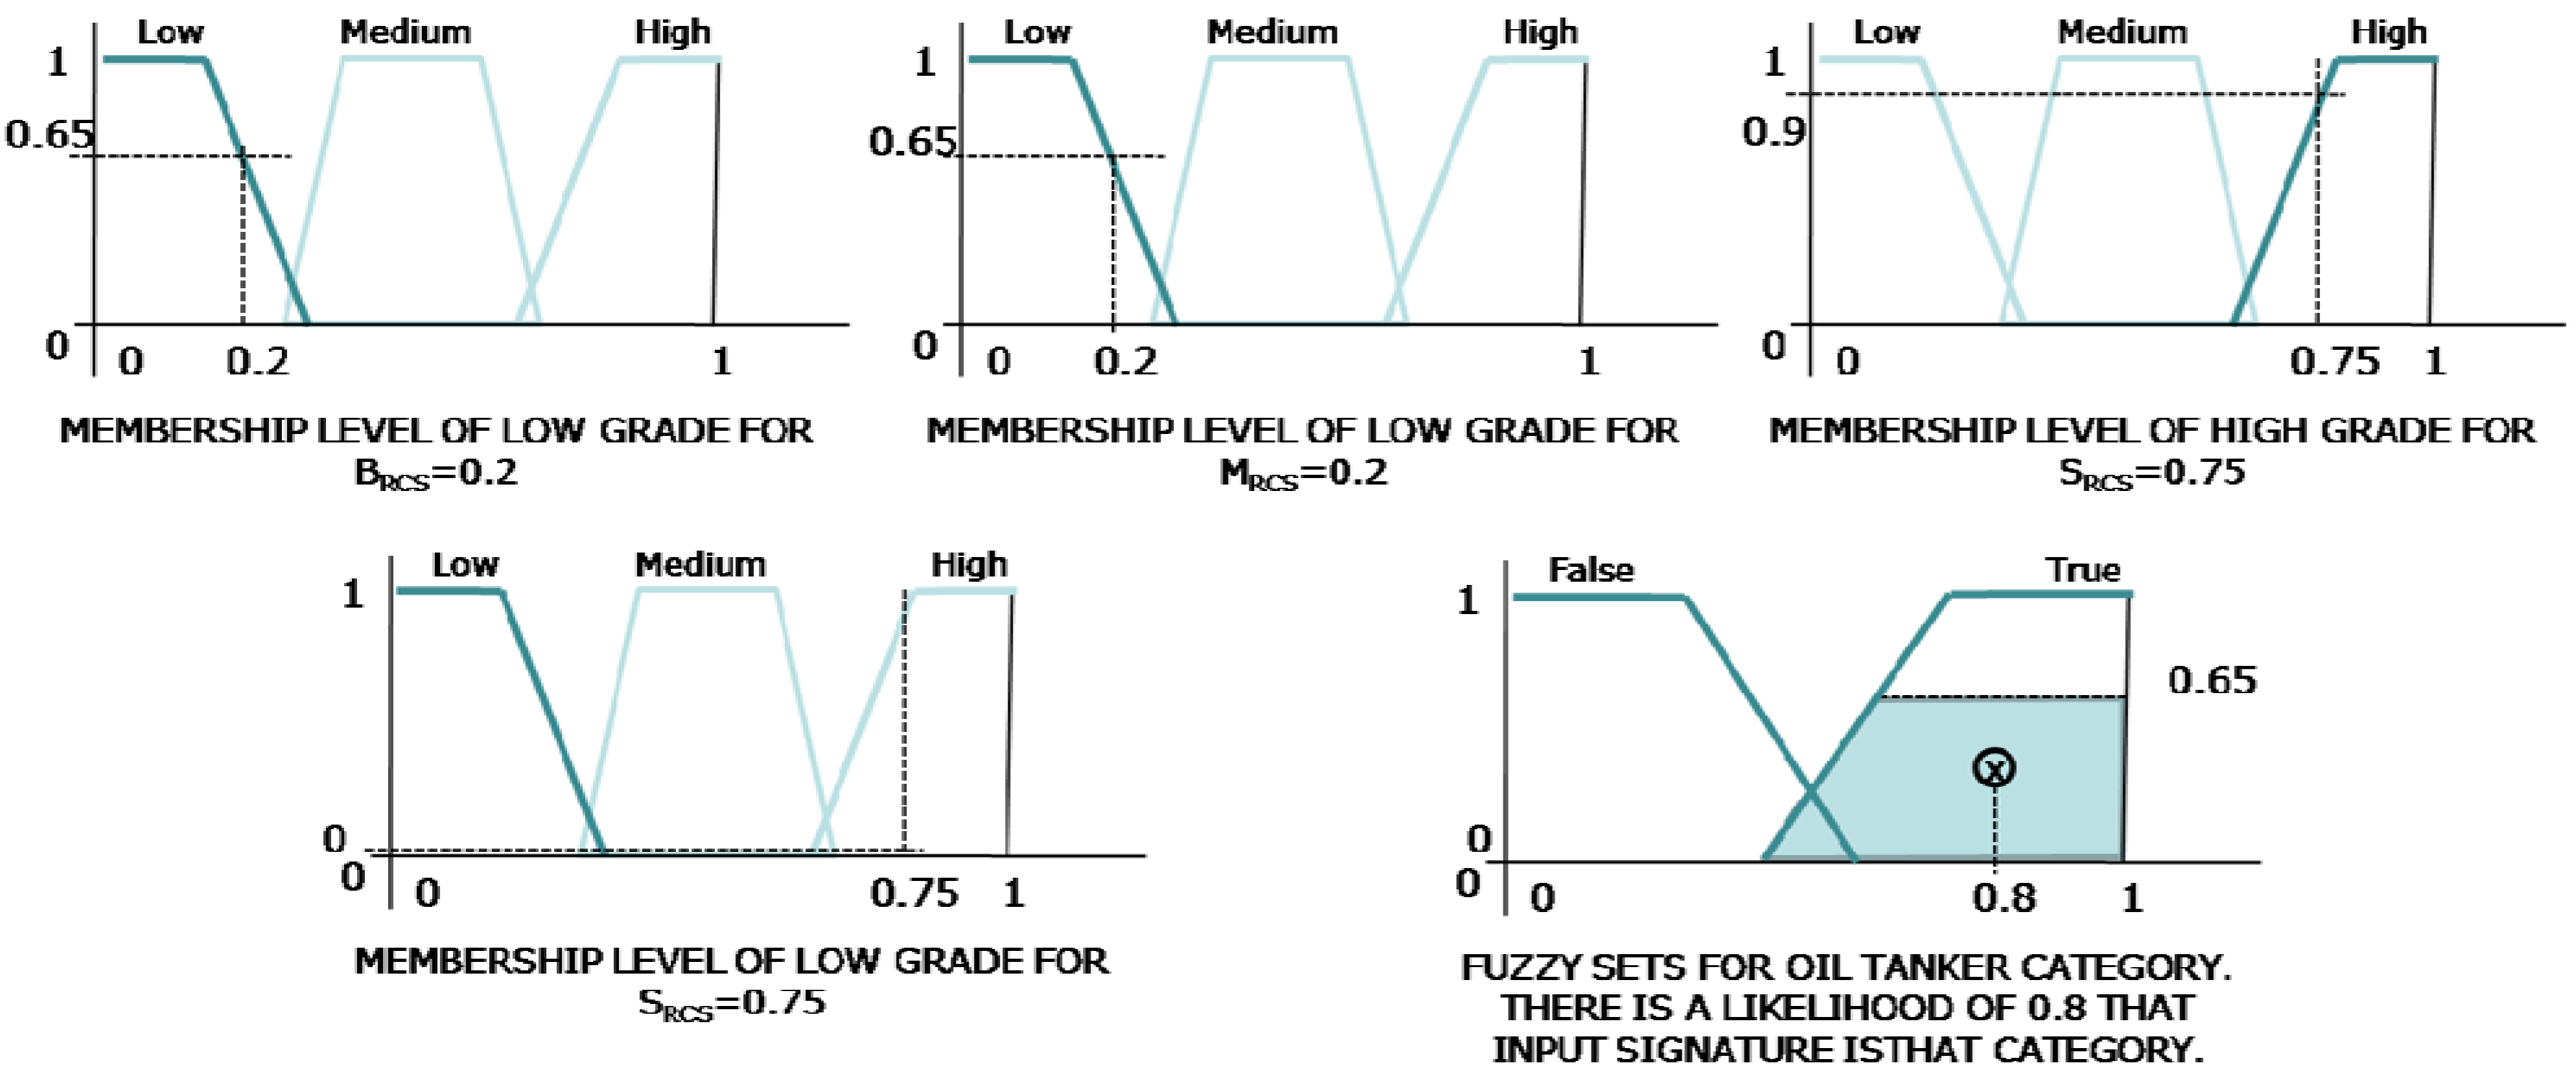
Figure 5. The evaluation of the input parameters with these membership functions provides the percentage of each input to pertain to each grade. The combination of these values according to a set of category rules leads to the percentage of a measured ship signature to be member of the different reference categories.
To do that, each reference category has to be associated with a two-grade set with equal membership functions (see
Figure 6). The grades of this set are
false (no member of the category) and
true (member of the category), and they are evaluated with the output of the category rules. Such rules provide decision for the “false” and “true” grades and are fixed from the relations shown in
Table 1.
The values resulting from the evaluation of the “false” and “true” rules define the area covered by each membership function of the true/false set. Such area is measured by the Centroid calculation method and is the similarity value between the measured ship signature and the processed category. This value, jointly with the ratio of target dimensions, gives the classification confidence.
Figure 5.
Illustrative description of ship classification without taking fuzzy logic processing into account.
Figure 5.
Illustrative description of ship classification without taking fuzzy logic processing into account.
Table 1.
Reference categories with the grades expected for the three normalized RCS values.
Table 1.
Reference categories with the grades expected for the three normalized RCS values.
| Category | SRCS | MRCS | BRCS | Length [m] | Breadth [m] |
|---|
| Oil Tanker | High | Low | Low | 300 | 45 |
| Chemical | High | Low | Medium | 200 | 35 |
| Coaster | High | Medium | Low | 100 | 25 |
| Goods Cargo | High | Low | Medium | 150 | 25 |
| Gas Cargo | High | High | Low | 200 | 35 |
| Bulk | High | Medium | Low | 200 | 35 |
| Container | High | High | High | 225 | 45 |
| Car Ferry | Medium | High | Low | 150 | 25 |
| Fishing vessel | Medium | High | Low | 90 | 25 |
| Small targets | Low | Medium | Low | 40 | 10 |
For a better understanding of how fuzzy logic works, an example for the evaluation of the Oil tanker category is presented (see
Figure 6). Let us define the following “true” and “false” rules where ~ means the inverse operation and (S
RCS IS ~high) = (S
RCS IS medium) OR (S
RCS IS low)
Rule 1: IF (SRCS IS high) AND (MRCS IS low) AND (BRCS IS low) THEN (True)
Rule 2: IF (SRCS IS ~high) OR (MRCS IS ~low) OR (BRCS IS ~low) THEN (False)
Consider then that the inputs to the fuzzy logic system are S
RCS = 0.75, M
RCS = 0.2, B
RCS = 0.2. So, the percentage to pertain to each grade is (see plots in
Figure 6):
SRCS IS high = 0.9, SRCS IS medium = 0, SRCS IS low = 0.
MRCS IS high = 0, MRCS IS medium = 0, MRCS IS low = 0.65.
BRCS IS high = 0, BRCS IS medium = 0, BRCS IS low = 0.65.
With this information, the evaluation of the two previous rules results on:
Rule 1: 0.9 AND 0.65 AND 0.65 THEN 0.65
Rule 2: 0 OR 0 OR 0THEN 0
With this information, the area filled in both true and false grades of the membership function of the Oil Tanker category is the one shown in
Figure 6. As observed, the final likelihood of the input signature to belong to the Oil Tanker category is 0.8. With the application of this process for all the defined categories, a set of chance values are obtained, which bases the classification decision.
Figure 6.
Illustrative description of fuzzy logic processing. The plots refer to a hypothetic input signature that is cross-checked against the Oil Tanker category.
Figure 6.
Illustrative description of fuzzy logic processing. The plots refer to a hypothetic input signature that is cross-checked against the Oil Tanker category.
3.5. SAR-AIS Correlation
After SAR processing, there is an additional processing step that correlates ship detection and classification reports with AIS polls. This step permits, first, the development of user-customized alarms and, second, the provision of a manner for validating ship classification performance. Certainly, the cross-check of the category assigned by SIDECAR with that provided by AIS poll helps assessing algorithm precision. The AIS-SAR correlation process starts by gathering the AIS information over the same location and period covered by the SAR image. The temporal window under analysis depends on the temporal resolution of the AIS service, which is almost continuous in coastal AIS and discontinuous in satellite AIS. All the detections for the same vessel are grouped into route tracks, and the locations expected at image acquisition time, calculated. This process solves two undesired effects:
Ship location shifts in SAR images due to Doppler effects
Low or discontinuous number of AIS tracks.
Both are compensated with a route propagation algorithm that estimates the tentative position of a ship projected into the SAR image. For each successful correlation between SAR-AIS ship positions, a confidence value is calculated from the distance between SAR and AIS locations, and the similarity between ship macro-scale features (ship length, breadth and heading).
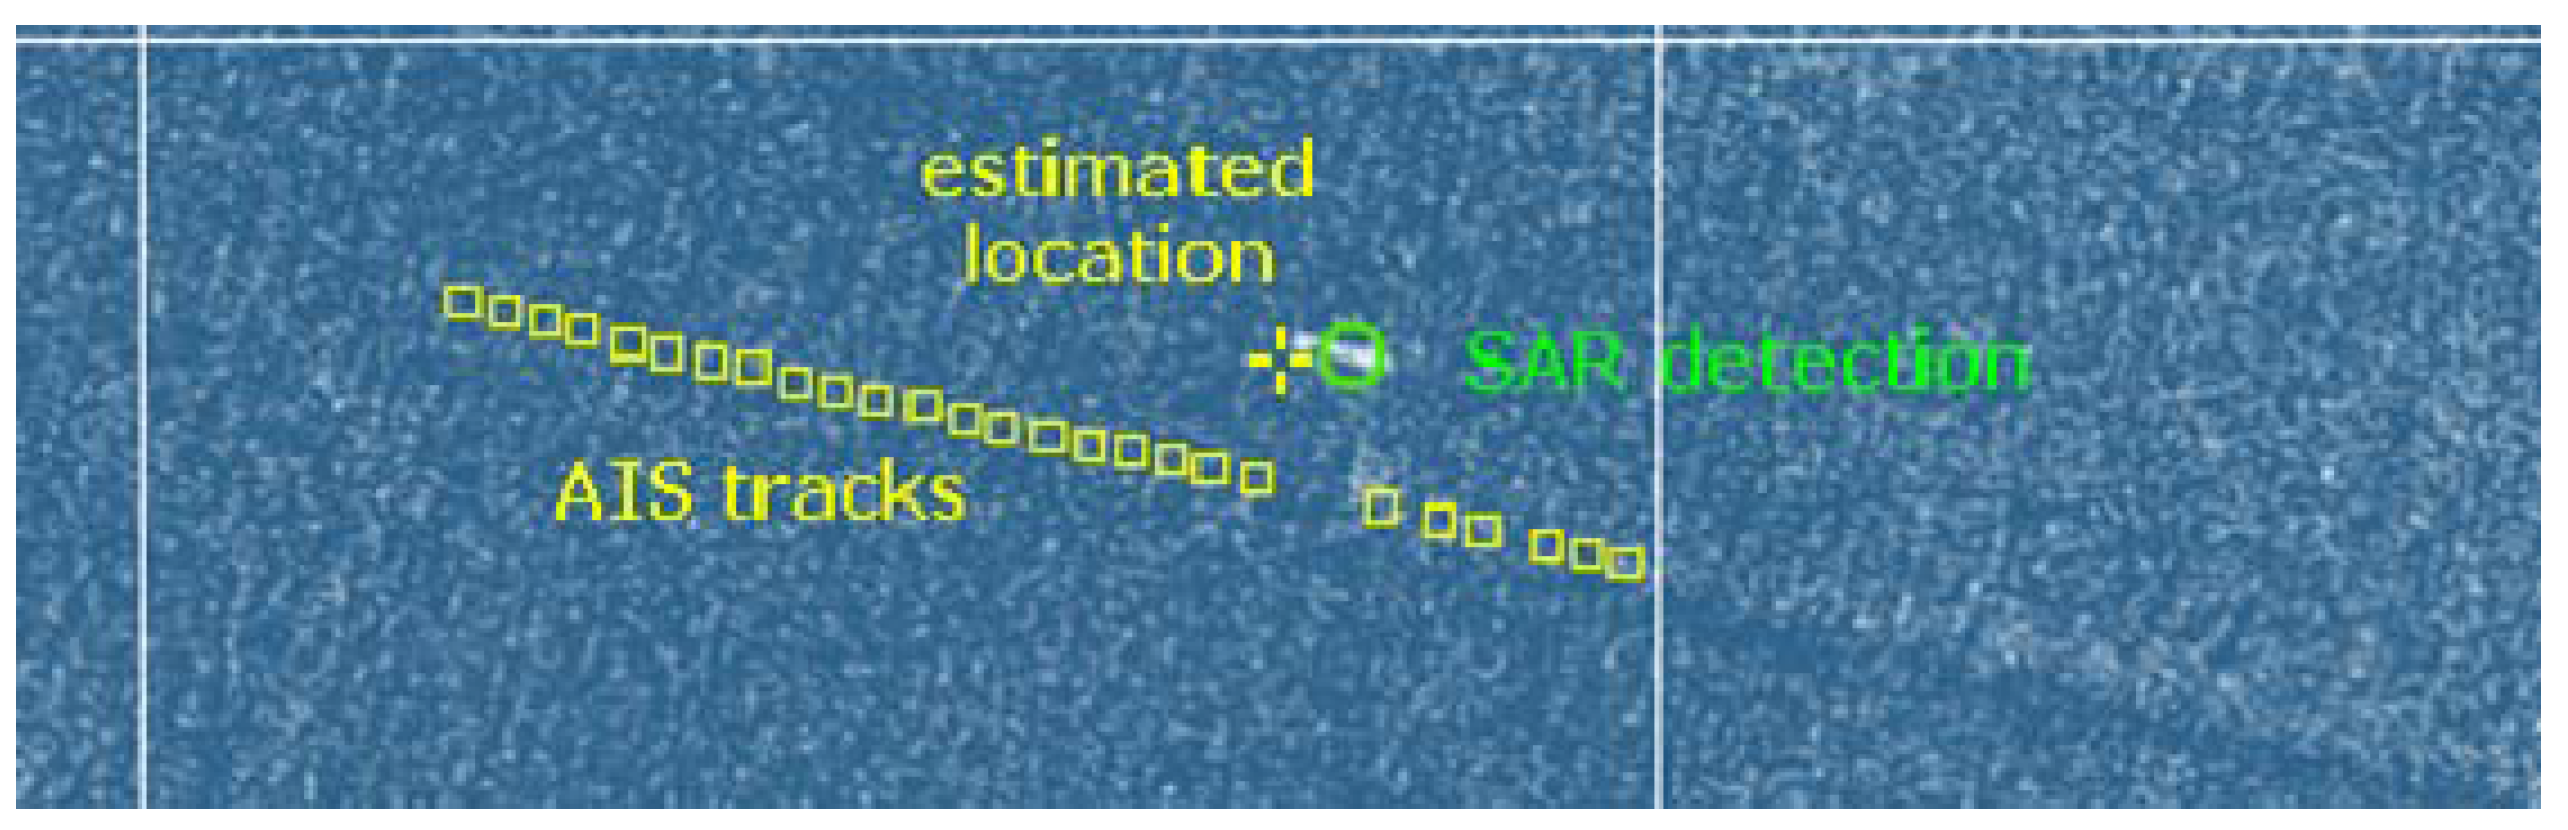
The following figure presents an example of this algorithm showing the AIS track (shown by yellow squares), the expected position at image acquisition time projected into the SAR geometry (shown by the yellow cross) and the actual detection from the SAR image (shown by the green circle).
Figure 7.
Illustrative description of the SAR-AIS route tracking algorithm.
Figure 7.
Illustrative description of the SAR-AIS route tracking algorithm.
With previous AIS-SAR correlation procedure, a test has been carried out for an ENVISAT image of the surroundings of the Strait of Gibraltar, Spain.
Table 2 summarizes the cross-correlation of categories for the SAR-AIS pairs having the highest confidence. The results show that the category assigned by the algorithm matches the category of the observed vessel in around 60% of the cases. This result can be considered good for the medium resolution single-polarimetric images managed. Although this preliminary test is encouraging, further studies are required for validating the results and for exploiting the improved resolution and polarimetric capabilities of new sensors.
Table 2.
SAR-AIS category cross-correlation for detections performed in an ENVISAT image.
Table 2.
SAR-AIS category cross-correlation for detections performed in an ENVISAT image.
| Category SAR | Category AIS | Ship name AIS | Check |
|---|
| Coaster | Fast Ferry | Avemar dos | ☑ |
| Oil Tanker | Container | MSC Levina | ⊠ |
| Bulk | Bulk | Maersk Nagoya | ☑ |
| Goods Cargo | Oil Tanker | Hekabe | ⊠ |
| Oil Tanker | Oil Tanker | Omega Theodore | ☑ |
3.6. Report Generation
Different dissemination strategies (mail, FTP…), with several formats (plain text, XML, PDF, Google Earth, etc.) can be configured. The reports are automatically generated after receiving SAR products and can be easily distributed to different operators or integrated in different platforms. Final reports contain information regarding ship location, detection confidence, ship category, classification confidence, heading, length, breadth and the normalized RCS values for the three bow, middle and stern sections. The user can also configure filters in order to reduce the information that will be reported, or the way it is displayed. By customizing the information contained in the report, operators can focus only on their areas of interest or can define alarms, i.e. particular situations that comprise a set of conditions that are met (short ship cruising at certain direction with no AIS).
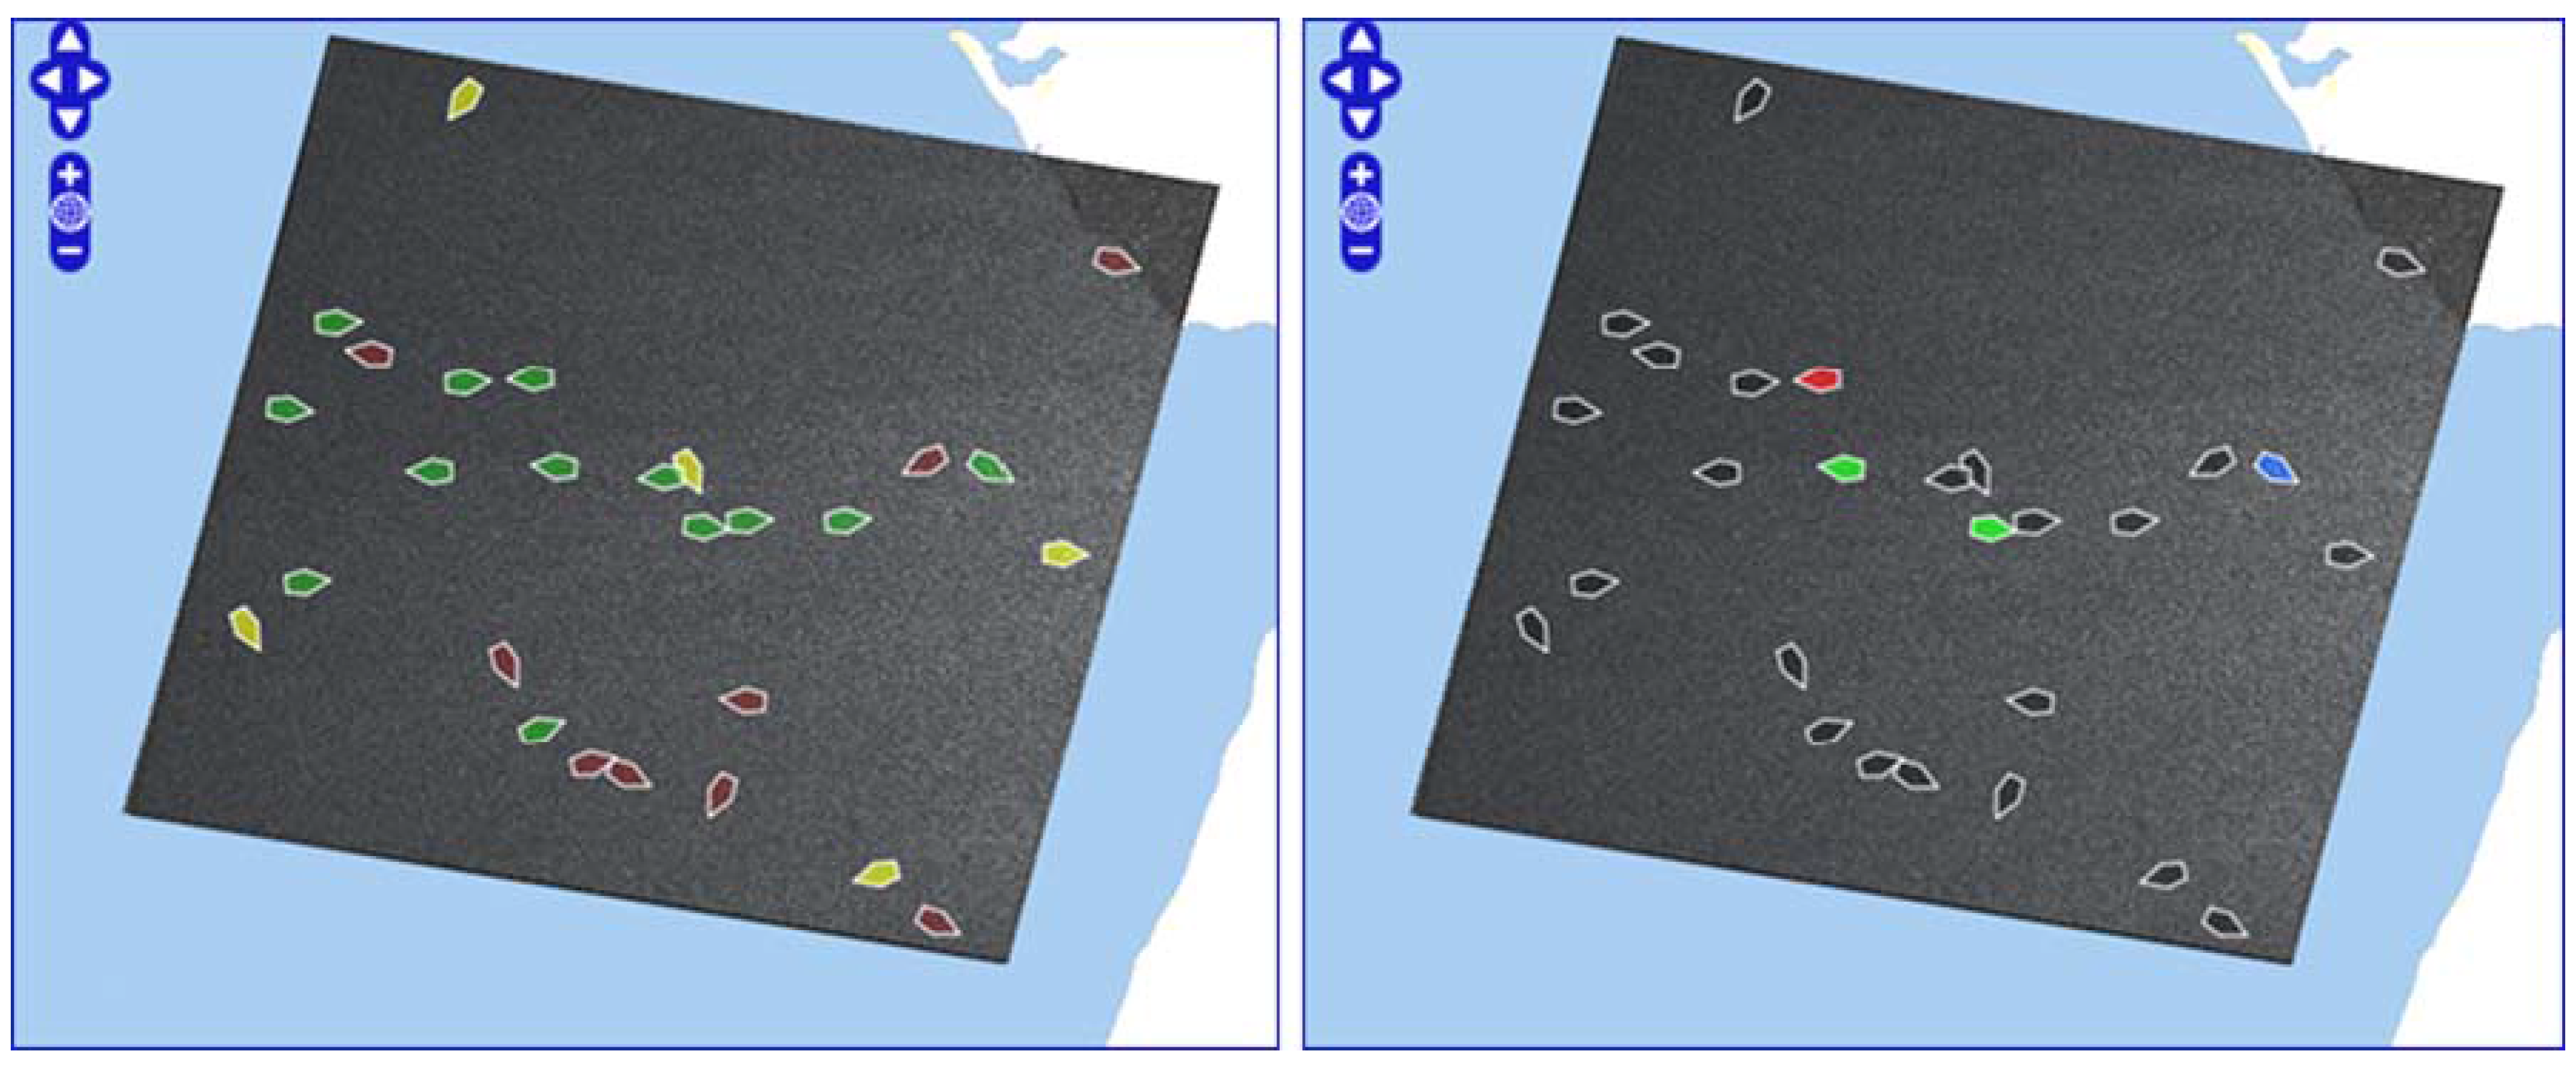
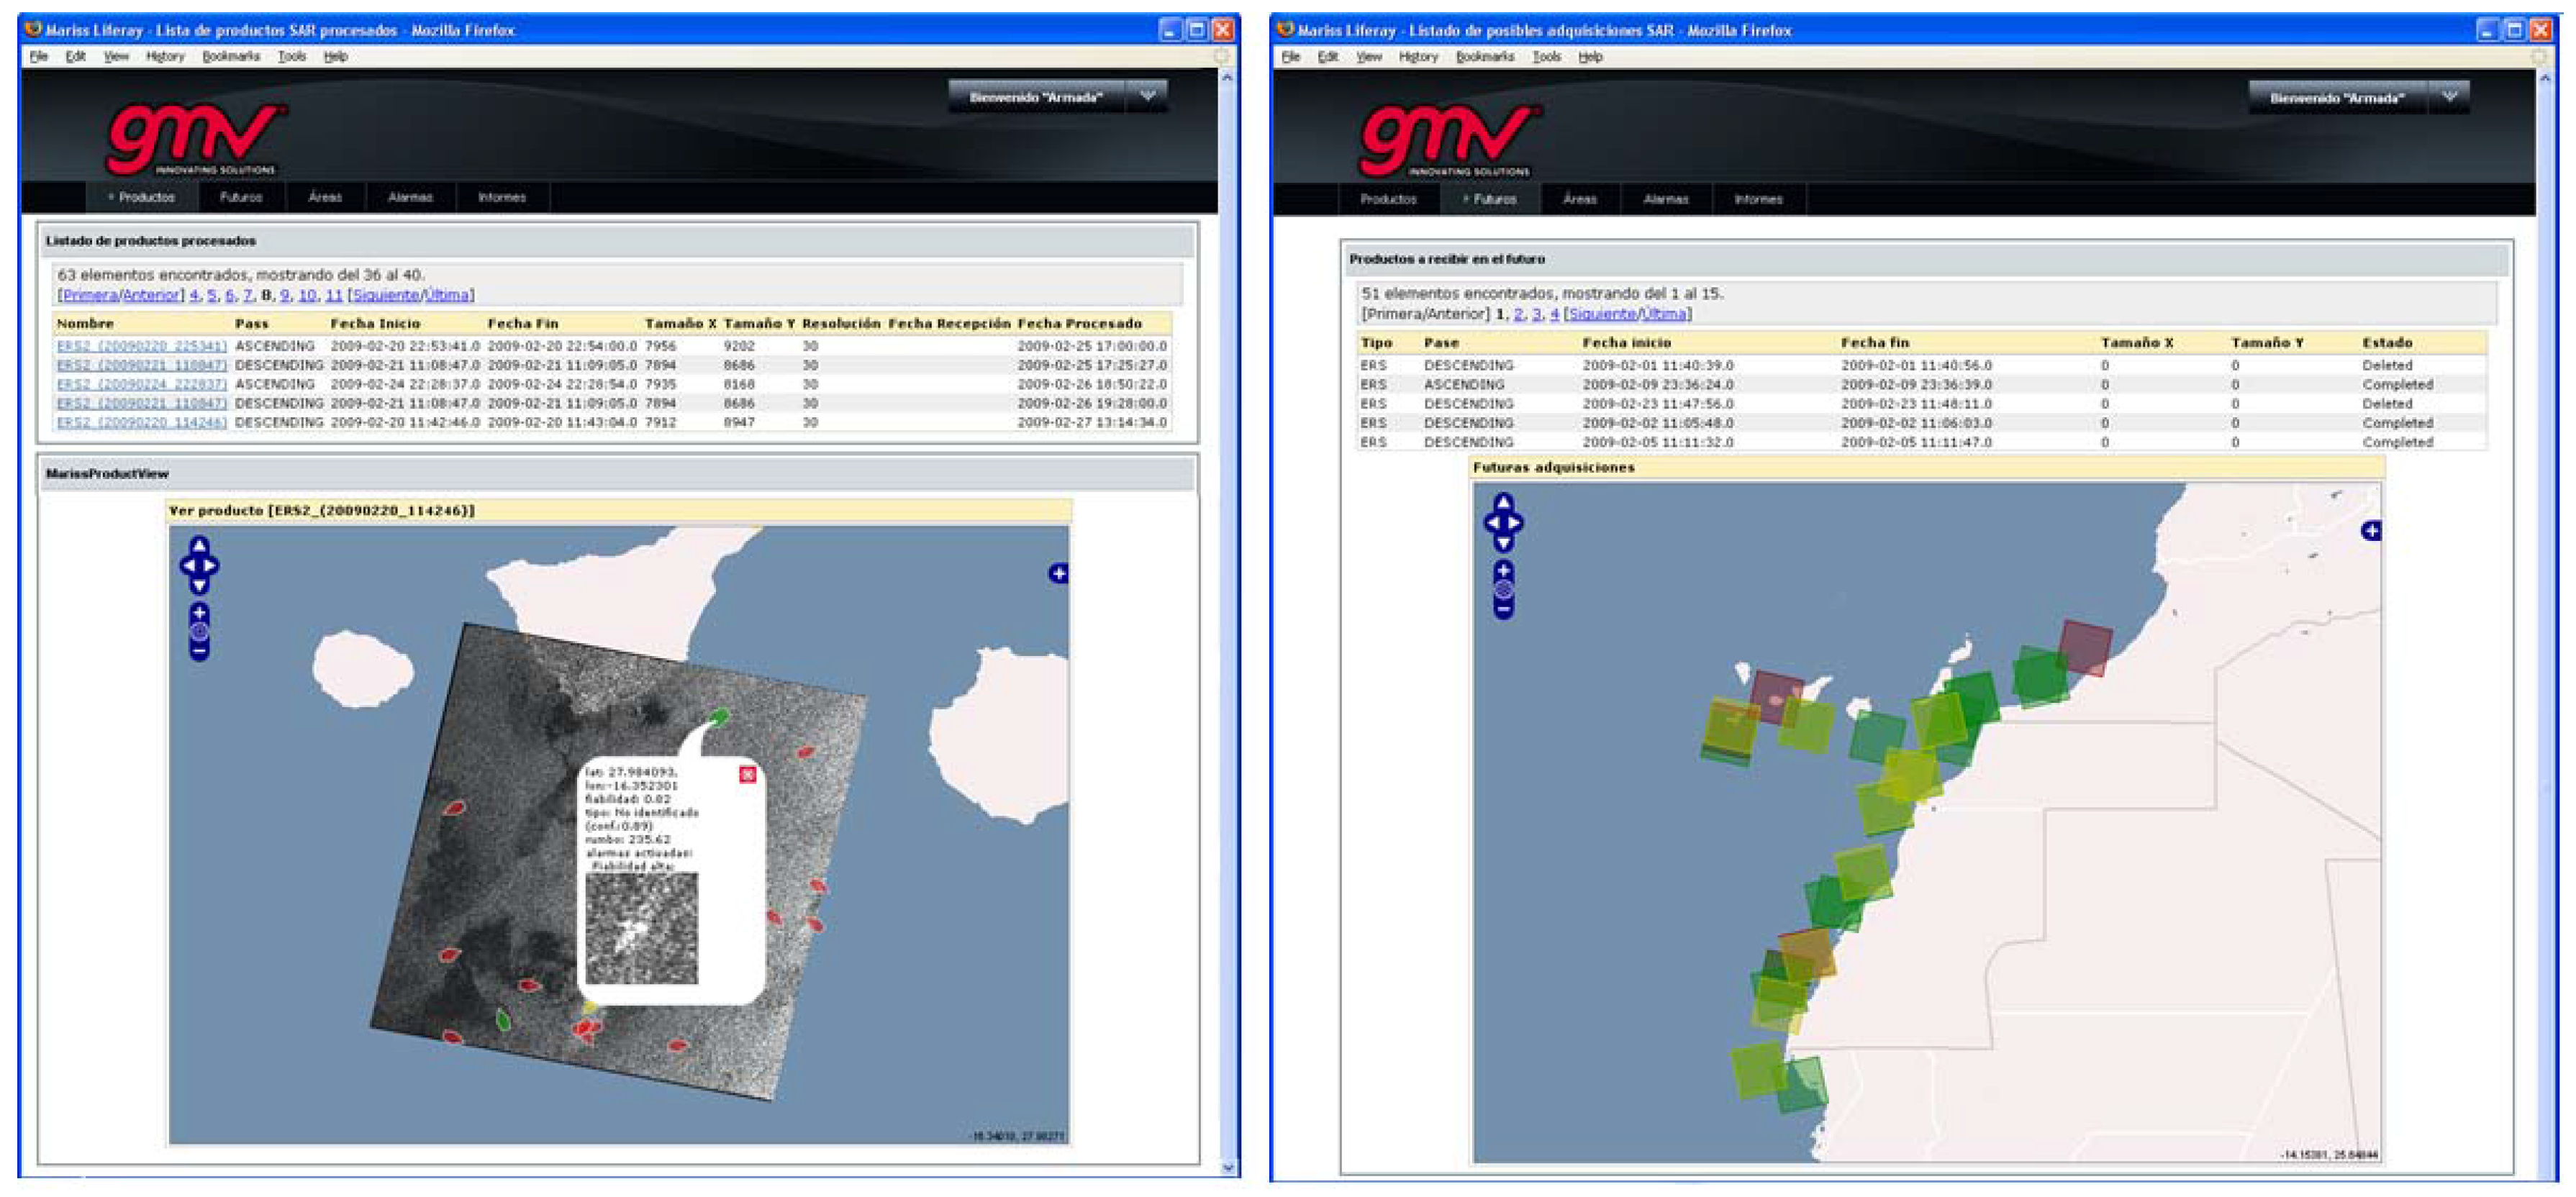
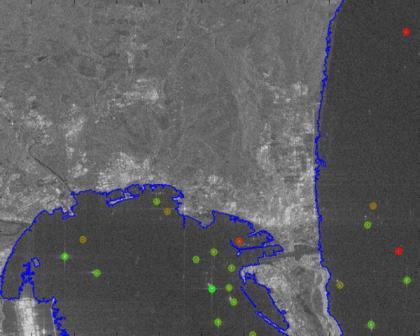
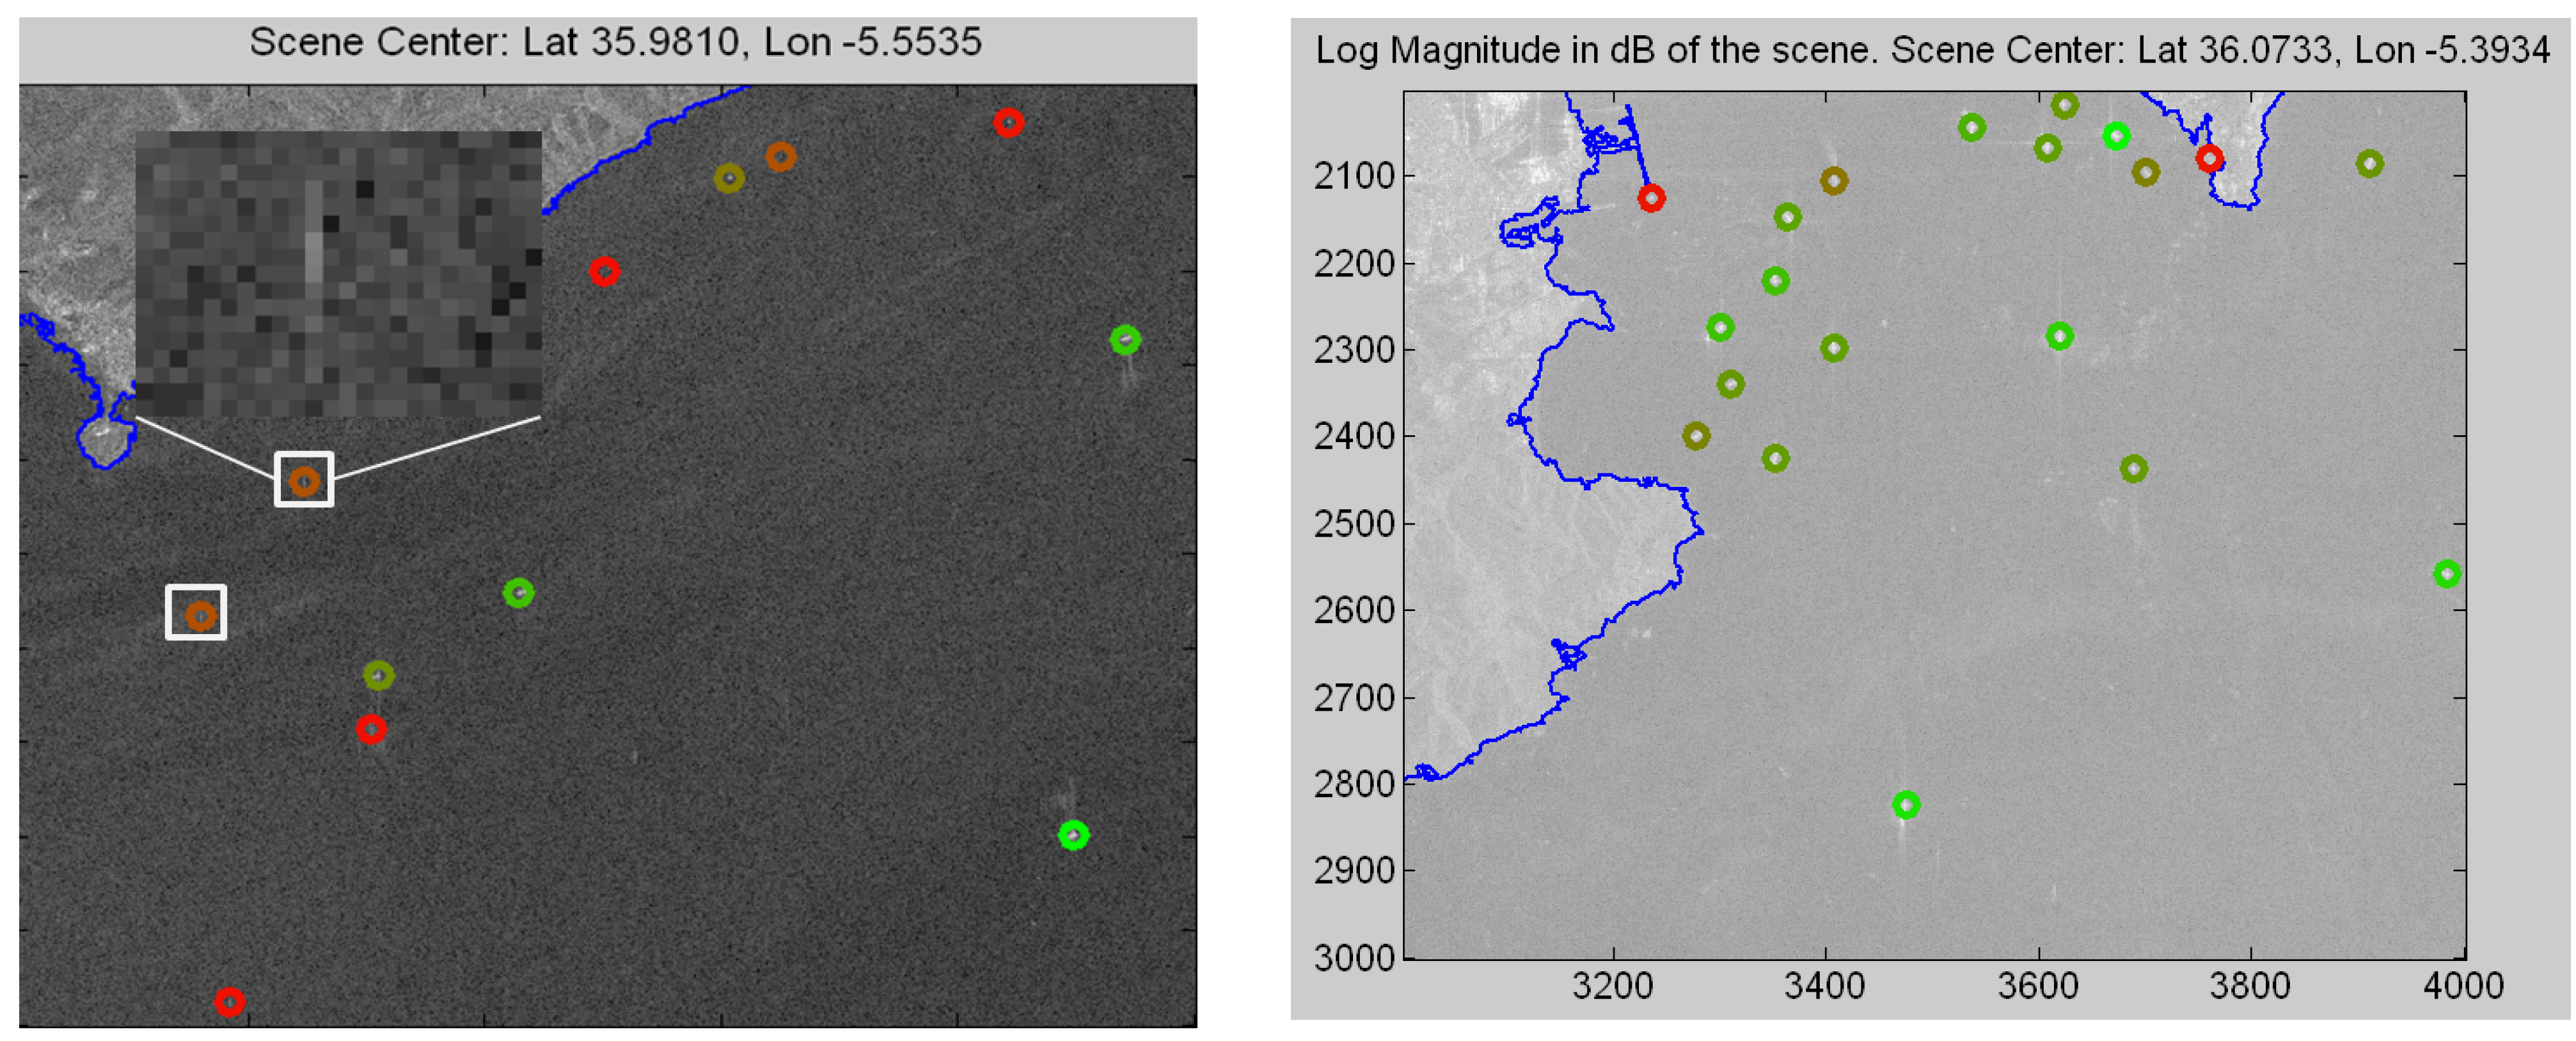
The following figure shows two reports generated for an image of the Strait of Gibraltar. At the left, the image presents ship detections with the associated confidence level (green, yellow and red for high, medium and low confidence, respectively) while, at the right, the layer displays the associated category via a color code where black means unclassified. With these layers, data reports can be filtered according to user preferences and the alarms defined. All of this improves decision making.
Figure 8.
Examples of two types of reports that can be generated.
Figure 8.
Examples of two types of reports that can be generated.
Figure 9.
Web GIS support for SIMONS with single products and future products planning.
Figure 9.
Web GIS support for SIMONS with single products and future products planning.
3.7. Web Interface
Output results are displayed into a private web interface, which has been implemented with OpenSource technologies compliant with OGC. The interface shows the processing results in a simple and handy way through a GIS, which is implemented with open source tools (MapServer and OpenLayers) that adopt geographic standards (WMS and WFS). Users can visualize the information extracted from every single product or review the acquisition data of future products (see
Figure 9). Different interfaces have been designed for element filtering that allow the users to customize the information displayed in the web GIS and included in the reports
4. Results
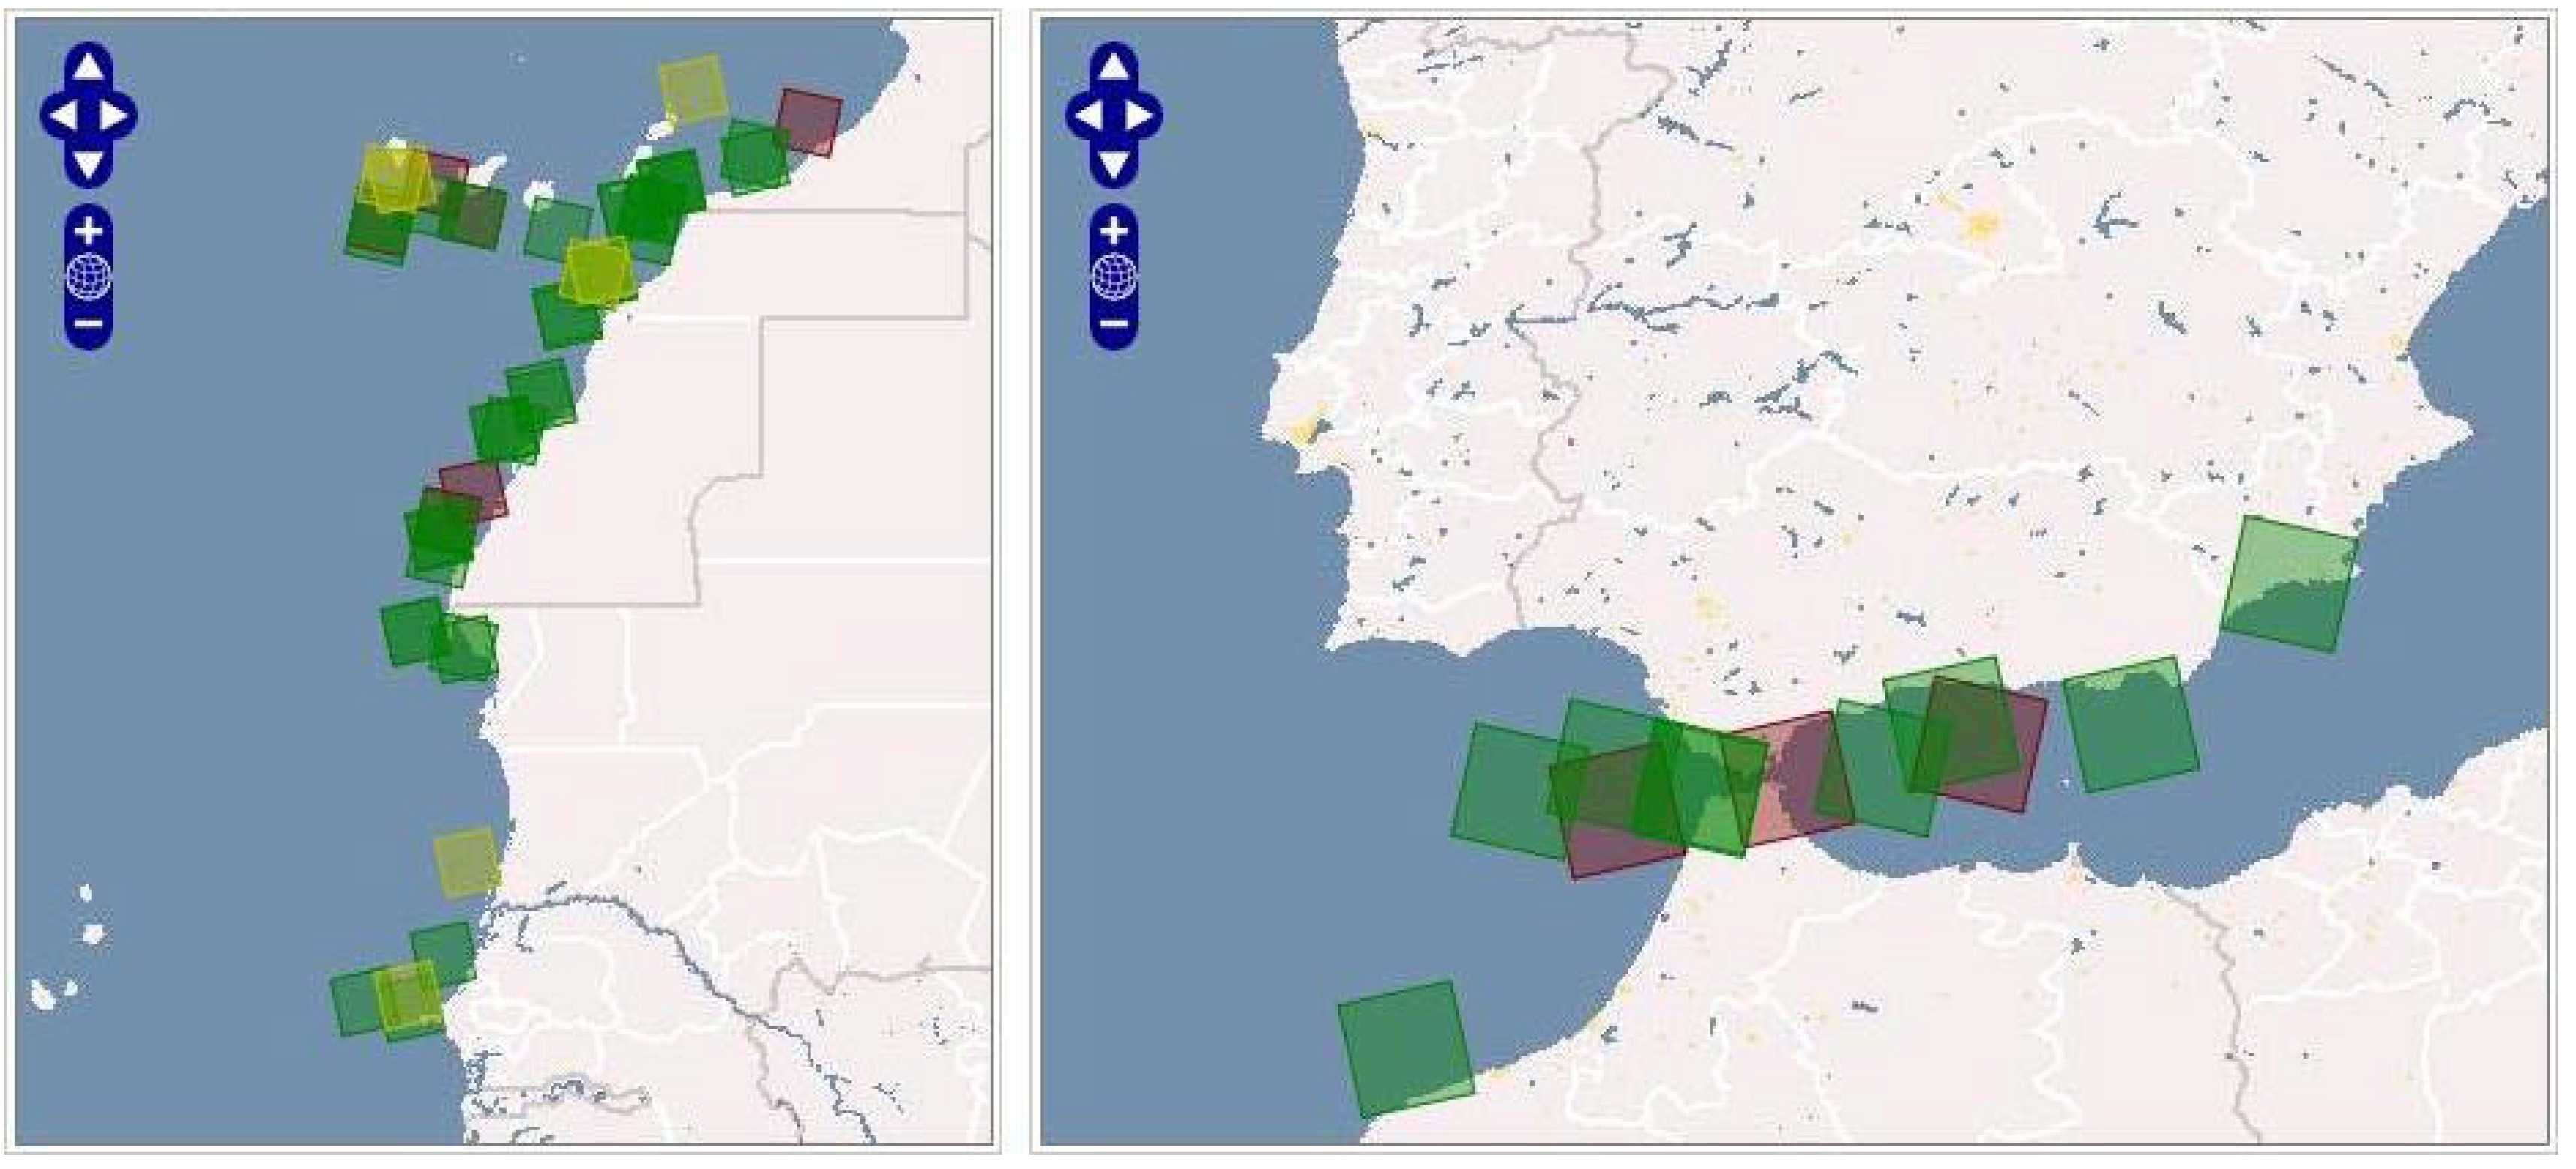
SIMONS is being exploited by different users, mainly Spanish police authorities. In the current phase of the collaboration work, a second version has been recently released and users have found it very interesting for supporting decision making. Around 70 medium resolution (30 m) ERS and ENVISAT images have been processed within an operational environment and up to 140 images are expected to be used at the end of the current phase. The processed data cover the areas depicted in
Figure 10 (Strait of Gibraltar, Mauritania, Canary Islands) and provide the results summarized in
Figure 11,
Figure 12 and
Table 3.
Figure 10.
Mapping of the datasets used in the results shown in
Section 4.
Figure 10.
Mapping of the datasets used in the results shown in
Section 4.
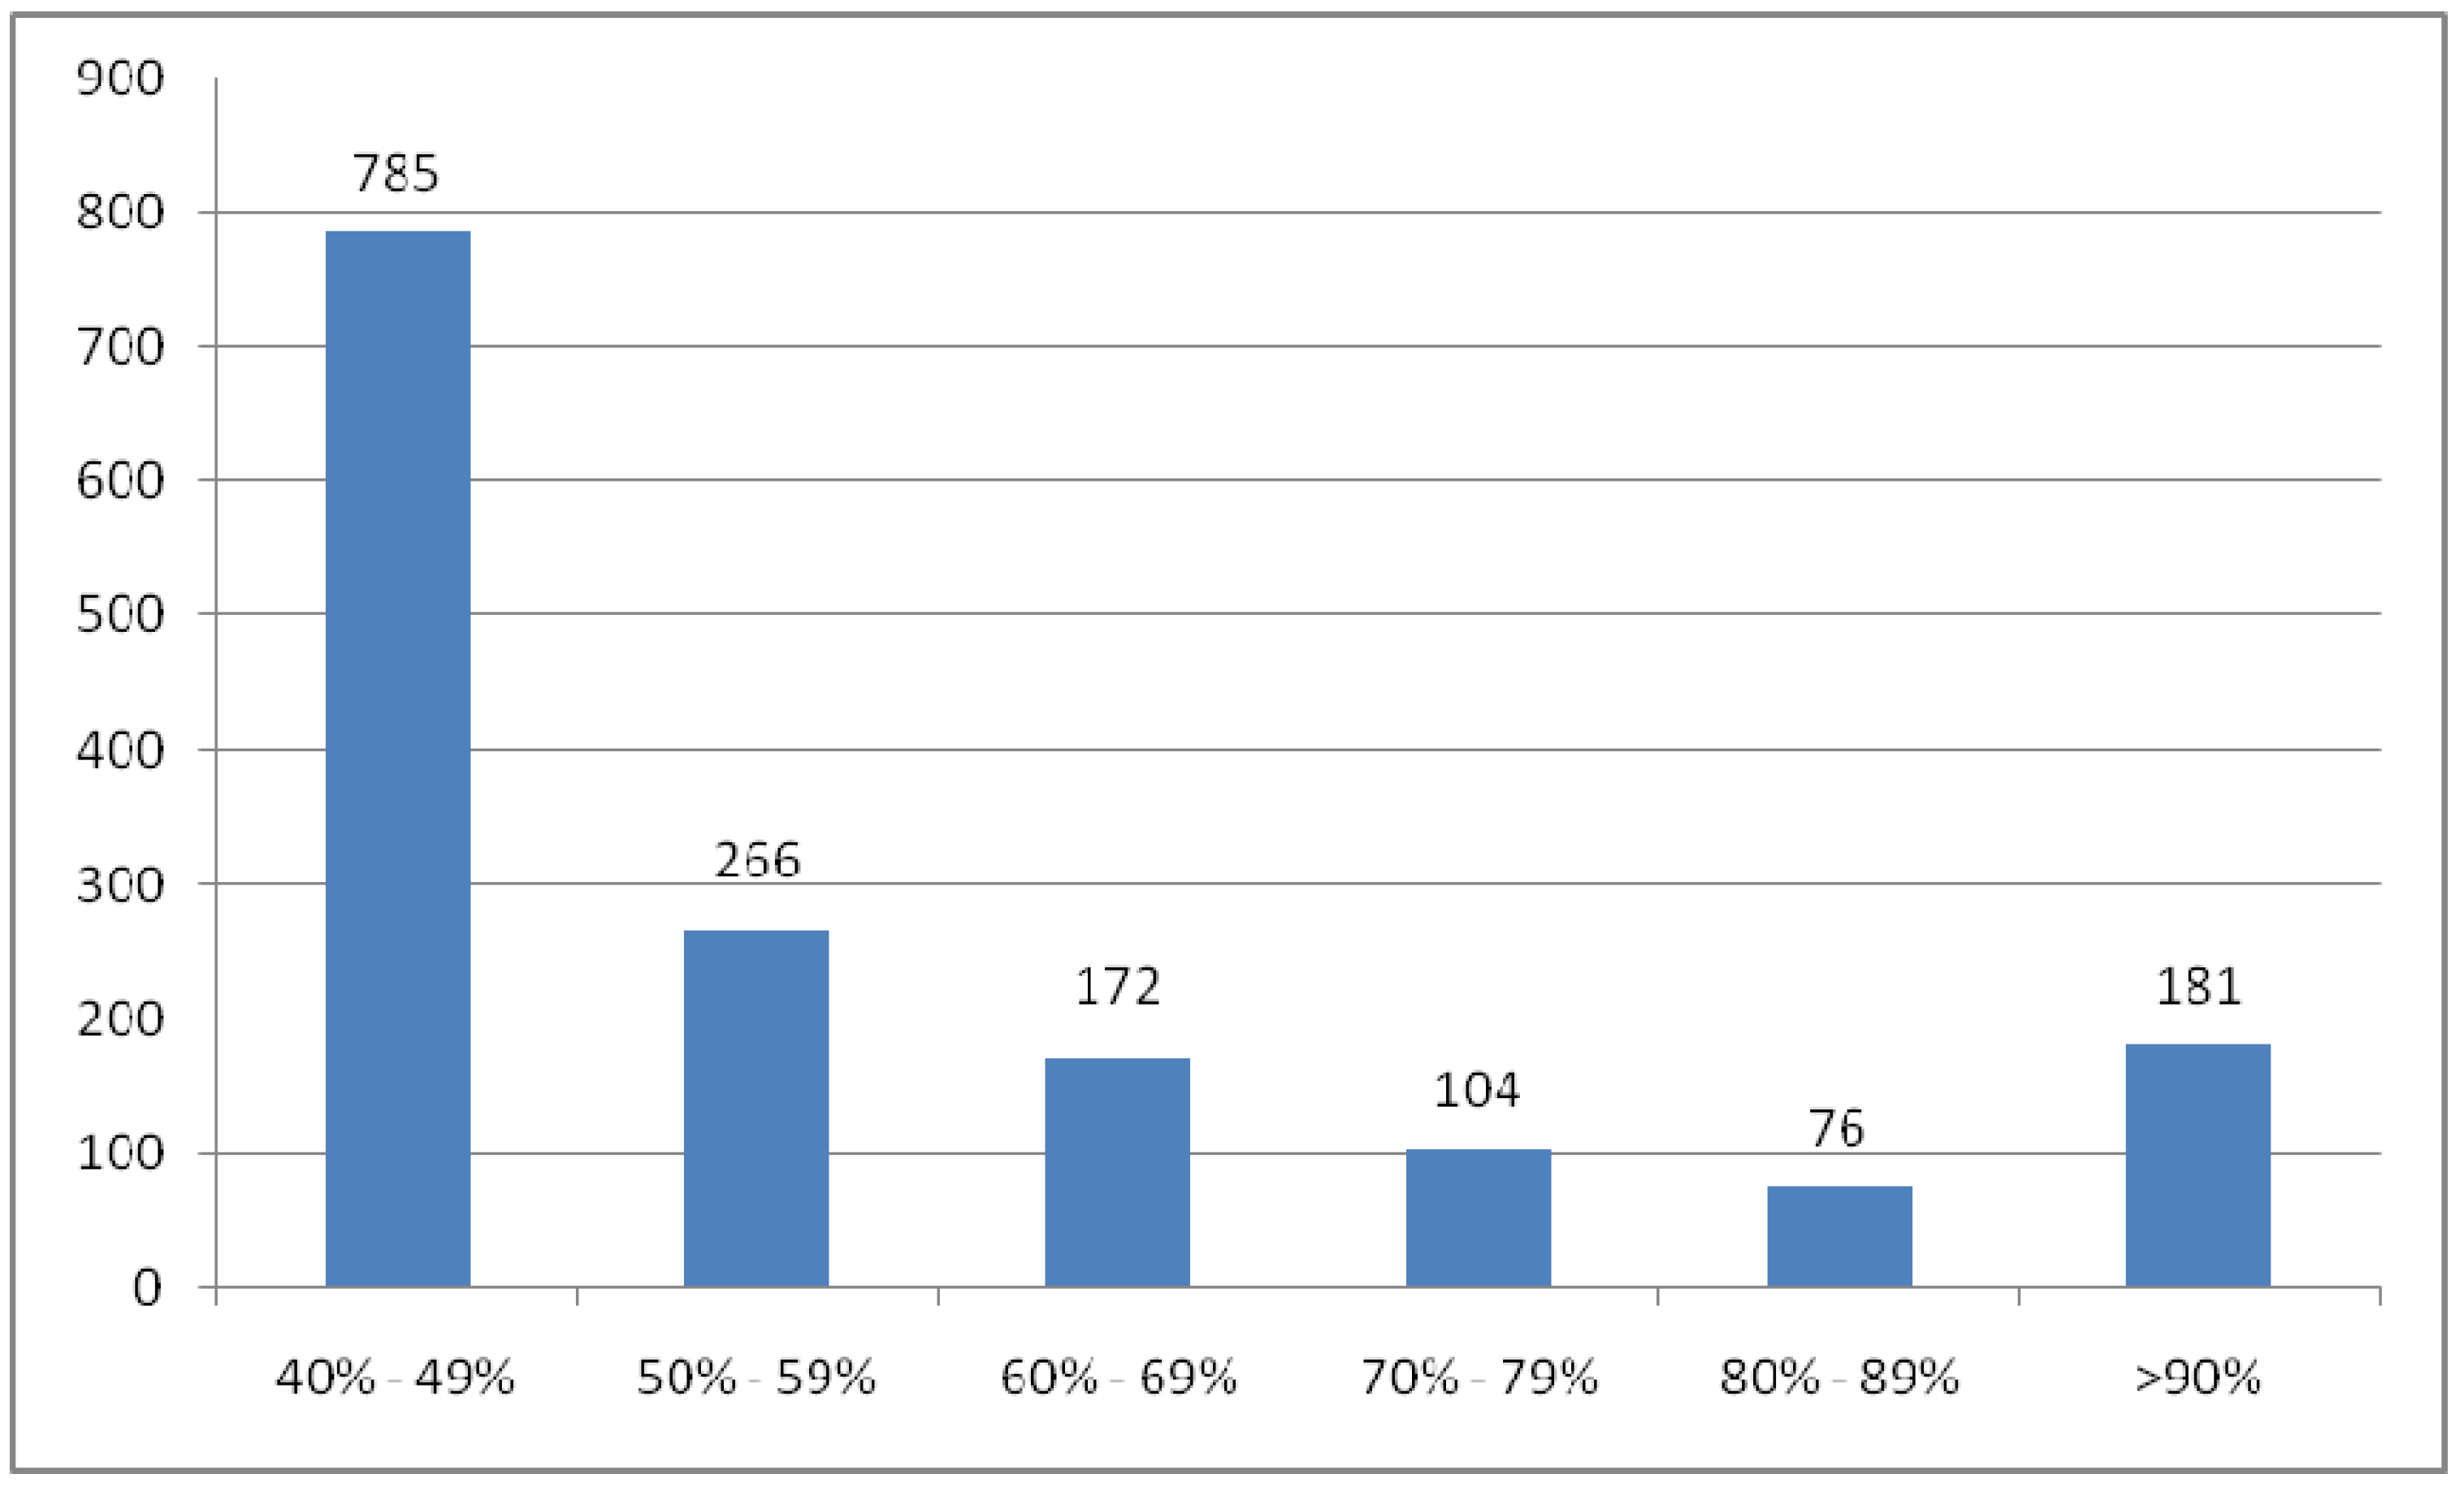
Figure 11.
A graphic showing the distribution of detections along confidence.
Figure 11.
A graphic showing the distribution of detections along confidence.
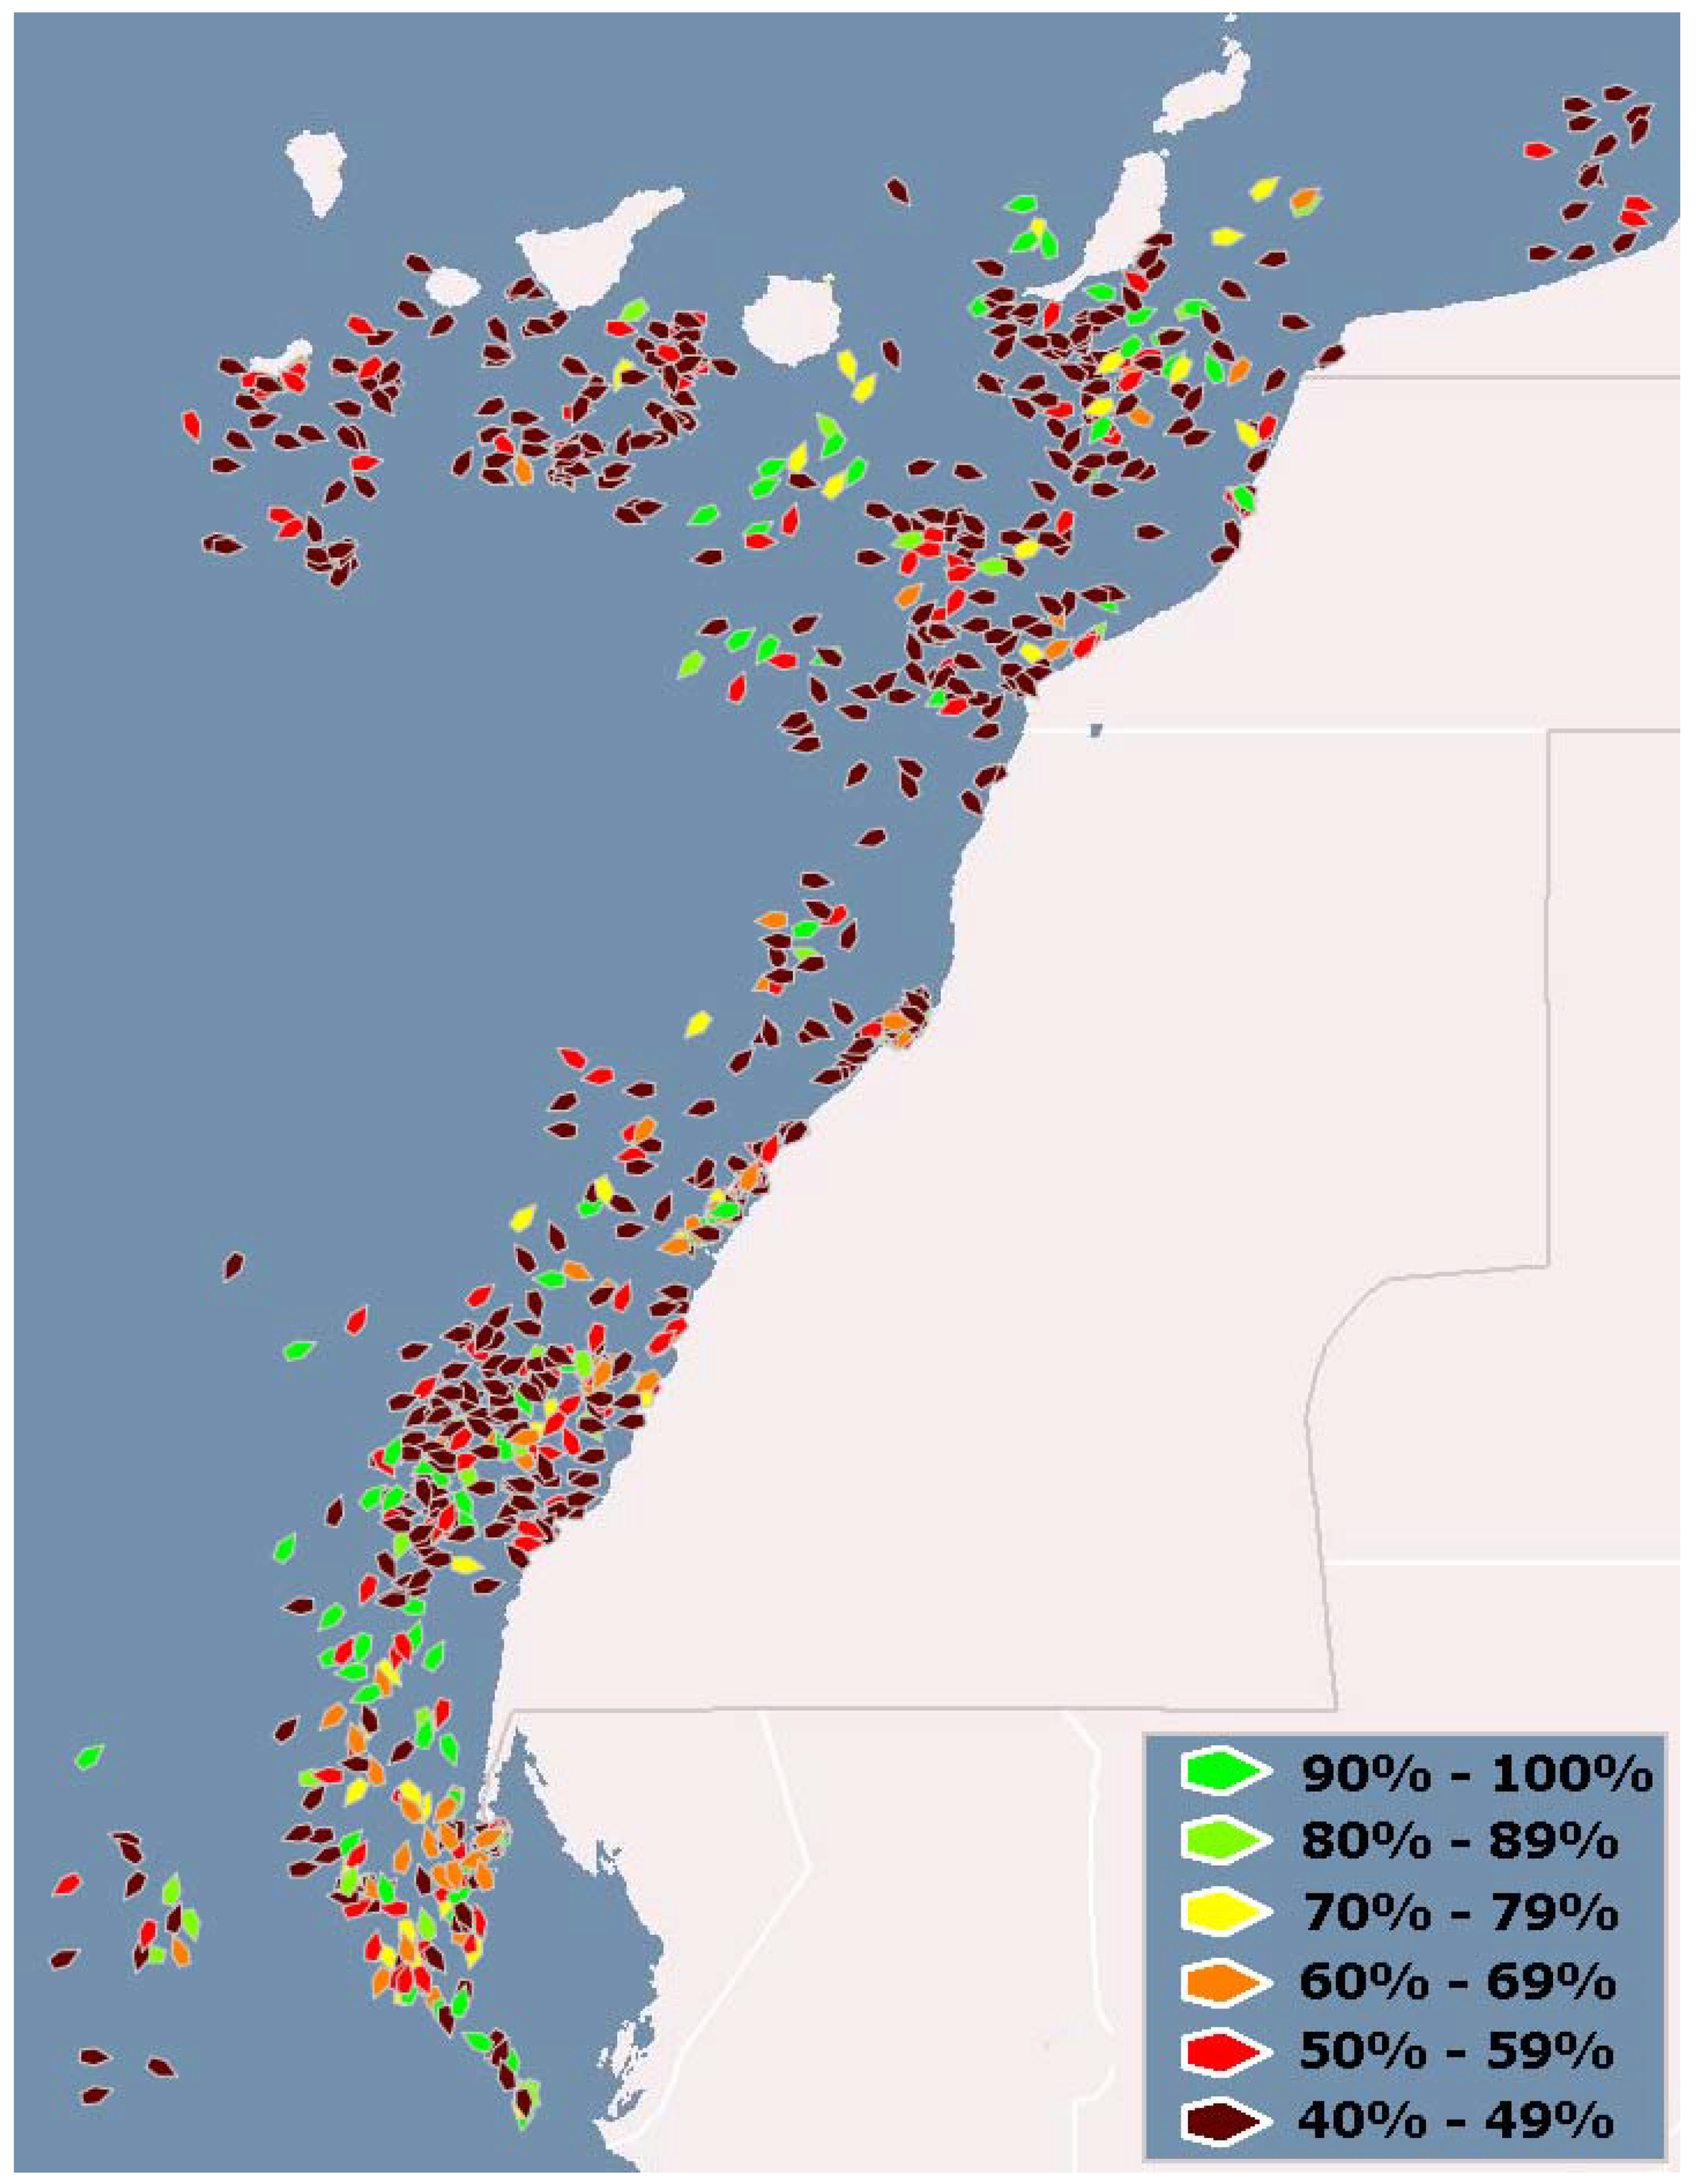
Figure 12.
Detection results for the datasets shown in
Figure 10. Color code indicates the level of confidence.
Figure 12.
Detection results for the datasets shown in
Figure 10. Color code indicates the level of confidence.
Table 3.
Summary of main detection and classification results for the datasets shown in
Figure 10.
Table 3.
Summary of main detection and classification results for the datasets shown in Figure 10.
| Images | detections (confidence>40%) | detections classified | detections classified (confidence >=75%) |
|---|
| 70 | 1,584 | 792 | 439 |
In general, it can be stated that ship detection performs correctly as not only are all the ships that can be identified by eye inspection located, but also other ones less evident. These spots have a set of reflective and geometrical characteristics very similar to those associated with ships despite their low RCS. Their detections are labeled within the category of low confidence 40―49%. Although this category may be the cause of a large number of false positive, it has been included because users are interested in the type of ships leading to such confidence level. An example may be short and less reflective vessels used for immigration activities. A proper image analysis may allow the differentiation between these targets and noise; and this is something expected to be improved in future versions. In the other categories, the number of possible ships is significantly reduced. For the highest confidence category (>90%), most of the detections correspond to large ships which signatures can be isolated by eye inspection.
Regarding classification, around half of the detections have no category assigned. In the cases where a category has been assigned, the positive matches are close to 60% of all the cases. These values can be considered good taking into account the type of processed image, ERS and ENVISAT images with a medium resolution of 30 m. However, further improvements are needed in future works.
Note that system output permits the user to see at a glance where the ships are and which course they are following (see
Figure 12). In addition, color code helps to clearly identify different layers of information, such as detection confidence and the type of ship. As such, the system is highly reliable for improving decision making, as corroborated by users.
5. Conclusions
This paper has presented an operative ship monitoring approach that combines the information obtained from AIS polls with SAR image processing. A state-of-the-art web interface supports output presentation with the aim of increasing user interaction and added-value capabilities. Key functionalities are alarm generation, user profile definition and interactive ship information displaying.
The overall system has been described and some tests have been presented. Proper land masking, accurate ship detection and reliable ship classification has been reached in an algorithm that meets NRT requirements. In addition, the system is fully operational, reliable and unsupervised as no operator is required to control the processing chain. The operator is only required for interpreting the results; a step that becomes straightforward thanks to the large number of information layers provided by the system. Among them, coastline detection, ship category and the confidence assigned to the detected spots are the most important ones. They are key advantages with respect to other monitoring services.
End-users have found the system very advanced for supporting decision making in the field of immigration and ship activities management. With medium resolution single-pol images, encouraging results have been found (high detection ratio plus medium classification ratio). They are expected to be improved with the exploitation of the new generation of SAR sensors, as TerraSAR-X, Cosmo-Skymed or Radarsat-2. Their features permit the detection of small and less reflective ships and tackling automatic ship classification following the seed of recent works [
9,
10].
With this experience, future work trying to fix the following upgrades is envisaged:
To improve coastline detection with a state-of-the-art wavelet-based methodology [
11].
To increase the detection capability of small targets.
To improve ship classification. Key topics regard the revision of ship categories and the associated fuzzy ``sets''. This implies to evaluate if other membership functions and grade distribution (low, medium, high) provide higher classification ratios. The inclusion of additional parameters within the fuzzy processing chain will also be a matter of concern.
To include auto-learning capabilities for generating a database of detection and classification collections. This will be used to train an auto-learning algorithm based on neural networks and/or genetic algorithms. The output of the algorithm will update, if required, the membership functions and the associated grades of the different reference categories.
To include new added-value capabilities, such as ship tracking and route propagation. The former will be tackled via multi-temporal processing algorithms dealing with stacks of SAR images while the latter by using statistical approaches.
To include new data formats, with special concern on TerraSAR-X and Cosmo-Skymed. The improved resolutions and polarimetric capabilities of these data may make advisable to lightly modify the processing approach, especially for ship detection and fuzzy sets.


