Detection and Monitoring of Active Faults in Urban Environments: Time Series Interferometry on the Cities of Patras and Pyrgos (Peloponnese, Greece)


Abstract
:1. Introduction
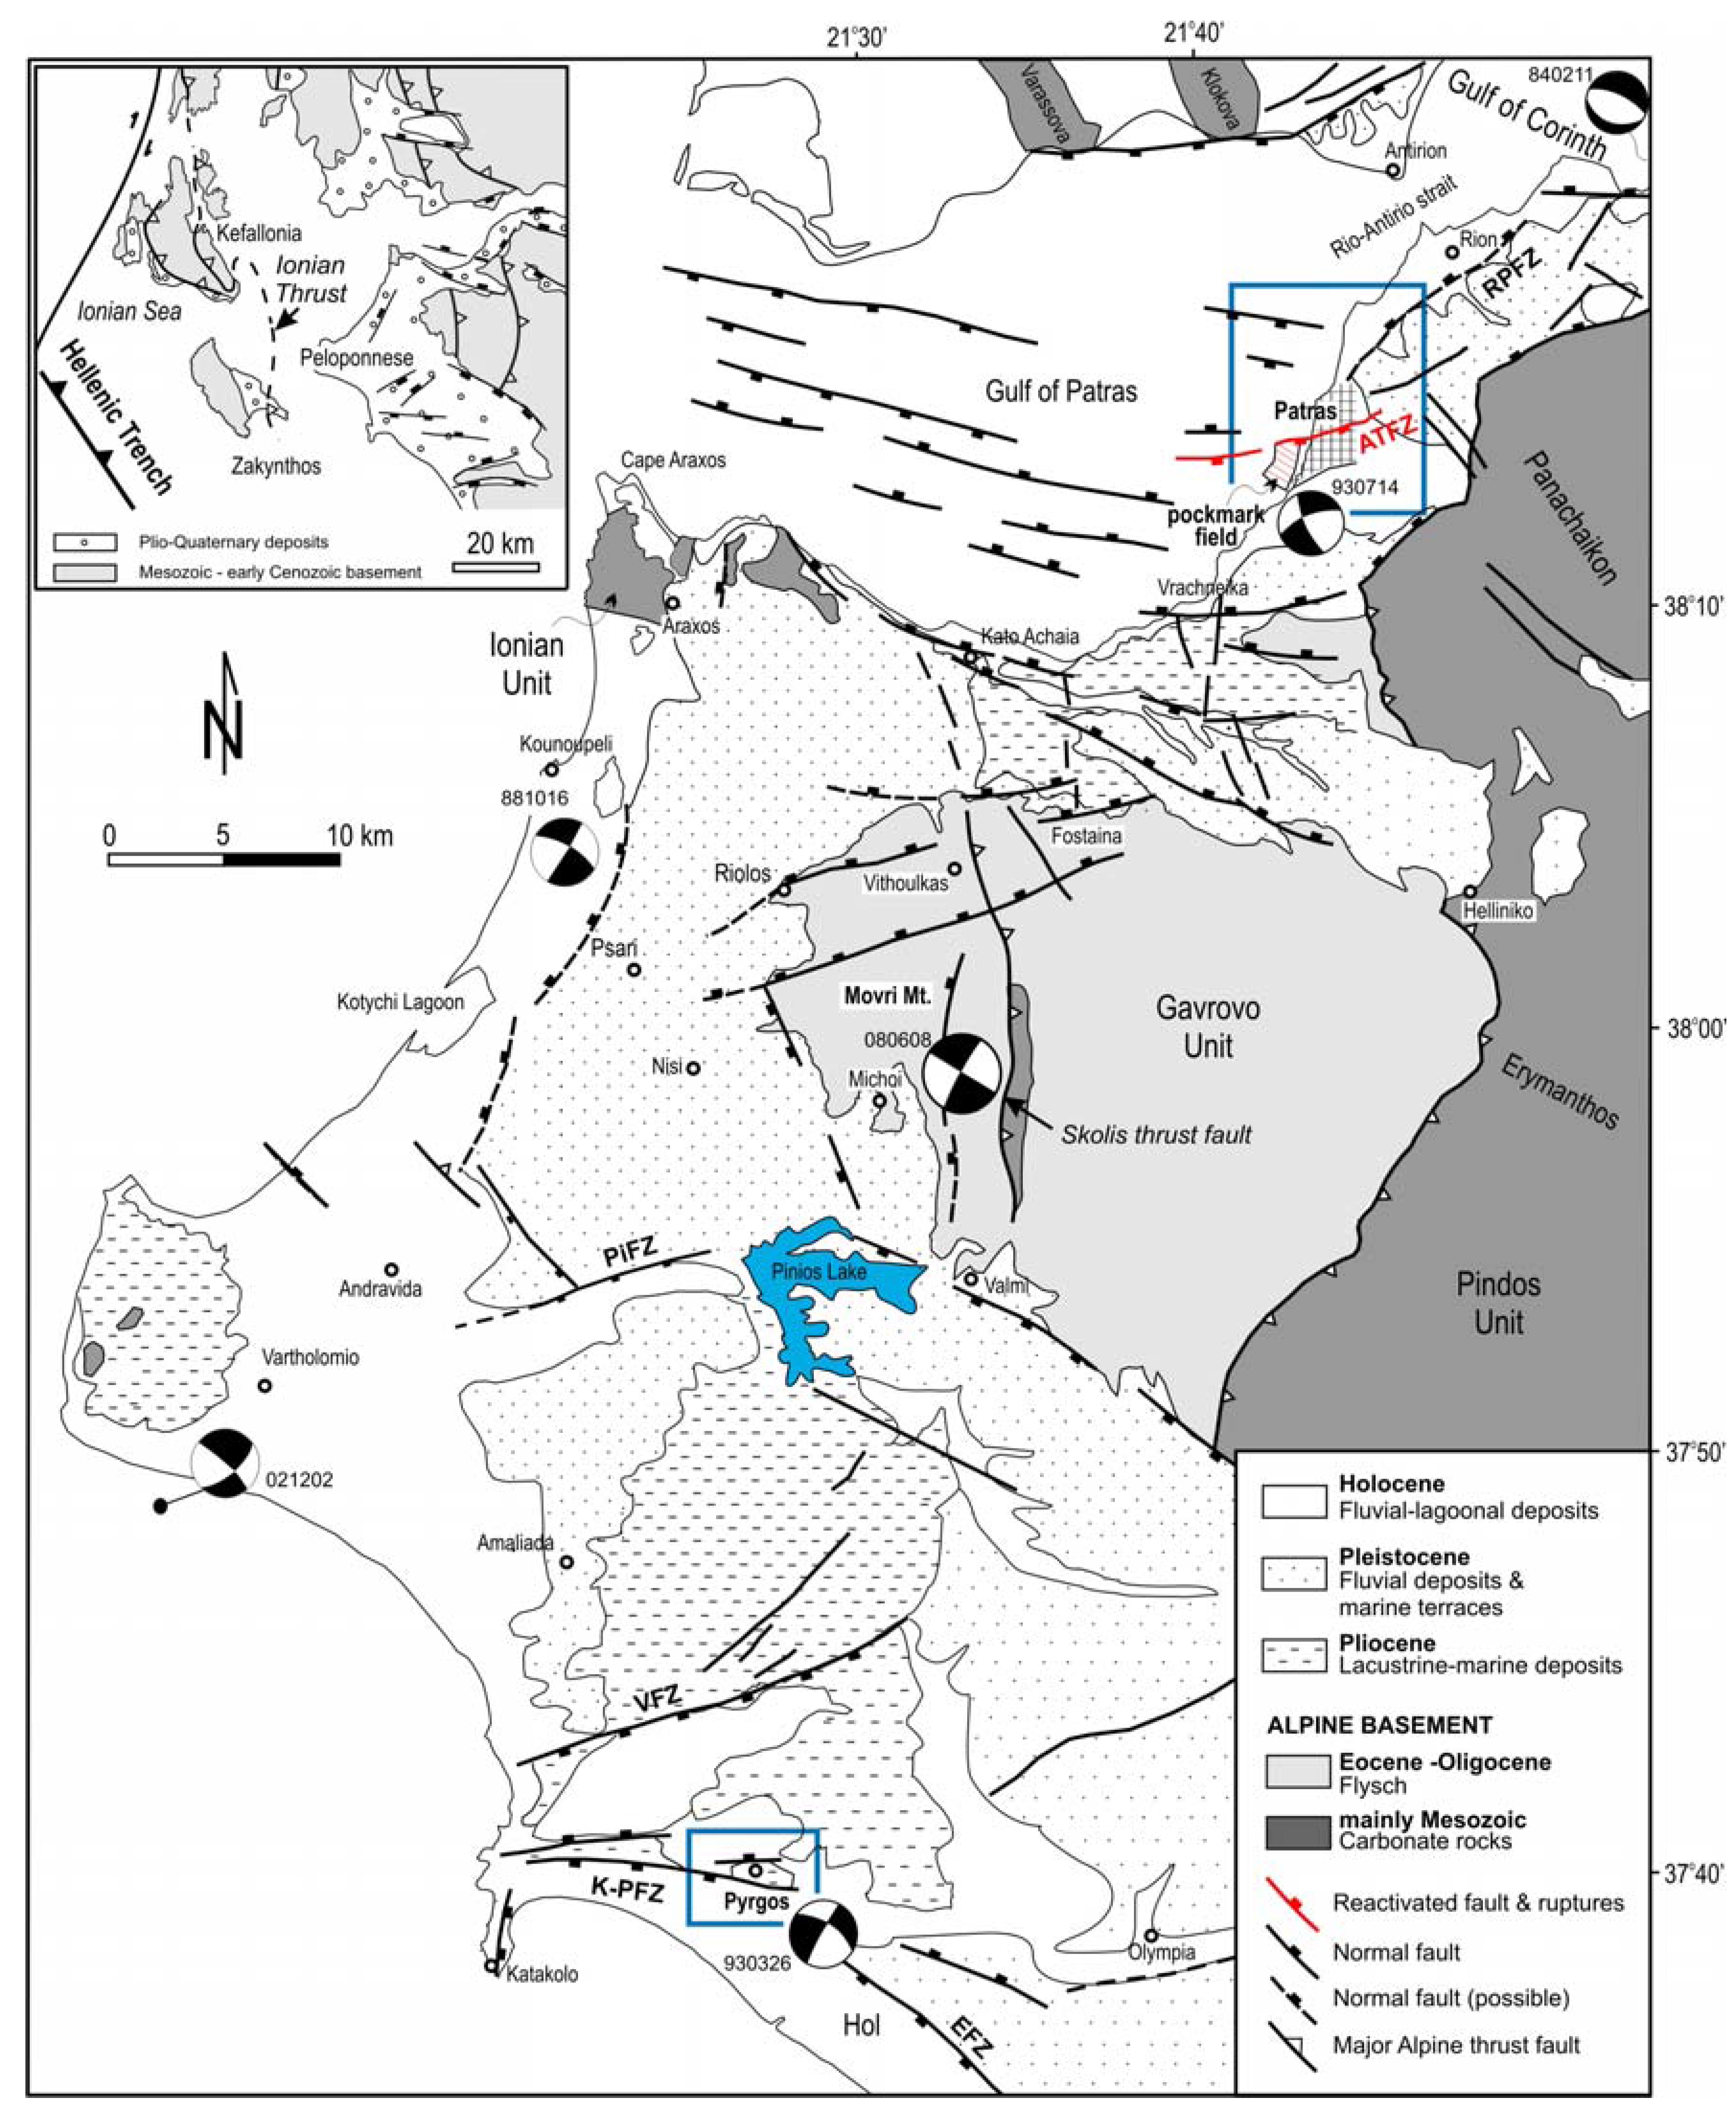
2. Tectonic and Geological framework—Active tectonics
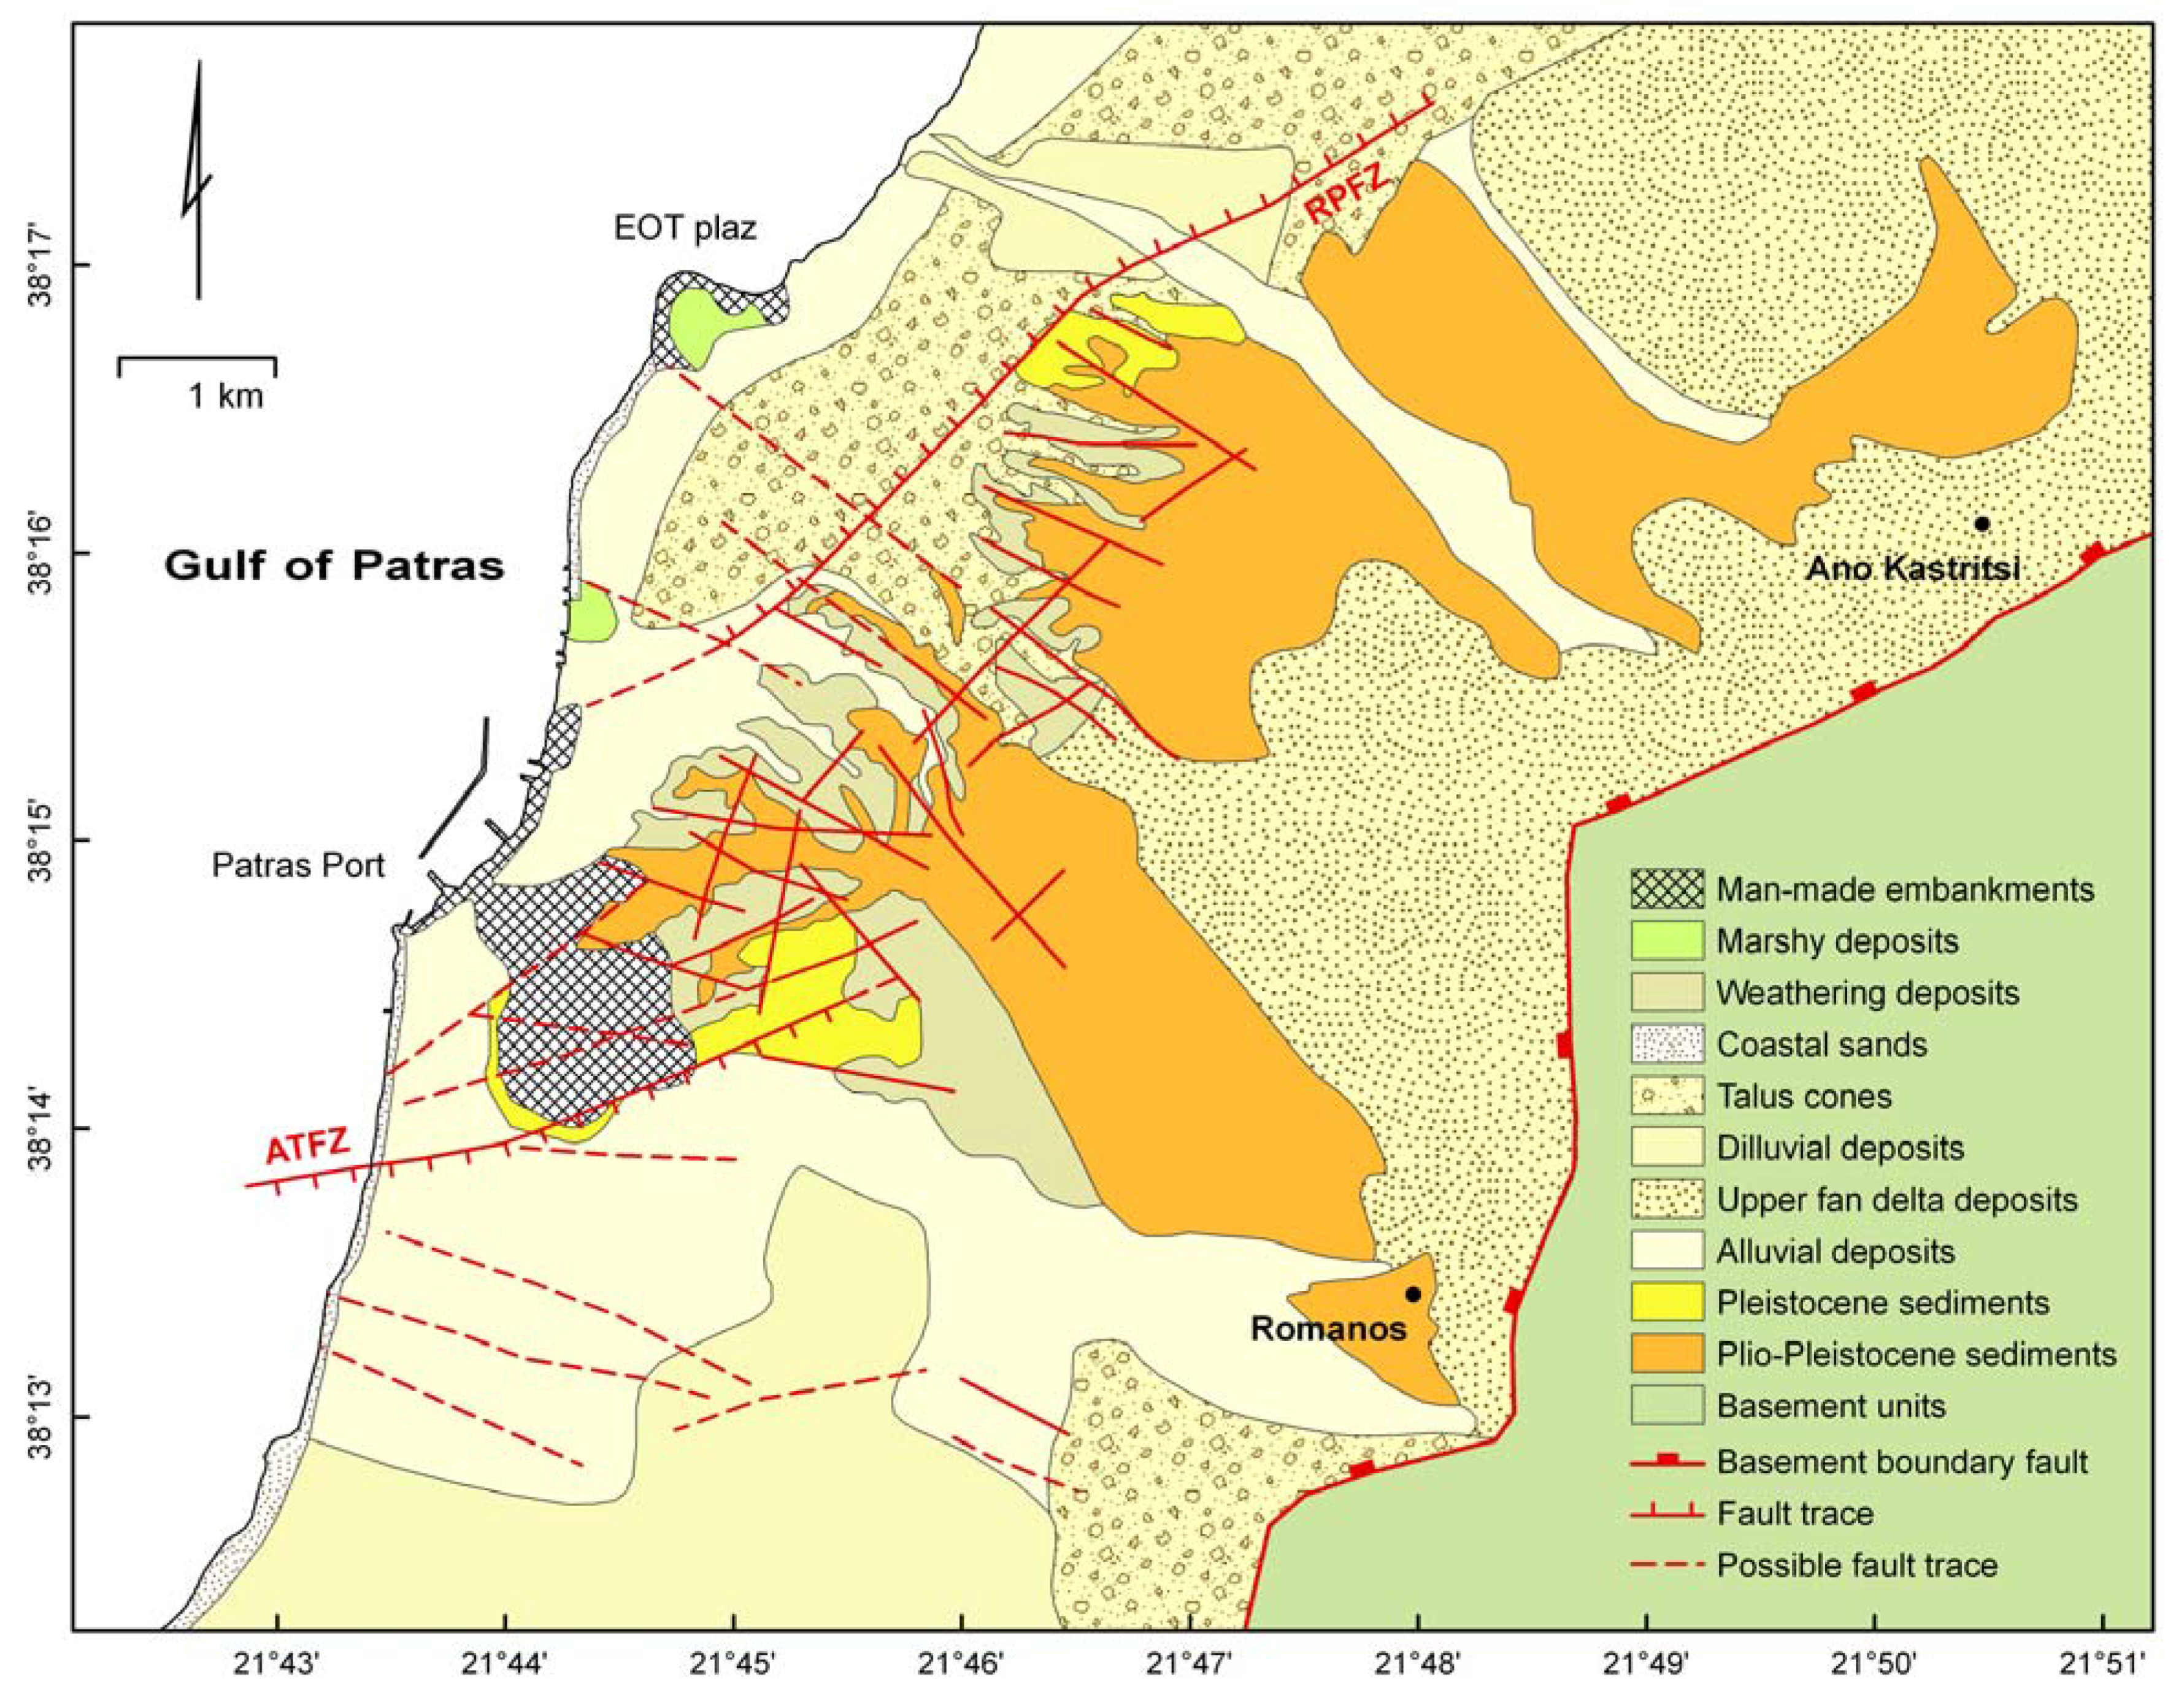
2.1. Patras


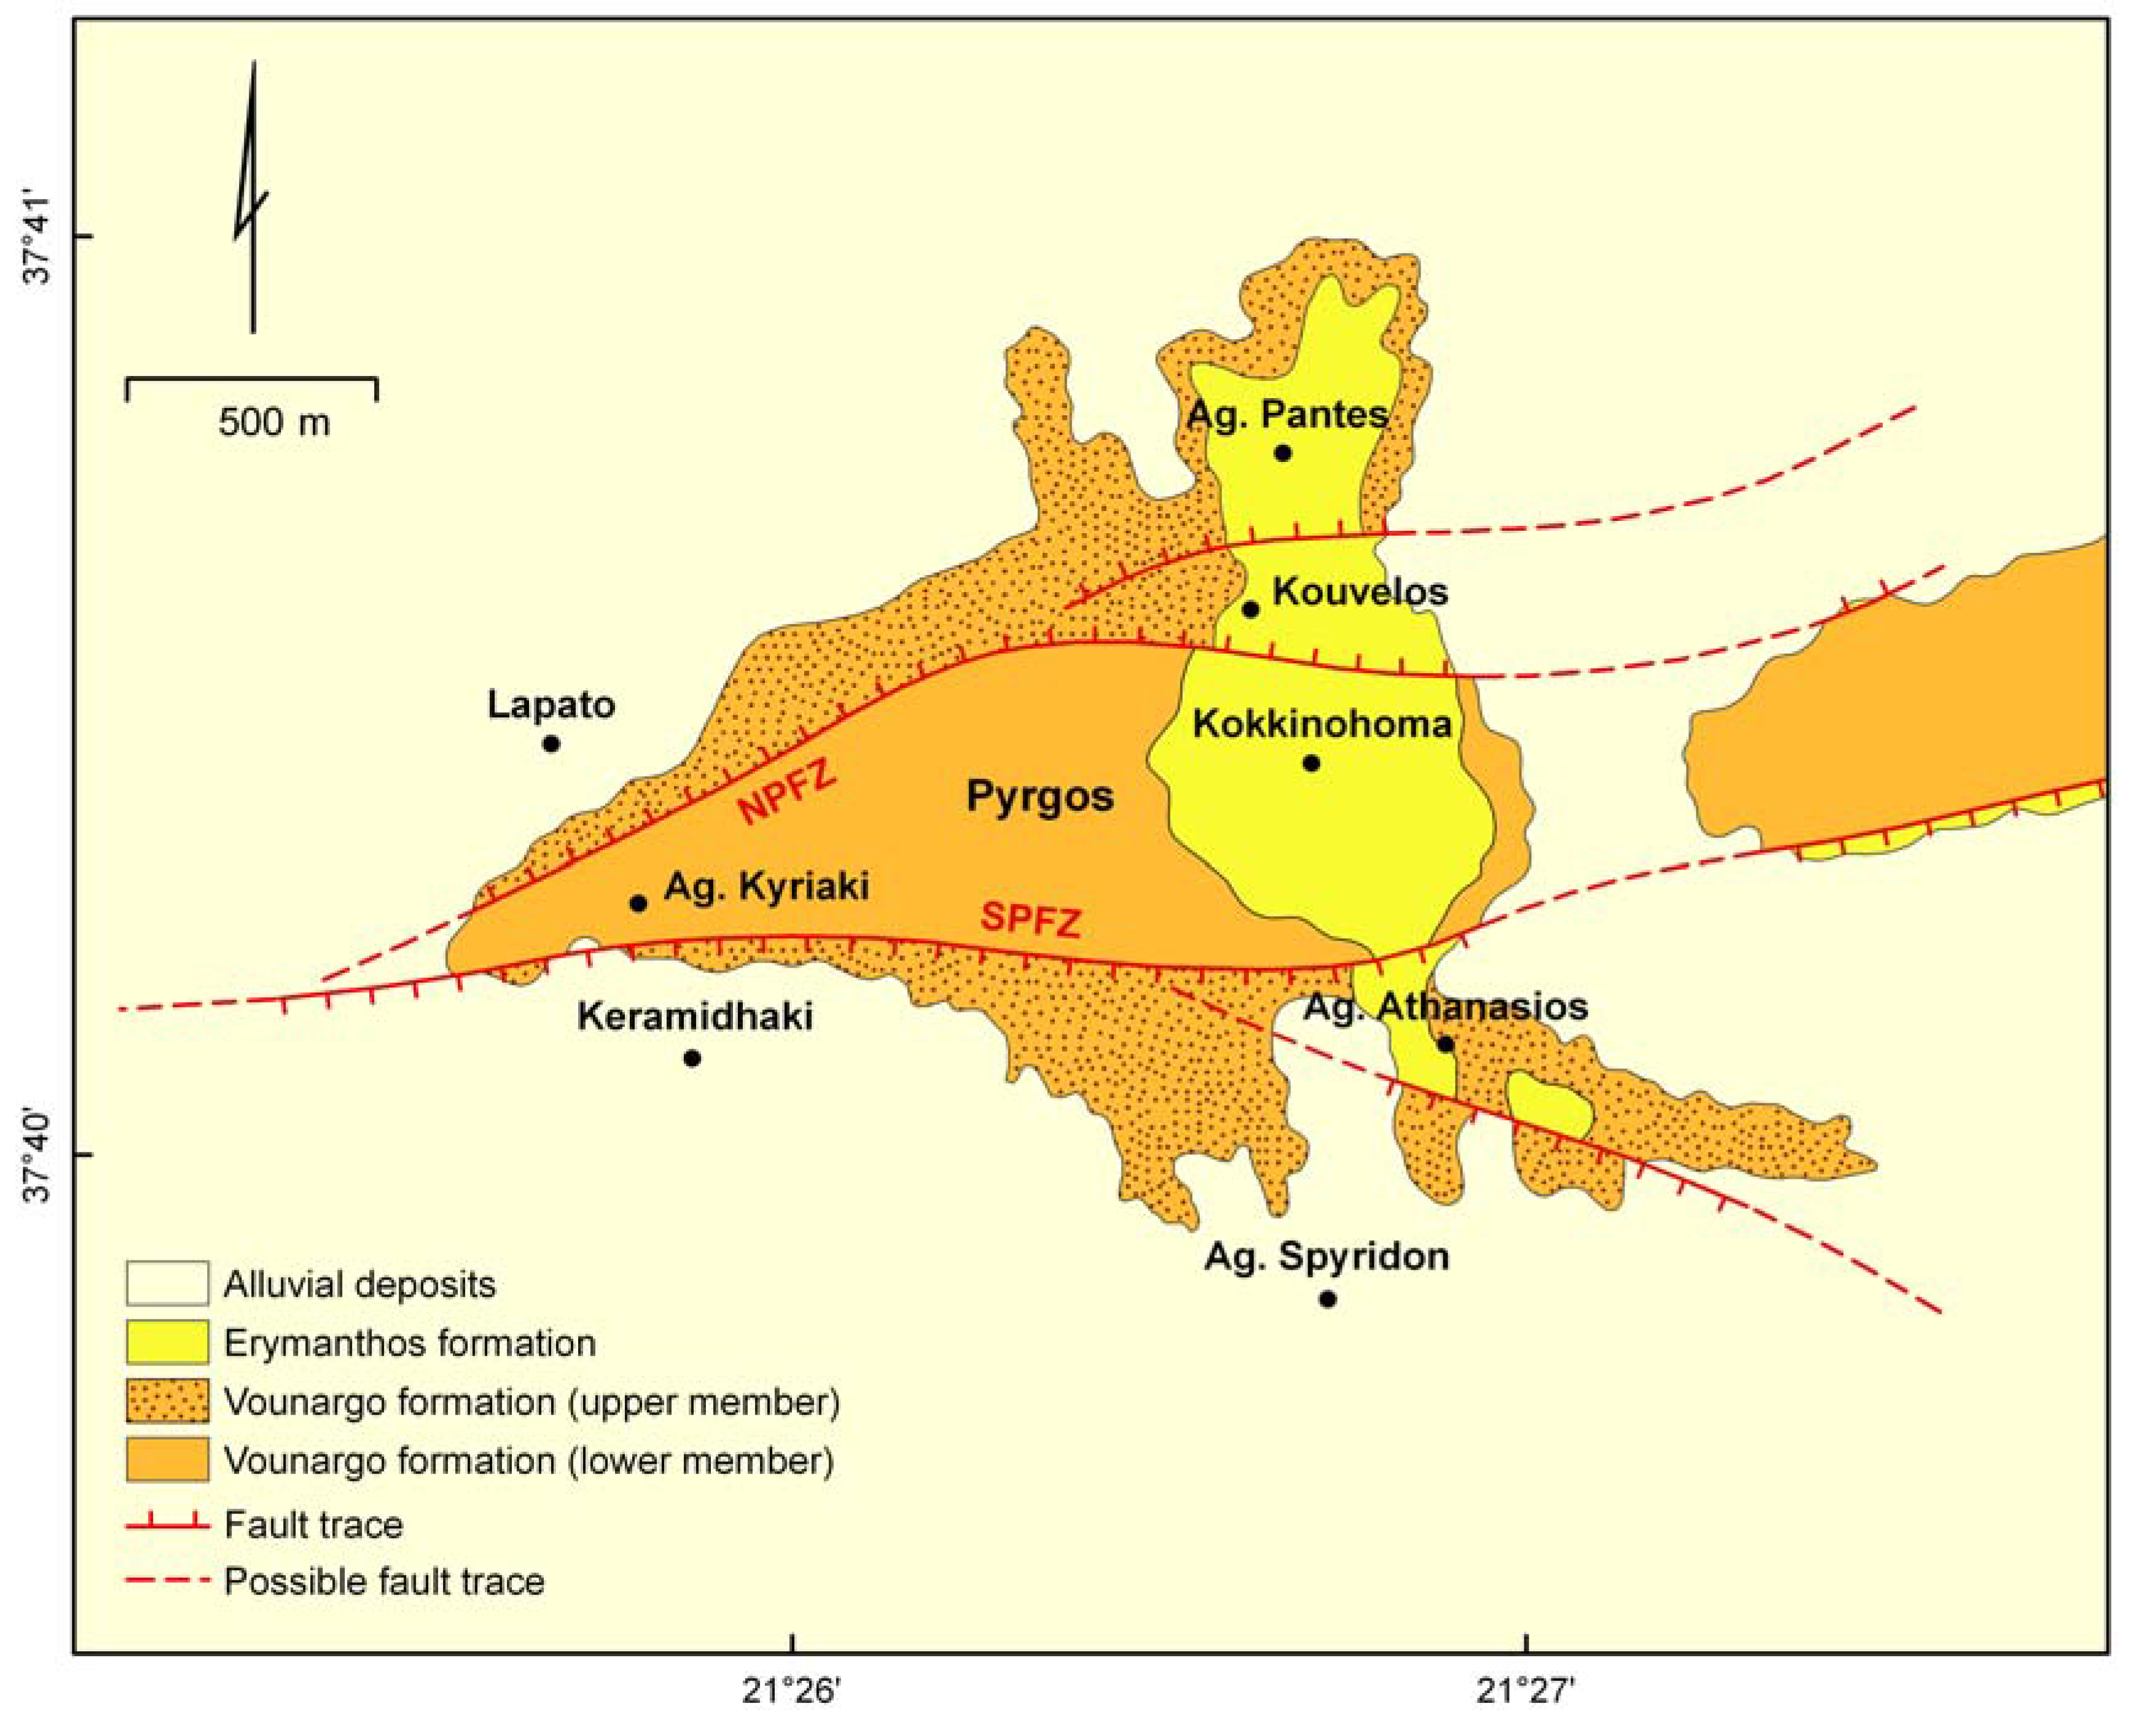
2.2. Pyrgos

3. SAR Interferometric Processing and Anaslysis

| Count | Master (date) | Satellite | Slave (date) | Orbit | Bp (meters) | dT (days) |
| 1 | 03/06/1995 | ERS–1 | 12/11/1992 | 6937 | 73.9 | −933 |
| 2 | 03/06/1995 | ERS–1 | 10/06/1993 | 9943 | −477.4 | −723 |
| 3 | 03/06/1995 | ERS–1 | 19/08/1993 | 10945 | −323.7 | −653 |
| 4 | 03/06/1995 | ERS–1 | 28/10/1993 | 11947 | 569.7 | −583 |
| 5 | 03/06/1995 | ERS–1 | 25/03/1995 | 19305 | −1169.9 | −70 |
| 6 | 03/06/1995 | ERS–1 | 29/04/1995 | 19806 | −518.5 | −35 |
| 7 | 03/06/1995 | ERS–1 | 03/06/1995 | 20307 | 0 | 0 |
| 8 | 03/06/1995 | ERS–1 | 08/07/1995 | 20808 | −583.4 | 35 |
| 9 | 03/06/1995 | ERS–2 | 13/08/1995 | 1636 | 82.9 | 71 |
| 10 | 03/06/1995 | ERS–2 | 17/09/1995 | 2137 | −360.1 | 106 |
| 11 | 03/06/1995 | ERS–1 | 21/10/1995 | 22311 | 761.3 | 140 |
| 12 | 03/06/1995 | ERS–2 | 31/12/1995 | 3640 | 186.2 | 211 |
| 13 | 03/06/1995 | ERS–2 | 19/05/1996 | 5644 | 71.0 | 351 |
| 14 | 03/06/1995 | ERS–2 | 23/06/1996 | 6145 | −83.8 | 386 |
| 15 | 03/06/1995 | ERS–2 | 01/09/1996 | 7147 | −514.6 | 456 |
| 16 | 03/06/1995 | ERS–2 | 06/10/1996 | 7648 | −392.7 | 491 |
| 17 | 03/06/1995 | ERS–2 | 10/11/1996 | 8149 | 1064.9 | 526 |
| 18 | 03/06/1995 | ERS–2 | 15/12/1996 | 8650 | −309.2 | 561 |
| 19 | 03/06/1995 | ERS–2 | 19/01/1997 | 9151 | −28.7 | 596 |
| 20 | 03/06/1995 | ERS–2 | 23/02/1997 | 9652 | −182.3 | 631 |
| 21 | 03/06/1995 | ERS–2 | 04/05/1997 | 10654 | −360.3 | 701 |
| 22 | 03/06/1995 | ERS–2 | 08/06/1997 | 11155 | −166.9 | 736 |
| 23 | 03/06/1995 | ERS–2 | 13/07/1997 | 11656 | −124.9 | 771 |
| 24 | 03/06/1995 | ERS–2 | 17/03/1997 | 12157 | 111.5 | 806 |
| 25 | 03/06/1995 | ERS–2 | 21/09/1997 | 12658 | −263.2 | 841 |
| 26 | 03/06/1995 | ERS–2 | 30/11/1997 | 13660 | 177.5 | 911 |
| 27 | 03/06/1995 | ERS–2 | 04/01/1998 | 14161 | 116.4 | 946 |
| 28 | 03/06/1995 | ERS–2 | 19/04/1998 | 15664 | 193.1 | 1051 |
| 29 | 03/06/1995 | ERS–2 | 24/05/1998 | 16165 | −160.7 | 1086 |
| 30 | 03/06/1995 | ERS–2 | 28/06/1998 | 16666 | −834.9 | 1121 |
| 31 | 03/06/1995 | ERS–2 | 02/08/1998 | 17167 | 56.7 | 1156 |
| 32 | 03/06/1995 | ERS–2 | 06/09/1998 | 17668 | 47.0 | 1191 |
| 33 | 03/06/1995 | ERS–2 | 28/02/1999 | 20173 | 302.9 | 1366 |
| 34 | 03/06/1995 | ERS–2 | 13/06/1999 | 21676 | −559.8 | 1471 |
| 35 | 03/06/1995 | ERS–2 | 18/07/1999 | 22177 | 455.9 | 1506 |
| 36 | 03/06/1995 | ERS–2 | 22/08/1999 | 22678 | 1012,1 | 1541 |
| 37 | 03/06/1995 | ERS–2 | 26/09/1999 | 23179 | 448.6 | 1576 |
| 38 | 03/06/1995 | ERS–2 | 31/10/1999 | 23680 | 357.3 | 1611 |
| 39 | 03/06/1995 | ERS–2 | 05/12/1999 | 24181 | −121.9 | 1646 |
| 40 | 03/06/1995 | ERS–2 | 09/01/2000 | 24682 | −140.1 | 1681 |
| 41 | 03/06/1995 | ERS–2 | 23/04/2000 | 26185 | 953.7 | 1786 |
| 42 | 03/06/1995 | ERS–2 | 28/05/2000 | 26686 | 806.6 | 1821 |
| Count | Master (date) | Satellite | Slave (date) | Orbit | Bp (meters) | dT (days) |
| 1 | 17/8/1997 | ERS–1 | 12/11/1992 | 6937 | −44.7 | −1739 |
| 2 | 17/8/1997 | ERS–1 | 10/6/1993 | 9943 | −581.5 | −1529 |
| 3 | 17/8/1997 | ERS–1 | 19/8/1993 | 10945 | −432.0 | −1459 |
| 4 | 17/8/1997 | ERS–1 | 28/10/1993 | 11947 | 455.7 | −1389 |
| 5 | 17/8/1997 | ERS–1 | 25/3/1995 | 19305 | −1274.8 | −876 |
| 6 | 17/8/1997 | ERS–1 | 29/4/1995 | 19806 | −624.8 | −841 |
| 7 | 17/8/1997 | ERS–1 | 3/6/1995 | 20307 | −107.5 | −806 |
| 8 | 17/8/1997 | ERS–2 | 13/8/1995 | 1636 | −28.5 | −735 |
| 9 | 17/8/1997 | ERS–1 | 21/10/1995 | 22311 | 653.7 | −666 |
| 10 | 17/8/1997 | ERS–1 | 18/5/1996 | 25317 | 39.4 | −456 |
| 11 | 17/8/1997 | ERS–2 | 23/6/1996 | 6145 | −196.6 | −420 |
| 12 | 17/8/1997 | ERS–2 | 1/9/1996 | 7147 | −622.8 | −350 |
| 13 | 17/8/1997 | ERS–2 | 10/11/1996 | 8149 | 954.8 | −280 |
| 14 | 17/8/1997 | ERS–2 | 15/12/1996 | 8650 | −415.3 | −245 |
| 15 | 17/8/1997 | ERS–2 | 19/1/1997 | 9151 | −139.1 | −210 |
| 16 | 17/8/1997 | ERS–2 | 23/2/1997 | 9652 | −288.6 | −175 |
| 17 | 17/8/1997 | ERS–2 | 4/5/1997 | 10654 | −466.7 | −105 |
| 18 | 17/8/1997 | ERS–2 | 8/6/1997 | 11155 | −276.1 | −70 |
| 19 | 17/8/1997 | ERS–2 | 13/7/1997 | 11656 | −235.9 | −35 |
| 20 | 17/8/1997 | ERS–2 | 17/8/1997 | 12157 | 0 | 0 |
| 21 | 17/8/1997 | ERS–2 | 21/9/1997 | 12658 | −370.4 | 35 |
| 22 | 17/8/1997 | ERS–2 | 30/11/1997 | 13660 | 63.3 | 105 |
| 23 | 17/8/1997 | ERS–2 | 4/1/1998 | 14161 | 9.9 | 140 |
| 24 | 17/8/1997 | ERS–2 | 19/4/1998 | 15664 | 78.8 | 245 |
| 25 | 17/8/1997 | ERS–2 | 24/5/1998 | 16165 | −271.3 | 280 |
| 26 | 17/8/1997 | ERS–2 | 28/6/1998 | 16666 | −941.3 | 315 |
| 27 | 17/8/1997 | ERS–2 | 2/8/1998 | 17167 | −47.8 | 350 |
| 28 | 17/8/1997 | ERS–2 | 6/9/1998 | 17668 | −60.7 | 385 |
| 29 | 17/8/1997 | ERS–2 | 28/2/1999 | 20173 | 186.5 | 560 |
| 30 | 17/8/1997 | ERS–2 | 13/6/1999 | 21676 | −674.8 | 665 |
| 31 | 17/8/1997 | ERS–2 | 18/7/1999 | 22177 | 341.6 | 700 |
| 32 | 17/8/1997 | ERS–2 | 22/8/1999 | 22678 | 898.1 | 735 |
| 33 | 17/8/1997 | ERS–2 | 26/9/1999 | 23179 | 345.9 | 770 |
| 34 | 17/8/1997 | ERS–2 | 31/10/1999 | 23680 | 247.4 | 805 |
| 35 | 17/8/1997 | ERS–2 | 5/12/1999 | 24181 | −236.6 | 840 |
| 36 | 17/8/1997 | ERS–2 | 9/1/2000 | 24682 | −247.4 | 875 |
| 37 | 17/8/1997 | ERS–2 | 23/4/2000 | 26185 | 838.9 | 980 |
| 38 | 17/8/1997 | ERS–2 | 19/11/2000 | 29191 | 839.0 | 1190 |
| 39 | 17/8/1997 | ERS–2 | 24/12/2000 | 29692 | −567.1 | 1225 |
3.1. Interferometric point target analysis
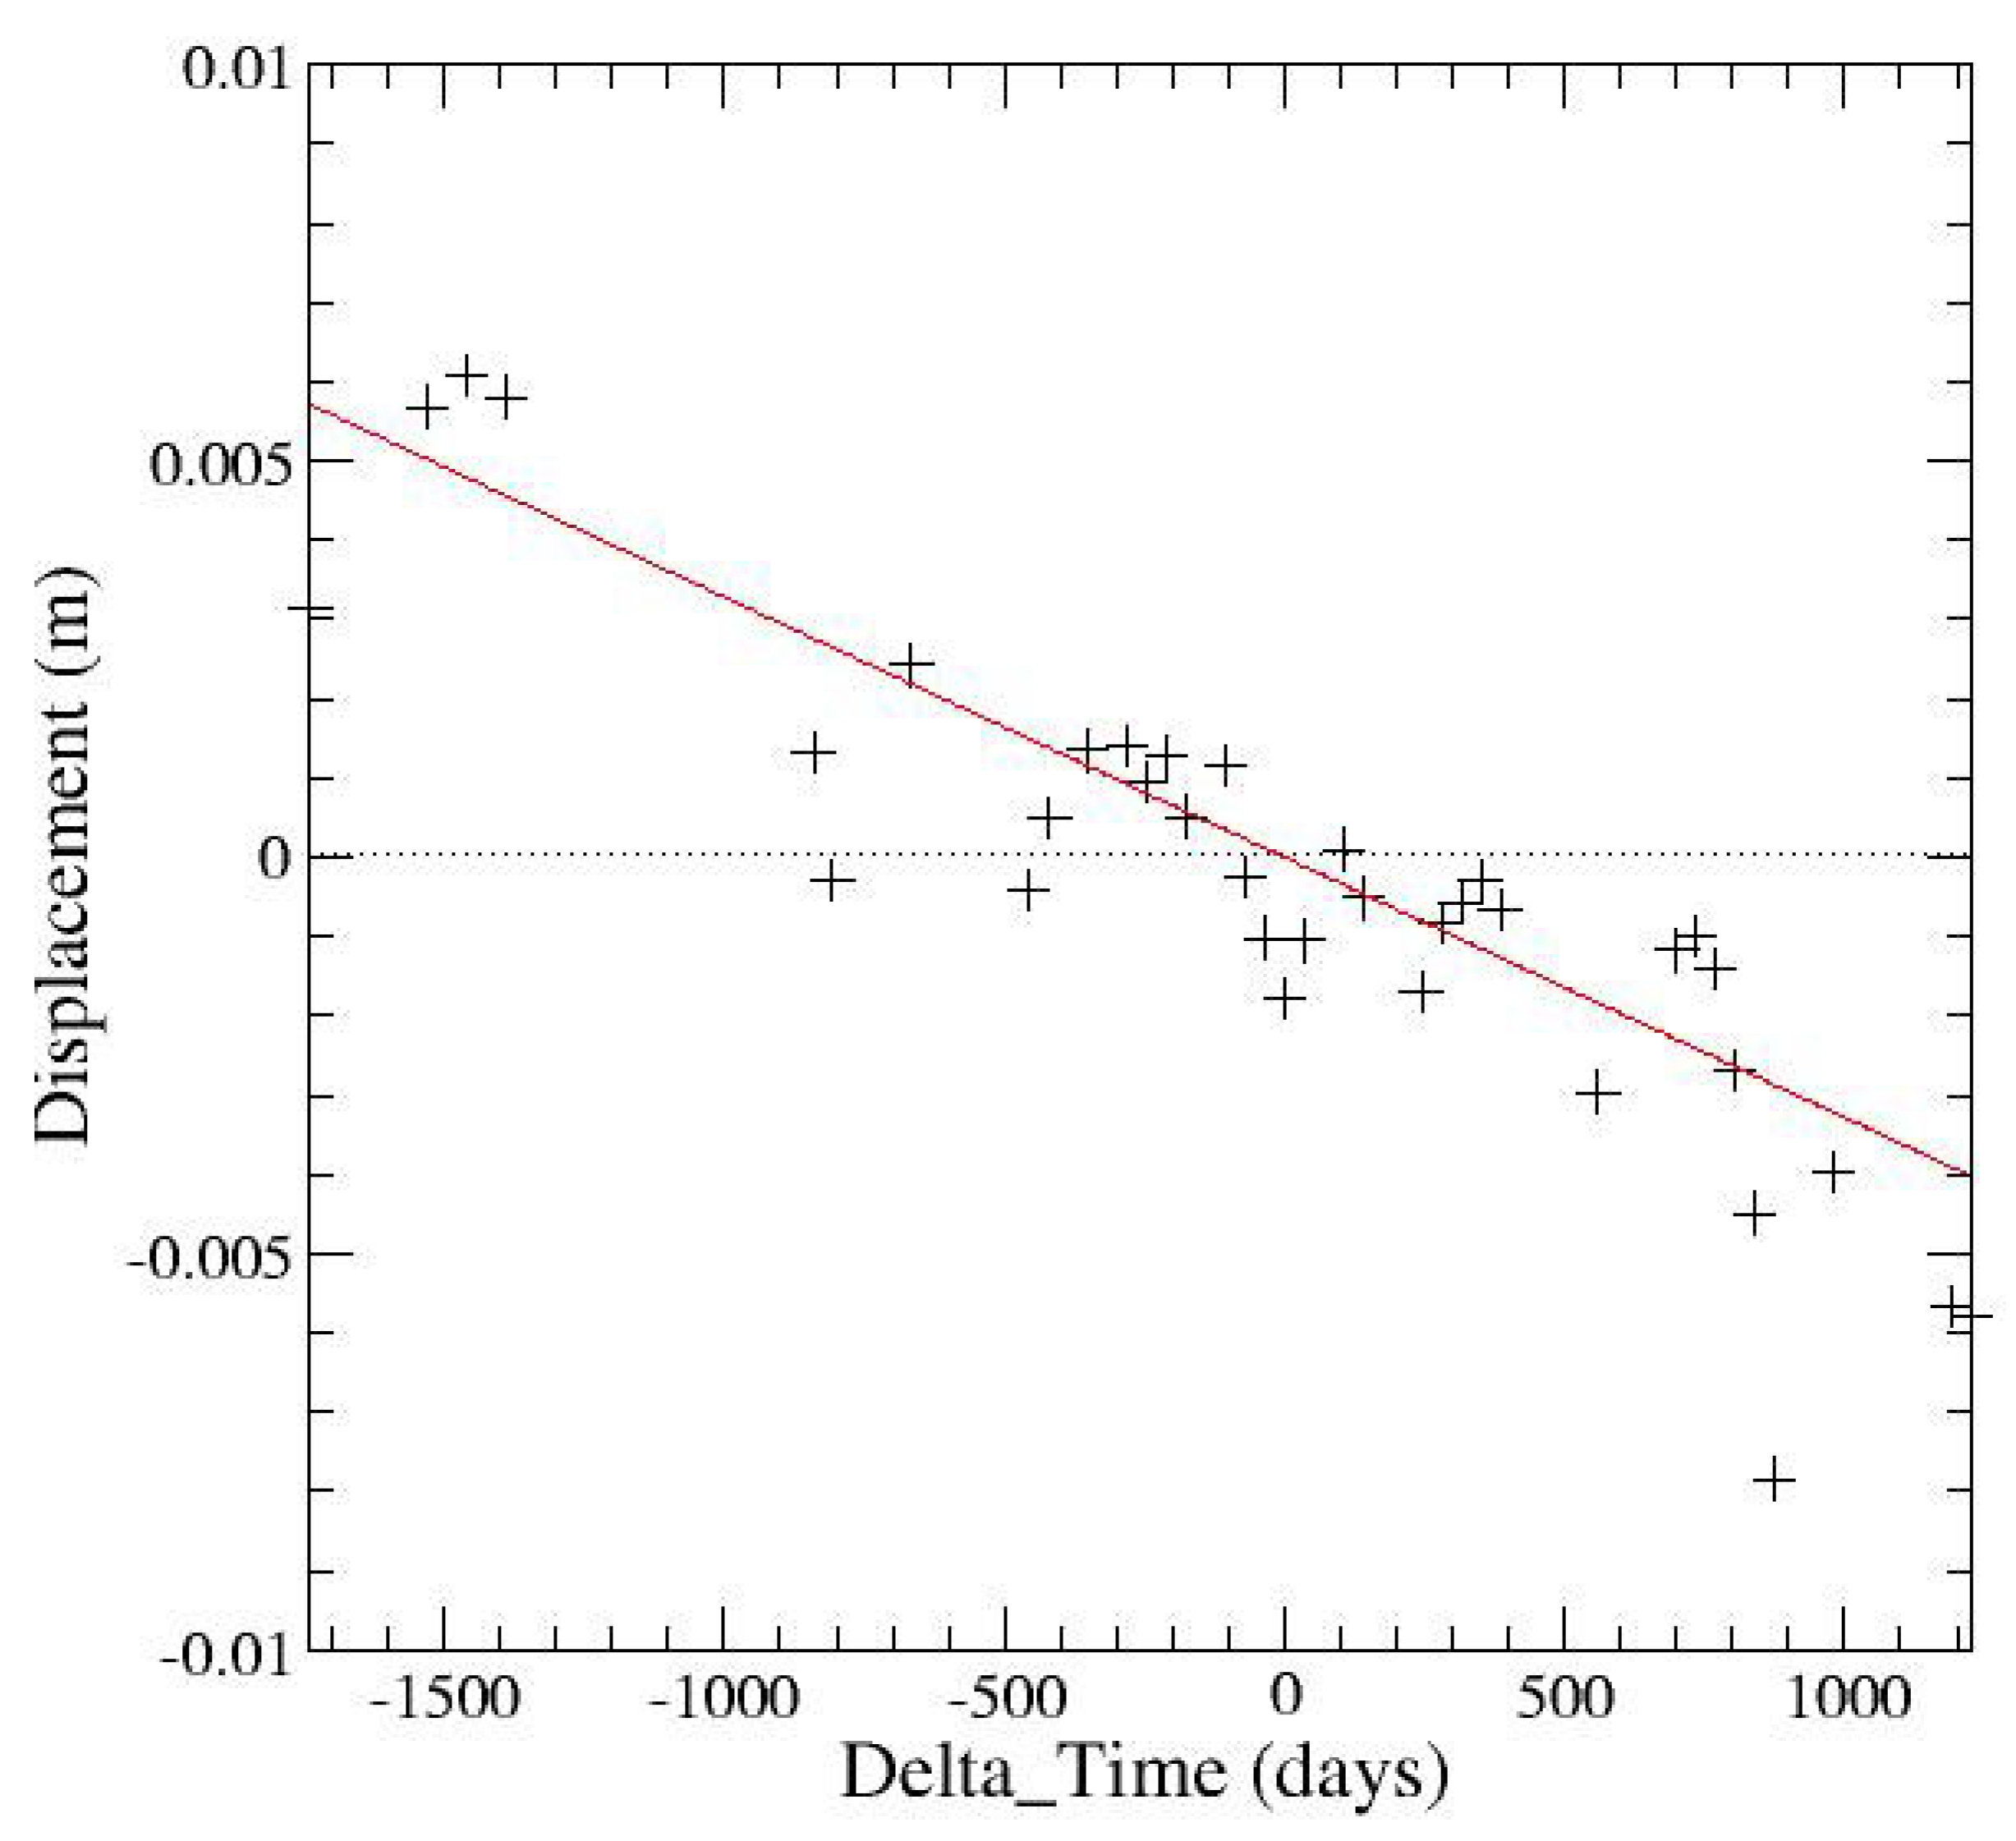
4. Results

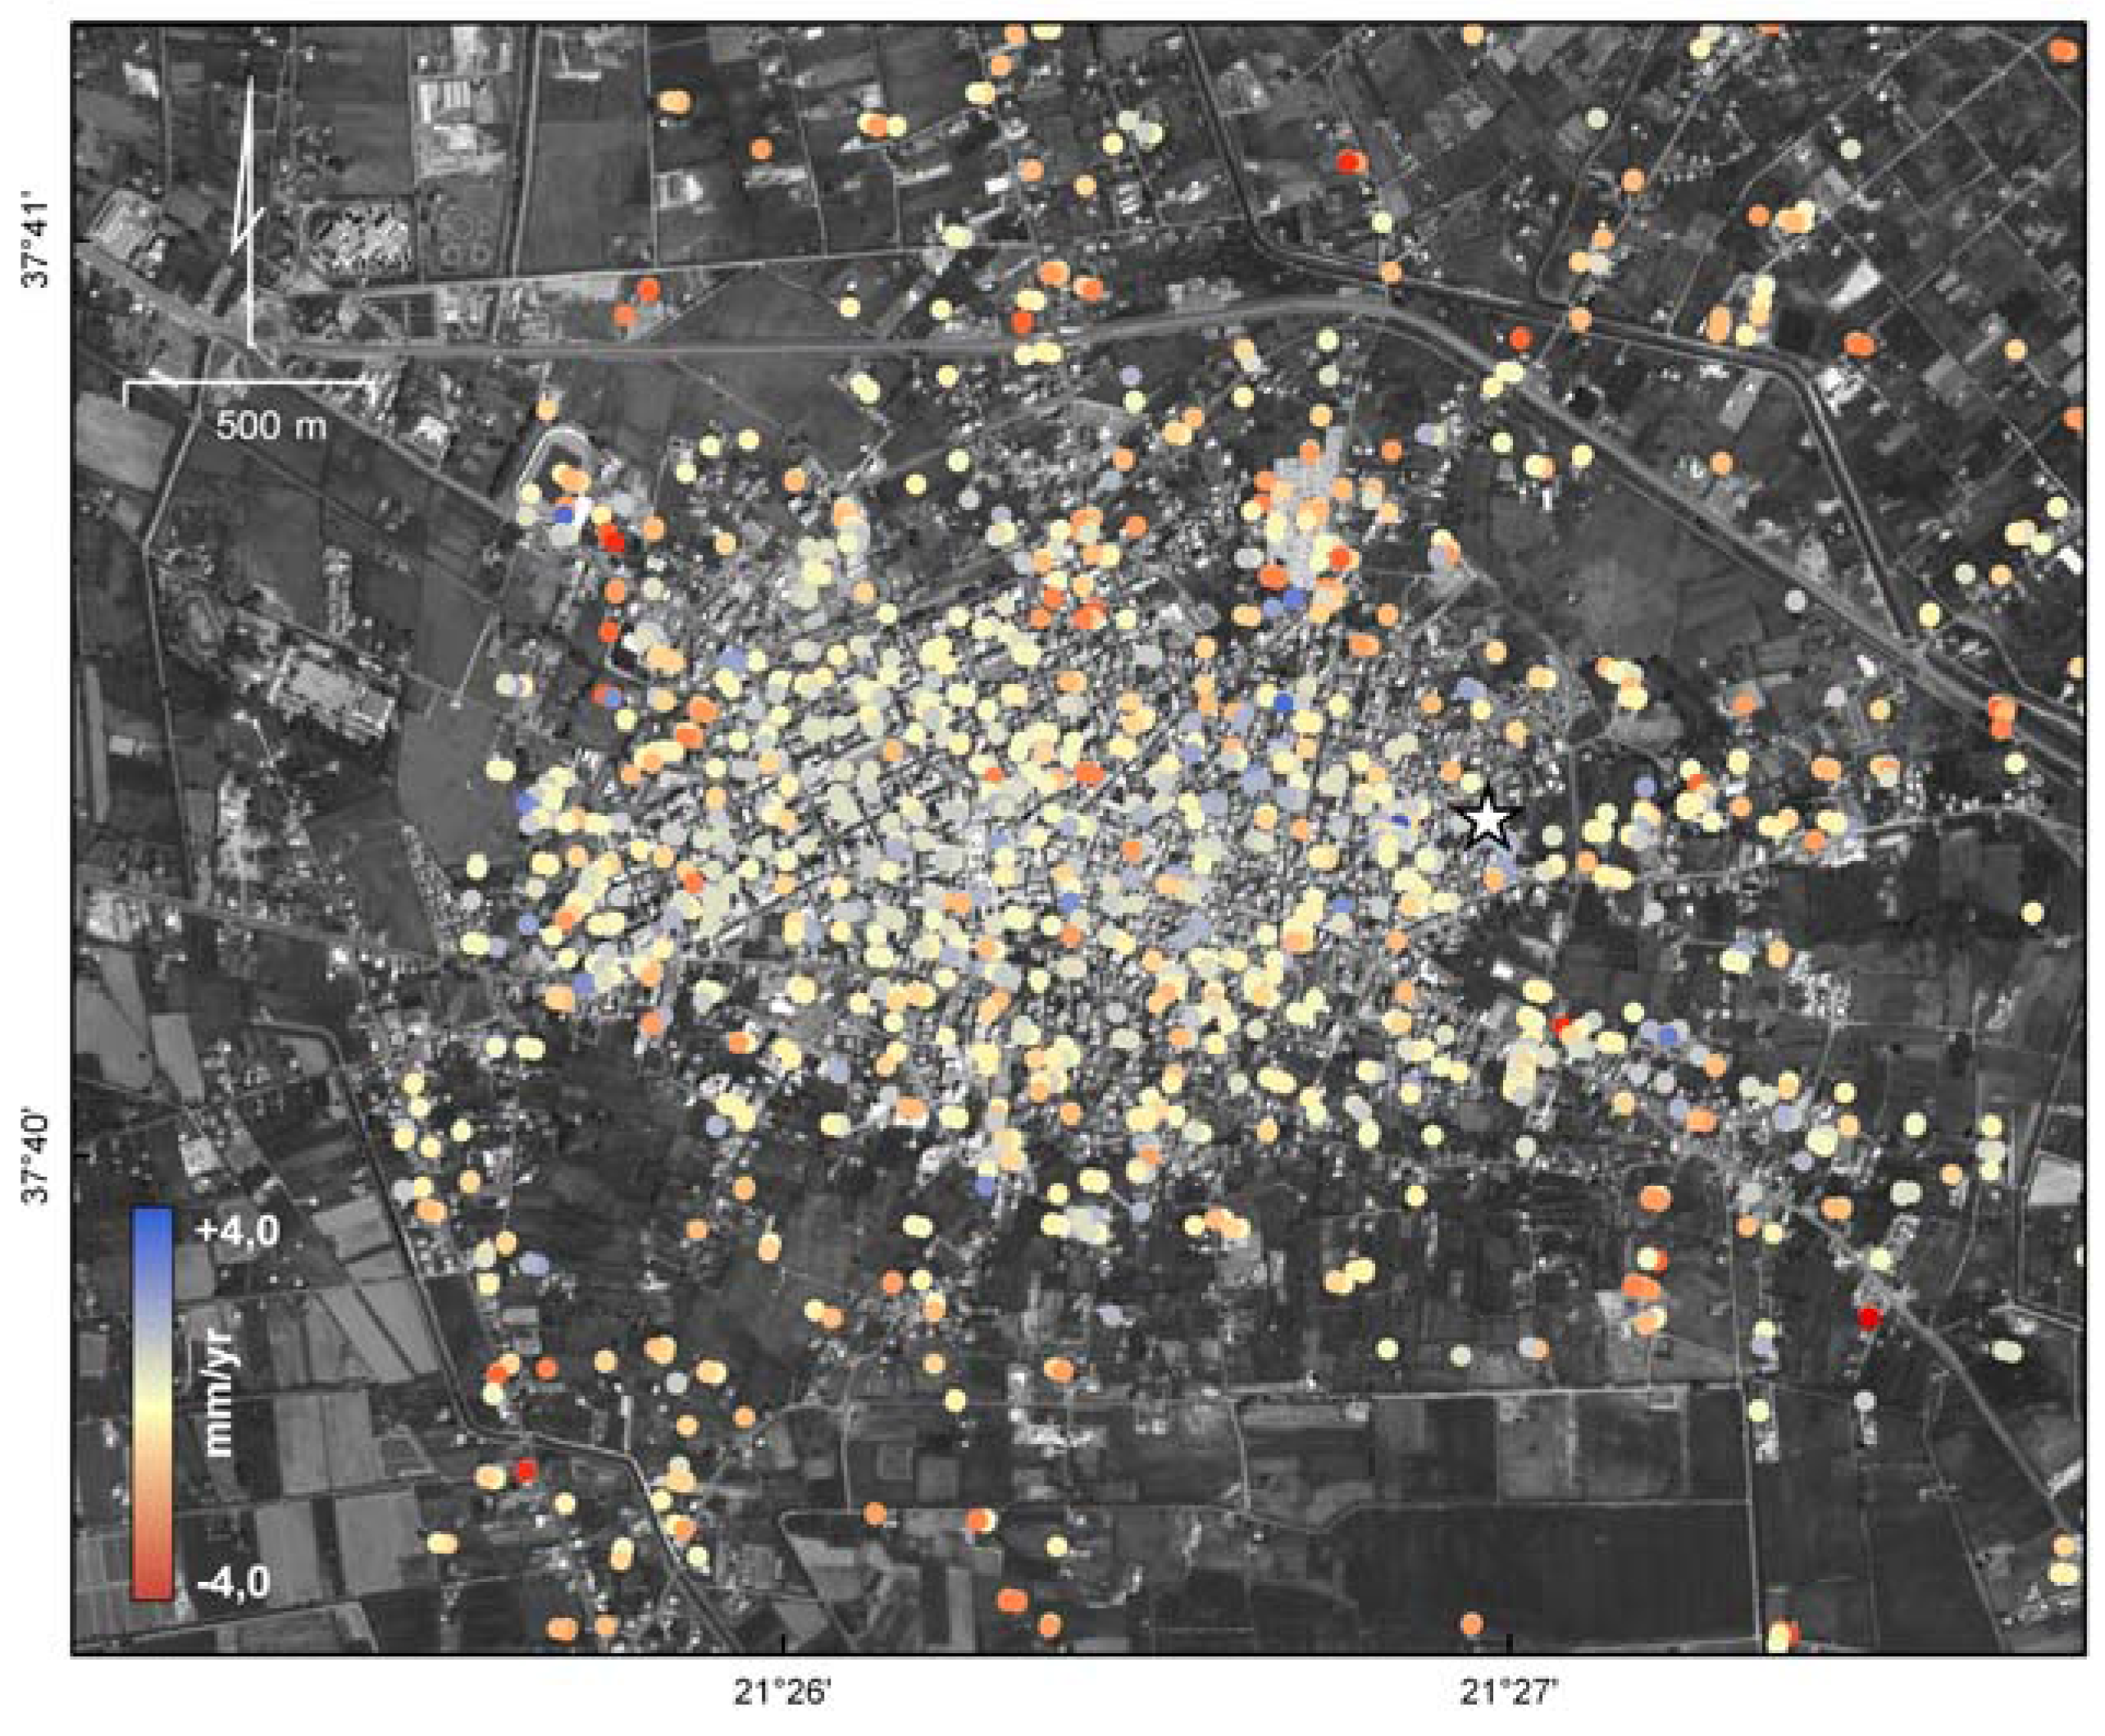
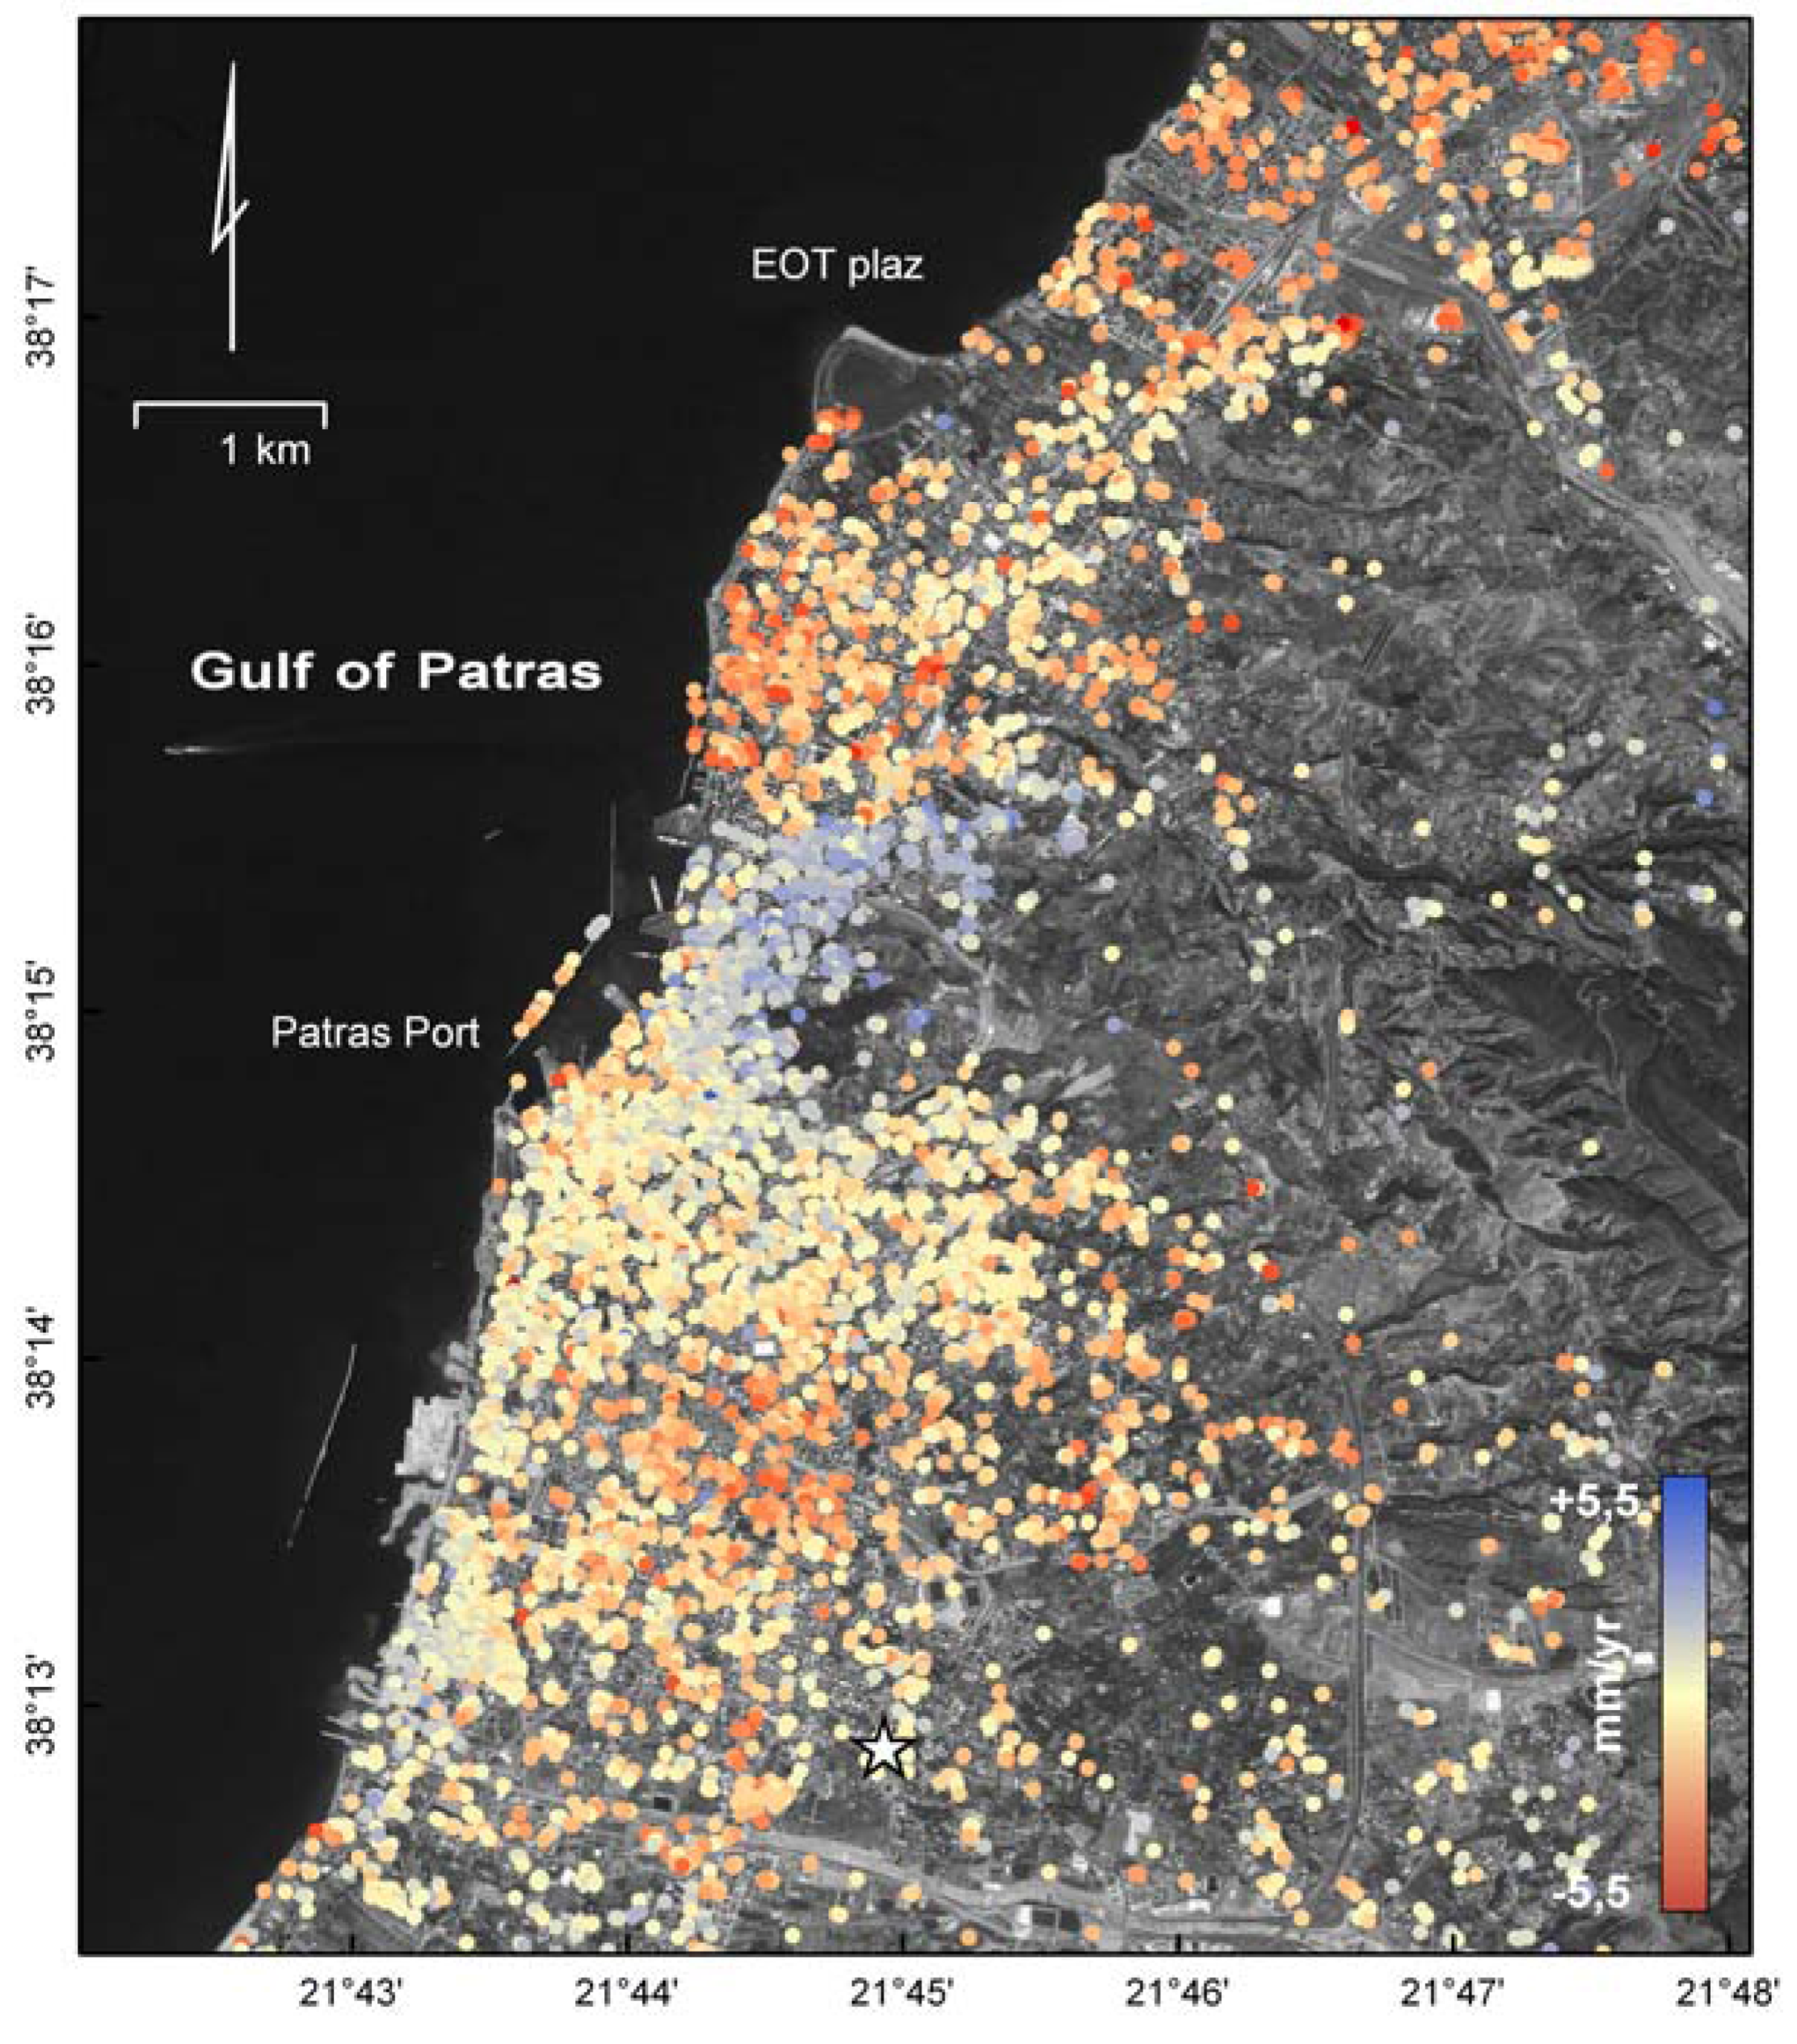
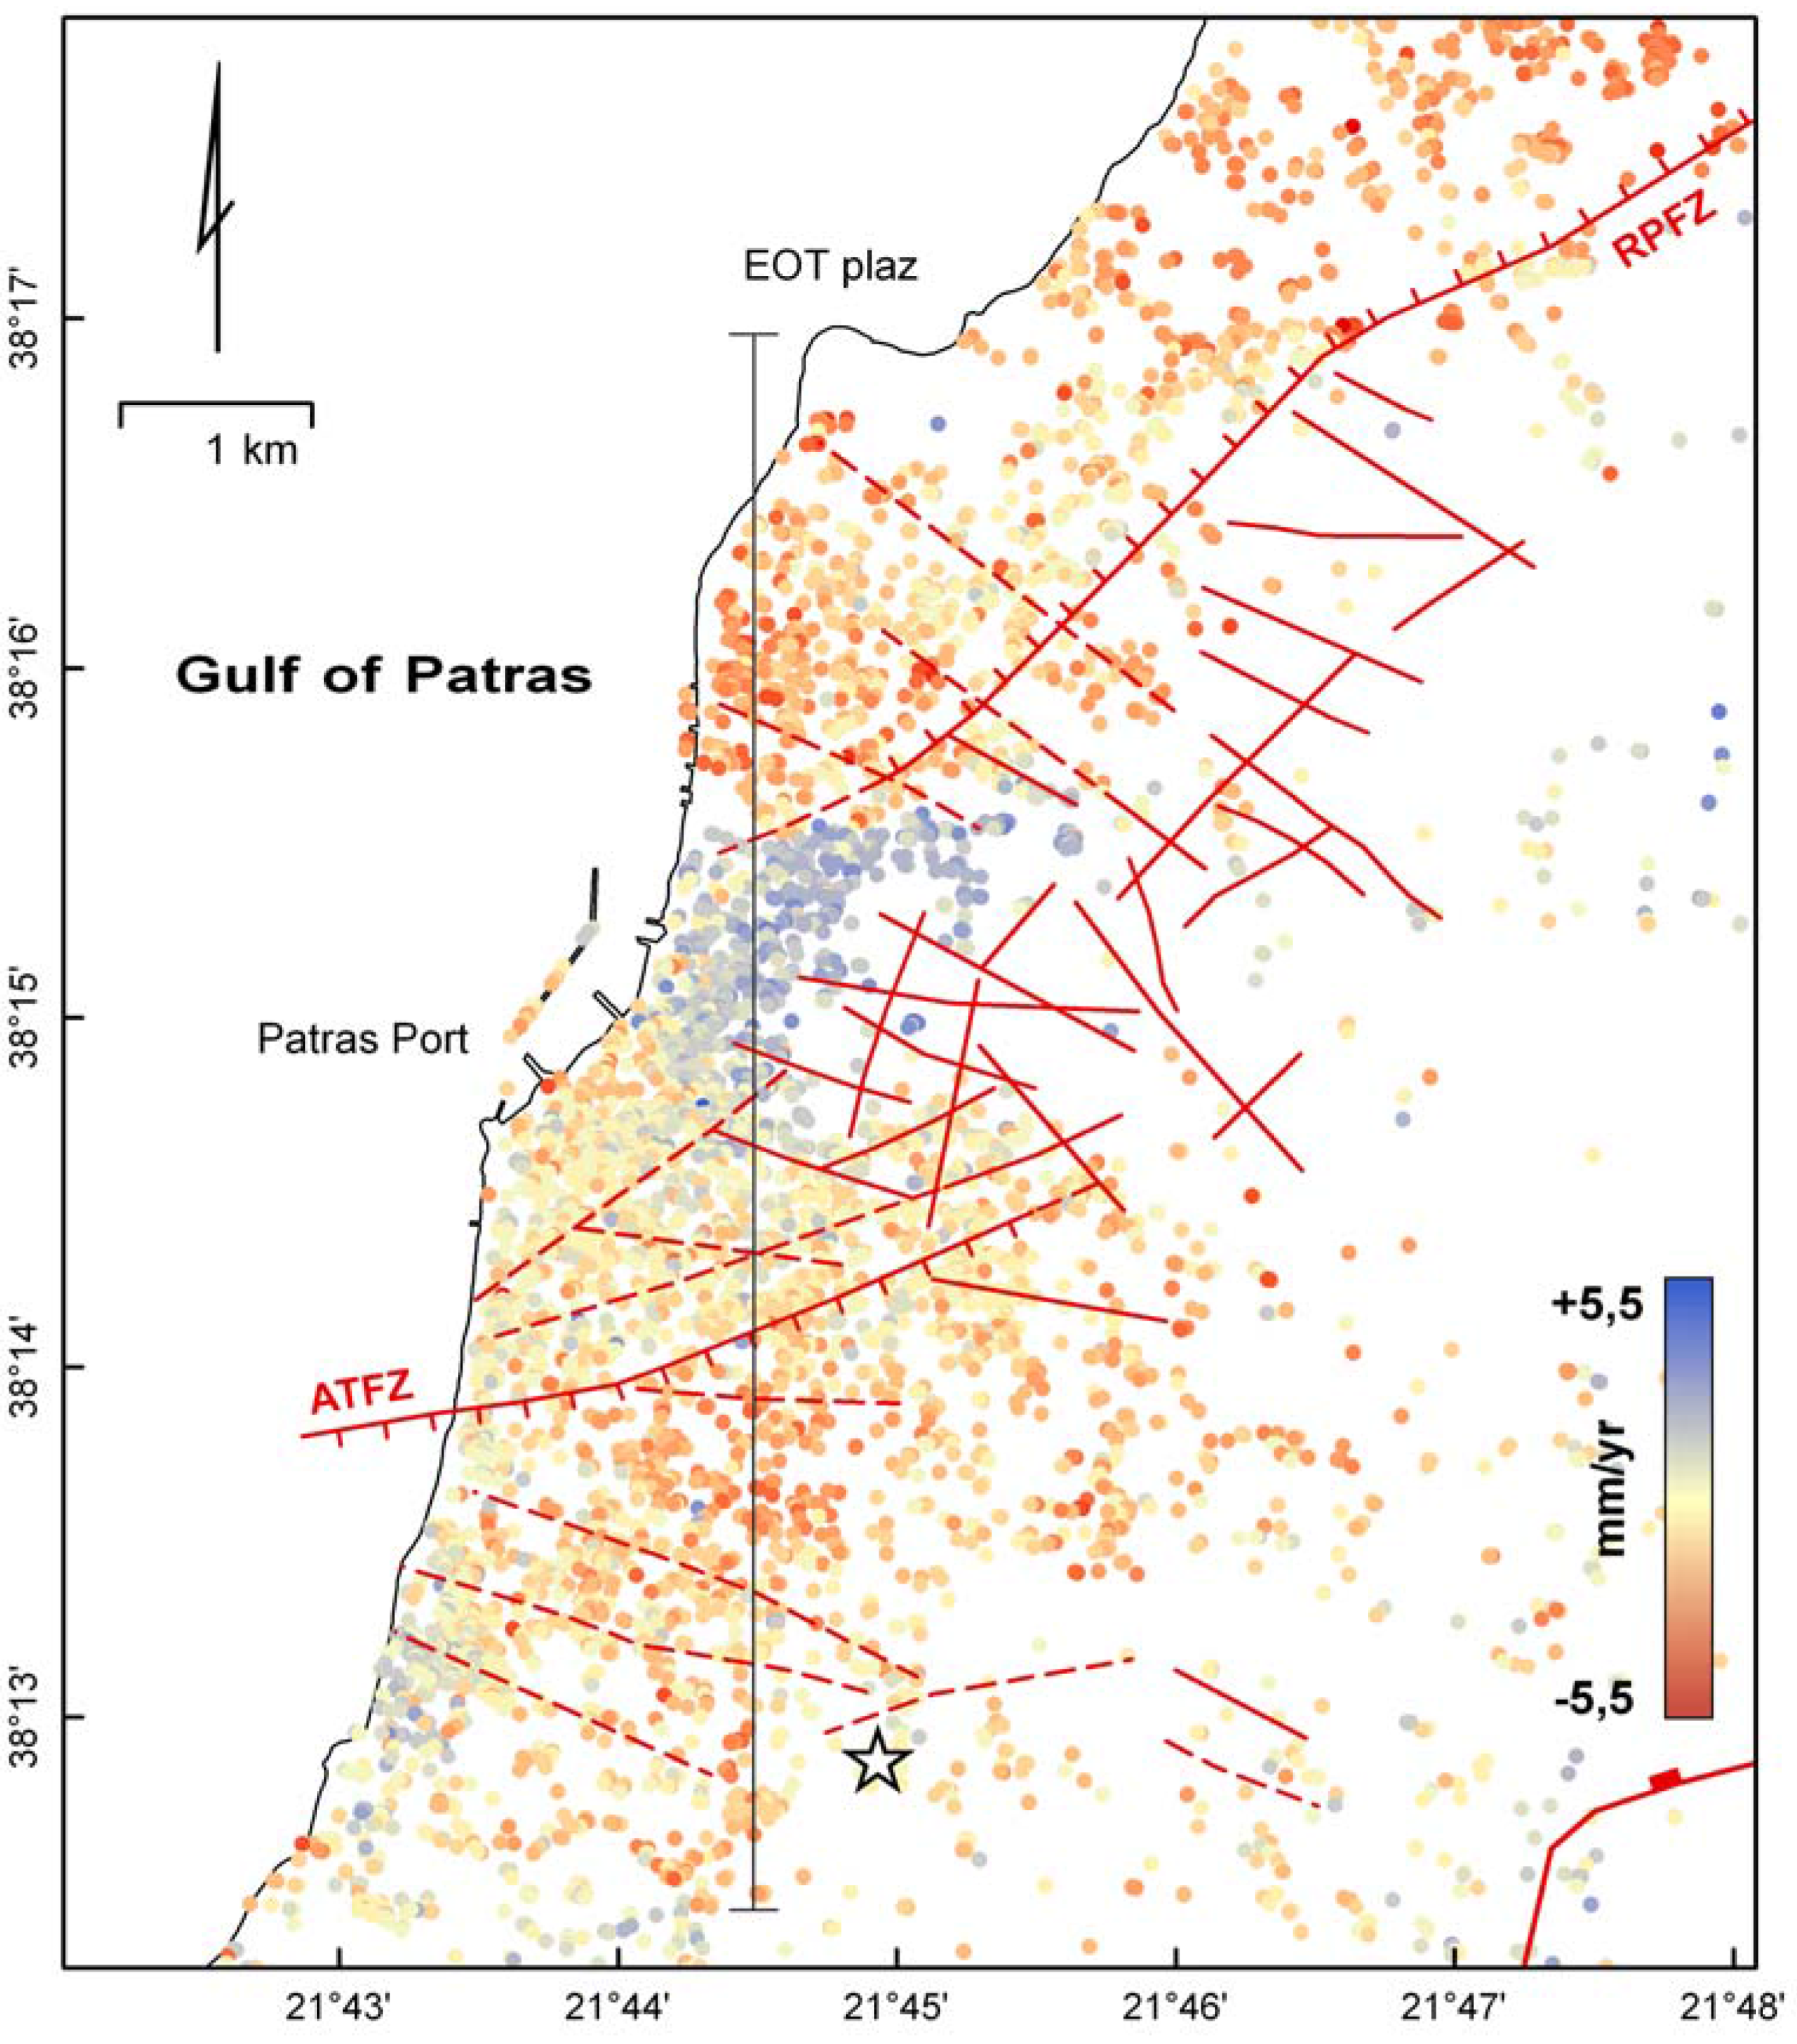
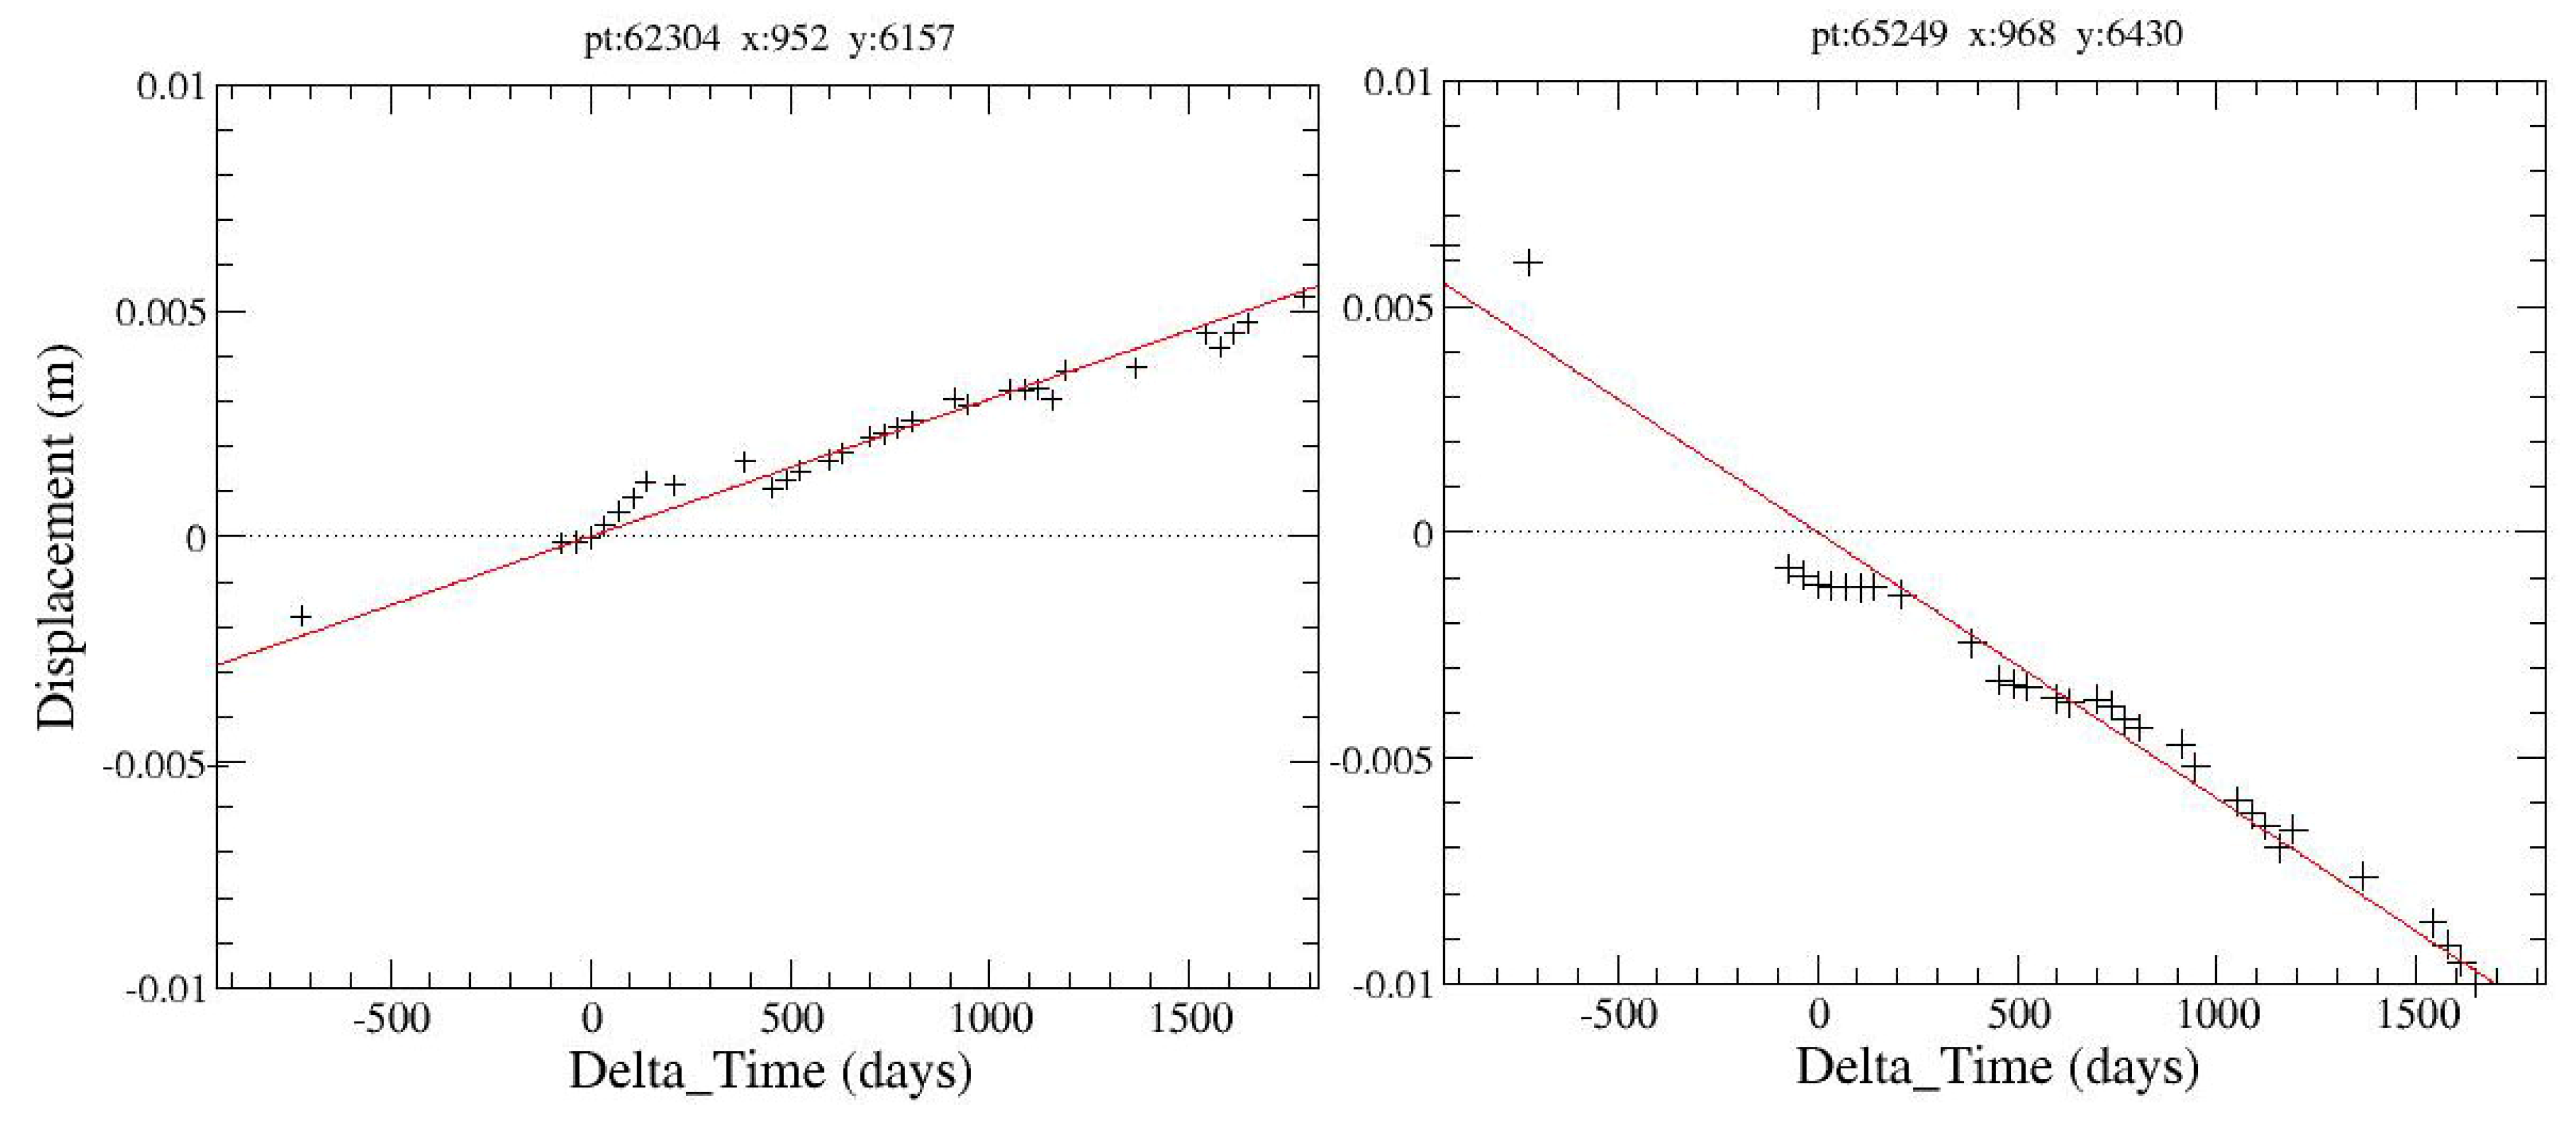
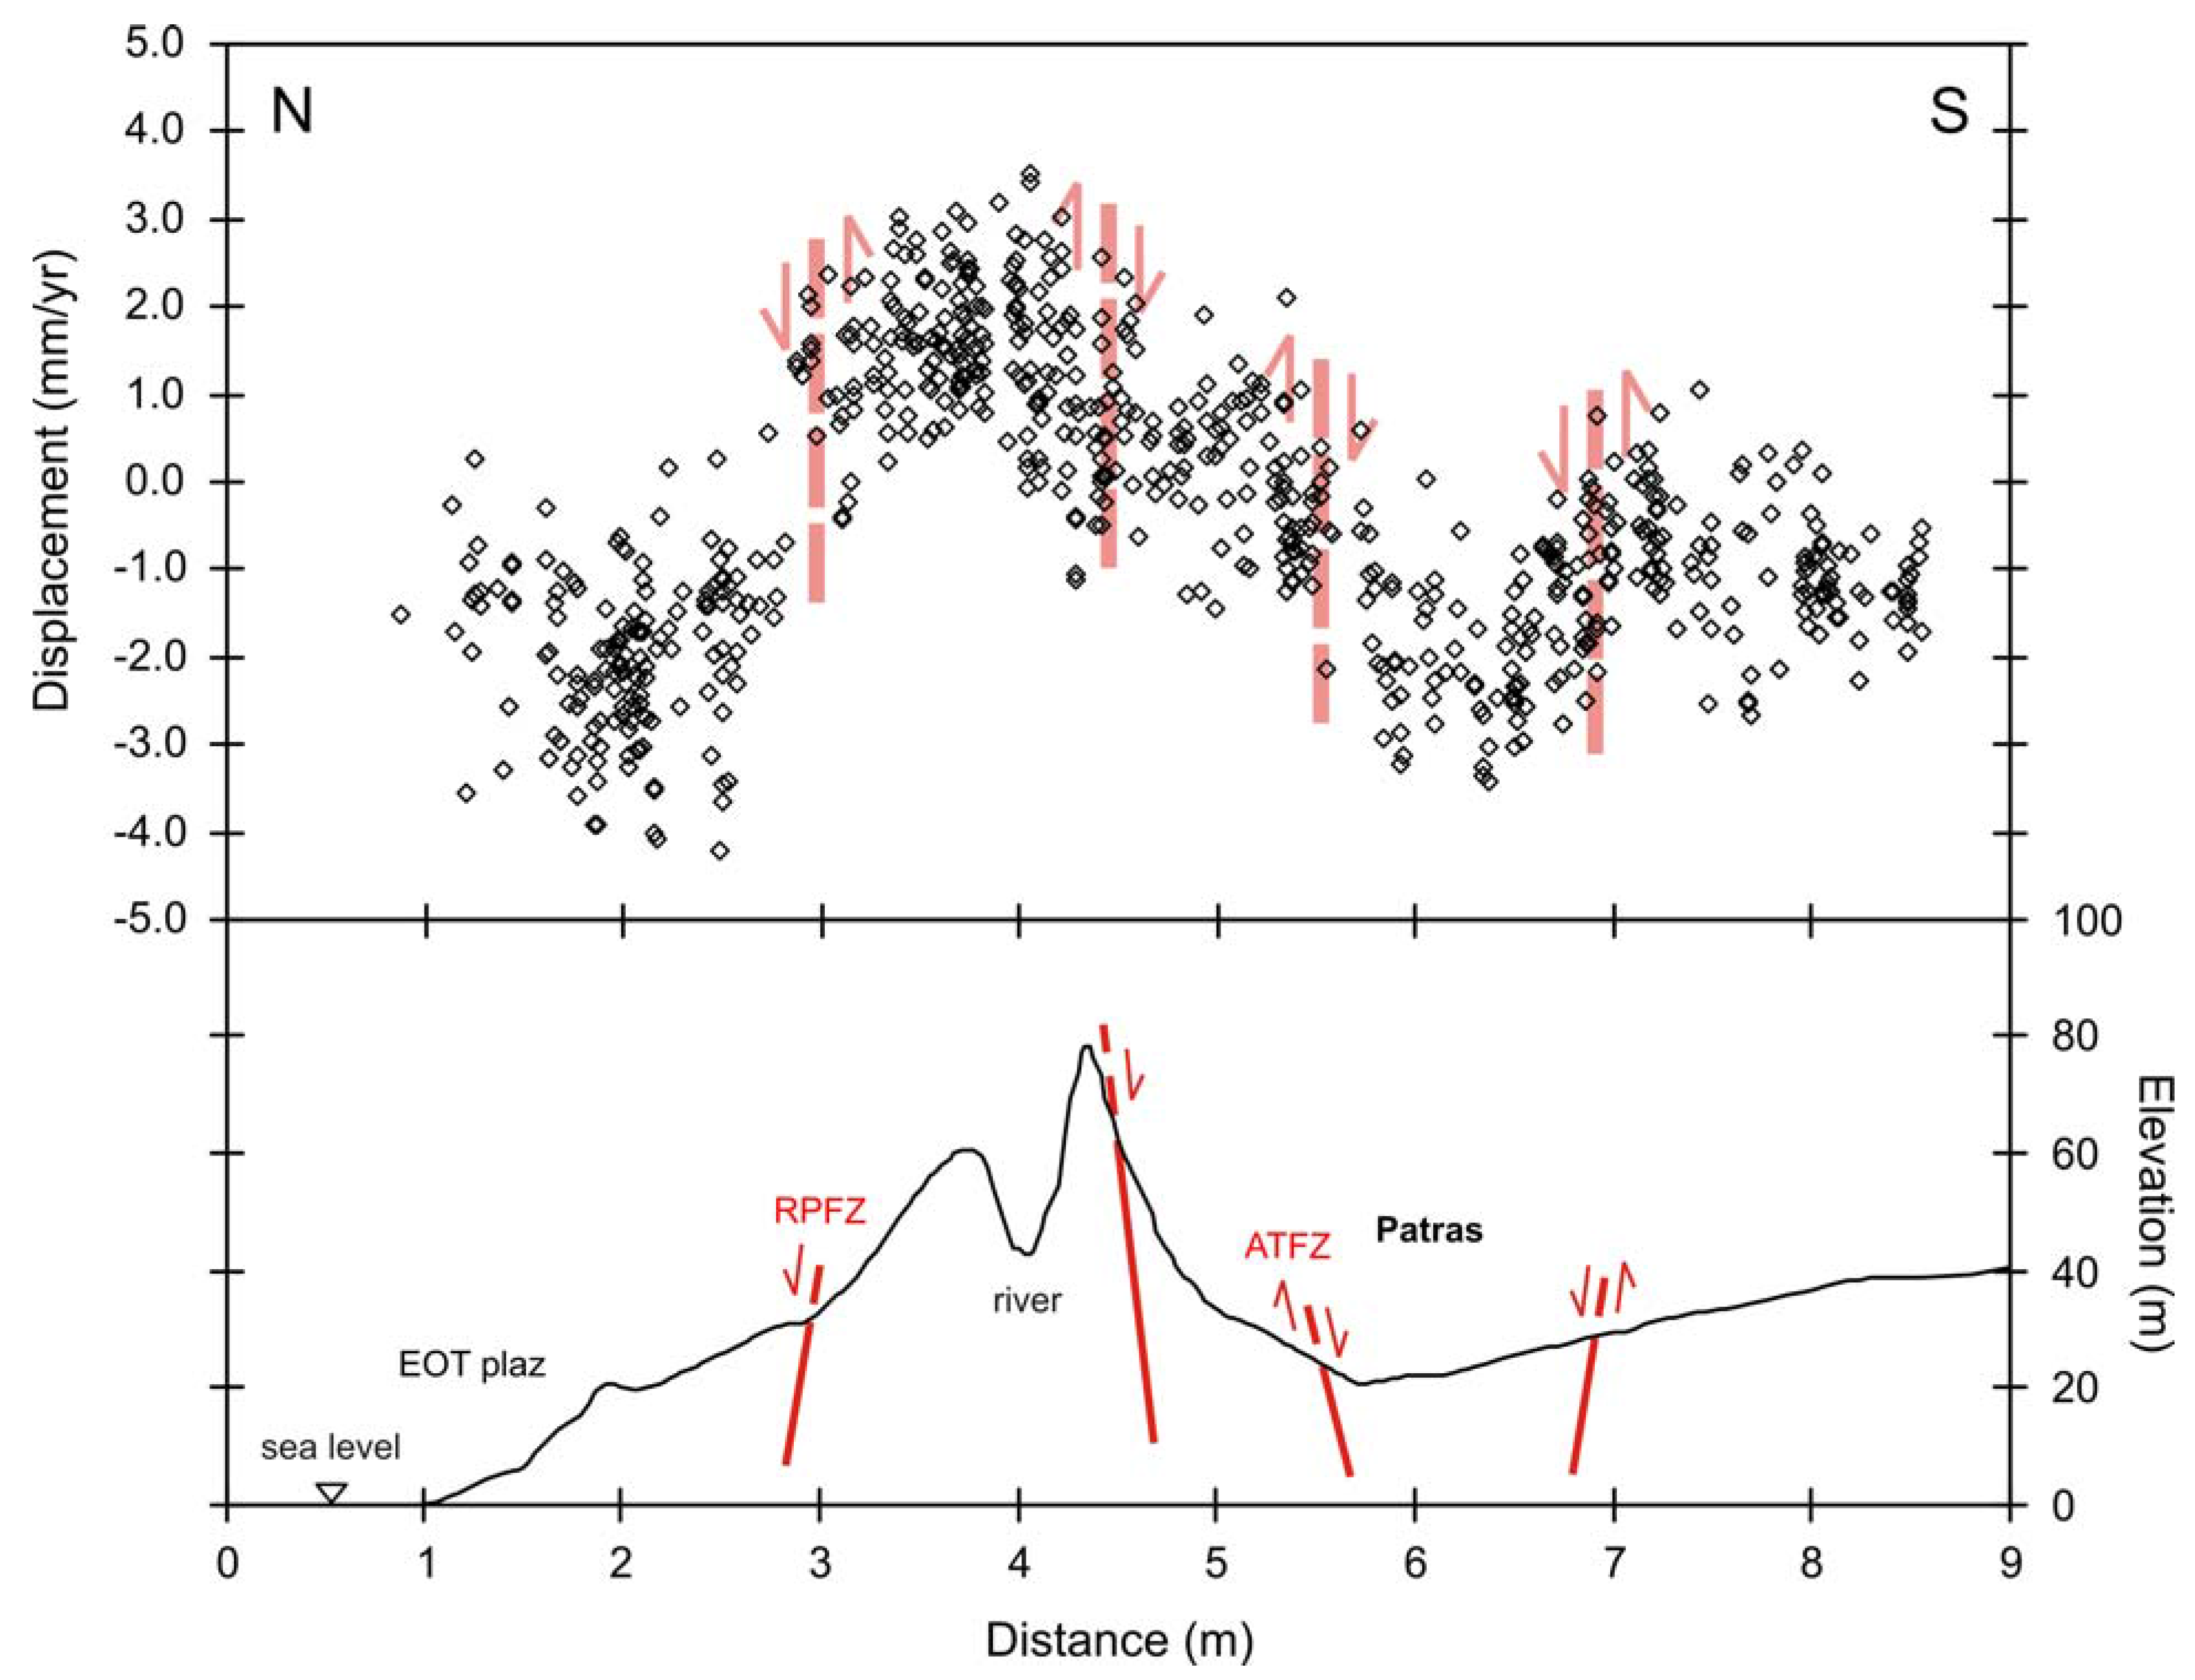
4.1. Patras

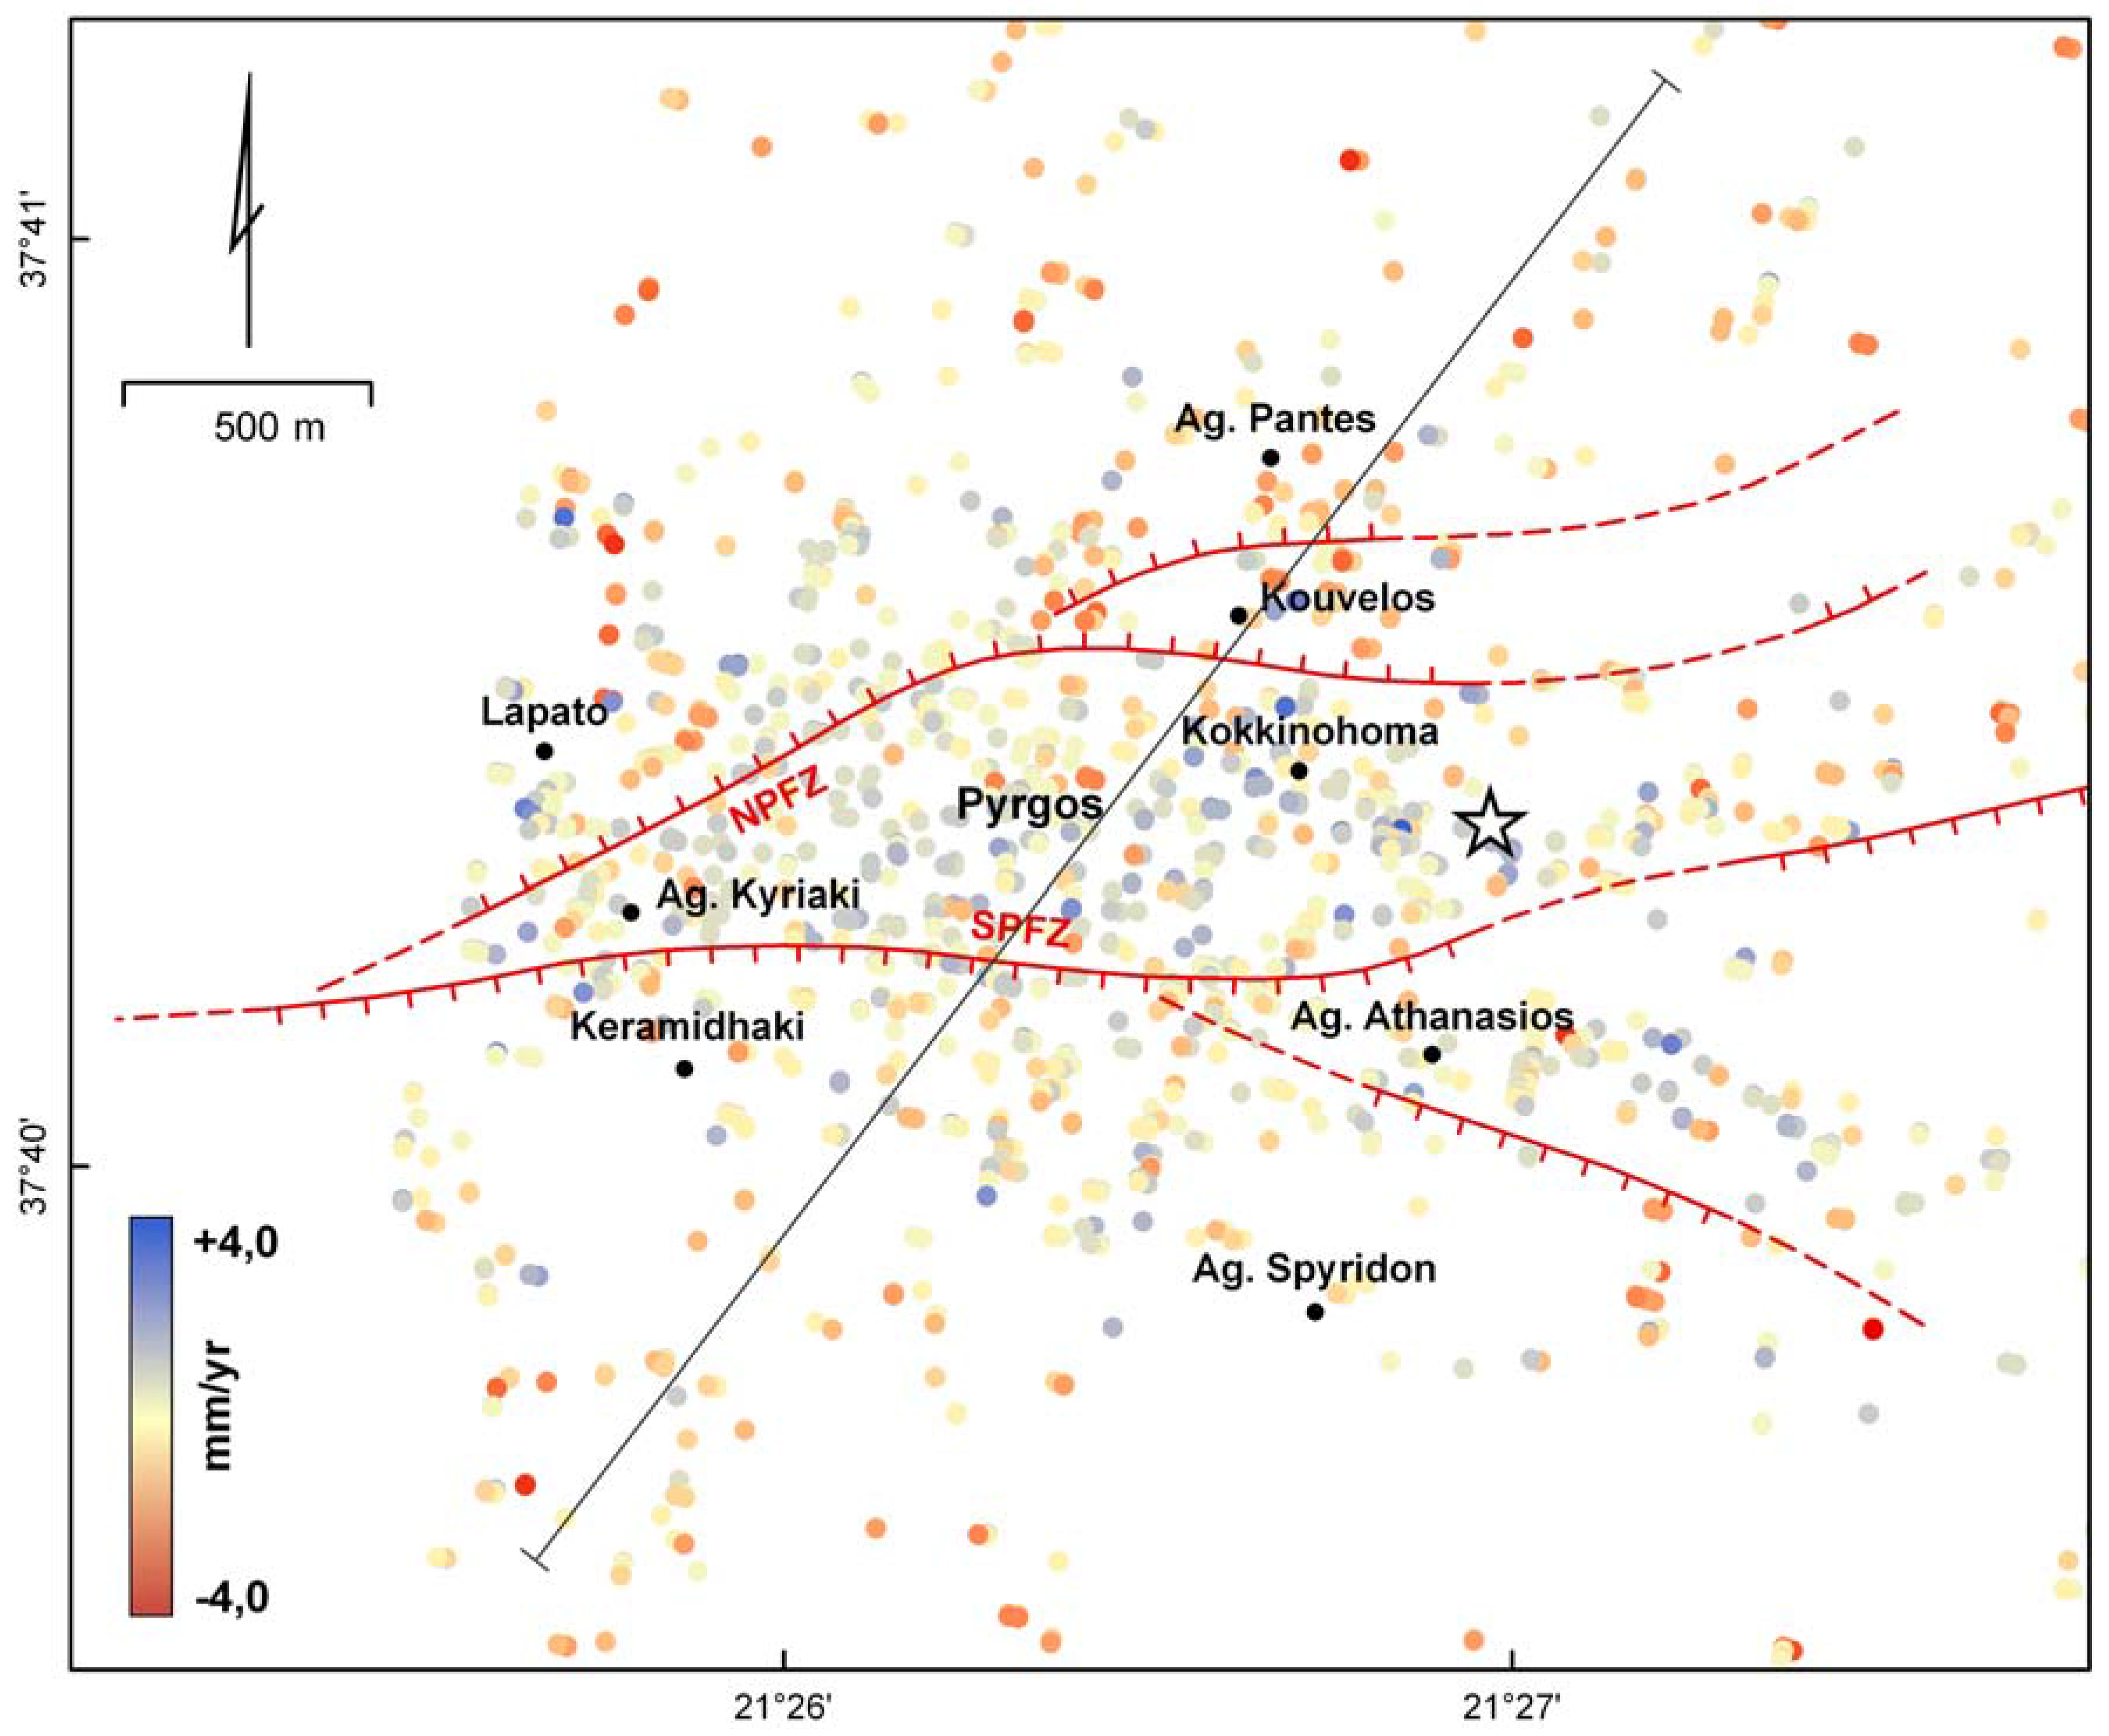
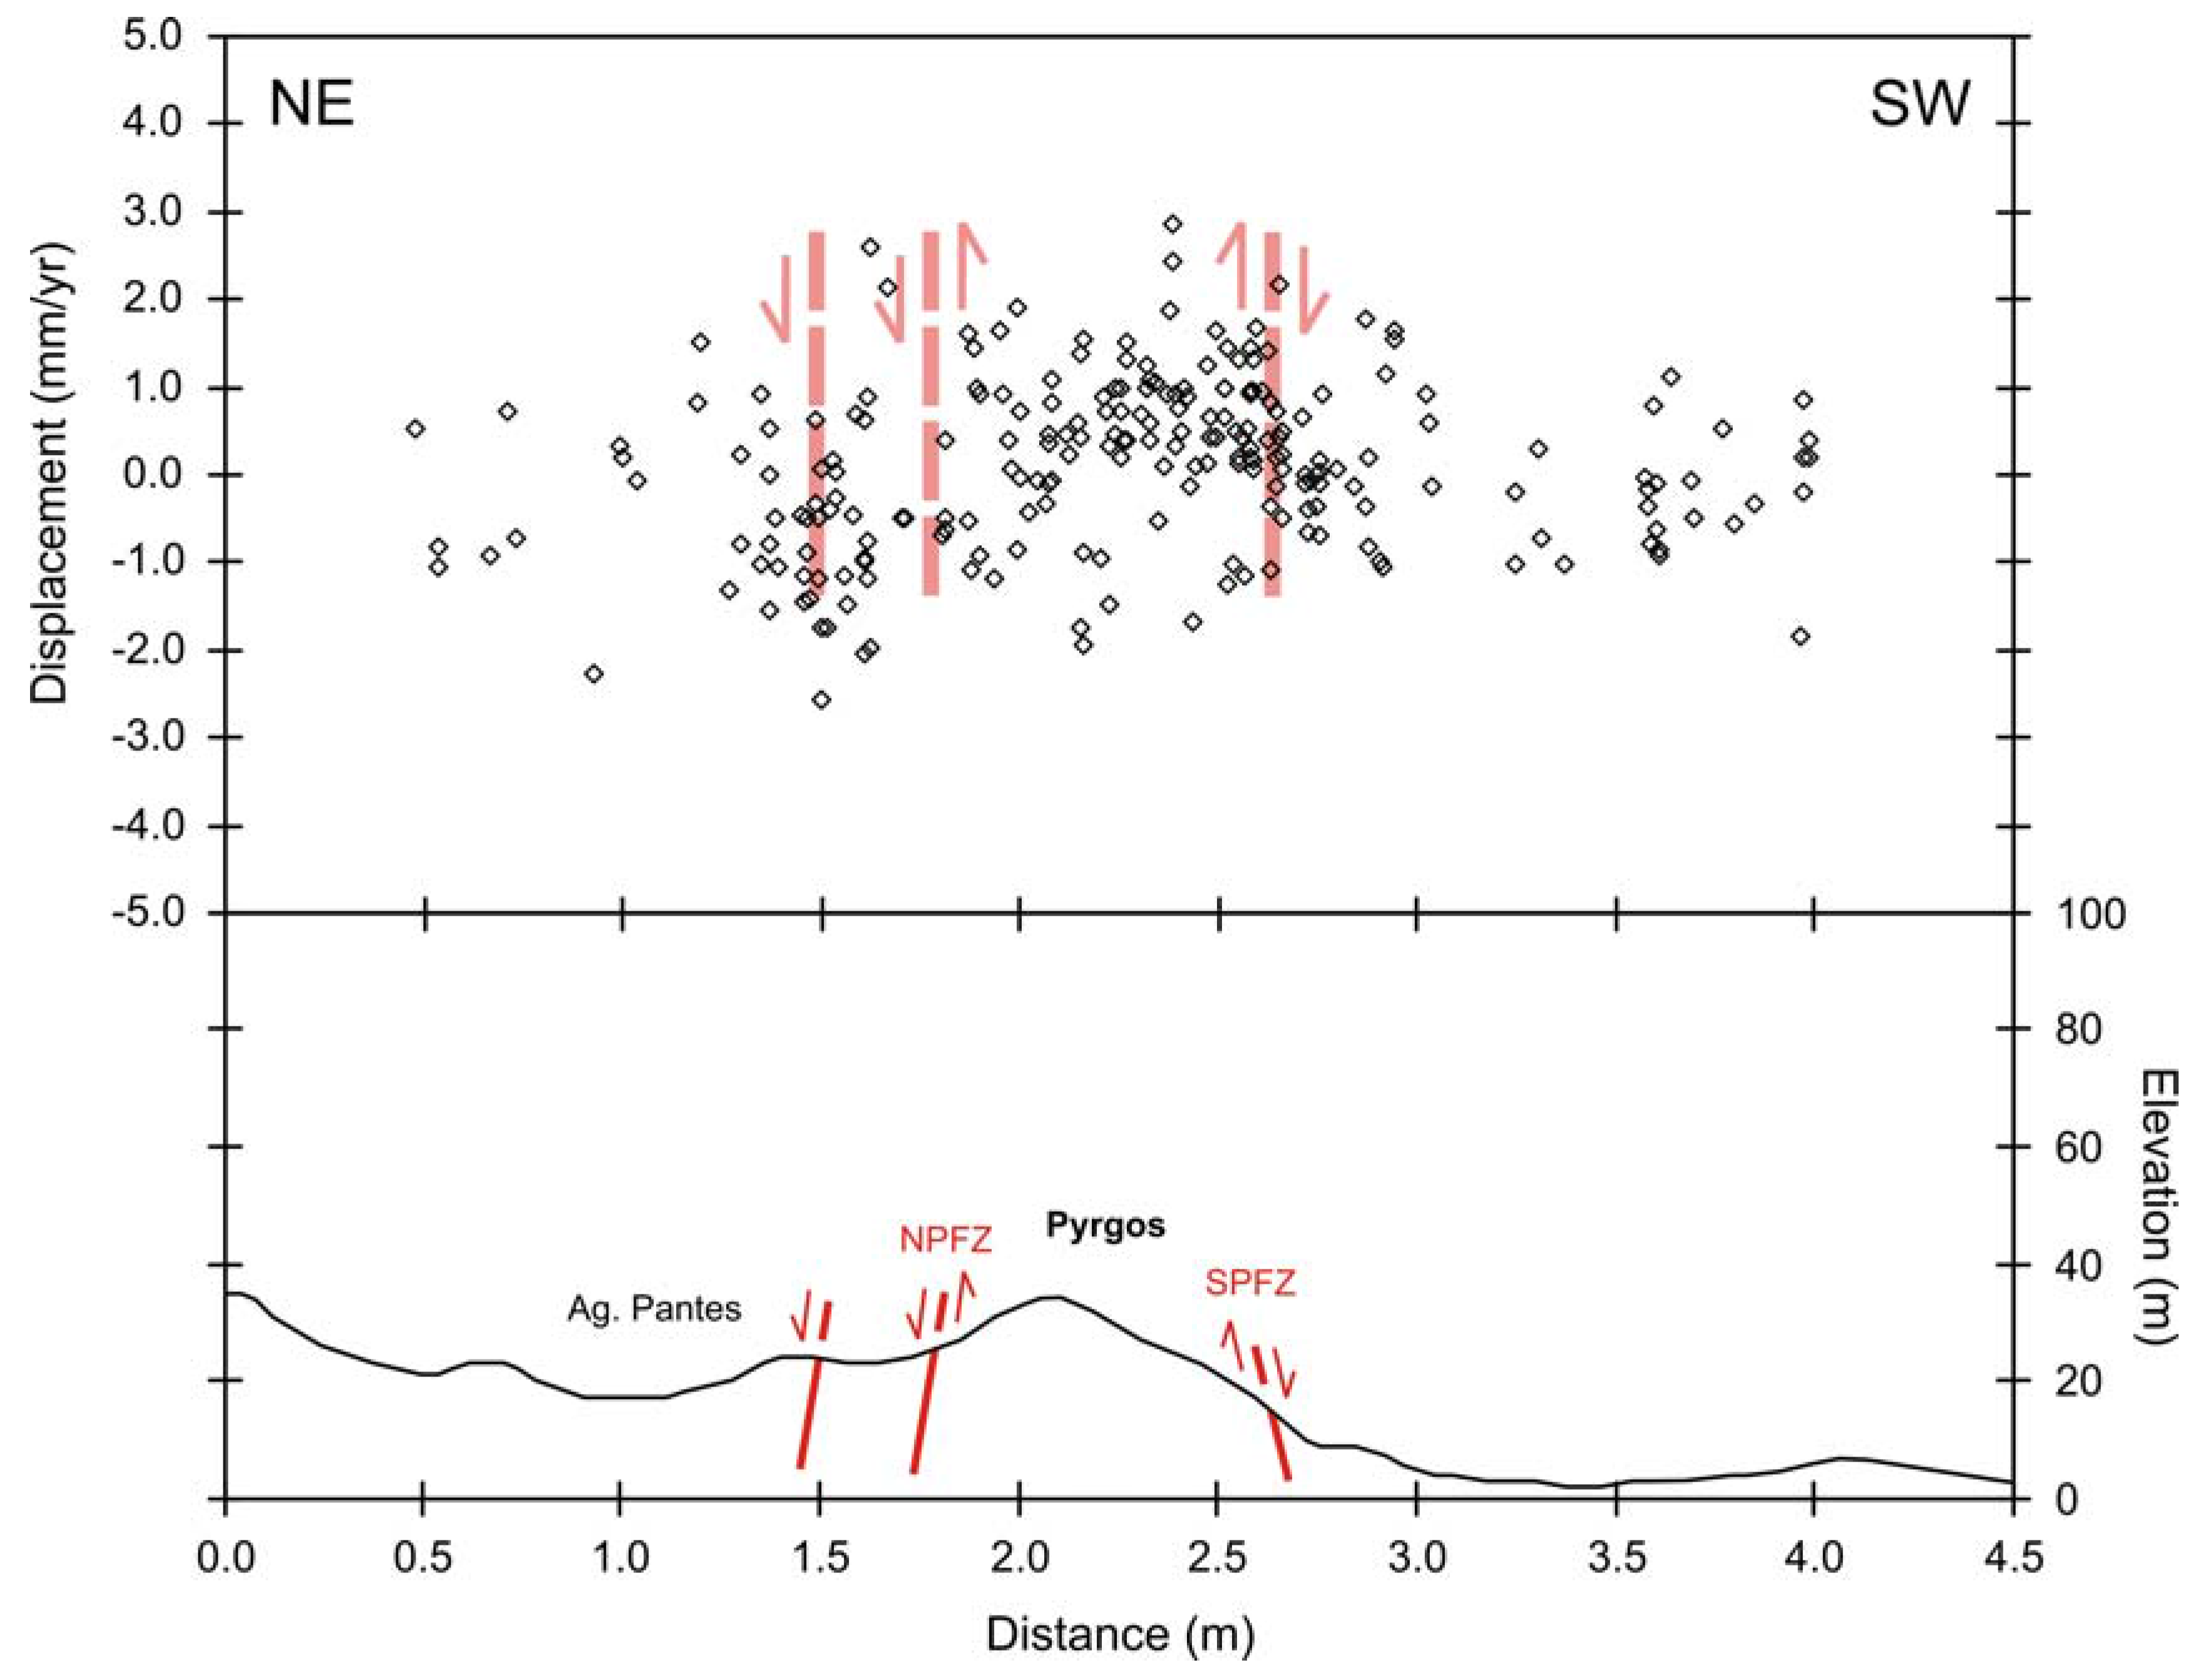
4.2. Pyrgos


5. Discussion
Acknowledgements
References
- Wright, T.; Parsons, B.; Fielding, E. Measurement of interseismic strain accumulation across the North Anatolian Fault by satellite radar interferometry. Geophys. Res. Lett. 2001, 28, 2117–2120. [Google Scholar] [CrossRef]
- Tosi, L.; Teatini, P.; Carbognin, L.; Brancolini, G. Using high resolution data to reveal depth–dependent mechanisms that drive land subsidence: The Venice coast, Italy. Tectonophysics 2009. [Google Scholar] [CrossRef]
- Massonnet, D.; Rossi, M.; Carmona, C.; Adragna, F.; Peltzer, G.; Feigl, K.; Rabaute, T. The displacement field of the Landers earthquake mapped by radar interferometry. Nature 1993, 364, 138–142. [Google Scholar] [CrossRef]
- Zebker, H.A.; Rosen, P.A.; Goldstein, R.M.; Gabriel, A.; Werner, C.L. On the derivation of coseismic displacement fields using differential radar interferometry. The Landers earthquake. J. Geophys. Res. 1994, 99, 19617–19634. [Google Scholar] [CrossRef]
- Ferretti, A.; Prati, C.; Rocca, F. Permanent scatterers in SAR interferometry. IEEE T. Geosci. Remote 2001, 39, 8–20. [Google Scholar] [CrossRef]
- Werner, C.; Wegmüller, U.; Strozzi, T.; Wiesmann, A. Interferometric point target anaysis for deformation mapping. In Proceedings of the IEEE International Geoscience and Remote Sensing Symposium, Toulouse, France, July 2003; pp. 4362–4364.
- Rosen, P.; Werner, C.; Fielding, E.; Hensley, S.; Buckley, S.; Vincent, P. Aseismic creep along the San Andreas fault northwest of Parkfield, CA measured by radar interferometry. Geophys. Res. Lett. 1998, 25, 825–828. [Google Scholar] [CrossRef]
- Colesanti, C.; Ferretti, A.; Ferrucci, F.; Prati, C.; Rocca, F. Monitoring known seismic faults using the Permanent Scatterers (PS) technique. In Proceedings of the IEEE International Geoscience and Remote Sensing Symposium, Honolulu, HI, USA, July 2000; pp. 2221–2223.
- Lee, J.C.; Angelier, J.; Chu, H.T.; Hu, J.C.; Jeng, F.S.; Rau, R.J. Active fault creep variations at Chihshang, Taiwan, revealed by creep meter monitoring, 1998 – 2001. J. Geophys. Res-Sol. Ea. 2003, 108, ETG 4–1–ETG 4–21. [Google Scholar] [CrossRef]
- Cunha, T.A.; Sarti, F. SAR interferometry as a tool for the detection of active tectonic regions: Preliminary results on the algarve region of the south Portugal. In Proceedings of the FRINGE 2003 Workshop, Frascati, Italy, 1–5 December 2003. ESA SP-550.
- Taylor, M.; Peltzer, G. Current slip rates on conjugate strike–slip faults in central Tibet using synthetic aperture radar interferometry. J. Geophys. Res-Sol. Ea. 2006, 111, B1240. [Google Scholar] [CrossRef]
- Biggs, J.; Wright, T.; Lu, Z.; Parsons, B. Multi-interferogram method for measuring interseismic deformation: Denali Fault, Alaska. Geophys. J. Int. 2007, 170, 1165–1179. [Google Scholar] [CrossRef]
- Cavalié, O.; Lasserre, C.; Doin, M.; Peltzer, G.; Sun, J.; Xu, X.; Shen, Z. Present-day deformation across the Haiyuan fault (Gansu, China), measured by SAR interferometry. In Dragon 1 Programme Final Results 2004–2007, Proceedings of the 2008 Dragon Symposium, Beijing, China, 21–25 April 2008; Lacoste, H., Ouwehand, L., Eds.; ESA Communication Production Office ESTEC: Noordwijk, The Netherlands, 2008. ESA SP-655. [Google Scholar]
- Huang, M.; Hu, J.; Ching, K.; Rau, R.; Hsieh, C.; Pathier, E.; Fruneau, B.; Deffontaines, B. Active deformation of Tainan tableland of southwestern Taiwan based on geodetic measurements and SAR interferometry. Tectonophysics 2009, 466, 322–334. [Google Scholar] [CrossRef]
- Underhill, J.R. Late Cenozoic deformation of the Hellenide foreland, western Greece. Geo. Soc. Am. Bull. 1989, 101, 613–634. [Google Scholar] [CrossRef]
- Hatzfeld, D.; Pedotti, G.; Hatzidimitriou, P.; Makropoulos, K. The strain pattern in the western Hellenic arc deduced from a microearthquake survey. Geophys. J. Int. 1990, 101, 181–202. [Google Scholar] [CrossRef]
- Hatzfeld, D.; Kassaras, I.; Panagiotopoulos, D.; Amorese, D.; Makropoulos, K.; Karakaisis, G.; Coutant, O. Microseismicity and strain pattern in northwestern Greece. Tectonics 1995, 14, 773–785. [Google Scholar] [CrossRef]
- Sachpazi, M.; Hirn, A.; Clément, C.; Haslinger, F.; Laigle, M.; Kissling, E.; Charvis, P.; Hello, Y.; Lépine, J.C.; Sapin, M.; Ansorge, J. Western Hellenic subduction and Cephalonia Transform: local earthquakes and plate transport and strain. Tectonophysics 2000, 319, 301–319. [Google Scholar] [CrossRef]
- Doutsos, T.; Koukouvelas, I.K.; Xypolias, P. A new orogenic model for the External Hellenides. In Tectonic Development of the Eastern Mediterranean Region; Robertson, Α.H.F., Mountrakis, D., Eds.; Geological Society: London, UK, 2006; pp. 507–520. [Google Scholar]
- Kokkalas, S.; Xypolias, P.; Koukouvelas, I.K.; Doutsos, T. Post-Ccollisional Contractional and Extensional Deformation in the Aegean Region. In Post-Collisional Tectonics and Magmatism in the Mediterranean region and Asia (GSA Special Paper); Dilek, Y., Pavlides, S., Eds.; Geol. Soc. Am. S.; 2006; Volume 409, pp. 97–123. [Google Scholar]
- Lagios, E.; Sakkas, V.; Papadimitriou, P.; Parcharidis, I.; Damiata, B.N.; Chousianitis, K.; Vassilopoulou, S. Crustal deformation in the Central Ionian Islands (Greece): Results from DGPS and DInSAR analyses (1995–2006). Tectonophysics 2007, 444, 119–145. [Google Scholar] [CrossRef]
- Hollenstein, Ch.; Müller, M.D.; Geiger, A.; Kahle, H.G. Crustal motion and deformation in Greece from a decade of GPS measurements, 1993–2003. Tectonophysics 2008, 449, 17–40. [Google Scholar] [CrossRef]
- Doutsos, T.; Pe-Piper, G.; Boronkay, K.; Koukouvelas, I. Kinematics of the Central Hellenides. Tectonics 1993, 12, 936–953. [Google Scholar] [CrossRef]
- Xypolias, P.; Doutsos, T. Kinematics of rock flow in a crustal scale shear zone: implication for the orogenic evolution of the SW Hellenides. Geol. Mag. 2000, 137, 81–96. [Google Scholar] [CrossRef]
- Skourlis, K.; Doutsos, T. The Pindos Fold and Thrust Belt (Greece): Inversion kinematics of a passive continental margin. Int. J. Earth Sci. 2003, 92, 891–903. [Google Scholar] [CrossRef]
- Sotiropoulos, S.; Kamberis, E.; Triantaphyllou, M.; Doutsos, T. Thrust sequences at the central part of the External Hellenides. Geol. Mag. 2003, 140, 661–668. [Google Scholar] [CrossRef]
- Doutsos, T.; Kontopoulos, N.; Poulimenos, G. The Corinth–Patras rift as the initial stage of continental fragmentation behind an active island arc (Greece). Basin Res. 1988, 1, 177–190. [Google Scholar] [CrossRef]
- Doutsos, T.; Kontopoulos, N.; Frydas, D. Neotectonic evolution of northwestern continental Greece. Geol. Rundsch. 1987, 76, 433–452. [Google Scholar] [CrossRef]
- Lekkas, E.; Papanikolaou, D.; Fountoulis, I. The Pyrgos Earthquake: The geological and geotechnical conditions of Pyrgos area (W. Peloponnese, Greece). In Field–guide for the Pre–Congress Excursion of the XV Congress of the Carpatho–Balcan Geological Association, Athens, Greece, September 1995; pp. 42–46.
- Koukouvelas, I.; Mpresiakas, A.; Sokos, E.; Doutsos, T. The tectonic setting and earthquake ground hazards of the 1993 Pyrgos earthquake, Peloponnese, Greece. J. Geol. Soc. London 1996, 153, 39–49. [Google Scholar] [CrossRef]
- Doutsos, T.; Kokkalas, S. Stress and deformation patterns in the Aegean region. J. Struct. Geol. 2001, 23, 455–472. [Google Scholar] [CrossRef]
- Papanikolaou, D.; Fountoulis, I.; Metaxas, C. Active faults, deformation rates and Quaternary paleogeography at Kyparissiakos Gulf (SW Greece) deduced from on-shore and off-shore data. Quatern. Int. 2007, 171–172, 14–30. [Google Scholar] [CrossRef]
- Zelilidis, A.; Koukouvelas, I.; Doutsos, T. Neogene paleostress changes behind the forearc fold belt in the Patraikos Gulf area, Western Greece. Neues Jahrb. Geol. P. M. 1988, 311–325. [Google Scholar]
- Flotte, N.; Sorel, D.; Muller, C.; Tensi, J. Along strike changes in the structural evolution over a brittle detachment fault: example of the Pleistocene Corinth – Patras rift (Greece). Tectonophysics 2005, 403, 77–94. [Google Scholar] [CrossRef]
- Chronis, G.; Piper, D.W.; Anagnostou, C. Late Quaternary evolution of the Gulf of Patras, Greece: Tectonism, deltaic sedimentation and sea–level change. Mar. Geol. 1991, 97, 191–209. [Google Scholar] [CrossRef]
- Koukis, G.; Sabatakakis, N.; Tsiambaos, G.; Katrivesis, N. Engineering geological approach to the evaluation of seismic risk in metropolitan regions: Case study of Patras, Greece. Bull. Eng. Geol. Environ. 2005, 64, 219–235. [Google Scholar] [CrossRef]
- Kalteziotis, N.; Koukis, G.; Tsiambaos, G.; Sabatakakis, N.; Zervogiannis, H. Structural damage in a populated area due to an active fault. In Proceedings of the 2nd International Conference on Recent Advancces in geotechnical Earthquake Engineering and soil Dynamics, Rolla, MO, USA, 11–15 March 1991; pp. 1709–1716.
- Hasiotis, T.; Papatheodorou, G.; Kastanos, N.; Ferentinos, G. A pockmark field in the Patras Gulf (Greece) and its activation during the 14/7/93 seismic event. Mar. Geol. 1996, 130, 333–344. [Google Scholar] [CrossRef]
- Papazachos, B.C.; Papazachou, C. The Earthquakes of Greece; Ziti Publications: Thessaloniki, Greece, 1997. [Google Scholar]
- Papatheodorou, G.; Christodoulou, D.; Geraga, M.; Etiope, G.; Ferentinos, G. The pockmark field of the Gulf of Patras: An ideal natural laboratory for studying seabed fluid flow. In Filed trips guide book “Sedimentology of western and central Greece from Triassic to recent”, Proceedings of the 25th IAS Meeting of Sedimentology, Patras, Greece, 4–7 September 2007.
- Lepichon, X.; Angelier, J. The Hellenic arc and trench system: a key to the neotectonic evolution of the Eastern Mediterranean area. Tectonophysics 1979, 60, 1–42. [Google Scholar]
- Mariolakos, I.; Papanikolaou, D. The neogene basins of the Aegean Arc from the Paleogeographic and the Geodynamic point of view. In Proceedings of the Int. Symp. Hell. Arc and Trench (HEAT), Athens, Greece, 1981; Vol. I, pp. 383–399.
- Mariolakos, I.; Papanikolaou, D. Deformation pattern and relation between deformation and seismicity in the Hellenic arc. Bull. Geol. Soc. Greece 1987, XIX, 59–76. (in Greek). [Google Scholar]
- Mariolakos, I.; Papanikolaou, D.; Lagios, E. A neotectonic geodynamic model of Peloponnesus based on: morphotectonics, repeated gravity measurements and seismicity. Geol. Jb. 1985, 50, 3–17. [Google Scholar]
- Kamberis, E. Geology and petroleum geology study of NW Peloponnese, Greece. Ph.D. Thesis, National Technical University of Athens, Athens, Greece, 1987. [Google Scholar]
- Lekkas, E.; Papanikolaou, D.; Fountoulis, I. Neotectonic map of Greece, sheet "Pyrgos" – "Tropaia" (scale 1/100.000). Project-University of Athens: Athens, Greece, 1992; 120. (in Greek) [Google Scholar]
- Lekkas, E.; Fountoulis, I.; Papanikolaou, D. Intensity distribution and Neotectonic macrostructure Pyrgos Earthquake data (Greece, 26 March 1993). Nat. Hazards 2000, 21, 19–33. [Google Scholar] [CrossRef]
- Scharoo, R.; Visser, P.N.A.M. Precise orbit determination and gravity field improvement for the ERS satellites. J. Geophys. Res. 1998, 103, 8113–8127. [Google Scholar] [CrossRef]
- Roumelioti, Z.; Benetatos, Ch.; Kiratzi, A.; Stavrakakis, G.; Melis, N. A study of the 2 December 2002 (M5.5) Vartholomio (western Peloponnese, Greece) earthquake and of its largest aftershocks. Tectonophysics 2004, 387, 65–79. [Google Scholar] [CrossRef]
- Koukouvelas, I.; Kokkalas, S.; Xypolias, P. Surface deformation during the Mw 6.4 (8 June 2008) Movri earthquake in the Peloponnese and its implications for the seismotectonics of Western Greece. Int. Geol. Rev. 2009. [Google Scholar] [CrossRef]
© 2009 by the authors; licensee Molecular Diversity Preservation International, Basel, Switzerland. This article is an open-access article distributed under the terms and conditions of the Creative Commons Attribution license (http://creativecommons.org/licenses/by/3.0/).
Share and Cite
Parcharidis, I.; Kokkalas, S.; Fountoulis, I.; Foumelis, M. Detection and Monitoring of Active Faults in Urban Environments: Time Series Interferometry on the Cities of Patras and Pyrgos (Peloponnese, Greece). Remote Sens. 2009, 1, 676-696. https://doi.org/10.3390/rs1040676
Parcharidis I, Kokkalas S, Fountoulis I, Foumelis M. Detection and Monitoring of Active Faults in Urban Environments: Time Series Interferometry on the Cities of Patras and Pyrgos (Peloponnese, Greece). Remote Sensing. 2009; 1(4):676-696. https://doi.org/10.3390/rs1040676
Chicago/Turabian StyleParcharidis, Issaak, Sotiris Kokkalas, Ioannis Fountoulis, and Michael Foumelis. 2009. "Detection and Monitoring of Active Faults in Urban Environments: Time Series Interferometry on the Cities of Patras and Pyrgos (Peloponnese, Greece)" Remote Sensing 1, no. 4: 676-696. https://doi.org/10.3390/rs1040676