1. Introduction
Land use/cover change is a major driving force of habitat modification and has important implications for the distribution of wildlife species and ecological systems [
1,
2,
3]. Successful coexistence between wildlife conservation and local uses, and conditions for environmental, social, and economic sustainability of such coexistence is a question that has not been adequately addressed [
4,
5,
6]. Rapid land use/cover change is dynamic, widespread and an accelerating process, mainly driven by natural phenomena and anthropogenic activities, which in turn drives changes that impact humans [
7,
8,
9]. The rapid land use/cover changes, unprecedented in human history especially in developing countries is continuously changing ecosystems, thereby threatening sustainability and livelihood systems [
10]. As human population increases, biodiversity is facing widespread competition with humanity for space and resources and as a result, there is increasing conflict between the need for biodiversity conservation and economic development [
11].
Protected areas, the cornerstone of modern biodiversity conservation, go some way to protecting wildlife species. However, they do not completely protect the biodiversity nor resolve the conservation-development conflicts since they do not always exclude destructive human impacts [
8]. Protected areas also tend to protect only a part of an ecosystem or species range, and wildlife dispersal from such areas may increase conflict with local people [
12]. Even when alternative forms of land use, such as wildlife tourism, are implemented in an attempt to derive sustainable benefits from wildlife, conflict may still remain. The challenge is to identify strategies that ensure conservation and at the same time allow economic development so that mutually sustainable benefits can be derived [
13]. This is a difficult issue especially in developing counties and requires detailed understanding of issues, careful monitoring, adaptive management on the basis of informed decision-making and consensus among various stakeholders.
The Masai Mara Ecosystem in southwestern Kenya, comprising the Masai Mara National Reserve and the adjoining group ranches holds a spectacular concentration of wildlife and is home to the iconic Masai pastoralists and their livestock. The annual wildlife migration offers a great wildlife experience to visiting tourists and was named in September 2007 by the international media as one of the new Seventh Wonders of the World in a global popularity poll contest. The Masai Mara Ecosystem however, embodies many of the current issues in biodiversity conservation. Despite being a vast area incorporating a major protected area, its considerable large wildlife species require access to large, unprotected dispersal ranges inhabited, and increasingly transformed, by agro-pastoral human communities. Expanding commercial farming, tourism and other human activities on land within and adjacent to the national reserve is threatening the sustainable coexistence of the region’s pastoral people with the wildlife populations. The habitat loss and wildlife population decline in Masai Mara has been attributed to population growth and spread of cultivation [
14,
15]. Although habitat fragmentation is thought to be responsible for the decline of many wildlife species, the Masai Mara Ecosystem has many confounding variables making trends analysis difficult because of the unpredictable nature of various causes and factors [
16]. The Masai Mara Ecosystem has different land zones with different land uses. The national reserve, owned and controlled by two local governments is exclusively for wildlife tourism and conservation. The adjacent group ranches on the other hand are owned privately or communally and have multiple land uses, ranging from pastoralism, small-scale farming, mechanized faming and wildlife tourism. This ecosystem also lies on the border with Tanzania, where the socio-economic, political and land tenure systems are different [
15]. Wildlife movement across the borders from Tanzania is another important phenomenon. Animals migrating into Masai Mara from Tanzania occupy the national reserve and the adjoining group ranches, while resident wildlife species also migrate between the reserve and the adjoining dispersal areas within the ecosystem [
17]. These animal migrations show that the protected areas within the ecosystem are not adequate for the protection and viability of migratory wildlife species in the ecosystem and that what happens in the adjoining group ranches have a direct influence on wildlife in the protected areas.
Although a few studies pertaining to wildlife population trends have been conducted in Masai Mara [
14,
18,
19], very little has been done to analyze land use/cover changes and the impact these changes have on the Masai Mara Ecosystem. In addition, these studies have concentrated on wildlife declines without considering the driving forces and thus do not provide sufficient insights into the spatial temporal dynamics of these changes. Therefore, a comprehensive analysis of land use/cover changes and wildlife population dynamics that also considers the primary driving forces behind these changes is needed in order to help in formulating a sustainable development policy for the ecosystem.
How has land use/cover changed in Masai Mara and what are the primary drivers of land use and land cover changes? Are these changes responsible for the declining wildlife population? This study analyzes the long term land use/cover changes and wildlife population trends in the Masai Mara Ecosystem. It summarizes the changes in land use/cover, wildlife and livestock population dynamics, and examines the factors potentially driving these changes. We also present a conceptual model to help explain the interactions of the various factors influencing changes in the Masai Mara Ecosystem. This study was accomplished by integrating multispectral remote sensing data and in-depth field studies together with socio economic, demographic, wildlife data sets and existing research knowledge on the Masai community’s way of life in the ecosystem.
2. Study Area
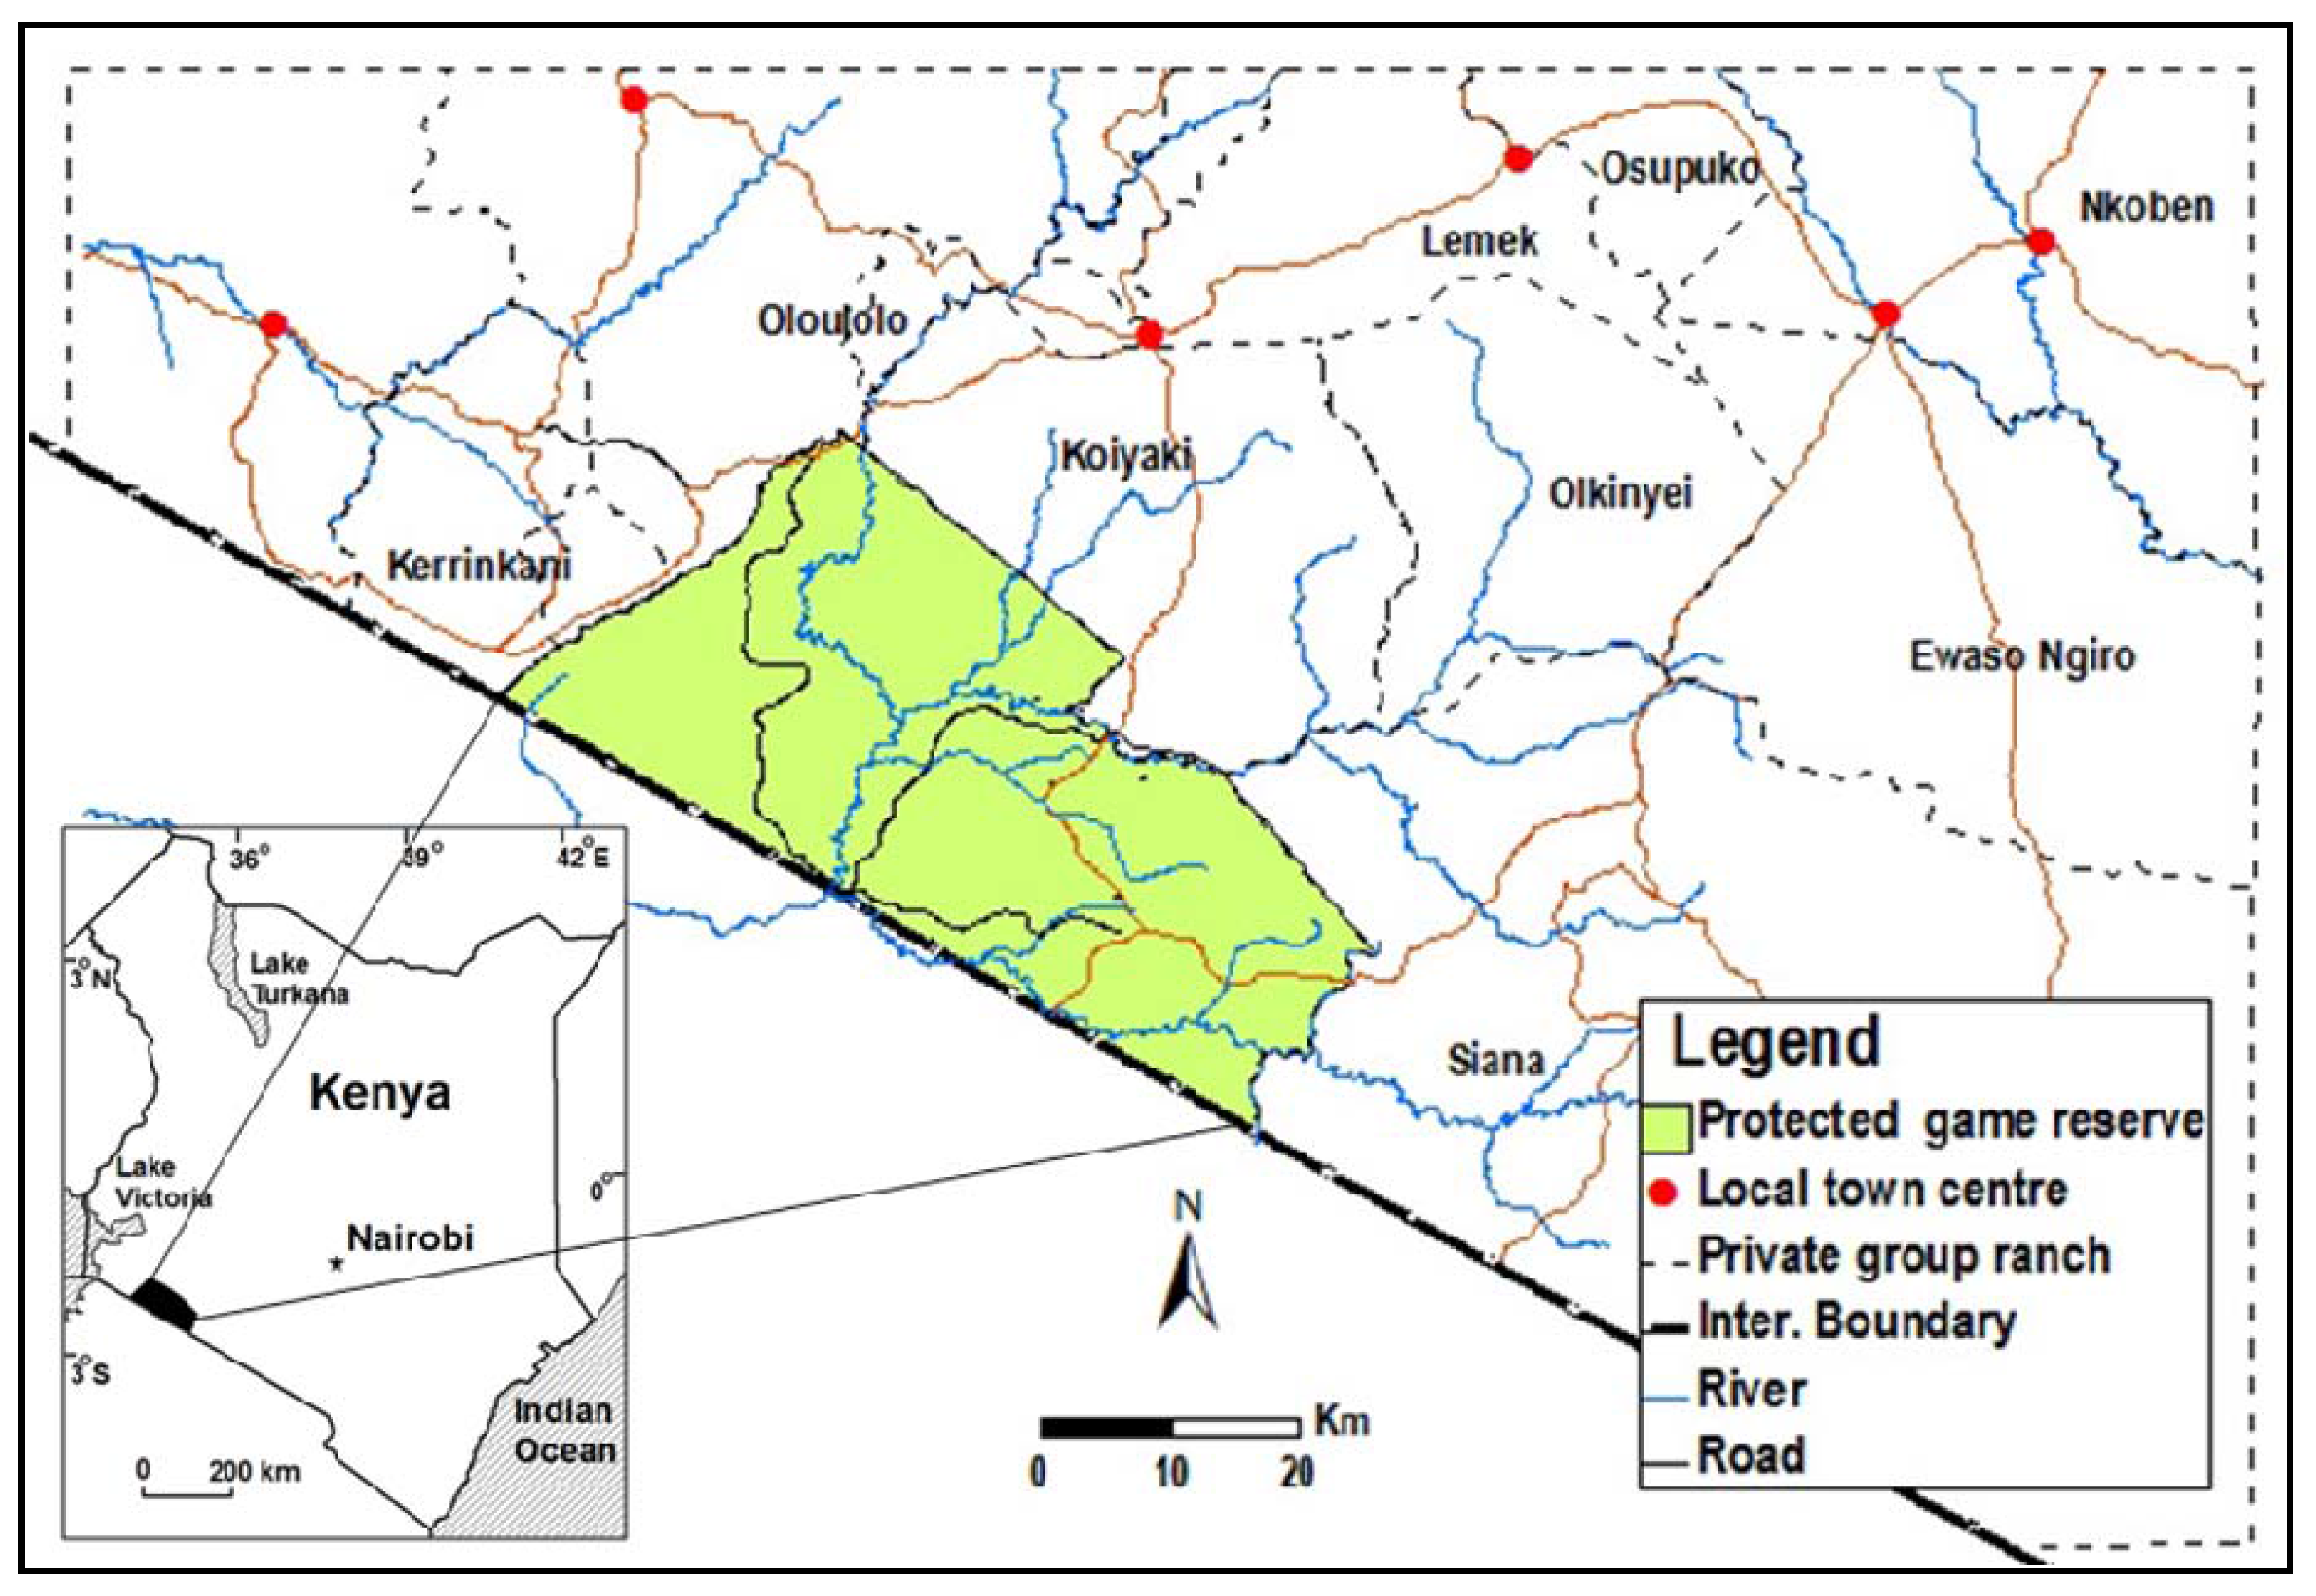
The Masai Mara Ecosystem (
Figure 1) lies in southwestern Kenya and comprises approximately 12,840 square kilometers, of which less than 10% represents Masai Mara National Reserve, while the rest is the unprotected land inhabited by the Masai agro-pastoral community. Laying at an altitude of about 1,600 m above sea level, the Masai Mara Ecosystem is an area of undulating savanna/woodland intersected by numerous drainage lines and bisected by the Mara River [
20]. Annual rainfall normally lies within the range of 800–1,200 mm, with a northwest to southeast declining gradient. Rainfall is bimodal, with a main dry period from mid June to mid October and a shorter dry season during January and February [
21].
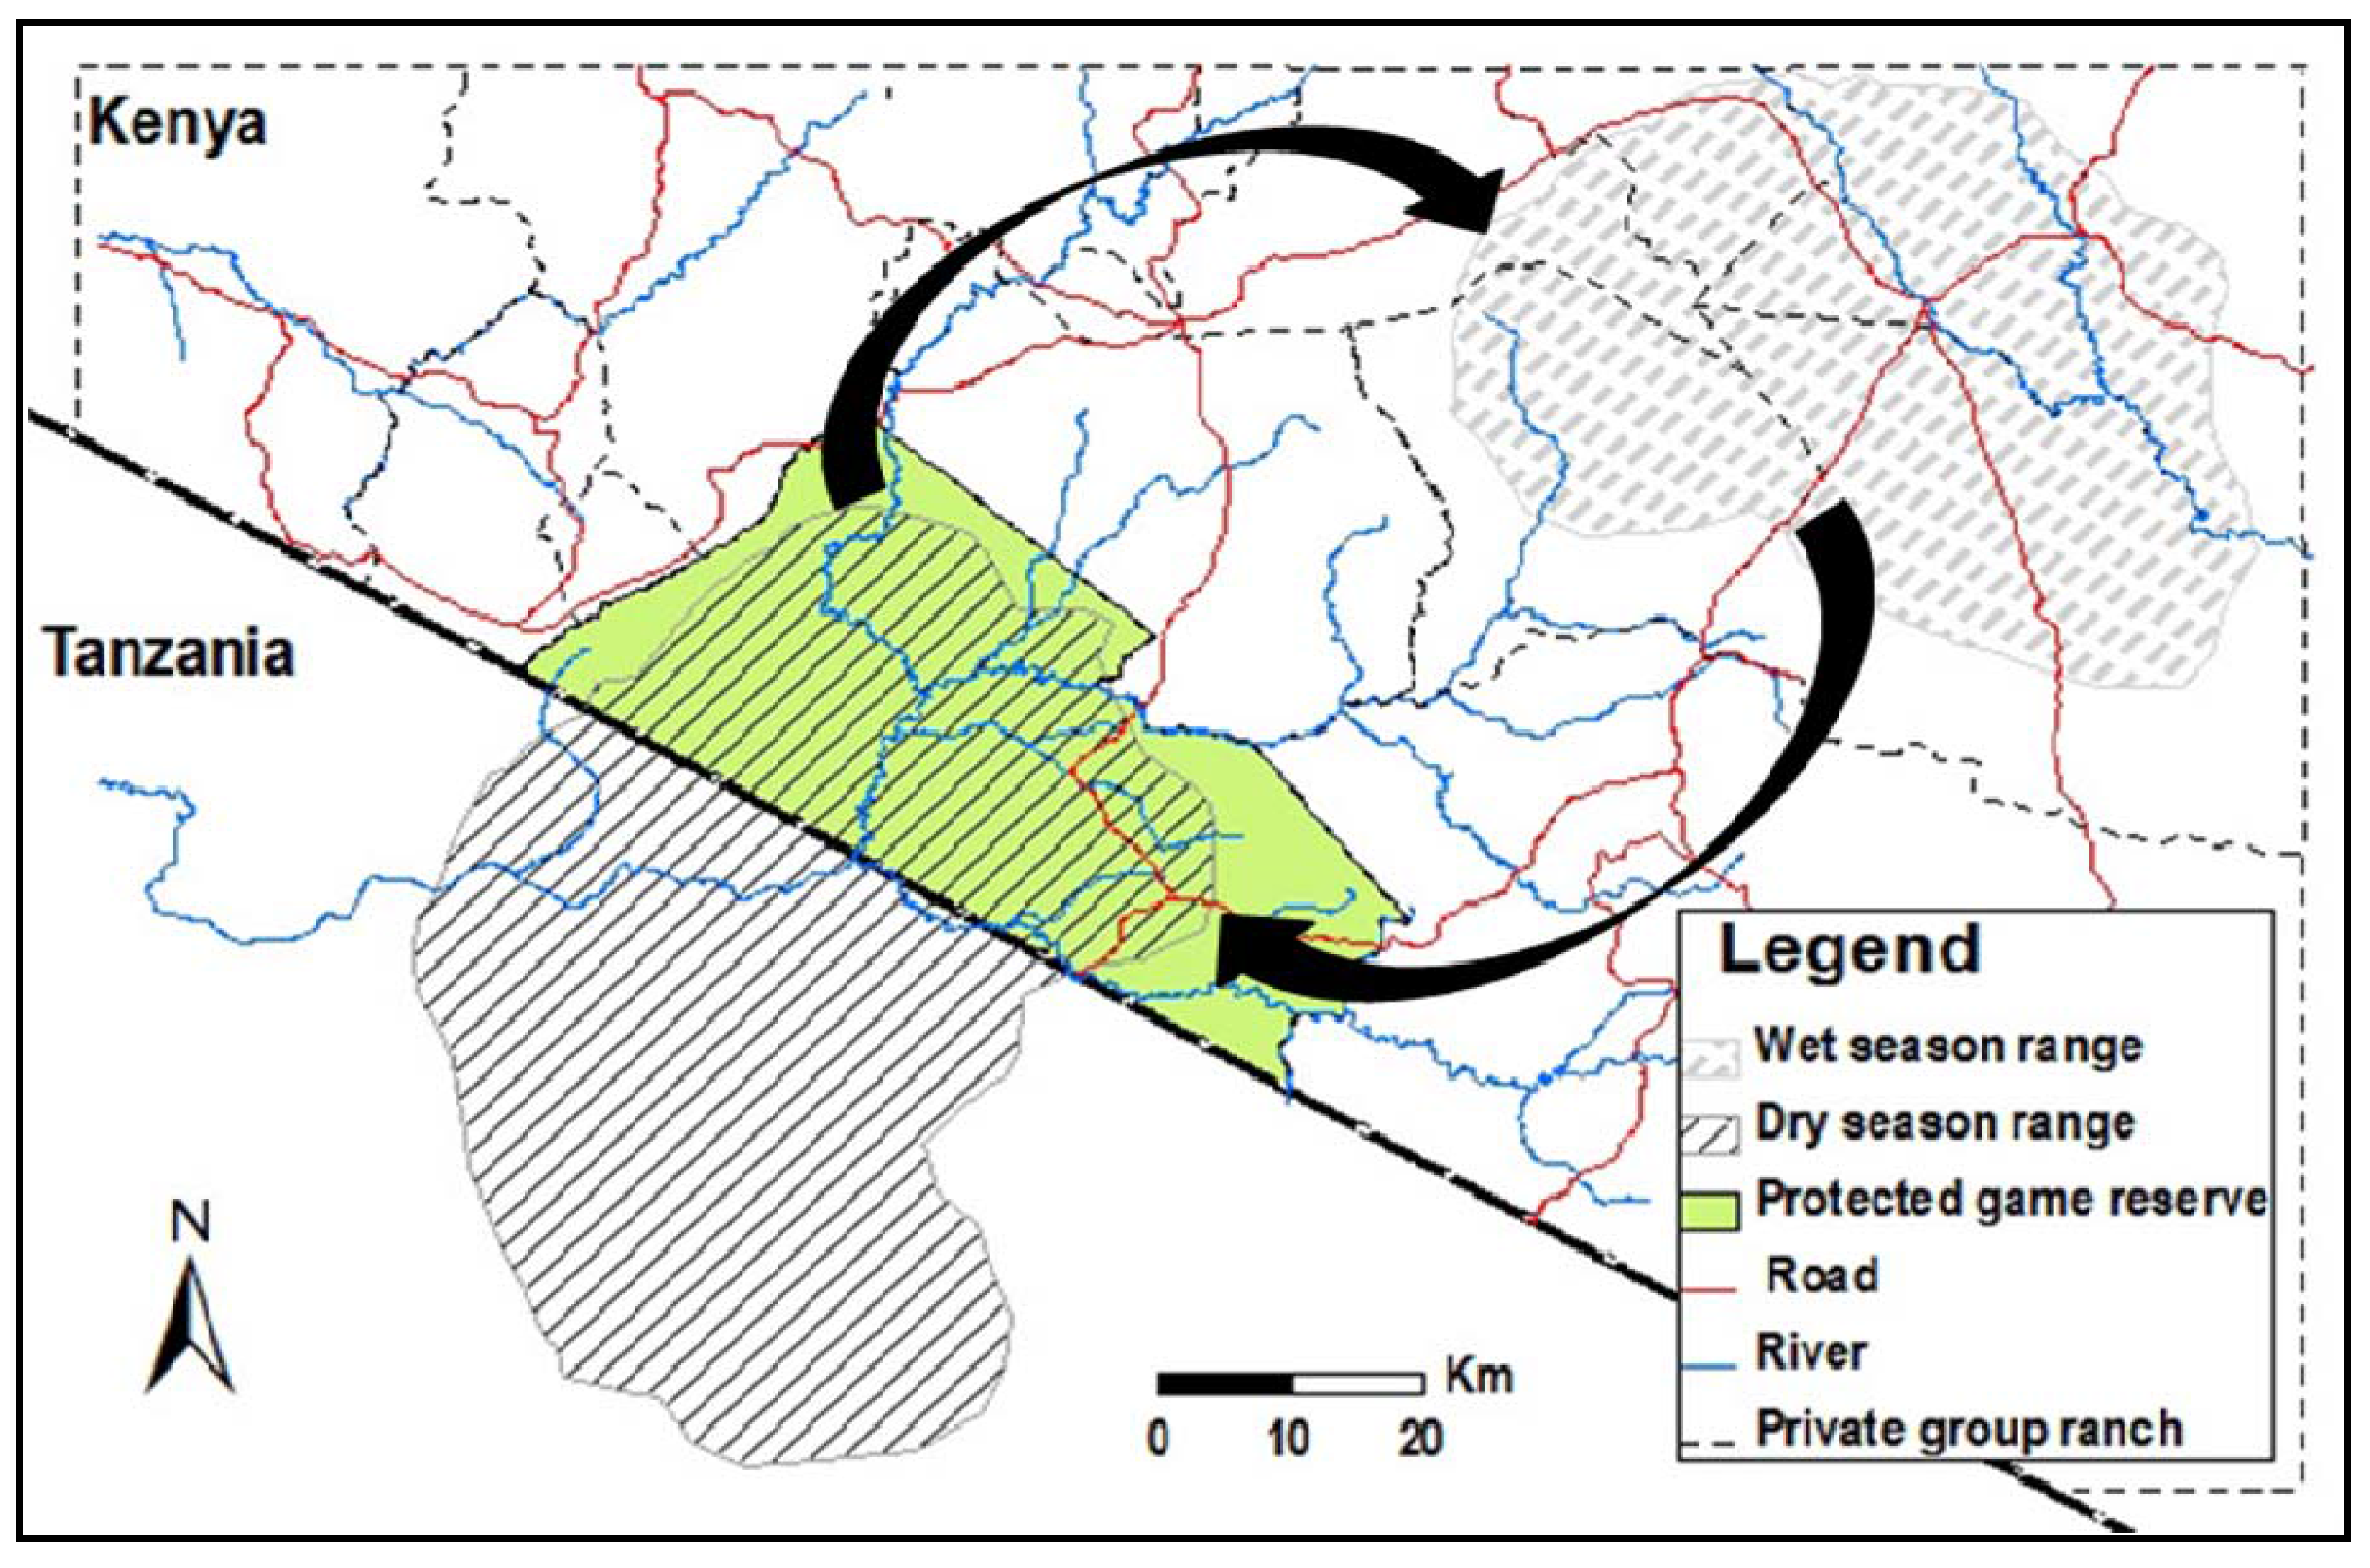
The Masai Mara National Reserve is unfenced and contiguous with unprotected land to the north, east and west, and Serengeti National Park in Tanzania to the south. The national reserve is bounded to the north and west by Siria escarpment, beyond which the land rises to over 2,200 m covered by a mosaic of Afro-montane, semi deciduous and dry-deciduous forest and acacia savanna woodlands [
22]. The Masai Mara Ecosystem is home to a wide range of mammal, bird, and reptile species and is famous for its concentration of migratory herbivores [
17]. The study area shares similar characteristics with Tanzanian Serengeri National Park to the immediate south and wildlife freely migrate between these two parks. Wildlife movements from their dry season range in the protected game reserve to the wet season range in the private group ranches during the wet season is presented in
Figure 2. The sight of hundreds of thousands of these animals migrating together through the grasslands has been described by many popular accounts as one of the greatest wildlife spectacles on Earth [
17,
23]. The vast unprotected area of the ecosystem surrounding the national reserve is a mixture of private and communally owned land [
24]. Historically, the area has been inhabited by the semi nomadic pastoralist Masai people. The land was held in trust for the Masai community by the government, and some areas in the east of the ecosystem still retain this arrangement [
25]. Since the 1970s, these trust lands have been converted into group ranches under local administration. More recently, subdivisions of these group ranches into parcels of privately owned land has been widely promoted, resulting in significant land transformations including mechanized farming and tourism businesses.
Figure 1.
Map of the study area showing the Masai Mara National Reserve and the surrounding privately owned group ranches.
Figure 1.
Map of the study area showing the Masai Mara National Reserve and the surrounding privately owned group ranches.
Figure 2.
Wildlife movements in the study area (modified from Maddock, [
13]).
Figure 2.
Wildlife movements in the study area (modified from Maddock, [
13]).
3. Data and Methods
This study integrates data from different sources, and uses different methods and approaches to analyze the long term land use/cover changes and wildlife population trends. Our approach involved multispectral satellite remote sensing; in-depth fieldwork surveys; land use and land tenure policy analysis linked with habitat change; and human, livestock and wildlife population data analysis. To investigate the wildlife and livestock population changes, animal counts from aerial census conducted in the ecosystem between 1975 and 2007 by the Department of Resource Surveys and Remote Sensing (DRSRS) were used. The data sets were collected using systematic reconnaissance flights fitted with GPS sets. The ecosystem was surveyed from along transects oriented in east-west direction and spaced at 5 km intervals. With well trained and experienced observers, and having calibrated the field of vision using ground markers, the number of animals falling within the survey strips on either side of the aircraft along each 5 km transect were counted and recorded into tape recorders. Groups of animals more than 10 in number were also photographed and later analyzed and counted. Population estimates for every species and every census were thereafter calculated using Jolly II statistics method [
26]. Though this approach gives large standard deviations, the means are good and the methodology and data have been described by different researchers as reliable [
27,
28]. Observations to determine the presence or absence of agricultural activities as well as other development activities were also included and information documented.
To characterize land use/cover changes, we used Landsat MSS data for 1975, Landsat TM for 1986, and ALOS AVNIR-2 data for 2007. The characteristics of these data sets are summarized in
Table 1. In addition we used black and white aerial photographs at a scale of 1:25,000 acquired in 2005, topographical maps at a scale of 1:50,000 produced from aerial photography taken in 1978 and vegetation maps at a scale of 1:50,000 derived from interpretation of rectified 1992 Landsat 5 TM images. The Aerial photographs, topographical maps, and vegetation maps were obtained from the department of survey while rainfall data was obtained from the meteorological department. Secondary data sets such as population census data, socio-economic survey data and land use policy reports that were also used for qualitative analysis of driving forces were obtained from Kenya’s Central Bureau of Statistics.
Table 1.
Key characteristics of satellite data used for land use/cover change analysis.
Table 1.
Key characteristics of satellite data used for land use/cover change analysis.
| Satellite | Sensor | Acquisition date | Resolution |
|---|
| Landsat MSS | Landsat 2 | 1975-2-11 | 75/120 |
| Landsat TM | Landsat 4 | 1986-10-17 | 30/120 |
| ALOS | AVNIR-2 | 2007-7-24 | 10 |
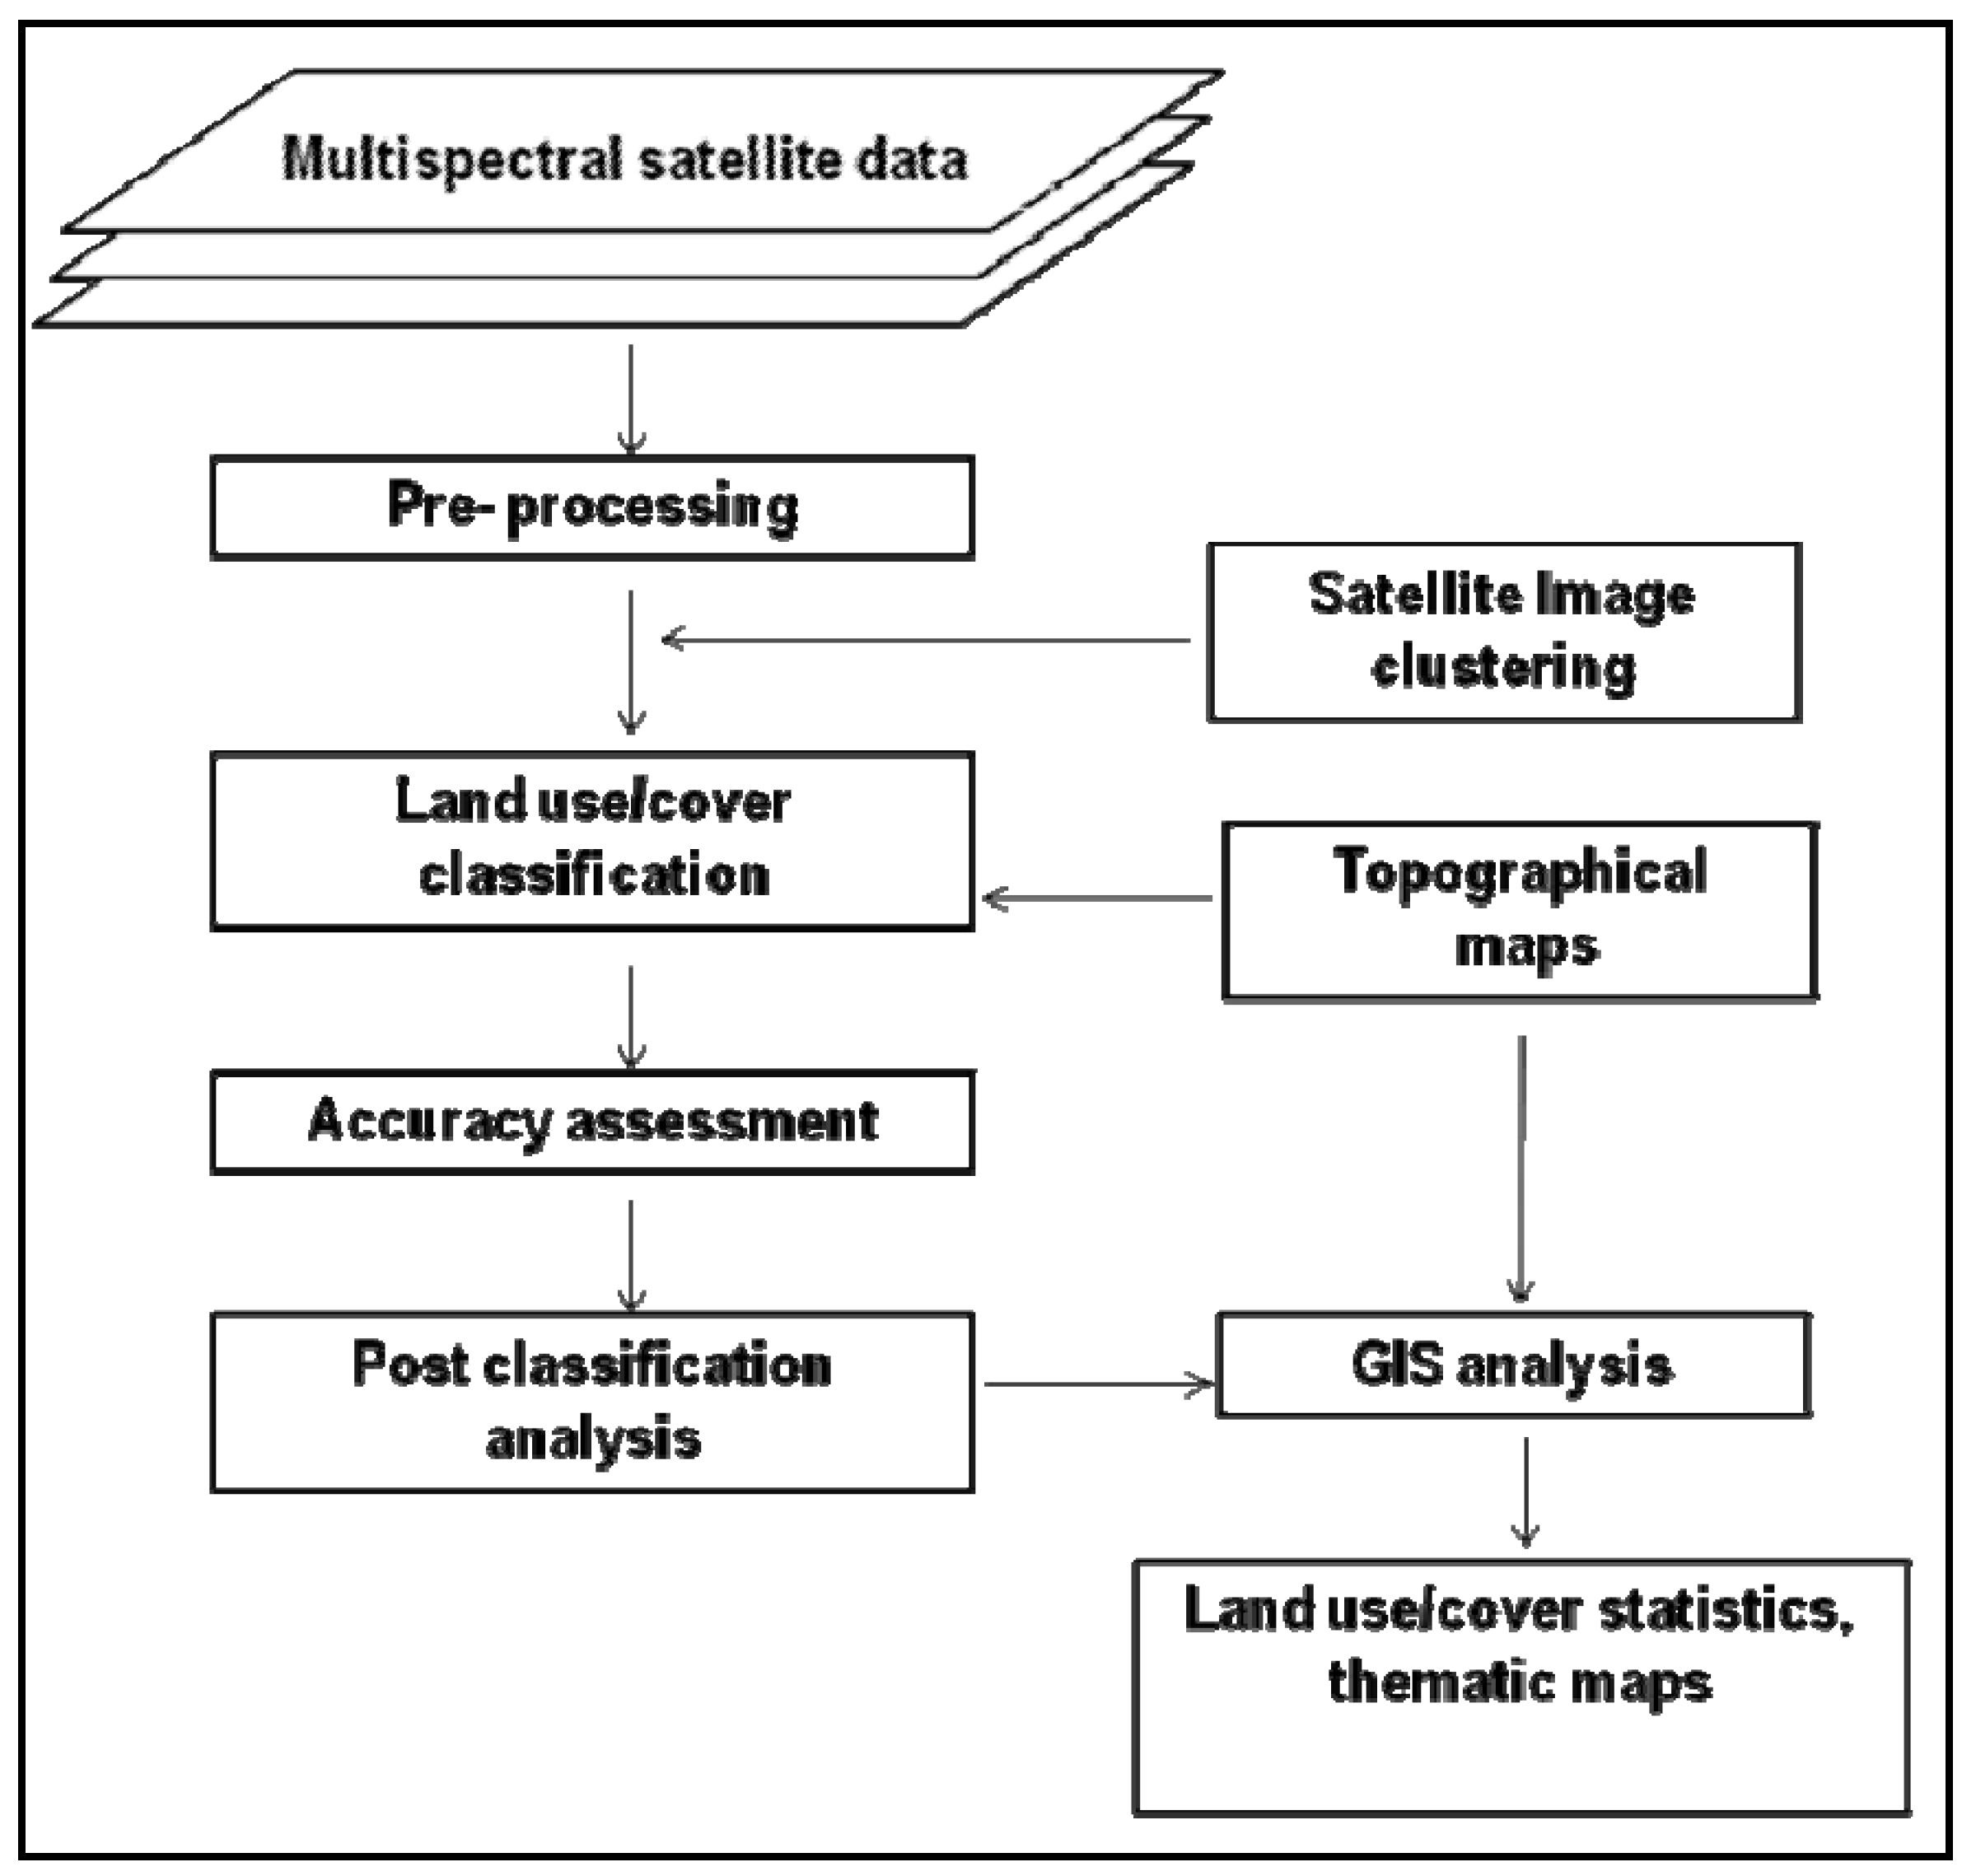
The methodology adopted for land use/cover change analysis is summarized in
Figure 3 and involved radiometric normalization, geo-referencing, land cover classification, accuracy estimation and post classification analysis with GIS. Radiometric normalization of Satellite images was carried out by converting DN values into radiance values using derived calibration coefficients. For geo-referencing the ALOS AVNIR-2 images, available 1:50,000 topographic maps were scanned and rectified for scanning errors. The output thus generated, was used for geo-referencing the 2007 ALOS images to UTM map projection using 50 well distributed ground control points with a root mean square error of about 0.5 pixels. The rectified ALOS AVNIR-2 images were resampled to 30 m pixel size using the nearest neighbor method and a mosaic covering the study area produced. The 2007 ALOS data was subsequently co-registered to the TM and MSS images using image-to-image registration algorithms supplied in Erdas Imagine.
Figure 3.
Study approach adopted for the analysis of land use/cover changes in Masai Mara Ecosystem.
Figure 3.
Study approach adopted for the analysis of land use/cover changes in Masai Mara Ecosystem.
To derive land use/cover information, four land use/cover classes were adopted for image classification based on the modified Anderson land cover scheme levels I and II [
29], and the authors’ a priori knowledge of the study area. These classes were categorized as: (1) farmland; (2) grassland; (3) shrubland; and (4) forest. The choice and modification of the Anderson classification scheme was done with the main purpose for the study in mind and was based on the major land use/cover classes within the study area, and the need to consistently discriminate land use/cover classes using images acquired with different sensors with different spatial resolutions and acquired in different seasons. For land use/cover classification, spectrally homogeneous classes were initially made from ALOS data using an unsupervised classification algorithm. Based on the results of the unsupervised classification, ground data and the authors’ knowledge of the study area, clusters of pixels representing various land use/cover categories were selected as training sets and their spectral response patterns were subsequently generated. The class separability analyses were then carried out by computing the transformed divergence values [
30]. Based on spectral separability of these classes, the training areas were suitably modified and the final spectral response patterns were generated, which were used to classify the ecosystem using a Gaussian maximum likelihood per pixel classifier. Similar procedures were followed for digital analysis of Landsat MSS and TM images. The accuracies of the various land use/cover categories were thereafter estimated following the procedure by [
31]. Post classification analyses and comparisons for various land use/cover results were performed to quantify and identify the changes that occurred over the study period.
National censuses on human population for 1979, 1989 and 1999, demographic and health surveys, national archives, and existing literature on conservation and land use policies were used for qualitative analysis for factors influencing land use/cover changes and wildlife dynamics. In depth field survey of Masai households, complemented by structured interviews quantified land use choices, economic returns and land use conversions to cultivation. Using GIS, qualitative analyses were carried out to identify the main driving forces and a conceptual model, illustrating the competition between different land uses was developed following a similar procedure by [
15].
4. Results and Discussion
4.1. Land Use/Cover and Wildlife Population Changes
In order to assess the thematic accuracy of the land use/cover maps, a stratified random sampling design was used to select a total of 300 pixels for each land use/cover map (1975, 1986, and 2007). The accuracy of the 1975 land use/cover map was assessed with reference to topographical map produced with aerial photography taken in 1978, while for the 1986 land use/cover map, vegetation maps at a scale of 1:50,000 derived from interpretation of rectified 1992 Landsat 5 TM images were used. For the 2007 land use/cover map, aerial photographs taken in 2005 and detailed ground survey conducted in July 2008 were used as reference. Overall land use/cover classification accuracy levels for the three dates range from 85 to 90 per cent, with Kappa statistics ranging from 0.79 to 0.88 (
Table 2). These accuracies were sufficient for the analysis of the study area because they satisfy the minimum accuracy stipulated by [
29] for satellite-derived land use/cover maps.
Table 2.
Summary of land use/cover classification accuracies for 1975, 1986 and 2007.
Table 2.
Summary of land use/cover classification accuracies for 1975, 1986 and 2007.
| Land Use/cover | 1975 | 1986 | 2007 |
|---|
| Producer’s | User’s | Producer’s | User’s | Producer’s | User’s |
|---|
| Farm land | 85% | 87% | 88% | 85% | 92% | 95% |
| Grassland | 84 | 79 | 89 | 81 | 85 | 89 |
| Shrubland | 86 | 89 | 86 | 89 | 87 | 90 |
| Forest | 87 | 86 | 93 | 84 | 97 | 89 |
| Overall accuracy | 85 | – | 86 | – | 90 | – |
| Kappa statistic | 79 | – | 83 | – | 88 | – |
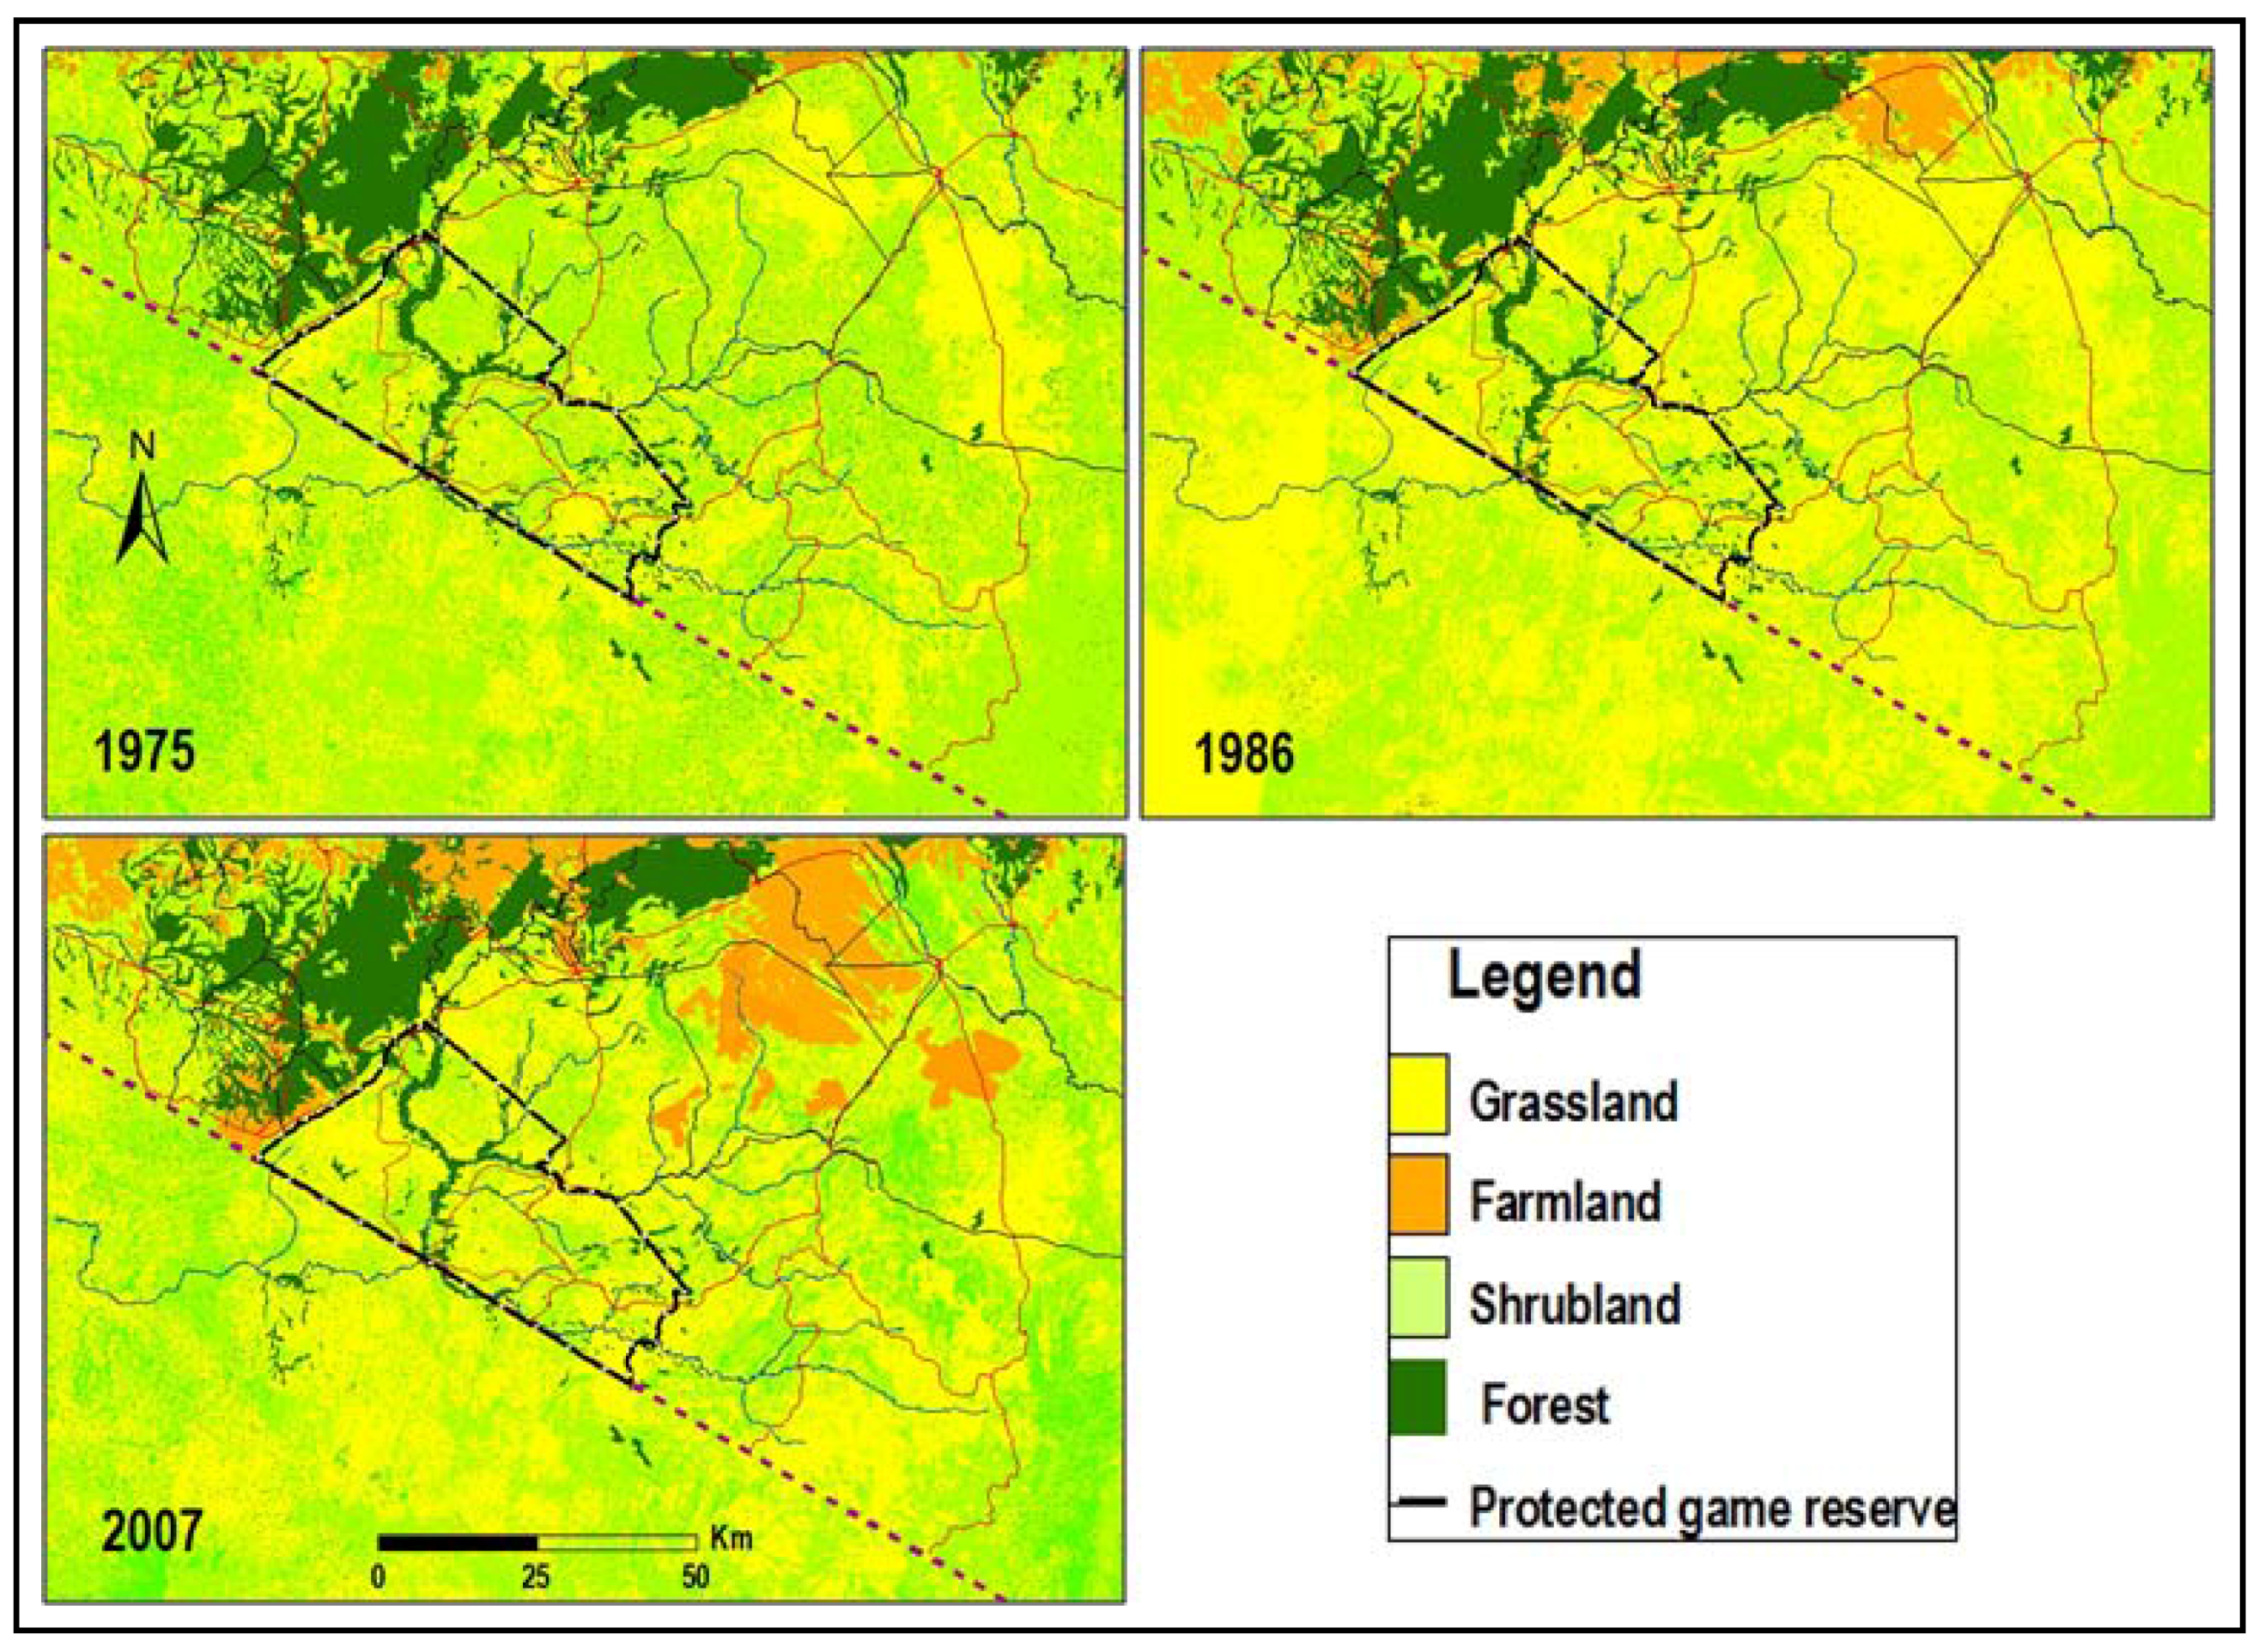
The general patterns of land use/cover for 1975, 1986 and 2007 are presented in
Figure 4. Farmland, grassland, shrubland and forestland were the dominant land use/cover classes. Computed percentages of land use/cover classes show that in 1975, farmland, grassland, shrubland and forest areas occupied 1, 19, 11, and 69 per cent respectively (
Table 3). However, significant spatial expansion in agriculture and the rapid decrease in forest cover within and close to Masai Mara National Reserve were observed in the 1986 and 2007 land use/cover maps. The area under agriculture increased from 1% to 12% while forested areas reduced from 11% to 9 %. Significant expansion of farmland, extending to over 100,000 ha, was observed to have taken place in areas previously under grasslands that were used by wildlife as dispersal areas and also as breeding and calving grounds during the wet season. The expanding agricultural farms and deforestation to create room for mechanized farming and tourism businesses were noted to be serious and continuing problems in Masai Mara.
Figure 4.
Land use/cover maps of Masai Mara Ecosystem derived from satellite data for 1975, 1986 and 2007.
Figure 4.
Land use/cover maps of Masai Mara Ecosystem derived from satellite data for 1975, 1986 and 2007.
Table 3.
Land use/cover changes in Masai Mara Ecosystem derived from satellite images.
Table 3.
Land use/cover changes in Masai Mara Ecosystem derived from satellite images.
| Land use/cover class | 1975 | | 2007 | % change
1975–2007 |
|---|
| Area (ha) | % | | Area (ha) | % |
|---|
| Agriculture | 15,540 | 1.2 | | 147,490 | 11.5 | 10.3 |
| Grassland | 243,940 | 18.9 | | 191,070 | 14.9 | −4 |
| Forests | 138,430 | 10.8 | | 123,600 | 9.6 | −1.2 |
| Shrublands | 886,090 | 69 | | 822,030 | 64 | −5 |
| Total | 1,284,000 | 100 | | 1,284,000 | 100 | |
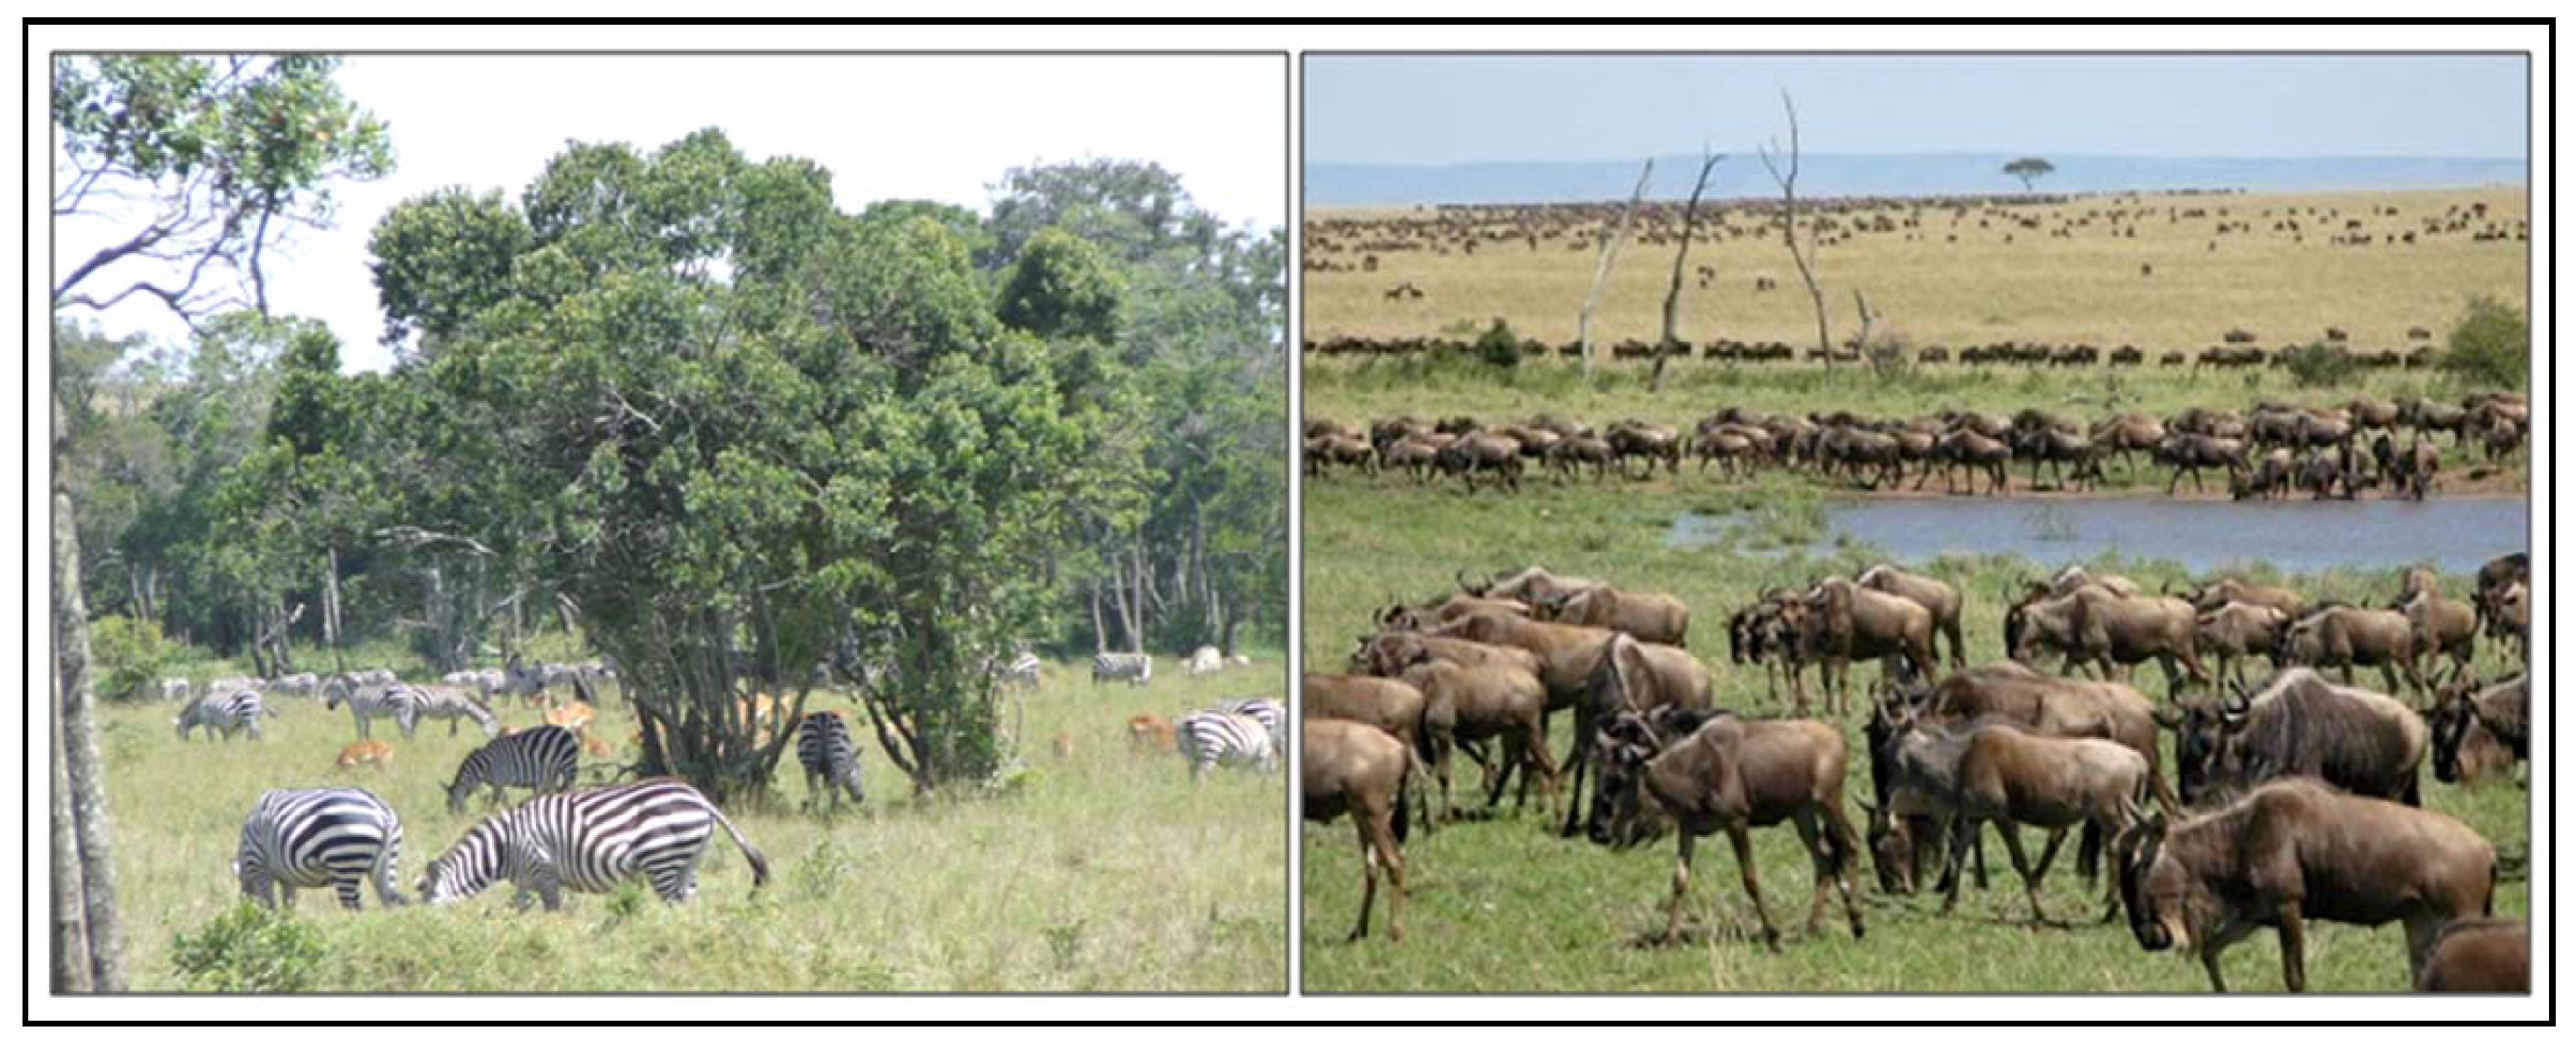
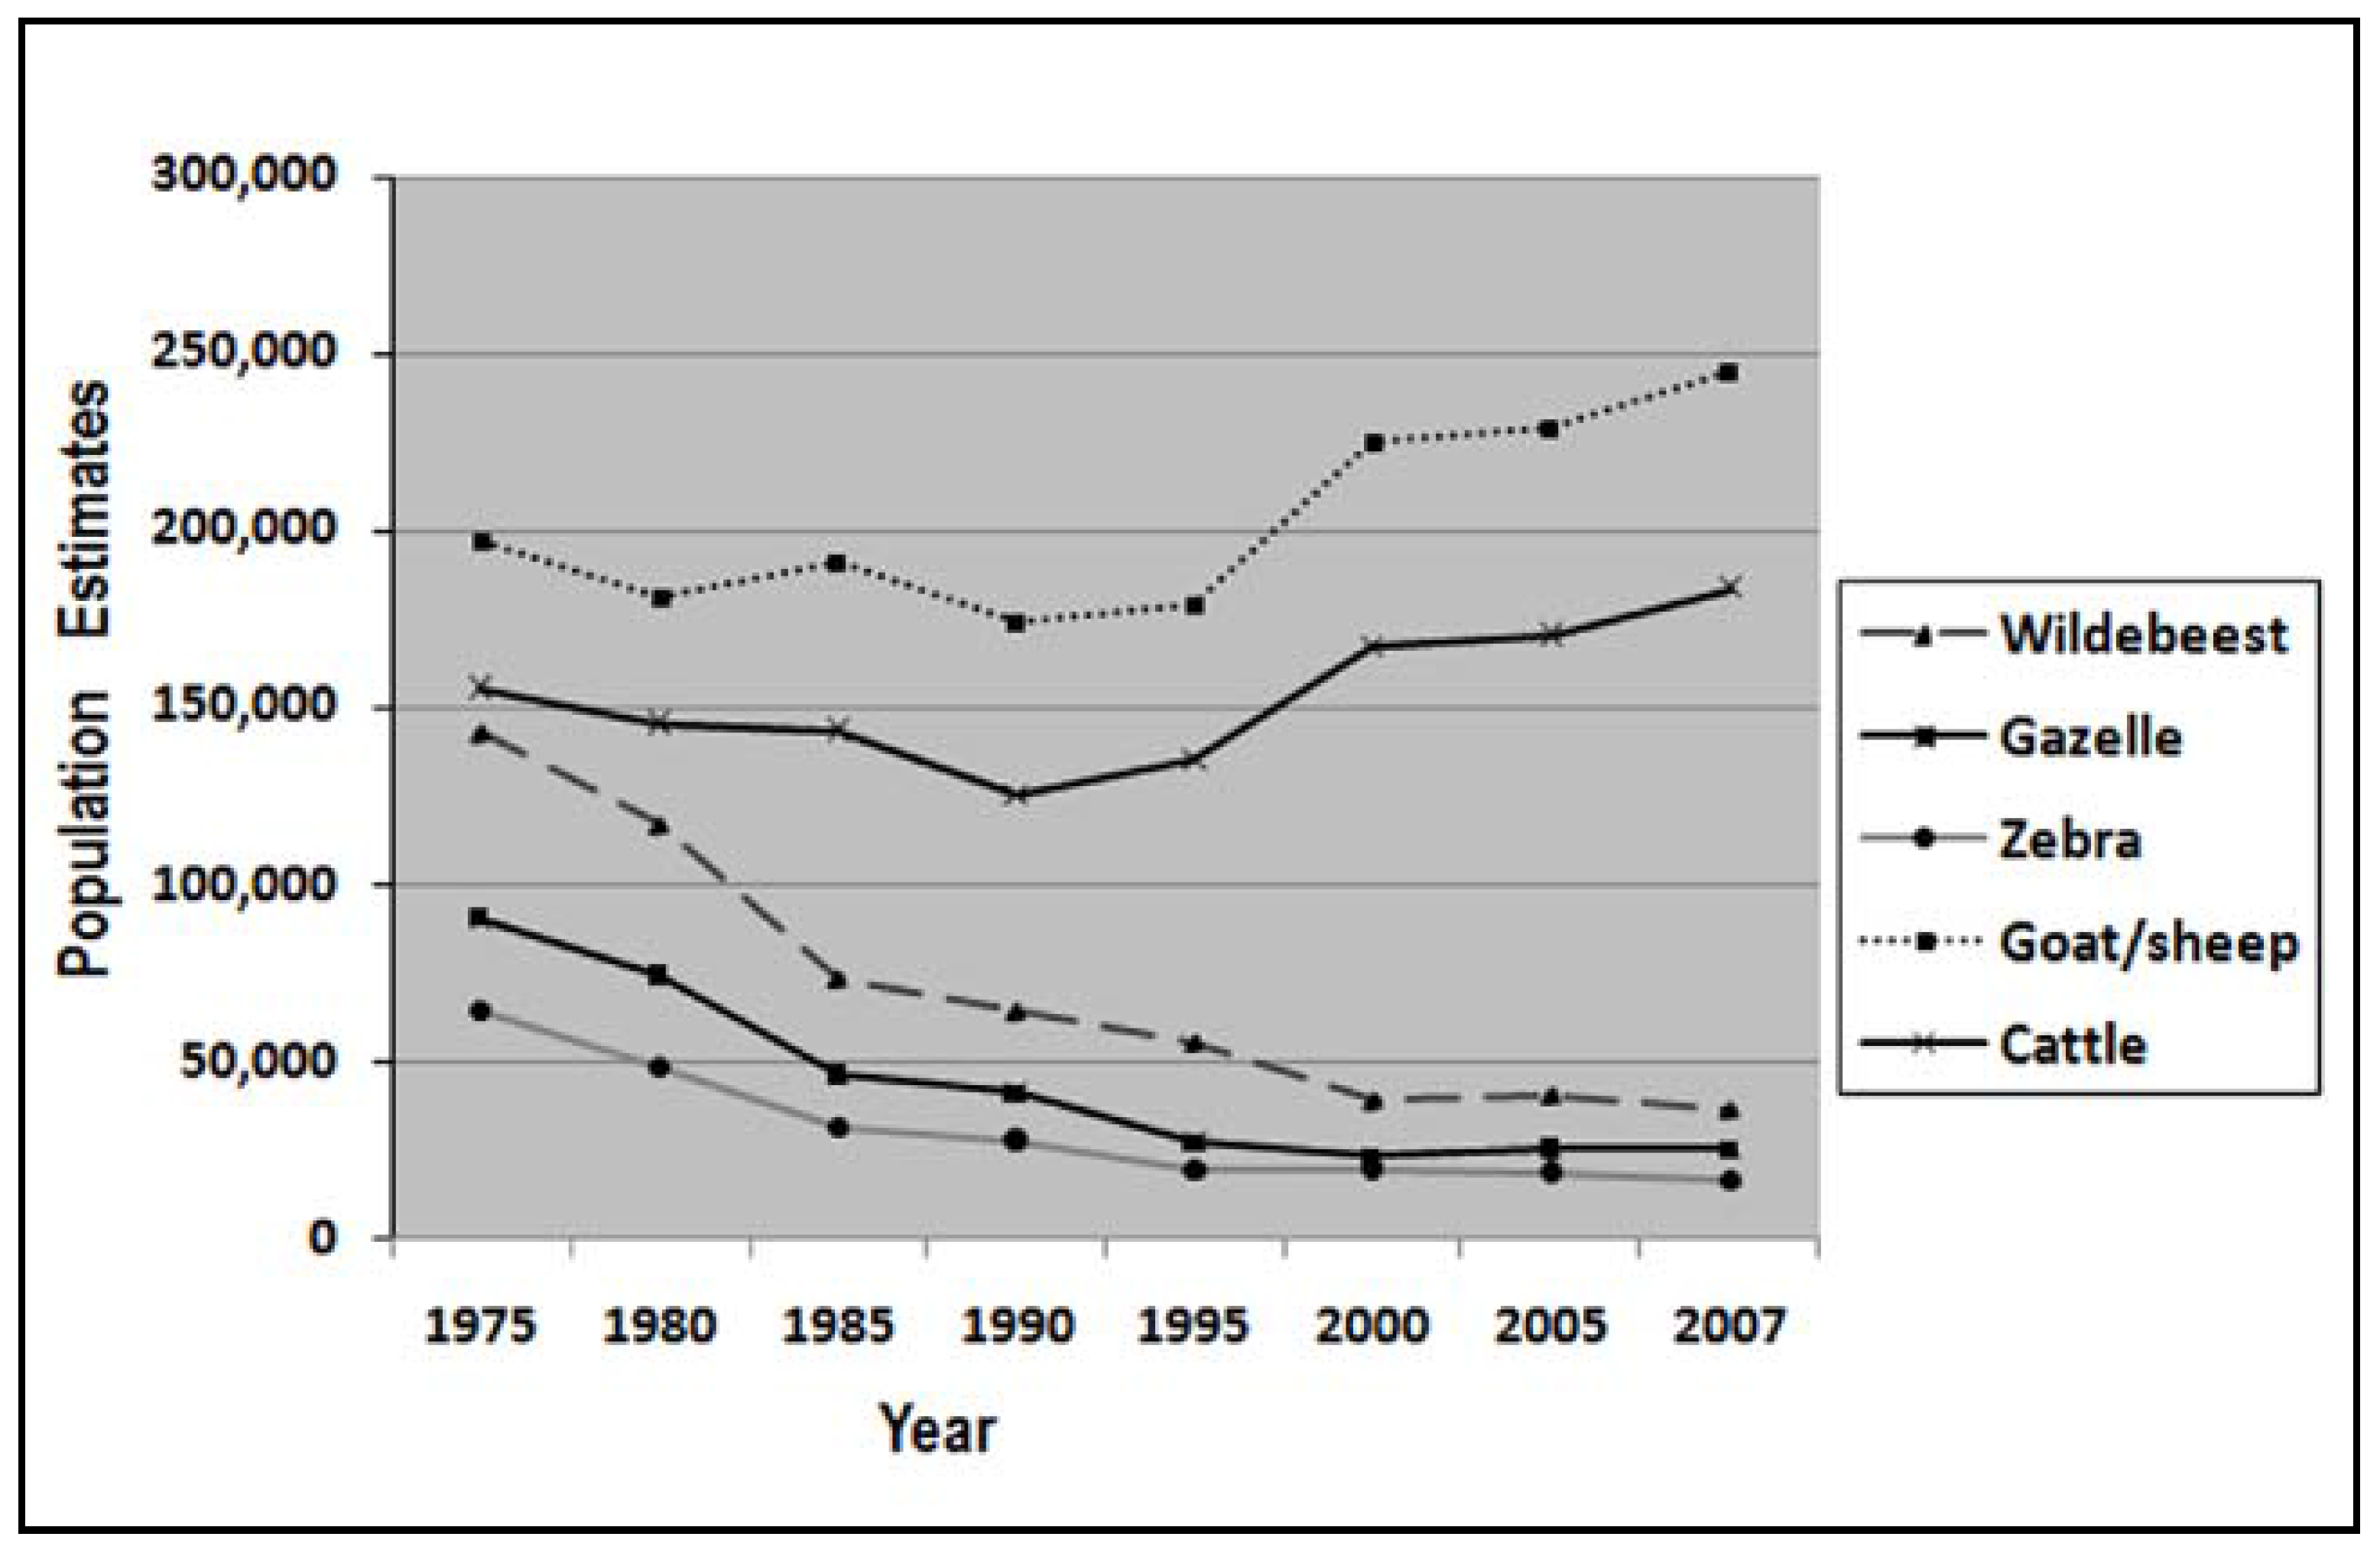
Analysis of long-term aerial census data acquired through animal counts from aerial surveys conducted between 1975 and 2007 show rapid declines for most wildlife species in Masai Mara Ecosystem.
Figure 5 illustrates the high concentration of wildlife species in Masai Mara while
Figure 6 summarizes the population trends for the livestock and the three most abundant wildlife species in the ecosystem, i.e., the wildebeest, zebra and gazelles. In general, the total non migratory wildlife population declined by 58% during the study period where giraffe, topi, buffalo, and warthog decreased by 73%–88%, while waterbucks, Thomson gazelle, kogoni, grants gazelle, and eland declined by about 60%. Impala, elephant and ostrich showed no changes in population.
Figure 5.
High concentrations of different wildlife species are common in the Masai Mara Ecosystem.
Figure 5.
High concentrations of different wildlife species are common in the Masai Mara Ecosystem.
Figure 6.
Wildlife and livestock population trends in Masai Mara Ecosystem, 1975–2007. Source: Aerial survey by Department of Resource Surveys and Remote Sensing (DRSRS).
Figure 6.
Wildlife and livestock population trends in Masai Mara Ecosystem, 1975–2007. Source: Aerial survey by Department of Resource Surveys and Remote Sensing (DRSRS).
The wildebeest dominate Masai Mara Ecosystem wildlife numbers and biomass, and their migrations define the ecosystem. Our analysis shows wildebeest population decreased by 74% over the 32-year study period. We compared the fluctuations with wet and dry rainfall data and observed a strong correlation with the wet season and dry season food supply. Further analysis, complemented by field surveys, show that expansion of mechanized farming took place (see
Figure 2 and
Figure 4) on the wet season rangelands that were fenced off to exclude wildlife. This excluded the animals from their former wet season range as the areas were converted to commercial wheat farms, with the period 1985–1997 showing the most marked decrease in wildebeest and zebra populations. Analysis of livestock population over the same period shows fluctuating patterns with an increasing trend in the recent years.
4.2. Factors Driving Land Use/Cover and Wildlife Population Changes
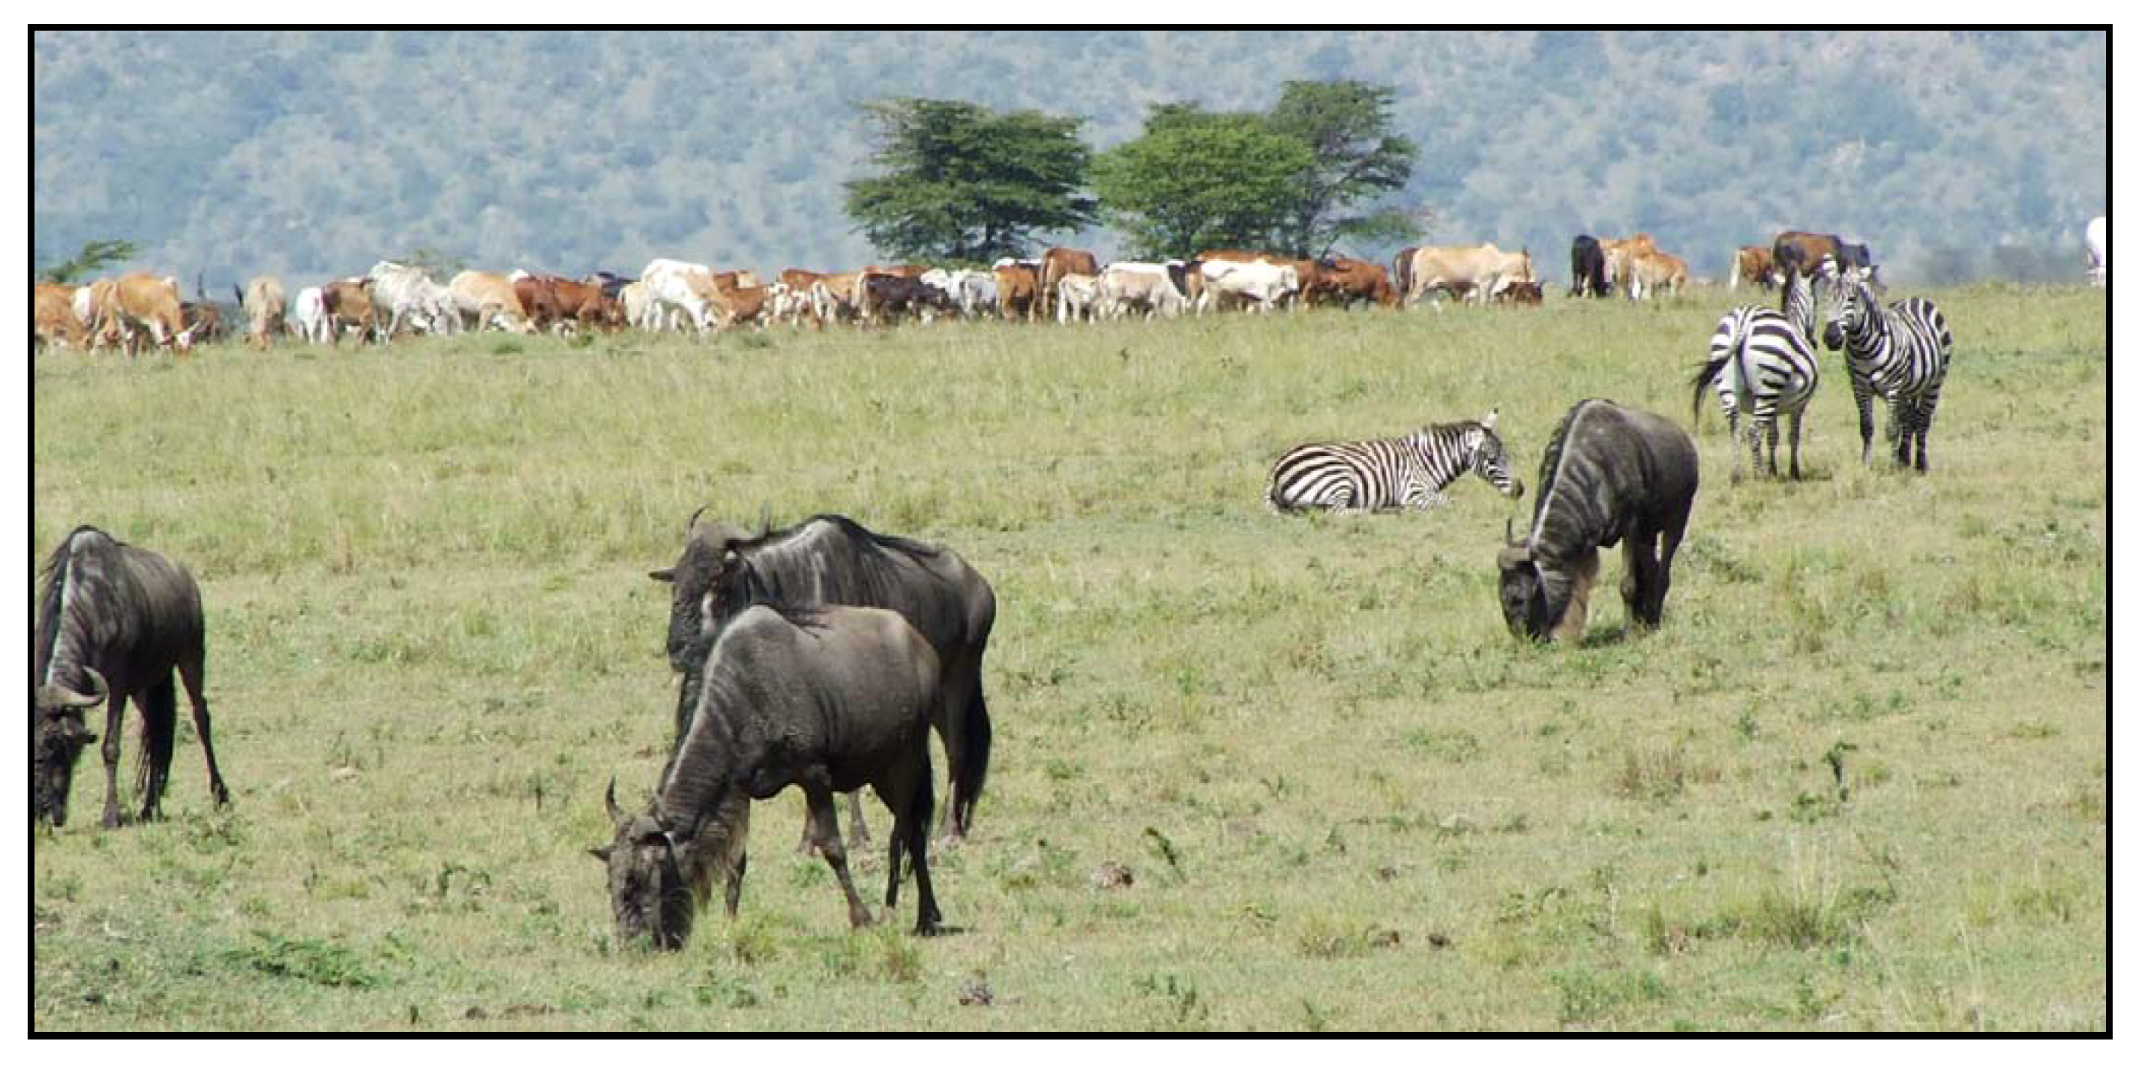
The analysis of the land use/cover changes and wildlife population trends has revealed substantial changes in Masai Mara Ecosystem over the 32-year study period. Agricultural farms around Masai Mara National Reserve have expanded from about 15,000 ha in 1975 to over 147,000 ha in 2007, suggesting that agricultural expansion is one of the major driving forces of land use/cover change and wildlife decline. Based on our field observations and questionnaire-based interviews, a number of factors may be responsible for the encroachment of agricultural practices into areas formally used sorely for livestock and wildlife. Some of the main ones include the government policy that is increasingly discouraging nomadic pastoralism in favor of permanent settlement, changing land ownership policies from communal ownership to individual ownership, and the big financial gains derived from mechanized farming as compared to pastoralism. Agricultural expansion therefore is a major threat to wildlife conservation in Masai Mara and for the wildlife conservation (i.e., preservation of open grazing lands) to be perceived as an advantage over agriculture, it will have to provide better revenue for the local people than the agricultural activities. At the same time, livestock population trends over the past three decades show that cattle and sheep are on the increase in Masai Mara (see
Figure 6). More intensified competition with wildlife as shown in
Figure 7 is leading to diminishing pastures and this is suspected to be causing more declines in wildlife population.
Figure 7.
Livestock and wildlife grazing together. There is increased competition for pastures due to increasing livestock production in Masai Mara.
Figure 7.
Livestock and wildlife grazing together. There is increased competition for pastures due to increasing livestock production in Masai Mara.
Another major factor driving changes in Masai Mara is the changing land tenure policy. Traditionally, land was owned communally, and this system made it possible to practice nomadic pastoralism, which ensured sustainable livestock production as well as survival of wildlife [
25]. However because of government policy, and in order to ensure security of land tenure to facilitate development, communally owned land is being subdivided into individual ranches. Our field interviews revealed that these land tenure changes have affected Masai traditions and wildlife conservation. Land privatization has meant that the formerly communal rangelands first demarcated as group ranches and more recently these group ranches have been internally subdivide into individual plots for which titles have been allocated to registered members [
25]. This has opened the way for individual landowners to make land use decisions over cultivation, livestock and/or wildlife based activities, land lease or sale on the basis of financial gains. It has also allowed large entrepreneurs that we interviewed, to buy or lease extensive areas and to establish profitable mechanized wheat farming. This has precipitated huge habitat losses and therefore in turn wildlife loss in the buffer zones as well as in the protected Masai Mara National Reserve.
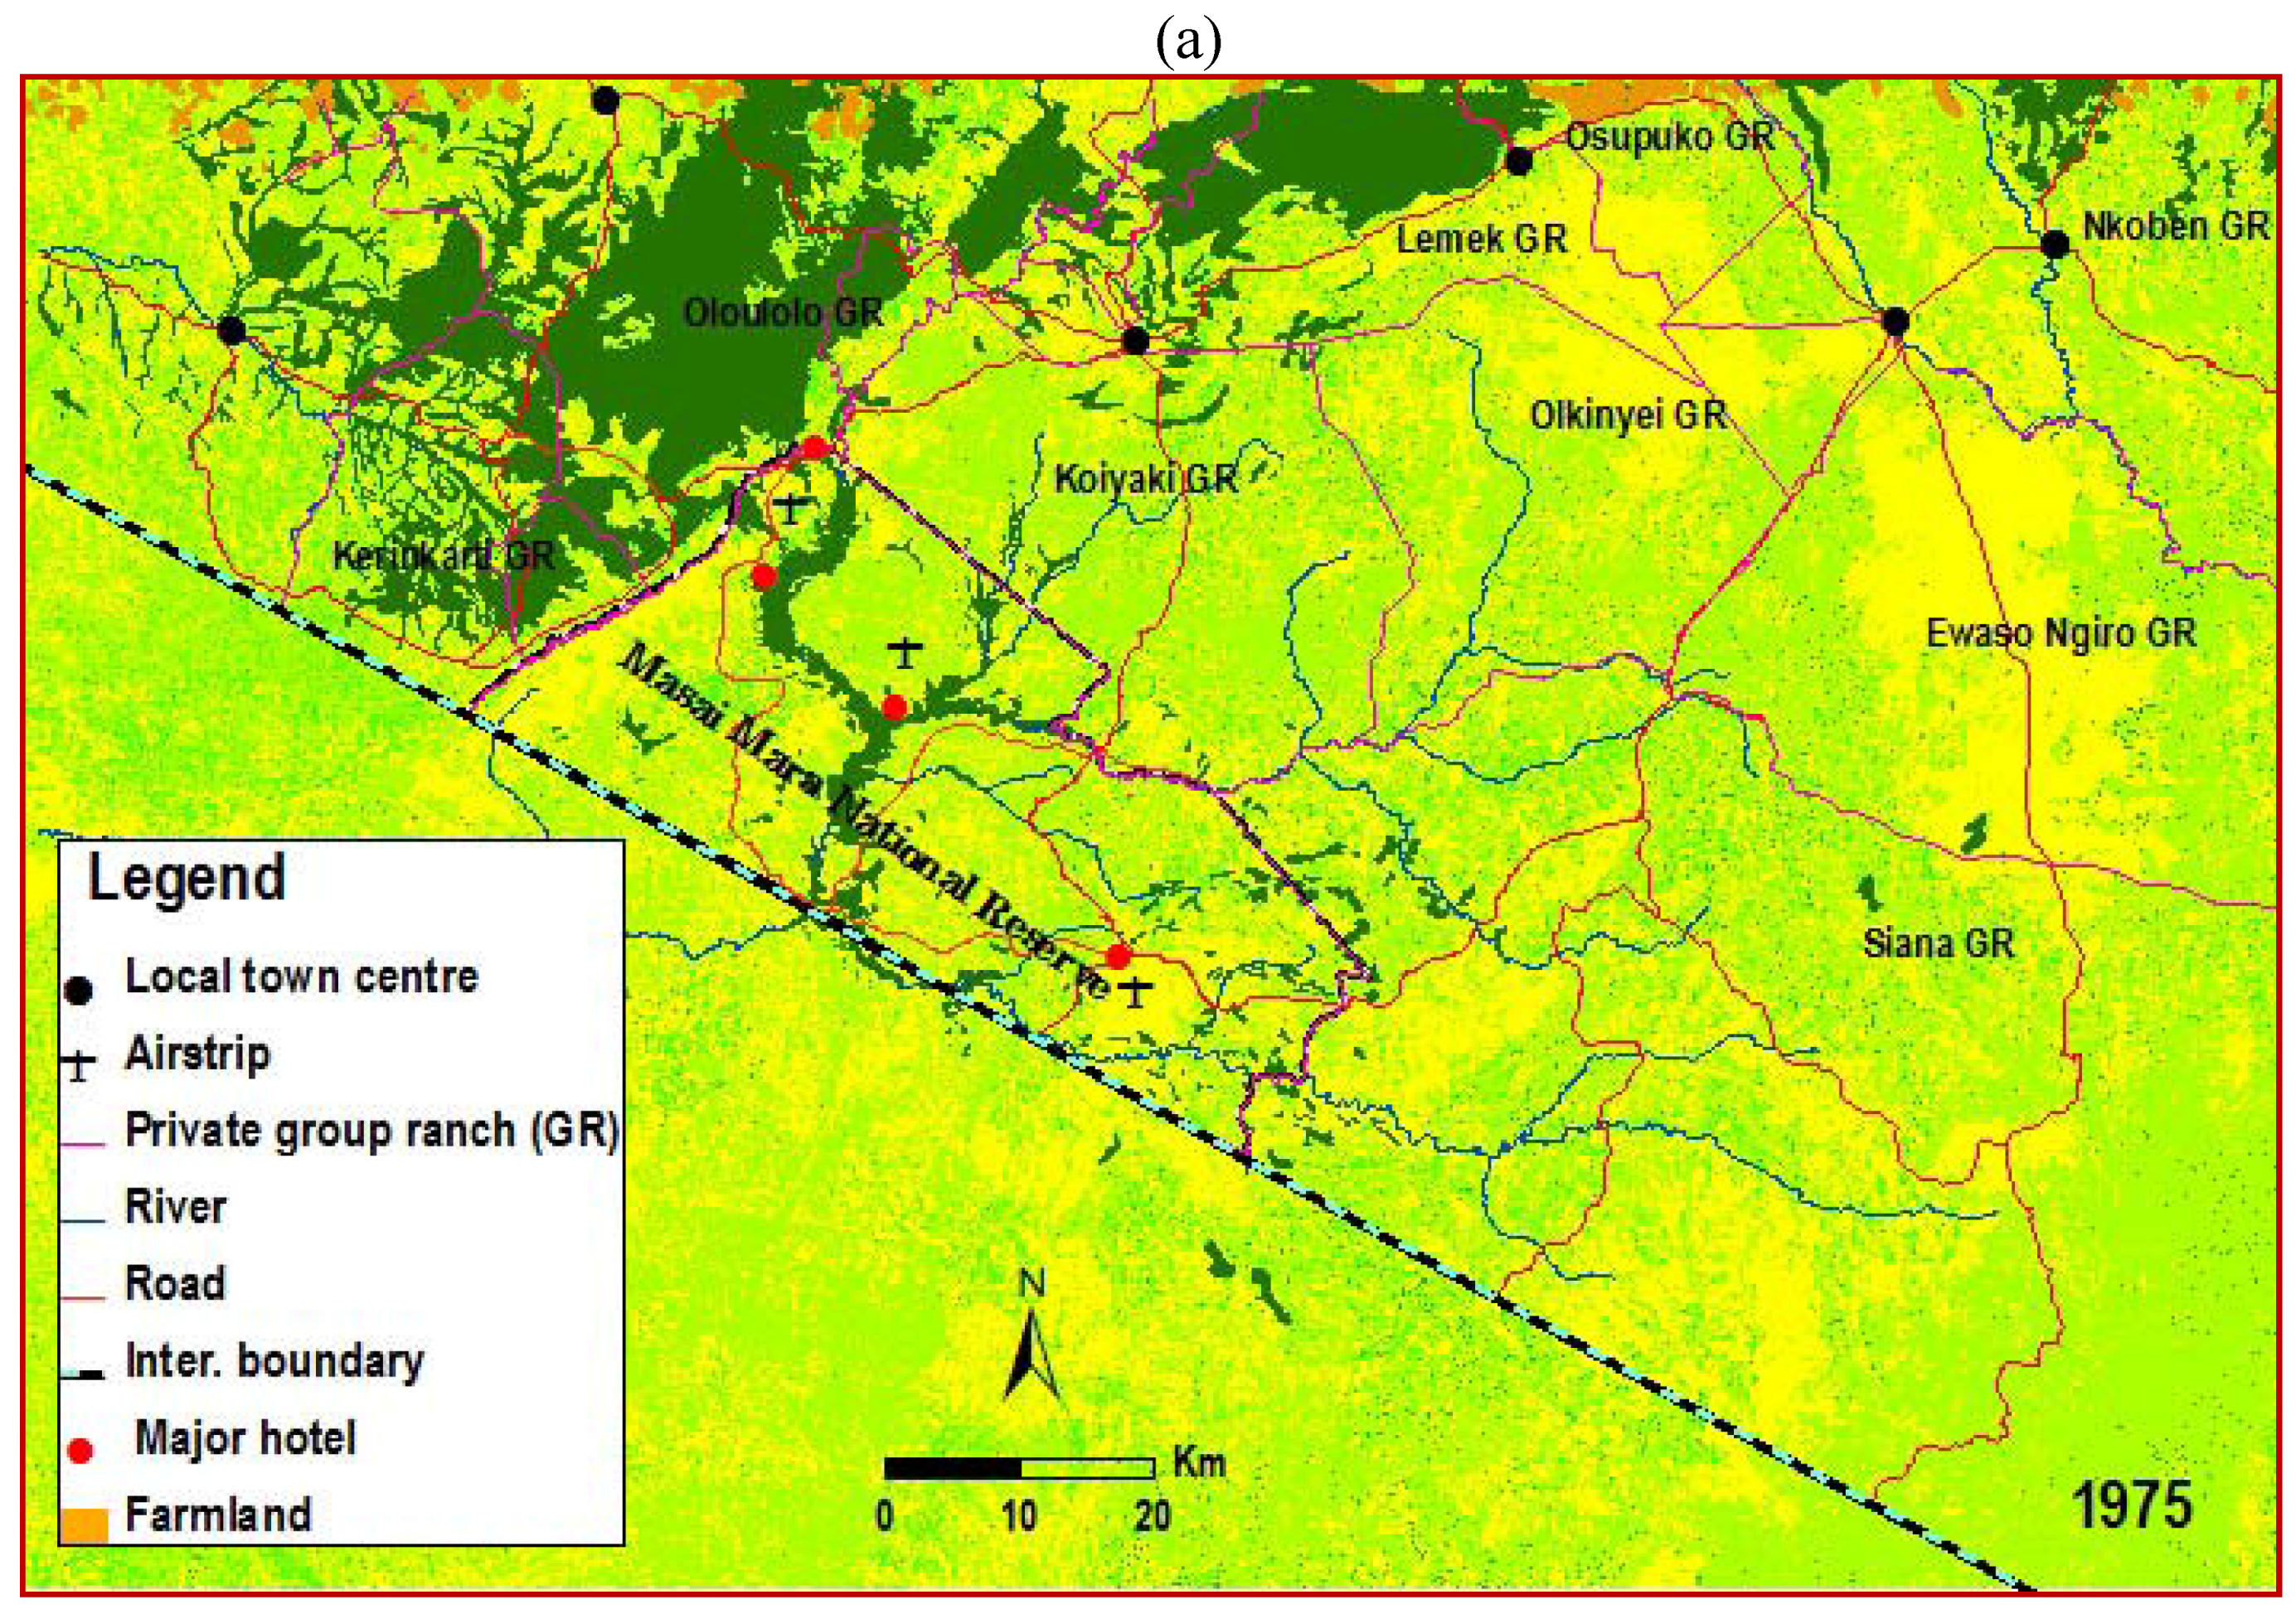
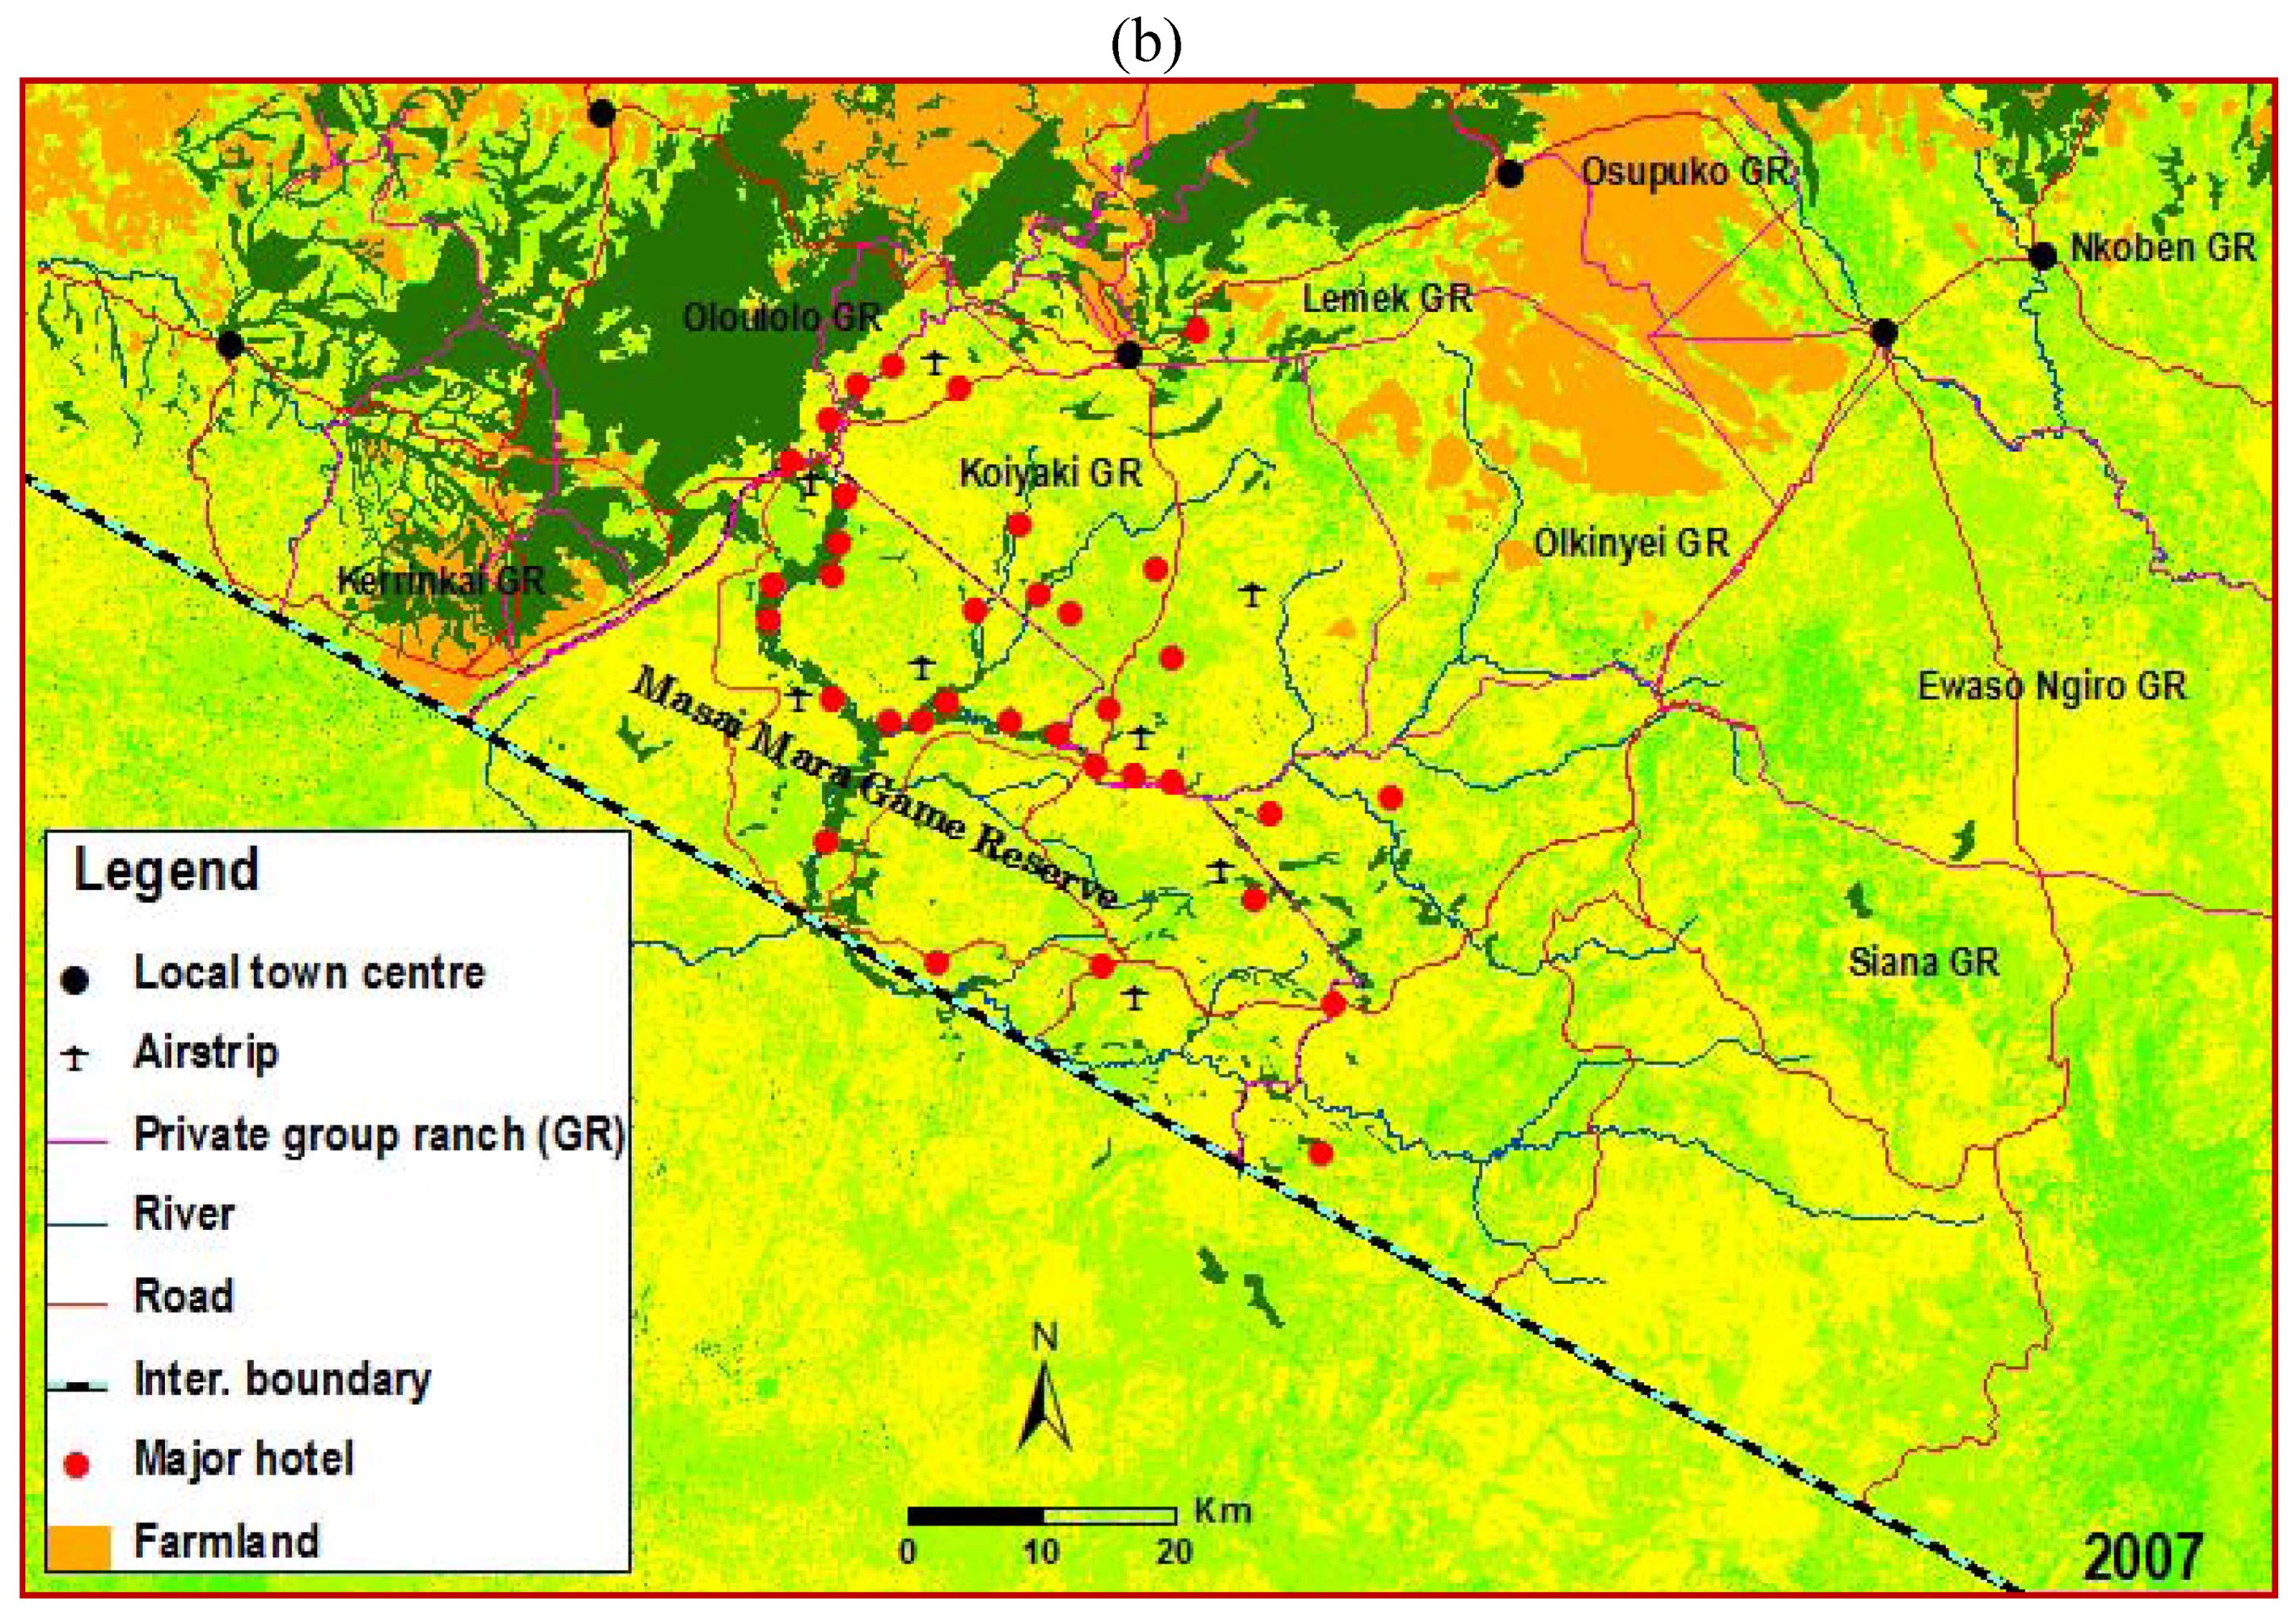
Increasing tourism activities have also affected land use/cover changes and wildlife population dynamics in the ecosystem. The tourism industry is the number one revenue generator in Kenya and Masai Mara is among the most popular destinations. Available data shows that international tourists’ arrivals in Masai Mara have increased from 114,000 in 1975 to over 350,000 per year in 2007 with demand highest in June–September season [
33]. Development of tourist facilities within Masai Mara National Reserve and in the surrounding group ranches has been rapid in response to the increasing number of tourists. In 1975 for example, there were only five hotels and lodges and these have increase to a total of over 140 hotels, lodges and camps sites with a capacity of over 10,000 beds. This increased proliferation of unplanned development of tourist facilities as shown in
Figure 8 has led to habitat destruction and consequently to the observed loss of wildlife. In an attempt to have tourists view wildlife from their hotels, the tourist facilities have mushroomed in ecologically fragile areas that serve as breeding and carving grounds for most wildlife species. Our field survey showed that these facilities have also disturbed animal’s migration patterns and increased habitat fragmentation.
Figure 8.
Maps showing the extent of agricultural expansion and mushrooming tourism facilities in Masai Mara Ecosystem. Tourist facilities have increased from five in 1975 to 140 in 2007: (a) 1975 scenario; (b) 2007 scenario.
Figure 8.
Maps showing the extent of agricultural expansion and mushrooming tourism facilities in Masai Mara Ecosystem. Tourist facilities have increased from five in 1975 to 140 in 2007: (a) 1975 scenario; (b) 2007 scenario.
The increasing tourist arrivals have also led to increased number of tourist vehicles into the ecosystem [
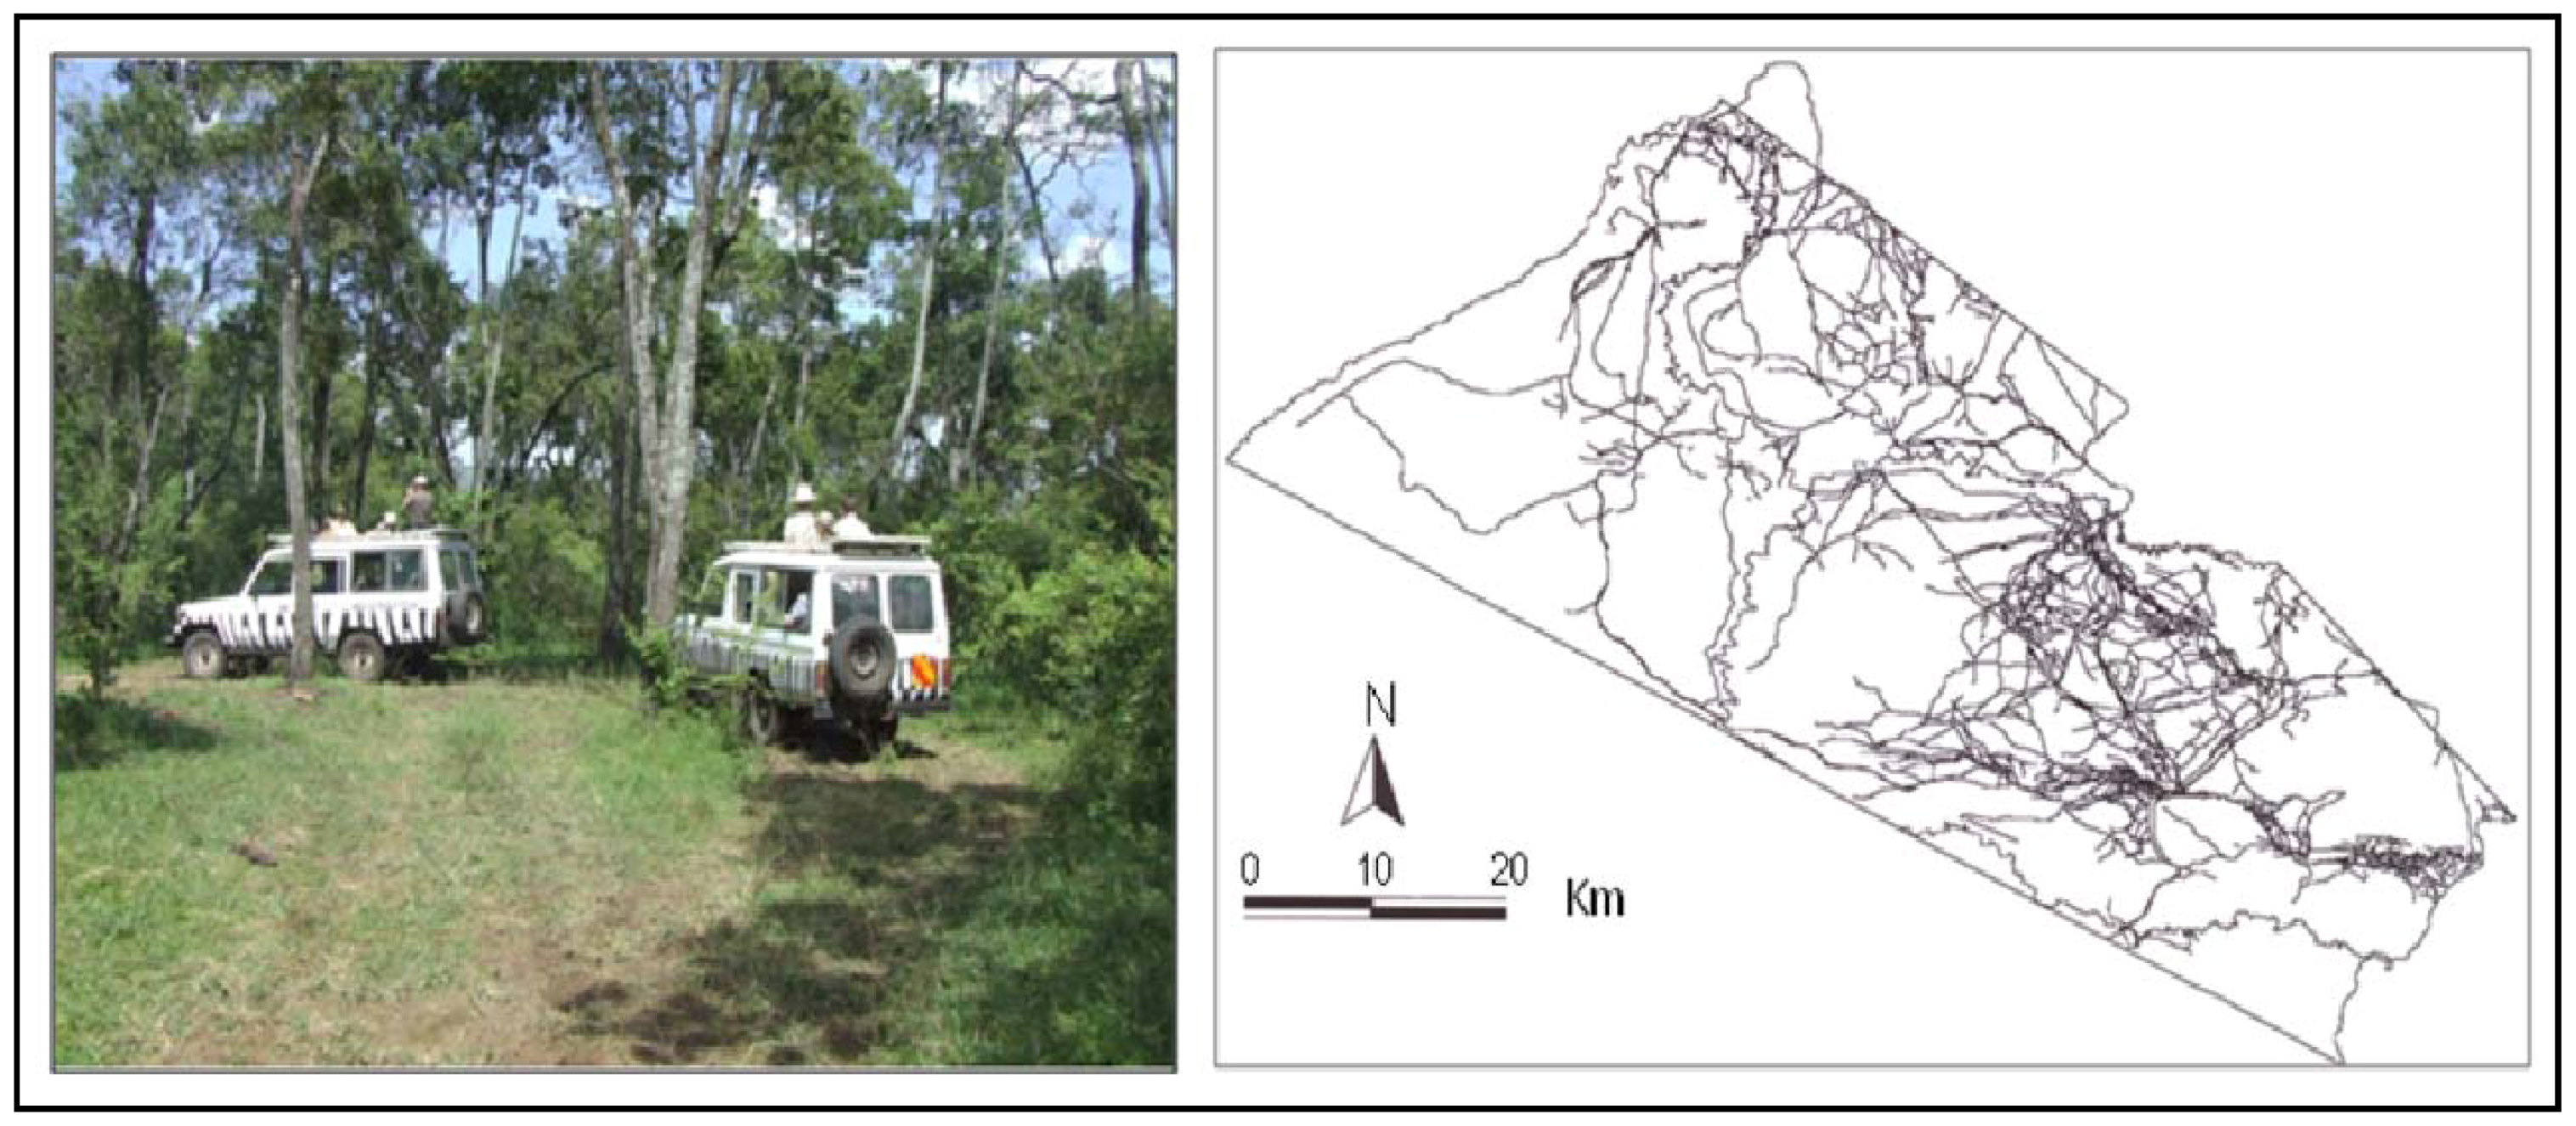
33]. With no planned tour circuits for viewing animals, vehicles crisscross all over and follow animals wherever they are. This repeated off road driving as shown in
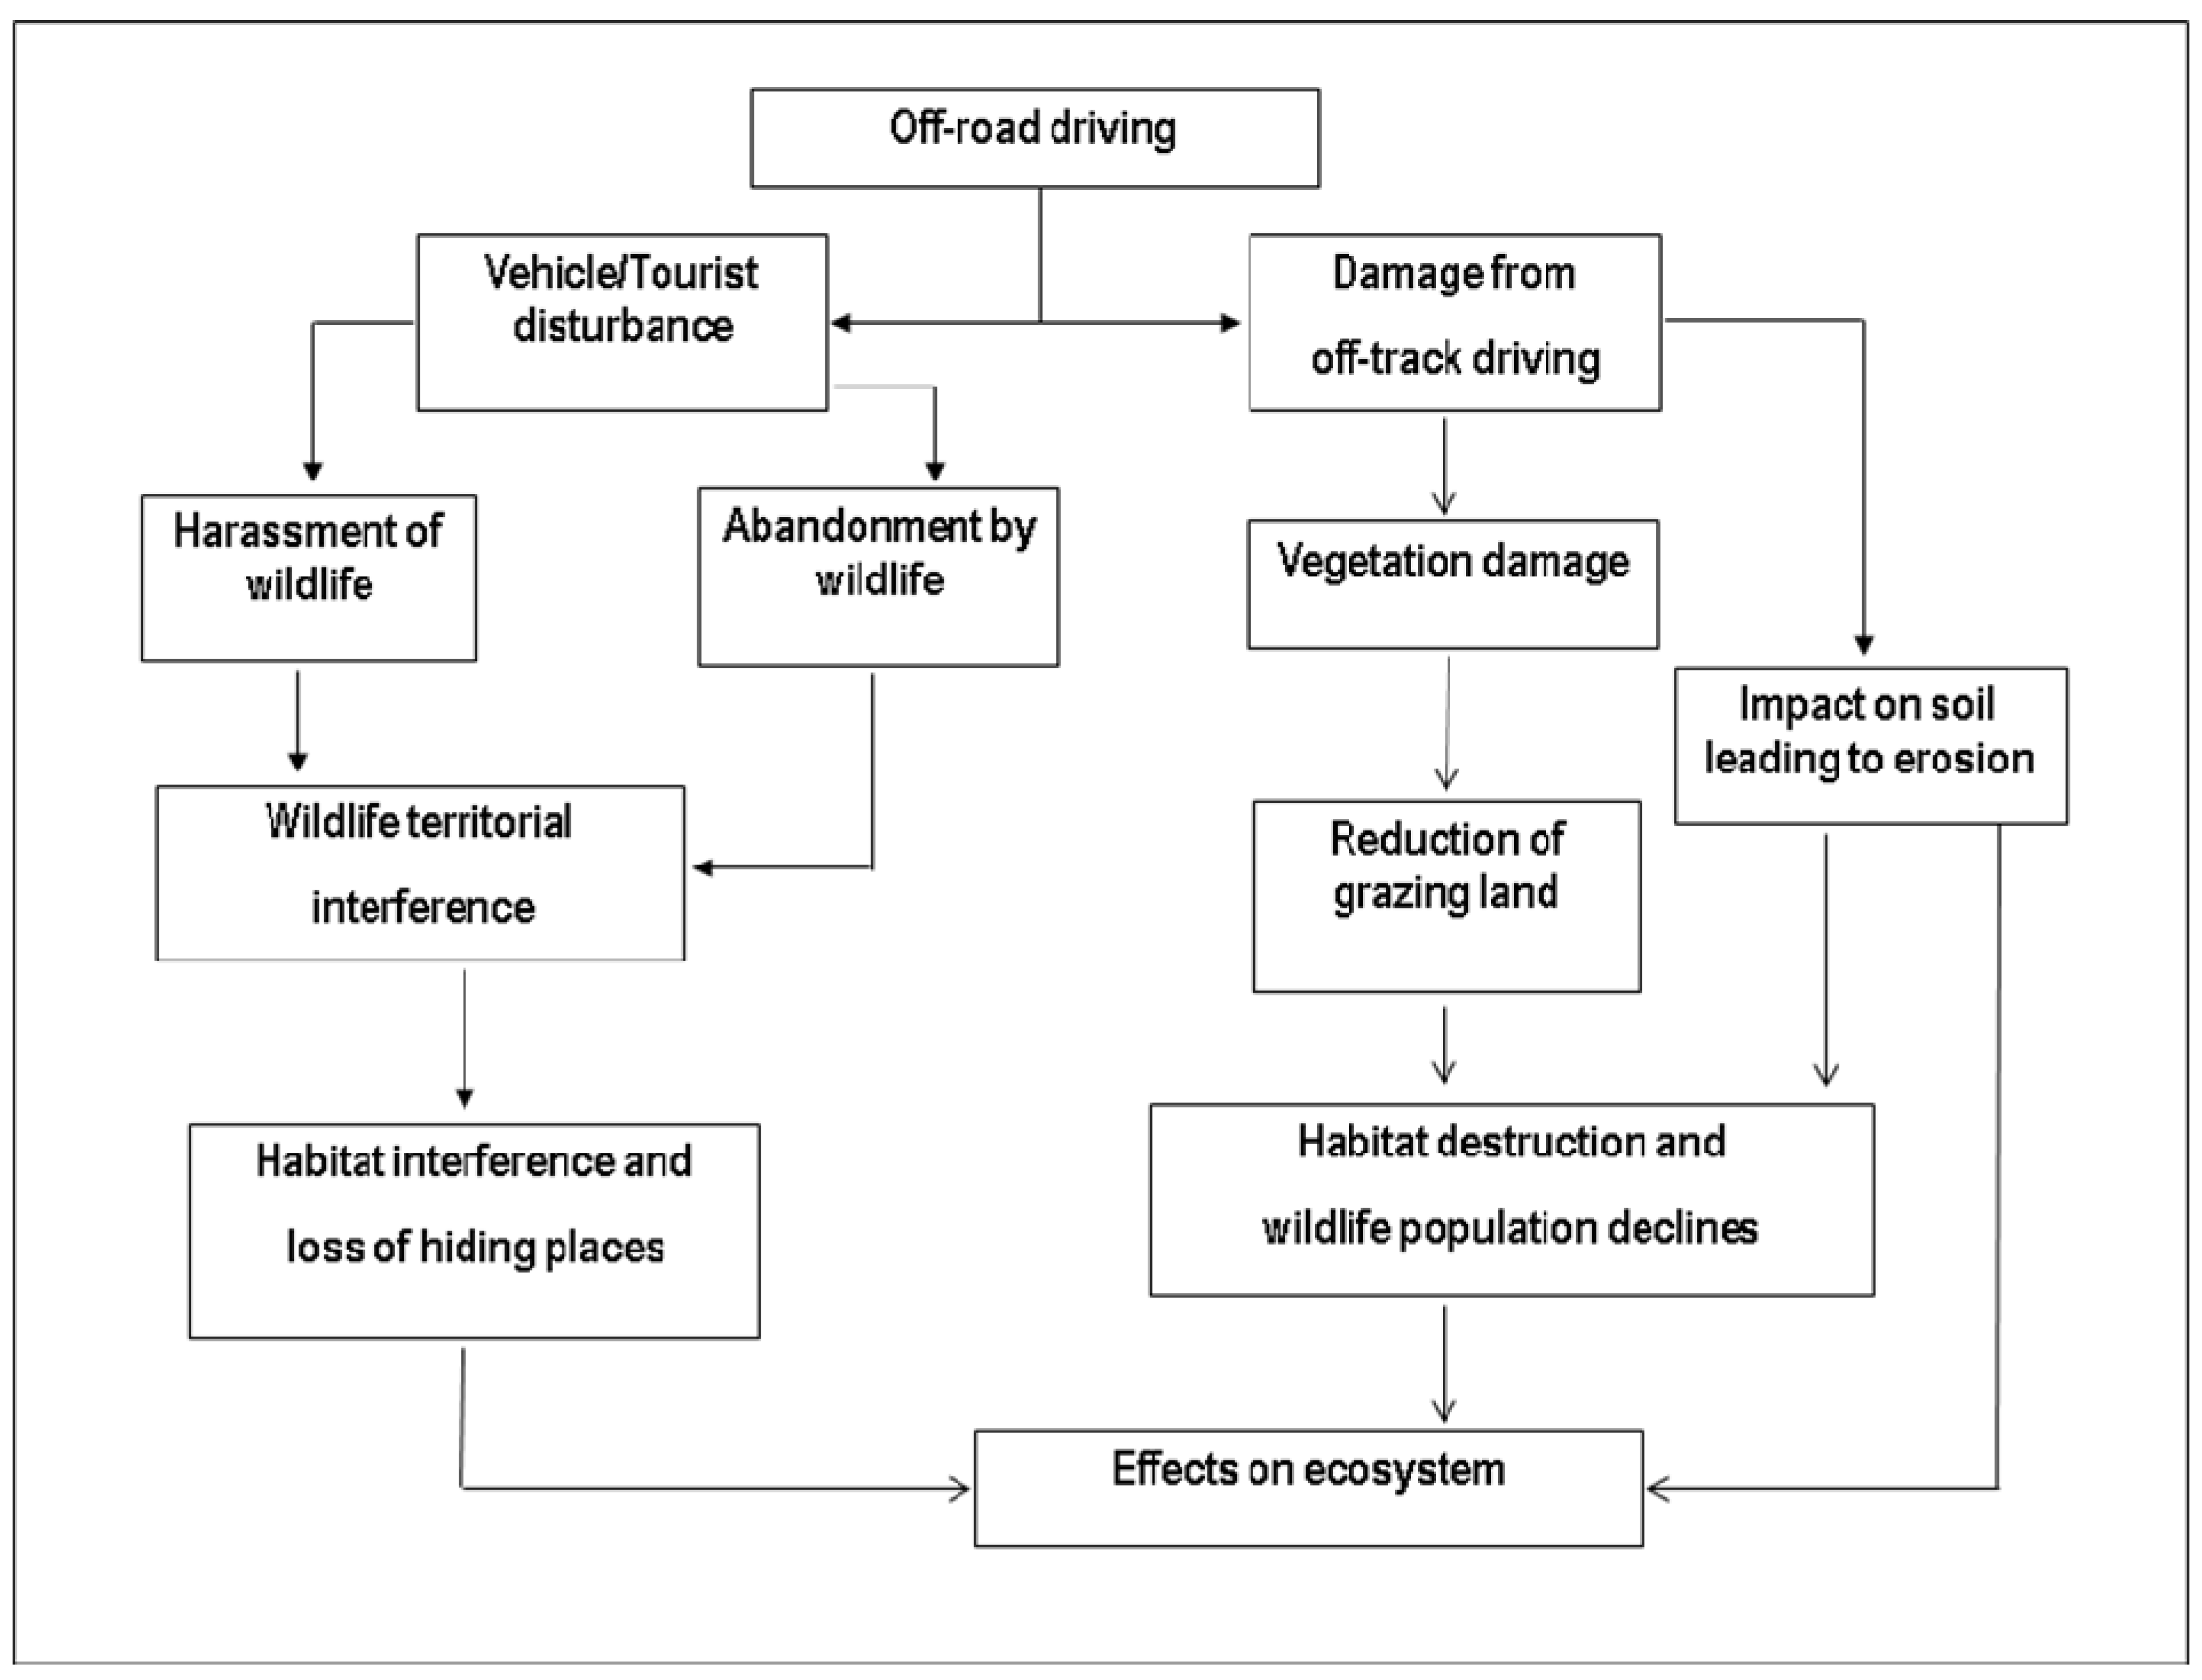
Figure 9, has resulted in vegetation degradation and development of multiple tracks that have destroyed the habitat. The overall effects of off-road driving, as observed during field surveys, are summarized in
Figure 10.
Figure 9.
Off-road driving in the Masai Mara National Reserve as tourist vehicles track wild animals. The resulting road tracks, which eventually lead to habitat degradation, were digitized from year 2000 aerial photographs.
Figure 9.
Off-road driving in the Masai Mara National Reserve as tourist vehicles track wild animals. The resulting road tracks, which eventually lead to habitat degradation, were digitized from year 2000 aerial photographs.
Figure 10.
Effects of off road driving in the Masai Mara National Reserve and surrounding areas.
Figure 10.
Effects of off road driving in the Masai Mara National Reserve and surrounding areas.
Demographic factors are also important in understanding land use/cover and wildlife population changes. Over the past three decades, areas peripheral to Masai Mara National Reserve have experienced population growth. Though the population density is still low at 15 persons per square kilometer, total fertility rates are high at 8.2 per cent. According to the 1999 population census, the rate of population increase was at 6.4 per cent with high in-migration and natural population increase at 3.9 per cent [
34]. As population density increases, the more densely populated areas become less suitable to practice livestock production and wildlife conservation, and thus people look for alternative sources of income such as mechanized wheat farming. In turn, the high revenues gained from mechanized agricultural farming may be attracting people from other regions, as suggested by the high in-migration, thus causing a stronger population increase in the area. As population in Masai Mara grows, development of permanent settlements is increasing and is associated with the expanding small-holder agriculture. This expansion is taking place in the expansive grasslands that have for many years served as wildlife dispersal areas.
Some studies [
2,
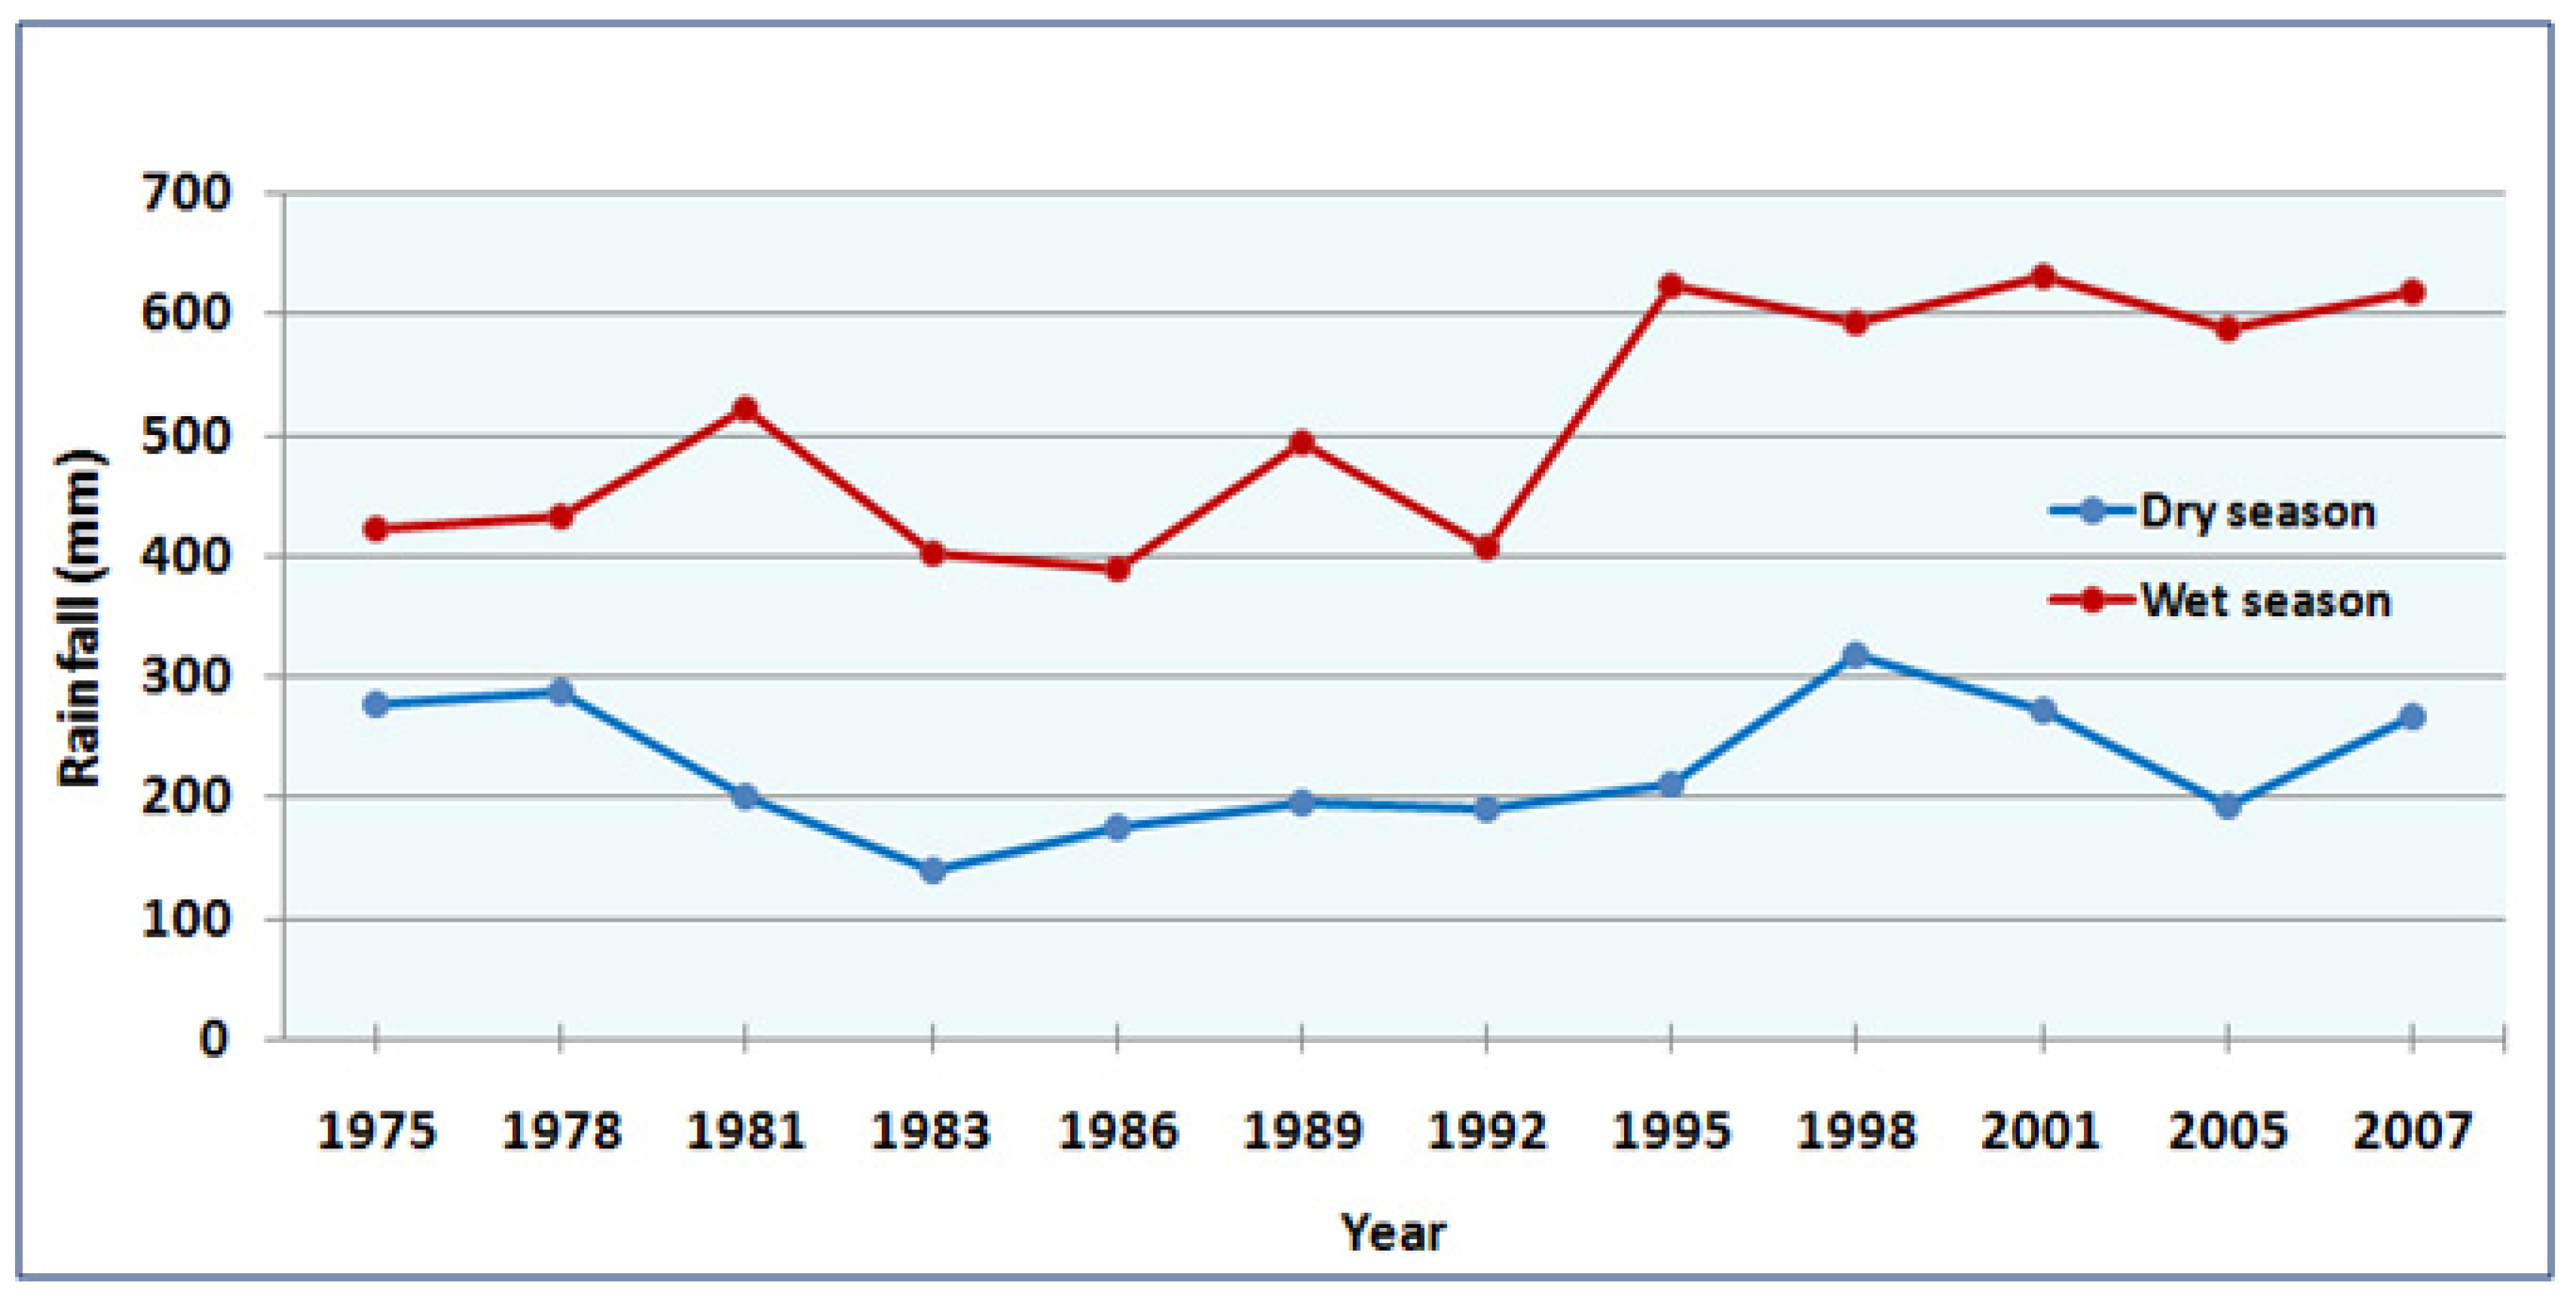
32] suggest that diseases, predation and poaching are not major factors in Masai Mara, although poaching may cause local wildlife population declines. For many nonmigratory wildlife species, however, the causes of population decline are likely to be more complex and less related to expansion of mechanized farming. For example, severe droughts were reported in Masai Mara in 1984 and 1992. During these droughts, high mortality of livestock was reported in the ecosystem [
35]. Since it has been shown that energy requirements of cattle and wildebeest are similar [
36], then the drought may also have affected the wildebeest population and contributed to the observed wildlife declines. Rainfall variation in Masai Mara over the study period is summarized in
Figure 11.
Figure 11.
Wet and dry rainfall variation in Masai Mara between 1975 and 2007. Source: Kenya Meteorological Department.
Figure 11.
Wet and dry rainfall variation in Masai Mara between 1975 and 2007. Source: Kenya Meteorological Department.
4.3. Conceptual Model
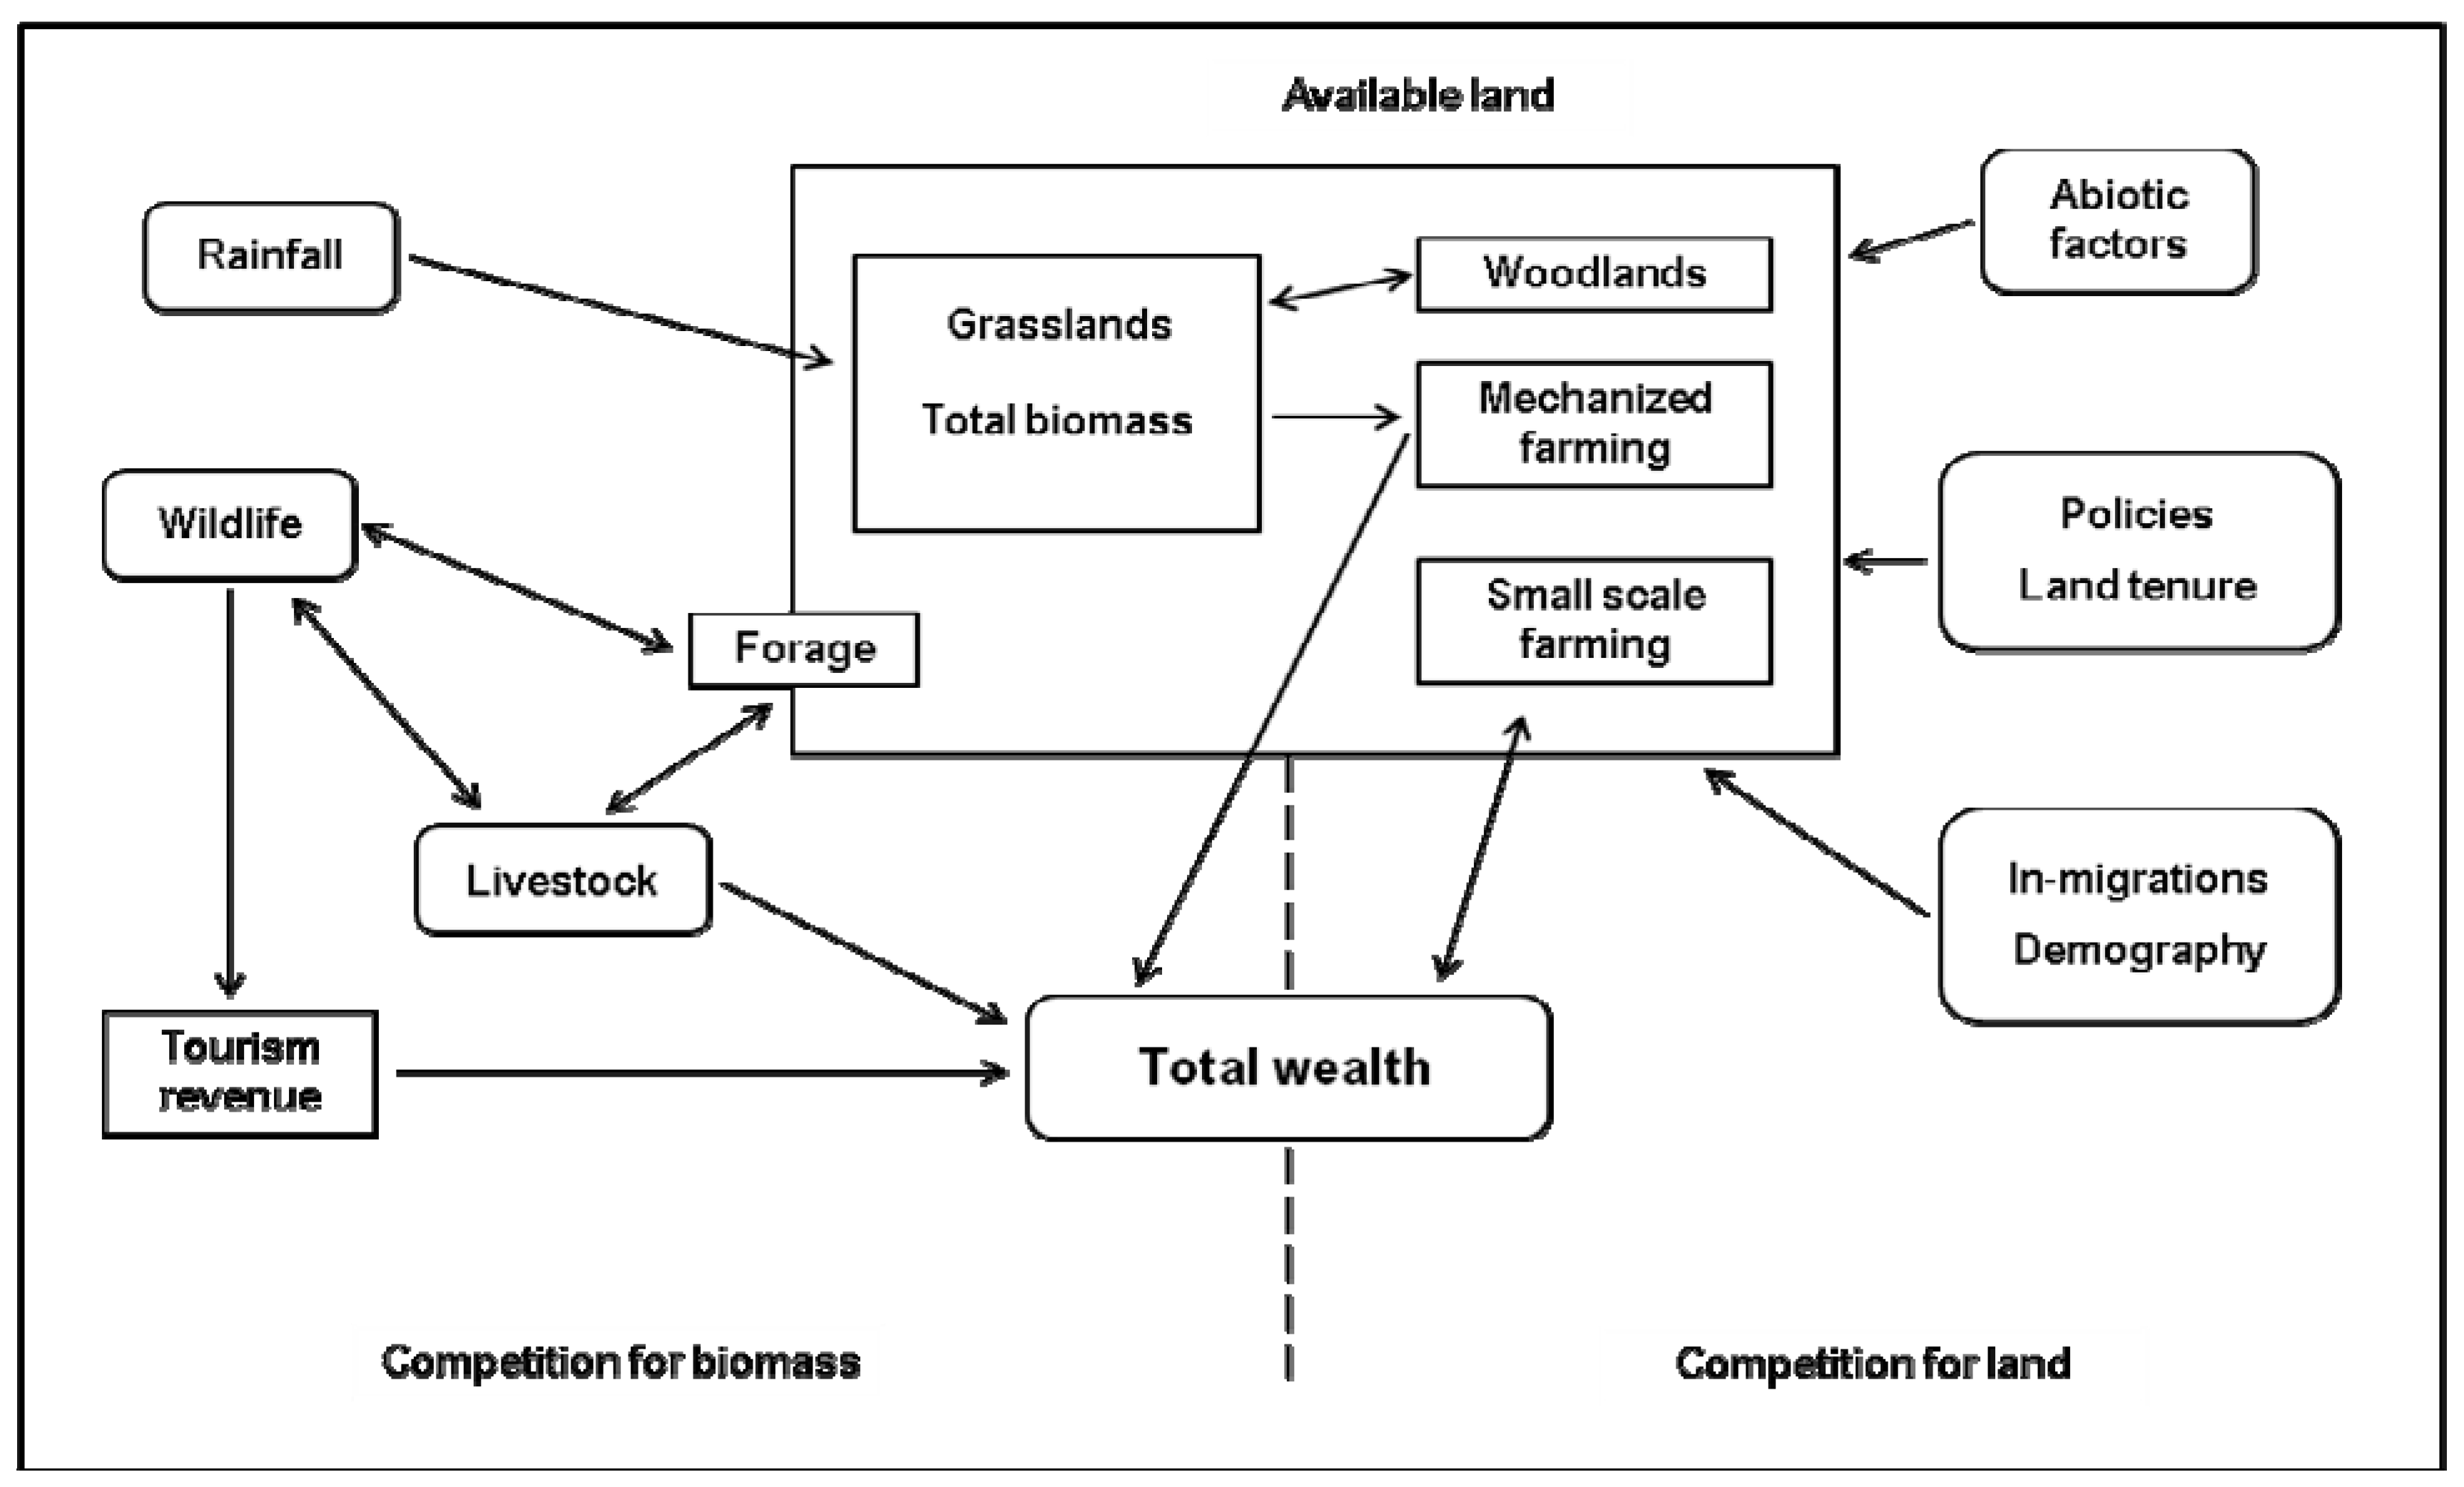
Following our GIS and remote sensing based analysis and detailed fieldwork assessments in Masai Mara Ecosystem, we present a conceptual model, modified from [
15] and shown in
Figure 12 that summarizes the dynamics of ecosystem change in terms of competition for land and for biomass. The total ecosystem area is in demand for subsistence farming, tourism businesses, mechanized cultivation, and for grazing for both livestock and wildlife. These land demands are controlled by socio-economic factors but also compete for limited space. The transitions while driven by many factors have underlying human drivers. Foremost among these is land conversion to farmland especially the expansion of mechanized farming which is controlled by economic factors. The land owners can sell or lease their land for commercial farming or can cultivate small farms themselves. These decisions are associated by lifestyle and demography changes and influenced by other factors such as policies and existing socio services. Wildlife and livestock compete for biomass and the size of livestock is linked to pastoralist’s decision and their wealth. Rainfall is important and serious drought can seriously impact these interactions. Around the conservation areas, a significant portion of pastoralist wealth derives from tourism activities. Possible tradeoff exists for pastoralists between increasing livestock holdings and maintaining tourist related incomes through wildlife conservation. Similar tradeoffs as noted by [
15] have to be made by pastoralists concerning the leasing of their land for mechanized agriculture and expansion of small scale cultivation. These important decisions are influenced by the proportion of total pastoralist income that can be derived from different land use options. These factors together with the tourism management style and the environmental conservation policies have contributed to the current scenario in the Masai Mara Ecosystem.
Figure 12.
Conceptual model depicting the factors contributing to habitat loss and wildlife decline in the Masai Mara Ecosystem.
Figure 12.
Conceptual model depicting the factors contributing to habitat loss and wildlife decline in the Masai Mara Ecosystem.
5. Implications and the Way Forward
Sustainable management of resources in Masai Mara that would allow economic development for the local people and at the same time achieve wildlife conservation is still a major challenge [
37]. Biodiversity conservation programs ought to seek to maintain characteristics of the landscape and foster wildlife management. While the Masai Mara National Reserve offers a measure of security, many of the wildlife species disperse over the park during wet seasons and others reside permanently in the surrounding privately owned communal group ranches. The loss and fragmentation of habitat due to several factors has serious implications for the viability of most of these wildlife populations. The subdivision and sale of group ranches, the inward migration by other groups to take up agricultural activities, and the increasing tourism businesses have resulted in significant land transformation. This is particularly prevalent where mechanized wheat farming and intensive small-scale agriculture are spreading. This study suggests that these changes are primarily responsible for the observed decline in wildlife population.
The current state of affairs calls for quick and concerted effort in order to overcome the problem of habitat destruction and other forces threatening the Masai Mara Ecosystem. This is because continued subdivision of ranches and expansion of cultivation will further disturb migration patterns and access to water, and encourage habitat fragmentation. A number of strategies could be employed to deal with the challenges facing the ecosystem to ensure that conservation successfully coexists with local users. One such strategy would be to promote incentives to increase economic returns from wildlife for the local people so that they can be motivated to conserve wildlife. More revenue that is shared equitably can discourage land subdivision in favor of group based wildlife sanctuaries that can generate revenues from wildlife viewing. For this to work, group ranch members have to benefit directly, and incomes have to exceed gains from alternative activities such as farming. Given the rich wildlife diversity and the high numbers of tourist arrivals in Masai Mara, this would be a viable option. Initiatives like this have not worked in the past because only a few have benefited from the incomes generated from tourism leaving out the local people who own the land. If the local and national governments could support such initiatives, and if the benefits were shared equitably, then the potential for conservation would be high.
Another strategy that is long overdue is to develop a comprehensive land zoning plan that would be used for managing human settlements, subsistence farming, tourism facilities development, commercial mechanized farming, and the access to and impact on key resources such as water sources and wildlife migration routes. The ecosystem can still accommodate further growth at low ecological cost provided this is well planned and executed. Lack of such a plan has led to conversion of wet-season dispersal and calving areas to mechanized cultivation areas and for tourism facilities. This has consequently precipitated major wildlife population loses which is threatening sustainable tourism in Masai Mara. A well thought out zoning plan could discourage policies, land uses, and projects that are likely to have adverse impacts on habitat.
Involving local communities in the management of resources and instituting participatory resource planning could go a long way in overcoming some of the problems in Masai Mara. For a long time, genuine participation by local people has been lacking, resulting in loss of trust, hostility and resentment towards conservation. Genuine and effective participation ought to involve empowering local people to take part in designing, planning, decision-making, implementation, benefit sharing, monitoring and evaluation of all developments in the area. Because the local people own the land, participatory process is essential in reaching consensus about the appropriate uses in specific zones. Only such uses that are compatible with conservation ought to be allowed in critical areas such as migratory corridors, calving and dispersal grounds. It is also important to adopt new modalities for benefit sharing to ensure that these are evenly distributed and adequate to motivate conservation. It would also be important to guarantee future access to these benefits for long term sustainability of conservation. Ultimately, people need to be fairly compensated for costs incurred through wildlife damage and opportunity cost of alternative land uses.
With many tourist hotels, camps, and lodges coming up even in ecologically fragile areas, there is doubt as to whether such developments are subjected to the necessary environmental impact assessments as required by law. To protect the ecosystem and to ensure sustainable tourism, environmental impact assessment regulations need to be enforced and strictly implemented to ensure all harmful impacts are avoided or well mitigated.
The Masai Mara Ecosystem has also been experiencing deteriorating conditions over the years because of poor management. The ecosystem is managed by two county councils under different management styles. The northwestern part of the ecosystem is managed by Mara conservancy on behalf of the Transmara county council, while the rest of the park is managed by the Narok county council. In addition, there are other conservancies managing tourism activities in the private group ranches. These bodies are generally poorly managed, do not cooperate and their activities are not coordinated though managing the same resource. To compound the situation, the central government has failed in providing a broader tourism policy or issuing tourism planning guidelines. As a result, poor management has led to deteriorating conditions in terms of infrastructure such as roads as well as tourist services. Field interviews confirmed that incomes from tourism are not properly distributed to local Masai communities who own the land and money is not put back into maintenance of the ecosystem. There is therefore the need to institute a more effective management system for the entire ecosystem that will, among other things, improve the economic returns, protect wildlife species, improve services and address socio and ecological issues. Further, because harmful development strategies in one country will eventually affect the shared ecosystem, Kenya and Tanzania need to cooperate and implement practical policies that will ensure conservation of the bigger ecosystem for sustainable tourism in the region.
6. Conclusions
Increasing land use/cover changes and the drastic decline in wildlife population have been observed in the Masai Mara Ecosystem over the past three decades. These changes are as a result of a number of factors, but mainly related to habitat loss due to agricultural encroachment and the mushrooming tourist facilities. Information about changing patterns of land use/cover through time and the factors influencing such changes are important for planning for sustainable utilization of resources. To study the long term land use/cover changes and wildlife population trends in the Masai Mara Ecosystem, we integrated data from different sources and used different methods and approaches including satellite remote sensing, field surveys and wildlife population trend analysis. Post classification analysis of land use/cover maps and integration of various data using GIS approach was adopted to examine land use/cover changes and wildlife population dynamics.
The results show rapid land use/cover conversions and a drastic decline for a wide range of wildlife species. Over 132,000 ha of grasslands were converted to cultivated farms between 1975 and 2007. In addition, substantial losses in forest cover and habitat fragmentation were observed. These factors have led to loss of wet season grazing, calving, breeding and dispersal areas formerly used by wildlife species and could be the main reasons for the observed 60% wildlife loss in the 32-year study period. Analyses of possible drivers of change indicate that land use policy, agricultural expansion and mushrooming tourism activities are some of the major factors.
It is extremely urgent that all necessary measures, including those proposed in this study, are taken in order to strike a balance between wildlife conservation and economic development if the observed harmful trends are to be reversed. It would also be important to revise the wildlife policy so that wildlife species in private group ranches outside the Masai Mara National Reserve are protected and habitat conserved to ensure sustainable tourism and economical empowerment of the local communities.

