Monitoring Bare Soil Freeze–Thaw Process Using GPS-Interferometric Reflectometry: Simulation and Validation


1
Shanghai Astronomical Observatory, Chinese Academy of Sciences, Shanghai 200030, China
2
Key Laboratory of Planetary Sciences, Chinese Academy of Sciences, Shanghai 200030, China
3
College of Marine Sciences, Shanghai Ocean University, Shanghai 201306, China
4
Collaborative Innovation Center for Distant-Water Fisheries, Shanghai 201306, China
*
Author to whom correspondence should be addressed.
Remote Sens. 2018, 10(1), 14; https://doi.org/10.3390/rs10010014
Submission received: 10 October 2017
/
Revised: 18 December 2017
/
Accepted: 21 December 2017
/
Published: 22 December 2017
(This article belongs to the Special Issue Multi-Constellation Global Navigation Satellite Systems: Methods and Applications)
Abstract
:Frozen soil and permafrost affect ecosystem diversity and productivity as well as global energy and water cycles. Although some space-based Radar techniques or ground-based sensors can monitor frozen soil and permafrost variations, there are some shortcomings and challenges. For the first time, we use GPS-Interferometric Reflectometry (GPS-IR) to monitor and investigate the bare soil freeze–thaw process as a new remote sensing tool. The mixed-texture permittivity models are employed to calculate the frozen and thawed soil permittivities. When the soil freeze/thaw process occurs, there is an abrupt change in the soil permittivity, which will result in soil scattering variations. The corresponding theoretical simulation results from the forward GPS multipath simulator show variations of GPS multipath observables. As for the in-situ measurements, virtual bistatic radar is employed to simplify the analysis. Within the GPS-IR spatial resolution, one SNOTEL site (ID 958) and one corresponding PBO (plate boundary observatory) GPS site (AB33) are used for analysis. In 2011, two representative days (frozen soil on Doy of Year (DOY) 318 and thawed soil on DOY 322) show the SNR changes of phase and amplitude. The GPS site and the corresponding SNOTEL site in four different years are analyzed for comparisons. When the soil freeze/thaw process occurred and no confounding snow depth and soil moisture effects existed, it exhibited a good absolute correlation (|R| = 0.72 in 2009, |R| = 0.902 in 2012, |R| = 0.646 in 2013, and |R| = 0.7017 in 2014) with the average detrended SNR data. Our theoretical simulation and experimental results demonstrate that GPS-IR has potential for monitoring the bare soil temperature during the soil freeze–thaw process, while more test works should be done in the future. GNSS-R polarimetry is also discussed as an option for detection. More retrieval work about elevation and polarization combinations are the focus of future development.
1. Introduction
The frozen soil and permafrost are widely distributed in high latitudes and high altitudes with about 35% of the total land area. Frozen soil has unique thermal properties of water and the soil freeze–thaw process affects ecosystem diversity and productivity. The understanding of atmosphere–hydrosphere interactions in the cold season and the corresponding feedback in Earth’s climate system are very important for the assessment of variations in the regional and global energy and water cycles [1,2]. Traditional observations of the bare soil freeze–thaw process are mainly conducted by in situ point measurements. However, the seasonal frozen soil and permafrost usually happen in cold climate regions, which are difficult to access, thus the spatial resolution of ground-based sensors is poor. These regions are very wide and coupled with extensive heterogeneity, while in situ observation stations are not uniformly distributed due to high cost and being very time-consuming, leading to low temporal-spatial resolutions. Therefore, they cannot meet the actual requirements.
The airborne or spaceborne remote sensing technique provides a feasible means to monitor the regional scale soil freeze–thaw process. Optical and thermal remote sensing can improve the ability of frequent observations, but they are strongly influenced by the cloud cover and cannot provide all-time and all-weather observations. Microwave remote sensing is very sensitive to the phase of soil moisture content and overcomes this shortcoming with a certain depth of penetration on the surface. At normal temperature, the permittivity of water is about 80, while the one of ice is 3.15 [3]. According to the significant differences of permittivity between frozen soil and thawed soil, a microwave radiometer/scatterometer can monitor the near-surface soil freeze–thaw process. Currently, monostatic radar (active microwave remote sensing) has been widely used [4], while radiometer (passive microwave remote sensing) has the advantages of frequent revisits and multiple channels, but has a low spatial resolution [5]. SMOS (Soil Moisture and Ocean Salinity) and SMAP (Soil Moisture Active and Passive) can be used for the global detection of soil freeze/thaw process. These spaceborne data can improve the spatial resolution of the detection, while their time resolution cannot satisfy the scientific requirements of monitoring, with global recovery of every three days.
Nowadays, GNSS-Reflectometry (GNSS-R), namely a bistatic/multi-static radar, us a promising and emerging remote sensing technique with unique advantages of low cost, small power consumption, high temporal resolutions and wide spatial coverage [6,7,8]. As for GNSS-reflection (GNSS-R) method, there are changes in the auto-correlation of the received and replica carrier signals at longer delays, and this is the theoretical fundamental for remote sensing detection. For example, GNSS-R ocean sensing was used in the field of sea surface wind and wave height [9], oil spill/suspended substance detection [10], and moving target detection on the sea surface [11]. For the ocean case, the reflected surface is homogenous, so ocean applications of GNSS-R are wider. The land surface is complex and the polarization characteristics are influenced by various surface types. Meanwhile, the geometric observations of GNSS-R are changing. All these factors lead to the initial stages in the research of the land surface remote sensing (soil moisture, vegetation and snow parameters) using GNSS-R. Several ground based experiments have been carried out for geophysical parameters detection [12,13,14,15,16,17].
Recently, it has been demonstrated that geodetic GPS receivers can be used for ground-based land surface remote sensing applications, e.g., soil moisture [18,19], vegetation [20,21] and snow parameters [22,23,24,25,26] as well as sea level [27,28,29]. However, bare soil freeze–thaw process detection is challenging [30]. Compared to more conventional GNSS-R remote sensing technique, GPS-interferometric reflectometry (GPS-IR) (also known as GPS multipath reflectometry) has the basic observation of signal-to-noise (SNR) that results from the interaction between the direct and ground-reflected signals. This is the basic difference for GNSS-R and GPS-IR.
In this paper, we present for the first time the monitoring of frozen and thawed soil conditions using GPS-IR. The SNR data in one GPS site are selected for analysis and, within the GPS-IR spatial resolution, one corresponding climate site is used for the comparison of geophysical parameters, i.e., near surface soil temperature, soil moisture and snow depth. To overcome the variant geometry problem, virtual bistatic radar is employed for data analysis. The final relationship between the near soil temperature (bare soil freeze/thaw process detection) and the multipath observables of the GPS site is investigated. In the followings, theory and method are introduced; simulation results and in-situ measurements validation are presented as well as some error analysis and discussions; and finally conclusions are given.
2. Theory and Method
As soil temperature changes, especially from below 0 °C to above 0 °C, or vice versa, the permittivities change, which lead to variations of soil surface reflectivity (both coherent scattering and non-coherent scattering). This is the fundamental for soil freeze/thaw process detection using GPS-IR technique.
Dielectric mixing models are used to calculate the microwave dielectric behavior of soil–water mixtures (Appendix A.1). In terms of electromagnetic characteristics, the soil is composed of five kinds of materials: air, solid particles, free water, bound water and ice. The final expression of frozen soil dielectric properties can be obtained [31,32,33,34,35,36]:
where is the permittivity; V is the volume of different components; the superscript is the constant shape factor; and subscripts s, a, fw, bw, and i refer to solid soils, air, free water, bound water and ice, respectively. Frozen and thawed soil permittivities are calculated using the above-mentioned models and they are basic inputs for the calculations of coherent scattering models. The surface scattering properties include not only the coherent scattering but also the non-coherent scattering. However, at present, only the coherent part are taken into account in the forward GPS multipath simulator and its basic form is the Fresnel reflection coefficients with a correction factor to take the surface roughness into consideration (Appendix A.2).
Considering the GPS reflection power, either arbitrary values or empirically defined powers are given in most GPS multipath forward models. Nievinski and Larson [37,38] have developed a fully polarimetric forward model, which accounts for polarizations of the GPS signals and of the antenna and surface responses as well. The GPS multipath observables corresponding to the changes of soil freeze/thaw process are calculated by extending the simulator [37,38] (Appendix A.3).
3. Simulation Results and Analysis
The fundamentals for soil freeze/thaw detection using GNSS-R are that the changes of permittivity affect the surface scattering properties and therefore will lead to the variations of GNSS-R signals or GPS multipath observations. The simulations of freeze/thaw soil permittivities and their effects on the final GPS multipath observables are given in this section.
3.1. Simulations of the Freeze/Thaw Soil Permittivity
For freeze/thaw soil permittivity simulations, GPS L1 band (1.23 GHz) and moderate soil moisture (vms = 0.3) are used, while the soil texture is sandy loam (vsand = 51.5%, vclay = 13.5%) and the buck density is 1.6. As the soil temperature changes (especially from below 0 °C to above 0 °C, or vice versa), the changes for both real part and imaginary part of the permittivities can be seen from the simulations in Figure 1.
The permittivities (both complex components) of thawed soil are much larger than those of frozen soil (Figure 1). If the soil temperature is below 0 °C, the real part and imaginary part of permittivity increase with soil moisture increases. The trend is the opposite if the soil temperature is larger than 0 °C. The figure presents the theoretical fundamentals for soil freeze/thaw process detection: when the soil changes from the frozen state to the thawed state or vice versa, there is a big difference in the soil permittivity. When the soil temperature is near 0 °C, the real part of permittivity is around 8 when soil temperature is below 0 °C, but will increase to 21 if soil temperature is above 0 °C. The imaginary part of soil permittivity near 0 °C is about 1.2 when soil temperature is below 0 °C, but will increase to 3.5 when it is above 0 °C. Real parts of the permittivity reveal the refraction and reflection phenomena of electromagnetic wave, while the imaginary part is related to attenuation (absorption and conversion); therefore, these variations on permittivity will lead to the changes of soil reflectivity and they will result in the final variations of GPS multipath observables.
3.2. Simulations of GPS Multipath Observables
The forward GPS multipath simulator developed by Nievinski and Larson [37,38] is employed for theoretical simulations. GPS multipath observables corresponding to the changes of soil temperatures are simulated in this section. Different soil temperatures (−1 °C and 1 °C) are set for comparisons (Figure 2). A Trimble receiver is used for the simulation, while the height of the antenna is 2.0 m and the antenna model is “TRM41249.00”. Effects of soil temperature on GPS multipath observables are given in this Section, and we also evaluate the multi-frequency effects on GPS multipath observables.
3.2.1. Effects of Soil Temperature on GPS Multipath Observables
Figure 2 presents the soil temperature effects on the multipath signatures in GPS SNR, carrier phase, and code pseudorange observables. It can be seen from the simulations that, as the soil temperature increases, the amplitudes of GPS multipath observables increase. The right panel of Figure 2 presents the Lomb–Scargle spectrogram analysis results. The different results can be seen: thawed soil has stronger power than frozen soil, which is due to the higher permittivity of the thawed soil. The modulation pattern of GPS multipath observations is like a dampened sinusoid wave. The relation between SNR and the soil temperature is not monotonic increasing or decreasing, and whether they are correlated or anti-correlated has something to do with the elevation angle. For the same observation angle, e.g., theta = 13°, if the GPS multipath observables, e.g., the phase, are at the peak, larger soil temperatures correspond to larger multipath values. If the GPS multipath observables, e.g., the phase, are at the trough, e.g., ele = 15°, greater soil temperatures correspond to lower multipath values.
3.2.2. Multi-Frequencies Effects on GPS Multipath Observables
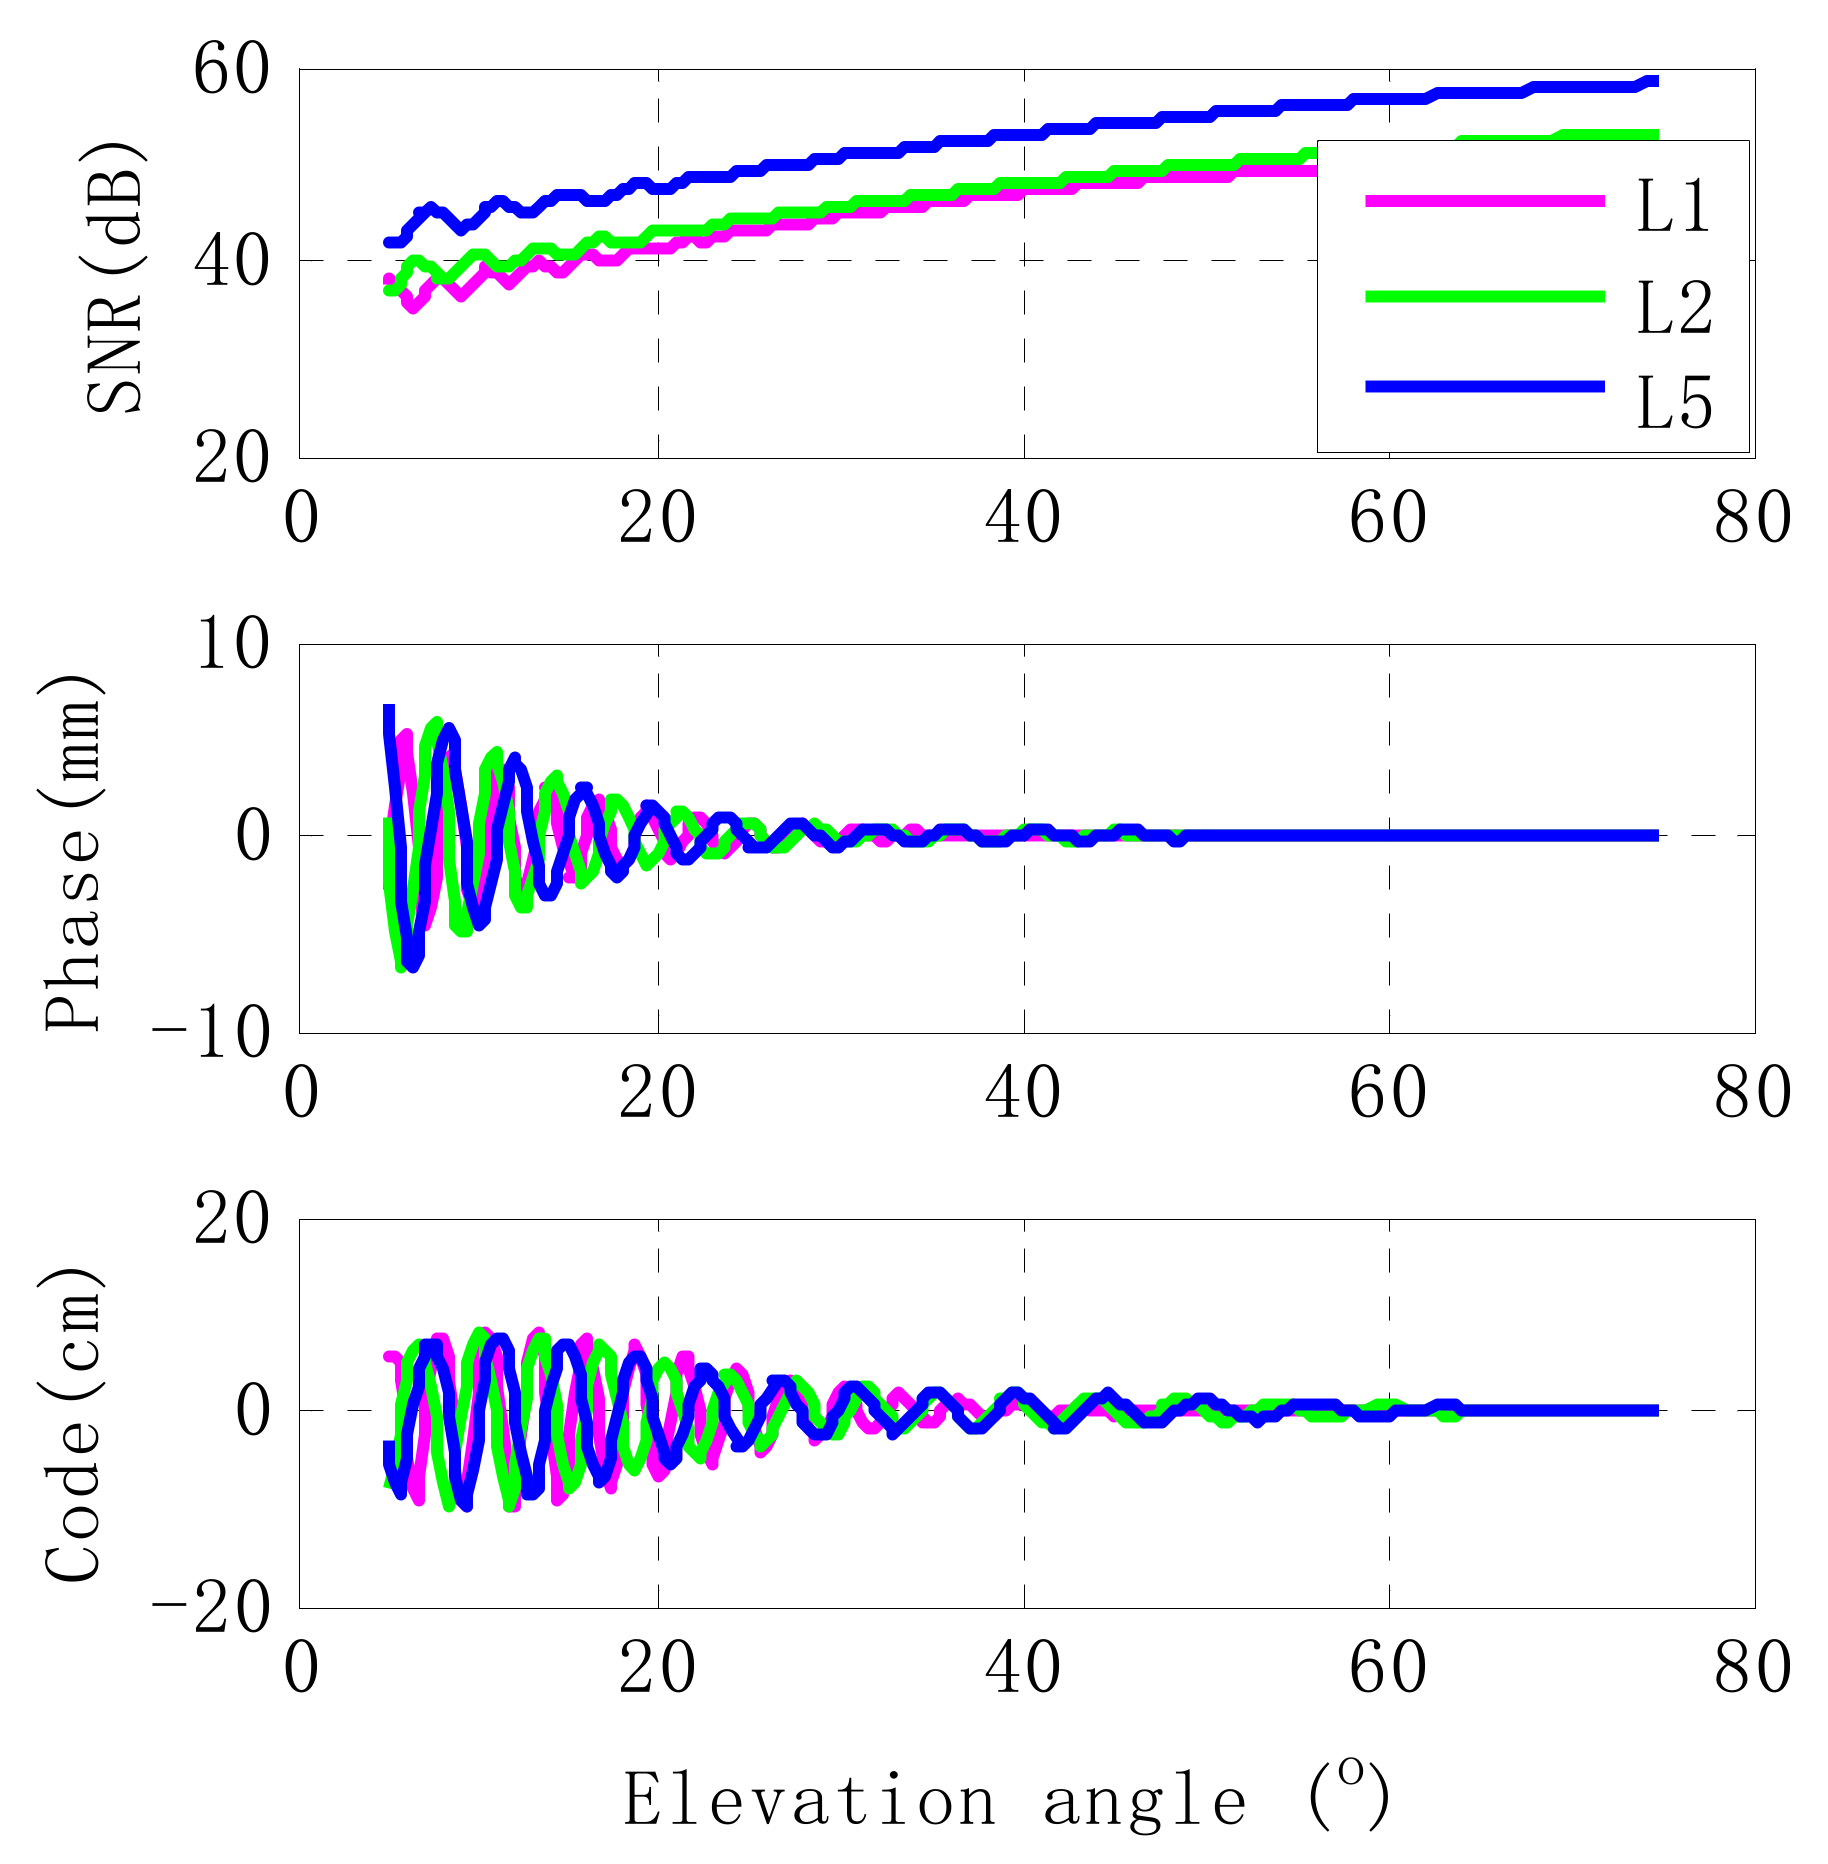
In 1999, the US government raised GPS modernization program, and the civil frequency L5 (f5 = 1.17624 MHz) is included. In this section, effects of triple-frequencies (L1 carrier (f1 = 1.57542 GHz), L2 carrier (f2 = 1.22760 GHz) and L5) on GPS multipath observables are evaluated. The forward GPS multipath simulator developed by Nievinski and Larson [37,38] can simulate L1 and L2 carrier frequencies, while Tabibi et al. [39] have developed a simulator that supports the third frequency, L5. For the simulator, we set the top of the surface material “air”, while the bottom part “wet soil fixed”. With different carrier frequencies, the phase and amplitude of GPS multipath observables are different. For L1, L2 and L5 (Figure 3), Table 1 shows the real part and imaginary part of the permittivities when the soil temperature changes from −1 °C to 1 °C. The permittivities of L1, L2 and L5 are almost the same, since triple GPS carrier frequencies are all within L band, and therefore have very similar scattering properties. As the perspective of electromagnetic wave, any frequency of GPS constellation can be used for the geophysical parameter study without microwave scattering differences. The different effects of GPS multipath observations on L1, L2 and L5, as presented in Figure 3, are due to different wavelengths and modulations of direct signals.
4. In-Situ Measurements Validation and Discussion
In the theoretical part, it has been shown that the bare soil freeze/thaw process detection can be monitored by the GPS-IR technique in theory. We do not validate the above-mentioned theoretical models in this section, but rather utilize the in-situ measurement data to investigate the possibility of soil freeze/thaw process detection. Meanwhile, we use the above-mentioned theoretical parts to interpret and analyze the experimental phenomenon. Virtual temporary bistatic radar is employed to simplify the varying geometry problem. Specific and targeted measurements are not carried out, but one freely available GPS site data (Site AB33) in PBO [40] and the soil geophysical measurement in SNOTEL (Snow Telemetry) (Site Coldfoot) are used to validate this initial investigation [41].
4.1. Virtual Temporary Bistatic Radar
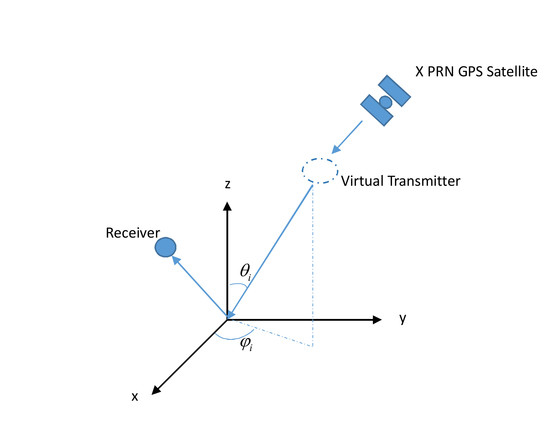
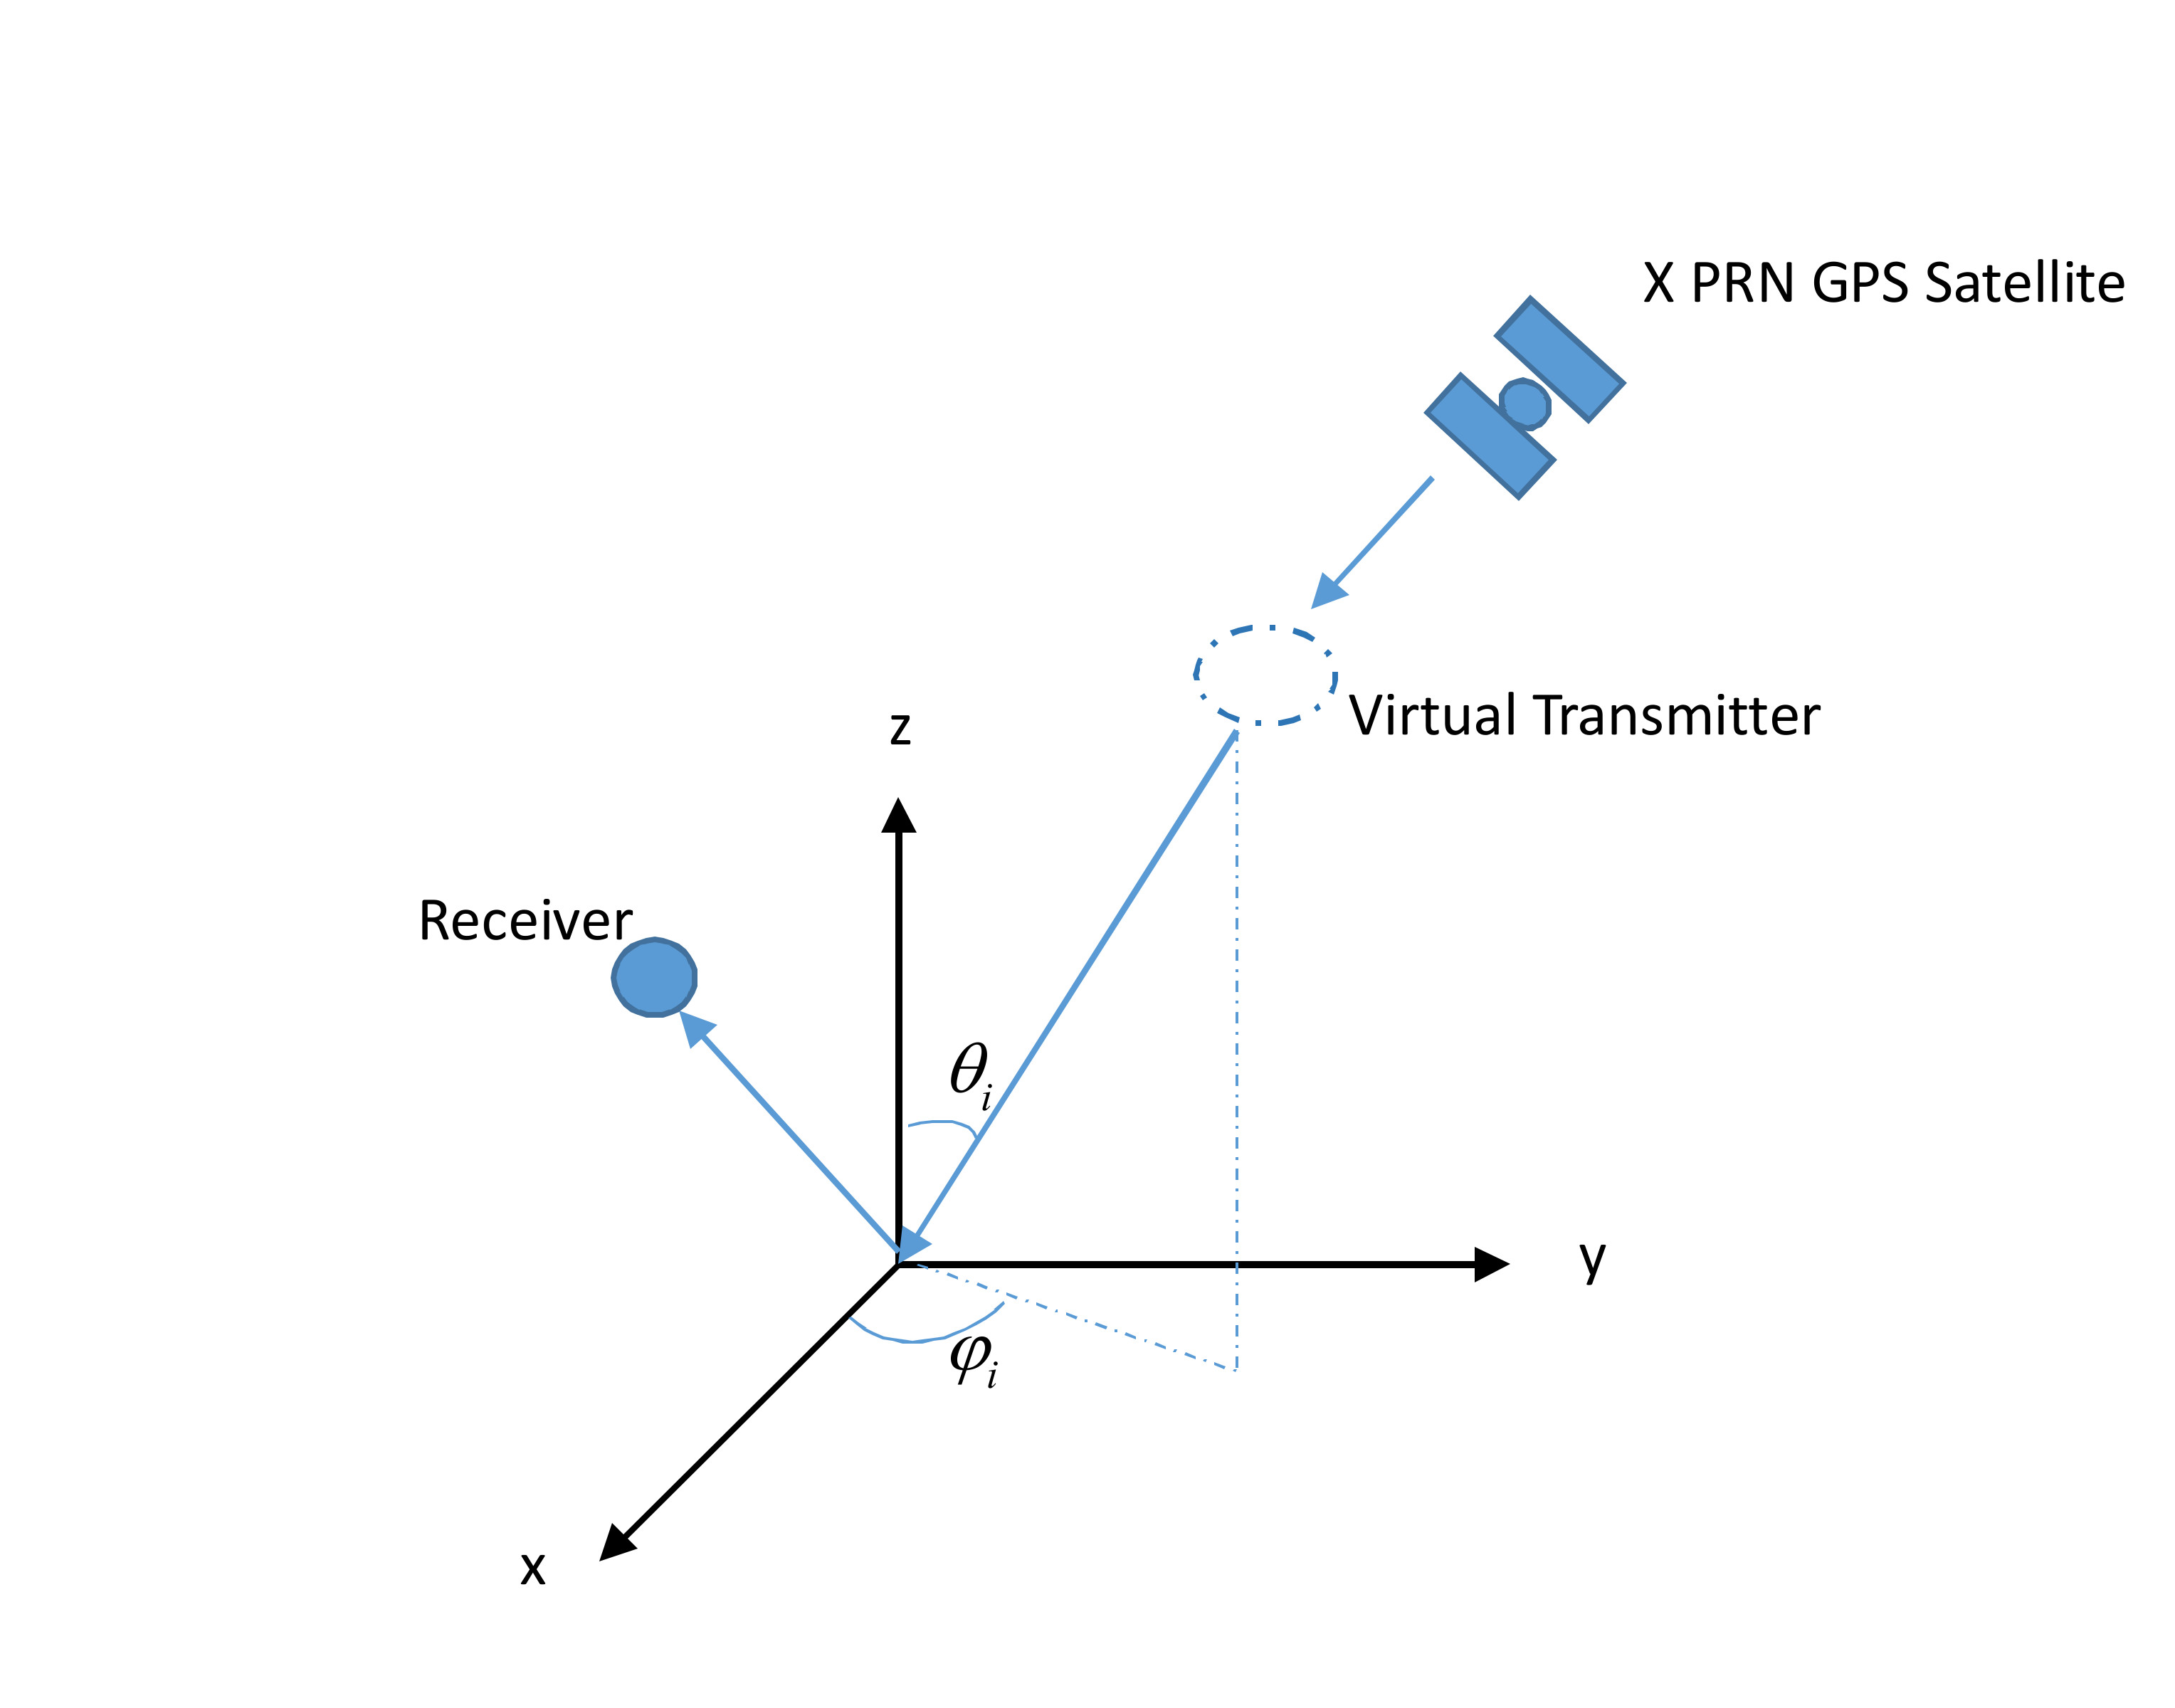
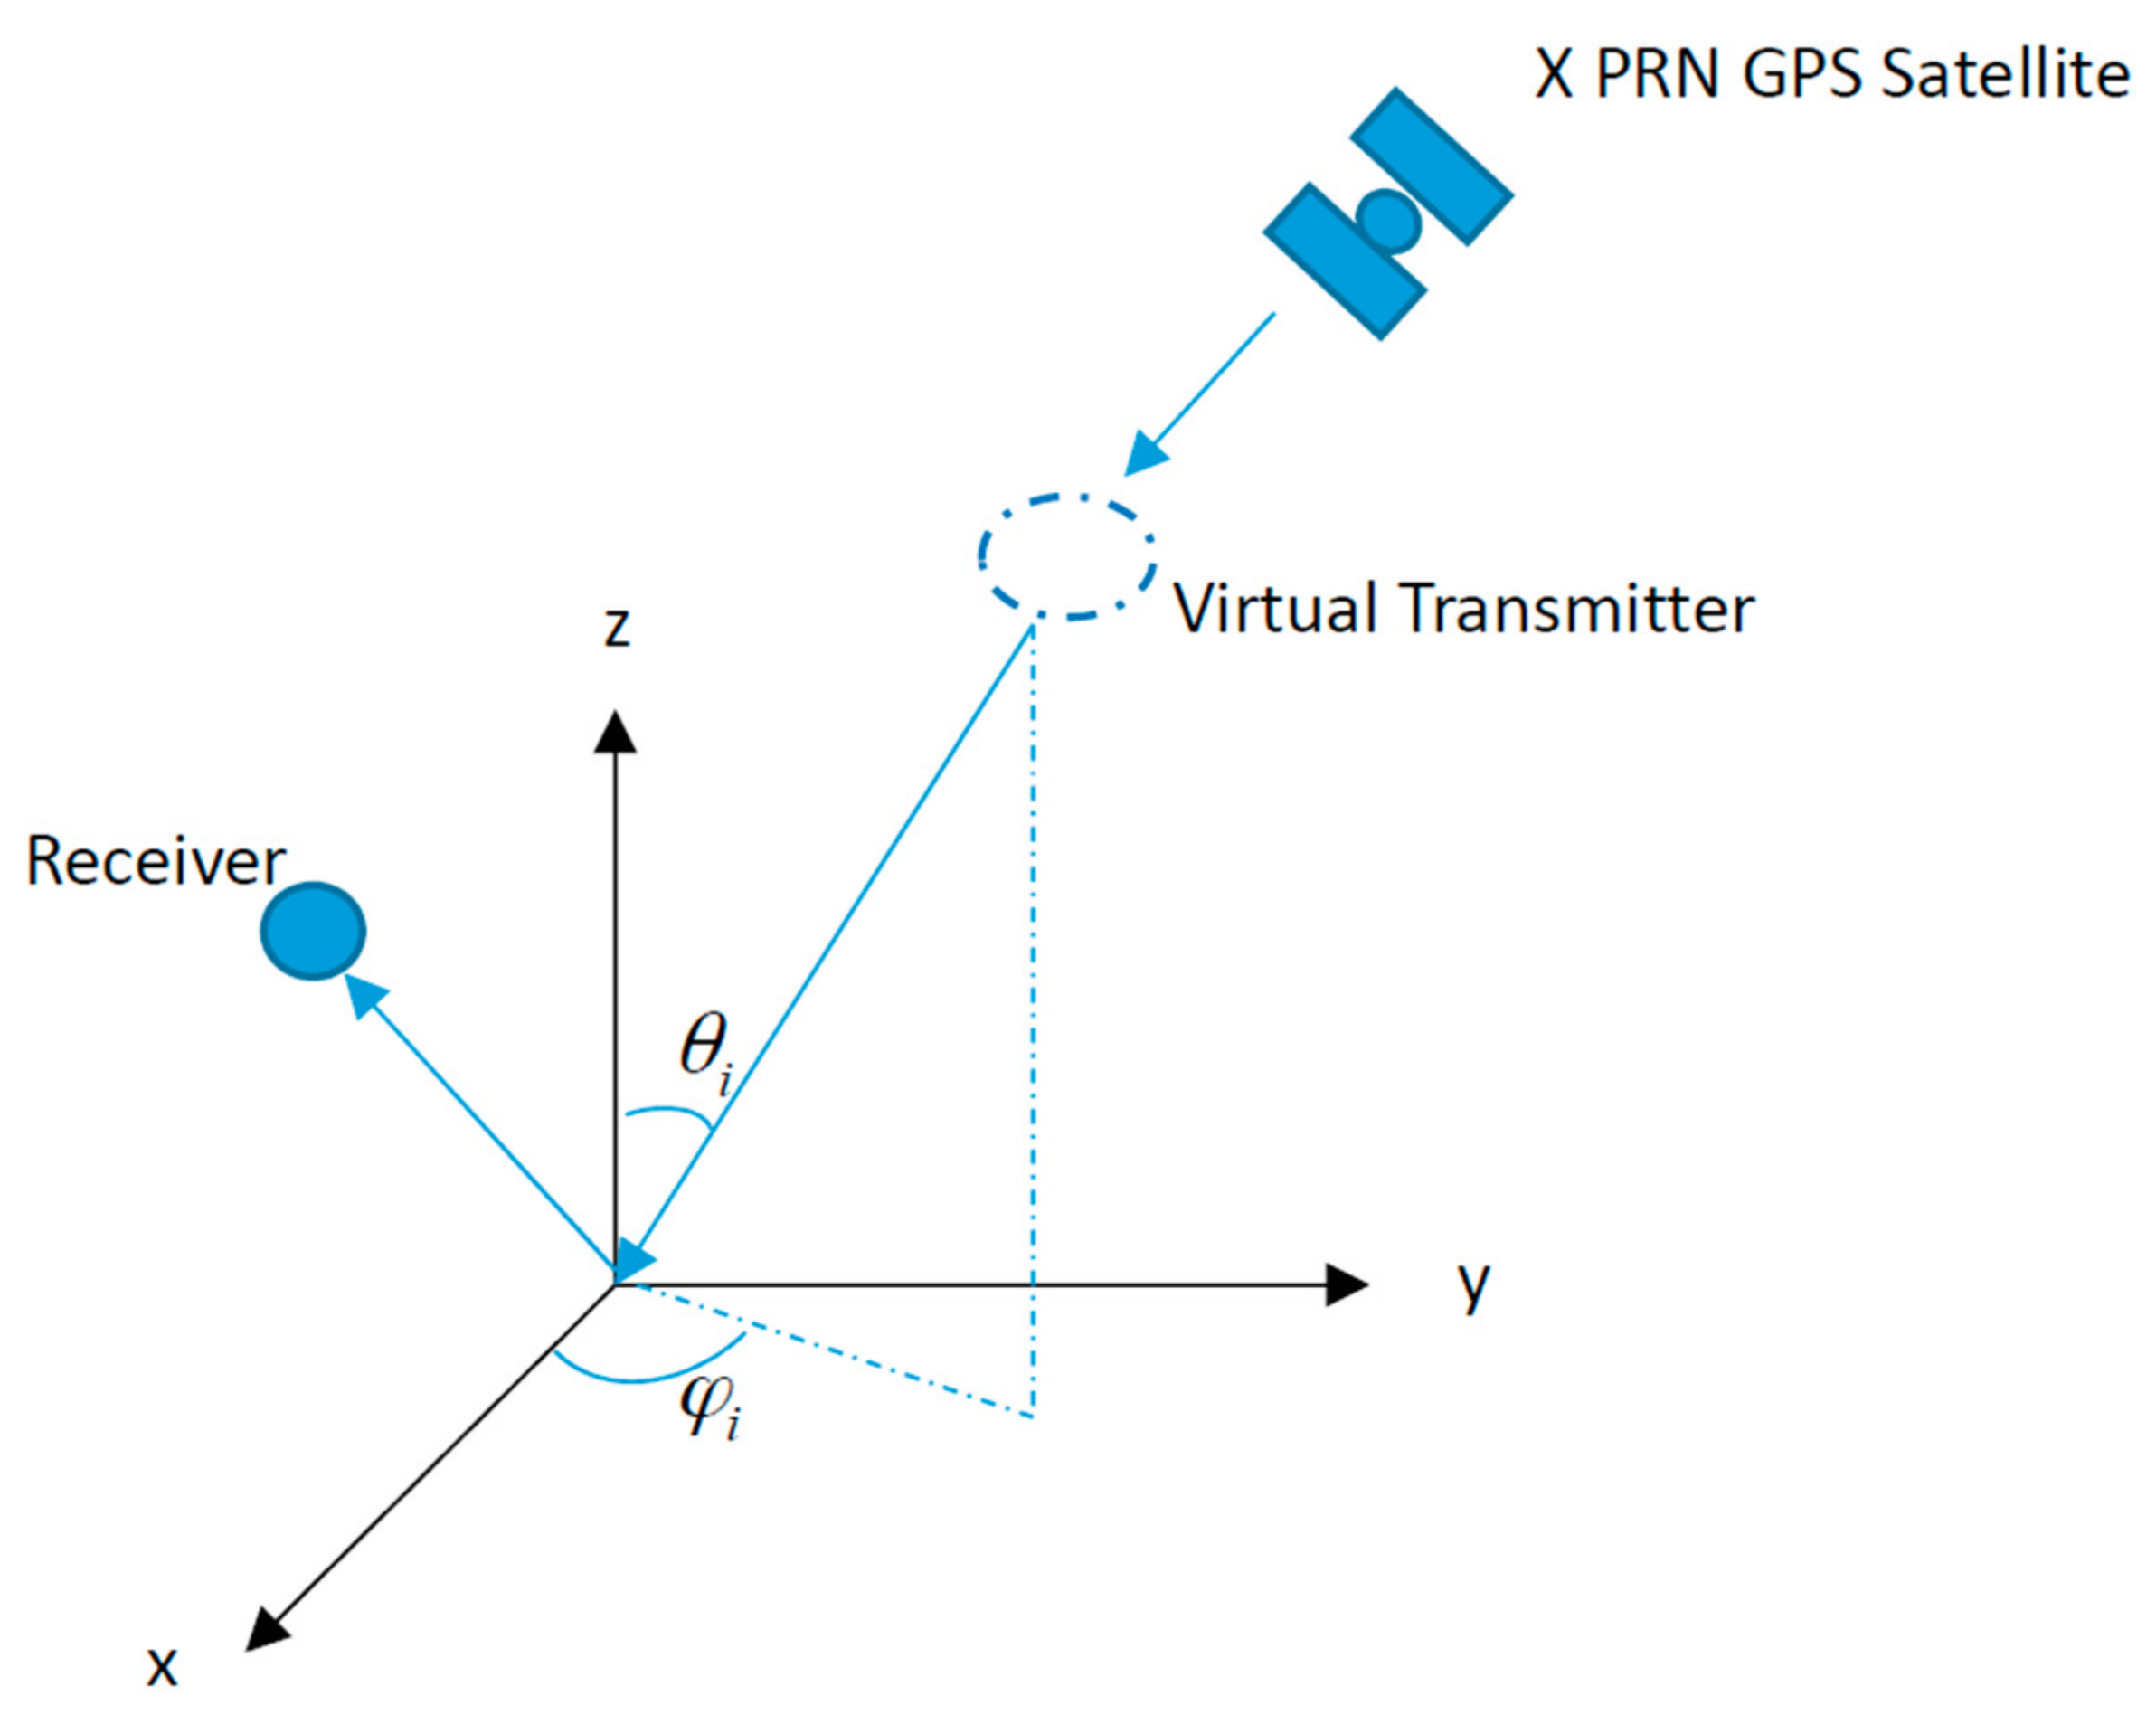
A difficult problem of GNSS-IR remote sensing is to solve the problem of time variant geometry. Since GNSS-R is essentially bistatic/multistatic radar, the concept of virtual bistatic radar is employed. The position of the ground GPS receiver is fixed; only the positions of transmitters (GNSS constellation) are changing. In a fixed observation geometry (fixed incident azimuth angle and zenith angle), the direction of the virtual transmitter is fixed in the geometry of the observation, thus there is always a GNSS satellite falling into the virtual transmitter location. Thus, the observation mode of virtual bistatic radar in the specified observation geometry is formed to simplify the analysis. The scattering properties of the reflected surface are anisotropic. We limit the observation angle to exclude the effects of surface scattering differences at different observation angles. Figure 4 shows the illustration of virtual bistatic radar. Since the receiver collects the specular scattering properties, there is no consideration for scattering difference of various zenith angles. When doing analysis, we have used the averaged detrended SNR in a fix elevation angle, which is different from the commonly used data analysis.
4.2. Analytical Data Selection and Preparation
Soil moisture and snow depth affect the GPS multipath modulation patterns. When the investigation of the freeze/thaw process is carried out, we must consider the effects of soil moisture and snow depth. We need to find an in-situ measurement where not only the soil temperature is recorded, but also the soil moisture and snow depth are provided. Within the GPS-IR resolution (1 km), a GPS site should be specifically chosen for investigation.
Since 1991, the Natural Resources Conservation Service (NRCS) has operated a national Soil Moisture/Soil Temperature (SM/ST) Pilot Project and focuses on the acquisition of comprehensive soil moisture and climate information. NRCS has an automated system named SNOTEL (Snow Telemetry), which is designed to collect the snowpack and meteorological information in the Western U.S. and Alaska. SNOTEL data are available near real-time for water cycle and climate study. The basic SNOTEL collects data of snow depth, precipitation and air temperature. Soil moisture and temperature information at a depth of 5 cm, 10 cm, 20 cm and 50 cm are provided in many enhanced SNOTEL stations, which provide reliable and efficient data for this investigation.
In this section, SNOTEL site Coldfoot (Site ID 958) in Alaska (Lat.: 67.25; Lon.: −150.18; Ele.: 316.99 m) is specifically selected. Its data are reported since 1 March 1995. Figure 5 shows the time series of snow depth, near surface soil moisture and soil temperature from 2009 to 2015. The top panel shows the time series of snow depth. For each year, during approximately April to October, there is no snowpack. For the remaining months of the year, SNOTEL site 958 is covered by snow, and its depth varies with time. Meanwhile, time series of soil moisture are also presented in the middle panel of Figure 5, and they have a very large difference for each month. For those periods where there is no snow, soil moisture also has a large difference. As for the initial investigation of the bare soil freeze/thaw process detection, to simplify the problem, we need to exclude the influences of soil moisture and snowpack on GPS SNR modulations. The second panel of Figure 5 presents the variations of soil temperature from 2009 to 2015. To focus on the effects of bare soil freeze–thaw process on GPS SNR modulations, the dates when soil freeze/thaw (or vice versa) process has happened are specifically chosen. Meanwhile, soil temperature and snow depth are constant during those periods.
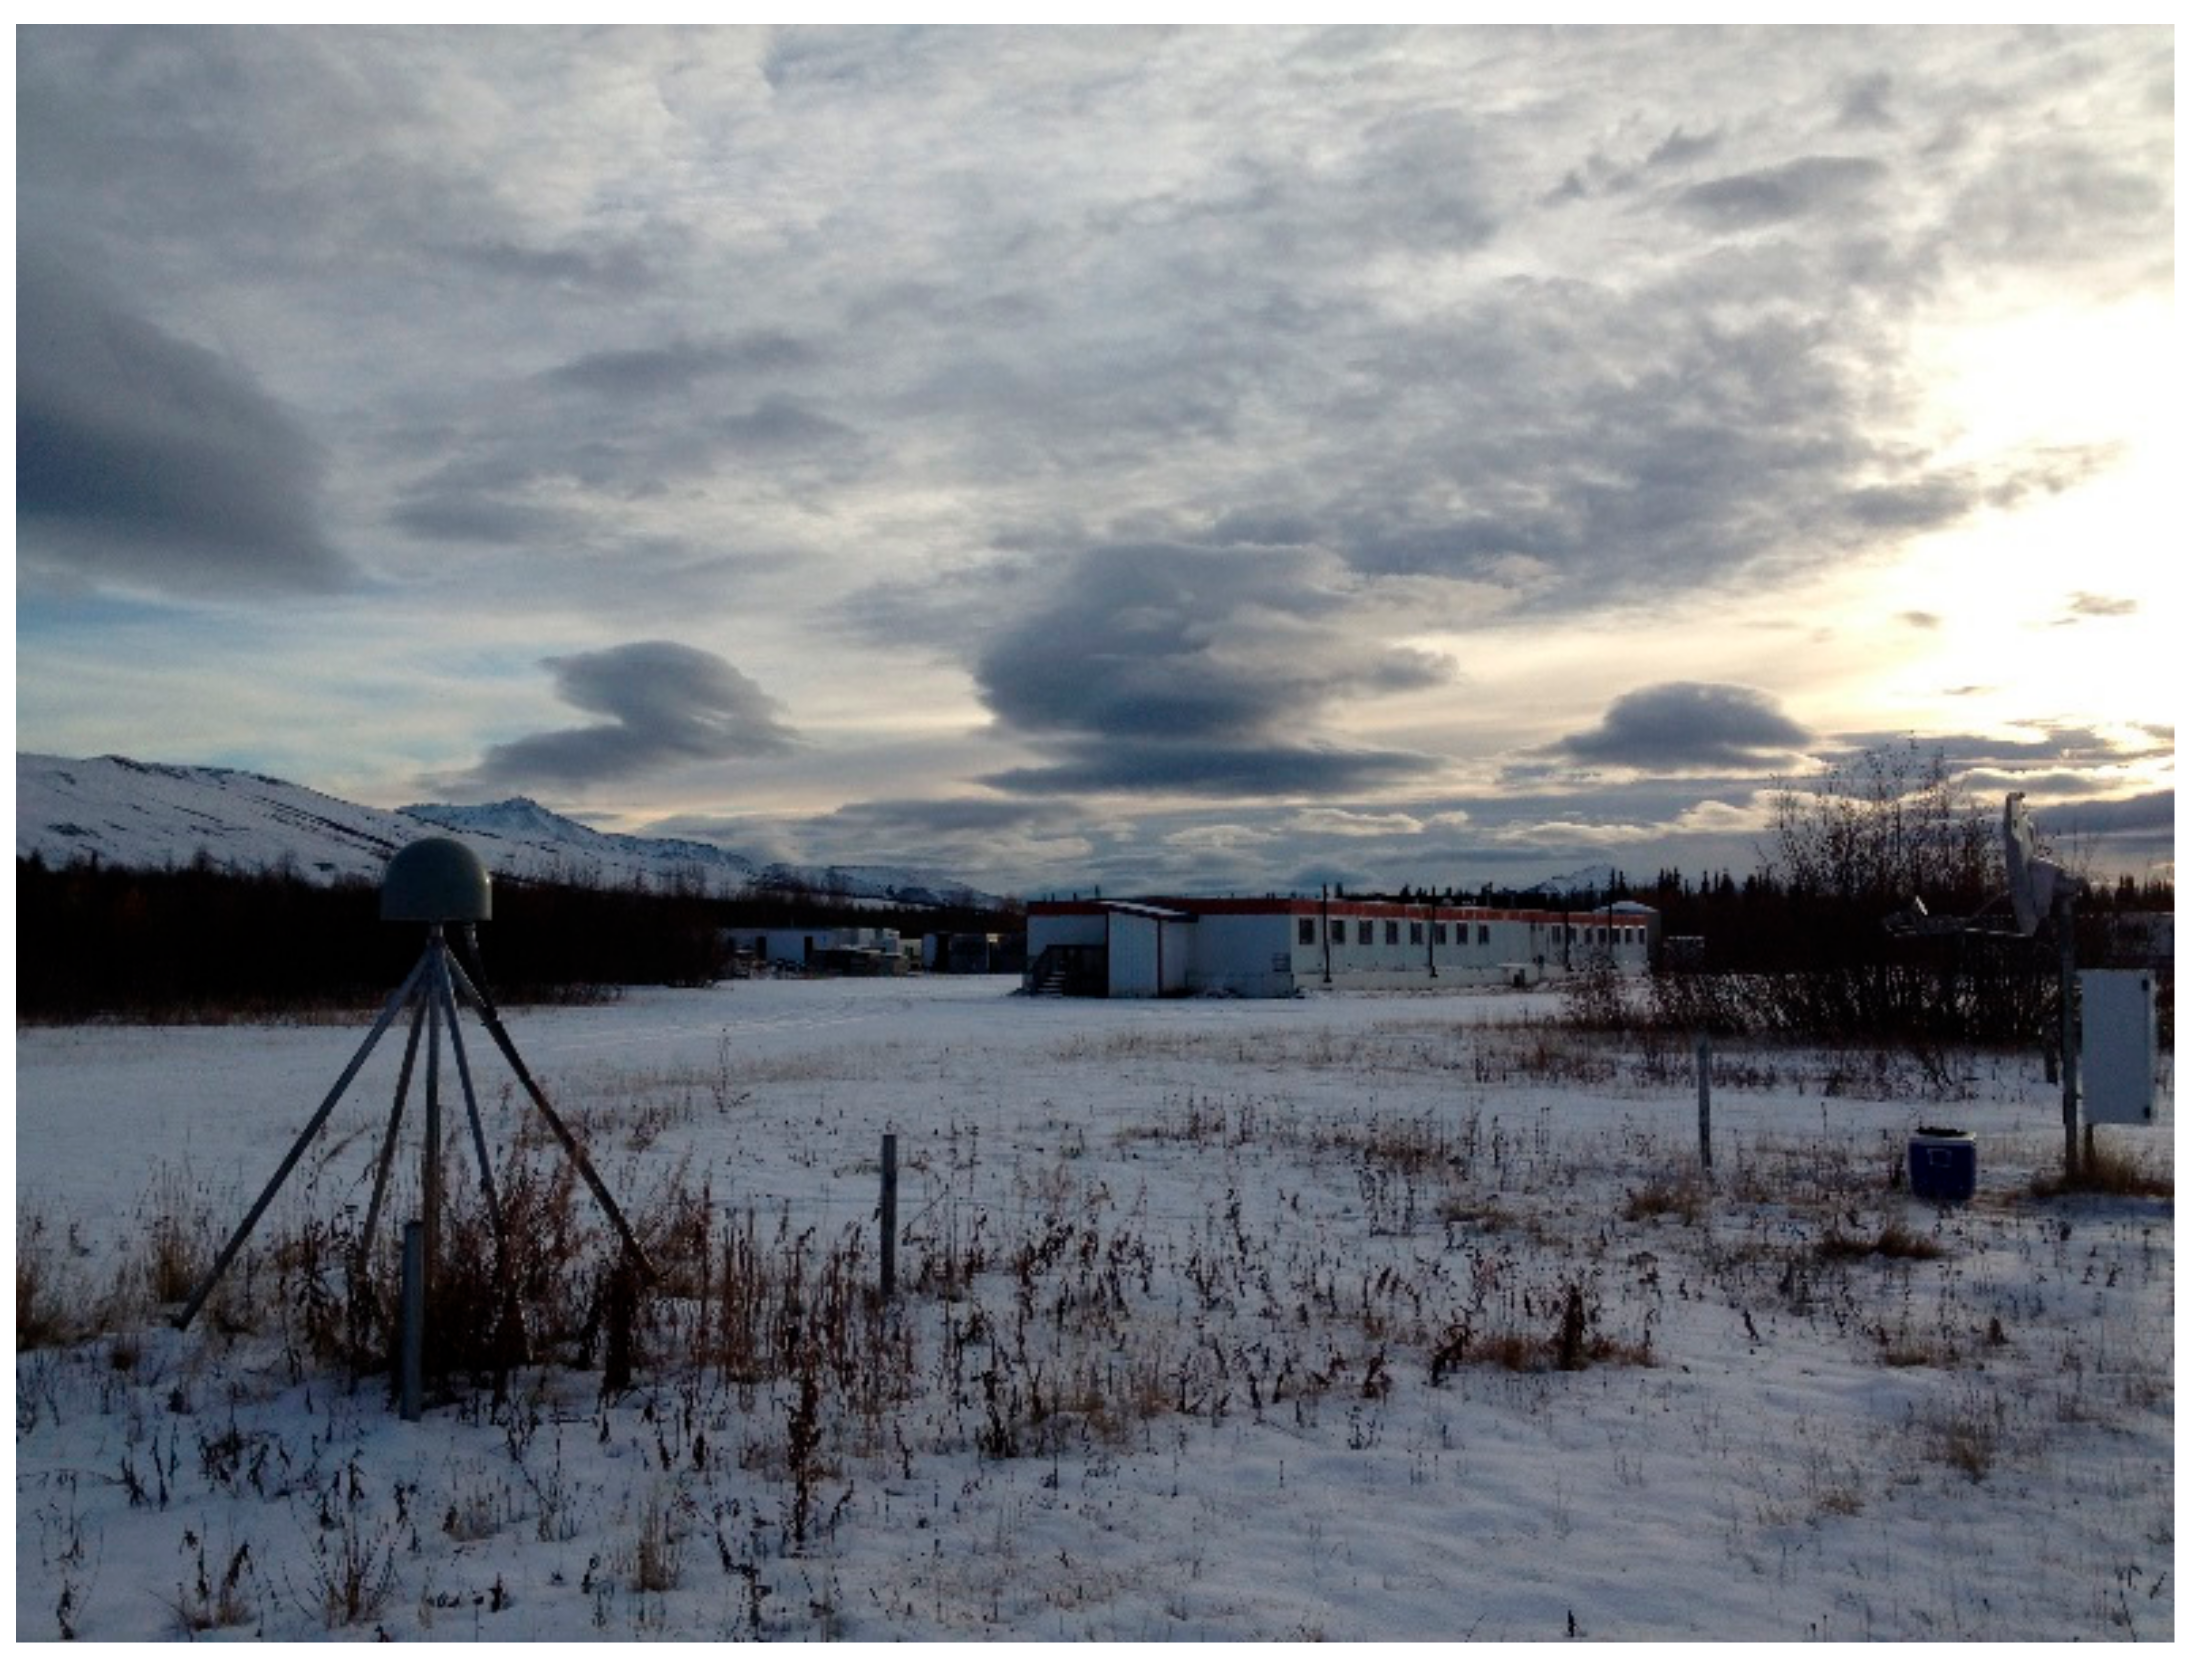
To investigate the soil temperature effects on GPS SNR modulation pattern, we need to find a GPS site surrounding the SNOTEL site 958. The Plate Boundary Observatory (PBO) is funded by the National Science Foundation and it is the geodetic component of EarthScope. A major component of the PBO is a network of 1100 permanent, continuously operating GPS stations. Within the GPS-IR resolution (about 1 km), one PBO site, Coldfoot_AK2006, as shown in Figure 6 (ID AB33, Lat.: 67.251; Lon.: −150.1725; Ele.: 334.76 m), is selected for validation. GPS multipath modulations are affected by the antenna gain pattern and the dielectric properties of the reflected surface. In the analysis, the receiver and antenna model remain unchanged, and the aim is to overcome their effects on the modulation pattern. Meanwhile, we can focus on the influences of reflected properties.
We use GPS SNR observations in the comparisons. RINEX (Receiver Independent Exchange format) data are available to the public in ASCII format. In the theoretical section, the effects of carrier frequencies are also presented. Since the reflected properties within the GPS frequencies are the same, L2 carrier phases are used in our analysis. Normal sampling rate (interval >1 s) is used. The used SNR is presented as
where , and are the direct power, reflected power and the interference phase, respectively. Since the first order SNR observed by geodetic GNSS receivers is determined by the direct signal power, we need to separate reflected signals contributions from GNSS multipath. The detrended SNR can be expressed as:
Low-order polynomial is used to remove the long-time trend in our analysis, and the detrended SNR are converted from dB to linear units.
4.3. In-Situ Measurement Validation
The specifically chosen dates and the soil information in 2011 for SNOTEL site 958 are shown in Table 2; the GPS receiver is TRIMBLE NETRS and the antenna model is TRM29659.00 (Table 2). There is a slight change in soil moisture (about 0.017) from DOY (Day of Year) 318 (2011) to DOY 323 (2011); snow depth remains 20 cm, but the soil temperature has changed from above 0 °C to below 0 °C. Soil temperature became 0 °C on DOY 320 (2011).
Two representative days are chosen for comparisons. On DOY 318, the soil temperature is 0.2 °C, while the soil became frozen on DOY 322. Their corresponding mean detrended SNR changes are given in Figure 7. As the soil changes from melt state to frozen state, it will result in the variations of GPS SNR modulation pattern (Figure 7), not only the amplitude but also the phase shift, and they are related to the elevation angles.
To further compare, we choose time periods when the near-surface freeze–thaw process has occurred. Meanwhile, to simplify the problem and exclude the effects of soil moisture and snow depth variations on GPS SNR modulations, time periods when there are small variations of these two geophysical parameters should be chosen. Based on these criteria, we have checked data from 2009 to 2015. Data in four years (2009, 2012, 2013 and 2014) are used for our analysis. (Figures S2.1–S2.8 in the Supplementary Materials are provided to illustrated why we skipped 2010 and 2011, and discarded the freezing or thawing event for 2009, 2012, 2013, and 2014. As can be seen in Figure 2, Figure 3, Figure 4, Figure 5, Figure 6, Figure 7, Figure 8 and Figure 9, when the thawing or freezing event has occurred, there is sudden change of soil moisture and snow depth, which do not satisfy the data analysis requirements.) Variable “ADSNR” is used for analysis. First, we have the detrended SNR data. Second, the detrended SNR data are averaged for multiple satellites. For the same elevation angle, we have used their ADSNR data for calculation. The tolerance for the “same” elevation angle is 1°. Azimuth angle effects are not included.
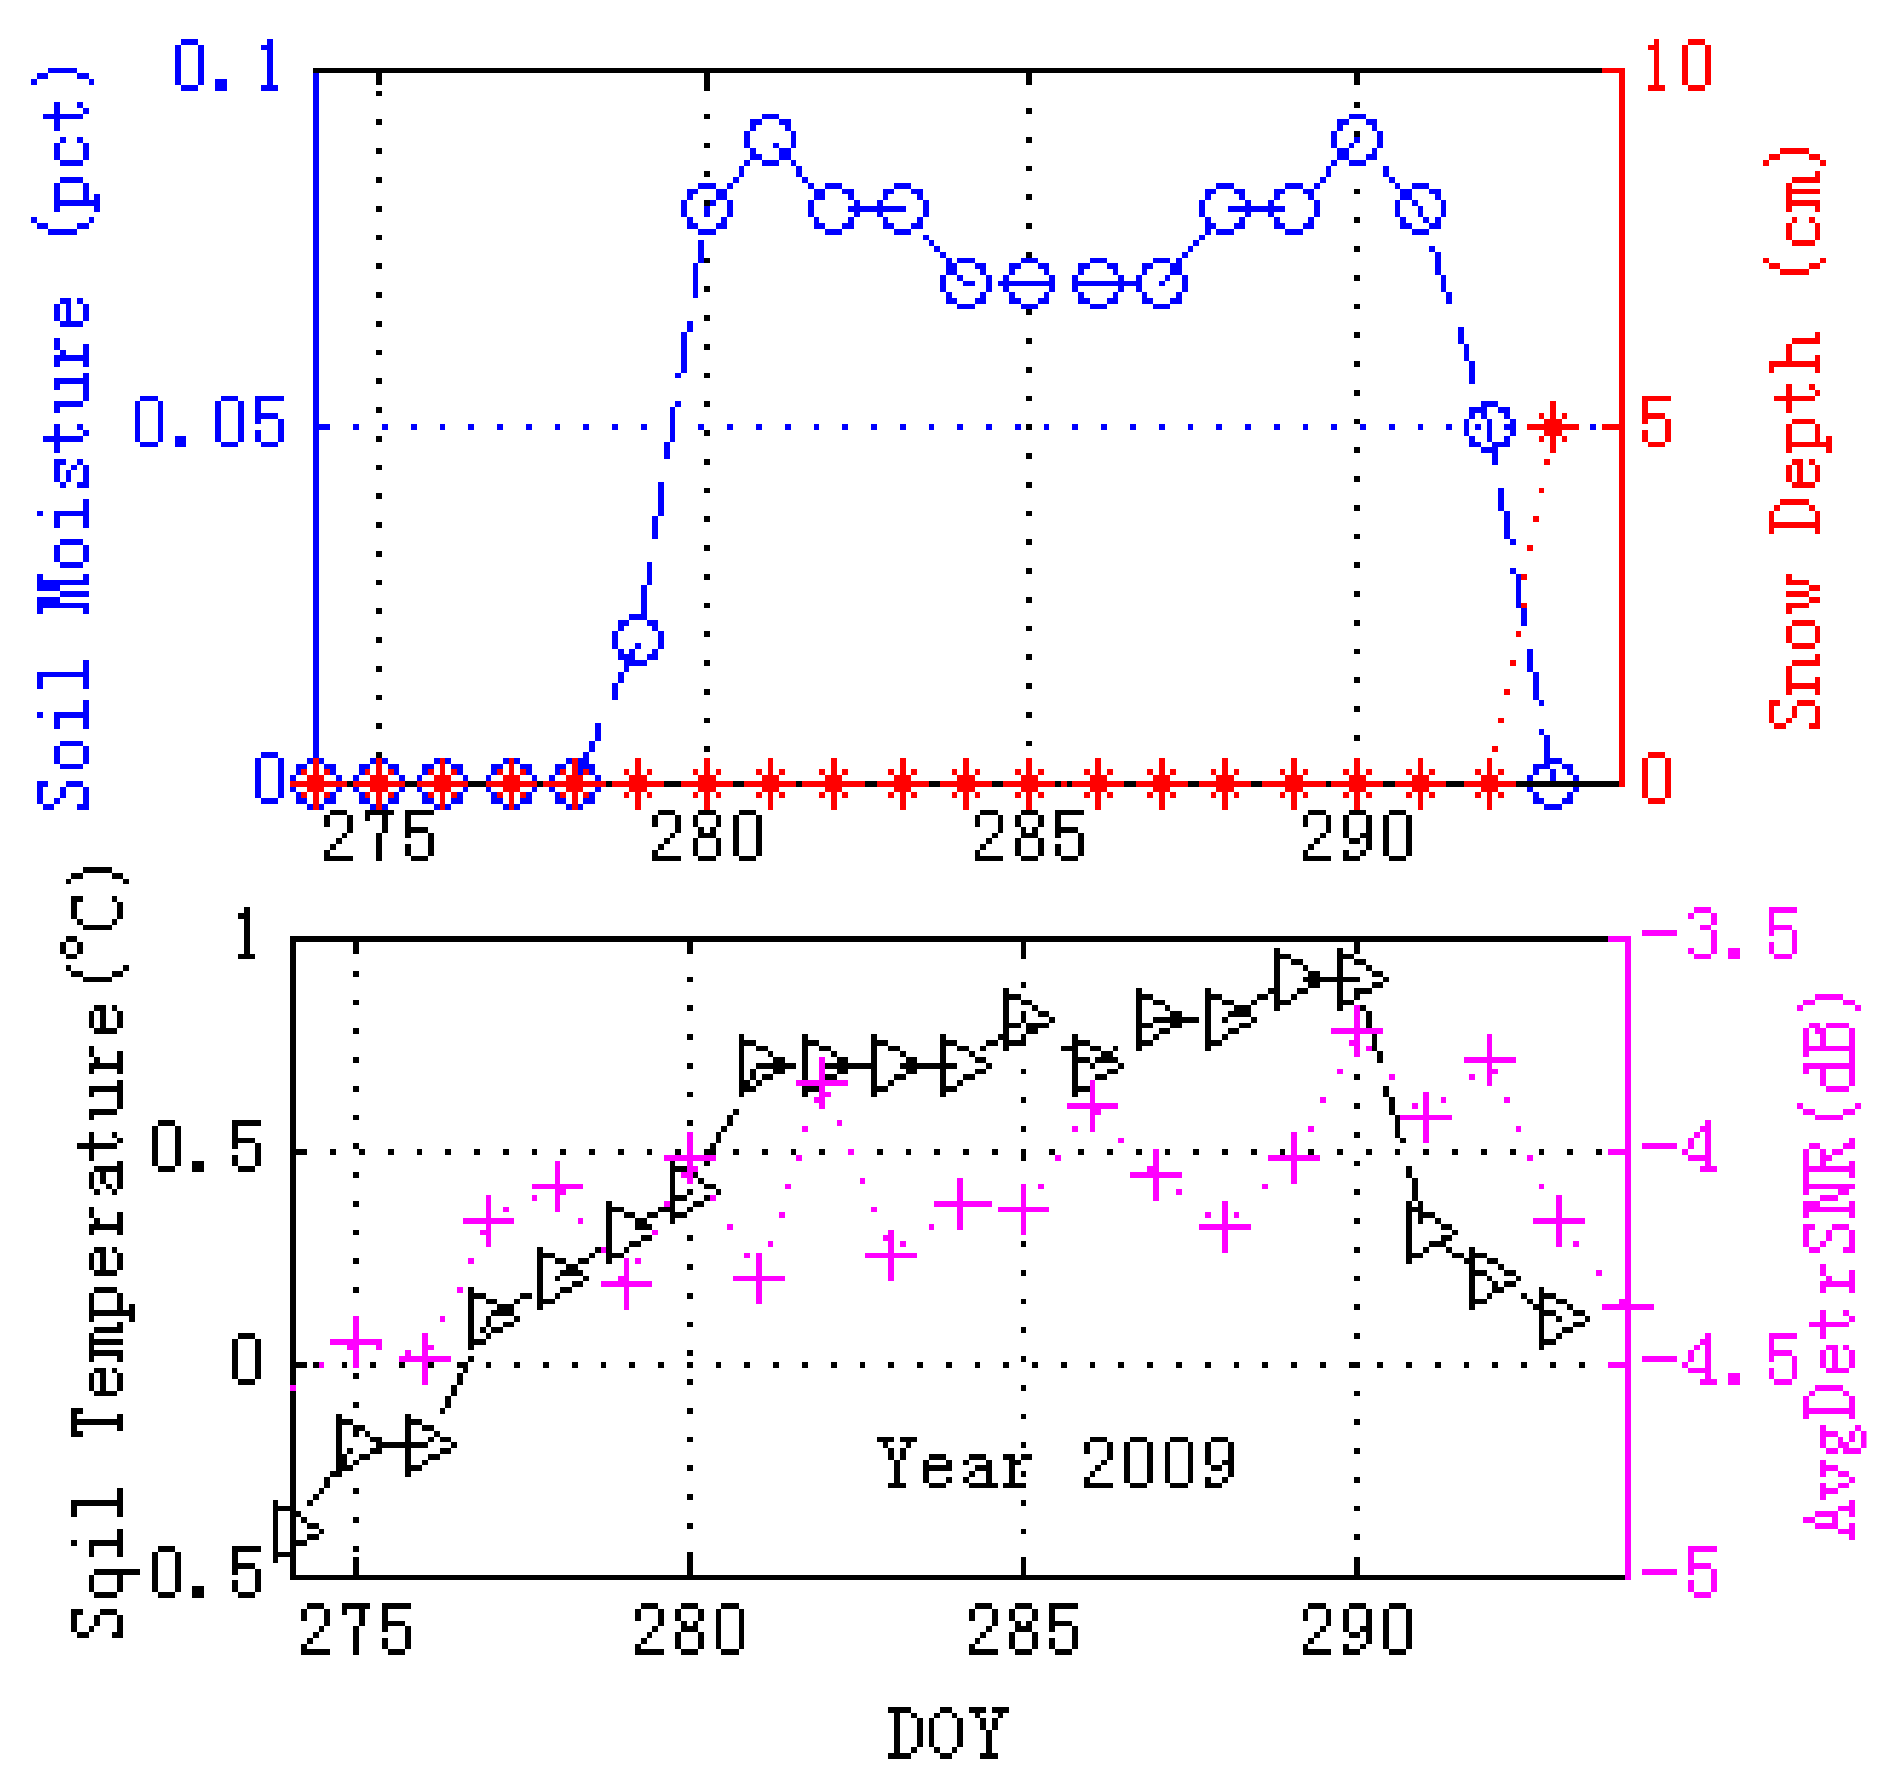
Figure 8 shows the comparisons between GPS site (AB33) and SNOTEL site (ID 958) from DOY 270 (2009) to DOY 295 (2009), while the elevation angle for GPS satellite is 20°. The upper panel presents variation series of soil moisture and snow depth. The soil moisture is from 0 to 1%, namely very dry soil. There is no snowfall during this period. Thus, the effects of soil moisture and snow depth can be ignored, but the soil has changed from below 0 °C to above 0 °C. That is to say, these two geophysical parameters (soil moisture and snow depth) have almost no influence on the SNR modulations. When the bare soil changed from below 0 °C to above 0 °C, the ADSNR has shown a corresponding variation trend, and the absolute correlation coefficient is 0.72. Results show that the variable of soil temperature and ADSNR has a good correlation.
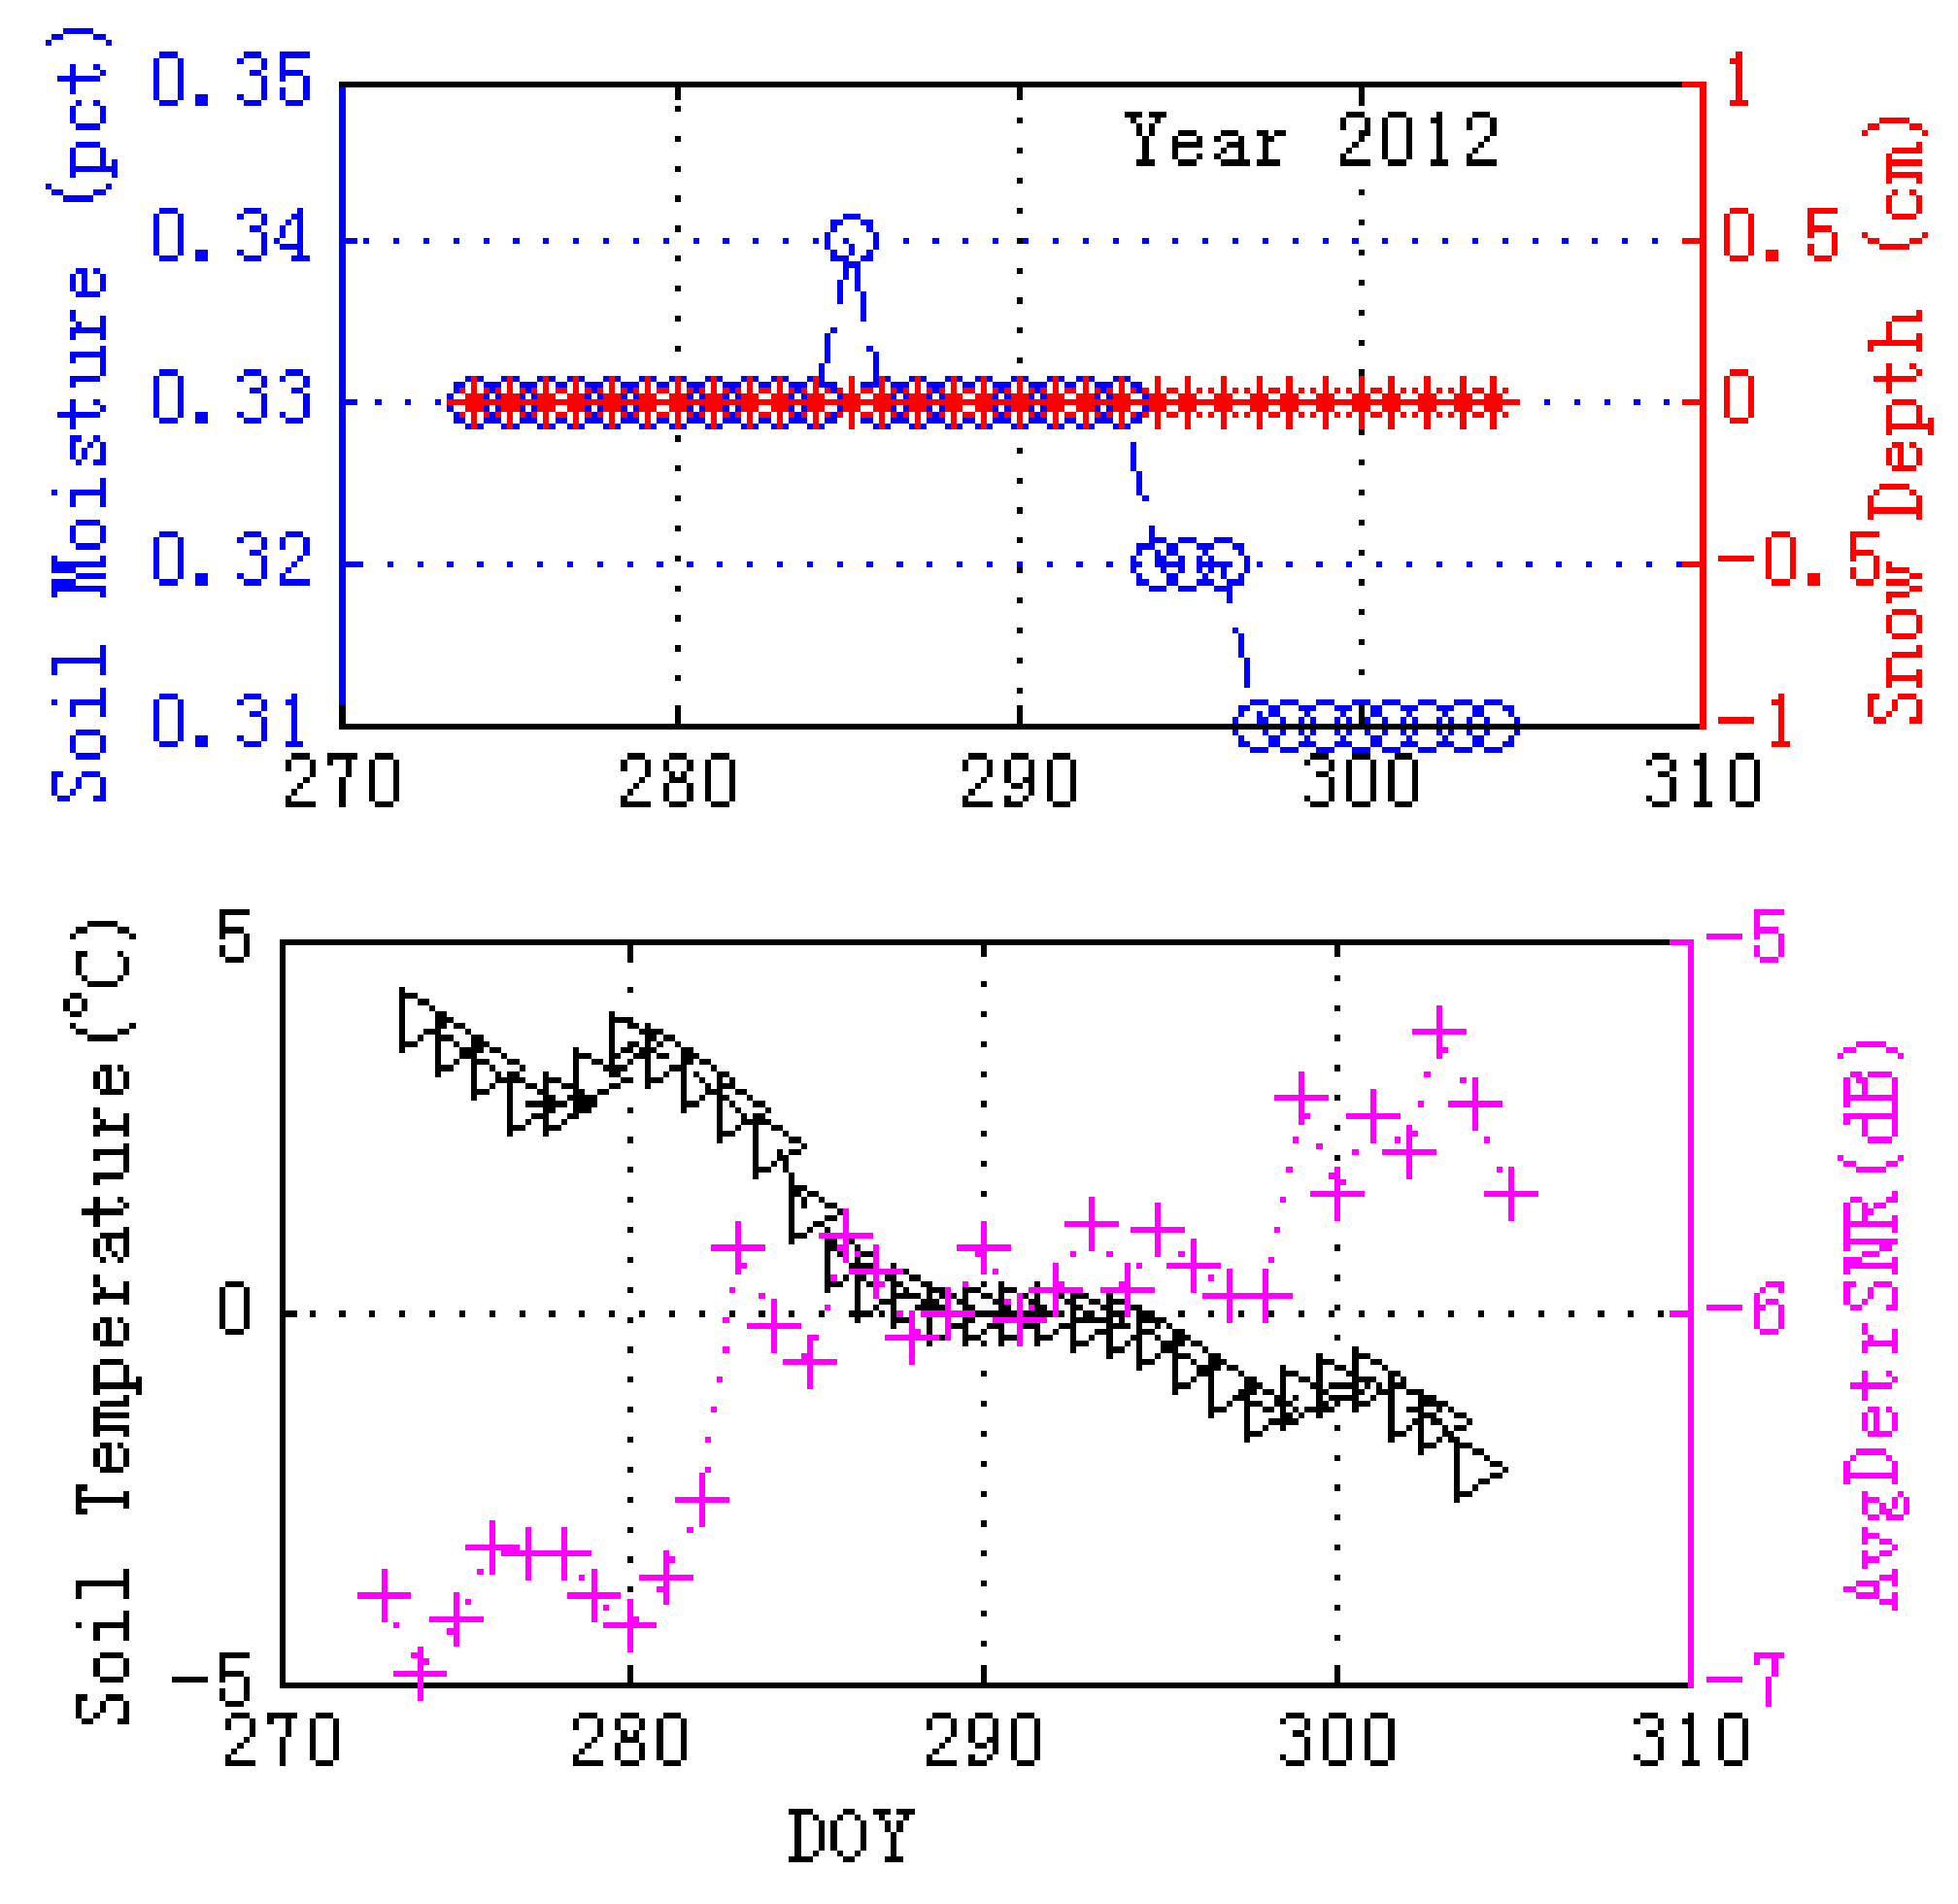
From DOY 270 (2012) to DOY 305 (2012), as shown in the upper panel of Figure 9, variations of soil moisture are below 0.04, i.e., very dry soil, while there is no snow during these periods; therefore, the effects of soil moisture and snow depth on GPS multipath observables can be ignored. In the bottom panel of Figure 9, when the soil is changed from thawed state to frozen state, ADSNR data start to increase, which is affected by the soil temperature. The direct signals have been excluded from the ADSNR data. The absolute correlation coefficient between soil temperature and ADSNR data is 0.90. There is a fairly good relationship between soil frozen/thaw state and the ADSNR data.
The upper panel of Figure 10 presents the comparisons between GPS site AB33 and SNOTEL site 958 on DOY 142 (2013) and DOY 162 (2013). The elevation angle is 20°. There was no snow and the soil moisture changed from 0.08 to 0.15 during these periods, which will result in small variations of dielectric properties. When the soil changed from frozen state to thawed state, the relevance between soil temperature (frozen state to thawed state) and GPS SNR data can be represented in the bottom panel, and the ADSNR data (direct signals have been removed) have a corresponding increasing trend. Although the correlation in 2013 is not as good as in 2012, there is still a good relevance between soil temperature and ADSNR data with the correlation coefficient of 0.65.
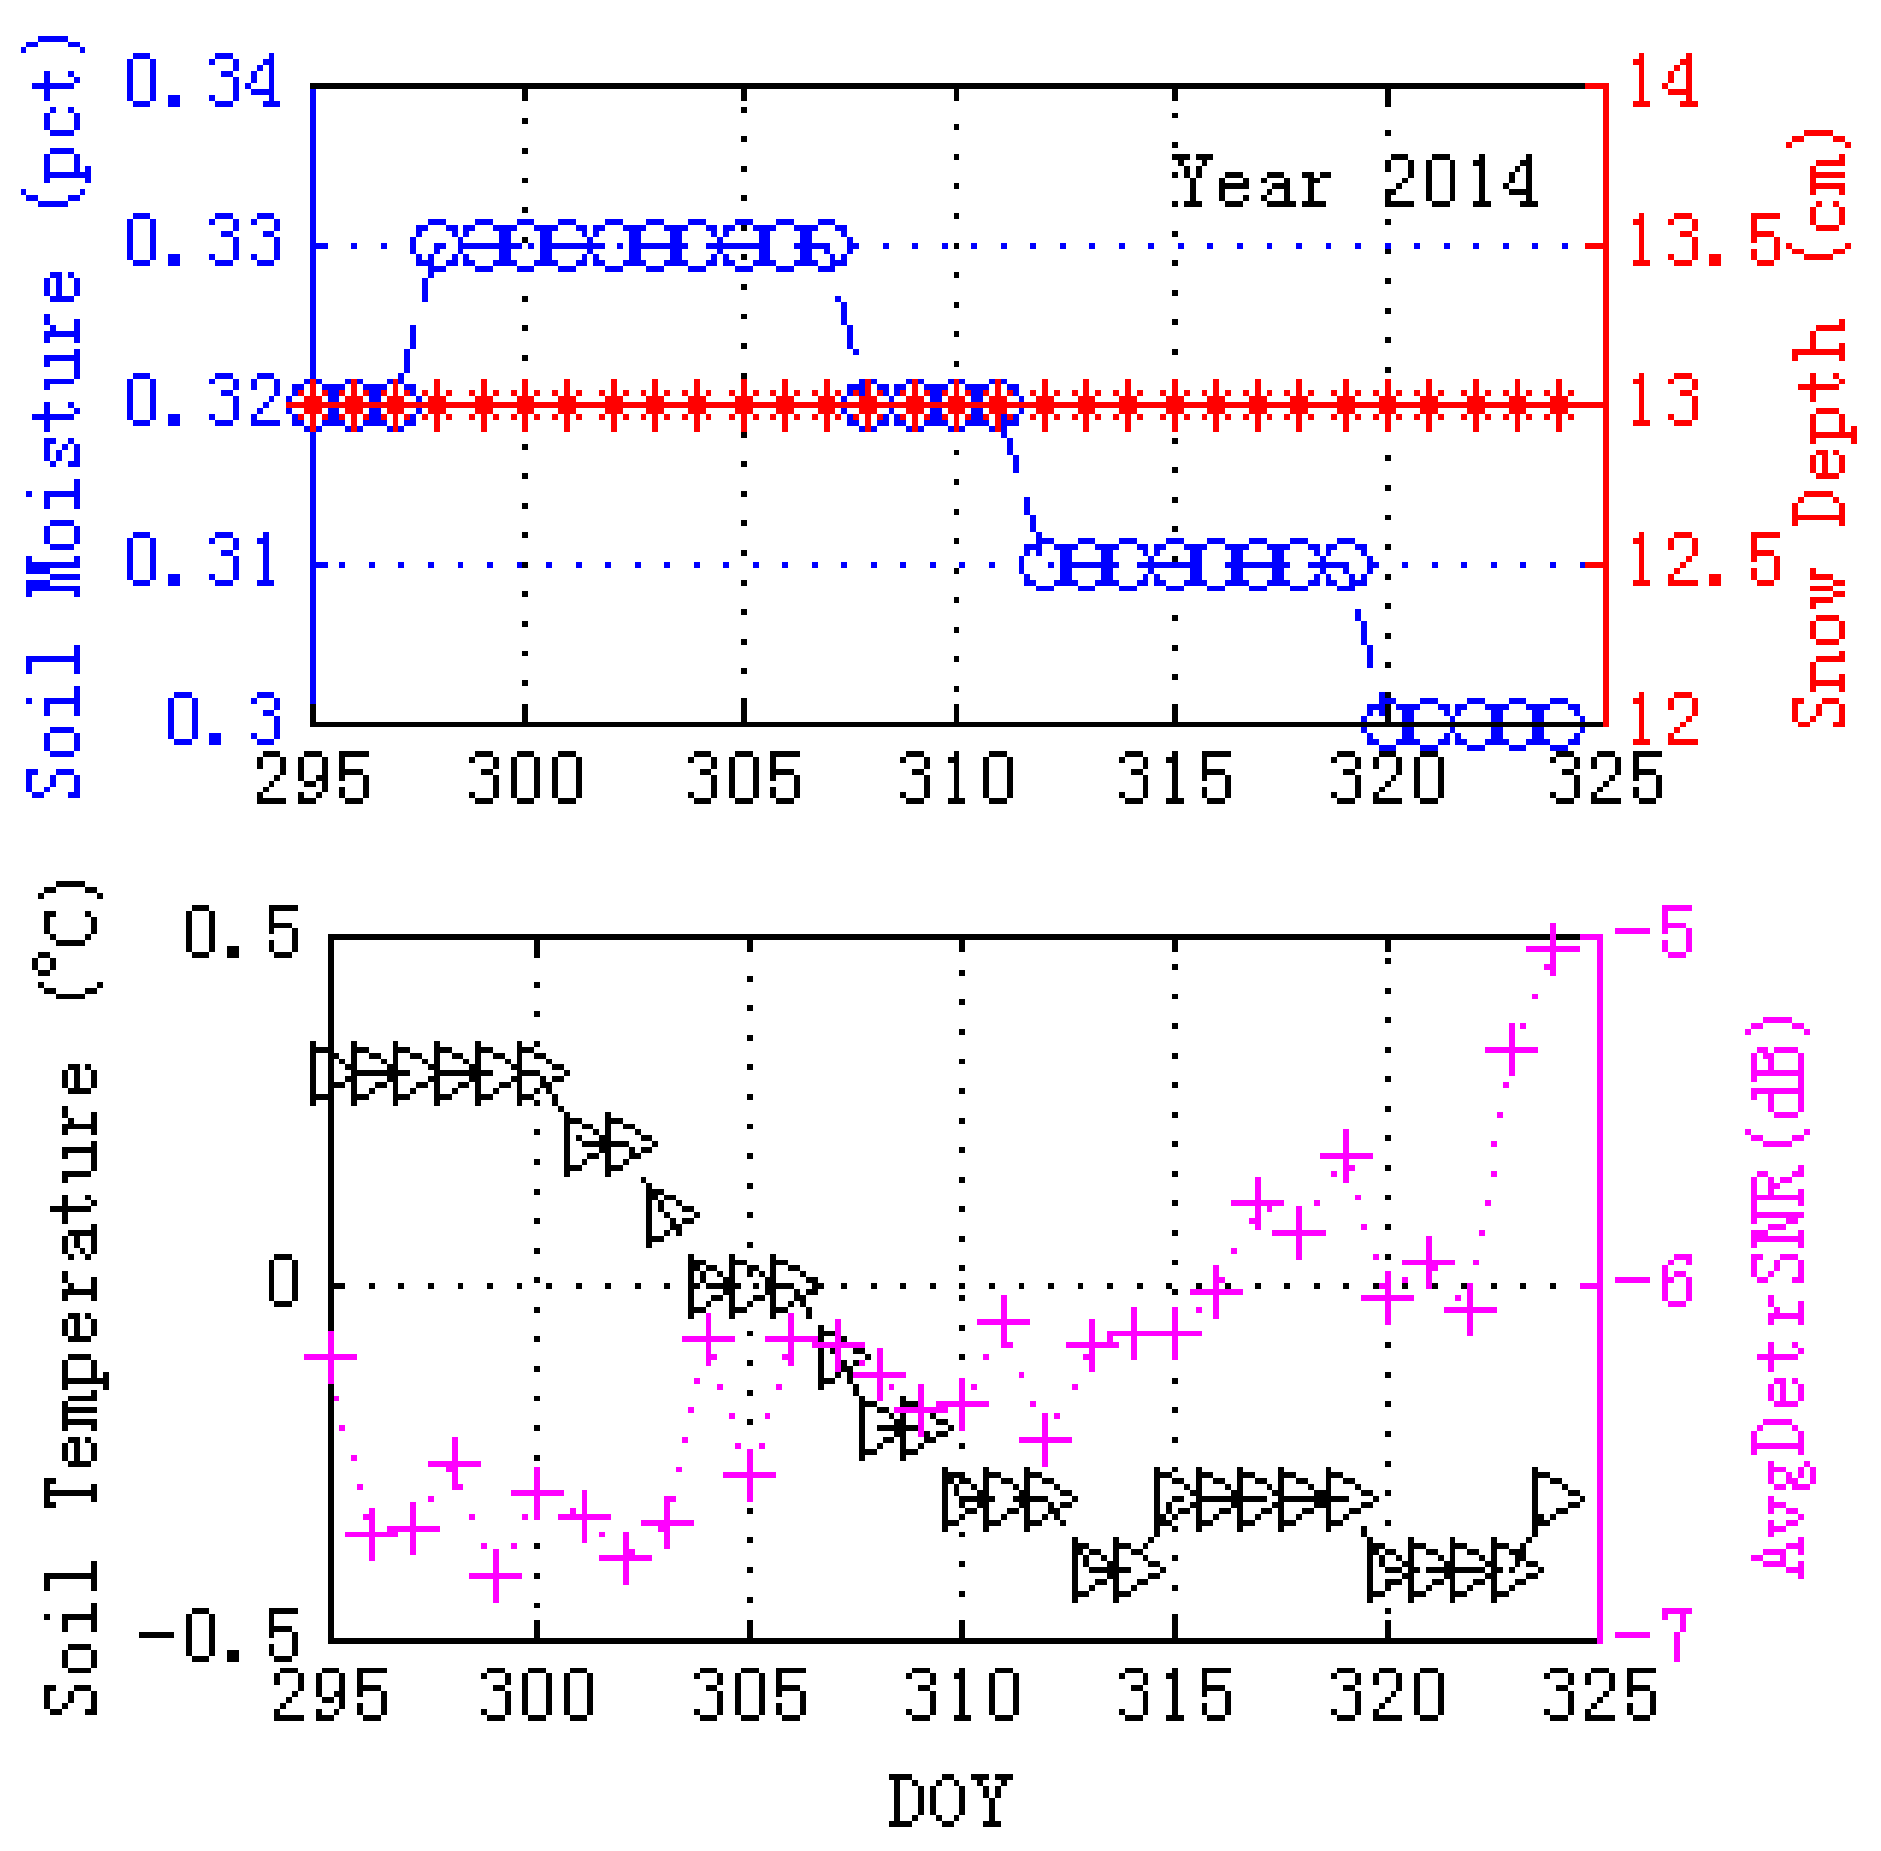
Figure 11 presents the comparisons between GPS site (AB33) and SNOTEL site (ID 958) from DOY 295 (2014) to DOY 325 (2014). The elevation angle is 20°. The upper panel shows the soil moisture and snow depth. Although soil is covered by snow during these periods, the snow depth remains 13 cm, and therefore it has no influence on the variations of GPS multipath modulations. The variations of volumetric soil moisture are below 0.03, which will result in no dielectric properties difference. The bottom panel of Figure 11 shows the comparisons between soil temperature and the ADSNR data. When the soil temperature changes from above 0 °C to below 0 °C, the ADSNR data have a corresponding increase. The absolute correlation coefficient between these two variables is 0.70, indicating a good correlation between the soil freeze/thaw process and the GPS SNR data.
However, it should be noted that, as for the fixed satellite elevation angle, in Figure 8 and Figure 10, it is a thawing event and the relation between ADSNR and soil temperature is positive, while, in Figure 9 and Figure 11, there is a negative correlation between ADSNR and soil temperature for these freezing events. Therefore, the relation between SNR and the soil temperature in a fixed satellite elevation angle has indicated the freezing or thawing event. Data analysis and comparisons for elevation angles between 10° and 30° are also provided in the Supplementary Materials.
5. Discussion
5.1. Influencing Factors
To validate the possibility of monitoring soil freeze/thaw process using GPS-IR technique, we also have to take the GPS receiver temperature, soil moisture, and snow depth into account, which may have the possibilities to affect the final GPS SNR signals. Considering the general GPS receiver composition, when the equipment temperature changes in such a small range, especially from below 0 °C to above 0 °C, their dielectric properties do not change much. The soil has the unique features that there are apparent changes for the dielectric properties, since the permittivity of water is 85, while the permittivity of other solid material is usually between 1 and 6. In this soil freeze/thaw process, considering the propagation of electromagnetic waves through the body of the equipment, the effect of GPS equipment temperature can be ignored. To take the thermal noise properties of the receiver electronics into account, we have done a test (Figures S1.1–S1.4 in the Supplementary Materials) using SNR above 45°, where multipath is negligible and shows no relation to temperature variations.
In the bare soil freeze/thaw process, it is often accompanied by the occurrence of snowfall. It is known that snow depth affects the GPS multipath observables, so we should exclude snow effects in the analysis of soil freeze/thaw process. The periods when there is no snow or the same snow depth, are specially chosen for analysis. Soil moisture is also an important factor that should be considered in the investigation, since it also affects the GPS multipath metrics. To eliminate the soil moisture effects, for the chosen periods, small variations or no variations of soil moisture are specially chosen, and its effects on the final GPS multipath observables can be ignored. As for the soil temperature, we have only chosen those time periods when soil freeze/thaw process has happened.
The theoretical analysis and in-situ measurements both confirm the possibility of soil freeze/thaw process detection using GPS-IR technique. Figure 8, Figure 9, Figure 10 and Figure 11 show comparisons between soil temperature and ADSNR data. Periods in 2009, 2012, 2013 and 2014 have been specifically chosen, and the correlation between soil temperature and ADSNR data is also evaluated. Lower-polynomial has been used to remove the effect of direct signals. The influences of soil moisture and snow depth can be eliminated. The absolute correlation coefficients between soil freeze/thaw temperatures and ADSNR are 0.72, 0.90, 0.65 and 0.70, separately.
Since scattering properties of the target objects are anisotropic, one difficult and complex problem to detect soil freeze/thaw process using GPS-IR is to find the most sensitive elevation angle that is good for SNR observation extraction and the final soil freeze/thaw process detection. Although the concept of virtual bistatic radar has been employed, more work should be performed to find the most sensitive angles (not only the elevation angle, but also the azimuth angle) in the future. The four years of analysis has shown that the GPS SNR modulation patterns have the potential for the investigation of soil freeze/thaw process. As for the experimental validation part, we used the existing PBO GPS data and the corresponding SNOTEL data to validate results. This new application of GPS-IR/GNSS-R will benefit more specific and targeted measurements.
5.2. GNSS-R Polarimetry
As for the ground-based GPS receivers, the antenna polarization is unique; however, polarization is an important variable of the electromagnetic wave and will provide more information of the target objectives.
Several ground-based experiments have been carried out for geophysical parameters detection and their antenna polarizations should be given attention, although they are not oriented to soil freeze/thaw process detection. In the early 2000s, a specially designed GNSS-R receiver with LHCP (Left Hand Circular Polarization) antenna was used in SMEX02/03 (Soil Moisture Experiments) experiments [12] to collect the reflected signals, which showed a strong correlation with the near surface soil moisture. To use the polarization information (polarization ratio) to cancel the roughness effects, the antenna of circular pol (RHCP (Right Hand Circular Polarization), LHCP) and linear pol (H, V) were designed to record the reflected signals in the BAO-Tower experiment [13]. However, their final experimental results did not confirm the theoretical analysis with probably simple assumption in the model. In the framework of LEiMON (Land Monitoring with Navigation Signals) project [14], a SAM receiver with both RHCP and LHCP antenna was used for soil moisture and vegetation monitoring and a GNSS-R signal simulator [15], i.e., the Soil and Vegetation Reflection Simulator (SAVERS) was developed to predict the power reflected by the land. Spanish researchers have developed the receiver SMIGOL (Soil Moisture Interference pattern GNSS Observations at L-band Reflectometer) with V polarization antenna and the advanced P-SMIGOL (Polarimetric SMIGOL) with an additional H polarization antenna except for V polarization antenna to carry out ground-based experiment. The Interferometric Pattern Technique (IPT) [16,17], which uses the information of notch numbers and positions, is used to retrieve the bare surface soil moisture, barley-covered soil moisture and vegetation water content.
From the ground-based experiments, it can be seen that the antenna polarizations are still in their development. Here, GNSS-R polarimetry will take advantages of the polarization sensitivity of the reflected signal for the exploration of the soil freeze/thaw process detection. At present, as for GPS-IR, it is thought that only the coherent scattering part at the first Fresnel Zone is received.
More work on the most sensitive polarization combination for soil freeze/thaw process detection will be further studied in our future work.
6. Conclusions
We present the monitoring of bare soil freeze–thaw process using GPS-IR technique with the theoretical study and in situ measurement validation. Theoretical analysis indicates that variations of soil temperature, especially freeze/thaw process or vice versa, result in changes of permittivity and the corresponding reflectivity. The forward GPS multipath simulating results show that surface soil temperature is related to the GPS multipath signals. Furthermore, the theoretical model and the possibility of soil freeze/thaw process detection using GPS-IR are validated by the in-situ measurement data. Two separate days in 2011 have shown that, when the soil changes from frozen state to the thawed states, the amplitude and phase of the SNR data also change. In the short time series of 2009, 2010, 2012 and 2014, when the soil freeze/thaw process with no coexistence of significant variations in soil moisture or snow depth has occurred, there is a good correlation between the soil temperature and GPS SNR data (direct signals have been removed). Theoretical fundamentals, simulations and in-situ measurement reveal that the existing geodetic GPS networks have provided us a new method to monitor near surface soil freeze–thaw process. In the future, hundreds of GPS receivers in cold region may meet the cost requirement for an in situ frozen/thaw soil process network. It could also provide a feasible way to calibrated and validate spaceborne satellites.
Supplementary Materials
The following are available online at www.mdpi.com/2072-4292/10/1/14/s1.
Acknowledgments
The authors would like to thank those making PBO station observations as well as Rui Jin and Xiaodong Qian at Shanghai Astronomical Observatory, Chinese Academy of Sciences. This study is supported by the Natural Science Foundation of China (NSFC) (Grant No. 41501384); the National Key R & D Program of China under contract #2017YB0502800 and #2017YFB0502802; and the academician workstation foundation (cfxyys201710).
Author Contributions
Xuerui Wu Conceived and performed the simulations and data analysis; Shuanggen Jin and Liang Chang contributed to data analysis; Xuerui Wu wrote the paper.
Conflicts of Interest
The authors declare no conflict of interest.
Appendix A
Appendix A.1. Soil Permittivity Models
In terms of electromagnetic characteristics, the soil is composed of four kinds of materials: air, solid particles, free water, bound water and ice. The final permittivity is the result of the interactions between various components. The permittivity of free water is defined as:
The real part and imaginary part of free water permittivity are presented in Equations (A1) and (A2). is the electromagnetic wave frequency. is the permittivity of free space. Effective conductivity is related to soil texture. is the solid material density. High frequency of pure water permittivity has nothing to do with soil temperature and salinity. Pure water static dielectric properties and the relaxation time of pure water are defined as:
As can be seen from Equations (A3) and (A4), and are functions of soil temperature. For frozen soil, due to phase changes of water, a component of ice is added:
For the estimation of the fractions of liquid water and ice in frozen soil, an empirical function is employed (Equation (A5)), while is unfrozen water content (%). A and B are parameters related to soil texture. T is the soil temperature (K). By introducing unfrozen volumetric moisture content (100 v/v) , Equation (A5) can be modified as:
where is the bulk density and is the specific density of water (g/cm3). The ice volumetric content (100 v/v) can be defined as:
where is total moisture (100 v/v) and is the specific density of ice (g/cm3). By multiplying the volumetric ice content and ice permittivity, , the final expression of frozen soil dielectric properties, can be obtained:
where is the permittivity, V is the volume of different components, the superscript is the constant shape factor, and subscripts s, a, fw, and bw refer to solid soils, air, free water and bound water, respectively. More information about soil permittivity models is provided in [31,32,35,36].
Appendix A.2. Coherent Scattering Properties
To calculate the coherent scattering properties, its basic form is the Fresnel reflection coefficients with a correction factor to take the surface roughness into consideration. The Fresnel reflection coefficients at vertical () and horizontal polarizations () are defined as:
where θ is the incidence angle, is the permittivity, is the wavenumber, Fs is the surface roughness factor and is the RMS height of surface roughness. The same polarization and cross polarization are marked by and , respectively. The circularly polarized scaler reflection coefficients are defined as:
The circular reflection coefficients are the linear combination of and . By employing Equations (A10)–(A13), the coherent scattering properties of the frozen/thawed soil can be calculated.
Appendix A.3. Forward Multipath Simulators
The simplified form of forward multipath simulators can be summarized as the following,
The direct and reflected electric field are presented in Equations (A14) and (A15), where and represent the antenna gain and Woodward ambiguity function, respectively. Subscripts and denote direct and reflect components and is the coupled surface/antenna coefficients in Equations (A16) and (A17).
Superscripts and indicate the polarizations of RHCP and LHCP, respectively. is the antenna phase pattern. The interferometric phase can be expressed as: . The same polarization and cross polarization are marked by and , respectively.
References
- Judge, J.; Galantowicz, J.F.; England, A.W.; Dahl, P. Freeze/thaw classification for prairie soils using SSM/I radio brightness. IEEE Trans. Geosci. Remote Sens. 1997, 35, 827–832. [Google Scholar] [CrossRef]
- Zhang, T.; Armstrong, R.L.; Smith, J. Investigation of the near-surface soil freeze-thaw cycle in the contiguous United States: Algorithm development and validation. J. Geophys. Res. Atmos. 2003, 108, 1054–1058. [Google Scholar] [CrossRef]
- Ulaby, F.T.; Moore, R.K.; Fung, A.K. Microwave Remote Sensing: Active and Passive. In Advanced Book Program/World Science Divison; Addison-Wesley: Reading, MA, USA, 1981. [Google Scholar]
- Jagdhuber, T.; Stockamp, J.; Hajnsek, I.; Ludwig, R. Identification of Soil Freezing and Thawing States Using SAR Polarimetry at C-Band. Remote Sens. 2014, 6, 2008–2023. [Google Scholar] [CrossRef]
- Zhang, T.; Armstrong, R.L. Soil freeze/thaw cycles over snow-free land detected by passive microwave remote sensing. Geophys. Res. Lett. 2001, 28, 763–766. [Google Scholar] [CrossRef]
- Cardellach, E.; Fabra, F.; Nogués-Correig, O.; Oliveras, S.; Ribó, S.; Rius, A. GNSS-R ground-based and airborne campaigns for ocean, land, ice, and snow techniques: Application to the GOLD-RTR data sets. Radio Sci. 2011, 46, 3604–3629. [Google Scholar] [CrossRef]
- Jin, S.; Komjathy, A. GNSS reflectometry and remote sensing: New objectives and results. Adv. Space Res. 2010, 46, 111–117. [Google Scholar] [CrossRef]
- Zavorotny, V.U.; Gleason, S.; Cardellach, E.; Camps, A. Tutorial on remote sensing using GNSS bistatic radar of opportunity. IEEE Geosci. Remote Sens. Mag. 2014, 2, 8–45. [Google Scholar] [CrossRef]
- Zavorotny, V.U.; Voronovich, A.G. Scattering of GPS signals from the ocean with wind remote sensing application. IEEE Trans. Geosci. Remote Sens. 2000, 38, 951–964. [Google Scholar] [CrossRef]
- Valencia, E.; Camps, A.; Rodriguez-Alvarez, N.; Park, H. Using GNSS-R imaging of the ocean surface for oil slick detection. IEEE J. Sel. Top. Appl. Earth Obs. Remote Sens. 2013, 6, 217–223. [Google Scholar] [CrossRef]
- Dempster, A.G.; Rizos, C. Feasibility of air target detection using GPS as a bistatic radar. J. Glob. Position Syst. 2006, 5, 119–126. [Google Scholar]
- Katzberg, S.J.; Torres, O.; Grant, M.S.; Masters, D. Utilizing calibrated GPS reflected signals to estimate soil reflectivity and dielectric constant: Results from SMEX02. Remote Sens. Environ. 2006, 100, 17–28. [Google Scholar] [CrossRef]
- Zavorotny, V.; Masters, D.; Gasiewski, A.; Bartram, B. Seasonal polarimetric measurements of soil moisture using tower-based GPS bistatic radar. In Proceedings of the 2003 IEEE International Geoscience and Remote Sensing Symposium, Toulouse, France, 21–25 July 2003; pp. 781–783. [Google Scholar]
- Egido, A.; Caparrini, M.; Guerriero, L.; Pierdicca, N.; Paloscia, S.; Santi, E.; Brogioni, M. LEiMON Land Monitoring with Navigation Signals; Final Report; ESA Contract 22117/08/NL/AF; ESA/ESTEC: Noordwijk, The Netherlands, 2011. [Google Scholar]
- Pierdicca, N.; Guerriero, L.; Giusto, R.; Brogioni, M.; Egido, A. Savers: A simulator of GNSS reflections from bare and vegetated soils. IEEE Trans. Geosci. Remote Sens. 2014, 52, 6542–6554. [Google Scholar] [CrossRef]
- Rodriguez-Alvarez, N.; Camps, A.; Vall-Llossera, M.; Bosch-Lluis, X. Land geophysical parameters retrieval using the interference pattern GNSS-R technique. IEEE Trans. Geosci. Remote Sens. 2011, 49, 71–84. [Google Scholar] [CrossRef]
- Alonso-Arroyo, A.; Camps, A.; Aguasca, A.; Forte, G. Improving the accuracy of soil moisture retrievals using the phase difference of the dual-polarization GNSS-R interference patterns. IEEE Geosci. Remote Sens. Lett. 2014, 11, 2090–2094. [Google Scholar] [CrossRef]
- Larson, K.M.; Small, E.E.; Gutmann, E.D.; Bilich, A.L.; Braun, J.J.; Zavorotny, V.U. Use of GPS receivers as a soil moisture network for water cycle studies. Geophys. Res. Lett. 2008, 35, 851–854. [Google Scholar] [CrossRef]
- Chew, C.C.; Small, E.E.; Larson, K.M.; Zavorotny, V.U. Effects of near-surface soil moisture on GPS SNR data: Development of a retrieval algorithm for soil moisture. IEEE Trans. Geosci. Remote Sens. 2014, 52, 537–543. [Google Scholar] [CrossRef]
- Small, E.E.; Larson, K.M.; Braun, J.J. Sensing vegetation growth with reflected GPS signals. Geophys. Res. Lett. 2010, 37, 245–269. [Google Scholar] [CrossRef]
- Chew, C.C.; Small, E.E.; Larson, K.M.; Zavorotny, V.U. Vegetation sensing using GPS-interferometric reflectometry: Theoretical effects of canopy parameters on signal-to-noise ratio data. IEEE Trans. Geosci. Remote Sens. 2015, 53, 2755–2764. [Google Scholar] [CrossRef]
- Larson, K.M.; Gutmann, E.D.; Zavorotny, V.U.; Braun, J.J.; Williams, M.W.; Nievinski, F.G. Can we measure snow depth with GPS receivers? Geophys. Res. Lett. 2009, 36, 153–159. [Google Scholar] [CrossRef]
- Mccreight, J.L.; Small, E.E.; Larson, K.M. Snow depth, density, and SWE estimates derived from GPS reflection data: Validation in the Western U.S. Water Resour. Res. 2015, 50, 6892–6909. [Google Scholar] [CrossRef]
- Jin, S.; Najibi, N. Sensing snow height and surface temperature variations in Greenland from GPS reflected signals. Adv. Space Res. 2014, 53, 1623–1633. [Google Scholar] [CrossRef]
- Boniface, K.; Braun, J.J.; Mccreight, J.L.; Nievinski, F.G. Comparison of snow data assimilation system with gps reflectometry snow depth in the western United States. Hydrol. Process. 2015, 29, 2425–2437. [Google Scholar] [CrossRef]
- Jin, S.G.; Qian, X.D.; Kutoglu, H. Snow depth variations estimated from GPS-Reflectometry: A case study in Alaska from L2P SNR data. Remote Sens. 2016, 8, 63. [Google Scholar] [CrossRef]
- Larson, K.M.; Lofgren, J.S.; Haas, R. Coastal sea level measurements using a single geodetic GPS receiver. Adv. Space Res. 2012, 51, 1301–1310. [Google Scholar] [CrossRef]
- Löfgren, J.S.; Haas, R.; Johansson, J.M. Monitoring coastal sea level using reflected GNSS signals. Adv. Space Res. 2011, 47, 213–220. [Google Scholar] [CrossRef]
- Lofgren, J.S.; Haas, R.; Scherneck, H.G. Sea level time series and ocean tide analysis from multipath signals at five GPS sites in different parts of the world. J. Geodyn. 2014, 80, 66–80. [Google Scholar] [CrossRef]
- Wu, X.; Jin, S. Can we monitor the bare soil freeze-thaw process using GNSS-R? A simulation study. In Proceedings of the SPIE Asia-Pacific Remote Sensing, Beijing, China, 13–17 October 2014. [Google Scholar]
- Hallikainen, M.T.; Ulaby, F.T.; Dobson, M.C.; El-Rayes, M.A. Microwave dielectric behavior of wet soil-part I: Empirical models and experimental observations. IEEE Trans. Geosci. Remote Sens. 1985, 1, 25–34. [Google Scholar] [CrossRef]
- Dobson, M.C.; Ulaby, F.T.; Hallikainen, M.T.; El-Rayes, M.A. Microwave dielectric behavior of wet soil-part II: Dielectric mixing models. IEEE Trans. Geosci. Remote Sens. 1985, 1, 35–46. [Google Scholar] [CrossRef]
- Bracaglia, M.; Ferrazzoli, P.; Guerriero, L. A fully polarimetric multiple scattering model for crops. Remote Sens. Environ. 1995, 54, 170–179. [Google Scholar] [CrossRef]
- Chen, K.S.; Wu, T.D.; Tsang, L.; Li, Q.; Shi, J.; Fung, A.K. Emission of rough surfaces calculated by the integral equation method with comparison to three-dimensional moment method simulations. IEEE Trans. Geosci. Remote Sens. 2003, 41, 90–101. [Google Scholar] [CrossRef]
- Peplinski, N.R.; Ulaby, F.T.; Dobson, M.C. Dielectric properties of soils in the 0.3–1.3-GHz range. IEEE Trans. Geosci. Remote Sens. 1995, 33, 803–807. [Google Scholar] [CrossRef]
- Zhang, L.; Shi, J.; Zhang, Z.; Zhao, K. The estimation of dielectric constant of frozen soil-water mixture at microwave bands. In Proceedings of the 2003 IEEE International Geoscience and Remote Sensing Symposium, Toulouse, France, 21–25 July 2003; pp. 2903–2905. [Google Scholar]
- Nievinski, F.G.; Larson, K.M. An open source GPS multipath simulator in Matlab/Octave. GPS Solut. 2014, 18, 1–9. [Google Scholar] [CrossRef]
- Nievinski, F.G.; Larson, K.M. Forward modeling of GPS multipath for near-surface reflectometry and positioning applications. GPS Solut. 2014, 18, 309–322. [Google Scholar] [CrossRef]
- Tabibi, S.; Nievinski, F.G.; Dam, T.V.; Monico, J.F.G. Assessment of modernized GPS L5 SNR for ground-based multipath reflectometry applications. Adv. Space Res. 2015, 55, 1104–1116. [Google Scholar] [CrossRef]
- Plate Boundary Observatory. Available online: http://pbo.unavco.org (accessed on 9 October 2017).
- Serreze, M.C.; Clark, M.P.; Armstrong, R.L.; McGinnis, D.A.; Pulwarty, R.S. Characteristics of the Western United States snowpack from snowpack telemetry (SNOTEL) data. Water Resour. Res. 1999, 35, 2145–2160. [Google Scholar] [CrossRef]
Figure 1.
Real part (Left); and imaginary part (Right) of the permittivities versus soil temperature. Soil temperature changes from below 0 °C to above 0 °C.
Figure 1.
Real part (Left); and imaginary part (Right) of the permittivities versus soil temperature. Soil temperature changes from below 0 °C to above 0 °C.
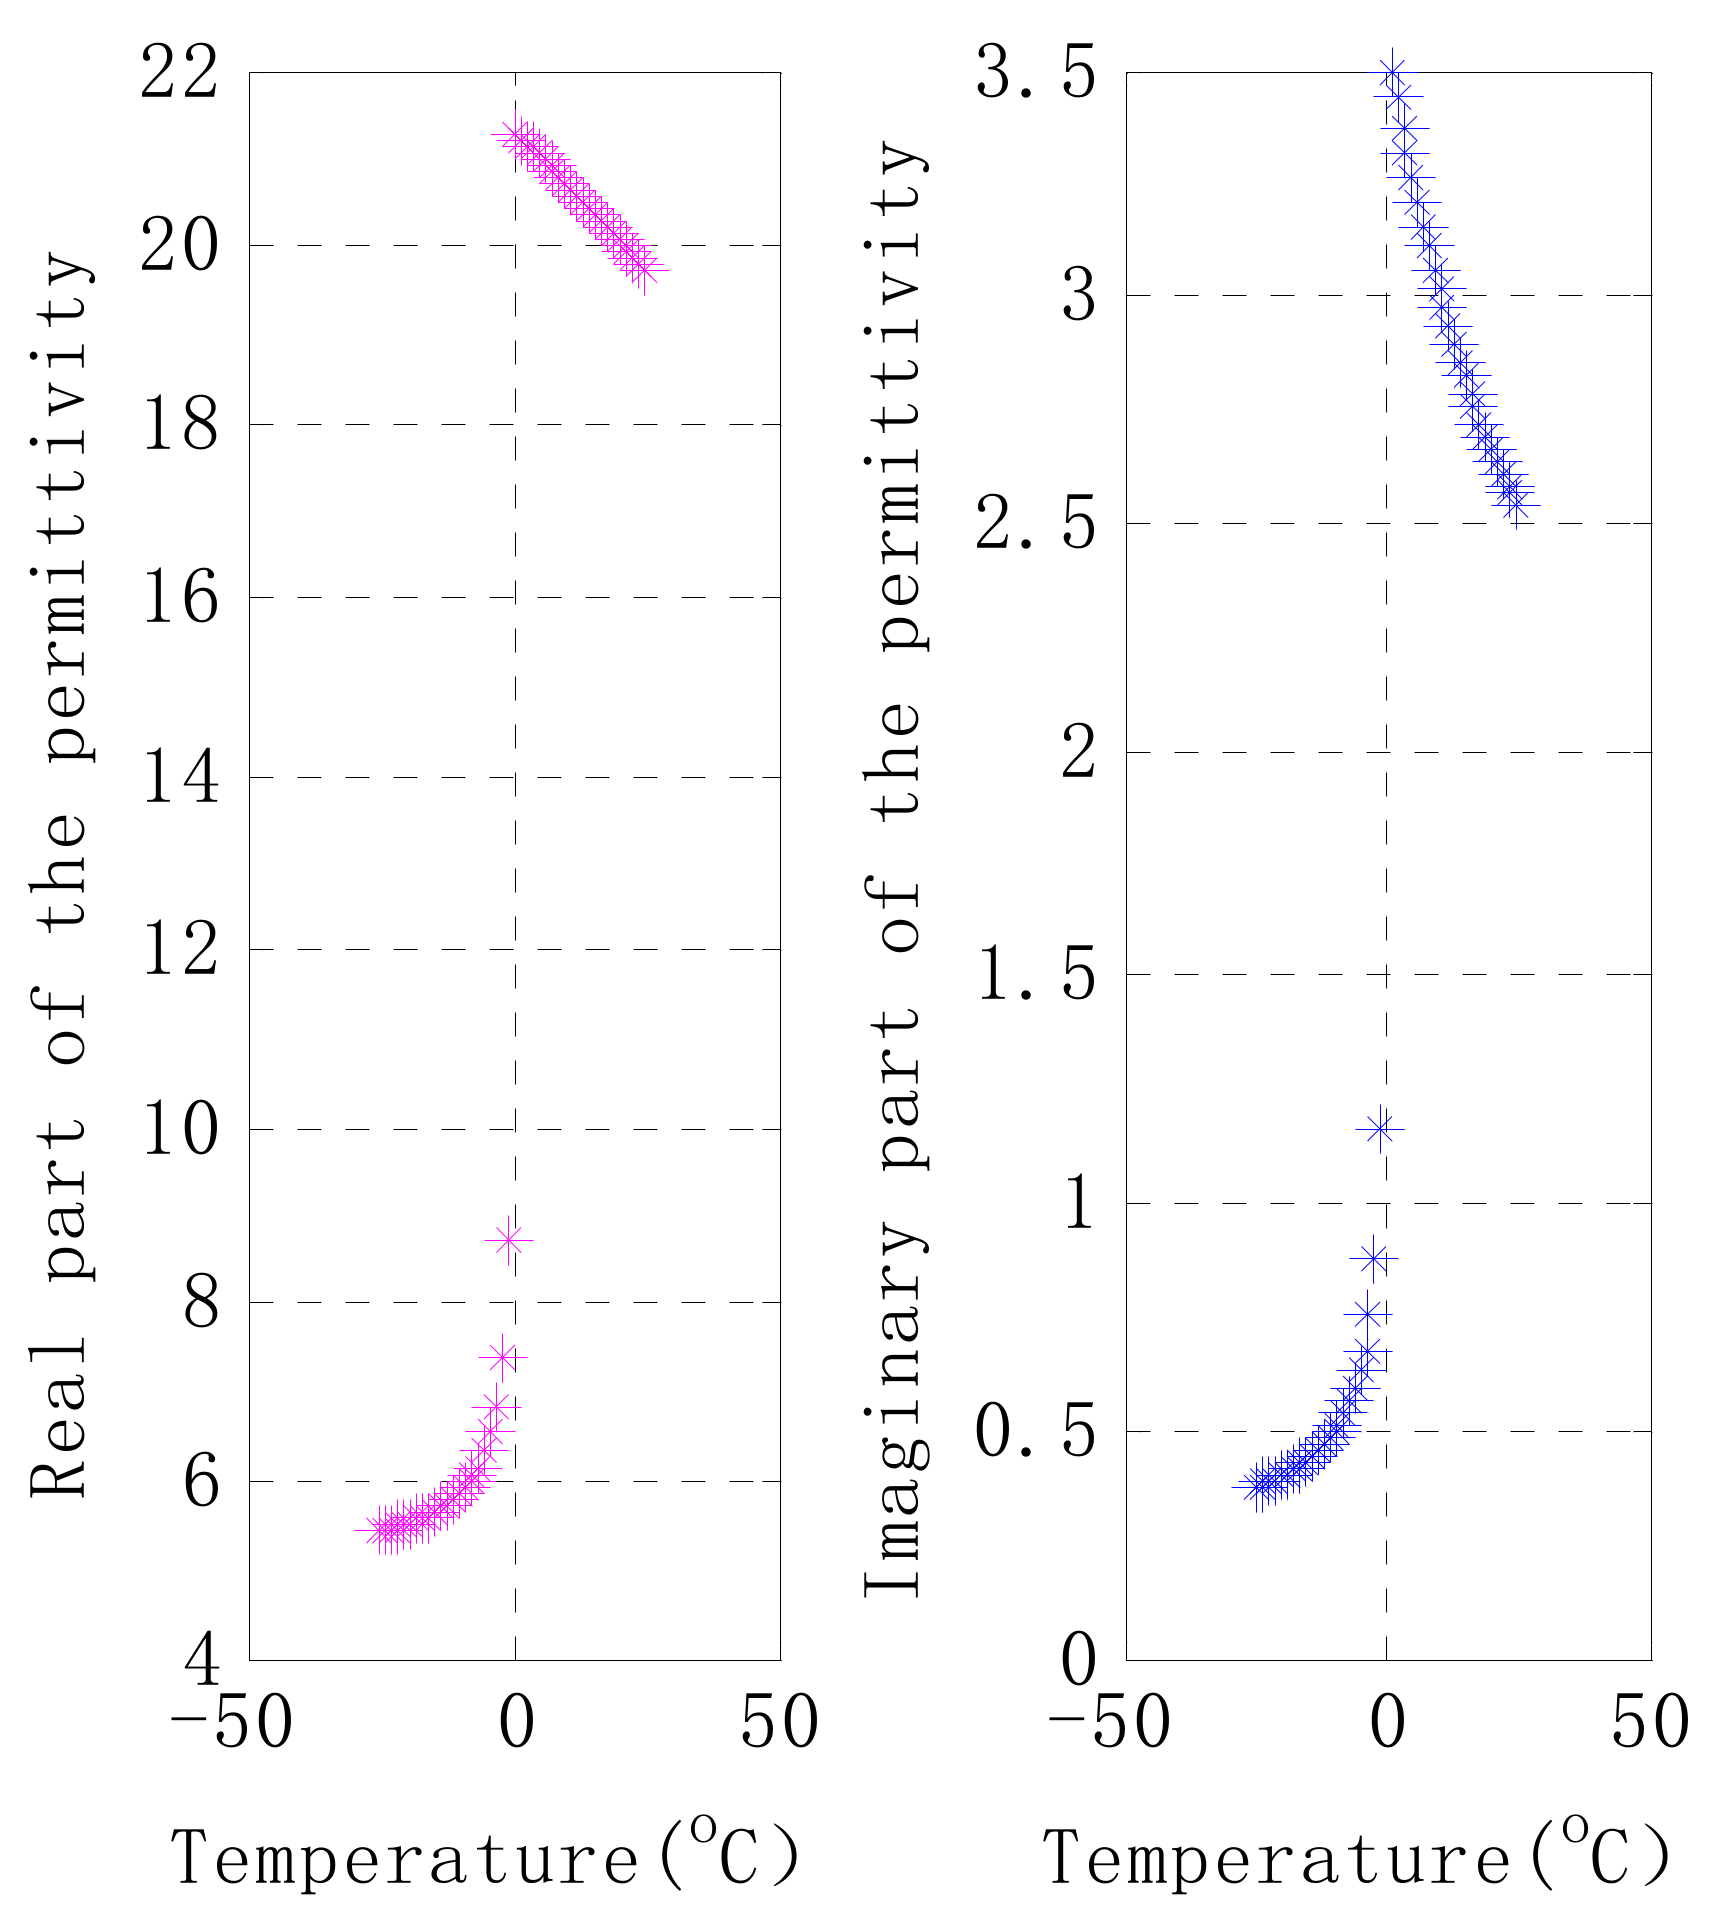
Figure 2.
Soil temperature effects on GPS multipath observations (GPS SNR, carrier phase, and code pseudorange). Lomb–Scargle spectrogram analysis is presented in the right panel. Soil temperature with −0.5 °C is shown in blue, 0.5 °C in pink.
Figure 2.
Soil temperature effects on GPS multipath observations (GPS SNR, carrier phase, and code pseudorange). Lomb–Scargle spectrogram analysis is presented in the right panel. Soil temperature with −0.5 °C is shown in blue, 0.5 °C in pink.
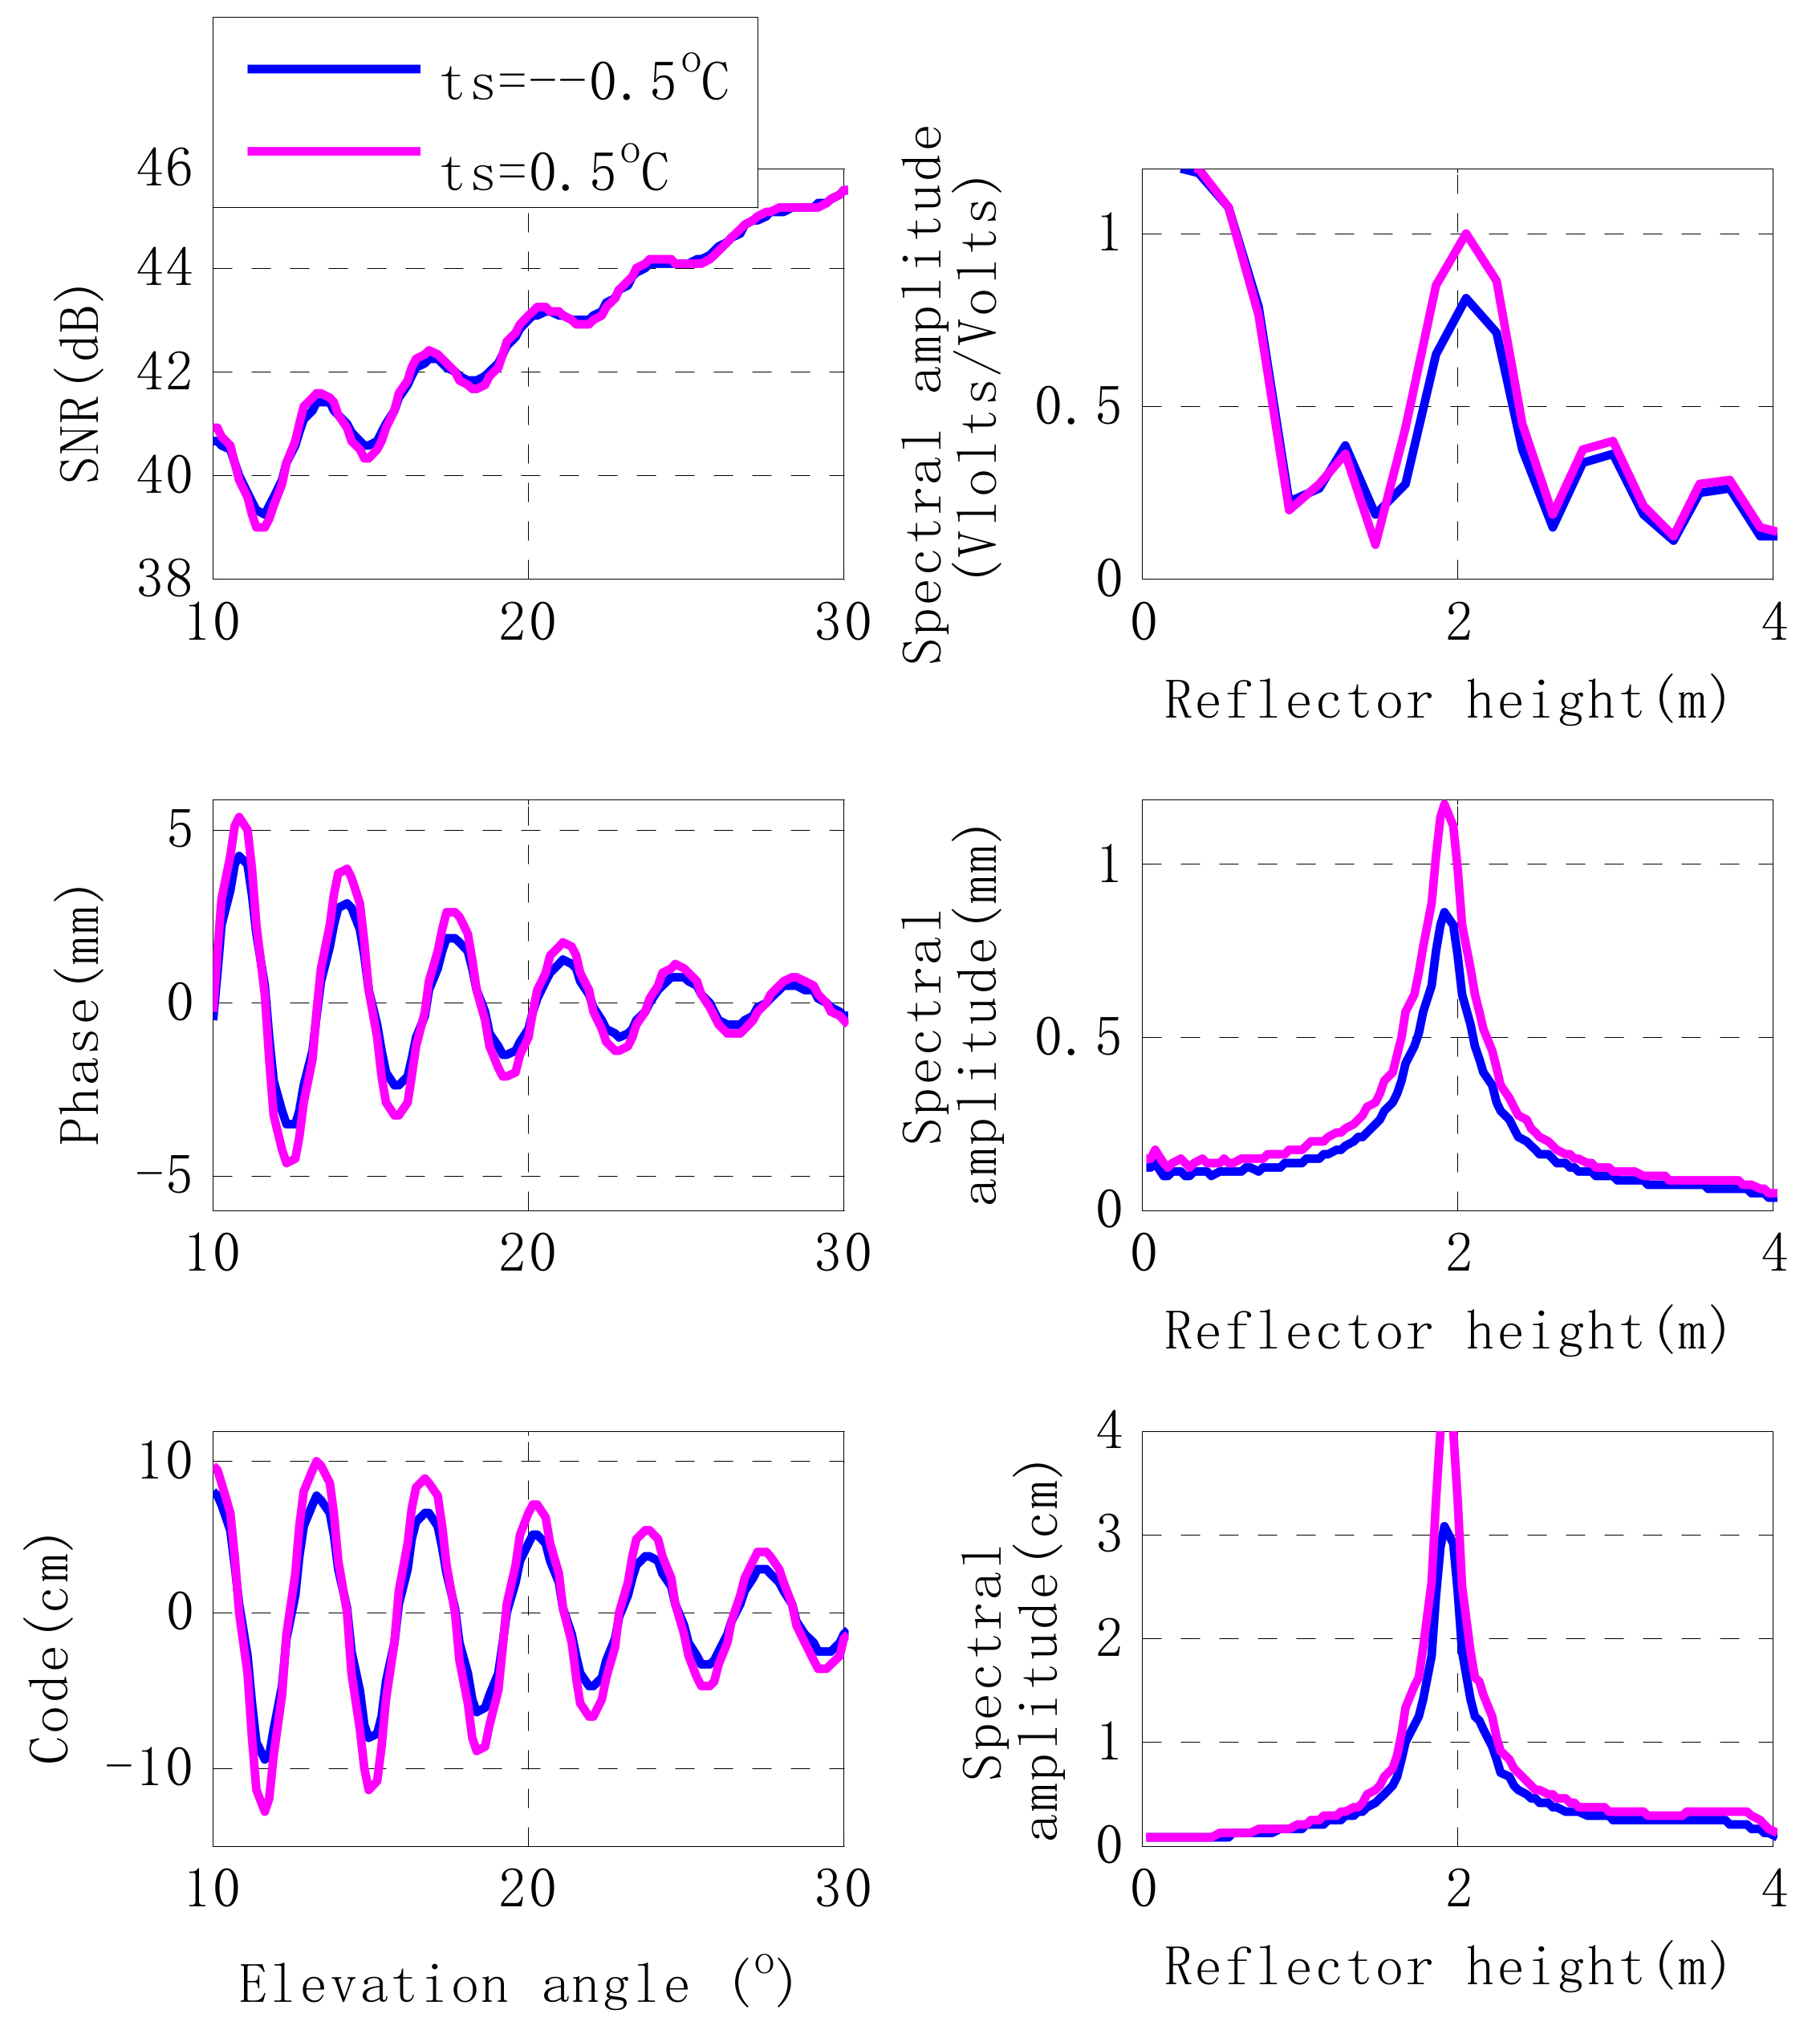
Figure 3.
Multi-frequencies effects on GPS multipath signatures in GPS SNR, carrier phase and code pseudorange observables. The L1 band is shown in pink, L2 in green and L5 in blue.
Figure 3.
Multi-frequencies effects on GPS multipath signatures in GPS SNR, carrier phase and code pseudorange observables. The L1 band is shown in pink, L2 in green and L5 in blue.
Figure 4.
Illustration of virtual bistatic radar by the receiver and virtual transmitter. At any time, one or more GPS satellites (X PRN: X presents the temporal PRN number) will fall into the position of virtual transmitter with the incident azimuth and zenith angles and , respectively.
Figure 4.
Illustration of virtual bistatic radar by the receiver and virtual transmitter. At any time, one or more GPS satellites (X PRN: X presents the temporal PRN number) will fall into the position of virtual transmitter with the incident azimuth and zenith angles and , respectively.

Figure 5.
Observed geophysical parameters of SNOTEL site 958. Tick mark refers to 1 January of the year. The first and second panels are the time series (2009–2015) of observed snow depth and soil moisture at 5 cm depth, respectively. The bottom panel is the time series of soil temperature at 5 cm depth. The periods analyzed later are presented in the red boxes. The freezing point is highlighted with a blue thicker horizontal line.

Figure 6.
Site photo from AB33, located in Coldfoot, AK.

Figure 7.
Observed GPS SNR data on DOY 318 (2011) (soil temperature is above 0 °C) and DOY 322 (2011) (soil temperature is below 0 °C). Satellite PRN = 6.
Figure 7.
Observed GPS SNR data on DOY 318 (2011) (soil temperature is above 0 °C) and DOY 322 (2011) (soil temperature is below 0 °C). Satellite PRN = 6.
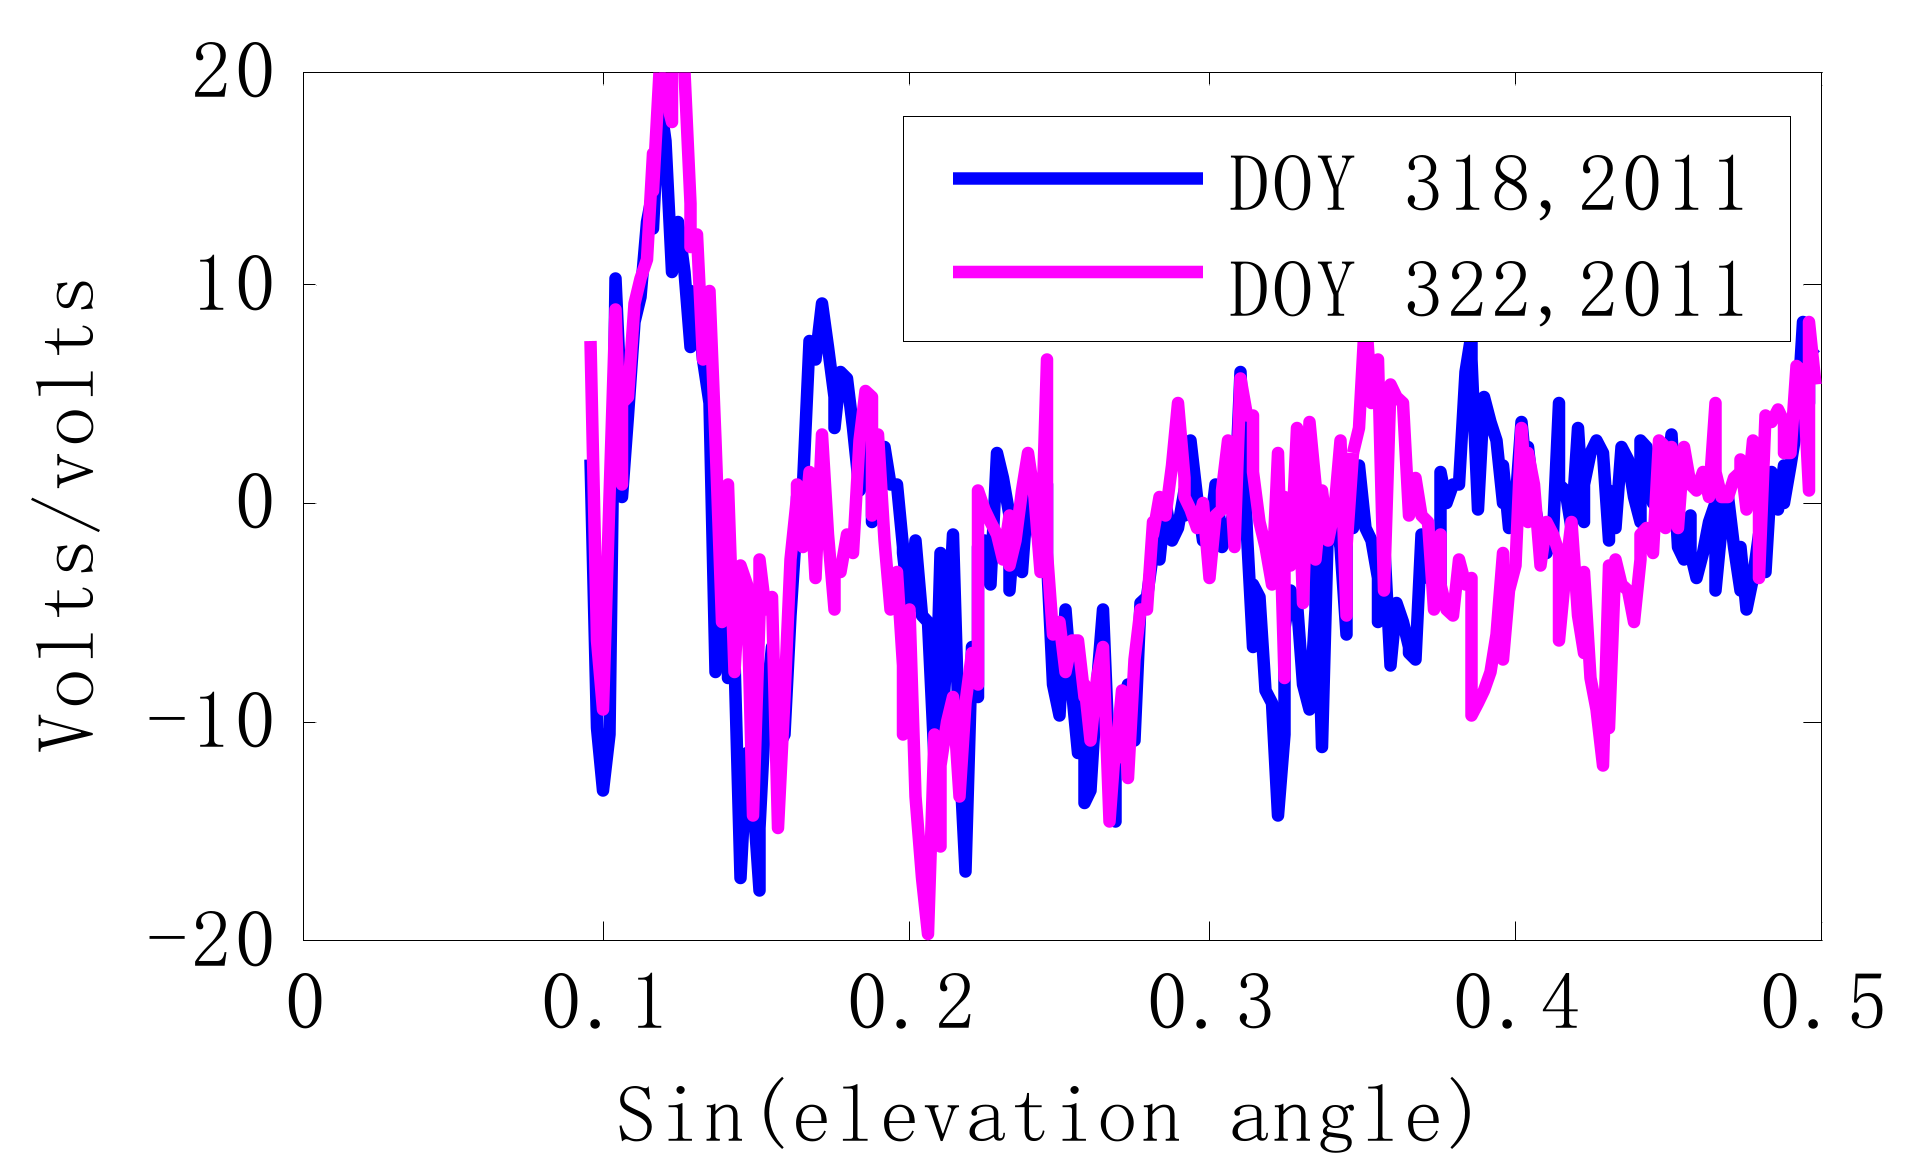
Figure 8.
Comparisons between GPS site (AB33) and SNOTEL site (ID 958) from DOY 270 (2009) to DOY 295 (2009). The elevation angle is 20°. The upper panel presents the comparisons of soil moisture (blue O) and snow depths (red *). Comparisons of soil temperature (black △) and ADSNR (pink +) are presented in the bottom panel.

Figure 9.
Comparisons between GPS site (AB33) and SNOTEL site (ID 958) from DOY 270 (2012) to DOY 305 (2012). The elevation angle is 20°. The upper panel presents the comparisons of soil moisture (blue O) and snow depths (red *). Comparisons of soil temperature (black △) and ADSNR (pink +) are presented in the bottom panel.

Figure 10.
Comparisons between GPS site (AB33) and SNOTEL site (ID 958) from DOY 142 (2013) to DOY 162 (2013). The elevation angle is 20°. The upper panel presents the comparisons of soil moisture (blue O) and snow depths (red *). Comparisons of soil temperature (black △) and ADSNR (pink +) are presented in the bottom panel.
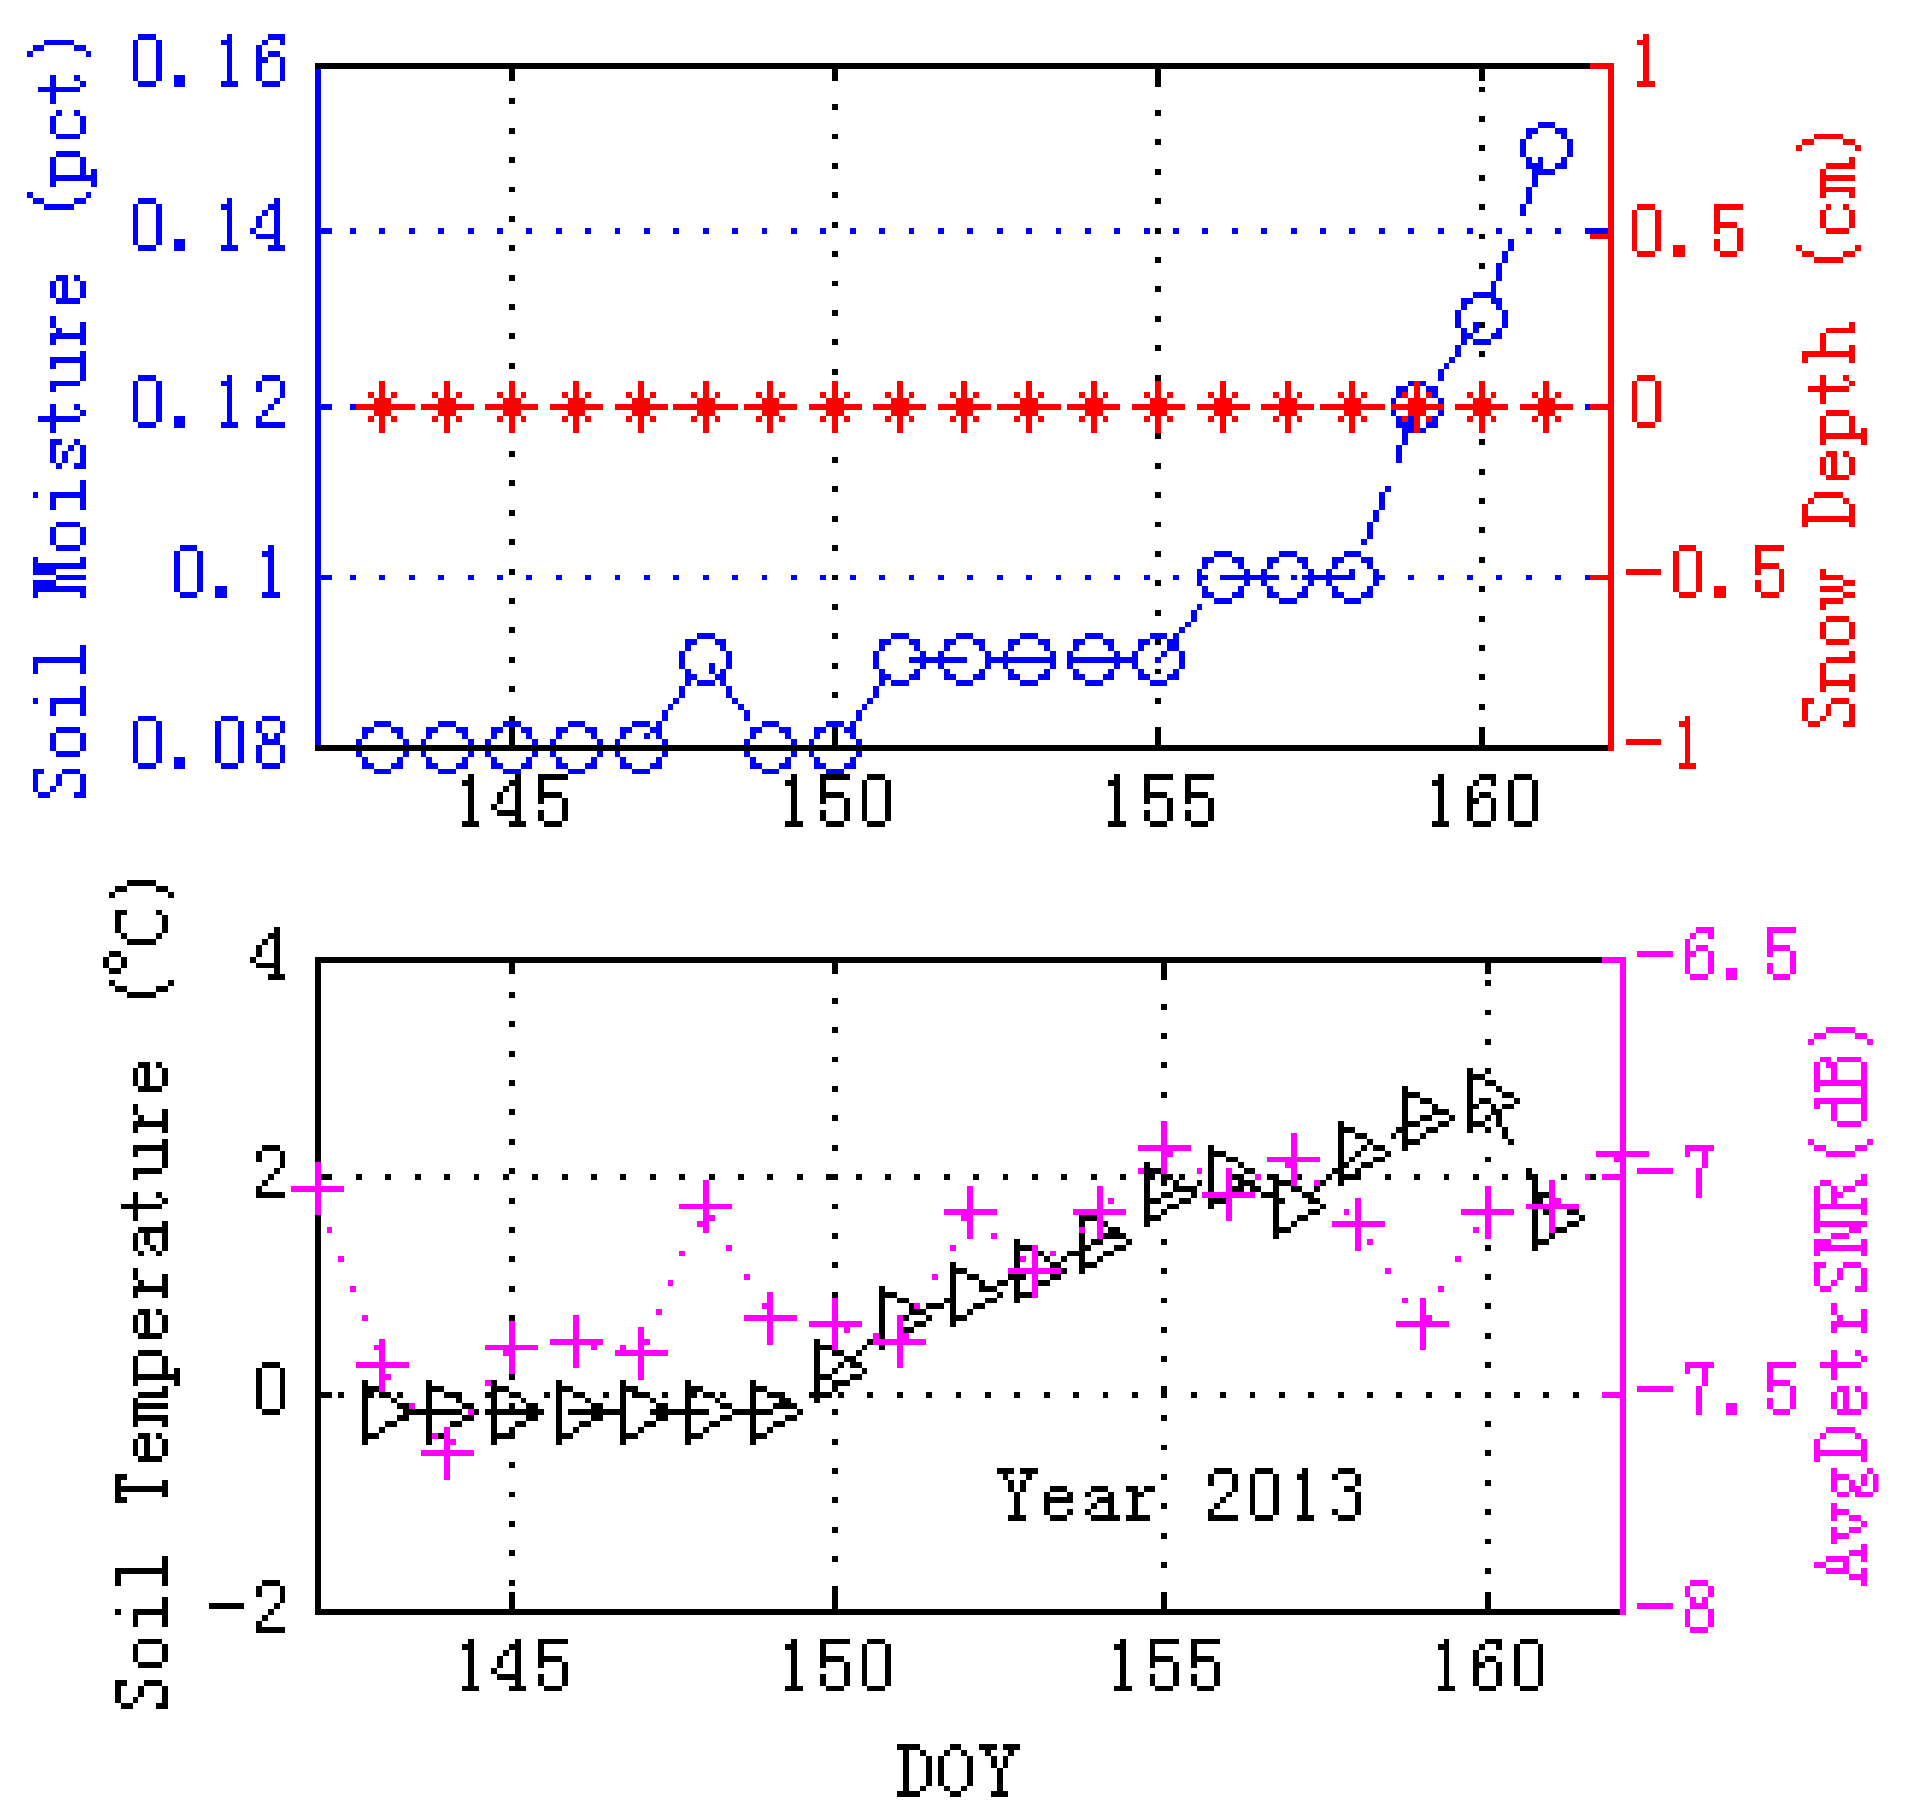
Figure 11.
Comparison between GPS site (AB33) and SNOTEL site (ID 958) from DOY 295 (2014) to DOY 325 (2014). The elevation angle is 20°. The upper panel presents the comparisons of soil moisture (blue O) and snow depths (red *). Comparisons of soil temperature (black △) and ADSNR (pink +) are presented in the bottom panel.

Table 1.
Permittivities (both real part and imaginary part) for GPS L1, L2 and L5 bands. The soil temperature is changed from −1 °C to 1 °C.
Table 1.
Permittivities (both real part and imaginary part) for GPS L1, L2 and L5 bands. The soil temperature is changed from −1 °C to 1 °C.
| Ts (°C) | L1 Carrier Frequency | L2 Carrier Frequency | L5 Carrier Frequency | |||
|---|---|---|---|---|---|---|
| Real Part | Imaginary Part | Real Part | Imaginary Part | Real Part | Imaginary Part | |
| −1 | 8.67 | 1.03 | 8.71 | 1.17 | 8.71 | 1.20 |
| +1 | 21.11 | 3.54 | 21.28 | 3.50 | 21.30 | 3.51 |
Table 2.
Soil information for SNOTEL site 958. SM is the soil moisture percent, and its sensor height is −5 cm; SD is the snow depth (cm); and ST is soil temperature observed at 5 cm depth (°C).
Table 2.
Soil information for SNOTEL site 958. SM is the soil moisture percent, and its sensor height is −5 cm; SD is the snow depth (cm); and ST is soil temperature observed at 5 cm depth (°C).
| Date | SM (pct) | SD (cm) | ST (°C) |
|---|---|---|---|
| 2011, DOY 318 | 15.2 | 20 | 0.2 |
| 2011, DOY 319 | 15 | 20 | 0.1 |
| 2011, DOY 320 | 15 | 20 | 0 |
| 2011, DOY 321 | 15 | 20 | −0.1 |
| 2011, DOY 322 | 14.1 | 20 | −0.1 |
| 2011, DOY 323 | 13.5 | 20 | −0.2 |
© 2017 by the authors. Licensee MDPI, Basel, Switzerland. This article is an open access article distributed under the terms and conditions of the Creative Commons Attribution (CC BY) license (http://creativecommons.org/licenses/by/4.0/).
Share and Cite
MDPI and ACS Style
Wu, X.; Jin, S.; Chang, L. Monitoring Bare Soil Freeze–Thaw Process Using GPS-Interferometric Reflectometry: Simulation and Validation. Remote Sens. 2018, 10, 14. https://doi.org/10.3390/rs10010014
AMA Style
Wu X, Jin S, Chang L. Monitoring Bare Soil Freeze–Thaw Process Using GPS-Interferometric Reflectometry: Simulation and Validation. Remote Sensing. 2018; 10(1):14. https://doi.org/10.3390/rs10010014
Chicago/Turabian StyleWu, Xuerui, Shuanggen Jin, and Liang Chang. 2018. "Monitoring Bare Soil Freeze–Thaw Process Using GPS-Interferometric Reflectometry: Simulation and Validation" Remote Sensing 10, no. 1: 14. https://doi.org/10.3390/rs10010014
Note that from the first issue of 2016, this journal uses article numbers instead of page numbers. See further details here.