Comprehensive Evaluation of Two Successive V3 and V4 IMERG Final Run Precipitation Products over Mainland China
by
 and
and
Haigen Zhao
1,2,*, 
Shengtian Yang
3,
Songcai You
1,*,
Yingchun Huang
4,
Qianfeng Wang
5 and
Qiuwen Zhou
6 1
Institute of Environment and Sustainable Development in Agriculture, Chinese Academy of Agricultural Sciences, Beijing 100081, China
2
Beijing Water Science and Technology Institute, Beijing 100048, China
3
College of Water Sciences, Beijing Normal University, Beijing 100875, China
4
Beijing Institute of Surveying and Mapping, Beijing 100038, China
5
College of Environment and Resource, Fuzhou University, Fuzhou 350116, China
6
School of Geography and Environment Science, Guizhou Normal University, Guiyang 550001, China
*
Authors to whom correspondence should be addressed.
Remote Sens. 2018, 10(1), 34; https://doi.org/10.3390/rs10010034
Submission received: 13 November 2017
/
Revised: 19 December 2017
/
Accepted: 20 December 2017
/
Published: 25 December 2017
(This article belongs to the Section Atmospheric Remote Sensing)
Abstract
:The Integrated Multi-satellitE Retrievals for Global Precipitation Measurement Final Run (IMERGF) product has now been upgraded to Version 4 (V4), which has been available since March 2017. Therefore, it is desirable to evaluate the characteristic differences between the V4 and the previous V3 products. A comprehensive performance evaluation of the errors of the successive V3 and V4 IMERGF products is performed with a comparison of the China daily Precipitation Analysis Products (CPAP) from March 2014 to February 2015. The version 6 Global Satellite Mapping of Precipitation (GSMaP) research product (which is another Global Precipitation Measurement (GPM) based precipitation product) is also used as a comparison in this study. Overall, the IMERGF-V4 product does not exhibit the anticipated improvement for China compared to the IMERGF-V3 product. An analysis of the metrics of annual daily average precipitation over China for the IMERGF-V3 and IMERGF-V4 products indicates a decrease of the relative bias (RB) from 3.70% to −7.18%, a decrease of the correlation coefficient (CC) from 0.91 to 0.89, an increase of the fractional standard error (FSE) from 0.49 to 0.56, and an increase of the root-mean-square error (RMSE) from 0.63 mm to 0.72 mm. Compared to the IMERGF-V3 product, the IMERGF-V4 product exhibits a significant underestimation of precipitation in the Qinghai-Tibetan plateau with a much lower RB of −60.91% (−58.19%, −65.30%, and −63.74%) based on the annual (summer, autumn, and winter) daily average precipitation and an even worse performance during winter (−72.33% of RB). In comparison, the GSMaP product outperforms the IMERGF-V3 and IMERGF-V4 products and has the smallest RMSE (0.47 mm/day), highest CC (0.95), lowest FSE (0.37), and best performance of the RB (−2.39%) in terms of annual daily precipitation over China. However, the GSMaP product underestimates the precipitation more than the IMERGF-V3 product for the arid XJ region.

1. Introduction
Satellite-based precipitation products with broad spatial coverage and continuous global observations have achieved enormous success in various applications [1,2,3,4,5,6,7,8]. Quantitative and systematical precipitation estimations from satellite-based precipitation products have been used in hydrology, climatology, and water-resources management [9,10,11,12,13]. However, it remains a worthy challenge to produce accurate satellite-based precipitation estimations due to the great temporal and spatial variability of the products, acquisitions at different scales, inhomogeneous distributions of rain gauges, complex topography, and cold weather [14,15,16,17,18,19,20,21,22,23].
Since the Global Precipitation Measurement (GPM) Core Observatory satellites were launched in 2014, satellite precipitation observations have entered the GPM era [24]. The GPM mission draws on the success of the Tropical Rainfall Measuring Mission (TRMM) and provides next-generation global rainfall observation products based on the constellation of research satellites [6]. A ‘Core’ satellite in the GPM mission is used to measure the rainfall rate from space and the obtained data serves as a reference to consolidate rainfall measurements from an international network of satellites. The measurement instruments include a multi-channel GPM Microwave Imager (GMI) and the first space-borne Ku/Ka-band Dual-frequency Precipitation Radar (DPR) both of which are carried on the ‘Core’ satellite [25]. The GMI scans a swath of 885 km and has 13 microwave radiometer channels covering a frequency range of 10–183 GHz; the DPR includes Ku-band and Ka-band precipitation radars with 13.6 GHz and 35.5 GHz frequencies, respectively [26]. The instruments measure the three-dimensional structure of precipitation in 25-km and 245-km swaths, respectively, for both radar instruments.
The Integrated Multi-satellitE Retrievals for Global Precipitation Measurements (GPM) (IMERG) algorithm was released in early 2015 [27,28] and the IMERG version 3 (V3) precipitation products have been provided by NASA since March 2014. The algorithm was derived by integrating the existing TMPA (TRMM multi-satellite precipitation analysis [29]), CMORPH-KF (climate prediction center morphing–Kalman filter [30]) and PERSIANN-CCS (precipitation estimation from remotely sensed information using artificial neural networks–cloud classification system [31]) algorithms. The IMERG products include Early, Late, and Final Run model precipitation products based on accuracy and latency. All three products have spatial resolutions of 0.1-degree and 0.5-h temporal resolutions. The IMERG Early and Late Run datasets are near real-time. The Early Run uses only forward propagation of the microwave data while the Late Run uses forward and backward propagation of the microwave data. Unlike the Early and Late Runs, the Final Run data is a post real-time research product. In addition to the processing and calibration in the Early and Late Runs, the Final Run data uses monthly observed gauge data.
Recently, the algorithm for the gauge-adjusted IMERG research product has been upgraded from version 3 (V3) to version 4 (V4), and the corresponding V4 IMERG product was released in March 2017. For IMERG product validation on land, comparisons to the fine-scale NOAA Multi-Radar Multi-Sensor (MRMS) analyses and to the Precipitation Measurement Missions (PMM) Kwajalein radar archives are considered key, at the snapshot level; the performance at larger space-time scales is being assessed via accumulations of these three datasets, as well as CPC daily gauge analysis, the International Precipitation Working Group (IPWG) validation sites (Australia, CONUS, Japan, South America, and Western Europe), and the GPCC global monthly gauge analysis; for higher-latitude validation, the GPCC data can be used to validate satellite-only products [32]. According to a report in previous study [33], the accuracy of the V4 IMERG supersedes the accuracies of all prior IMERG versions. The V4 IMERG data prior to March 2014 will also be processed retrospectively in late 2017. To date, researchers have identified both the uncertainty and error characteristics of the V3 IMERG datasets [34,35,36,37,38,39,40,41]. At present, a quantitative evaluation of the similarities and differences between the successive V3 and V4 products and of the global improvements of V4 over V3 are urgently required. This comprehensive assessment will contribute to the improvement of the IMERG algorithm as well as to hydrological and climatic studies. Few studies have quantitatively evaluated and identified temporal and spatial errors over Mainland China for the new IMERG V4 products since the algorithm was updated from the V3 product.
In addition to the V3 IMERG and V4 IMERG products, the version 6 Global Satellite Mapping of Precipitation (GSMaP) research product is also used for comparison in this study. The GSMaP has been distributed by the Japan Aerospace Exploration Agency (JAXA) since late 2014 and uses a newly developed algorithm for the GPM mission to retrieve rain rates [42]. The major characteristic of the version 6 GSMaP algorithm is the use of various attributes derived from all available passive microwave radiometers except for the Dual-frequency Precipitation Radar (DPR).
Mainland China has a complex topography and precipitation regime. Flat plains dominate the geographic features of eastern and northern China; hilly regions dominate the south-east of China, deserts characterize the north-west, and high-altitude mountain areas are distributed in the south-western Chinese plateaus. The precipitation regime of China is mainly influenced by the Asian monsoon, which causes a spatially uneven distributed precipitation; the precipitation events are mainly short-term and intense rainstorms are common. The large spatial variability of the topography and precipitation distribution renders mainland China a good testing ground to validate satellite-based precipitation products.
The objective of this study is to evaluate and compare the successive V3 IMERG Final Run product (hereafter referred to as IMERGF-V3) and the V4 IMERG Final Run product (hereafter referred to as IMERGF-V4) using the China daily Precipitation Analysis Products (CPAP) and to illustrate the error characteristics associated with both products over mainland China. Additionally, the validation results of the gauge-adjusted version 6 GSMaP product (hereafter referred to as GSMaP) over China are also used in comparison to the IMERGF-V3 and IMERGF-V4 products. The results serve as a reference for applications of GPM-based satellite data in high-altitude and mountainous regions of Asia and help to improve the spaceborne retrieval algorithms used by GPM algorithm developers.
2. Study Area and Data Products
2.1. Study Area
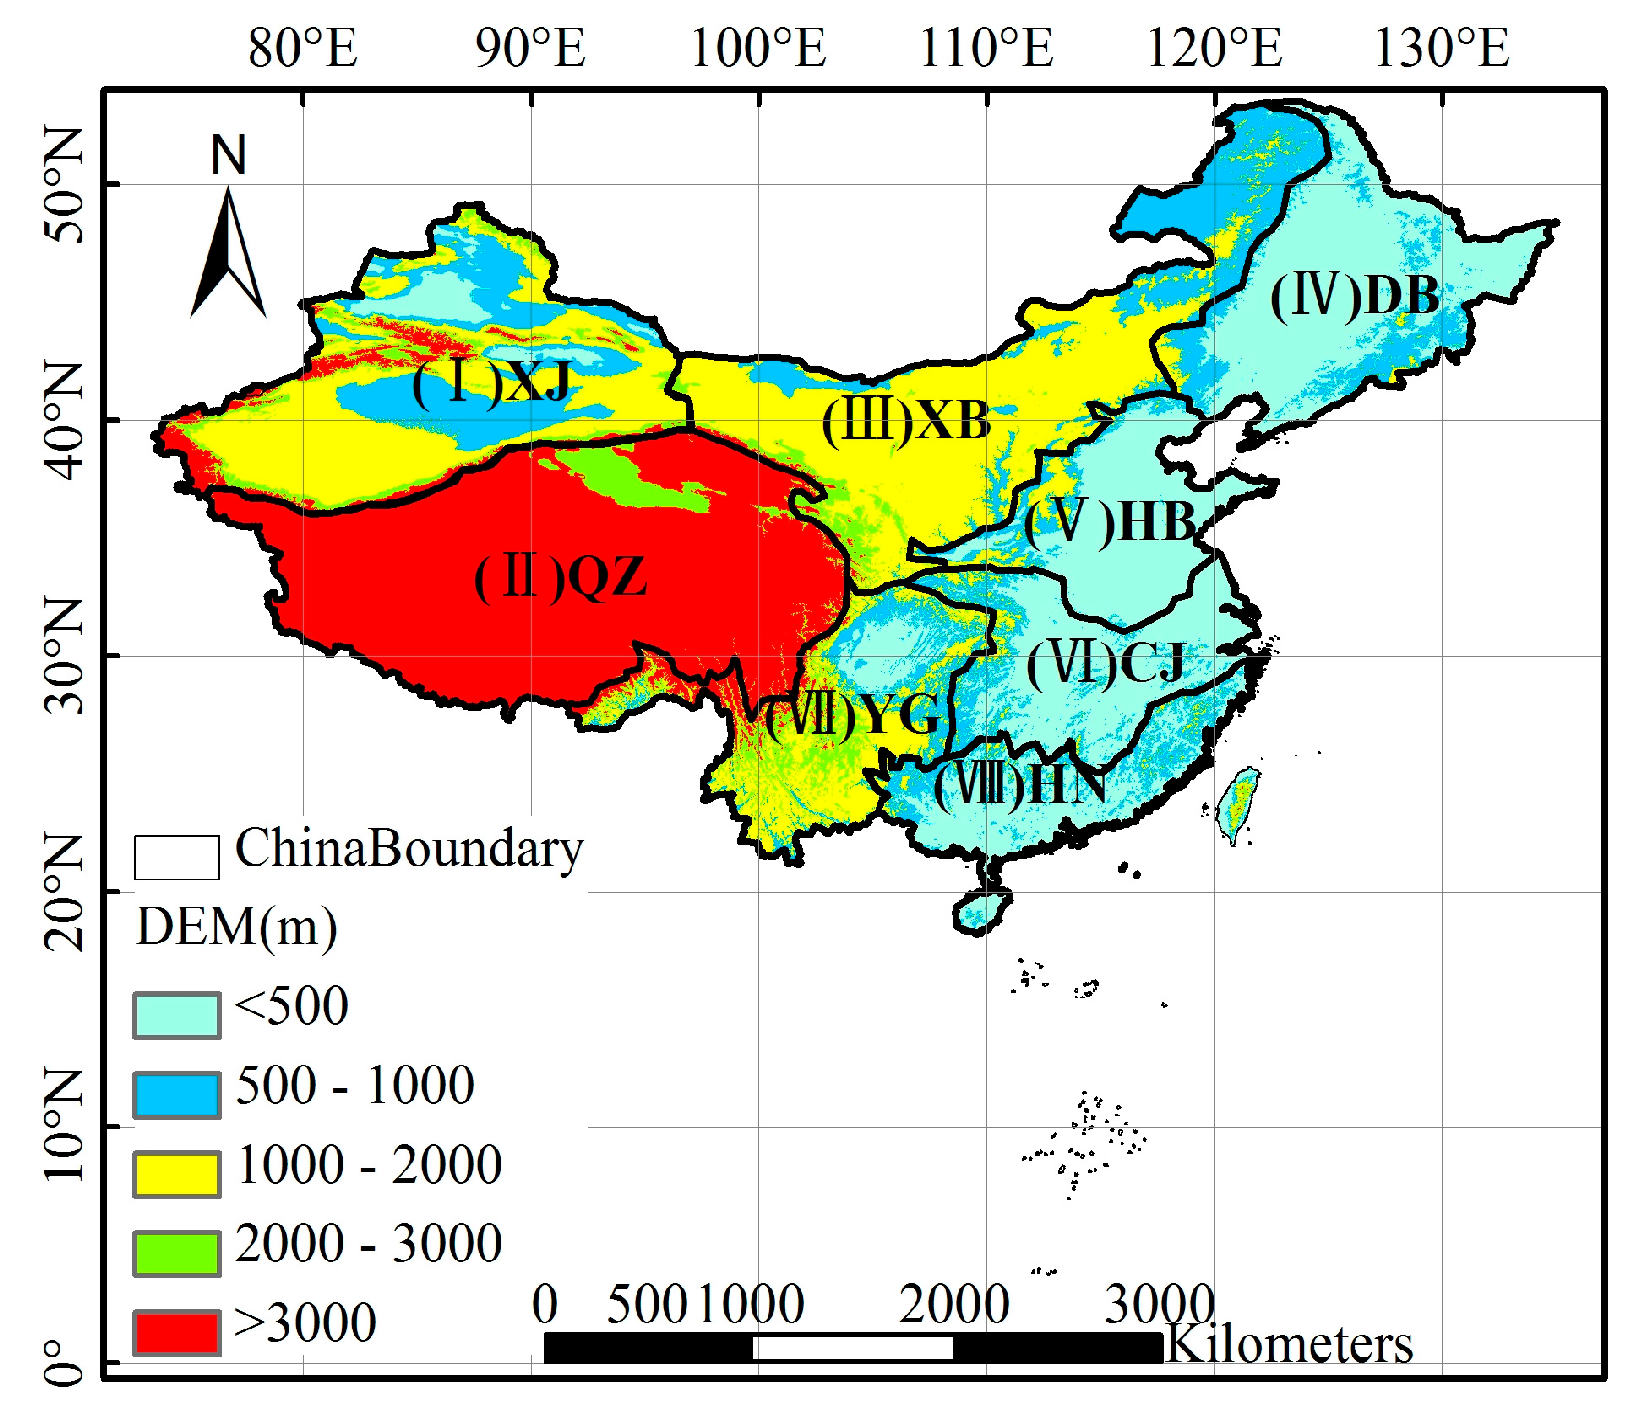
China has a vast territory and a complex terrain with considerable variation. Flat plains (e.g., the North-east Plain, the North China Plain, and the Yangtze Plain) are distributed in the south and east of China along the coastline. Deserts (e.g., the Taklimakan Desert, the Tengger Desert, and the Qaidam Desert) are dominant in the north-west of China and high-altitude plateaus (e.g., the Qinghai-Tibet and the Yun-Gui plateaus), and mountain ranges (e.g., the Qilian mountains and the Himalaya mountains) exist in the south-west of China. Chen [43] proposed eight sub-regions in mainland China (Figure 1). These include inland Xinjiang (XJ), the high-altitude Qinghai-Tibetan plateau (QZ), North-western China (XB), North-eastern China (DB), Northern China (HB), the Changjiang (CJ) River Plain, the South-western Yungui Plateau (YG), and South-eastern China (HN). The extents and abbreviations of these eight sub-regions are shown in Figure 1 and the abbreviations are used hereafter.
The precipitation distribution of the south and east of China is influenced by the Asian monsoon. Considerable humid air originating from the Pacific Ocean is transported by the monsoon to produce heavy rainfall, called Mei-Yu, from June to July in southern and eastern China [44,45]. The precipitation distribution regime over south-west China is mainly influenced by the monsoon between the QZ region and the Indian Ocean. The XJ region has a semi-arid climate and the moisture provided by mid-latitude westerlies generated from the North Atlantic Ocean significantly impacts the precipitation distribution [46]. In general, the number of precipitation events increases gradually from the north-west to the south-east of China due to the complex terrain.
2.2. Gauge-Observed Data
Since hourly precipitation data from rain gauges are not publicly released in China, the CPAP with a spatial resolution of 0.25° × 0.25° is used as ground reference data in this study. This dataset is developed by the National Meteorological Information Center and the China Meteorological Administration and can be downloaded from http://data.cma.cn/data/cdcdetail/dataCode/SEVP_CLI_CHN_PRE_DAY_GRID_0.25.html. This dataset is aggregated from 00 h UTC to 24 h UTC, which is temporally consistent with the daily satellite-based products. For the CPAP, 2419 daily rain gauge-station observations are interpolated to produce a gridded product using an optimal interpolation (OI) technique, in which the orographic errors are calibrated via the Parameter-Elevation Regression on Independent Slopes Model (PRISM [47]). Compared to other interpolation algorithms, the OI technique results in a higher correlation with the ground-based rain gauge observations [47]. Additionally, a previous study has indicated that the relative bias (RB) of the CPAP is about 3% when compared to individual gauge measurements at a 0.5° scale, which can be used to validate the satellite precipitation accuracy at 0.25° [35,43].
2.3. Satellite-Based Precipitation Products
2.3.1. IMERG Products
To compare the satellite products with the CPAP at a daily scale, we aggregated the IMERGF 30-min products into daily datasets for the range of 00 h UTC to 24 h UTC. To prevent errors due to missing CPAP data, the IMERGF products from March 2014 to February 2015 are used to validate the accuracy of this study.
The IMERG algorithm is a unified U.S.-developed algorithm that provides the Day-1 multi-satellite precipitation product for the U.S. GPM team [27]. It blends various precipitation-relevant satellite passive microwave (PMW) and infrared (IR) sensors to produce quasi-global quantitative precipitation datasets with high spatiotemporal resolution. The PMW sensors include the DPR, Special Sensor Microwave Imager/Sounder (SSMIS), GMI, TRMM Microwave Imager (TMI), Microwave Humidity Sounder (MHS), and the Advanced Technology Microwave Sounder (ATMS) (only in V04). The IR sensors include all available geosynchronous-based infrared imagers (GOES, METEOSAT, GMS, MTSat, and Himawari series). The precipitation estimates from the PMW are computed via the GPM Goddard Profiling Algorithm (GPROF), which are gridded, intercalibrated to the GPM combined instrument product, and combined into half-hourly 0.1° × 0.1° fields. In parallel, the Climate Prediction Center (CPC) assembles the zenith-angle-corrected, intercalibrated “even-odd” geo-IR fields and forwards them to the Precipitation Processing System (PPS) for use in the CMORPH-KF Lagrangian time-interpolation scheme as well as the PERSIANN-CCS computation routines. The PERSIANN-CCS estimates are computed and sent to the CMORPH-KF Lagrangian time-interpolation scheme that uses the PMW and IR estimates to create half-hourly estimates. The IMERG system is run twice in near real-time to yield Early and Late Run multi-satellite products. However, the Final Run product can only be provided once after the monthly gauge analysis (which is used to adjust the multi-satellite half-hour estimates) has been received. Therefore, both the IMERGF-V3 and V4 products include Early, Late, and Final Run products.
For the IMERG products, the major updates from V3 to V4 are summarized as follows: the GPROF V4 was used to estimate precipitation using all microwave sensors as input and the GPROF-ATMS precipitation estimates were added. The spatial coverage of the high-quality (HQ) precipitation field was increased from 60°N-S to 90°N-S. The GPM combined instrument dataset (2BCMB) was calibrated using the Global Precipitation Climatology Project (GPCP) V2.3 over the ocean (at middle and high latitudes) and the land (globally) to compensate for a low (high) 2BCMB bias over non-tropical oceans (land). The four 1° grid box adjustment coefficients were averaged to calibrate the GPROF-GMI to 2BCMB in each IMERG 0.1° grid and to eliminate the blockiness in regions with high-gradient differences. The grid box volume adjustment used by the Global Precipitation Climatology Centre (GPCC) was removed to eliminate the blocky gauge adjustment for the final run. More detailed introductions can be found in previous study [33].
2.3.2. Version 6 GSMaP Products
The new version 6 GSMaP products with the latest algorithm for the GPM mission to retrieve rain rates were released in September 2014 and provide retrospectively-processed data starting from March 2014. The version 6 GSMaP product provides three product types: near real-time, microwave-IR re-analysis, and gauge-adjustment. All three products have a 0.1° × 0.1° spatial resolution and a 1 h temporal resolution. The near-real-time product has a latency of 4 h and synergistically uses available microwave imagers and sounders, including GPM. Compared to the near real-time product, the microwave-IR re-analysis product also uses IR to correct the satellite estimates, except for using various PWM imagers and sounders; thus it has a 3 d latency. In addition to the PWM and IR, the observed global rainfall data from the CPC are used to adjust the bias in the GSMaP product. These three types of version 6 GSMaP products cover the latitude region from 60°N to 60°S and the longitude region from 180°W to 180°E. More documents on version 6 GSMaP products can be obtained through the G-Portal data service system (http://www.gportal.jaxa.jp). To evaluate the satellite products using the gauge observation dataset, all daily satellite precipitation products are re-sampled to a spatial resolution of 0.25° × 0.25°.
3. Evaluation Metrics
To assess the performances of the IMERGF-V3 and IMERGF-V4 satellite-based precipitation products, the bias, RB, root-mean-square error (RMSE), Pearson linear correlation coefficient (CC), and fractional standard error (FSE) were used as statistical metrics in this study. The details for calculating the five statistics have been provided by previous studies [35,43]. The metrics are calculated at the pixel scale over China to determine the spatial distribution of errors.
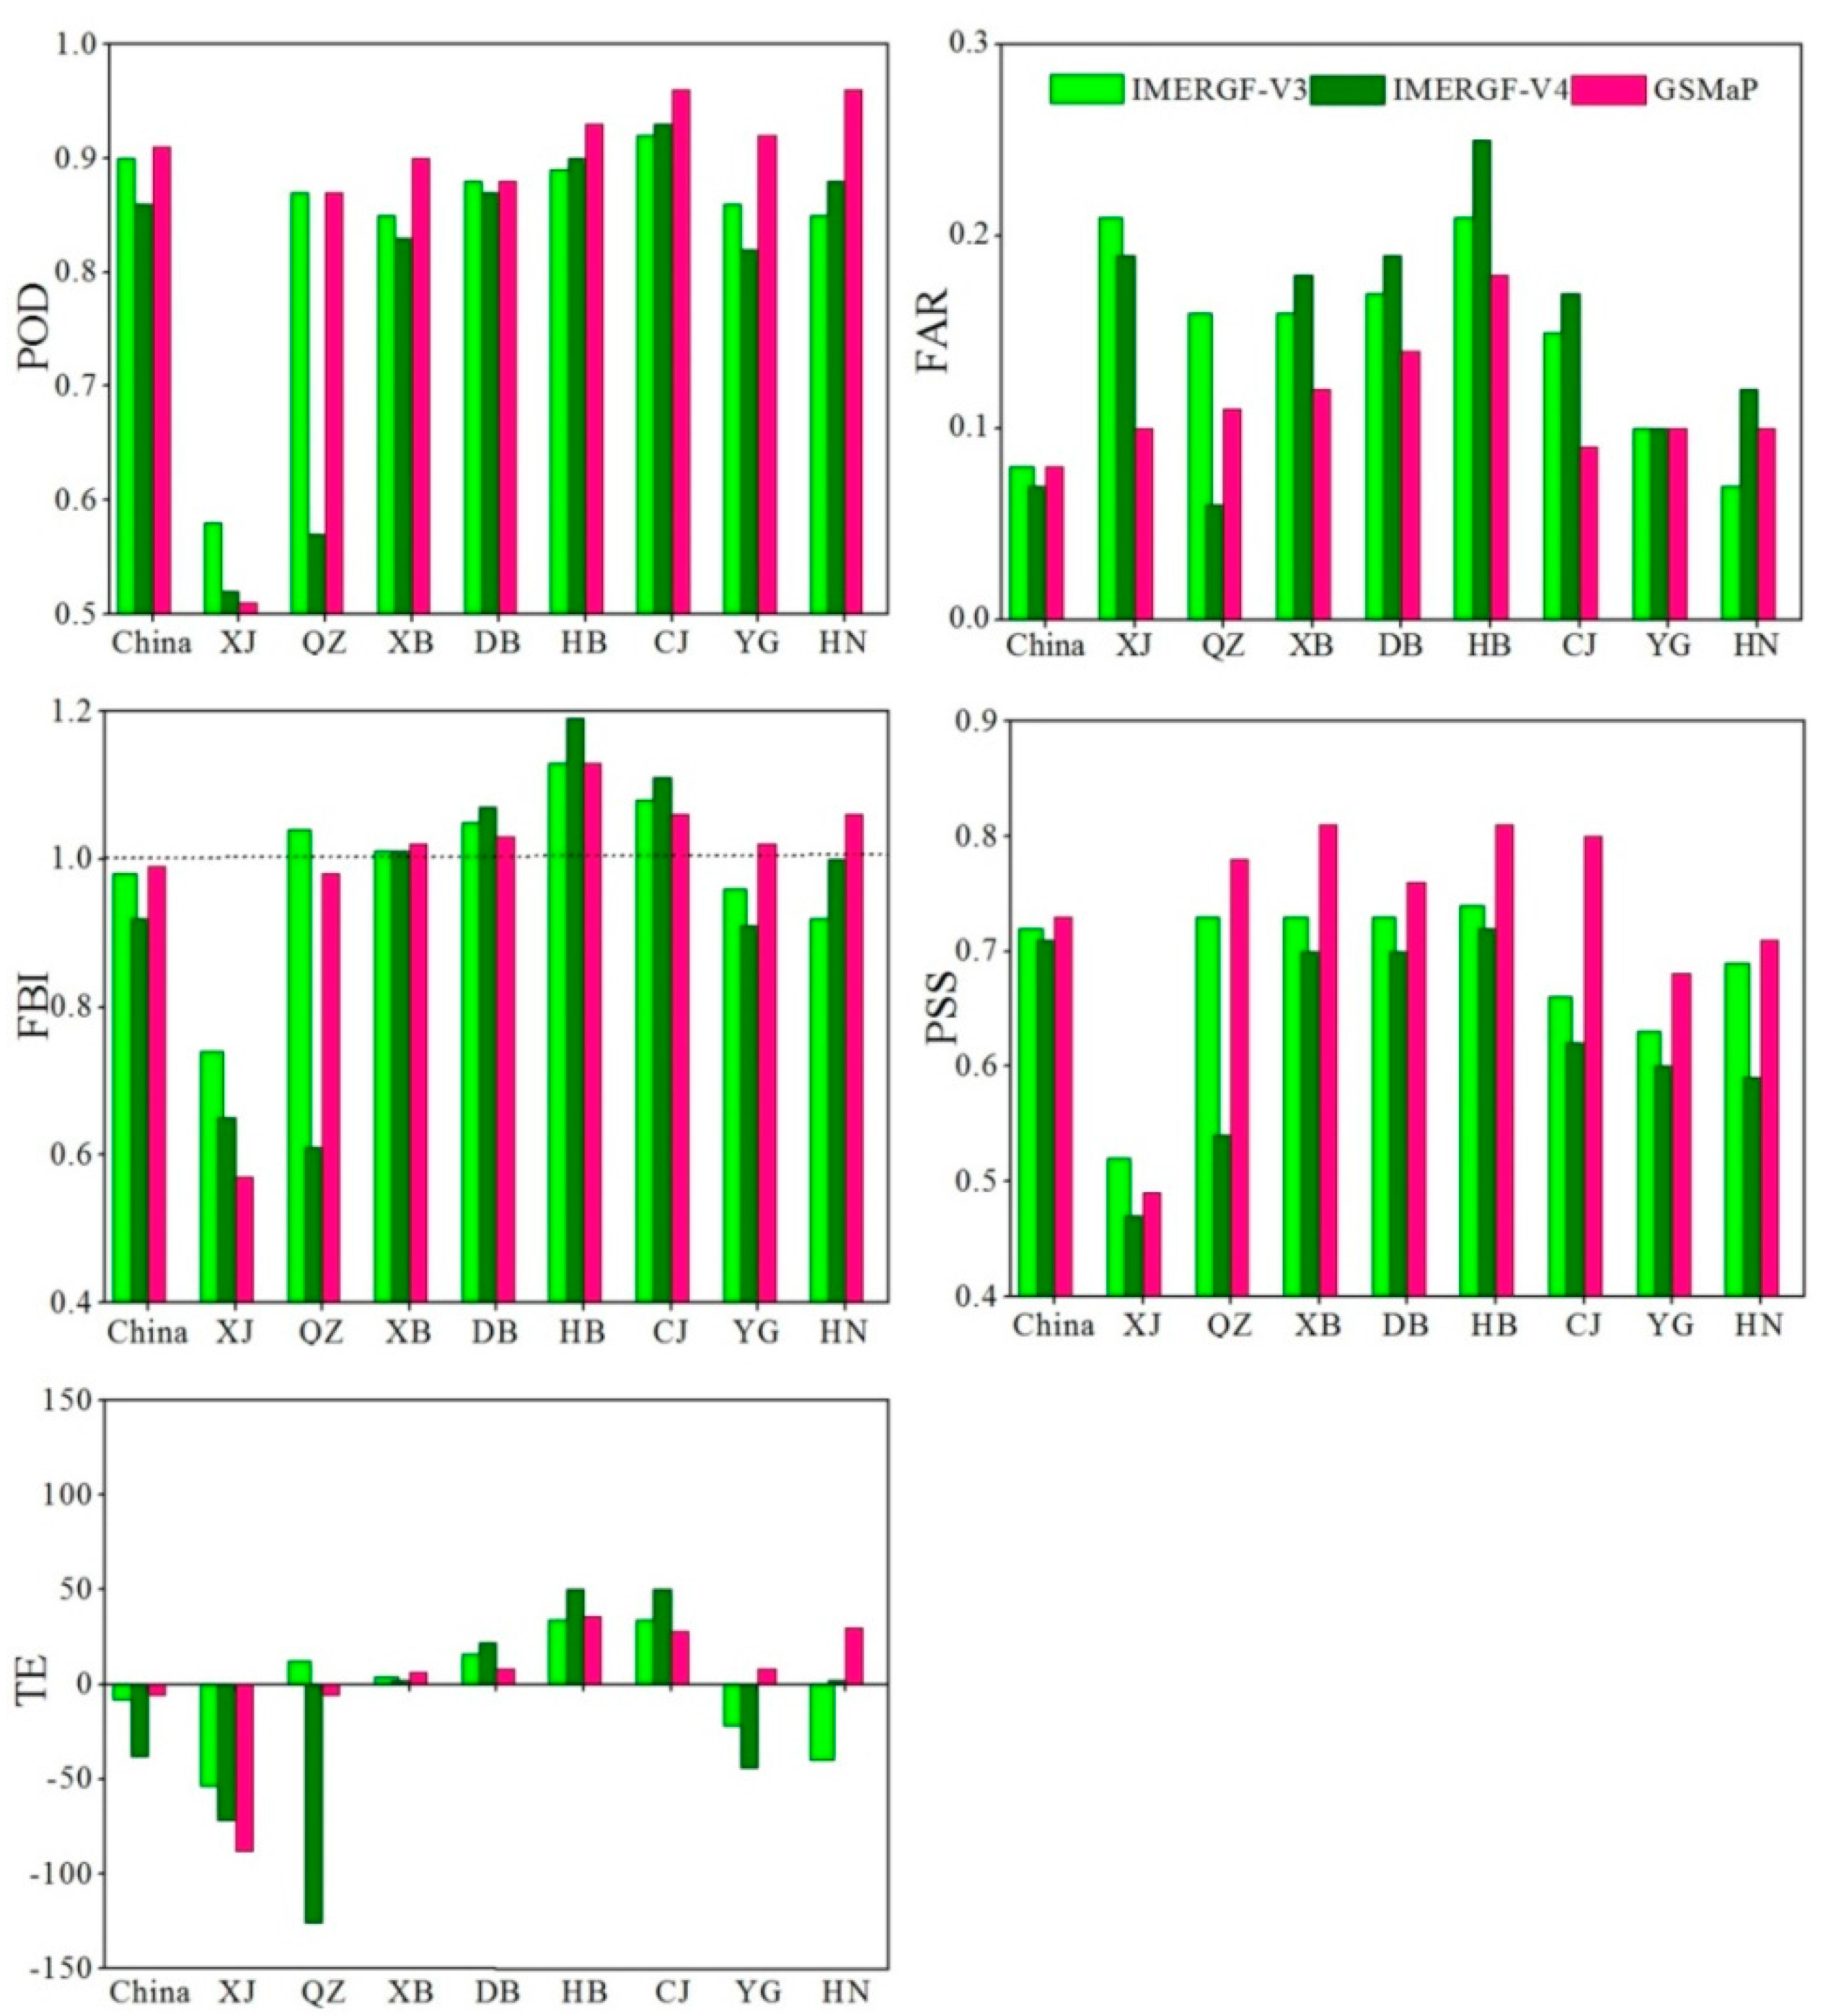
In addition to the aforementioned spatial statistical metrics, the probability of detection (POD), frequency bias index (FBI), false-alarm ratio (FAR), Peirce skill score (PSS), and total error (TE) were also used to evaluate the ability for detection of the four GPM-based products compared to the CPAP. The POD, FAR, and PSS range from 0 to 1. Additionally, 1, 0, and 1 are the ideal values for POD, FAR, and PSS, respectively. Although the range of FBI can exceed 1, the ideal value is also 1. Based on previous study [48], the TE is composed of three independent components of H, –M, and F. H is called the hit bias and is the difference in the detected rain rate between satellite and gauge-based observations; it may be either positive or negative. –M represents missed precipitation and refers to the rain rate not detected by the satellite estimates; it has always a negative value. F refers to false precipitation detected by the satellites but not observed by the gauges; it is always positive. The calculations for these five metrics are provided in Appendix A [49]. To show the spatial distribution of the errors, all metrics used in this study were calculated at the pixel scale over China. The equations for the metrics are listed in Appendix B.
4. Results
In this section, we describe the results of using the statistical metrics to compare the IMERGF-V3 and IMERGF-V4 products over China and the eight sub-regions at annual, seasonal, and daily time scales.
4.1. Annual Daily Average Precipitation
Figure 2 shows the spatial distributions of the rain gauges and the daily average precipitation for CPAP, IMERGF-V3, IMERGF-V4, and GSMaP over China from March 2014 to February 2015. Compared to the dense distribution of the rain gauges in eastern and southern China, the rain gauge distribution is relatively sparse in the western regions, which are dominated by plateaus, mountains, and deserts (e.g., QZ and XJ) as well as the northern high-latitude regions (e.g., XB and DB) (Figure 2a). The IMERGF-V3 and IMERGF-V4 products arrive at similar spatial precipitation patterns; the precipitation gradually increases from north-west to south-east China. However, both products heavily underestimate the precipitation in the XJ region. Compared to the IMERGF-V3 product, the IMERGF-V4 product significantly underestimates the precipitation in the QZ region. Figure 2 shows that the GSMaP product results in a more accurate spatial precipitation pattern than the IMERGF-V3 or IMERGF-V4 products.
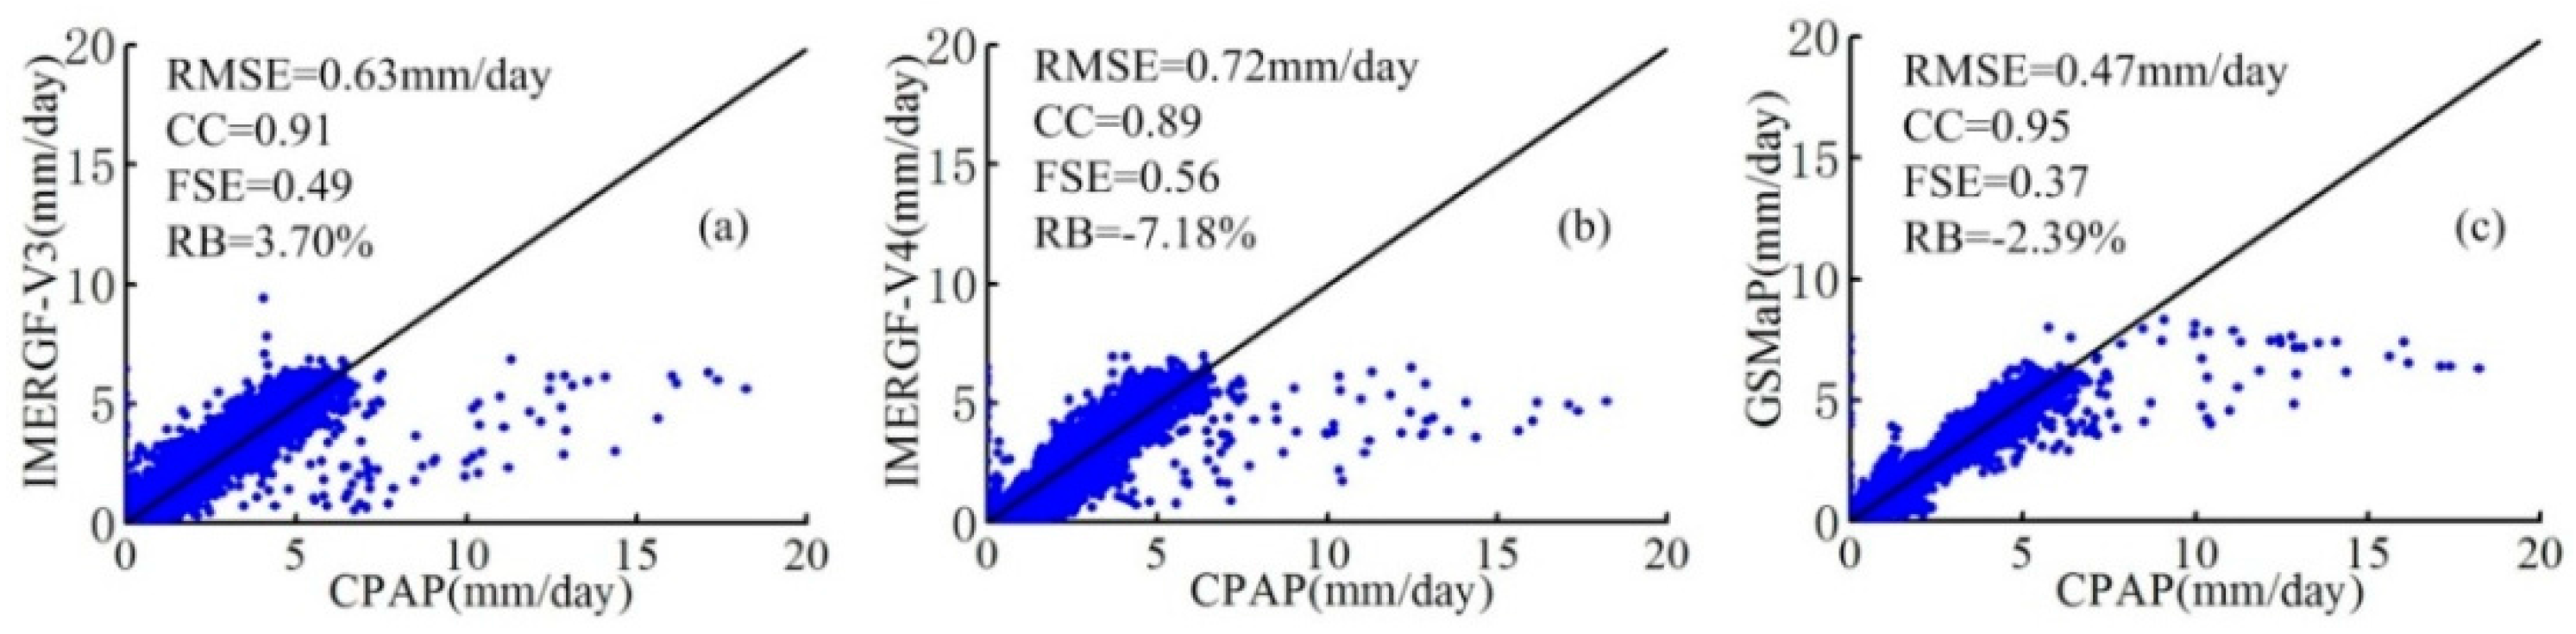
Figure 3a,b quantitatively show the differences between the IMERGF and CPAP products over China based on the RB, CC, RMSE, and FSE. When the rain rates of CPAP are above 10 mm/day, scatterplots indicate that the three satellite-based products do not capture the high values. This may be related to the following: (1) high-intensity storms usually happen at fine spatiotemporal scales and the storm centers are not completely or accurately detected by satellite-based products [50]; (2) merging algorithms in the satellite-based products likely smooth out extreme precipitation events [51]. Taking the specific metrics into account, the performance of the IMERGF-V4 product is not superior to that of the IMERGF-V3 product over China. Compared to the IMERGF-V3 product, the IMERGF-V4 product has a lower CC (0.91 for IMERGF-V3 vs. 0.89 for IMERGF-V4), a larger RMSE (0.63 mm/day for IMERGF-V3 vs. 0.72 mm/day for IMERGF-V4), a higher FSE (0.49 for IMERGF-V3 vs. 0.56 for IMERGF-V4), and an inferior performance of the RB (3.70% for IMERGF-V3 vs. −7.18% for IMERGF-V4). Figure 3c shows that all statistical indicators are better for the GSMaP product than for the IMERGF products and have the smallest RMSE (0.47 mm/day), the highest CC (0.95), the lowest FSE (0.37), and the best performance of the RB (−2.39%). In addition, when the rain rates of CPAP are above 10 mm/day, this figure also shows that the rain rates of GSMaP are closer to those of CPAP than the IMERGF products.
Appendix C lists the values for the metrics (RB, RMSE, CC, and FSE) for the IMERGF-V3, IMERGF-V4, GSMaP, and CPAP products over China and the eight sub-regions. The IMERGF-V3 and IMERGF-V4 products slightly overestimate the precipitation over the DB and HB sub-regions with respect to the RB values (11.20% and 8.51%, 13.34% and 12.35%, respectively), and considerably underestimate the precipitation over the XJ region with negative RB values (−17.74% and −37.63%). The overestimation over the high-latitude DB and HB regions may be due to biased snowfall estimation in the spring and winter [35] and complex topography which a strong influence on TB and its polarization property with varying snow cover conditions, depending on exposure and the altitude in mountainous terrain [52,53]. Sparse and uneven rain gauge distribution, high latitude, the OI interpolation technique, and the poor detection ability of the orographic precipitation for passive microwave and IR satellites result in underestimation over the arid XJ region. The performance is better for the IMERGF-V4 product than for the IMERGF-V3 product over the XB, DB, HB, and HN regions, while the IMERGF-V4 product exhibits a far inferior performance than the IMERGF-V3 product over QZ and XJ based on the RB values (−60.91% and 3.32%, −37.63% and −17.74%). These results illustrate that a newly calibrated dataset and an a priori database with a very short lead time for the IMERG algorithm generates larger errors in arid regions with few rain gauges.
According to the quantitative statistical metrics shown in Appendix C, the GSMaP product arrives at better performance measures (i.e., CC, RMSE, and FSE) and provides relatively better RB performance compared to the IMERGF-V3 and IMERGF-V4 products for most regions of China (except for QZ and XJ). The reasons behind these results have been discussed with regard to the data shown in Figure 2. However, a considerable underestimation of the RB (−33.61%) is observed for the GSMaP product over XJ. The lack of DPR radar data for the GSMaP product, the sparse distribution of rain gauges, and the OI interpolation technique contributed to this outcome.
4.2. Seasonal Daily Average Precipitation
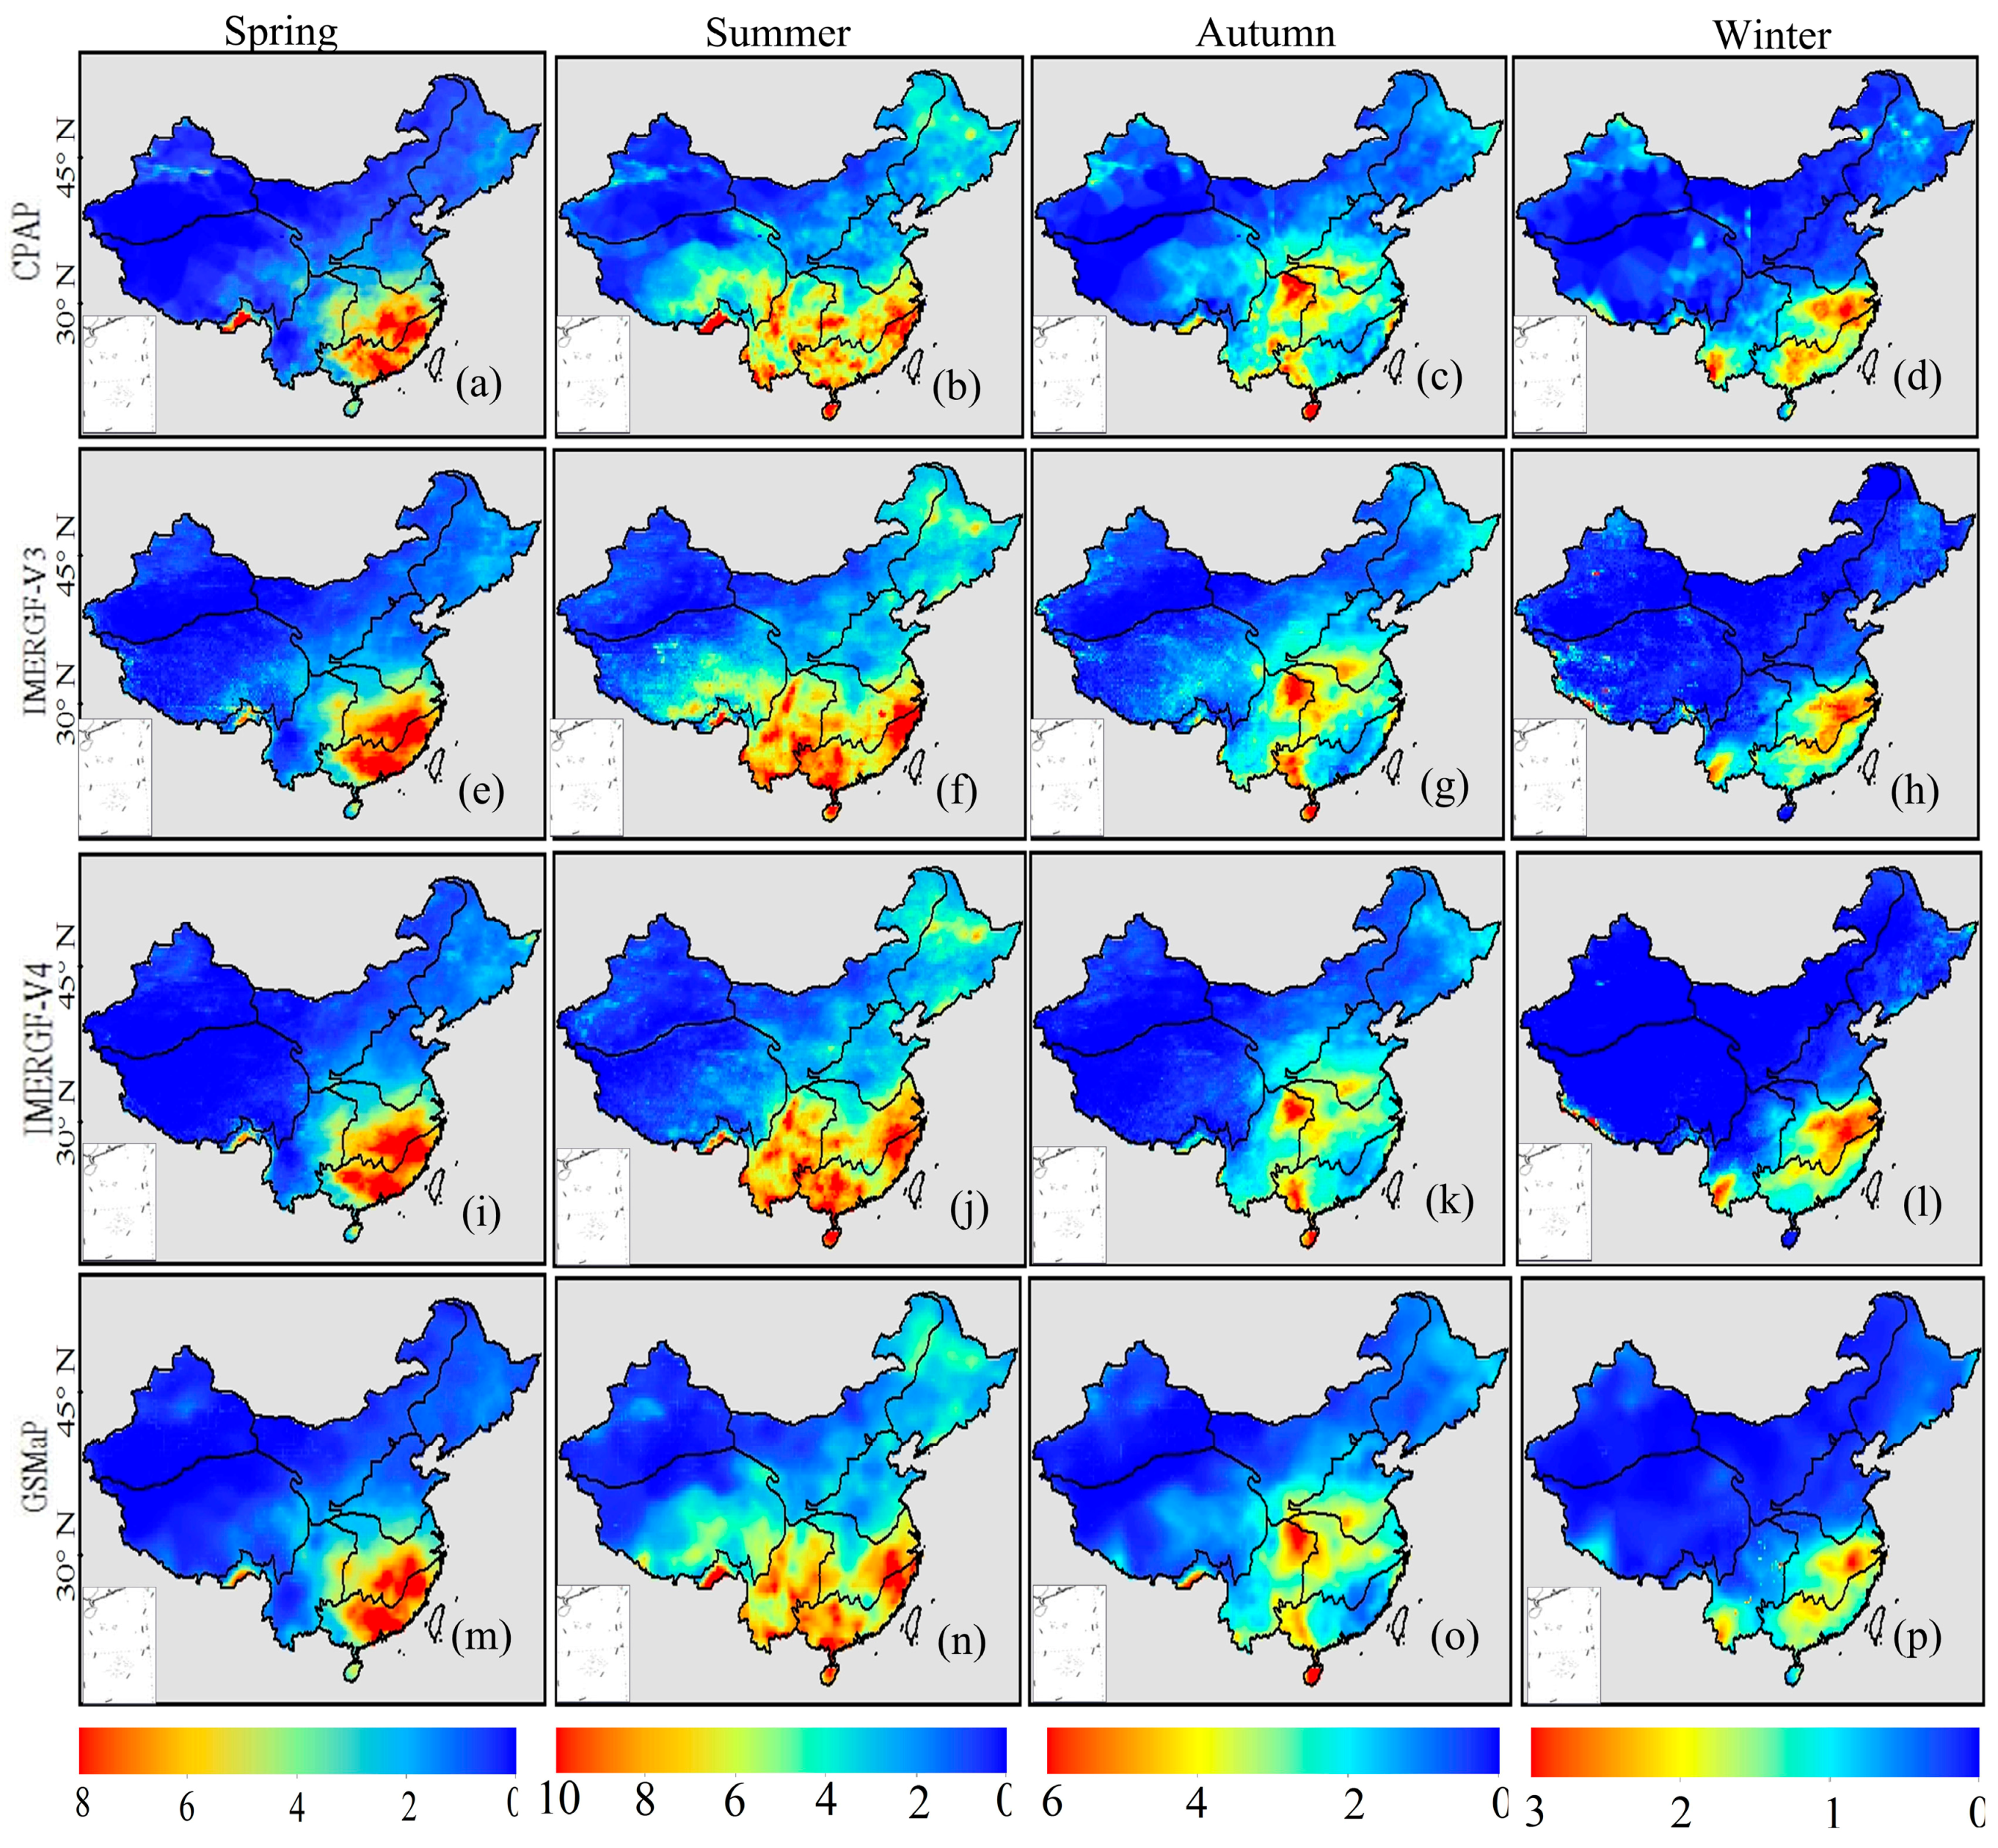
Figure 4 shows that the IMERGF-V3 and IMERGF-V4 products overestimate precipitation in HN during summer. These overestimations may be caused by the erroneous discrimination between raining and non-raining warm clouds [54,55,56]. In contrast, the products underestimate the precipitation over DB and the northern XJ region during spring and winter. The sparse rain gauge distribution and the PMW’s inability to measure snowfall/rainfall over snow- and ice-covered land surfaces are the reasons for the underestimations in these subregions [35,57]. Compared to the IMERGF-V3 product, the IMERGF-V4 product exhibits a significant underestimation of the precipitation in the QZ plateau in all seasons, which could mainly be attributed to the a priori database with a very short lead time and the newly calibrated dataset in the IMERGF-V4 algorithm. Additionally, the GSMaP product exhibits superior performances compared to the IMERGF-V3 and IMERGF-V4 products in most regions during the summer (Appendix D). This occurs because the missed precipitation is not a significant error source in the GSMaP product [57].
The scatterplots in Figure 5 show that the absolute RB values for the three satellite-based products range from 2.04% to 28.45%, the RMSEs range from 0.25 mm/day to 1.79 mm/day, the CCs range from 0.80 to 0.95, and the FSEs range from 0.36 to 1.00. Compared to previous studies [34,35,40], most of the metrics remain within normal ranges with the exception of the RB value of the IMERGF-V4 product with a larger bias (−28.45%) during winter. Compared to the CPAP product, the three satellite-based products clearly underestimate the precipitation in the spring and winter. The considerable underestimation of the gauge-adjusted products may be attributed (at least partially) to the sparse rain gauge distribution and the OI interpolation technique. Another important reason may be that passive microwave and IR satellite sensors have difficulties detecting shallow orographic precipitation [58,59,60]. In addition, land surfaces covered by snow and ice in the winter also have an effect because the accuracy of PMW-based precipitation is influenced and degraded by snow and ice cover [61,62]. Compared to the IMERGF-V3 product, the IMERGF-V4 product exhibits an increased underestimation of precipitation during all four seasons and the RBs of the IMERGF-V4 product have evidently inferior performances during autumn (2.81% for IMERGF-V3 vs. −15.86% for IMERGF-V4) and winter (−16.57% for IMERGF-V3 vs. −28.45% for IMERGF-V4). Additionally, the IMERGF-V3 product generally has better CC, RMSE, and FSE (except for the FSE value in spring) than the IMERGF-V4 product in all four seasons. Among the three satellite-based products, the RMSE, FSE, and CC of the GSMaP product are generally best in all four seasons (except for the FSE value in spring). GSMaP has a poor RB performance (−5.90%) in spring and has a better RB performance (2.04%) in summer than IMERGF-V3 and IMERGF-V4 products. In addition, the absolute RB values for GSMaP are smaller than those for the IMERGF-4 product and larger than those for the IMERGF-V3 product in autumn and winter.
The RB, RMSE, CC, and FSE values for the eight sub-regions of China during all four seasons are shown in Appendix D. The three satellite-based products underestimate the precipitation in the winter over the XJ, QZ, XB, DB, YG, and HN sub-regions. The IMERGF-V3 and IMERGF-V4 products underestimate the precipitation during all four seasons in XJ and YG in the range from −1.01% to −95.14% (except for 1.07% for IMERGF-V3 in summer over YG) and overestimate the precipitation over HB and CJ in the range from 1.41% to 16.54%. Compared to the IMERGF-V3 product, large underestimations of the IMERGF-V4 product occur in the XJ, QZ, and DB regions; especially in XJ and QZ, the IMERGF-V4 product underestimates the precipitation by a factor of two compared to the IMERGF-V3 product. Compared to the IMERGF-V3 and IMERGF-V4 products, the GSMaP product underestimates the precipitation based on the RB value over YG (which has complex terrain) during all four seasons and in most sub-regions (except for XJ) during summer. In addition, the GSMaP product also has smaller RMSE and FSE values as well as an apparent increase in the CC values in various subregions.
4.3. Daily Precipitation
An accurate analysis of daily precipitation is significant for simulating the water-cycle processes and predicting flood events at basin or regional scales. Pixel-based differences in daily precipitation between the CPAP and the satellite-based precipitation products over mainland China in 2014 were used to calculate the daily variations of the bias, CC, and RMSE; the results are displayed in Figure 6. Previous research [63] shows that the values of gauge-based analysis grid boxes without gauges are determined by interpolating observations over the surrounding areas. Therefore, this could change an original grid value of zero to a non-zero value, and an original grid value of non-zero to zero. In this study, only the pixel pairs in which both the CPAP and satellite-based precipitation product values were above zero were used to reduce random errors in daily analysis. To filter out high-frequency noise, a 30-day moving window was used to create a smoothed time series dataset after calculating the daily metrics [64].
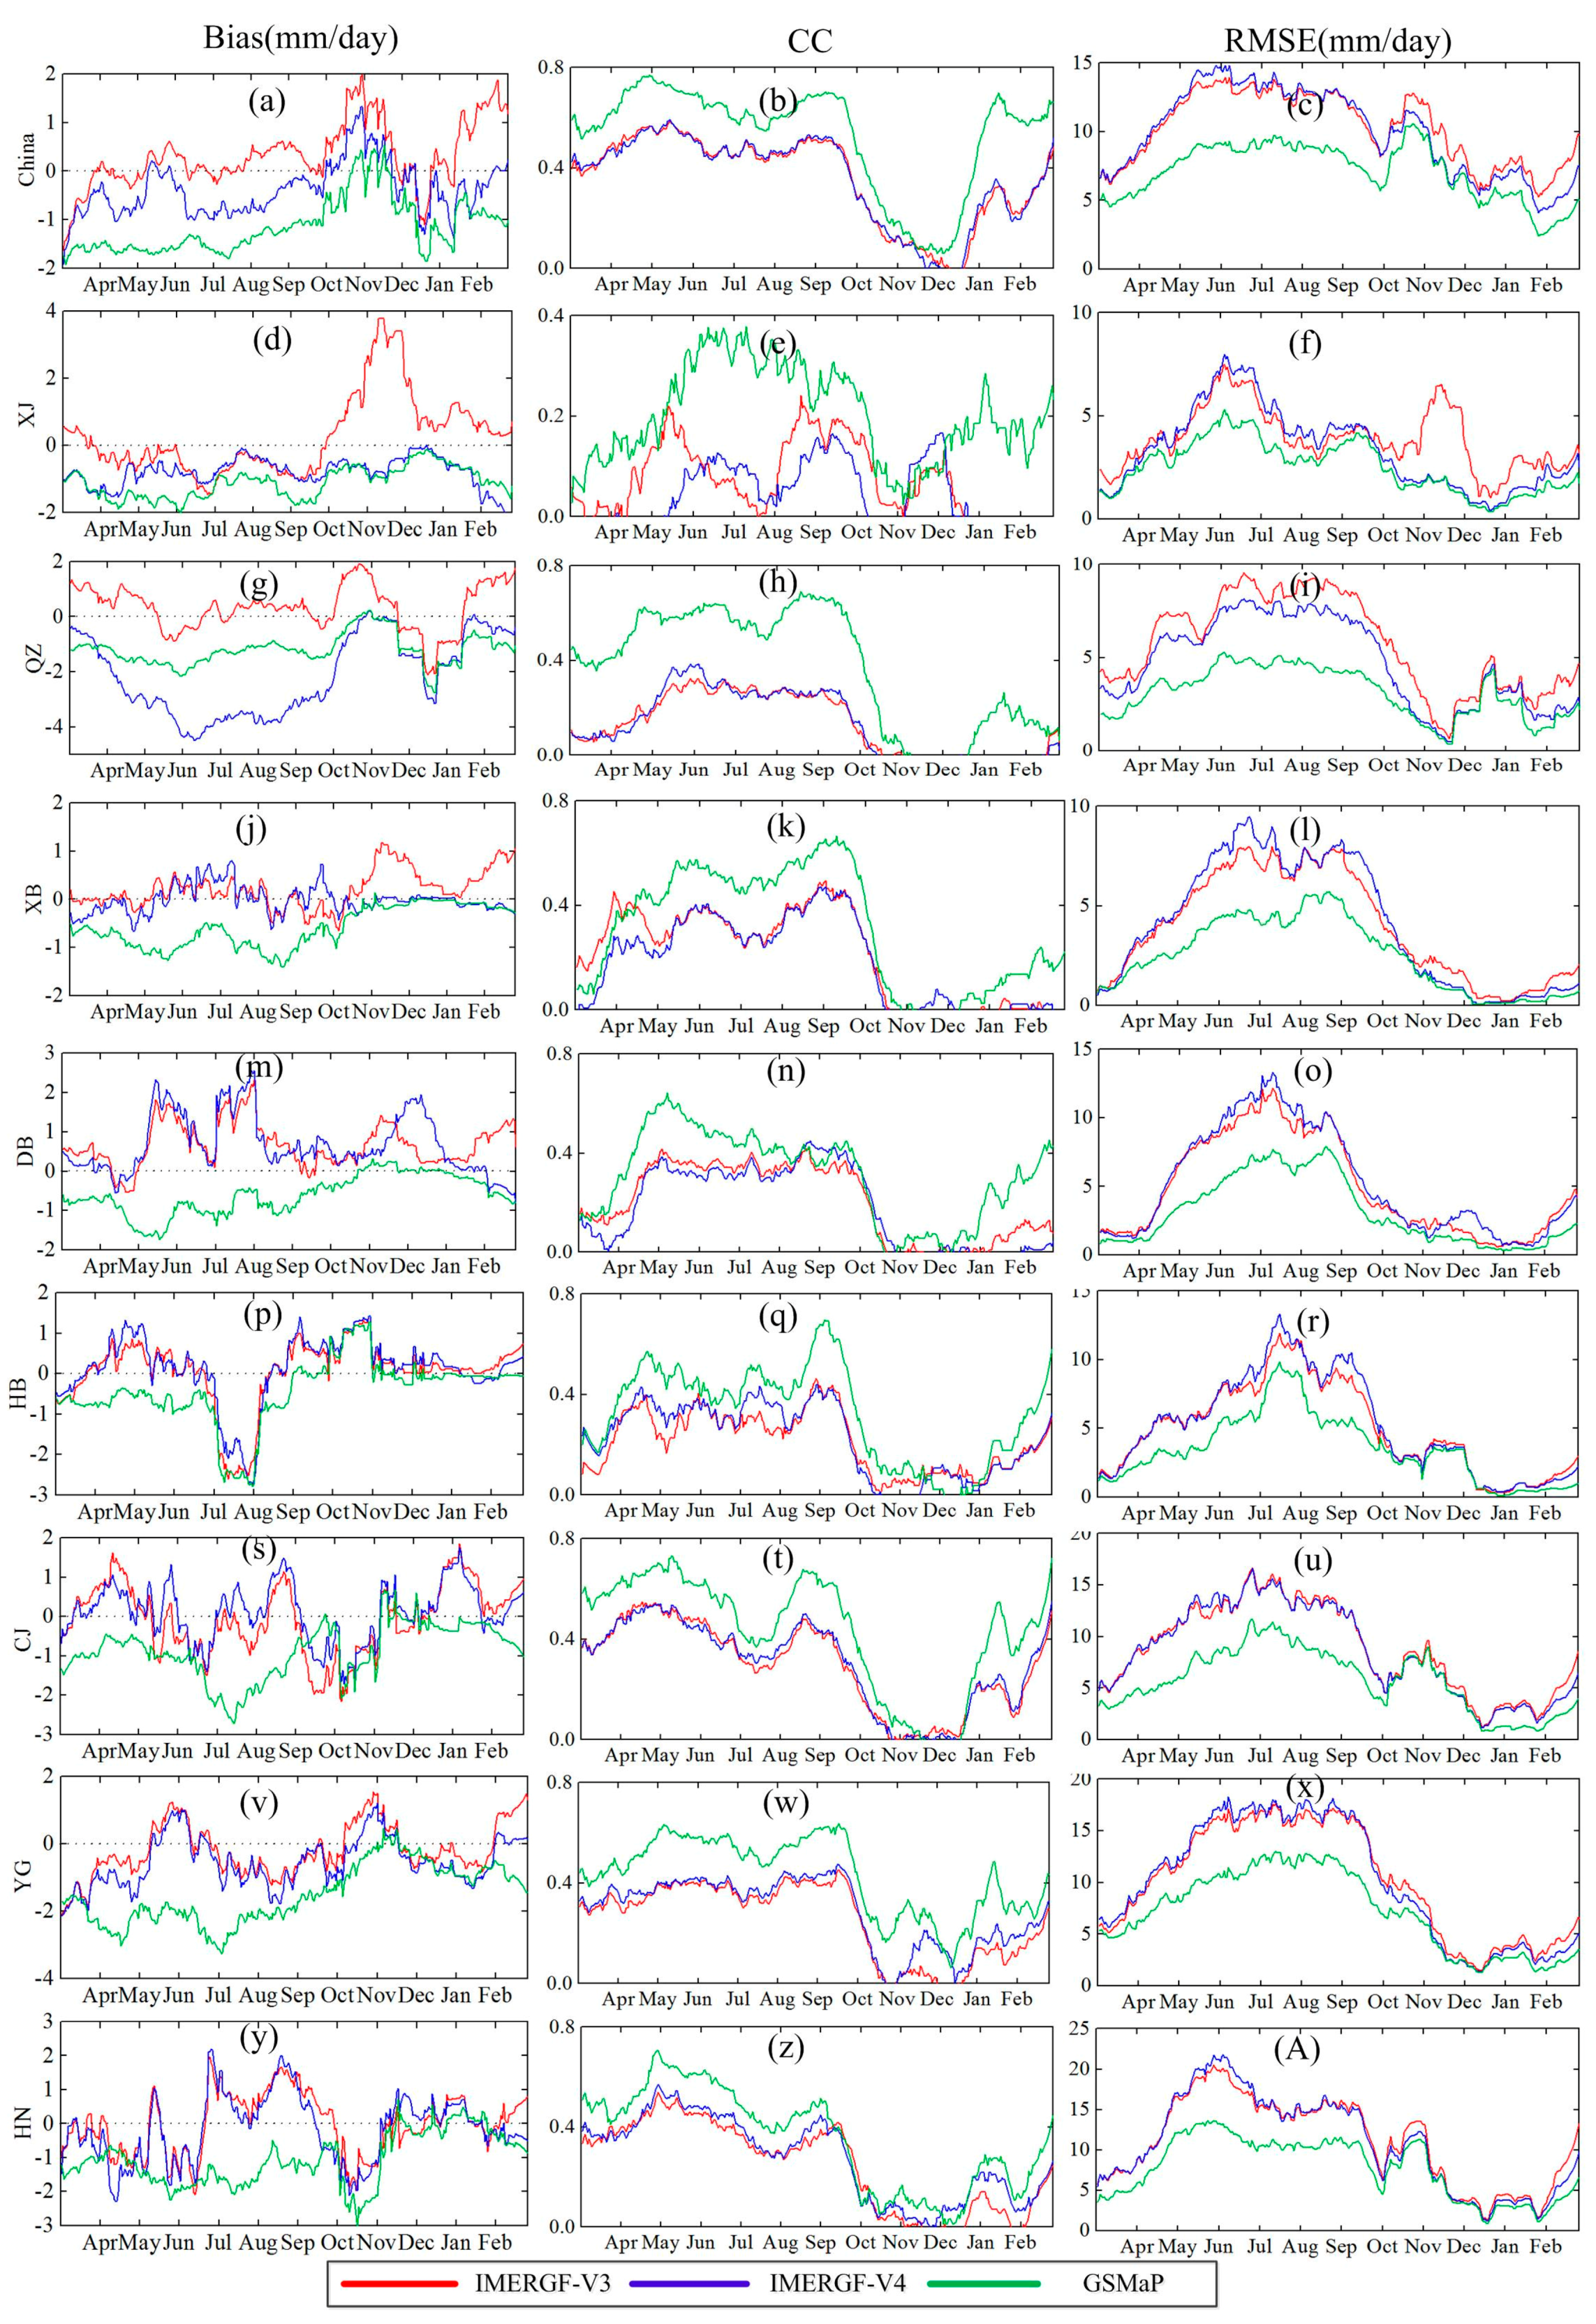
For the three satellite-based precipitation datasets, the daily CC and RMSE values present generally consistent variant processes, whereas the daily bias values follow apparent fluctuations around the zero line (Figure 6). For the IMERGF-V3 and IMERGF-V4 products, the daily CC values gradually increase from April, while they gradually decrease from October; the highest values over QZ, XB, HB, and YG occur between August and September and the highest values over DB and HN occur between April and May. This is because the satellite sensors could accurately detect deep convection rainfall during the warm season. However, heavy precipitation with higher intensity may cause significant and frequent signal attenuation [65], which might be used to explain the RMSE variance in Figure 6.
Compared to the IMERGF-V3 product, the CC values of the IMERGF-V4 product are lower between April and November (except June and July) over XJ. The RMSEs for the IMERGF-V3 and IMERGF-V4 datasets display similar variances as the CC values in most sub-regions and have the highest (lowest) values between June and September (December and January); the highest and the lowest RMSE values are above 12 mm/day and below 6 mm/day. However, there are very high RMSE values for the IMERGF-V3 product in November 2015 over XJ compared to the IMERGF-V4 product. Additionally, the RMSE values for the IMERGF-V3 product in 2014 over QZ are evidently higher than those for the IMERGF-V4 product with the exception of December and January. It is noteworthy that the bias values for the IMERGF-V4 product exhibit a large underestimation over QZ from April to October. In addition, the IMERGF-V3 product exhibits higher estimations from October to November over XJ, XB, and QZ; this occurs because the expansion to a warmer threshold in the IMERGF-V4 product can better capture the precipitation from low clouds in dry regions [26]. Compared to both IMERGF-V3 and V4, the GSMaP bias values exhibit underestimations during warmer seasons (from April to September) in most regions (except for QZ) and have a better performance during colder seasons (from October 2014 to February 2015).
4.4. Probability Distribution Function (PDF) Analysis
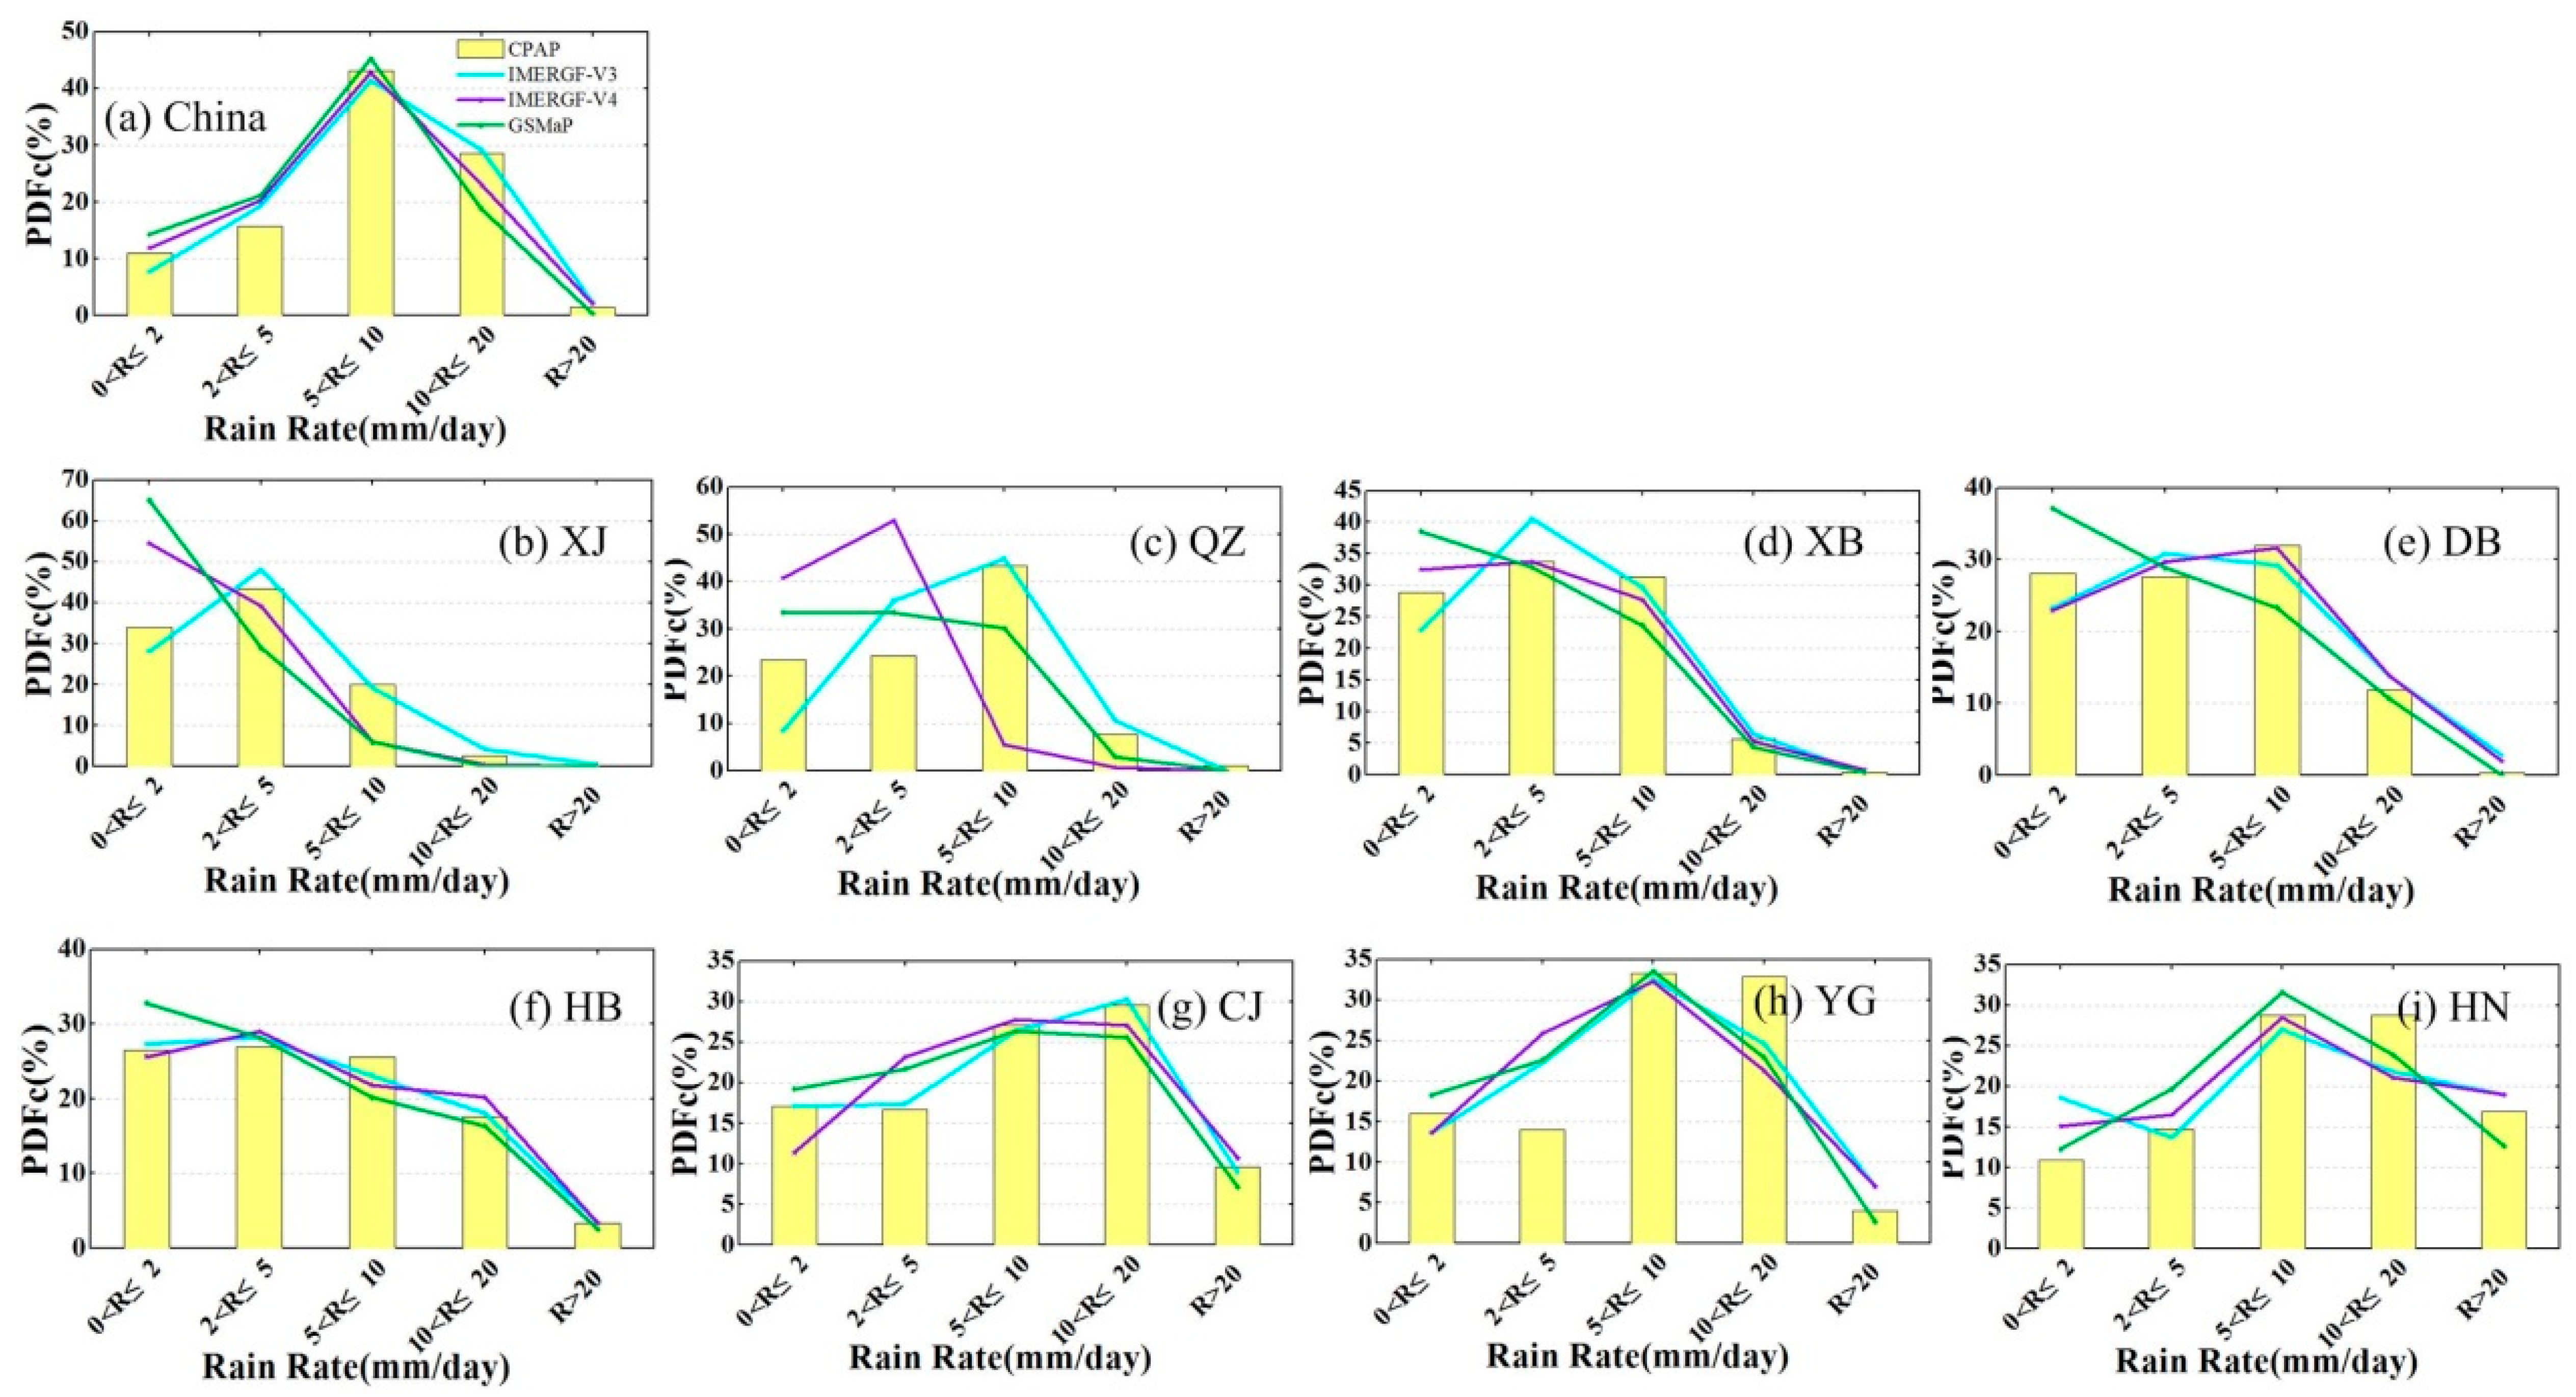
The same precipitation amount results in significantly different flood patterns if the duration of the precipitation event changed [64]. Therefore, it is very important to determine the accurate distribution of rainfall frequencies with different intensities for rainfall events. The PDFc and PDFv [35,66] provide detailed information on the inhomogeneity of precipitation events in a region; therefore, these parameters were analyzed for the satellite products and compared to CPAP over mainland China and the eight subregions for the entire study period (Figure 7 and Figure 8). 2 mm/day, 5 mm/day, 10 mm/day, and 20 mm/day were used as thresholds of the rainfall intensities for the PDFc and PDFv. To avoid random errors, only the pixel-gauge pairs where the values of both the satellite precipitation products and CPAP above zero were used for the calculations.
Figure 7 shows that the IMERGF-V4 product overestimates light precipitation events (<2 mm/day), while underestimating heavy precipitation events (>10 mm/day) over XJ and QZ in comparison to the IMERGF-V3 product. This effect provides a possible explanation for the significant underestimation by the IMERGF-V4 product. In addition, the IMERGF-V3 product detects more moderate precipitation events (2 mm/day < R < 10 mm/day) than the IMERGF-V4 product over western China (XB and XJ) but detects fewer moderate precipitation events over south-eastern China (CJ and HN). Compared to the IMERGF-V3 and IMERGF-V4 products, the GSMaP product detects relatively more light precipitation events in most areas in China and less heavy precipitation events over XJ, XB, DB, HB, and CJ, possibly because the Kalman filter technique in the merging algorithms averages heavy precipitation events [51].
Similar to the results shown in Figure 7, the IMERGF-V3 and IMERGF-V4 products overestimate the precipitation volume when the rainfall intensity exceeds 20 mm/day in most areas of China (Figure 8). In addition, they estimate a higher lower precipitation volume of 2–5 mm/day and estimate lower precipitation of 5–10 mm/day over the QZ, XJ, XB, and DB sub-regions. Complex topography, intense evaporation, and a sparse distribution of rain gauges may have contributed to occurrences of this phenomenon. The updated IMERGF-V4 product heavily underestimates precipitation when the rain rate is in the range of 5–10 mm/day and overestimates events in the range of 2–5 mm/day over QZ when compared to the IMERGF-V3 product. The maximum precipitation volumes for the GSMaP product occur for 5–10 mm/day and this range of precipitation volume for GSMaP is noticeably underestimated based on a comparison with the IMERGF-V3 and IMERGF-V4 products.
4.5. Contingency Statistics
Compared to IMERGF-V3, IMERGF-V4 does not exhibit good POD scores for most regions in China (except HB, CJ, and HN); an especially low POD score (0.52) is observed for the IMERGF-V4 product over QZ. In addition to XJ and QZ, the IMERGF-V3 product has more false rainfall event estimations based on FAR. In QZ, the FBI results show that the IMERGF-V3 product slightly overestimates the rainfall events, while the IMERGF-V4 product arrives at significant underestimations. The PSS values of the IMERGF-V3 and V4 products are above 0.5 in most subregions with the exception of XJ and the IMERGF-V3 product has larger PSS values than the IMERGF-V4 product over QZ. Note that the largest TE value (about −120) is observed for the IMERGF-V4 product in QZ and is considerably larger than the value for the IMERGF-V3 product. Compared to IMERGF-V3 and V4, the GSMaP product has generally better scores for the POD, FAR, PSS, and TE in most regions (except for XJ). The fluctuations of the TE values are smaller for the GSMap product in the sub-regions than for the IMERGF-V3 and IMERGF-V4 products because the GSMaP algorithm and error-correction method are more effective in balancing the errors related to topography [57].
5. Discussion
Numerous previous studies have evaluated different satellite products over China [18,35,67,68] and several studies have pointed out differences between different versions of the same product [43,67]. However, none of these studies cover the different versions of GPM-based satellite precipitation products over China. It should also be noted that the performances of the successive IMERGF-V3 and V4 products were compared over China for the first time. The comparisons of successive versions over different sub-regions in China contribute an improvement of the spaceborne retrieval algorithms used by IMERG developers.
In addition to the influences of satellite sensors, the land–surface complex, and precipitation type [18], the errors of satellite precipitation estimates show evident dependency on the precipitation-retrieval algorithm. Compared to the IMERGF-V3 product, the IMERGF-V4 product significantly underestimates precipitation over the QZ region in this study. The calibration of the 2BCMB in the IMERGF-V4 product to the new GPCP V2.3 dataset generated in 2016 is responsible for this underestimation [69]. Moreover, two reasons may also contribute to this phenomenon: (1) the IMERGF-V4 product uses the GPM-generated a priori databases with a very short lead time, which led to insufficient testing of the GPROFV04 that resulted in less-than-ideal retrievals [70]. A-priori databases include observed precipitation profiles and their associated brightness temperature signals; these databases are used in conjunction with Bayesian inversion techniques to build consistent retrieval algorithms for the Core satellite’s GMI instrument and each of GPM’s constellation satellites [71]; (2) the IMERGF-V4 product removes the GPCC grid box volume adjustment to smooth gauge analysis precipitation values for a particular grid to the surrounding grids [33]. In addition, the GPROF-GMI to 2BCMB calibrations with distance-weighted interpolations of the four surrounding 1° grid cells in the IMERGF-V4 product facilitates the capture of more accurate peak-precipitation events with the comparison with IMERGF-V3 [32,33].
Furthermore, it is noted that precipitation estimation of a gauge-calibrated satellite product depends in large part on global gauge-based analysis precipitation datasets; however, these gauge-calibrated satellite products do not always show accurate estimations, particularly over less dense gauge regions [72]. Re-sampling and interpolation methods are used to produce these gauge-based analysis precipitation data sets. However, spatial sampling accuracy is related to the density of the gauge [63].
With the exception of evaluation metrics, hydrological modes are also a useful tool to evaluate satellite-based precipitation data [2,3,16,41]. Previous studies suggested that a better discharge simulation could be performed when satellite-based precipitation products with inferior accuracy are compared to gauges combined with appropriate hydrological models [21]. However, since there are no records of the hydrological simulation between IMERGF-V3 and V4, further studies about their utility in hydrology and associated uncertainty analyses should be conducted.
In this study, a further and new GPM-based precipitation product (namely the version 6 GSMaP research product) is also used for comparison. Figure 2 shows that the GSMaP product results in a more accurate spatial precipitation pattern than the IMERGF-V3 or IMERGF-V4 products. Two factors may be responsible for this phenomenon: first, daily CPC observed data are used by the GSMaP product to adjust the precipitation bias, which performs better than the monthly gauge analyses (GPCC) used in the IMERGF products; second, the Japan Meteorological Agency Global Analysis (GANAL) data and Merged Satellite and in-situ Global Daily Sea Surface Temperature (MGDSST) are used in the GSMaP product to calculate lookup tables, which are then used by the GSMap microwave imager and sounder algorithms [21]. Additionally, another advantage for GSMaP is its short latency time for release (one or two days) in comparison with IMERGF’s two to four months.
6. Conclusions
This study presents a comprehensive and timely comparison of the errors in the successive V3 and V4 IMERG Final Run products over mainland China and eight sub-regions. A systematic and quantitative evaluation is performed based on a comparison with CPAP data at annual, seasonal, and daily time scales. Additionally, the gauge-adjusted version 6 GSMaP product is used for comparison. Statistical metrics, precipitation frequency, and spatial analyses are performed in this study. The main conclusions are as follows:
- (1)
- Overall, the IMERGF-V4 product does not exhibit the expected superior performance compared to the IMERGF-V3 product over China. For the annual daily average precipitation, the IMERGF-V4 product shows a significant underestimation of the precipitation in the western regions (e.g., QZ and XJ), while the IMERGF-V3 product has a better RB performance than the IMERGF-V4 product (3.70% for IMERGF-V3 vs. −7.18% for IMERGF-V4) over China. Additionally, the IMERGF-V3 product has a higher CC (0.91), a smaller RMSE (0.63 mm/day), and a lower FSE (0.49); correspondingly, the IMERGF-V4 product has a lower CC (0.89), a larger RMSE (0.72 mm/day), and a higher FSE (0.56). In comparison, the GSMaP product performs better in terms of spatial precipitation distribution than the IMERGF-V3 and V4 products with the highest CC (0.95), the smallest RMSE (0.47 mm/day), the lowest FSE (0.37), and the highest RB (−2.39%) at an annual scale.
- (2)
- For the seasonal analysis over China, the absolute RBs of the IMERGF-V4 product are slightly improved during spring and summer but have lower values than the IMERGF-V3 product during autumn and winter (Appendix C). The IMERGF-V3 product has a better performance than the IMERGF-V4 product for the CC, RMSE, and FSE during summer, autumn, and winter but produces inferior FSE values during spring (0.63 vs. 0.41). Among the three satellite-based products, the GSMaP product obtains the best RMSE, FSE, and CC during all four seasons and obtains the worst RB values during spring and winter (−5.90% during spring and −17.02% during winter).
- (3)
- The IMERGF-V3 and IMERGF-V4 products show a distinct underestimation over XJ and YG most of the time. In QZ, the IMERGF-V4 product produces significant underestimations compared to the IMERGF-V3 product during all four seasons (Appendix D). Additionally, the IMERGF-V3 product achieves better metrics (i.e., better RB, RMSE, FSE, and CC) during winter, especially in the western, arid region and in the North.
- (4)
- For the daily statistical metrics, although IMERGF-V4 has similar performance than its predecessor IMERGF-V3 over southern China, eastern China and north-eastern China, it presents considerable improvement over IMERGF-V3 during autumn and winter in the drier north-western China (XJ and XB) regions. However, IMERGF-V4 yields a strong underestimation in the high-altitude region (QZ) in comparison with IMERGF-V3. Compared to IMERGF-V3 and V4, the GSMaP bias values exhibit underestimations in warmer seasons (from April to September) in most regions (except for QZ) and perform better during colder seasons (from October 2014 to February 2015).
- (5)
- Compared to the IMERGF-V3 product, the IMERGF-V4 product has slightly higher POD and PSS scores only over HB, CJ, and HN (Figure 9). In addition to XJ and QZ, the IMERGF-V3 product has more false rainfall event estimations based on FAR. In QZ, the FBI results show that the IMERGF-V3 product slightly overestimates the rainfall events and the IMERGF-V4 product arrives at significant underestimations. The absolute TE value for the IMERGF-V4 product is significantly larger than that of the IMERGF-V3 product in QZ. Among the three precipitation products, the GSMaP product generally arrives at better scores for the POD, FAR, PSS, and TE for most regions (except for XJ).
- (6)
- Judging by the PDFc and PDFv, when the CPAP rainfall intensity exceeds 10 mm/day, the IMERGF-V4 product underestimates the precipitation events over XJ and QZ compared to the IMERGF-V3 product. The updated IMERGF-V4 product heavily underestimates precipitation when the rain rate is in the range of 5–10 mm/day and has an apparent overestimation in the range of 2–5 mm/day over QZ compared to the IMERGF-V3 product. The GSMaP product detects relatively more light precipitation events (<2 mm/day) in most areas and less heavy precipitation events (>10 mm/day) over XJ, XB, DB, HB, and CJ.
- (7)
- This study compares the similarities and differences between the successive V3 and V4 IMERGF products over China and provides important reference information for future hydrological and climatic applications. The results of the error analysis of the IMERGF-V3 and V4 products provide helpful feedback to IMERG algorithm developers to improve product accuracies in future. Although the IMERGF-V4 product does not show an anticipated improvement over the IMERGF-V3 product in China, additional studies are required to evaluate the V4 product elsewhere.
Acknowledgments
The National Key Research and Development Program of China (2017YFD0300400); The National Natural Science Foundation of China (Grant No. 41701517), the China Postdoctoral Science Foundation (Grant No. 2016M591093), the Science and Technology Pillar Program of Beijing (grant No. D151100005915001) and the Natural Science Foundation of China (41601569) provided the financial support for the study in this paper. At the same time, the authors are very thankful to anonymous reviewers and editors for their helpful and constructive comments.
Author Contributions
H.Z. analyzed the data and prepared the draft of the manuscript. S.Ya. gave comments and significantly revised the manuscript. S.Yo. conceived of this study, gave comments and revised the manuscript. Y.H.~prepared the satellite precipitation data and revised the manuscript. Both Q.W. and Q.Z. handled the gauge data.
Conflicts of Interest
The authors declare no conflict of interest.
Appendix A. The 2 × 2 Contingency Table Used for the Computation of Categorical Metrics
| Estimated | Observed | ||
| Rain (Daily rain ≥ 0.5 mm) | No-rain (Daily rain < 0.5 mm) | ||
| Rain (Daily rain ≥ 0.5 mm) | Hits | False alarms | Estimated events |
| No-rain (Daily rain < 0.5 mm) | Misses | Correct negatives | Estimated non-events |
| Observed events | Observed non-events |
Appendix B. The Statistical Metrics Used in the Evaluation and Comparison

| Metrics | Equations |
| Correlation coefficient (CC) | |
| Bias | |
| Relative bias (RB) | |
| Root-mean-square error (RMSE) | |
| Fractional Standard Error (FSE) | |
| Probability of Detection (POD) | |
| False Alarm Ratio (FAR) | |
| Frequency Bias Index (FBI) | |
| Peirce Skill Score (PSS) | |
| Total Error (TE) |
Variables: N is number of samples; S represents satellite precipitation estimate; G represents gauged observed precipitation; and and represent means of satellite precipitation estimate and gauged observed precipitation.
Appendix C. Statistical Metrics for Annual Daily Average Satellite Precipitation over the 8 Sub-Regions in China
| Metrics | Products | XJ | QZ | XB | DB | HB | CJ | YG | HN |
| RB (%) | IMERGF-V3 | −17.74 | 3.32 | 8.44 | 11.20 | 13.34 | 4.49 | −5.13 | 7.66 |
| IMERGF-V4 | −37.63 | −60.91 | 3.21 | 8.51 | 12.35 | 7.12 | −8.34 | 7.57 | |
| GSMaP | −33.61 | −4.65 | −0.75 | −3.54 | 6.32 | 0.61 | −4.08 | 2.16 | |
| RMSE (mm/day) | IMERGF-V3 | 0.29 | 0.43 | 0.20 | 0.25 | 0.32 | 0.54 | 1.50 | 0.75 |
| IMERGF-V4 | 0.36 | 0.84 | 0.21 | 0.27 | 0.31 | 0.54 | 1.50 | 0.72 | |
| GSMaP | 0.27 | 0.31 | 0.16 | 0.22 | 0.25 | 0.40 | 1.07 | 0.54 | |
| CC | IMERGF-V3 | 0.67 | 0.83 | 0.93 | 0.81 | 0.94 | 0.86 | 0.42 | 0.61 |
| IMERGF-V4 | 0.50 | 0.75 | 0.91 | 0.78 | 0.93 | 0.88 | 0.46 | 0.66 | |
| GSMaP | 0.83 | 0.92 | 0.94 | 0.81 | 0.94 | 0.91 | 0.79 | 0.78 | |
| FSE | IMERGF-V3 | 0.45 | 0.42 | 0.21 | 0.21 | 0.24 | 0.28 | 0.83 | 0.36 |
| IMERGF-V4 | 0.57 | 0.82 | 0.22 | 0.22 | 0.24 | 0.28 | 0.83 | 0.34 | |
| GSMaP | 0.43 | 0.30 | 0.17 | 0.18 | 0.19 | 0.20 | 0.59 | 0.26 |
Appendix D. Statistical Metrics for Seasonal Daily Average Precipitation over the 8 Sub-Regions in China
| Metrics | Seasons | Datasets | XJ | QZ | XB | DB | HB | CJ | YG | HN |
| RB (%) | Spring | IMERGF-V3 | −14.59 | 18.64 | 8.22 | 8.40 | 4.43 | 6.62 | −8.19 | 11.48 |
| IMERGF-V4 | −44.51 | −72.33 | −0.66 | 11.33 | 6.12 | 7.41 | −15.55 | 10.30 | ||
| GSMaP | −46.11 | −6.26 | −11.91 | −19.76 | −2.54 | 0.66 | −9.95 | 4.83 | ||
| Summer | IMERGF-V3 | −46.47 | −1.55 | 16.59 | 16.18 | 16.54 | 1.47 | 1.07 | 13.13 | |
| IMERGF-V4 | −3.57 | −58.19 | 15.62 | 15.26 | 15.93 | 6.18 | −1.01 | 11.18 | ||
| GSMaP | −16.55 | −1.64 | 8.30 | 4.29 | 9.41 | 1.41 | −0.13 | 5.80 | ||
| Autumn | IMERGF-V3 | −12.82 | 10.92 | 3.15 | 15.81 | 15.43 | 7.85 | −10.79 | 0.21 | |
| IMERGF-V 4 | −56.87 | −65.30 | −14.75 | −0.82 | 2.74 | 2.26 | −20.02 | 2.35 | ||
| GSMaP | −42.19 | −8.09 | −5.49 | −2.22 | 8.70 | 5.23 | −5.57 | −4.77 | ||
| Winter | IMERGF-V3 | −46.89 | 2.72 | −59.81 | −35.70 | 13.24 | 4.12 | −28.66 | −16.25 | |
| IMERGF-V4 | −95.14 | −63.74 | −79.94 | −55.91 | 8.37 | 10.18 | −32.94 | −17.37 | ||
| GSMaP | −49.24 | −27.86 | −38.14 | −28.83 | 4.84 | −7.44 | −16.71 | −10.92 | ||
| RMSE (mm/day) | Spring | IMERGF-V3 | 0.46 | 0.51 | 0.23 | 0.33 | 0.35 | 0.90 | 1.65 | 1.23 |
| IMERGF-V4 | 0.48 | 0.63 | 0.26 | 0.49 | 0.33 | 0.84 | 1.61 | 1.29 | ||
| GSMaP | 0.43 | 0.26 | 0.19 | 0.43 | 0.31 | 0.66 | 1.39 | 1.05 | ||
| Summer | IMERGF-V3 | 0.64 | 1.03 | 0.61 | 0.78 | 0.72 | 1.26 | 3.86 | 1.91 | |
| IMERGF-V4 | 0.67 | 2.01 | 0.62 | 0.85 | 0.74 | 1.14 | 3.95 | 1.73 | ||
| GSMaP | 0.45 | 0.79 | 0.47 | 0.58 | 0.67 | 1.14 | 2.78 | 1.45 | ||
| Autumn | IMERGF-V3 | 0.37 | 0.50 | 0.32 | 0.35 | 0.57 | 0.58 | 0.98 | 0.97 | |
| IMERGF-V4 | 0.50 | 0.71 | 0.34 | 0.29 | 0.48 | 0.53 | 1.05 | 0.95 | ||
| GSMaP | 0.41 | 0.37 | 0.25 | 0.28 | 0.41 | 0.48 | 0.68 | 0.71 | ||
| Winter | IMERGF-V3 | 0.30 | 0.42 | 0.20 | 0.25 | 0.10 | 0.34 | 0.46 | 0.54 | |
| IMERGF-V4 | 0.35 | 0.48 | 0.22 | 0.33 | 0.11 | 0.33 | 0.46 | 0.59 | ||
| GSMaP | 0.23 | 0.23 | 0.18 | 0.21 | 0.08 | 0.25 | 0.35 | 0.37 | ||
| CC | Spring | IMERGF-V3 | 0.48 | 0.72 | 0.88 | 0.64 | 0.94 | 0.95 | 0.66 | 0.91 |
| IMERGF-V4 | 0.48 | 0.67 | 0.83 | 0.37 | 0.95 | 0.93 | 0.70 | 0.89 | ||
| GSMaP | 0.70 | 0.92 | 0.93 | 0.69 | 0.95 | 0.95 | 0.80 | 0.91 | ||
| Summer | IMERGF-V3 | 0.46 | 0.85 | 0.88 | 0.75 | 0.83 | 0.79 | 0.35 | 0.62 | |
| IMERGF-V4 | 0.26 | 0.73 | 0.86 | 0.71 | 0.81 | 0.85 | 0.32 | 0.64 | ||
| GSMaP | 0.72 | 0.91 | 0.92 | 0.74 | 0.79 | 0.84 | 0.79 | 0.71 | ||
| Autumn | IMERGF-V3 | 0.72 | 0.74 | 0.87 | 0.80 | 0.89 | 0.84 | 0.80 | 0.83 | |
| IMERGF-V4 | 0.61 | 0.78 | 0.88 | 0.81 | 0.88 | 0.86 | 0.83 | 0.84 | ||
| GSMaP | 0.76 | 0.87 | 0.94 | 0.81 | 0.93 | 0.89 | 0.90 | 0.92 | ||
| Winter | IMERGF-V3 | 0.40 | 0.40 | 0.23 | 0.35 | 0.93 | 0.91 | 0.78 | 0.62 | |
| IMERGF-V4 | 0.29 | 0.38 | 0.07 | 0.13 | 0.92 | 0.94 | 0.83 | 0.49 | ||
| GSMaP | 0.82 | 0.56 | 0.33 | 0.43 | 0.94 | 0.96 | 0.85 | 0.80 | ||
| FSE | Spring | IMERGF-V3 | 0.83 | 0.69 | 0.28 | 0.30 | 0.27 | 0.41 | 1.09 | 0.51 |
| IMERGF-V4 | 0.85 | 0.86 | 0.31 | 0.44 | 0.26 | 0.38 | 1.05 | 0.53 | ||
| GSMaP | 0.76 | 0.52 | 0.23 | 0.38 | 0.24 | 0.30 | 0.91 | 0.43 | ||
| Summer | IMERGF-V3 | 0.81 | 0.64 | 0.46 | 0.44 | 0.44 | 0.52 | 1.48 | 0.70 | |
| IMERGF-V4 | 0.84 | 1.24 | 0.46 | 0.49 | 0.45 | 0.47 | 1.52 | 0.63 | ||
| GSMaP | 0.57 | 0.49 | 0.35 | 0.33 | 0.41 | 0.47 | 1.07 | 0.53 | ||
| Autumn | IMERGF-V3 | 0.56 | 0.58 | 0.33 | 0.33 | 0.39 | 0.35 | 0.58 | 0.59 | |
| IMERGF-V4 | 0.76 | 0.82 | 0.34 | 0.27 | 0.33 | 0.32 | 0.61 | 0.57 | ||
| GSMaP | 0.63 | 0.42 | 0.25 | 0.26 | 0.28 | 0.29 | 0.40 | 0.43 | ||
| Winter | IMERGF-V3 | 0.61 | 0.94 | 0.52 | 0.42 | 0.19 | 0.28 | 0.50 | 0.41 | |
| IMERGF-V4 | 0.73 | 1.08 | 0.57 | 0.54 | 0.21 | 0.27 | 0.50 | 0.45 | ||
| GSMaP | 0.47 | 0.52 | 0.47 | 0.35 | 0.16 | 0.21 | 0.38 | 0.28 |
References
- Arkin, P.A.; Xie, P. The Global Precipitation Climatology Project: First Algorithm Intecomparison Project. Bull. Am. Meteorol. Soc. 1994, 75, 401–419. [Google Scholar] [CrossRef]
- Bitew, M.M.; Gebremichael, M.; Gebremichael, L.T.; Bayissa, Y.A. Evaluation of high-resolution satellite rainfall products through streamflow simulation in a hydrological modeling of a small mountainous watershed in Ethiopia. J. Hydrometeorol. 2012, 13, 338–350. [Google Scholar] [CrossRef]
- Chintalapudi, S.; Sharif, H.O.; Xie, H.J. Sensitivity of distributed hydrologic simulations to ground and satellite based rainfall products. Water 2014, 6, 1221–1245. [Google Scholar] [CrossRef]
- Hong, Y.; Adler, R.F.; Negri, A.; Huffman, G.J. Flood and landslide applications of near real-time satellite rainfall products. Nat. Hazards 2007, 43, 285–294. [Google Scholar] [CrossRef]
- Kidd, C.; Bauer, P.; Turk, J.; Braithwaite, D. Intercomparison of high-resolution precipitation products over Northwest Europe. J. Hydrometeorol. 2012, 13, 67–83. [Google Scholar] [CrossRef]
- Sahlu, D.; Nikolopoulos, E.; Moges, E.; Anagnostou, E.; Hailu, D. First evaluation of the Integrated Multi-satellitE Retireval for GPM Day-1 IMERG over the upper Blue Nile Basin. J. Hydrometeorol. 2016. [Google Scholar] [CrossRef]
- Wang, H.L.; Guan, H.D.; Gutiérrez-Jurado, H.A.; Simmons, C.T. Examination of water budget using satellite products over Australia. J. Hydrol. 2014, 511, 546–554. [Google Scholar] [CrossRef]
- Zhang, W.J.; Zhang, Y.J.; Zhou, X.J. Lightning activity and precipitation characteristics of typhoon Molave around its landfall. Acta Meteorol. Sin. 2009, 27, 742–757. [Google Scholar] [CrossRef]
- Habib, E.; Haile, A.T.; Tian, Y.; Joyce, R.J. Evaluation of the high-resolution CMORPH satellite rainfall product using dense rain gauge observations and radar-based estimates. J. Hydrometeorol. 2012, 13, 1784–1798. [Google Scholar] [CrossRef]
- Khan, S.I.; Adhikari, P.; Hong, Y.; Vergara, H.; Aldler, R.F.; Policelli, F.; Irwin, D.; Korme, T.; Okello, L. Hydroclimatology of Lake Victoria region using hydrologic model and satellite remote sensing data. Hydrol. Earth Syst. Sci. 2011, 15, 107–117. [Google Scholar] [CrossRef]
- Khan, S.I.; Hong, Y.; Wang, J.H.; Yilmaz, K.K.; Gourley, J.J.; Adler, R.F.; Brakenridge, G.R.; Policelli, F.; Habib, S.; Irwin, D. Satellite remote sensing and hydrologic modeling for flood inundation mapping in Lake Victoria basin: Implications for hydrologic prediction in ungauged basins. IEEE Trans. Geosci. Remote Sens. 2011, 49, 85–95. [Google Scholar] [CrossRef]
- Zappa, M.; Fundel, F.; Jaun, S. A ‘Peak-Box’ approach for supporting interpretation and verification of operational ensemble peak-flow forecasts. Hydrol. Process. 2013, 27, 117–131. [Google Scholar] [CrossRef]
- Zhang, Y.; Hong, Y.; Wang, X.G.; Gourley, J.J.; Xue, X.W.; Saharia, M.; Ni, G.; Wang, G.; Huang, Y.; Chen, S.; et al. Hydrometeorological analysis and remote sensing of extremes: Was the July 2012 Beijing flood event detectable and predictable by Global Satellite Observing and Global Weather Modeling Systems? Am. Meteorol. Soc. 2015, 16, 381–395. [Google Scholar] [CrossRef]
- Ciach, G.J.; Krajewski, W.F.; Villarini, G. Product-error-driven uncertainty model for probabilistic quantitative precipitation estimation with NEXRAD data. J. Hydrometeorol. 2007, 8, 1325–1347. [Google Scholar] [CrossRef]
- Duan, Z.; Liu, J.; Tuo, Y.; Chiogna, C.; Disse, M. Evaluation of eight high spatial resolution gridded precipitation products in Adige Basin (Italy) at multiple temporal and spatial scales. Sci. Total Environ. 2016, 573, 1536–1553. [Google Scholar] [CrossRef] [PubMed]
- Ebert, E.E.; Janowiak, J.E.; Kidd, C. Comparison of near-real-time precipitation estimates from satellite observations and numerical models. Bull. Am. Meteorol. Soc. 2007, 88, 47–64. [Google Scholar] [CrossRef]
- Lo Conti, F.; Hsu, K.L.; Noto, L.V.; Sorooshian, S. Evaluation and comparison of satellite precipitation estimates with reference to local area in the Mediteranean Sea. Atmos. Res. 2014, 138, 189–204. [Google Scholar] [CrossRef]
- Jiang, S.H.; Zhou, M.; Ren, L.L.; Cheng, X.R.; Zhang, P.J. Evaluation of latest TMPA and CMORPH satellite precipitation products over Yellow River Basin. Water Sci. Eng. 2016, 9, 87–96. [Google Scholar] [CrossRef]
- Mei, Y.W.; Anagnostou, E.N.; Nikolopoulos, E.I.; Borga, M. Error analysis of satellite precipitation products in mountainous basins. J. Hydrometeorol. 2014, 15, 1778–1793. [Google Scholar] [CrossRef]
- Nan, Z.T.; Wang, S.G.; Liang, X.; Adams, T.E.; Teng, W.; Liang, Y. Analysis of spatial similarities between NEXRAD and NLDAS precipitation data products. IEEE Sel. Top. Appl. Earth Obs. Remote Sens. 2010, 3, 371–385. [Google Scholar] [CrossRef]
- Ning, S.W.; Wang, J.; Jin, J.L.; Ishidaira, H. Assessment of the latest GPM-Era high-resolution satellite precipitation products by comparison with Observation Gauge Data over the Chinese Mainland. Water 2016, 8, 481. [Google Scholar] [CrossRef]
- Porcù, F.; Milani, L.; Petracca, M. On the uncertainties in validating satellite instantaneous rainfall estimates with raingauge operational network. Atmos. Res. 2014, 144, 73–81. [Google Scholar] [CrossRef]
- Schneebeli, M.; Dawes, N.; Lehning, M.; Berne, A. High-resolution vertical profiles of X-band polarimetric radar observables during snowfall in the Swiss Alps. J. Appl. Meteorol. Climatol. 2013, 52, 378–394. [Google Scholar] [CrossRef]
- Skofronick-Jackson, G.; Petersen, W.A.; Berg, W.; Kidd, C.F.; Stocker, E.; Kirschbaum, D.B.; Kakar, R.; Braun, S.A.; Huffman, G.J.; Iguchi, T.; et al. The Global Precipitation Measurement (GPM) mission for science and society. Bull. Am. Meteorol. Soc. 2016. [Google Scholar] [CrossRef]
- Kubota, T.; Seto, S.; Awaka, J.; Kida, S.; Oki, R. Evaluation of precipitation estimation by at-Launch codes of GPM/DPR algorithms using synthetic data from TRMM/PR observations. IEEE J. Sel. Top. Appl. Obs. Remote Sens. 2014, 7, 3931–3944. [Google Scholar] [CrossRef]
- Huffman, G.J.; Bolvin, D.T.; Braithwaite, D.; Hsu, K.; Joyce, R.; Xie, P. Algorithm Theoretical Basis Document (ATBD) Version 4.5 NASA Global Precipitation Measurement (GPM) Integrated Multi-satellitE Retrievals for GPM (IMERG). NASA, 2015. Available online: https://pmm.nasa.gov/index.php?q=data-access/downloads/gpm/IMERGAlgorithmTheoreticalBasisDocument(ATBD) (accessed on 11 June 2015).
- Huffman, G.J.; Bolvin, D.T.; Braithwaite, D.; Hsu, K.; Joyce, R.; Xie, P. Algorithm Theoretical Basis Document (ATBD) Version 4.4 for the NASA Global Precipitation Measurement (GPM) Integrated Multi-satellitE Retrievals for GPM (I-MERG). NASA, 2014. Available online: http:/pmm.nasa.gov/sites/default/files/document_files/IMERG_ATBD_V4.4.pdf (accessed on 26 April 2014).
- Yong, B.; Liu, D.; Gourley, J.J.; Tian, Y.D.; Huffman, G.J.; Ren, L.L.; Hong, Y. Global view of real-time TRMM multisatellite precipitation analysis: Implications for its successor global precipitation measurement mission. Bull. Am. Meteorol. Soc. 2015, 96, 283–296. [Google Scholar] [CrossRef]
- Huffman, G.J.; Adler, R.F.; Bolvin, D.T.; Gu, G.; Nelkin, E.J.; Bowman, K.P.; Hong, Y.; Stocker, E.F.; Wolff, D.B. The TRMM Multisatellite Precipitation Analysis (TMPA): Quasi-global, multiyear, combined-sensor precipitation estimates at fine scales. J. Hydrometeorol. 2007, 8, 38–55. [Google Scholar] [CrossRef]
- Joyce, R.J.; Xie, P. Kalman filter-based CMORPH. J. Hydrometeorol. 2011, 12, 1547–1563. [Google Scholar] [CrossRef]
- Hong, Y.; Hsu, K.L.; Sorooshian, S.; Gao, X.G. Precipitation estimation from remotely sensed imagery using an Artificial Neural Network Cloud Classification System. J. Appl. Meteorol. 2004, 43, 1834–1852. [Google Scholar] [CrossRef]
- Huffman, G.J.; Bolvin, D.T.; Braithwaite, D.; Hsu, K.; Joyce, R.; Kidd, C.; Nelkin, E.J.; Sorooshian, S.; Tan, J.; Xie, P. Algorithm Theoretical Basis Document (ATBD) Version 4.6 NASA Global Precipitation Measurement (GPM) Integrated Multi-satellitE Retrievals for GPM (IMERG). NASA, 2017. Available online: https://pmm.nasa.gov/index.php?q=data-access/downloads/gpm (accessed on 18 June 2017).
- Huffman, G.J.; Bolvin, D.T.; Nelkin, E.J.; Stocher, E.F. V04 IMERG Final Run Release Notes. NASA 1–2. 2017. Available online: https://pmm.nasa.gov/data-access/downloads/gpm/V04IMERGFinalRunReleaseNotes (accessed on 18 June 2017).
- Chen, F.R.; Li, X. Evaluation of IMERG and TRMM 3B43 monthly precipitation products over Mainland China. Remote Sens. 2016, 8, 472. [Google Scholar] [CrossRef]
- Guo, H.; Chen, S.; Bao, A.M.; Behrangi, A.L.; Hong, Y.; Ndayisaba, F.; Hu, J.; Phillip, M. Stepanian Early assessment of Integrated multi-satellitE Retrievals for Global Precipitation Measurement over China. Atmos. Res. 2016, 176–177, 121–133. [Google Scholar] [CrossRef]
- Li, N.; Tang, G.Q.; Zhao, P.; Hong, Y.; Gou, Y.B.; Yang, K. Statistical assessment and hydrological utility of the latest multi-satellite precipitation analysis IMERG in Ganjiang River basin. Atmos. Res. 2017, 183, 212–223. [Google Scholar] [CrossRef]
- Pakoksung, K.; Takagi, M. Effects of satellite based rainfall products on river basin responses of runoff simulation on flood event. Model. Earth Syst. Environ. 2016, 2, 143. [Google Scholar] [CrossRef]
- Prakash, S.; Mitra, A.K.; AghaKouchak, A.; Liu, Z.; Norouzi, H.; Pai, D.S. A preliminary assessment of GPM-based multi-satellite precipitation estimates over a monsoon dominated region. J. Hydrol. 2016. [Google Scholar] [CrossRef]
- Prakash, S.; Mitra, A.K.; Pai, D.S.; AghaKouchak, A. From TRMM to GPM: How well can heavy rainfall be detected from space? Adv. Water Resour. 2016, 88, 1–7. [Google Scholar] [CrossRef]
- Tang, G.Q.; Ma, Y.Z.; Long, D.; Zhong, L.Z.; Hong, Y. Evaluation of GPM Day-1 IMERG and TMPA Version-7 legacy products over Mainland China at multiple spatiotemporal scales. J. Hydrol. 2016, 533, 152–167. [Google Scholar] [CrossRef]
- Tang, G.Q.; Zeng, Z.Y.; Long, D.; Guo, X.L. Statistical and hydrological comparisons between TRMM and GPM Level-3 Products over a midlatitude basin: Is Day-1 IMERG a good successor for TMPA 3B42V7? Bull. Am. Meteorol. Soc. 2016, 7, 121–137. [Google Scholar] [CrossRef]
- Ushio, T.; Kubota, T.; Shige, S.; Okamoto, R.; Aonashi, K.; Inoue, T.; Takahashi, N.; Iguchi, T.; Kachi, M.; Oki, R.; et al. A Kalman filter approach to the Global Satellite Mapping of Precipitation (GSMaP) from combined passive microwave and infrared radiometric data. J. Meteorol. Soc. Jpn. 2009, 87A, 137–151. [Google Scholar] [CrossRef]
- Chen, S.; Hong, Y.; Cao, Q.; Gourley, J.J.; Kirstetter, P.E.; Yong, B.; Tian, Y.; Zhang, Z.; Shen, Y.; Hu, J.; et al. Similarity and difference of the two successive V6 and V7 TRMM multisatellite precipitation analysis performance over China. J. Geophys. Res. Atmos. 2013, 118, 13060–13074. [Google Scholar] [CrossRef]
- Shen, Y.; Xiong, A.; Wang, Y.; Xie, P. Performance of highresolution satellite precipitation products over China. J. Geophys. Res. 2010, 115, D02114. [Google Scholar] [CrossRef]
- Liang, J. Study of the Influences of Monsoon Gyres on Formation and Sudden Track Change of Typhoons. Master’s Thesis, College of Atmospheric Science, Nanjing University of Information Science & Technology, Nanjing, China, 2012. [Google Scholar]
- Bothe, O.; Fraedrich, K.; Zhu, X. Precipitation climate of central Asia and the large-scale atmospheric circulation. Theor. Appl. Climatol. 2012, 108, 345–354. [Google Scholar] [CrossRef]
- Shen, Y.; Feng, M.; Zhang, H.; Gao, F. Interpolationmethods of China daily precipitation data. J. Appl. Meteorol. Sci. 2010, 21, 279–281. (In Chinese) [Google Scholar]
- Tian, Y.; Peters-Lidard, C.; Eylander, J.; Joyce, R.; Huffman, G.; Adler, R.; Hsu, K.-L.; Turk, F.J.; Garcia, M.; Zeng, J. Component analysis of errors in satellitebased precipitation estimates. J. Geophys. Res. 2009, 114, D24101. [Google Scholar] [CrossRef]
- Hogan, R.J.; Ferro, C.A.T.; Jolliffe, I.T.; Stephenson, D.B. Equitability revisited: Why the “Equitable Threat Score” is not equitable. Weather Forecast. 2010, 25, 710–726. [Google Scholar] [CrossRef]
- Mu, J.L.; Li, Z.C.; Chen, Y.; Chen, X.P. Feature analyses of mesoscale convective system of a heavy rainfall in the Central Shaanxi Plain. Plateau Meteorol. 2014, 33, 148–161. (In Chinese) [Google Scholar]
- Hur, J.; Raghavan, S.V.; Nguyen, N.S.; Liong, S.Y. Evaluation of high-resolution satellite rainfall data over Singapore. Procedia Eng. 2016, 154, 158–167. [Google Scholar] [CrossRef]
- Amlien, J. Remote Sensing of Snow with Passive Microwave Radiometers: A Review of Current Algorithms; Report No. 1019; Norsk Regnesentral: Oslo, Norway, 2008; pp. 1–52. [Google Scholar]
- Scheel, M.L.M.; Rohrer, M.; Huggel, C.H.; Villar, D.S.; Silvestre, E.; Huffman, G.J. Evaluation of TRMM multi-satellite precipitation analysis (TMPA) performance in the central Andes region and its dependency on spatial and temporal resolution. Hydrol. Earth. Syst. Sci. 2011, 15, 2649–2663. [Google Scholar] [CrossRef] [Green Version]
- Hong, Y.; Gochis, D.; Cheng, J.; Hsu, K.; Sorooshian, S. Evaluation of PERSIANN-CCS rainfall measurement using the NAME event rain gauge network. J. Hydrometeorol. 2007, 8, 469–482. [Google Scholar] [CrossRef]
- Dinku, T.; Chidzambwa, S.; Ceccato, P.; Connor, S.J.; Ropelewski, C.F. Validation of high-resolution satellite rainfall products over complex terrain. Int. J. Remote Sens. 2008, 29, 4097–4110. [Google Scholar] [CrossRef]
- Li, X.H.; Zhang, Q.; Xu, C.Y. Assessing the performance of satellite-based precipitation products and its dependence on topography over Poyang Lake basin. Theor. Appl. Climatol. 2014, 115, 713–729. [Google Scholar] [CrossRef]
- Ning, S.W.; Song, F.; Udmale, P.; Jin, J.L.; Thapa, B.R.; Ishidaira, H. Error analysis and evaluation of the latest GSMap and IMERG precipitation products over Eastern China. Adv. Meteorol. 2017, 2017. [Google Scholar] [CrossRef]
- Adeyewa, Z.D.; Nakamura, K. Validation of TRMM radar rainfall data overmajor climatic regions in Africa. J. Appl. Meteorol. 2003, 42, 331–347. [Google Scholar] [CrossRef]
- Karaseva, M.O.; Prakash, S.; Gairola, R.M. Validation of high-resolution TRMM-3B43 precipitation product using rain gauge measurement over Kyrgyzstan. Theor. Appl. Climatol. 2012, 108, 147–157. [Google Scholar] [CrossRef]
- Taniguchi, A.; Shige, S.; Yamamoto, M.K.; Mega, T.; Kida, S.; Kubota, T.; Kachi, M.; Ushio, T.; Aonashi, K. Improvement of high-resolution satellite rainfall product for typhoon Morakot (2009) over Taiwan. J. Hydrometeorol. 2013, 14, 1859–1871. [Google Scholar] [CrossRef]
- Ferraro, R.R.; Smith, E.A.; Berg, W.; Huffman, G.J. A screening methodology for passive microwave precipitation retrieval algorithms. J. Atmos. Sci. 1998, 55, 1583–1600. [Google Scholar] [CrossRef]
- Tian, Y.; Peters-Lidard, C.D.; Choudhury, B.J.; Garcia, M. Multitemporal analysis of TRMM-based satellite precipitation products for land data assimilation applications. J. Hydrometeorol. 2007, 8, 1165–1183. [Google Scholar] [CrossRef]
- Xie, P.P.; Arkin, P.A. An intercomparison of gauge observations and satellite estimates on monthly precipitation. J. Appl. Meteorol. Climatol. 1995, 34, 1143–1160. [Google Scholar] [CrossRef]
- Li, Z.; Yang, D.W.; Hong, Y. Multi-scale evaluation of high-resolution multi-sensor blended global precipitation products over the Yangtze River. J. Hydrol. 2013, 500, 157–169. [Google Scholar] [CrossRef]
- Villarini, G.; Krajewski, W.F. Review of the different sources of uncertainty in single polarization radar-based estimates of rainfall. Surv. Geophys. 2010, 31, 107–129. [Google Scholar] [CrossRef]
- Kirstetter, P.E.; Hong, Y.; Gourley, J.; Schwaller, M.; Petersen, W.; Zhang, J. Comparison of TRMM 2A25 products, Version 6 and Version 7 with NOAA/NSSL ground radar-based National Mosaic QPE. J. Hydrometeorol. 2013, 14, 661–669. [Google Scholar] [CrossRef]
- Chen, S.; Liu, H.J.; You, Y.L.; Mullens, E.; Hu, J.J.; Yuan, Y.; Huang, M.; He, L.; Luo, Y.; Zeng, X.; et al. Evaluation of high-resolution precipitation estimates from satellites during July 2012 Beijing flood event using dense rain gauge observations. PLoS ONE 2014, 9, e89681. [Google Scholar] [CrossRef] [PubMed]
- Chen, Z.Q.; Qin, Y.X.; Shen, Y.; Zhang, S.P. Evaluation of Global Satellite Mapping of Precipitation project daily precipitation estimates over the Chinese mainland. Adv. Meteorol. 2016, 2016. [Google Scholar] [CrossRef]
- Adler, R.; Sapiano, M.; Huffman, G.; Bolvin, D.; Gu, G.; Wang, J.; Nelkin, E.; Xie, P.; Chiu, L.; Ferraro, R.; et al. The New Version 2.3 of the Global Precipitation Climatology Project (GPCP) Monthly Analysis Product. 2016. Available online: http://eagle1.umd.edu/GPCP_ICDR/GPCPmonthlyV2.3.pdf (accessed on 20 July 2016).
- National Aeronautics and Space Administration (NASA). Algorithm Theoretical Basis Document Global Precipitation Measurement (GPM) MISSION. 2017. Available online: http://rain.atmos.colostate.edu/ATBD/ATBD_GPM_June1_2017.pdf (accessed on 1 July 2017).
- National Aeronautics and Space Administration (NASA). Release Notes for GPROF V5 Public Release; NASA: Washington, DC, USA, 2017.
- Japan Aerospace Exploration Agency (JAXA). Caveat for Use of GPM Global Rainfall Map (GPM-GSMaP). 2017. Available online: http://sharaku.eorc.jaxa.jp/GSMaP/index.htm (accessed on 17 June 2017).
Figure 1.
Distribution of sub-regions in China.

Figure 2.
Spatial patterns of annual daily average difference precipitation for gauge-observed and satellite-based datasets from March 2014 to February 2015 (mm/day).
Figure 2.
Spatial patterns of annual daily average difference precipitation for gauge-observed and satellite-based datasets from March 2014 to February 2015 (mm/day).
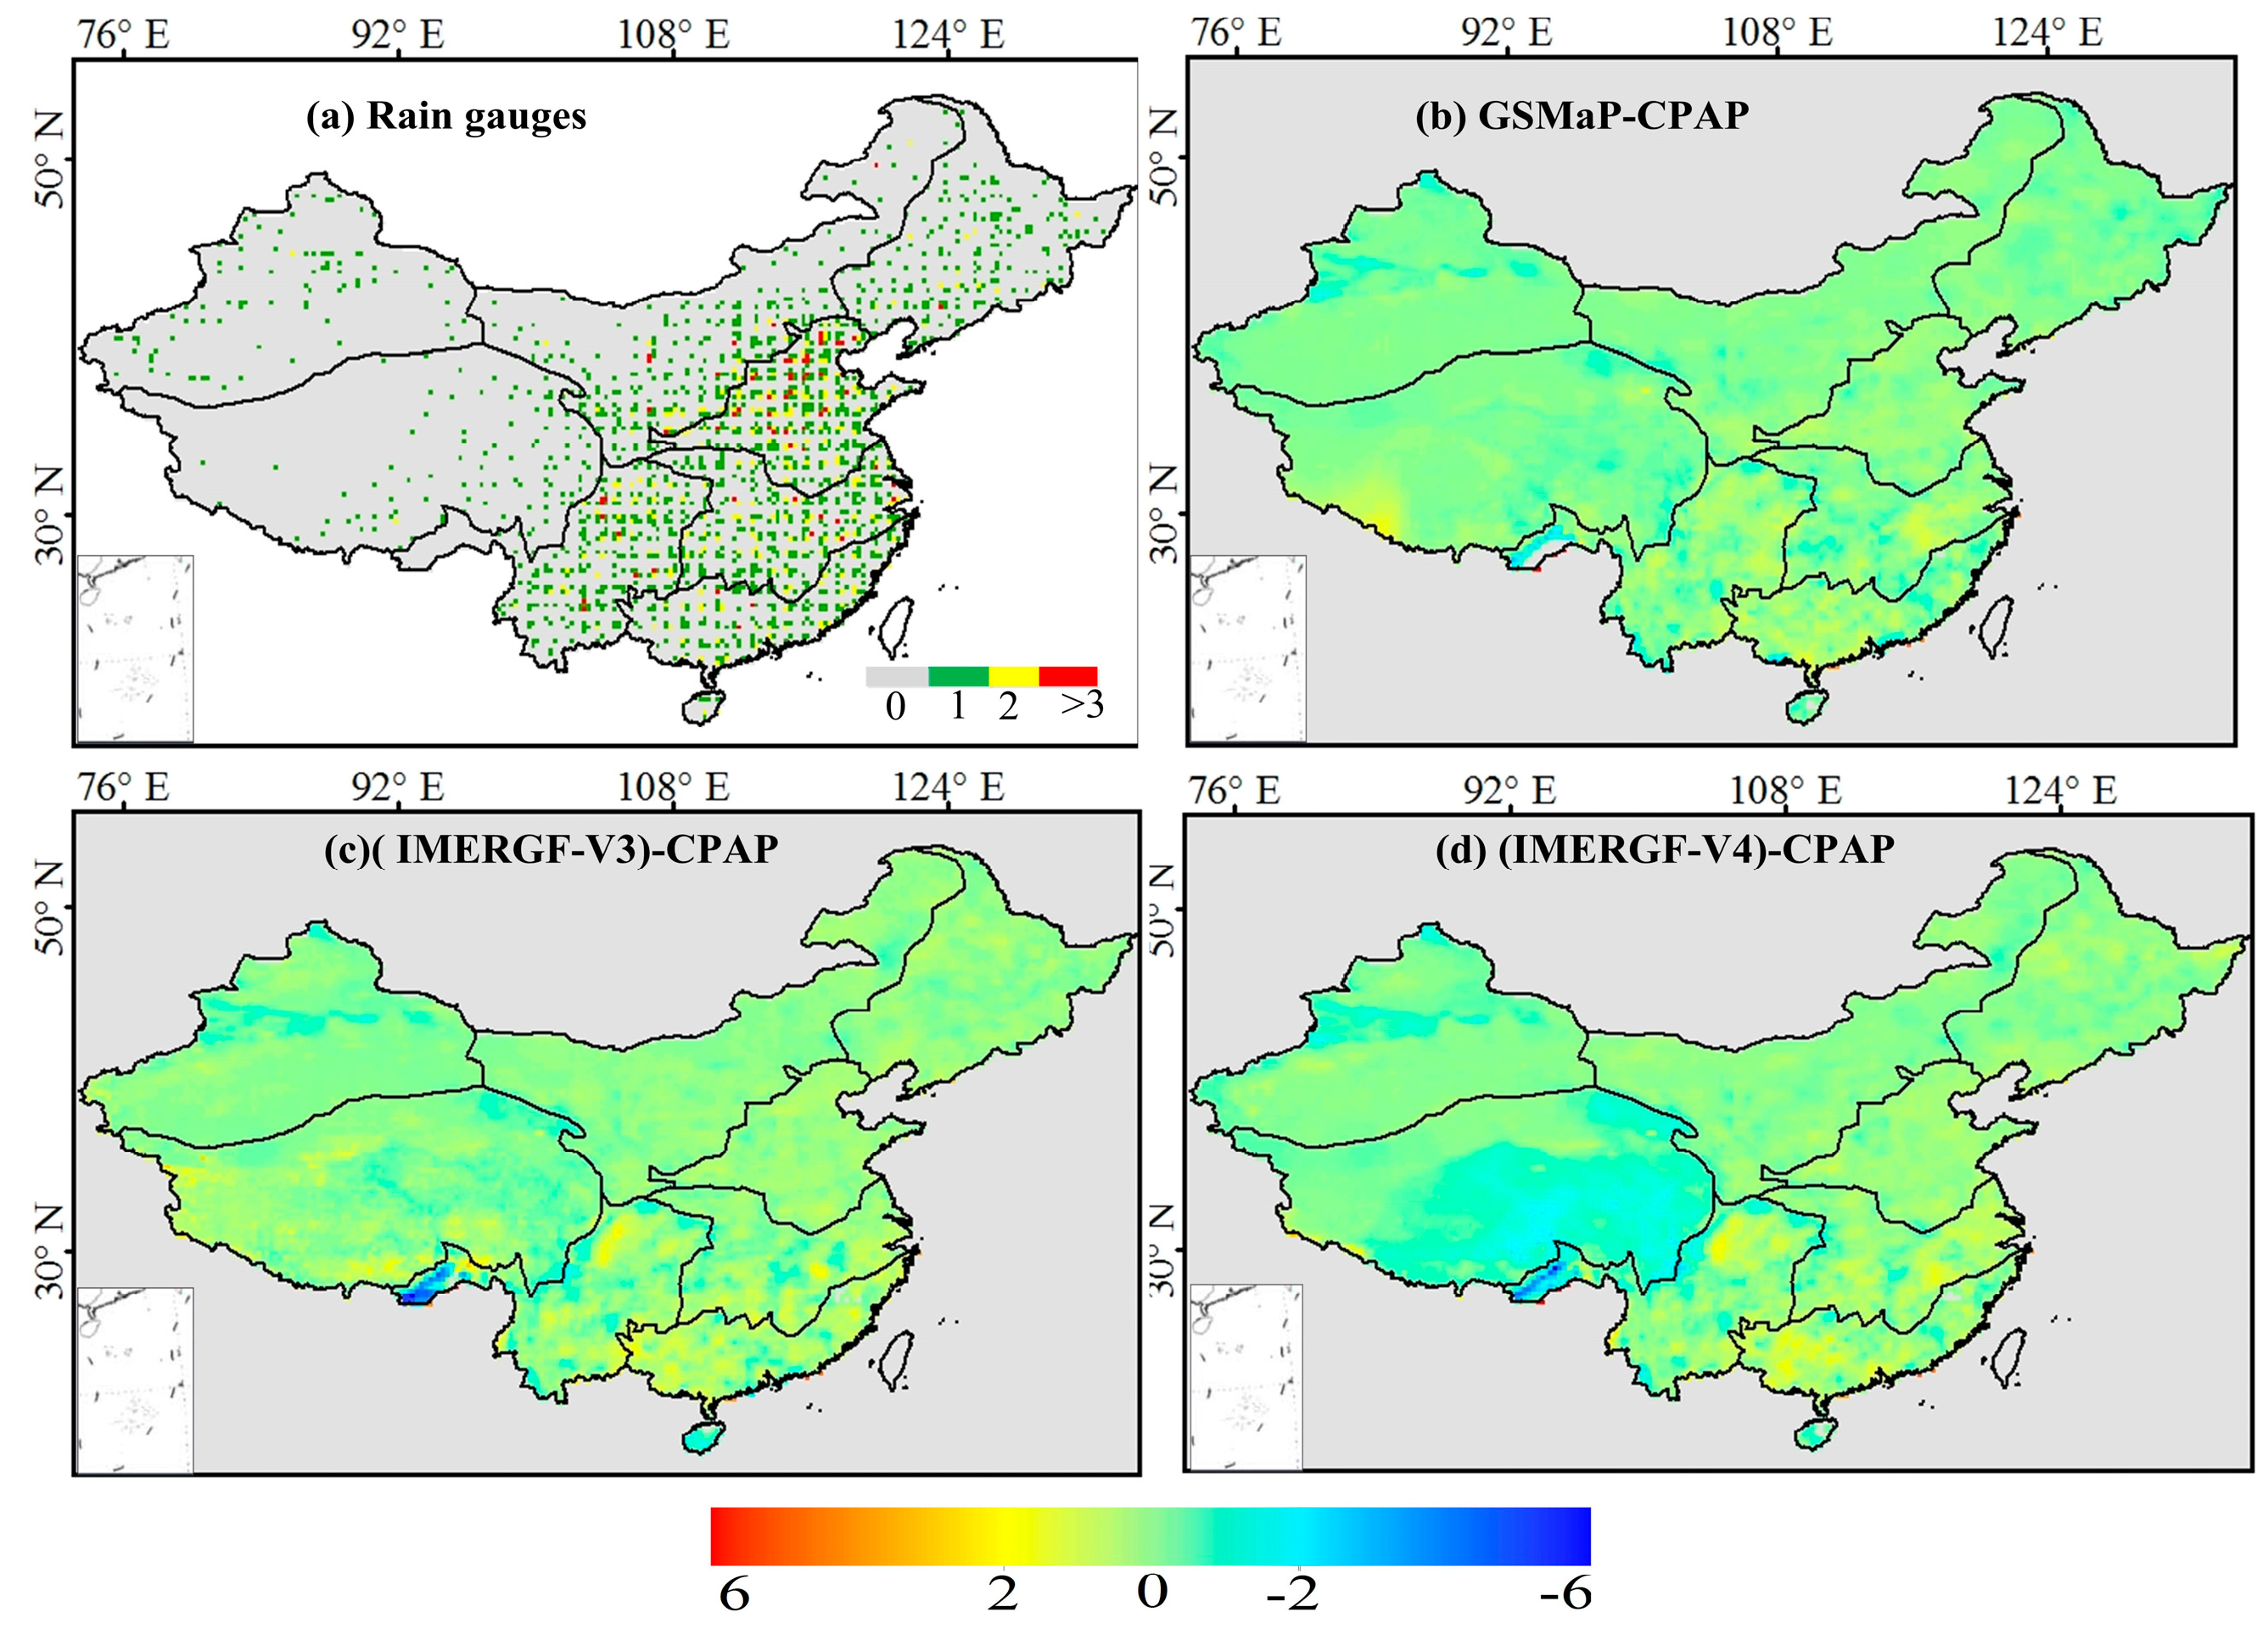
Figure 3.
(a) represents the RMSE, CC, FSE and RB between annual daily average IMERGF-V3 and CPAP. (b) represents the RMSE, CC, FSE and RB between annual daily average IMERGF-V4 and CPAP. (c) represents the RMSE, CC, FSE and RB between annual daily average GSMap and CPAP.
Figure 3.
(a) represents the RMSE, CC, FSE and RB between annual daily average IMERGF-V3 and CPAP. (b) represents the RMSE, CC, FSE and RB between annual daily average IMERGF-V4 and CPAP. (c) represents the RMSE, CC, FSE and RB between annual daily average GSMap and CPAP.

Figure 4.
Seasonal daily average precipitation distributions over mainland China for the IMERGF-V3, IMERGF-V4, GSMaP, and CPAP products from March 2014 to February 2015 (a–p).
Figure 4.
Seasonal daily average precipitation distributions over mainland China for the IMERGF-V3, IMERGF-V4, GSMaP, and CPAP products from March 2014 to February 2015 (a–p).

Figure 5.
Scatterplots of seasonal daily average precipitation for the IMERGF-V3, IMERGF-V4, and GSMaP products versus CPAP from March 2014 to February 2015 (a–l).
Figure 5.
Scatterplots of seasonal daily average precipitation for the IMERGF-V3, IMERGF-V4, and GSMaP products versus CPAP from March 2014 to February 2015 (a–l).
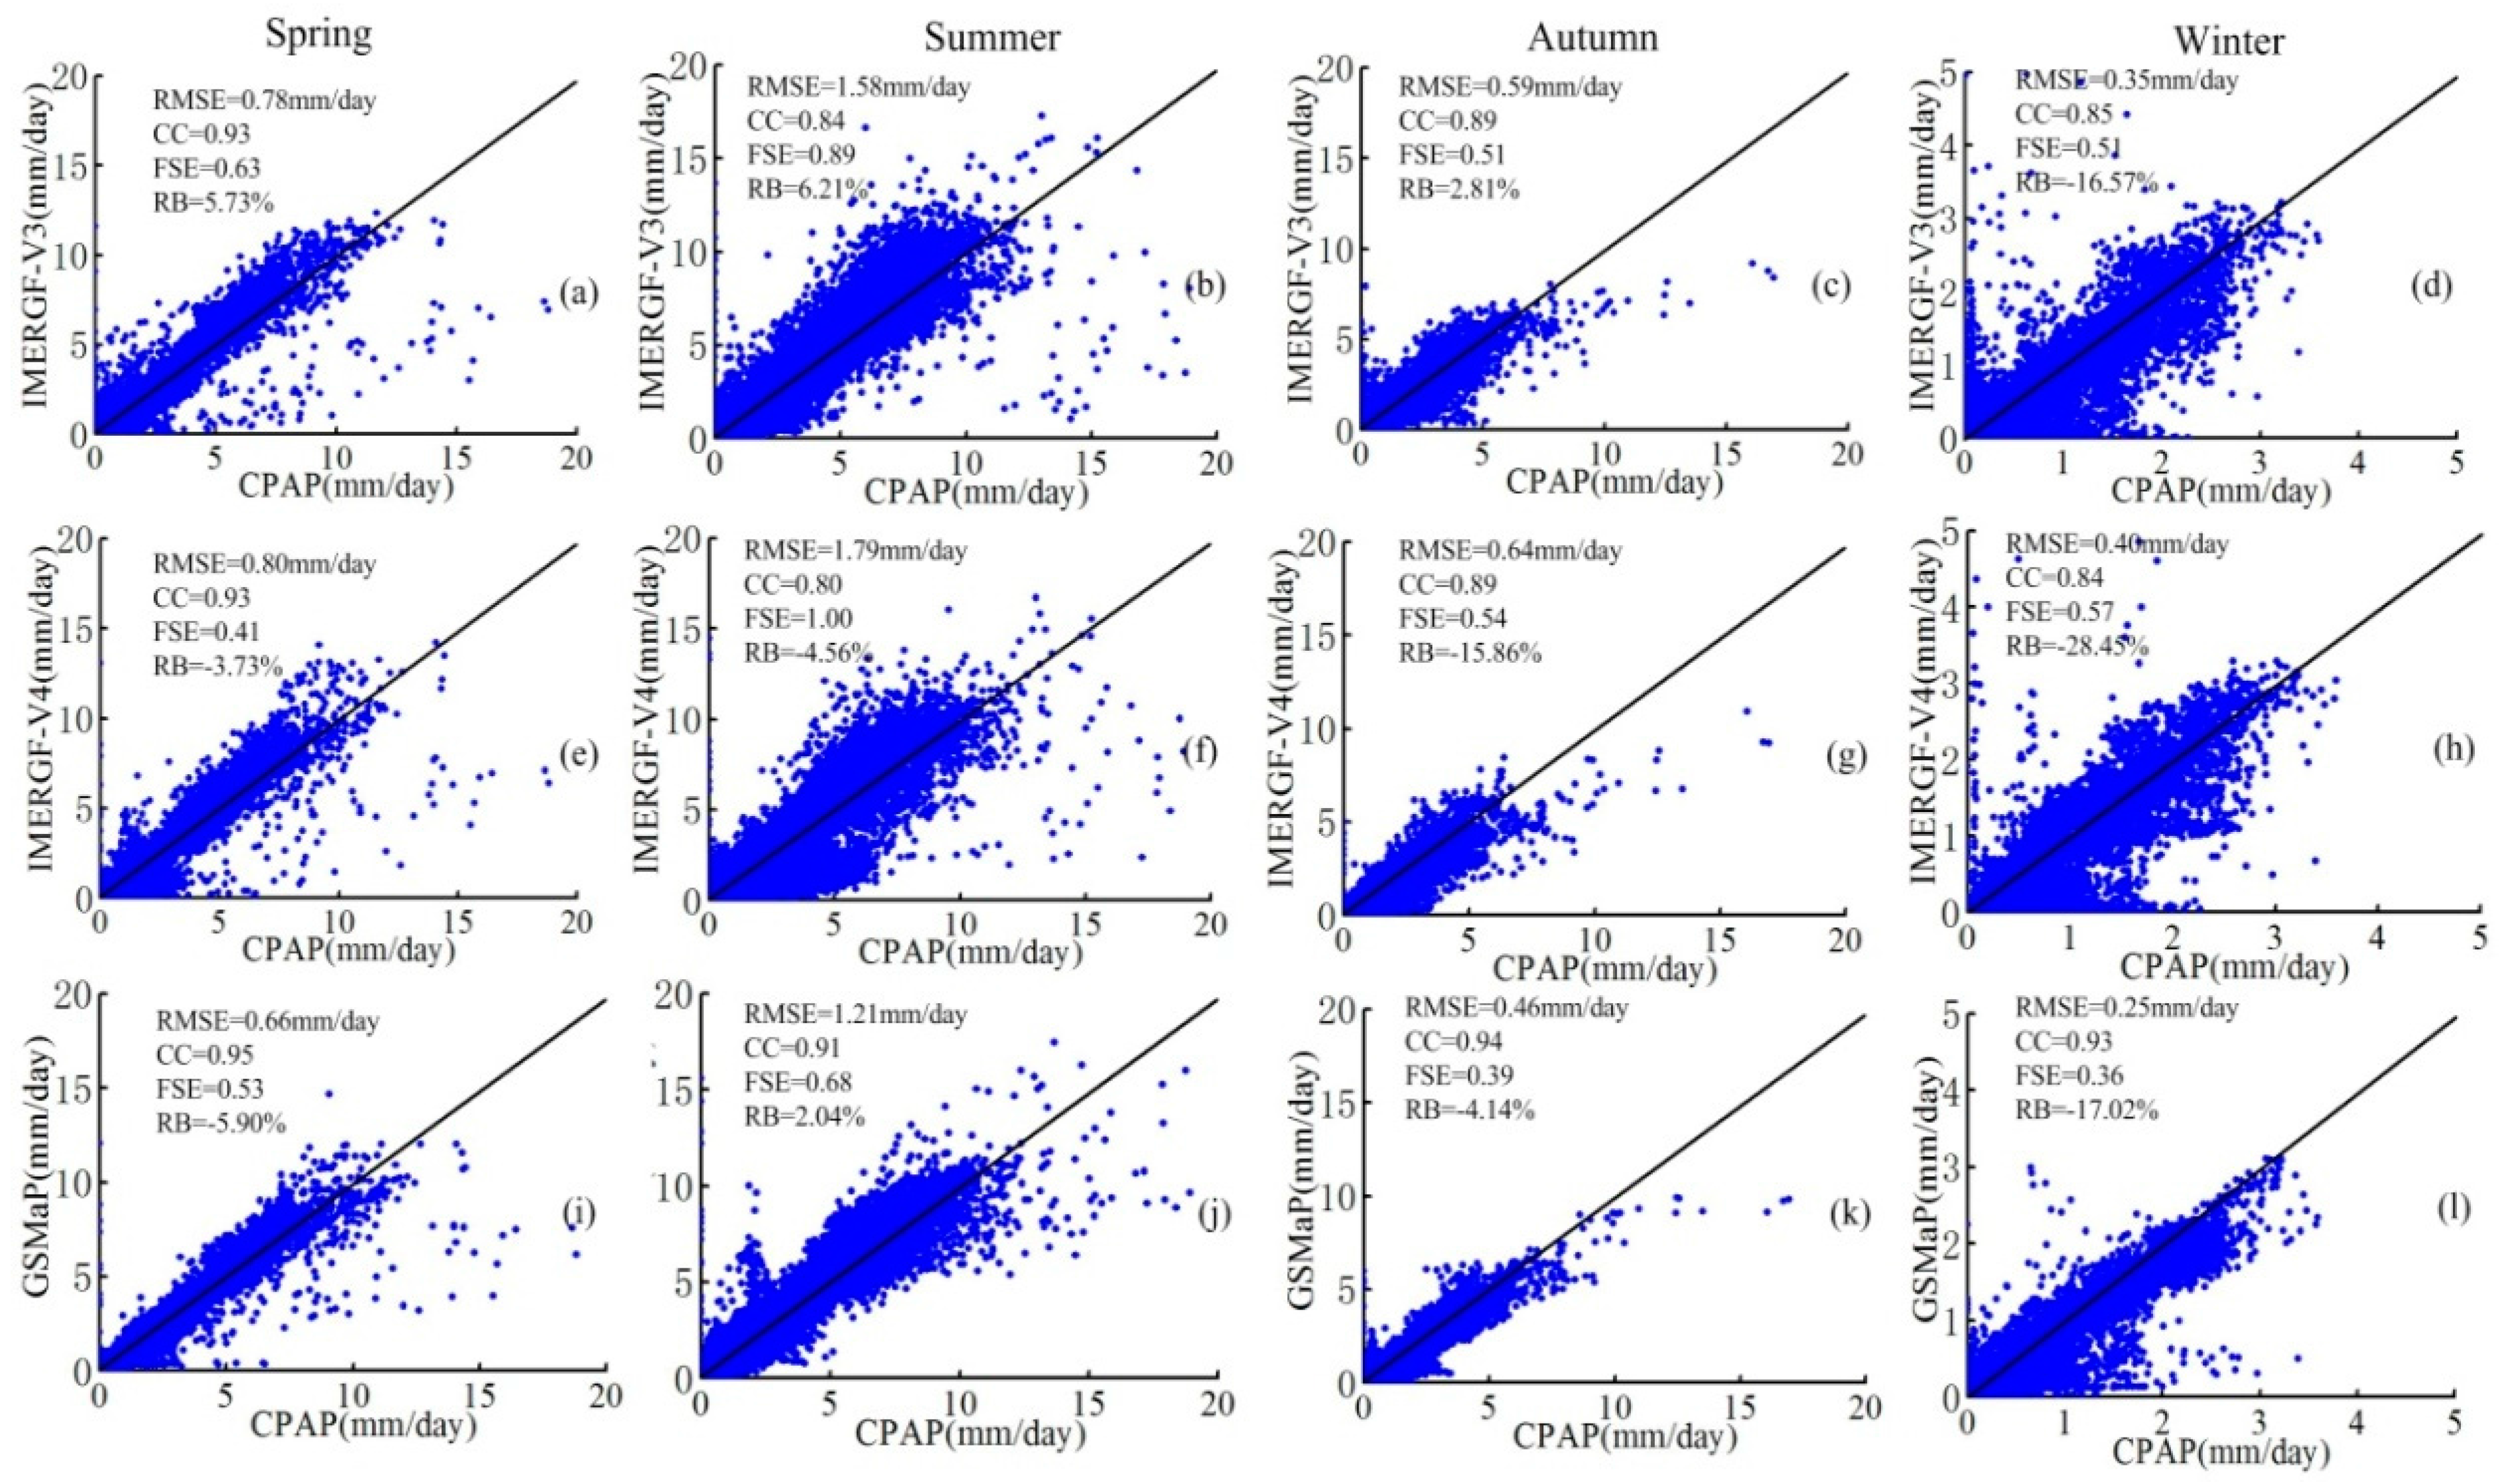
Figure 6.
Daily bias, correlation coefficient (CC) and root-mean-square error (RMSE) between CPAP and three satellite-based precipitation products over China and the eight sub-regions from March 2014 to February 2015. (a–c) represents the BIAS, CC and RMSE over china. (d,g,j,m,p,s,v,y) represents the Bias values over eight sub-regions, (e,h,k,n,q,t,w,z) represents the CC values over eight sub-regions, (f,i,l,o,r,u,x,A) represents the RMSE values over eight sub-regions, respectively. Only grid pairs with values of both CPAP and satellite-based precipitation above zero are used.

Figure 7.
Probability distribution function (PDFc) of daily rainfall for specific rainfall intensity bins over mainland China and eight sub-regions from March 2014 to February 2015. (a) represents the PDFc over China and (b–i) represents the PDFc distributions over eight sub-regions, respectively.
Figure 7.
Probability distribution function (PDFc) of daily rainfall for specific rainfall intensity bins over mainland China and eight sub-regions from March 2014 to February 2015. (a) represents the PDFc over China and (b–i) represents the PDFc distributions over eight sub-regions, respectively.

Figure 8.
PDFv of daily rainfall for specific rainfall intensity bins over mainland China and eight sub-regions from March 2014 to February 2015. (a) represents the PDFv over China and (b–i) represents the PDFv distributions over eight sub-regions, respectively.
Figure 8.
PDFv of daily rainfall for specific rainfall intensity bins over mainland China and eight sub-regions from March 2014 to February 2015. (a) represents the PDFv over China and (b–i) represents the PDFv distributions over eight sub-regions, respectively.
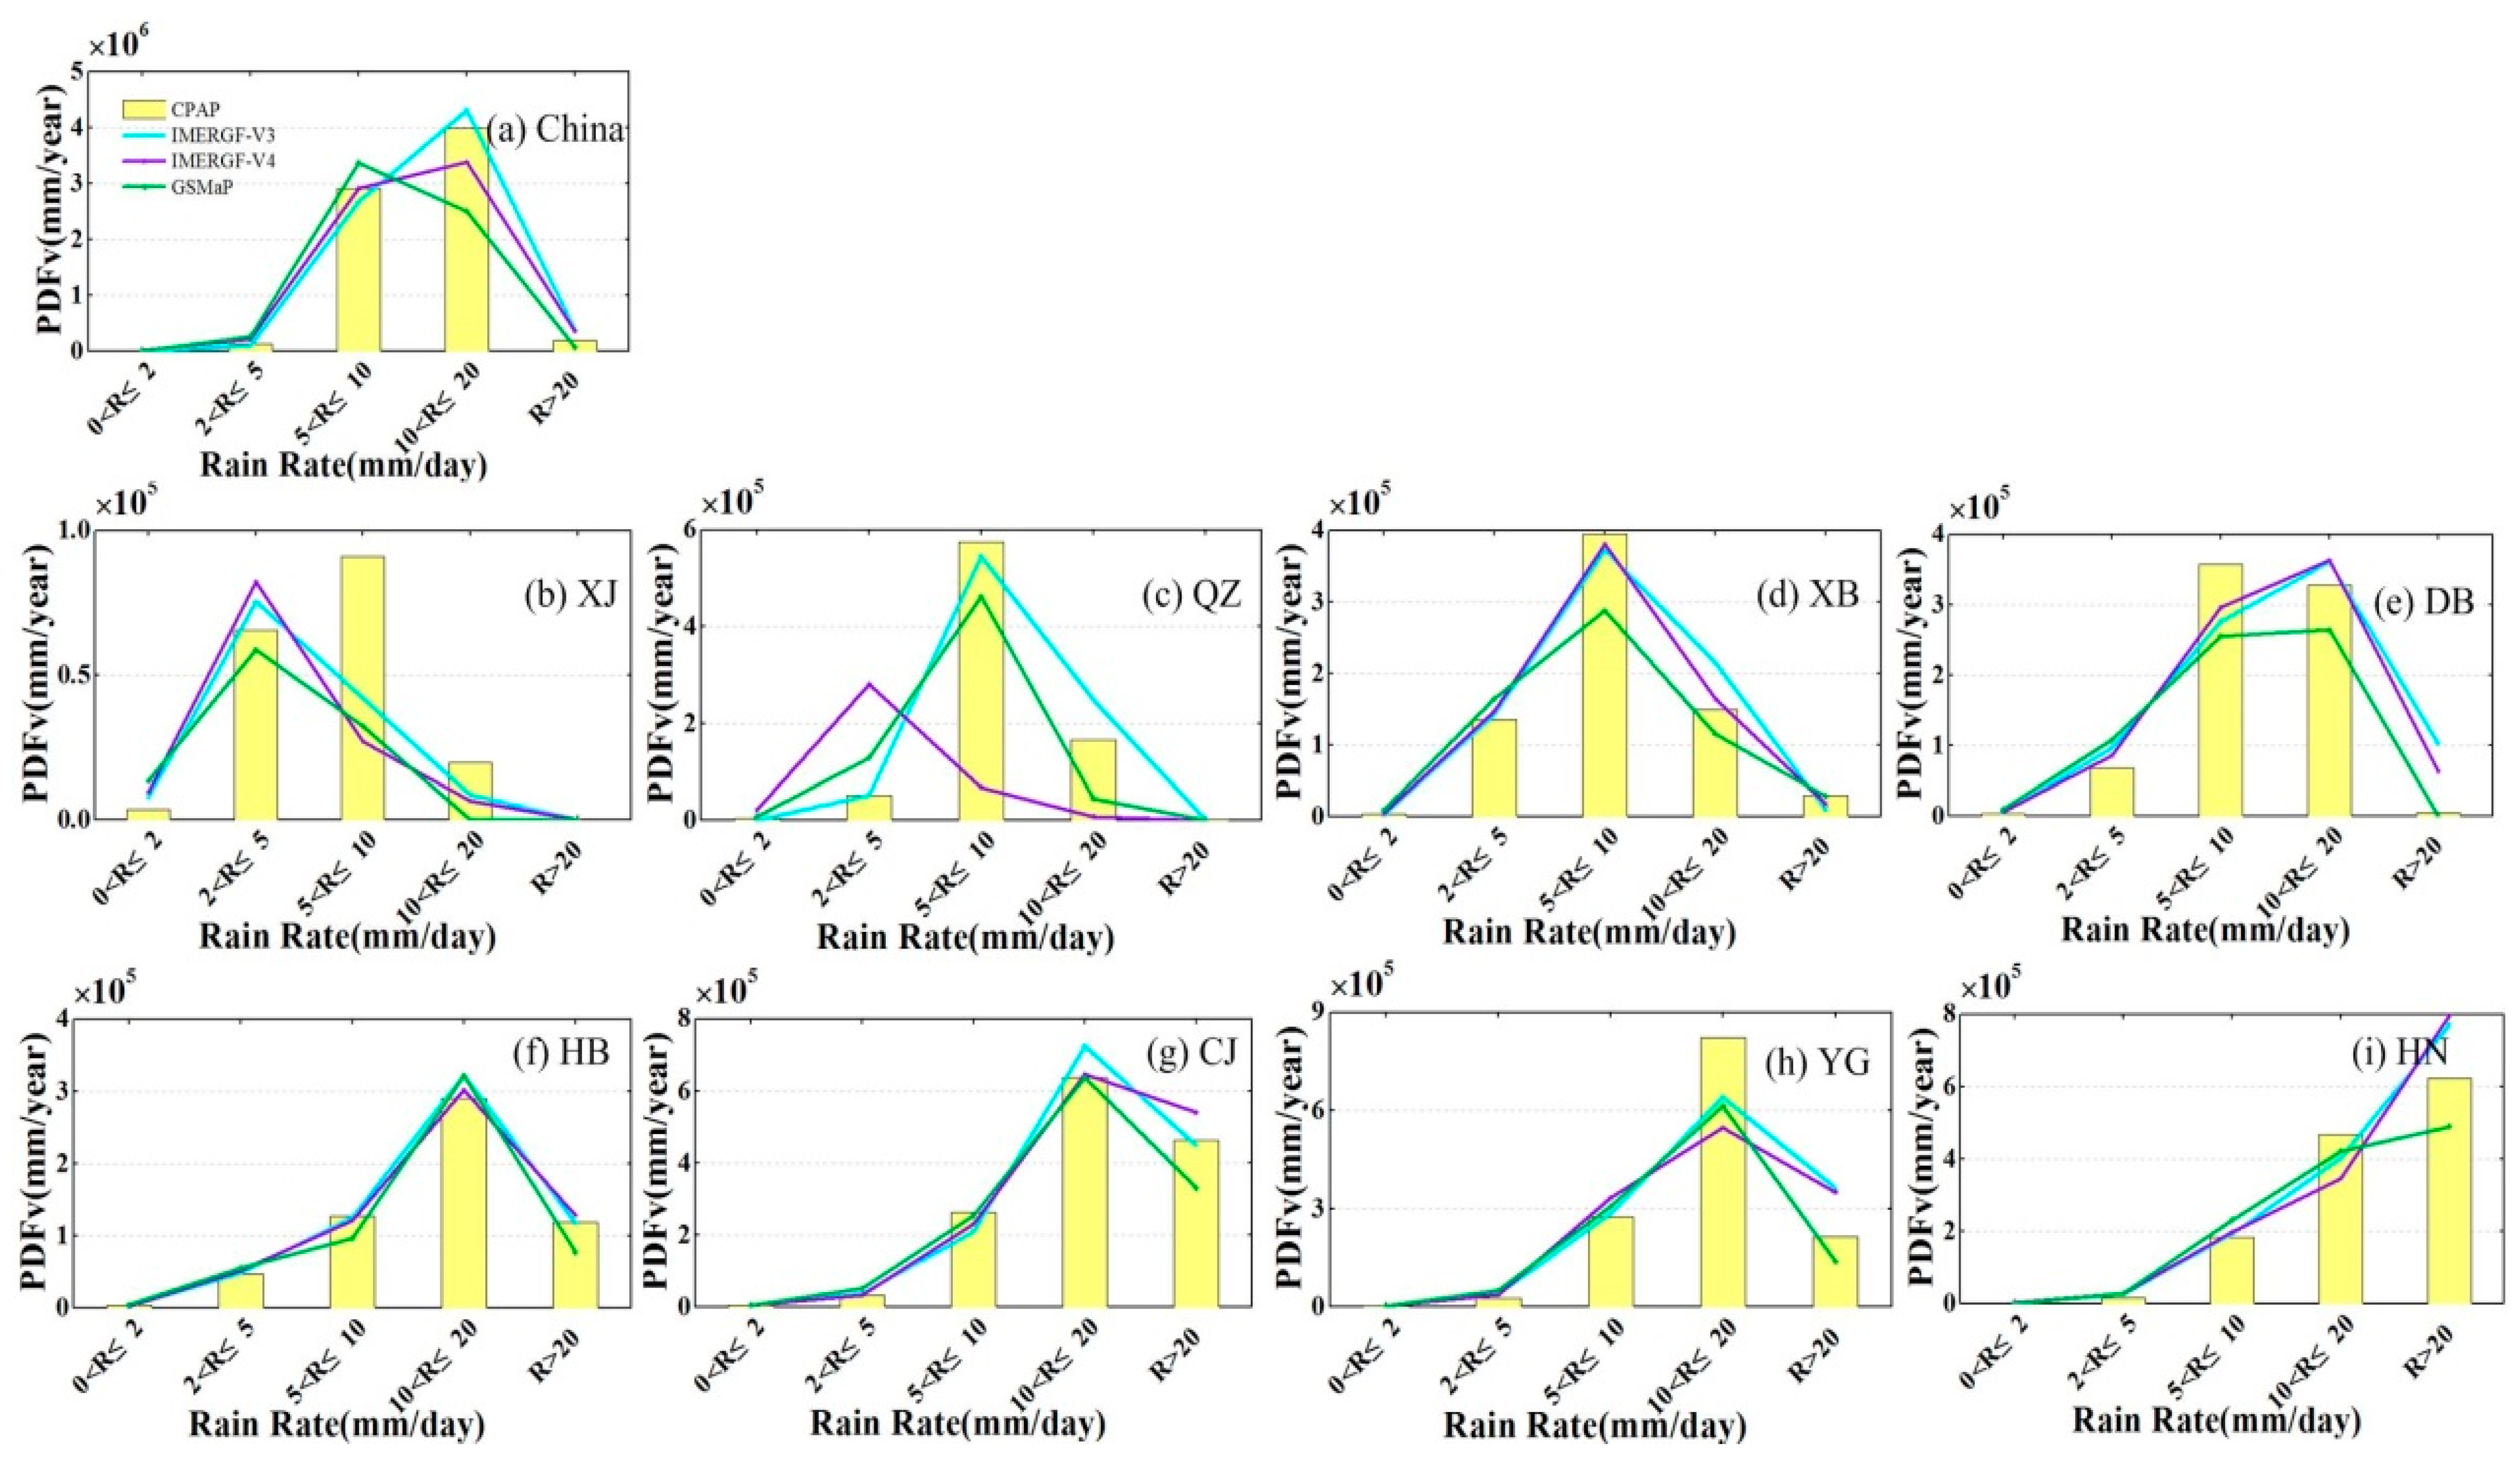
Figure 9.
Contingency statistics of daily rainfall for the IMERGF-V3, IMERGF-V4, and GSMaP products compared to CPAP over mainland China and eight sub-regions for 2014. Daily rainfall volumes below 0.5 mm are considered no-rain events.
Figure 9.
Contingency statistics of daily rainfall for the IMERGF-V3, IMERGF-V4, and GSMaP products compared to CPAP over mainland China and eight sub-regions for 2014. Daily rainfall volumes below 0.5 mm are considered no-rain events.
© 2017 by the authors. Licensee MDPI, Basel, Switzerland. This article is an open access article distributed under the terms and conditions of the Creative Commons Attribution (CC BY) license (http://creativecommons.org/licenses/by/4.0/).
Share and Cite
MDPI and ACS Style
Zhao, H.; Yang, S.; You, S.; Huang, Y.; Wang, Q.; Zhou, Q. Comprehensive Evaluation of Two Successive V3 and V4 IMERG Final Run Precipitation Products over Mainland China. Remote Sens. 2018, 10, 34. https://doi.org/10.3390/rs10010034
AMA Style
Zhao H, Yang S, You S, Huang Y, Wang Q, Zhou Q. Comprehensive Evaluation of Two Successive V3 and V4 IMERG Final Run Precipitation Products over Mainland China. Remote Sensing. 2018; 10(1):34. https://doi.org/10.3390/rs10010034
Chicago/Turabian StyleZhao, Haigen, Shengtian Yang, Songcai You, Yingchun Huang, Qianfeng Wang, and Qiuwen Zhou. 2018. "Comprehensive Evaluation of Two Successive V3 and V4 IMERG Final Run Precipitation Products over Mainland China" Remote Sensing 10, no. 1: 34. https://doi.org/10.3390/rs10010034
Note that from the first issue of 2016, this journal uses article numbers instead of page numbers. See further details here.