Can Satellite Precipitation Products Estimate Probable Maximum Precipitation: A Comparative Investigation with Gauge Data in the Dadu River Basin


Abstract
:
1. Introduction
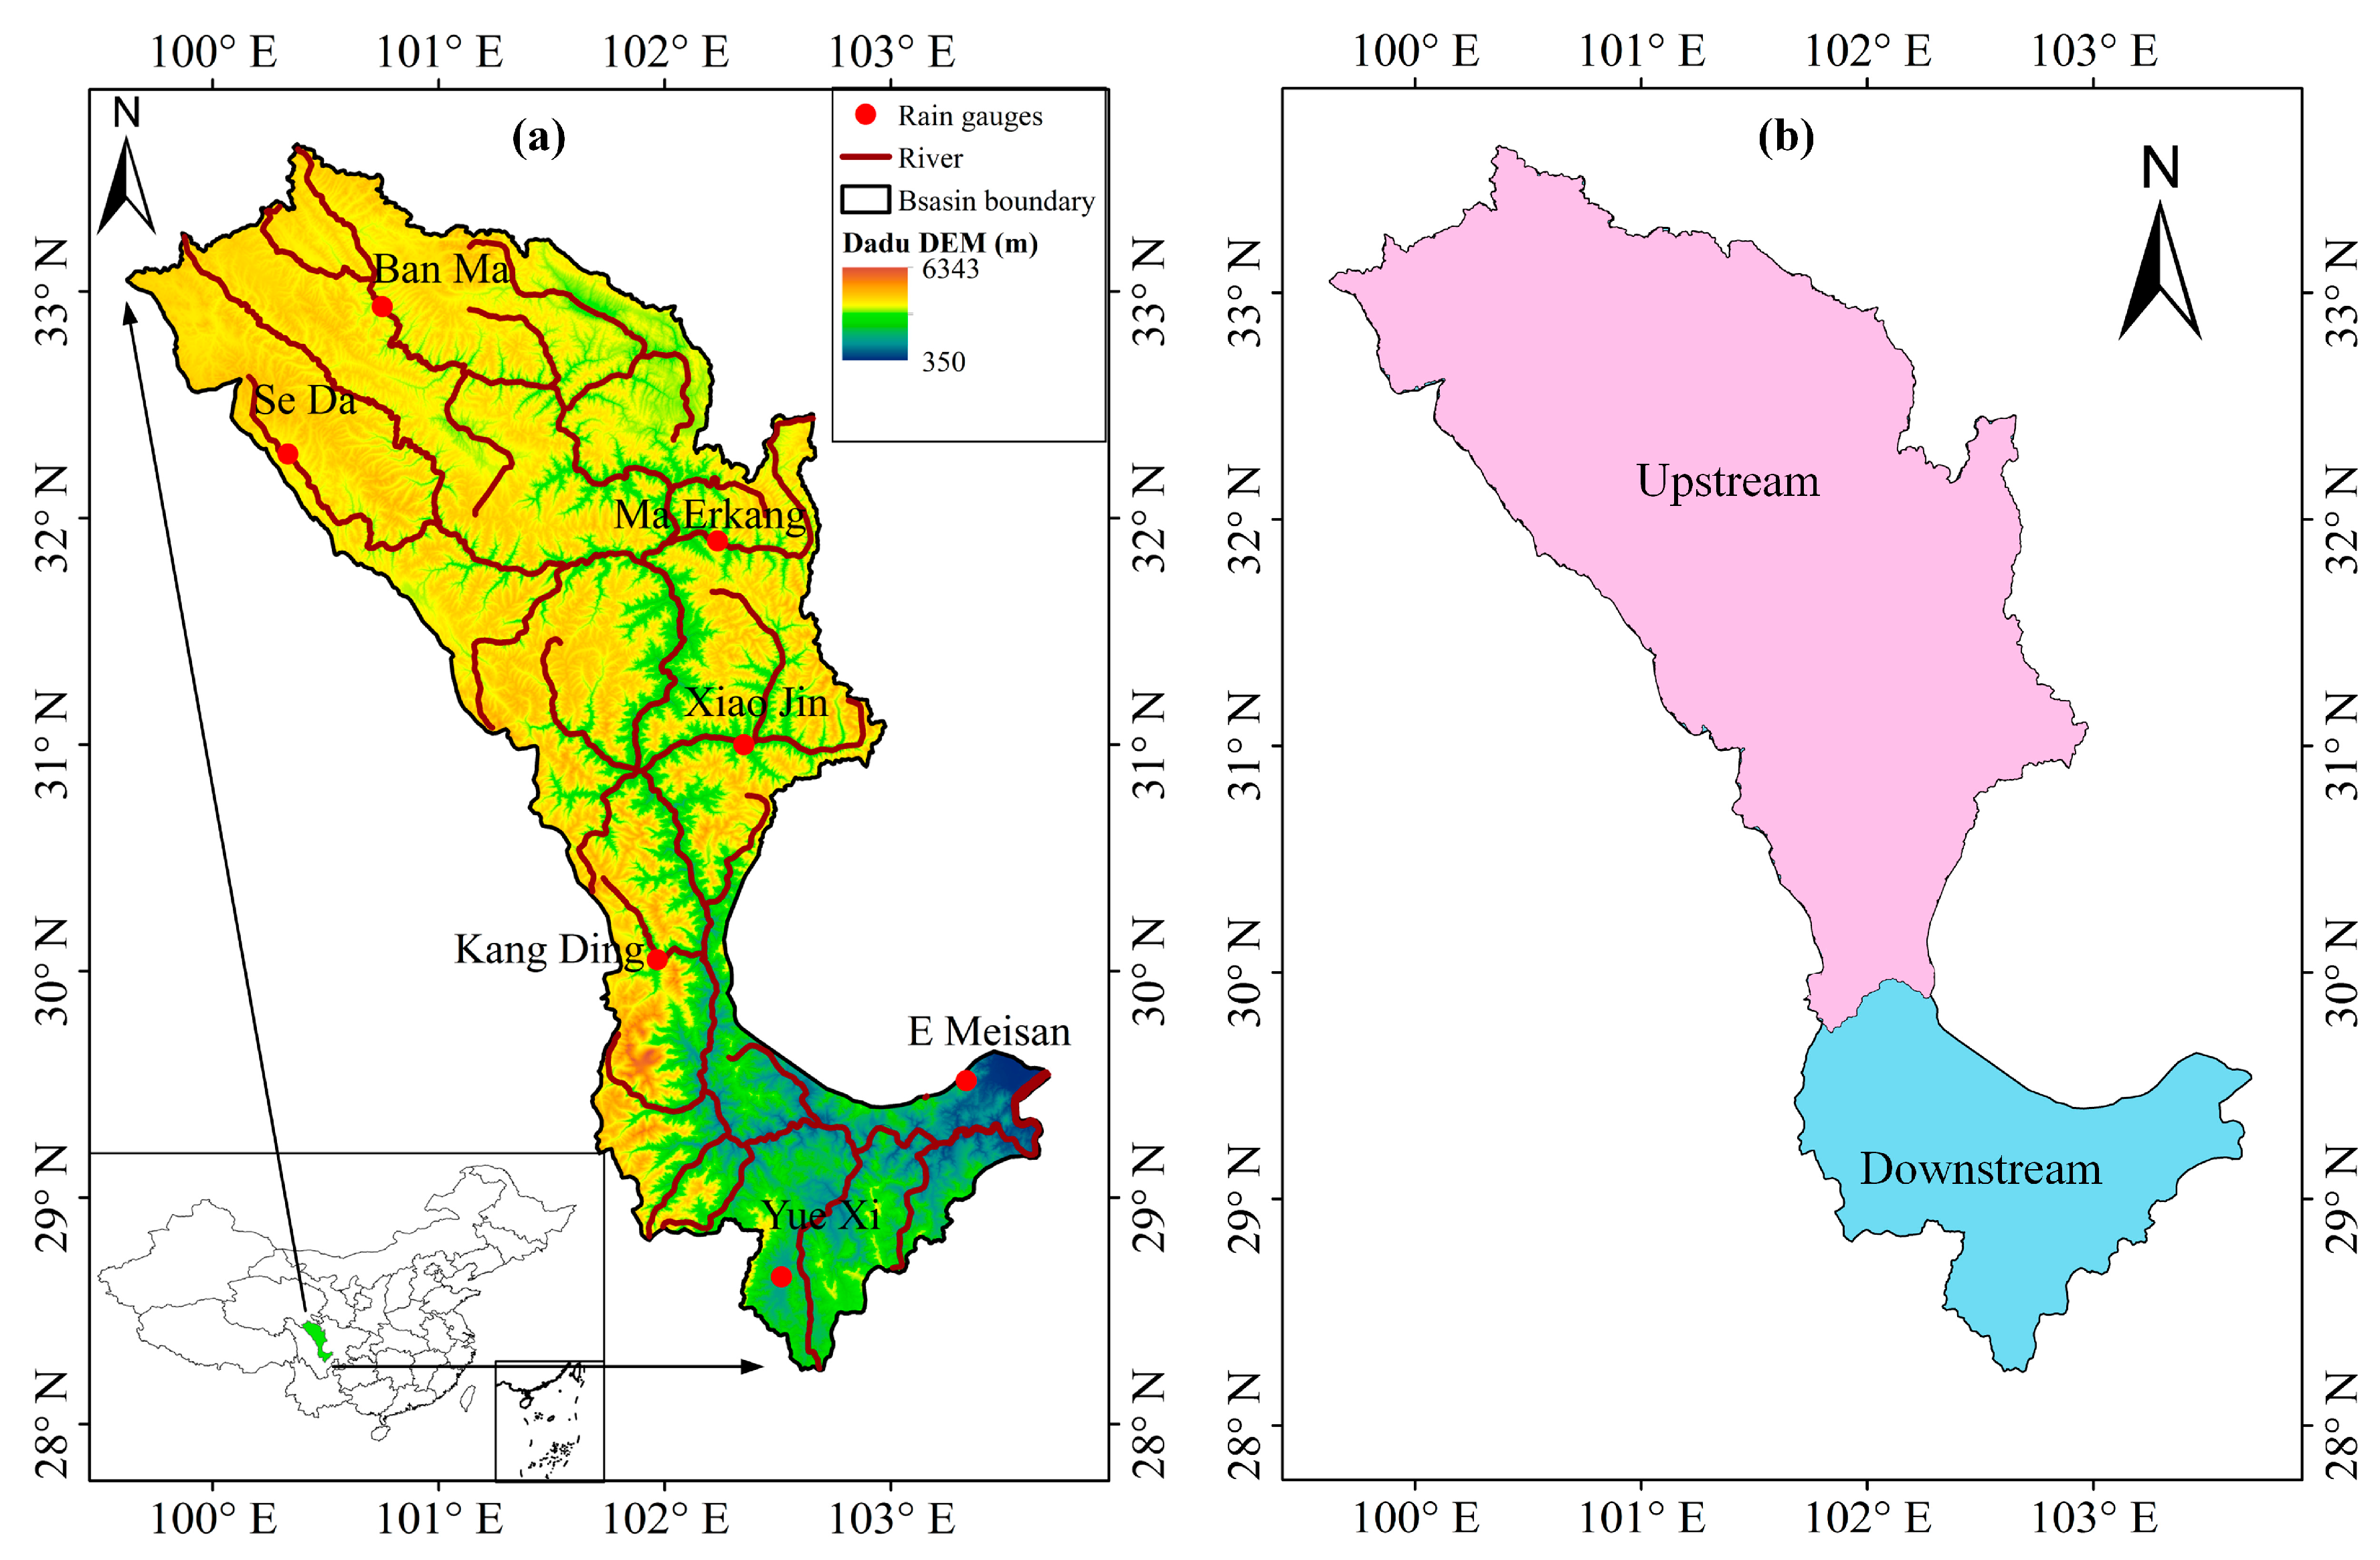
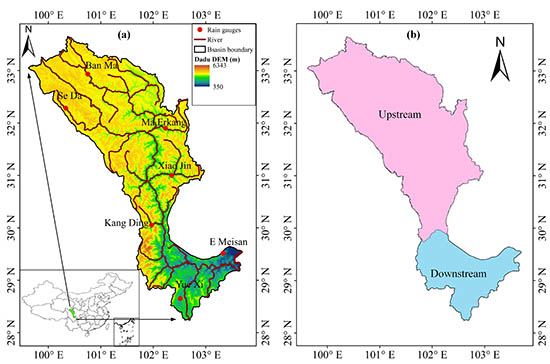
2. Study Area
3. Datasets
3.1. Rain Gauge Precipitation Dataset
3.2. Satellite Precipitation Dataset
4. Methodology
4.1. Hershfield Technique
4.2. Extreme-Value Type I (Gumbel) Distribution
4.3. Statistical Metrics
5. Results
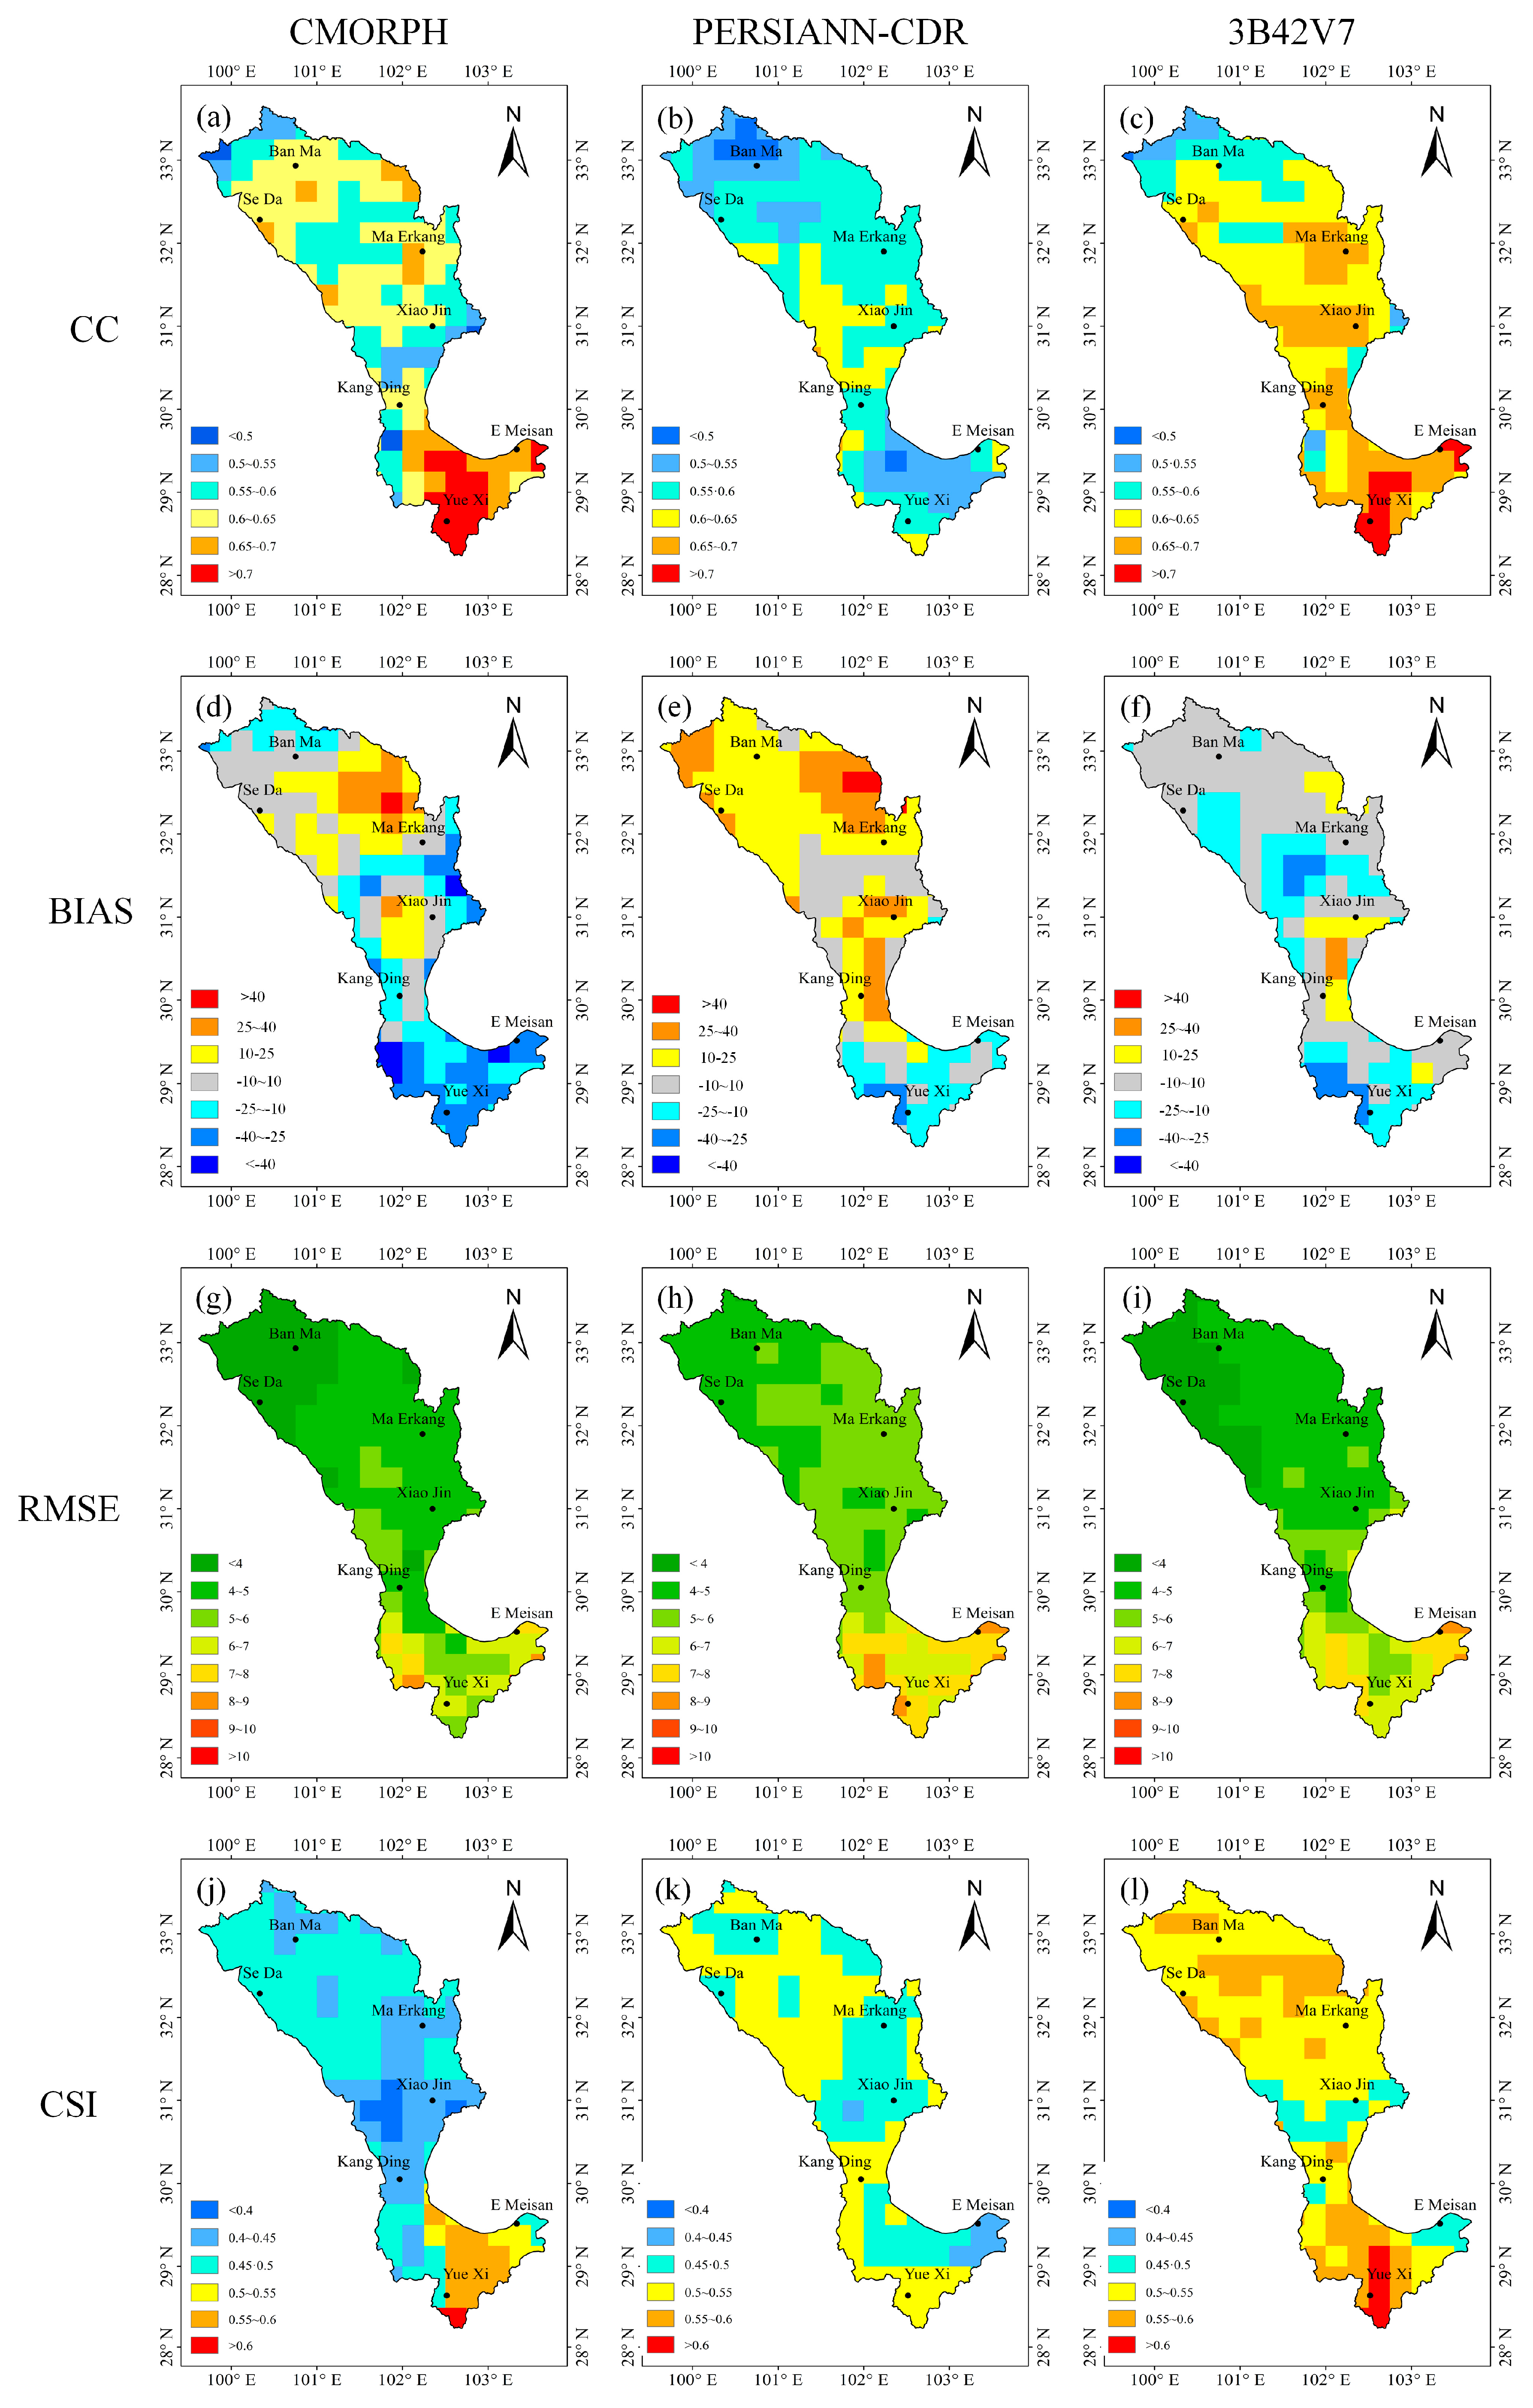
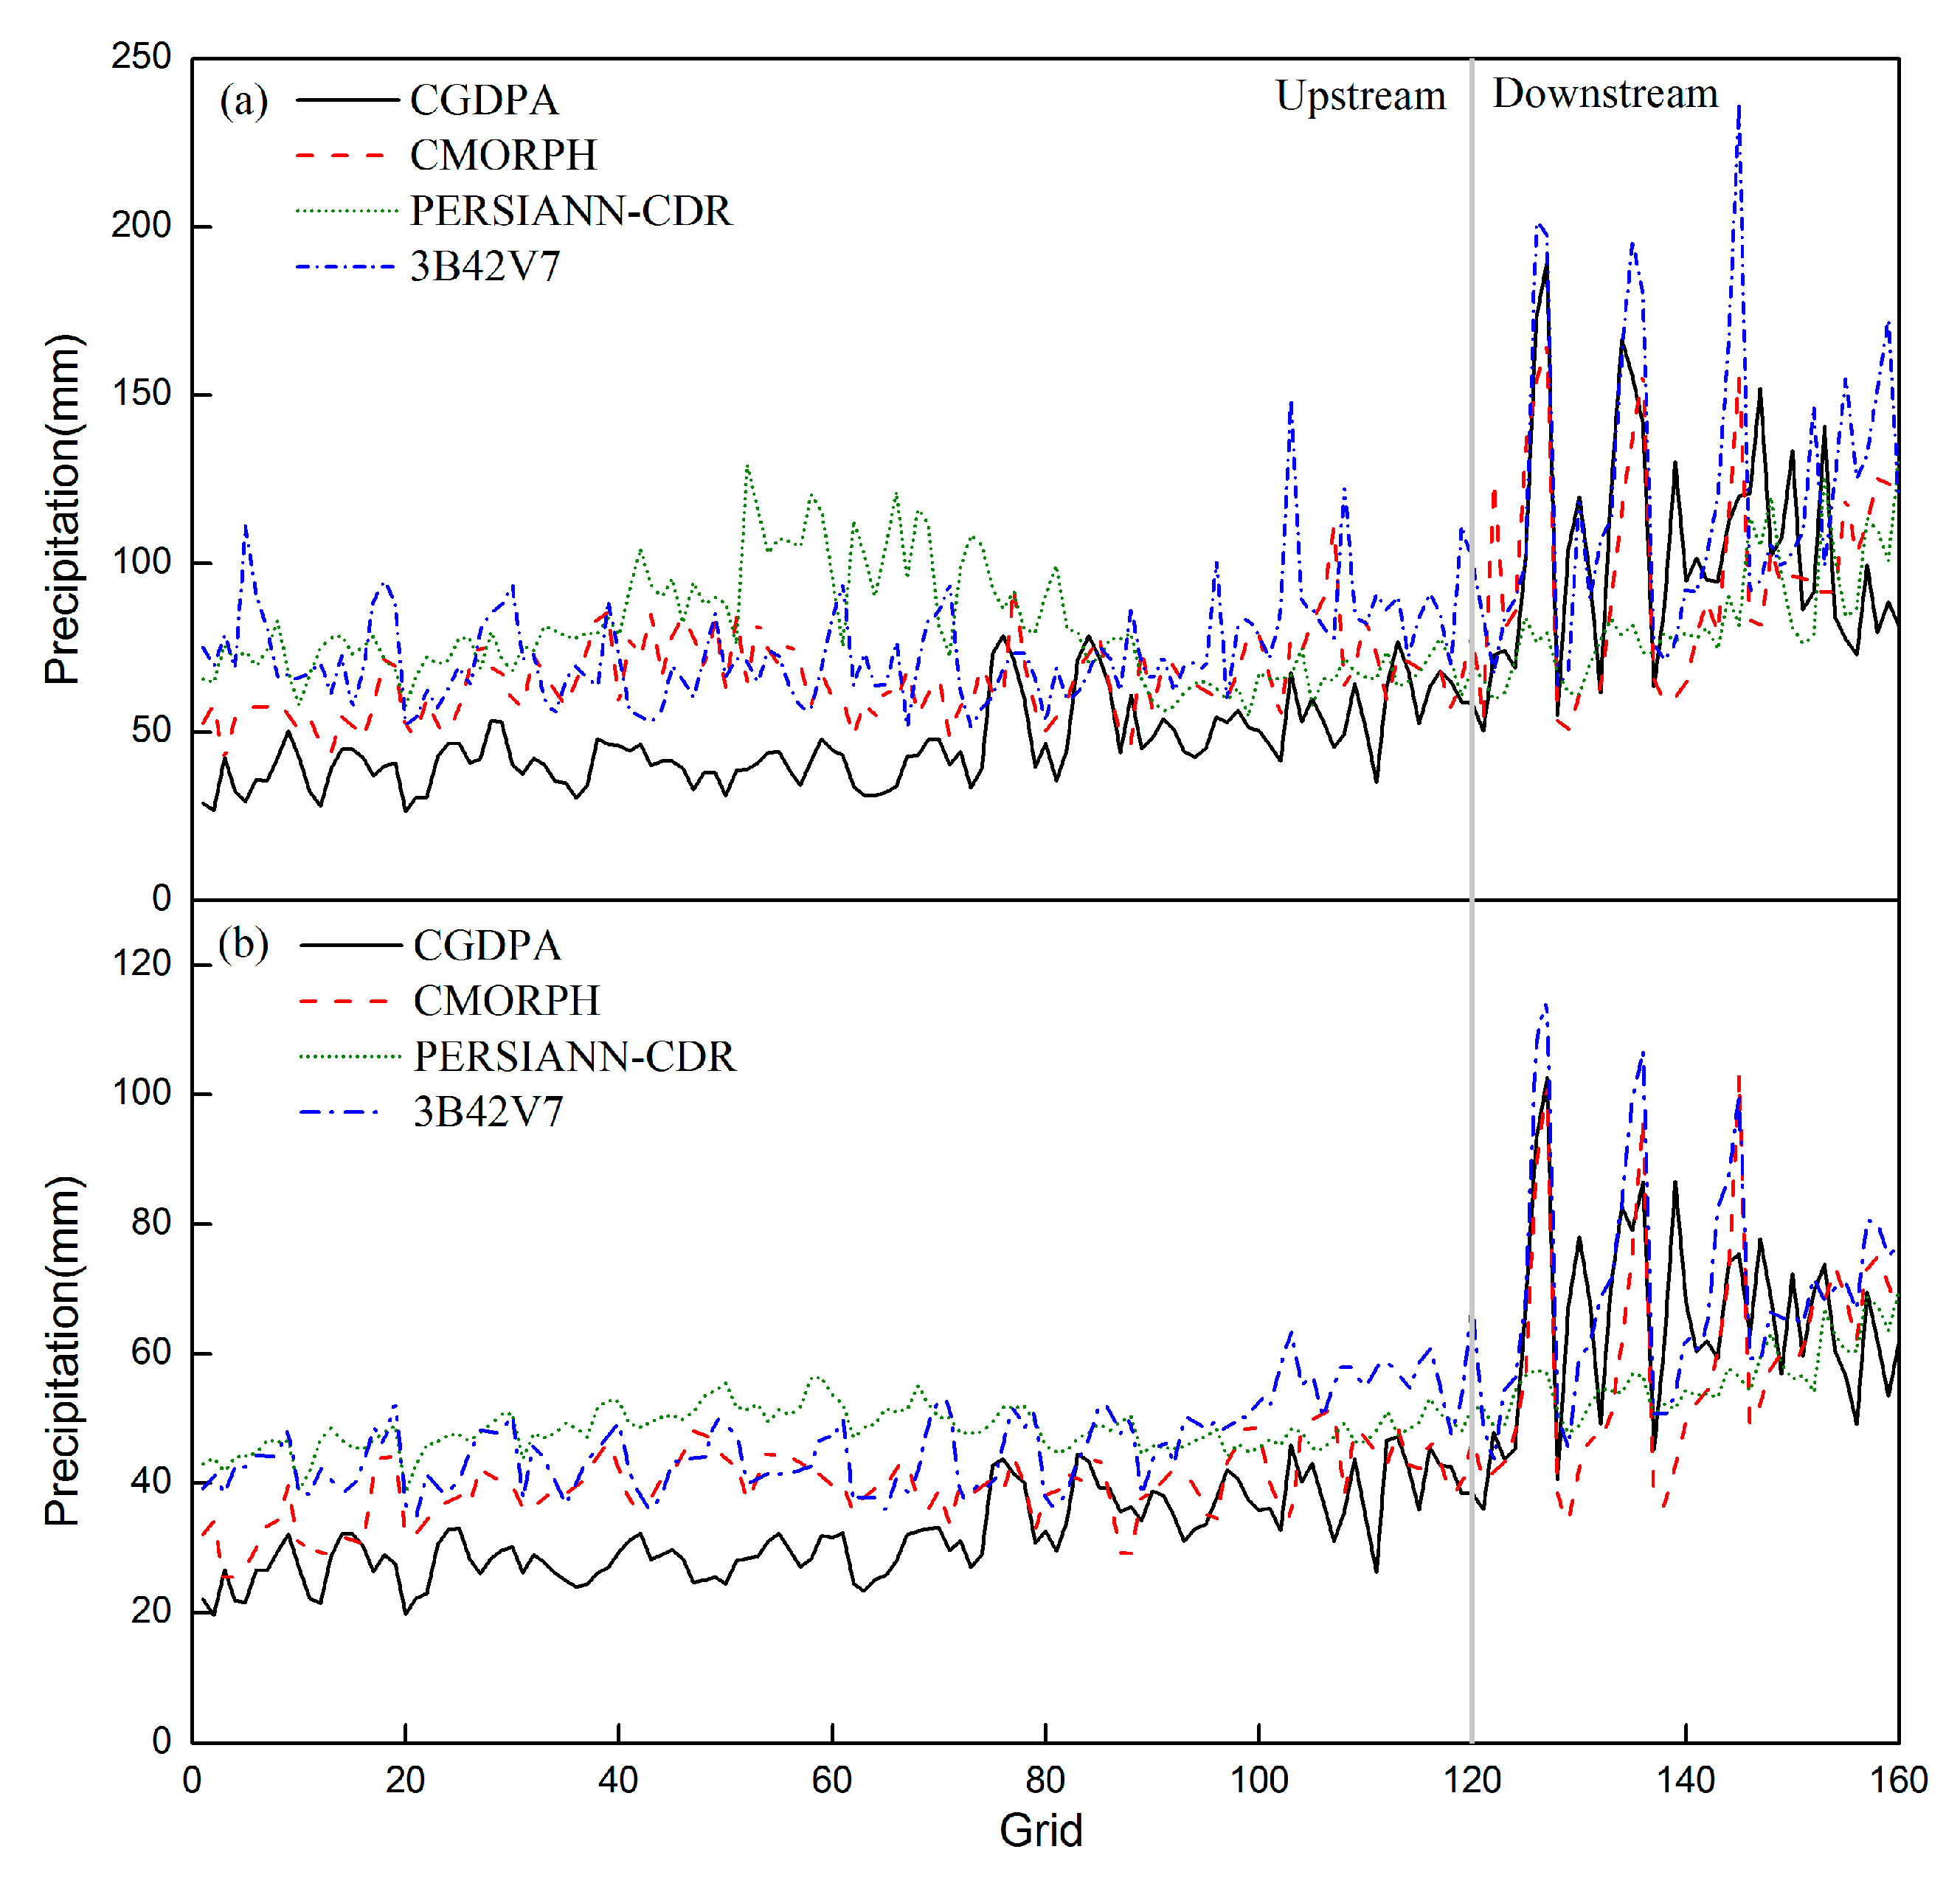
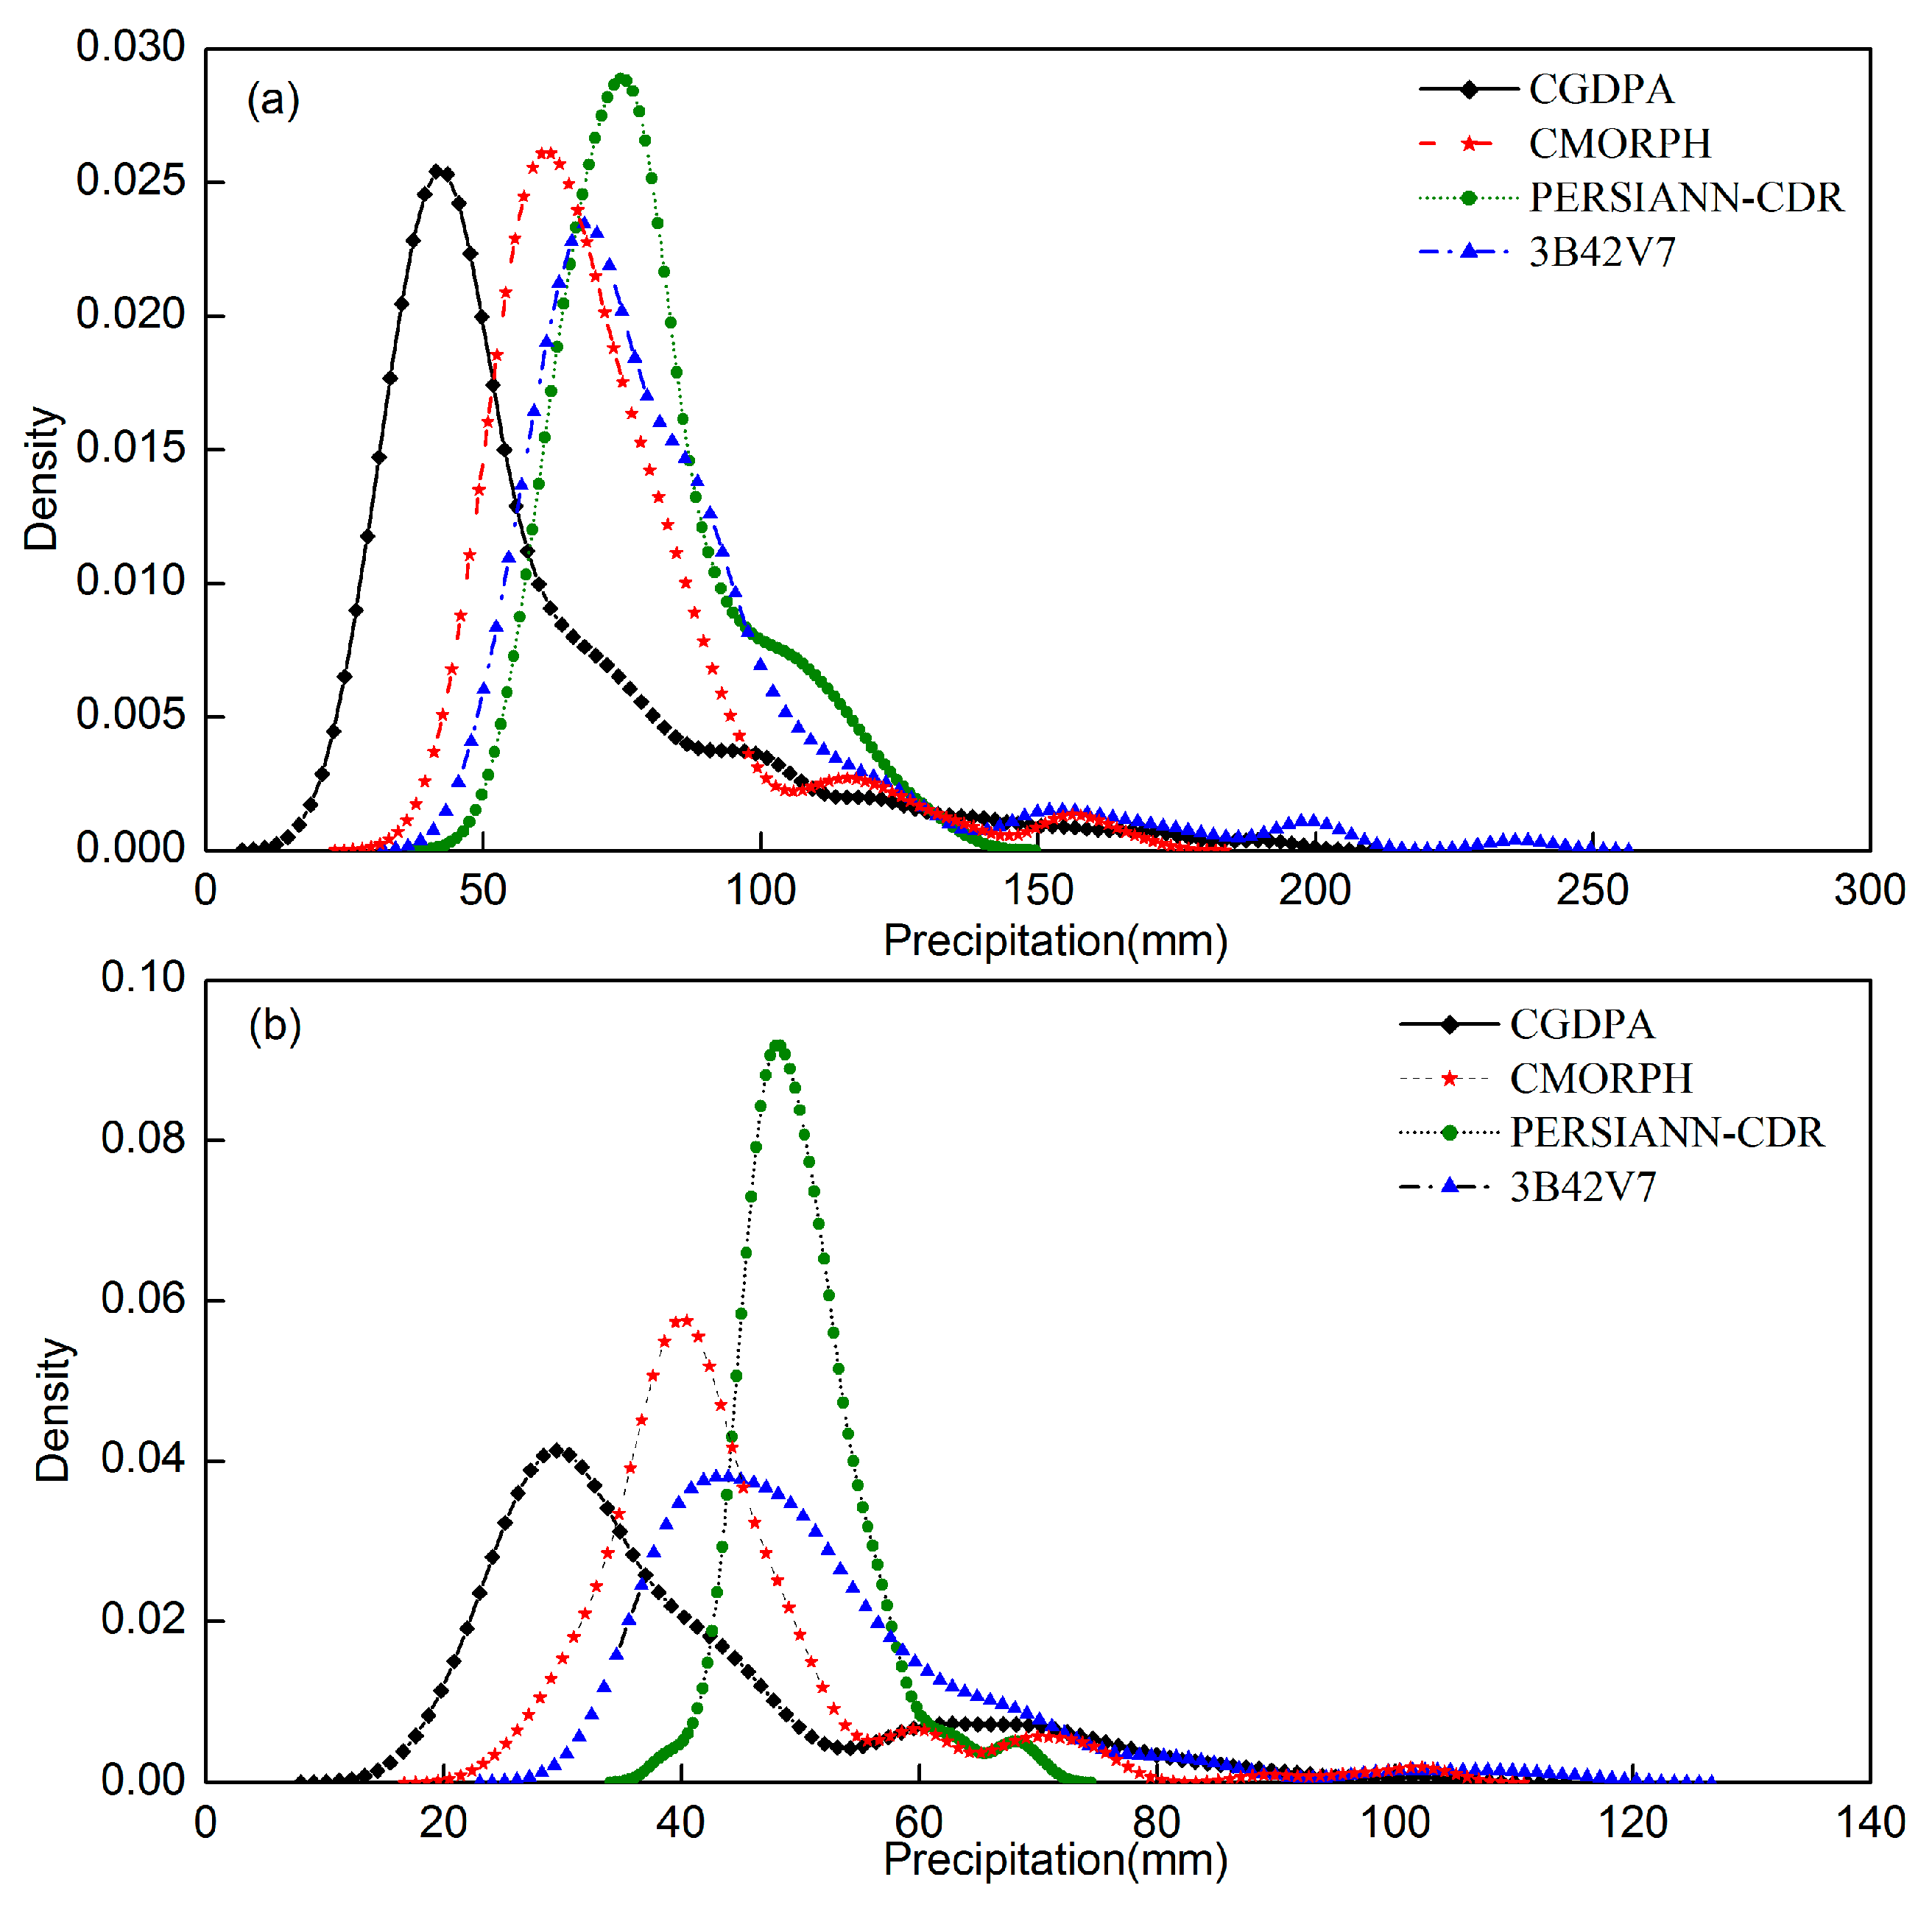
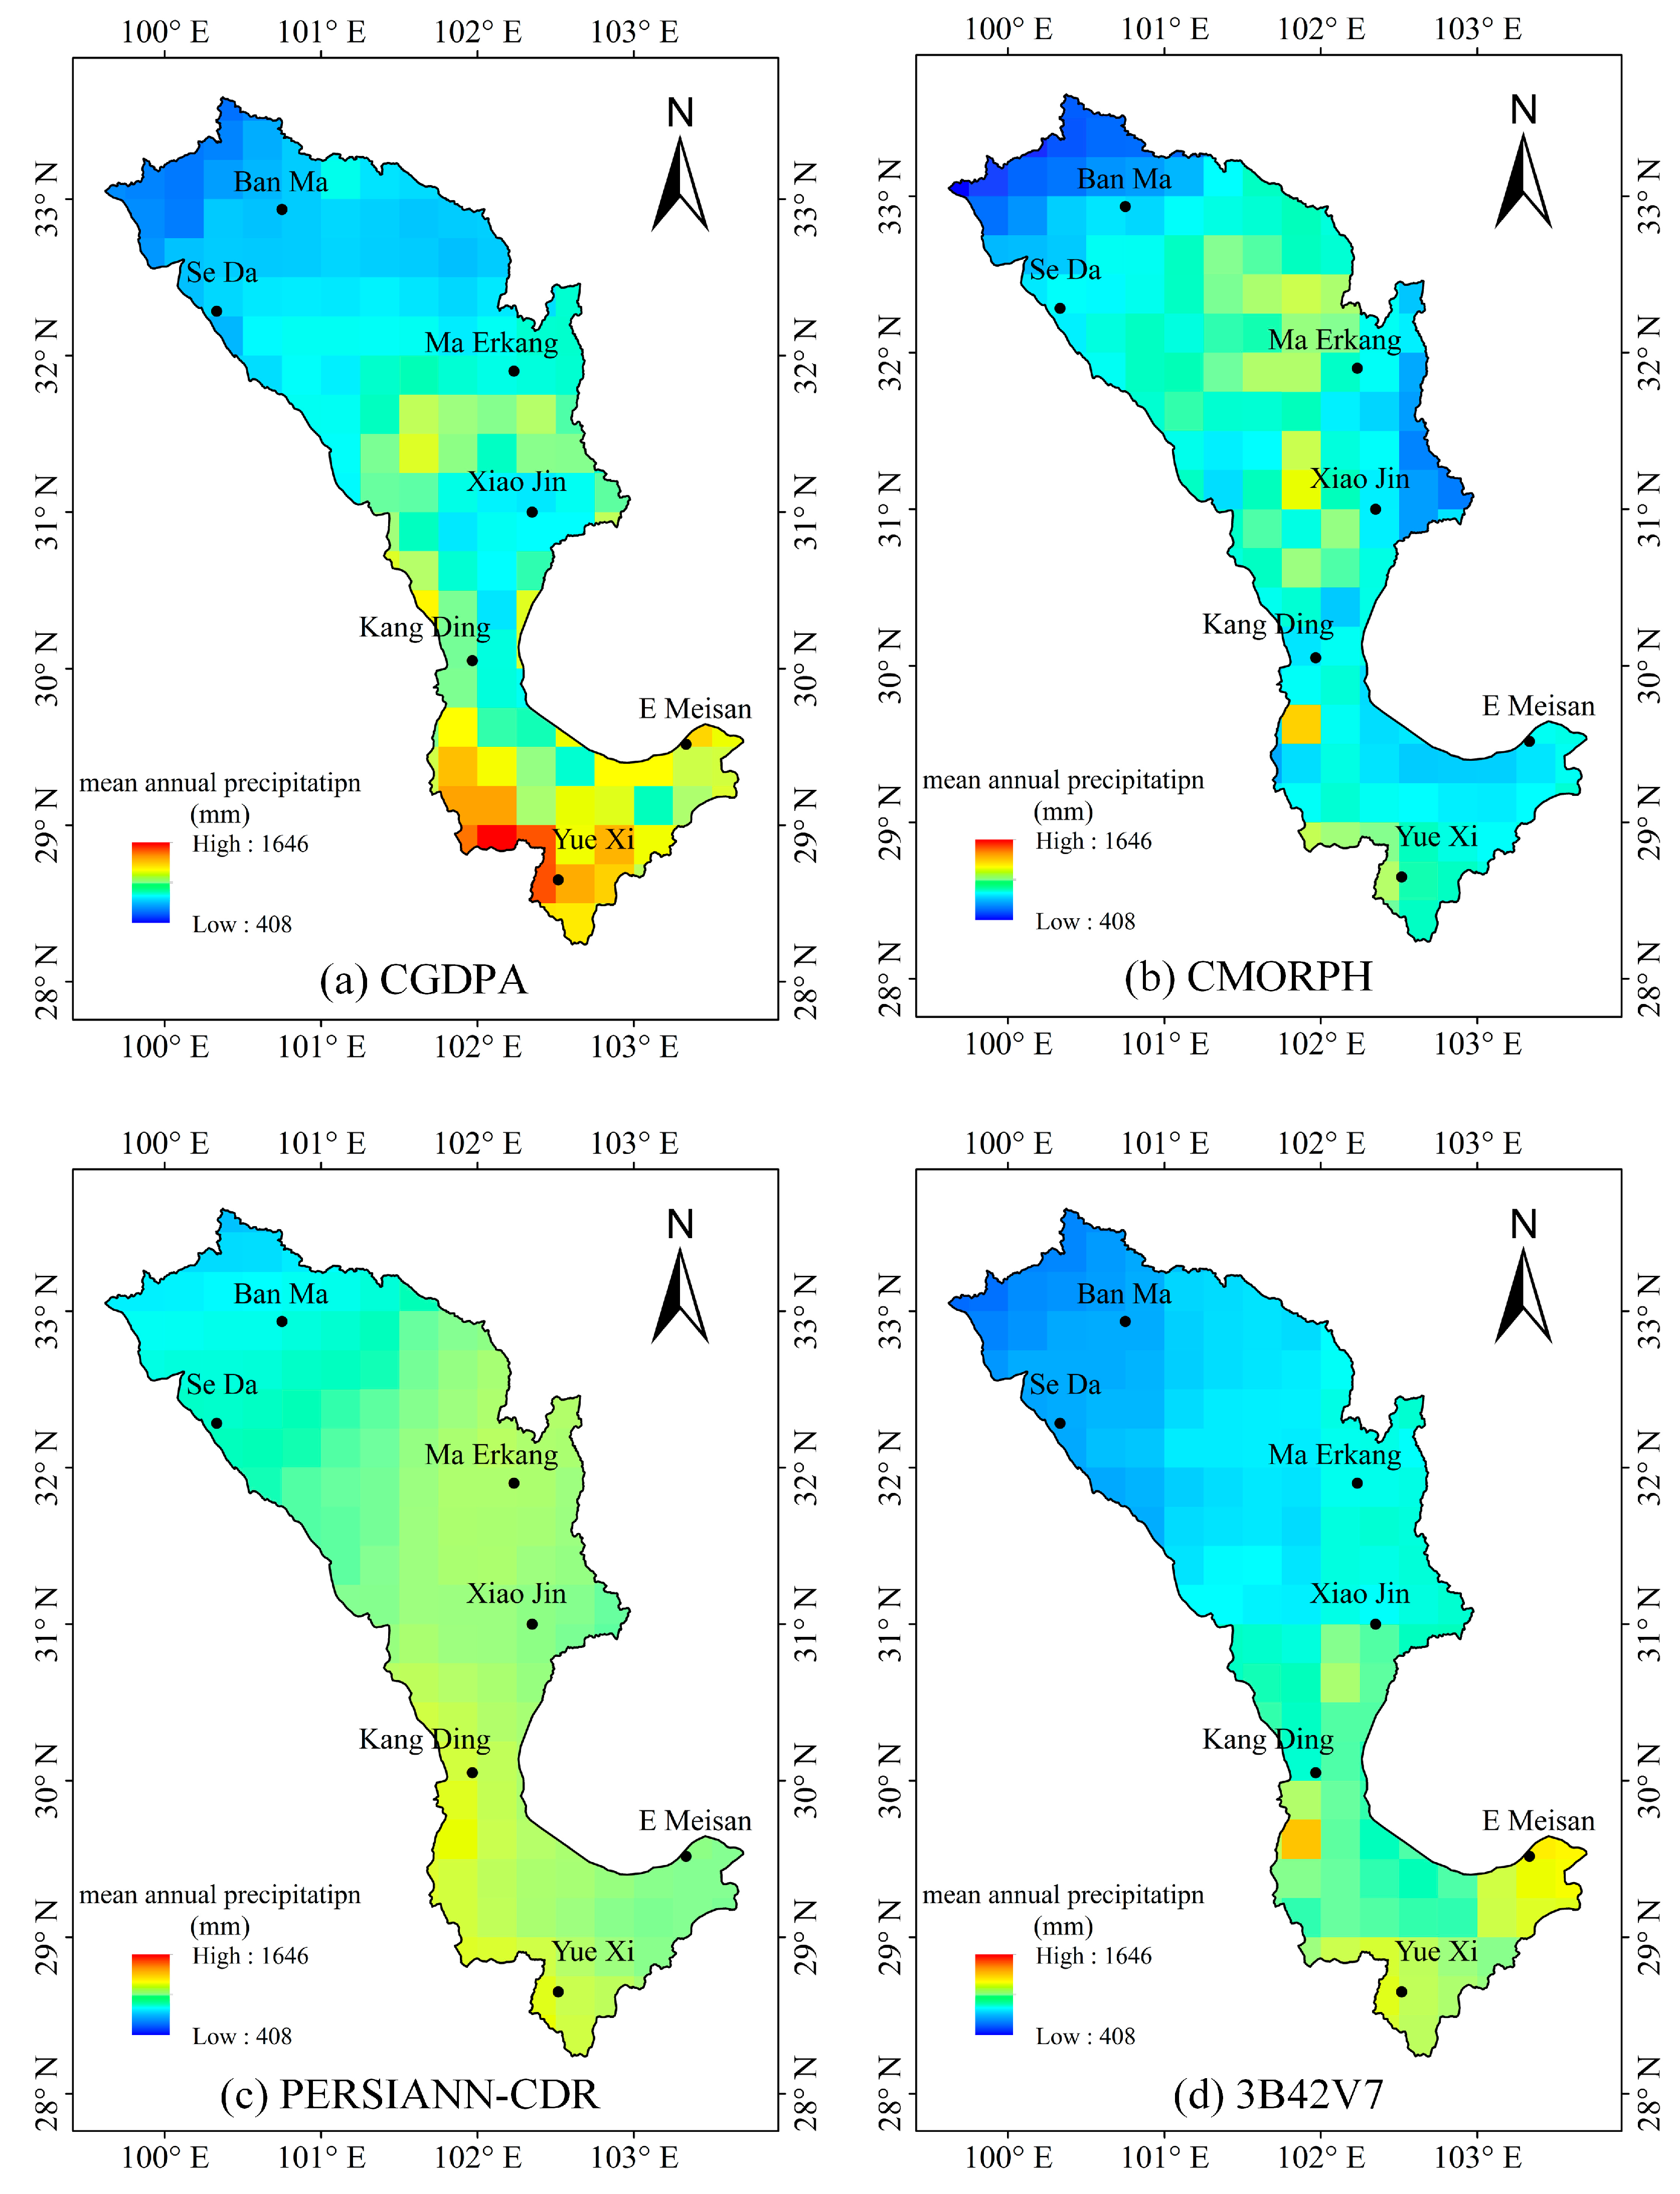
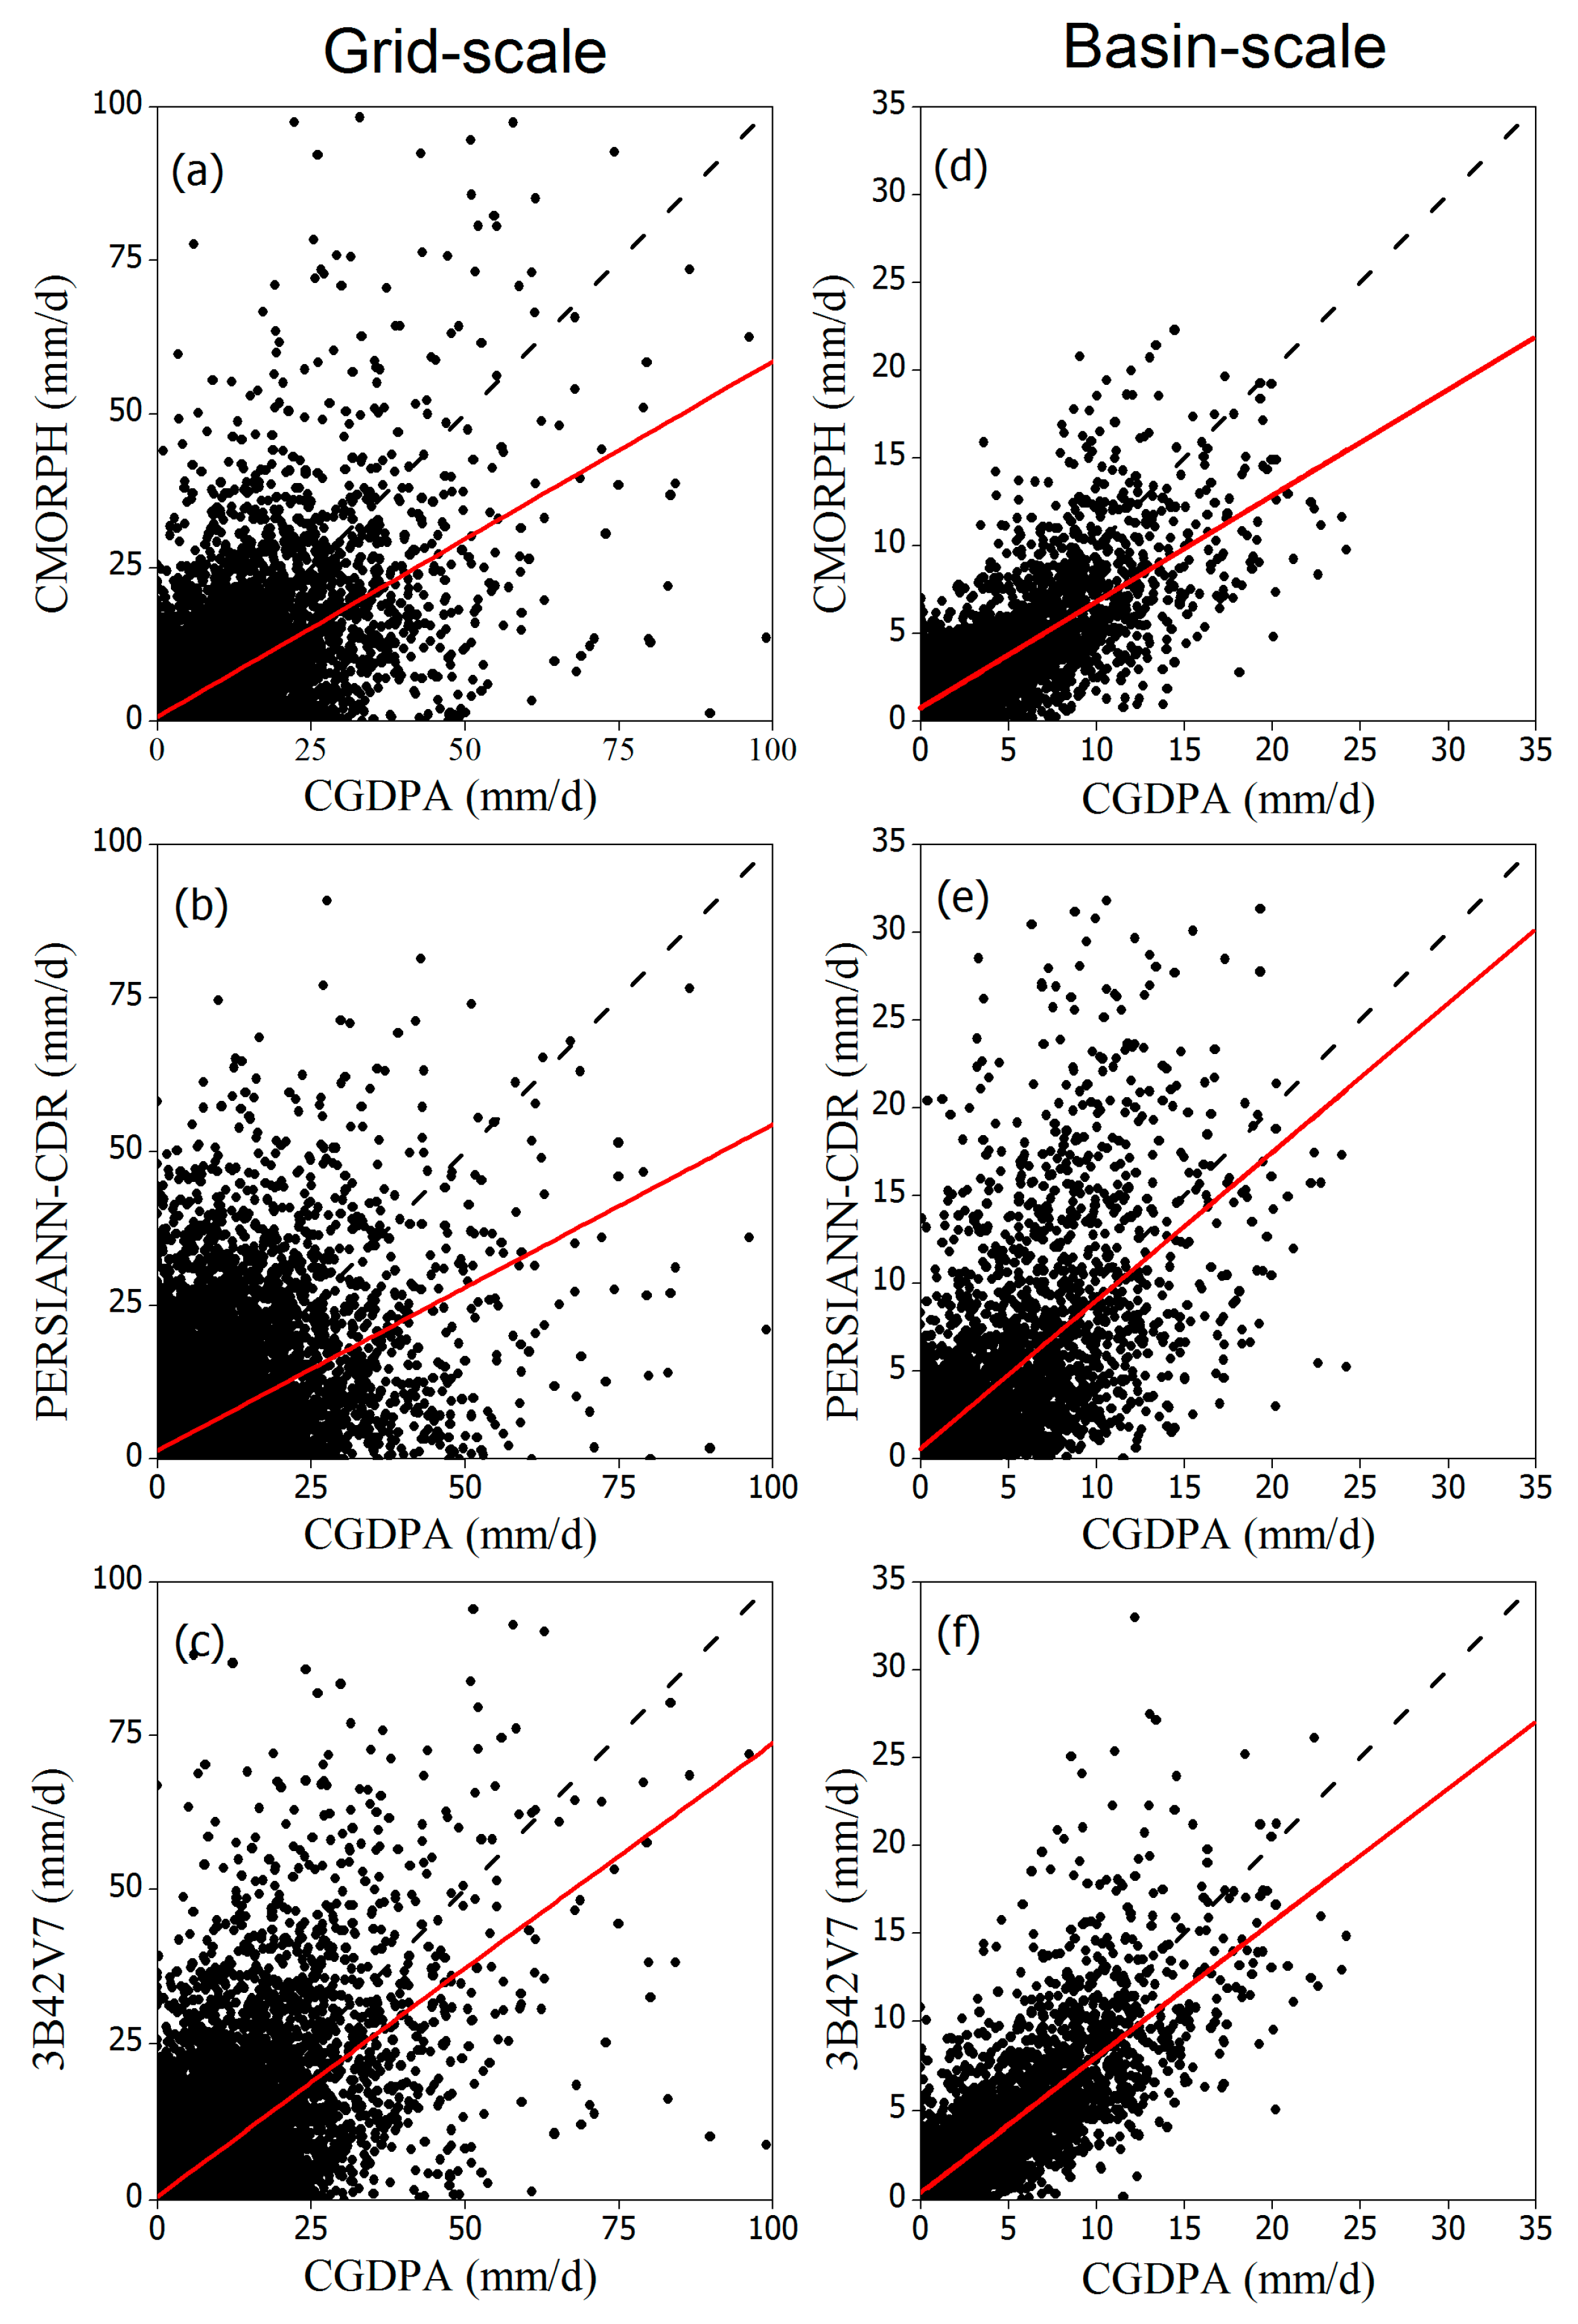
5.1. Evaluation and Comparison of Precipitation
5.2. PMP Estimation and Evaluation
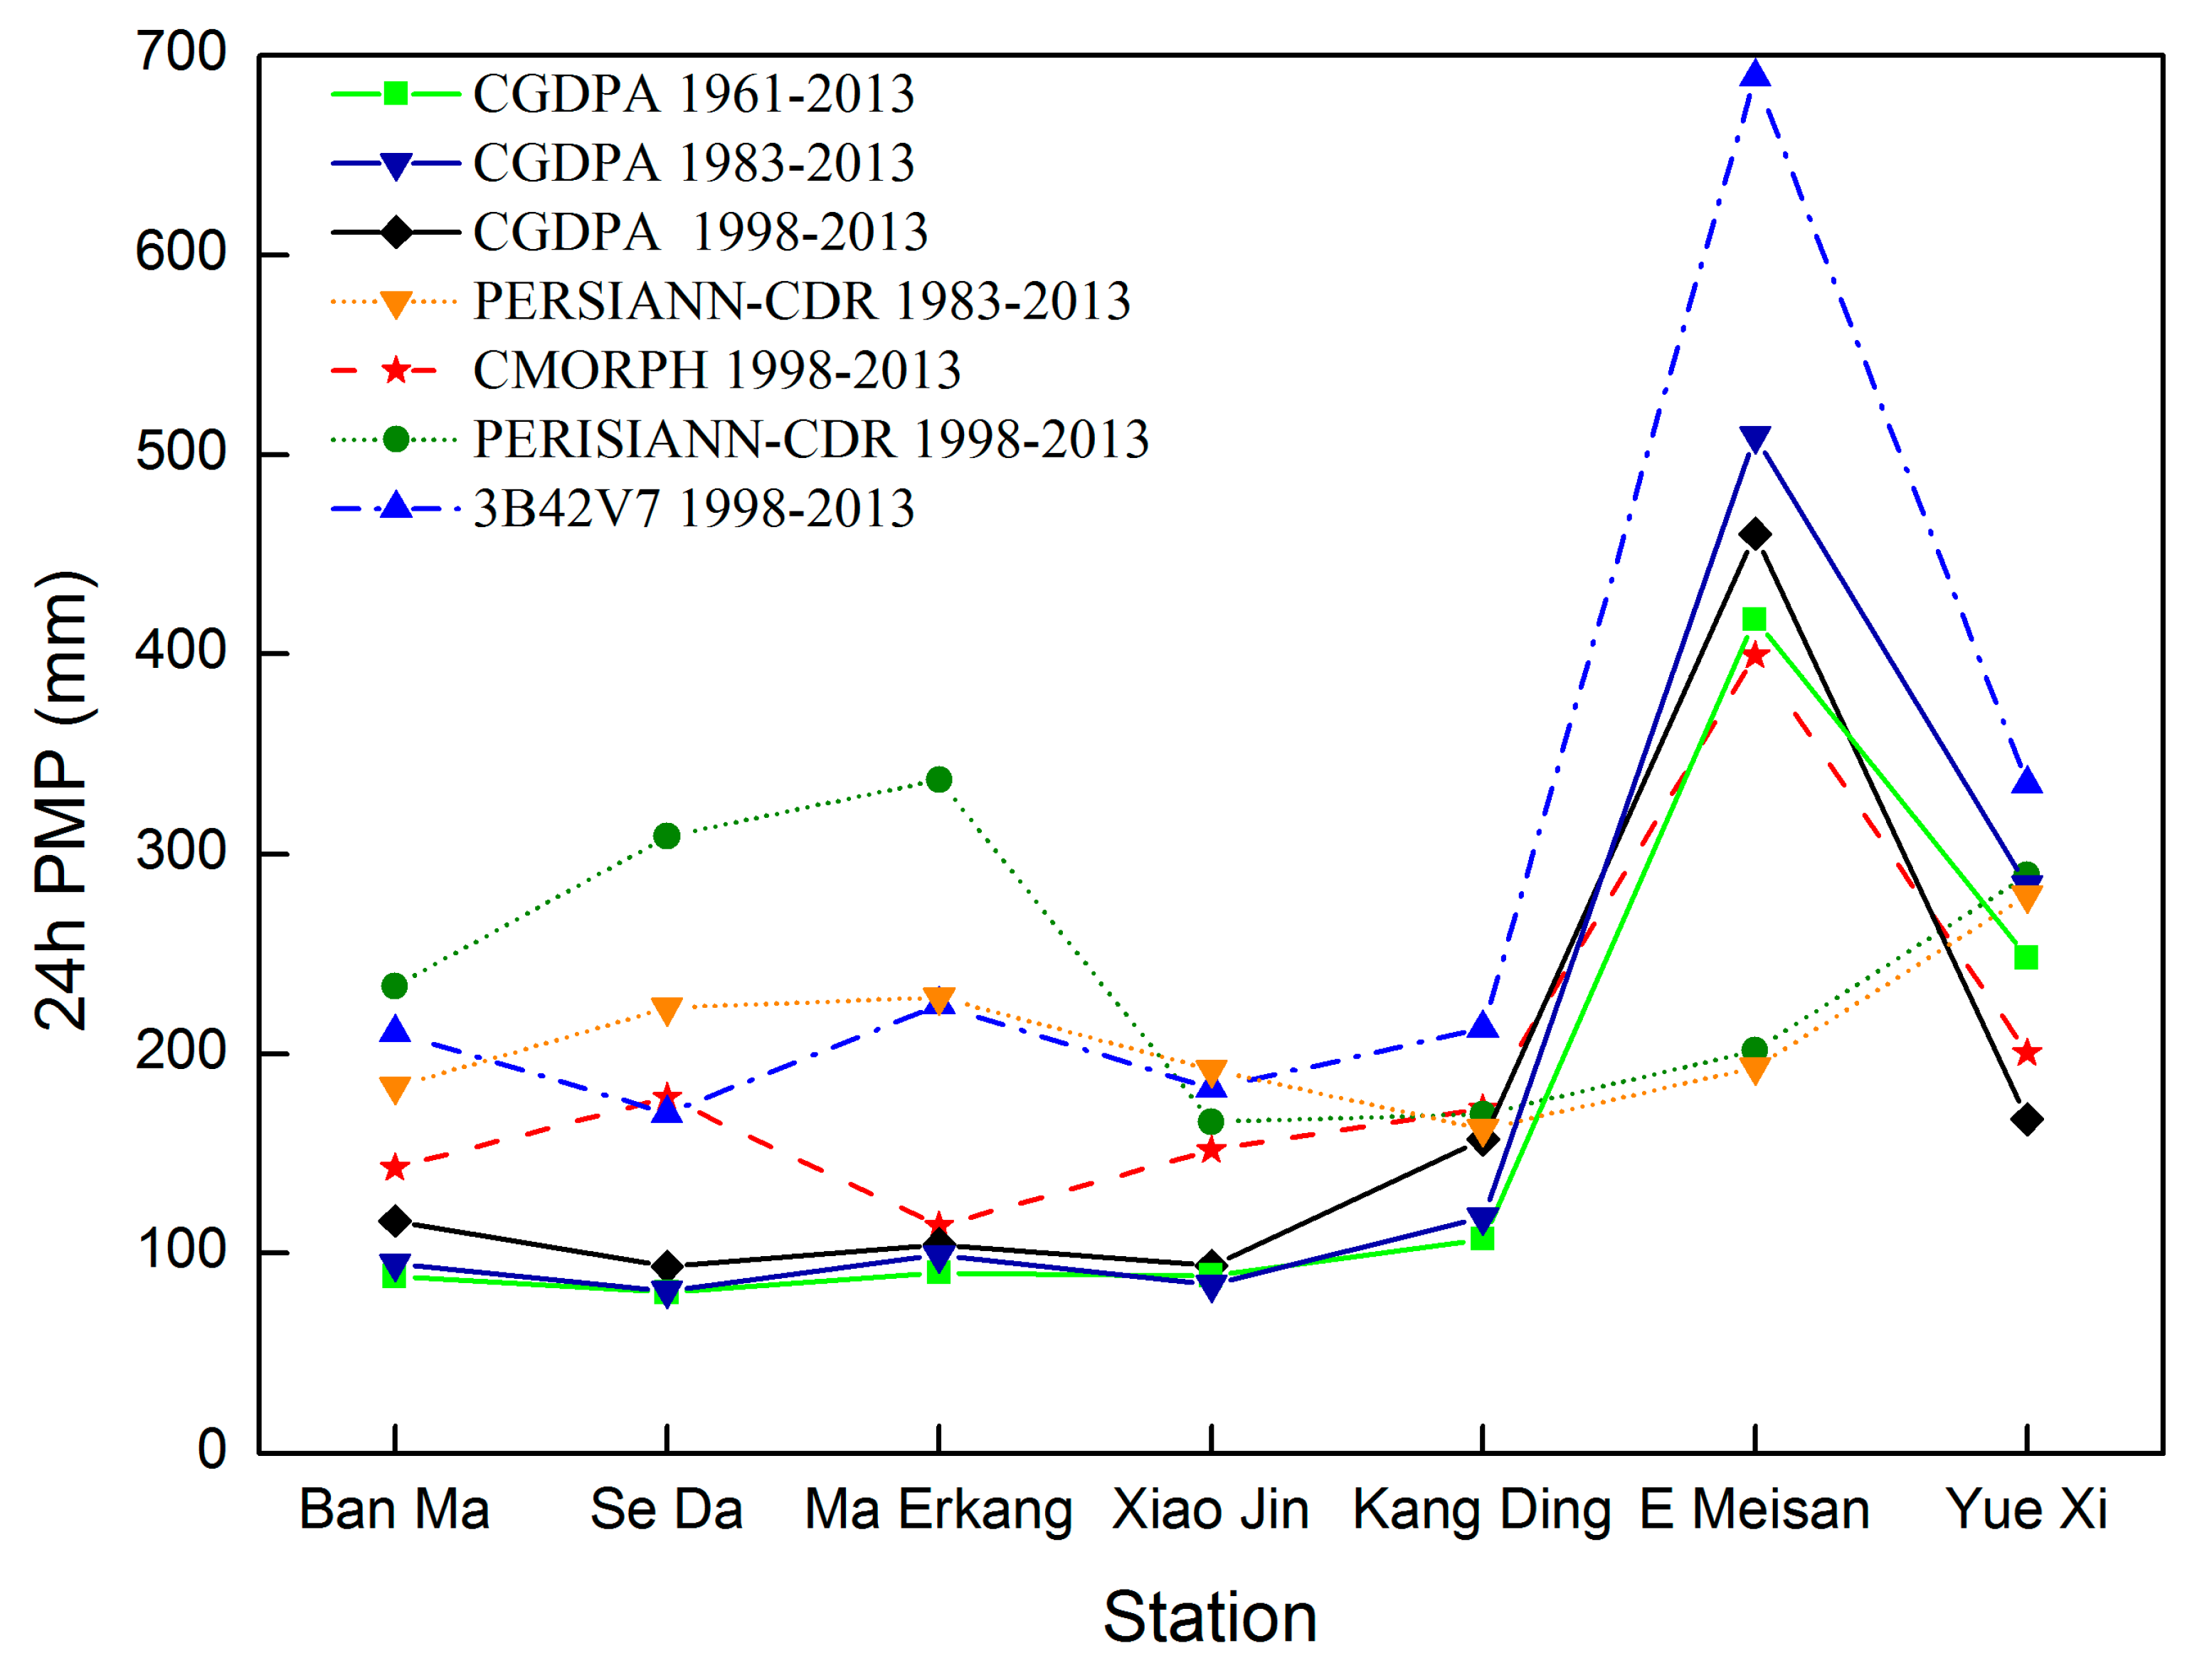
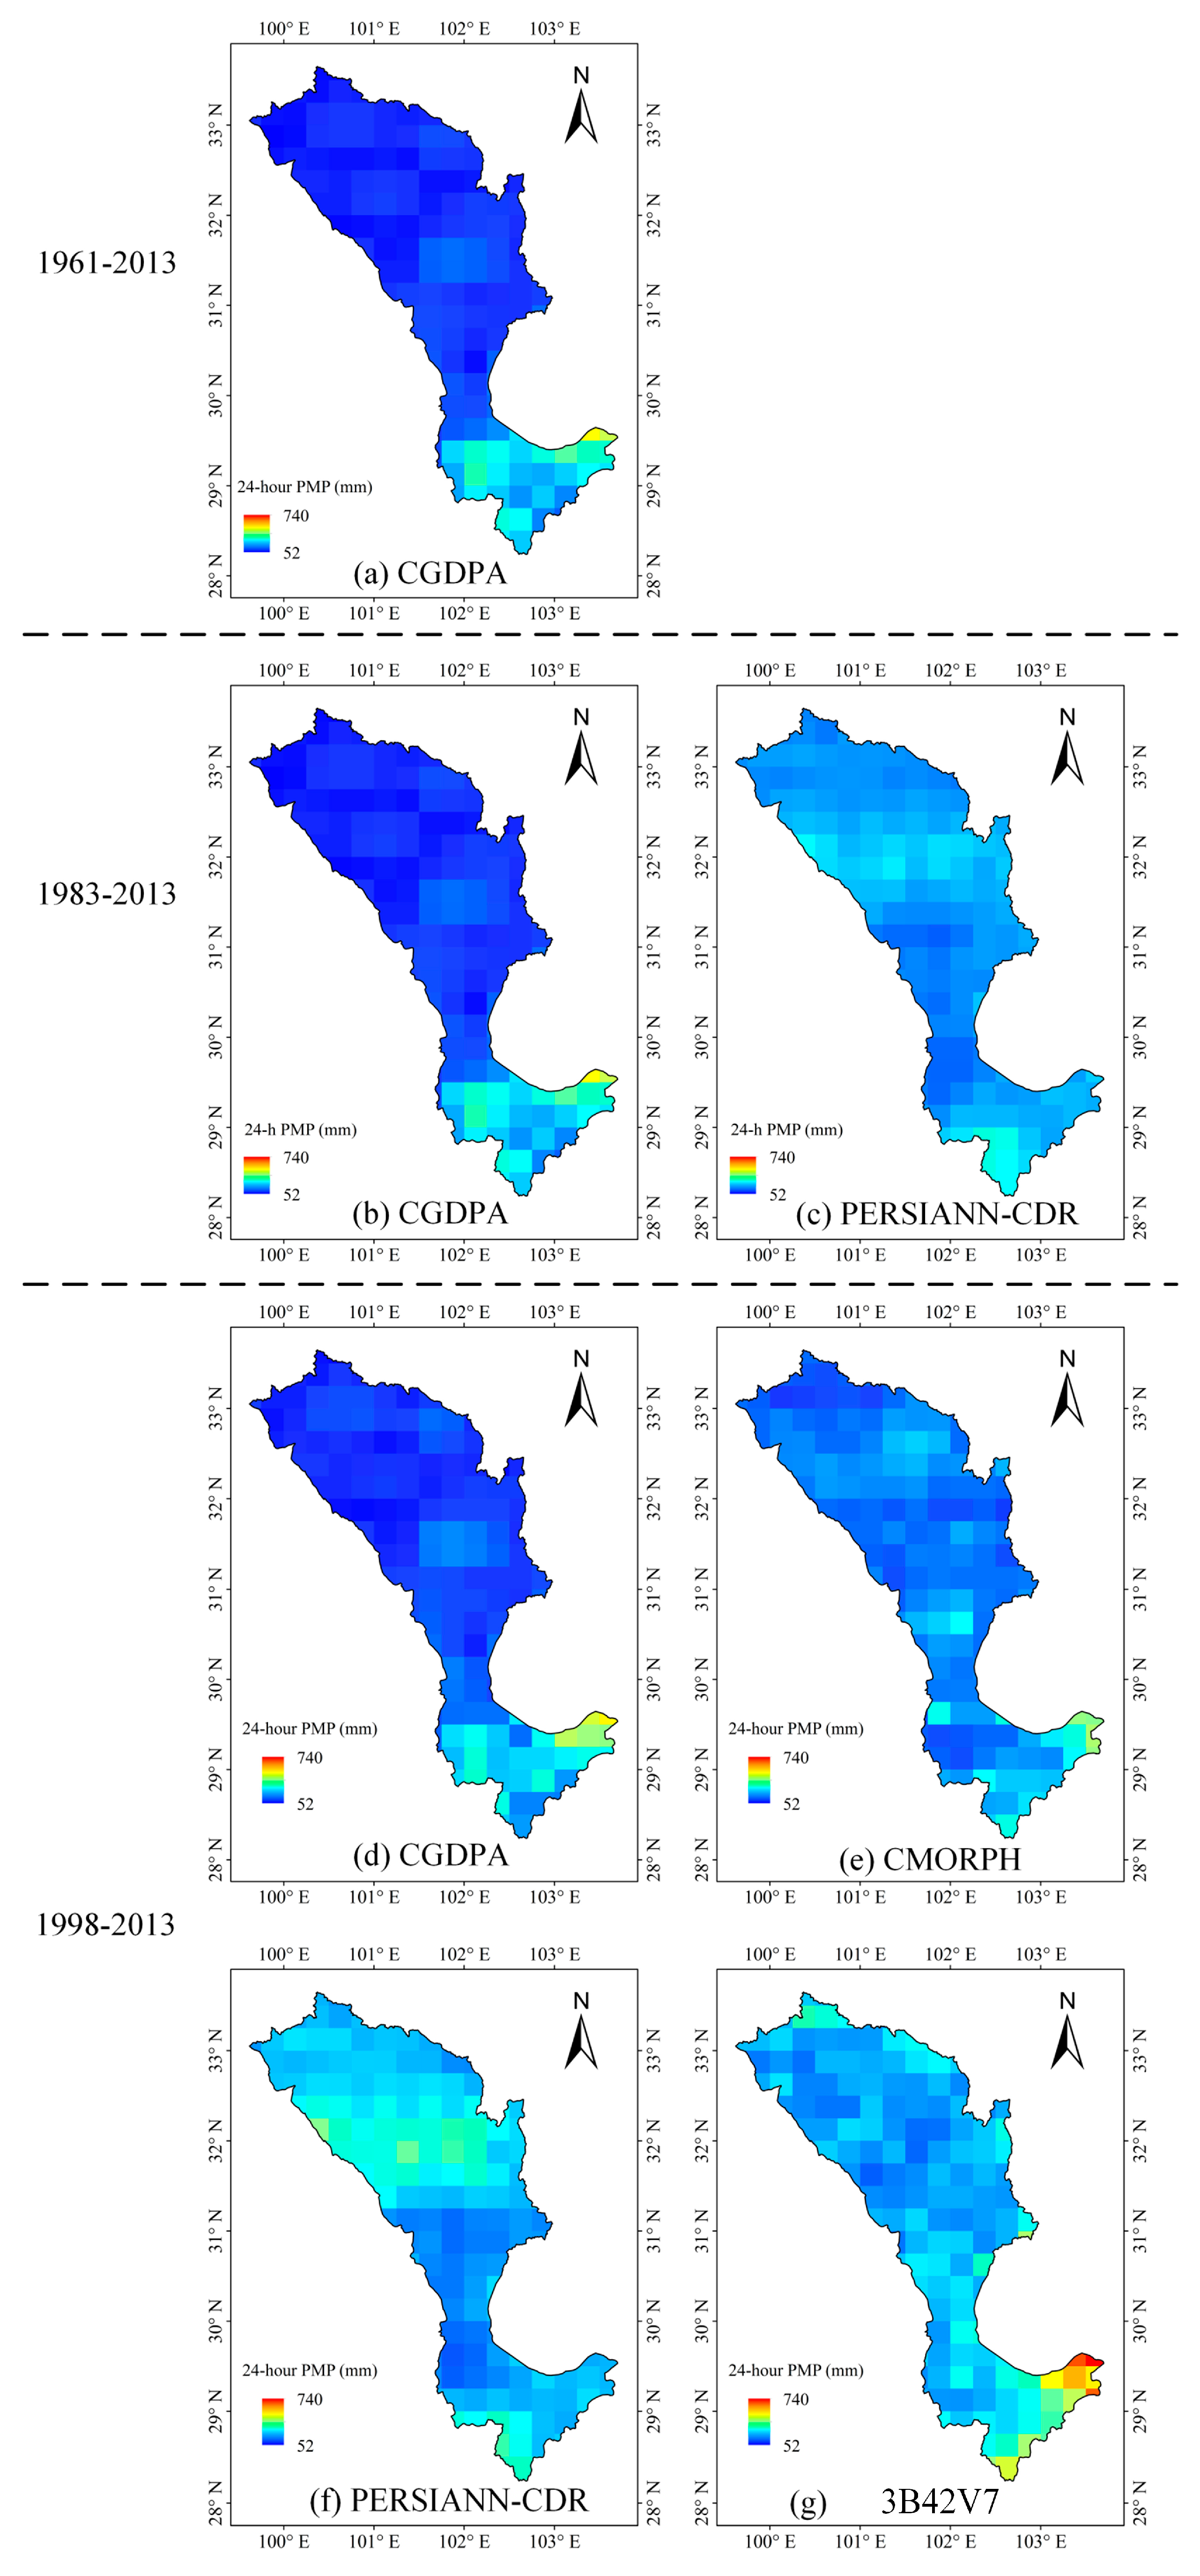
5.2.1. 24-h PMP Evaluation
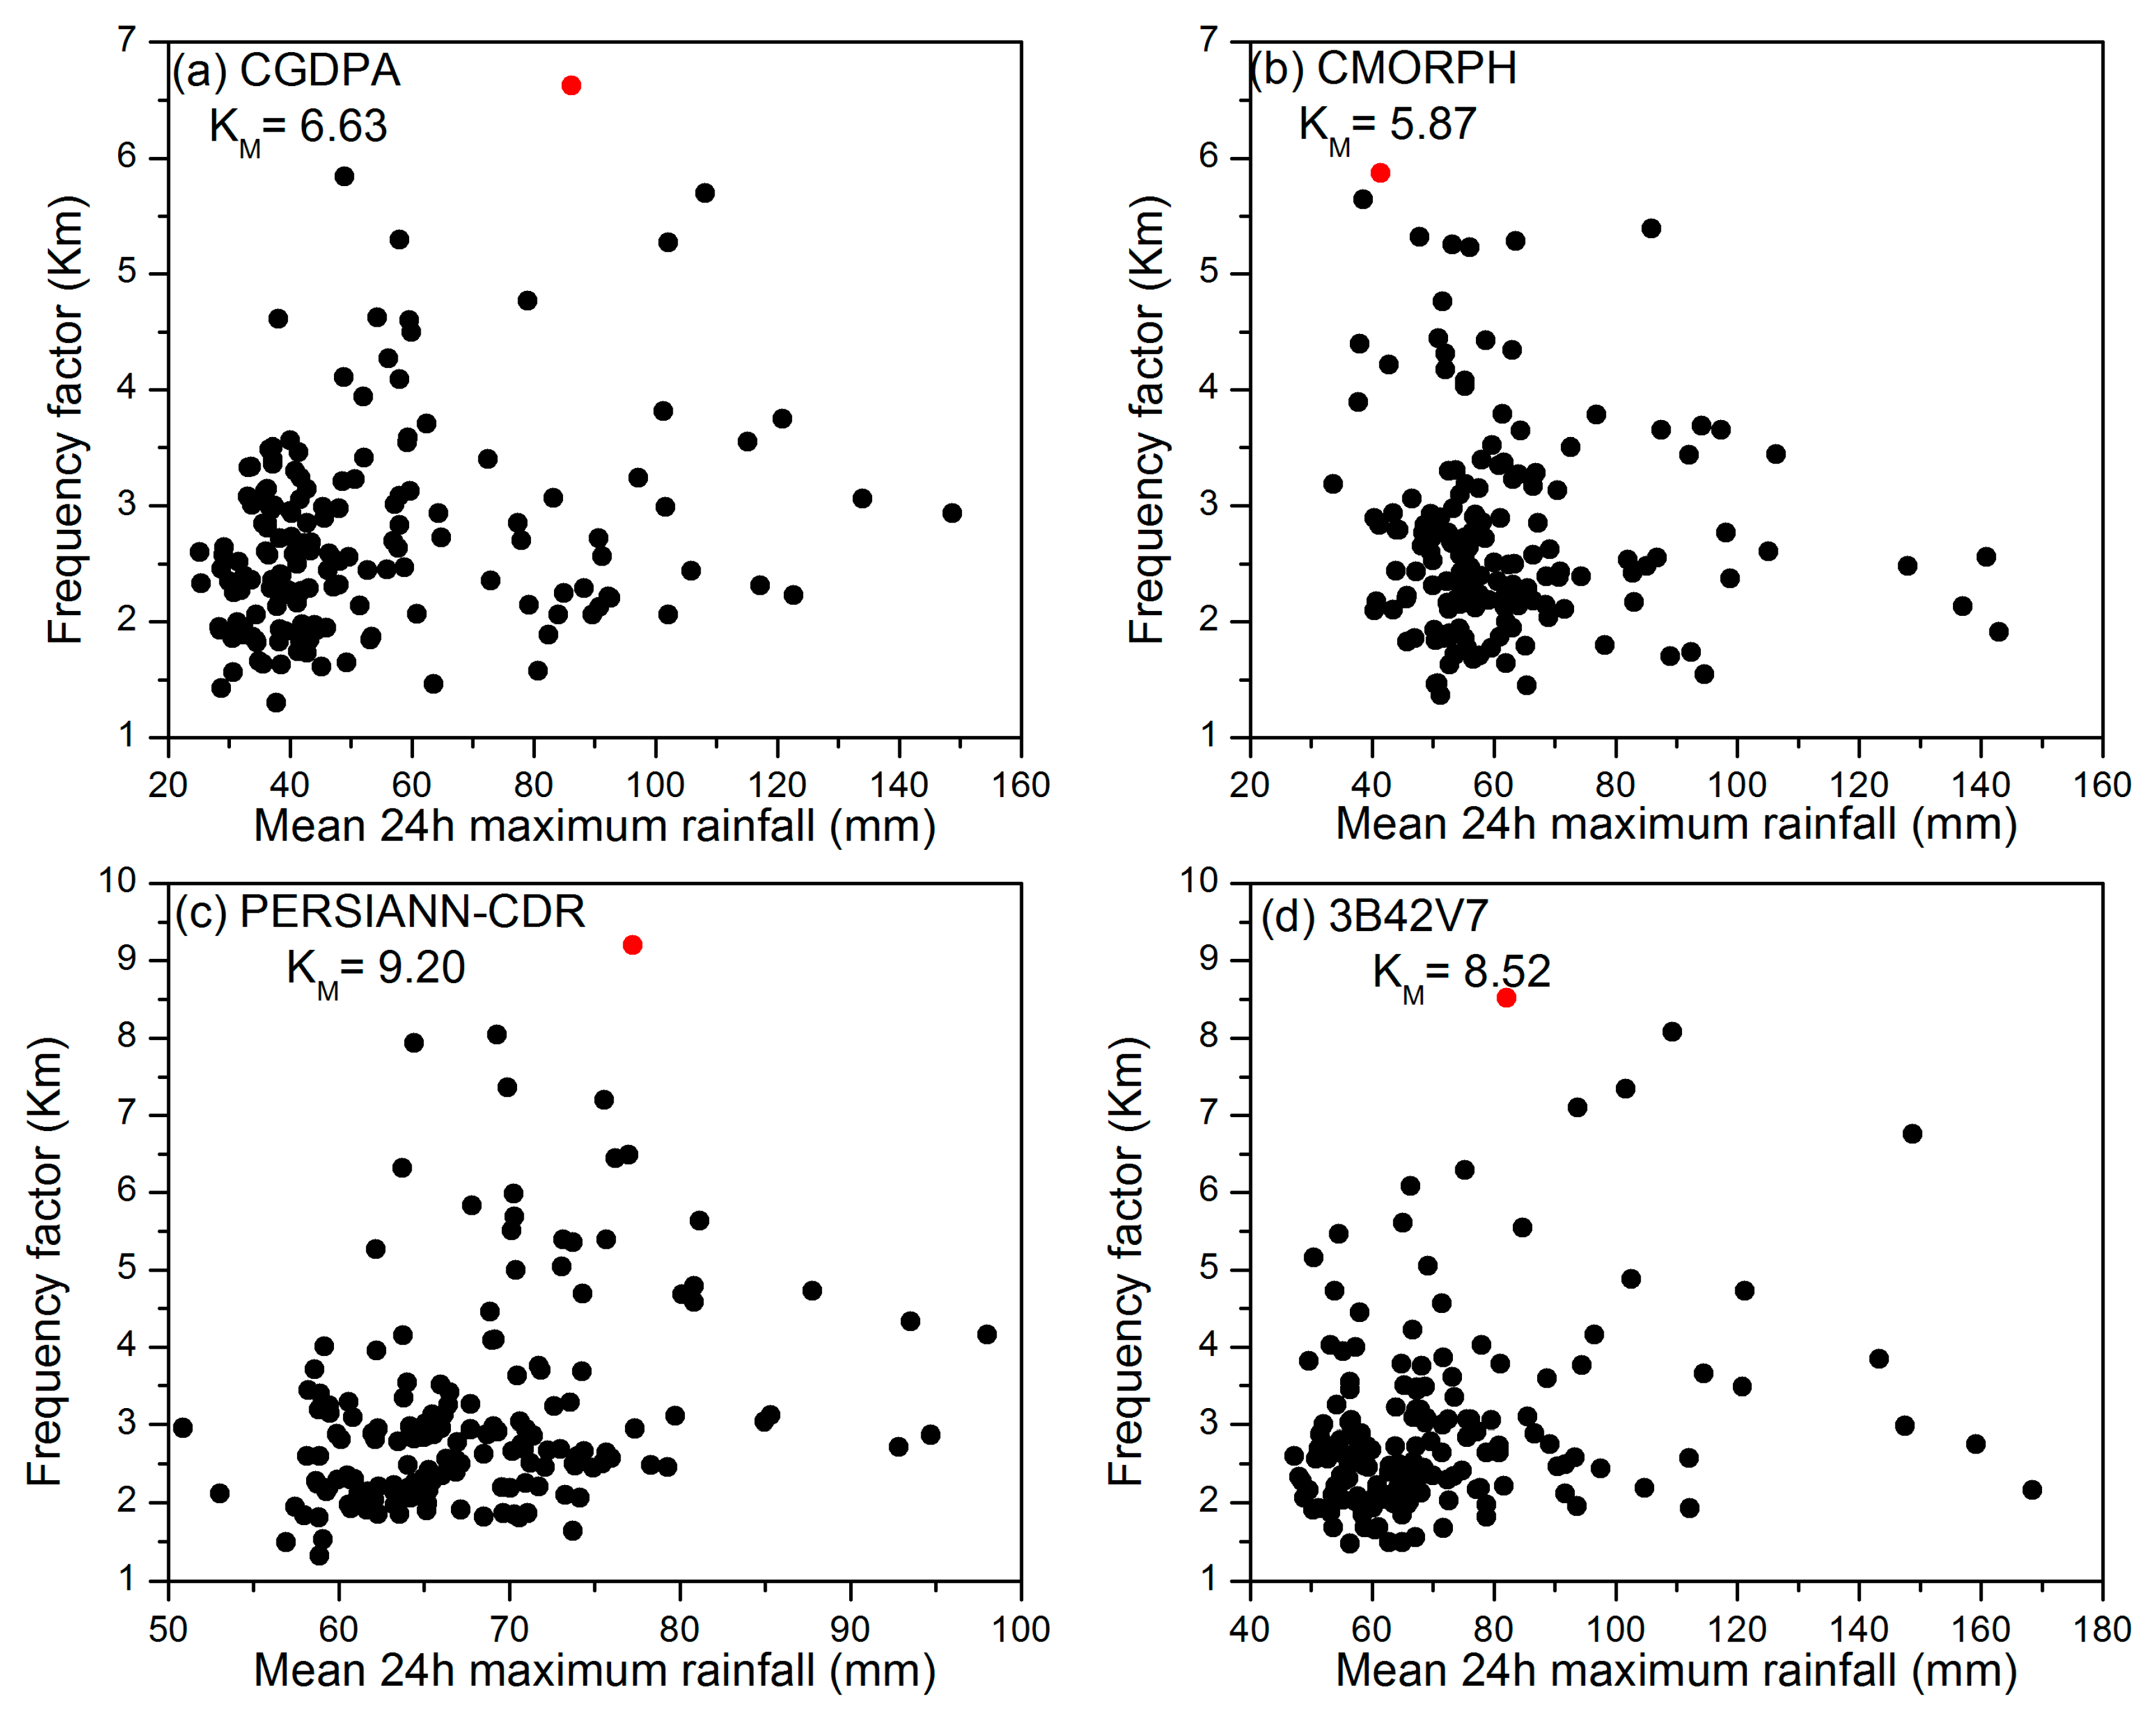
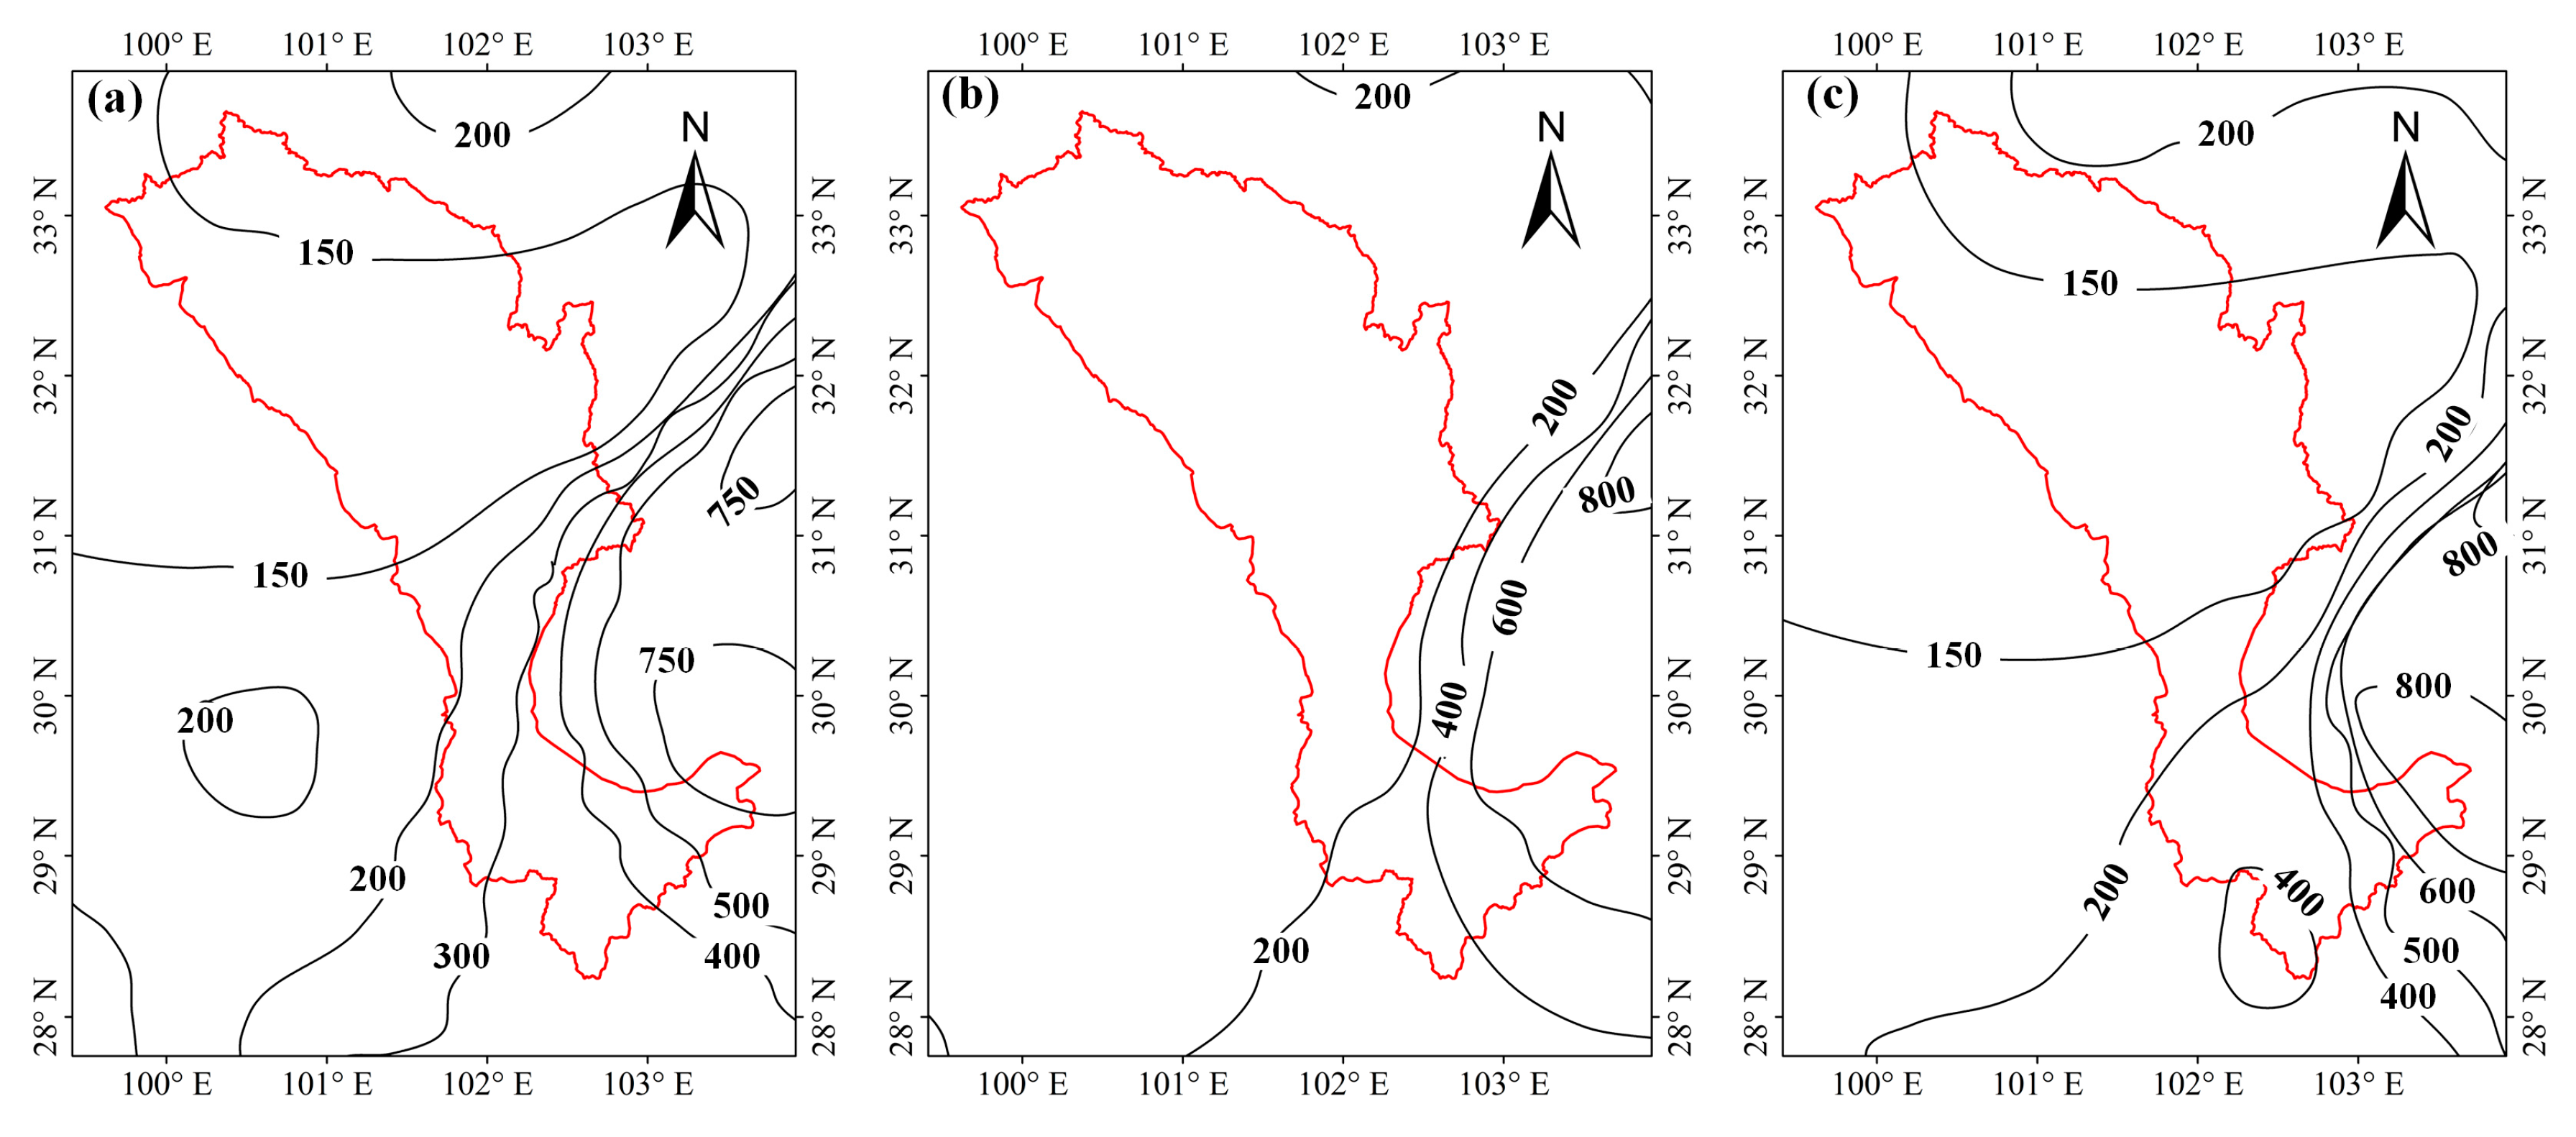
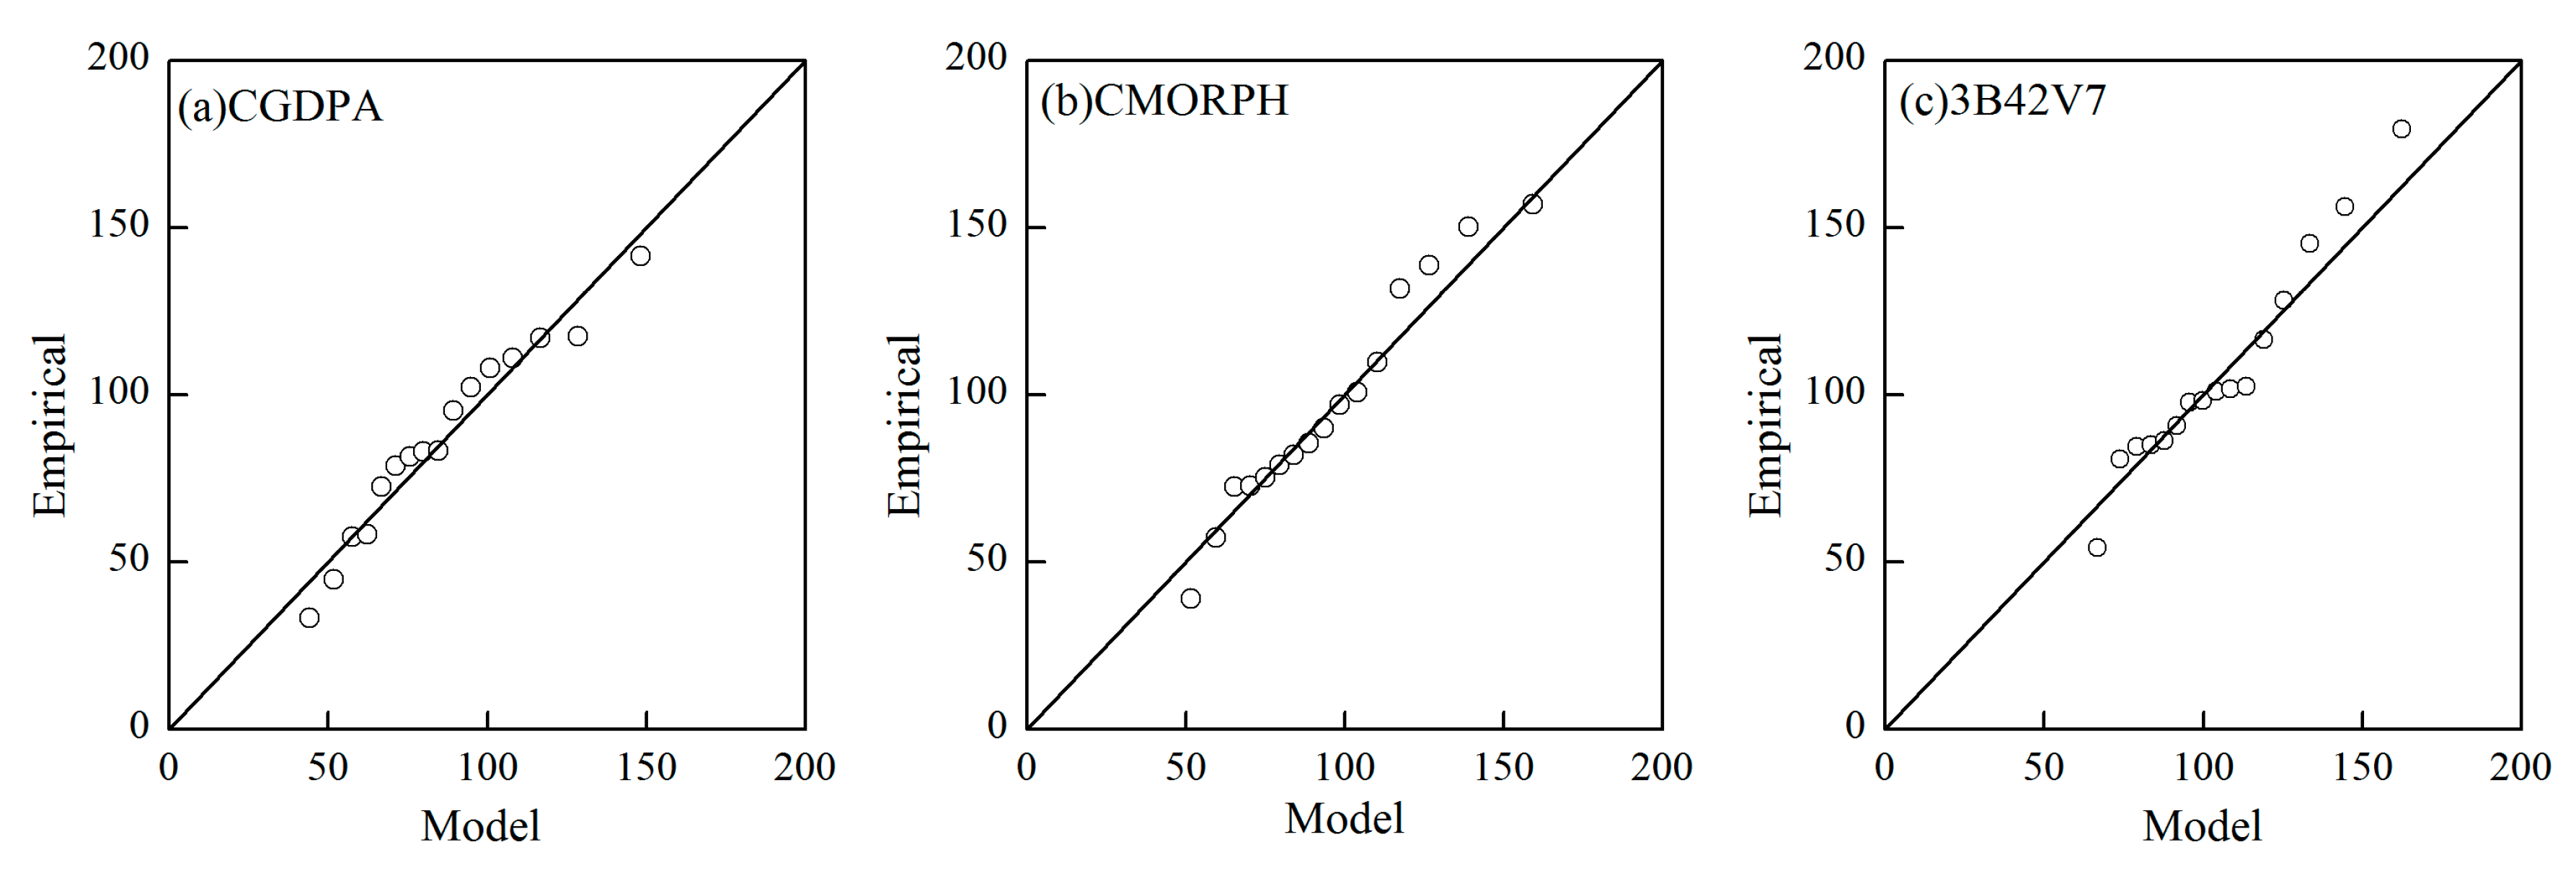
5.2.2. Analysis of the Rationality of PMP Estimates
6. Discussion
7. Conclusions
- CMORPH and 3B42V7 agreed well with gauge-based CGDPA for the period of 1998–2013 at both grid and basin scales. PERSIANN-CDR showed an overestimation in the upstream and an underestimation in the downstream. Moreover, CMORPH and 3B42V7 performed better scores than PERSIANN-CDR in term of capturing the extreme precipitation events, with high CCs (0.68 and 0.71, respectively).
- CMORPH and 3B42V7, the datasets that have better agreements with gauge observations, showed the satisfying performance in PMP estimation and better skills than PERSIANN-CDR in capturing the magnitude and spatial distribution of 24-h PMP. Further analysis of the rationality of PMP estimates also verified the feasibility of PMP results that were derived from CMORPH and 3B42V7 were proper in the Dadu River basin.
Acknowledgments
Author Contributions
Conflicts of Interest
References
- Biswas, A.K.; Tortajada, C. Development and large dams: A global perspective. Int. J. Water Resour. Dev. 2001, 17, 9–21. [Google Scholar] [CrossRef]
- Hossain, F.; Jeyachandran, I.; Pielke, R. Dam safety effects due to human alteration of extreme precipitation. Water Resour. Res. 2010, 46. [Google Scholar] [CrossRef]
- Woldemichael, A.T.; Hossain, F.; Pielke, R.; Beltrán-Przekurat, A. Understanding the impact of dam-triggered land use/land cover change on the modification of extreme precipitation. Water Resour. Res. 2012, 48. [Google Scholar] [CrossRef]
- Yigzaw, W.; Hossain, F.; Kalyanapu, A. Impact of artificial reservoir size and land use/land cover patterns on probable maximum precipitation and flood: Case of folsom dam on the american river. J. Hydrol. Eng. 2012, 18, 1180–1190. [Google Scholar] [CrossRef]
- Chen, L.C.; Bradley, A.A. Adequacy of using surface humidity to estimate atmospheric moisture availability for probable maximum precipitation. Water Resour. Res. 2006, 42. [Google Scholar] [CrossRef]
- Beauchamp, J.; Leconte, R.; Trudel, M.; Brissette, F. Estimation of the summer-fall PMP and PMF of a northern watershed under a changed climate. Water Resour. Res. 2013, 49, 3852–3862. [Google Scholar] [CrossRef]
- Collier, C.; Hardaker, P. Estimating probable maximum precipitation using a storm model approach. J. Hydrol. 1996, 183, 277–306. [Google Scholar] [CrossRef]
- Rakhecha, P.; Clark, C. Revised estimates of one-day probable maximum precipitation (PMP) for India. Meteorol. Appl. 1999, 6, 343–350. [Google Scholar] [CrossRef]
- Rezacova, D.; Pesice, P.; Sokol, Z. An estimation of the probable maximum precipitation for river basins in the Czech Republic. Atmos. Res. 2005, 77, 407–421. [Google Scholar] [CrossRef]
- Svensson, C.; Rakhecha, P. Estimation of probable maximum precipitation for dams in the Hongru river catchment, China. Theor. Appl. Climatol. 1998, 59, 79–91. [Google Scholar] [CrossRef]
- World Meteorological Organization (WMO). Manual on Estimation of Probable Maximum Precipitation (PMP), 3rd ed.; World Meteorological Organization (WMO): Geneva, Switzerland, 2009; ISBN 978-92-63-11045-9. [Google Scholar]
- Rakhecha, P.; Soman, M. Estimation of probable maximum precipitation for a 2-day duration: Part 2—North Indian region. Theor. Appl. Climatol. 1994, 49, 77–84. [Google Scholar] [CrossRef]
- Hershfield, D.M. Estimating the probable maximum precipitation. J. Hydraul. Eng. Div. ASCE 1961, 87, 99–116. [Google Scholar]
- Hershfield, D.M. Method for estimating probable maximum rainfall. J. Am. Water Works Assoc. 1965, 57, 965–972. [Google Scholar]
- Chavan, S.R.; Srinivas, V. Probable maximum precipitation estimation for catchments in Mahanadi river basin. Aquat. Procedia 2015, 4, 892–899. [Google Scholar] [CrossRef]
- Deshpande, N.; Kulkarni, B.; Verma, A.; Mandal, B. Extreme rainfall analysis and estimation of probable maximum precipitation (PMP) by statistical methods over the Indus river basin in India. J. Spat. Hydrol. 2008, 8, 22–35. [Google Scholar]
- Casas, M.C.; Rodríguez, R.; Nieto, R.; Redaño, A. The estimation of probable maximum precipitation. Ann. N. Y. Acad. Sci. 2008, 1146, 291–302. [Google Scholar] [CrossRef] [PubMed]
- Casas, M.C.; Rodríguez, R.; Prohom, M.; Gázquez, A.; Redaño, A. Estimation of the probable maximum precipitation in Barcelona (Spain). Int. J. Climatol. 2011, 31, 1322–1327. [Google Scholar] [CrossRef] [Green Version]
- Fattahi, E.; Noorian, A.; Noohi, K. Comparison of physical and statistical methods for estimating probable maximum precipitation in southwestern basins of Iran. Desert 2011, 15, 127–132. [Google Scholar]
- Shirdeli, A. Probable maximum precipitation 24 h estimation: A case study of Zanjan province of Iran. Manag. Sci. Lett. 2012, 2, 2237–2242. [Google Scholar] [CrossRef]
- Alias, N.E.; Luo, P.; Takara, K. Probable maximum precipitation using statistical method for the Yodo river basin. J. Jpn. Soc. Civ. Eng. Ser. B1 (Hydraul. Eng.) 2013, 69, I_157–I_162. [Google Scholar] [CrossRef]
- Desa, M.M.N.; Noriah, A.B.; Rakhecha, P.R. Probable maximum precipitation for 24 h duration over southeast Asian Monsoon region—Selangor, malaysia. Atmos. Res. 2001, 58, 41–54. [Google Scholar] [CrossRef]
- Desa, M.M.N.; Rakhecha, P.R. Probable maximum precipitation for 24-h duration over an equatorial region: Part 2-Johor, Malaysia. Atmos. Res. 2007, 84, 84–90. [Google Scholar] [CrossRef]
- Rakhecha, P.; Singh, V.P. Applied Hydrometeorology; Springer Science & Business Media: Dordrecht, The Netherlands, 2009; ISBN 978-1-4020-9844-4. [Google Scholar]
- Wu, Y.; Wang, W.; Wang, G. Detecting variation trends of temperature and precipitation for the Dadu river basin, China. Adv. Meteorol. 2016, 2016. [Google Scholar] [CrossRef]
- Tu, Y. Significance of the Power Generation of Dagangshan Hydropower Station on the Development of Dadu River basin. Water Power 2015, 41, 1–4. (In Chinese) [Google Scholar]
- Shen, Y.; Xiong, A. Validation and comparison of a new gauge-based precipitation analysis over mainland China. Int. J. Climatol. 2016, 36, 252–265. [Google Scholar] [CrossRef]
- Xie, P.; Chen, M.; Yang, S.; Yatagai, A.; Hayasaka, T.; Fukushima, Y.; Liu, C. A gauge-based analysis of daily precipitation over East Asia. J. Hydrometeorol. 2007, 8, 607–626. [Google Scholar] [CrossRef]
- Tang, G.; Zeng, Z.; Long, D.; Guo, X.; Yong, B.; Zhang, W.; Hong, Y. Statistical and hydrological comparisons between trmm and gpm level-3 products over a midlatitude basin: Is day-1 imerg a good successor for TMPA 3b42v7? J. Hydrometeorol. 2016, 17, 121–137. [Google Scholar] [CrossRef]
- Tang, G.; Ma, Y.; Long, D.; Zhong, L.; Hong, Y. Evaluation of gpm day-1 imerg and TMPA version-7 legacy products over mainland China at multiple spatiotemporal scales. J. Hydrol. 2016, 533, 152–167. [Google Scholar] [CrossRef]
- Sun, R.; Yuan, H.; Liu, X.; Jiang, X. Evaluation of the latest satellite-gauge precipitation products and their hydrologic applications over the Huaihe River basin. J. Hydrol. 2016, 536, 302–319. [Google Scholar] [CrossRef]
- Guo, H.; Chen, S.; Bao, A.; Behrangi, A.; Hong, Y.; Ndayisaba, F.; Hu, J.; Stepanian, P. Early assessment of Integrated Multi-satellite Retrievals for Global Precipitation Measurement over China. Atmos. Res. 2016, 176, 121–133. [Google Scholar] [CrossRef]
- Chen, X.; Long, D.; Hong, Y.; Zeng, C.; Yan, D. Improved modeling of snow and glacier melting by a progressive two-stage calibration strategy with GRACE and multisource data: How snow and glacier meltwater contributes to the runoff of the Upeer Brahmaputra River basin? Water Resour. Res. 2017, 53, 2431–2466. [Google Scholar] [CrossRef]
- Chen, S.; Hong, Y.; Cao, Q.; Gourley, J.J.; Kirstetter, P.E.; Yong, B.; Tian, Y.; Zhang, Z.; Shen, Y.; Hu, J.; et al. Similarity and difference of the two successive v6 and v7 TRMM multisatellite precipitation analysis performance over China. J. Geophys. Res. Atmos. 2013, 118, 13060–13074. [Google Scholar] [CrossRef]
- Gao, Z.; Long, D.; Tang, G.; Zeng, C.; Huang, J.; Hong, Y. Assessing the potential of satellite-based precipitation estimates for flood frequency analysis in ungauged or poorly gauged tributaries of China’s Yangtze river basin. J. Hydrol. 2017, 550, 478–496. [Google Scholar] [CrossRef]
- Ning, S.; Song, F.; Udmale, P.; Jin, J.; Thapa, B.R.; Ishidaira, H. Error analysis and evaluation of the latest gsmap and imerg precipitation products over eastern China. Adv. Meteorol. 2017, 11, 1–16. [Google Scholar] [CrossRef]
- Yong, B.; Wang, J.; Ren, L.; You, Y.; Xie, P.; Hong, Y. Evaluating four multi-satellite precipitation estimates over Diaoyu islands during typhoon seasons. J. Hydrometeorol. 2017, 17, 1623–1641. [Google Scholar] [CrossRef]
- Zhang, C.; Tang, Q.; Chen, D.; Li, L.; Liu, X.; Cui, H. Tracing changes in atmospheric moisture supply to the drying southwest China. Atmos. Chem. Phys. 2017, 17, 1–19. [Google Scholar] [CrossRef]
- Yong, B.; Chen, B.; Tian, Y.; Yu, Z.; Hong, Y. Error-component analysis of TRMM-based multi-satellite precipitation estimates over mainland China. Remote Sens. 2017, 8, 440. [Google Scholar] [CrossRef]
- Joyce, R.J.; Janowiak, J.E.; Arkin, P.A.; Xie, P. Cmorph: A method that produces global precipitation estimates from passive microwave and infrared data at high spatial and temporal resolution. J. Hydrometeorol. 2004, 5, 487–503. [Google Scholar] [CrossRef]
- Ashouri, H.; Hsu, K.-L.; Sorooshian, S.; Braithwaite, D.K.; Knapp, K.R.; Cecil, L.D.; Nelson, B.R.; Prat, O.P. Persiann-cdr: Daily precipitation climate data record from multisatellite observations for hydrological and climate studies. Bull. Am. Meteorol. Soc. 2015, 96, 69–83. [Google Scholar] [CrossRef]
- Huffman, G.J.; Bolvin, D.T.; Nelkin, E.J.; Wolff, D.B.; Adler, R.F.; Gu, G.; Hong, Y.; Bowman, K.P.; Stocker, E.F. The TRMM multisatellite precipitation analysis (TMPA): Quasi-global, multiyear, combined-sensor precipitation estimates at fine scales. J. Hydrometeorol. 2007, 8, 38–55. [Google Scholar] [CrossRef]
- Shen, Y.; Pan, Y.; Yu, J.; Zhao, P.; Zhou, Z. Quality assessment of hourly merged precipitation product over China. Trans. Atmos. Sci. 2013, 36, 37–46. (In Chinese) [Google Scholar]
- Chow, V.T. A general formula for hydrologic frequency analysis. EOS Trans. AGU 1951, 32, 231–237. [Google Scholar] [CrossRef]
- Lin, B.; Vogel, J. A new look at the statistical estimation of PMP. In Proceedings of the Symposium, Engineering Hydrology, ASCE, San Francisco, CA, USA, 25–30 July 1993; pp. 629–634. [Google Scholar]
- Klein Tank, A.M.G.; Zwiers, F.W.; Zhang, X. Guidelines on Analysis of Extremes in a Changing Climate in Support of Informed Decisions for Adaptation; World Meteorological Organization: Geneva, Switzerland, 2009. [Google Scholar]
- Burke, E.J.; Perry, R.H.; Brown, S.J. An extreme value analysis of uk drought and projections of change in the future. J. Hydrol. 2010, 388, 131–143. [Google Scholar] [CrossRef]
- Oosterbaan, R.J.; Ritzema, H. Frequency and regression analysis. In Drainage Principles and Applications, 2nd ed.; Ritzema, H.P., Ed.; International Institute for Land Reclamation and Improvement (ILRI): Wageningen, The Netherlands, 1994; pp. 175–223. [Google Scholar]
- Hershfield, D.M.; Kohler, M.A. An empirical appraisal of the gumbel extreme-value procedure. J. Geophys. Res. Atmos. 1960, 65, 1737–1746. [Google Scholar] [CrossRef]
- Leese, M.N. Use of censored data in the estimation of gumbel distribution parameters for annual maximum flood series. Water Resour. Res. 1973, 9, 1534–1542. [Google Scholar] [CrossRef]
- Ebert, E.E.; Janowiak, J.E.; Kidd, C. Comparison of near-real-time precipitation estimates from satellite observations and numerical models. Bull. Am. Meteorol. Soc. 2007, 88, 47. [Google Scholar] [CrossRef]
- Yong, B.; Ren, L.L.; Hong, Y.; Wang, J.H.; Gourley, J.J.; Jiang, S.H.; Chen, X.; Wang, W. Hydrologic evaluation of multisatellite precipitation analysis standard precipitation products in basins beyond its inclined latitude band: A case study in laohahe basin, china. Water Resour. Res. 2010, 46. [Google Scholar] [CrossRef]
- Miao, C.; Ashouri, H.; Hsu, K.-L.; Sorooshian, S.; Duan, Q. Evaluation of the persiann-cdr daily rainfall estimates in capturing the behavior of extreme precipitation events over china. J. Hydrometeorol. 2015, 16, 1387–1396. [Google Scholar] [CrossRef]
- Guo, H.; Chen, S.; Bao, A.; Hu, J.; Yang, B.; Stepanian, P.M. Comprehensive evaluation of high-resolution satellite-based precipitation products over china. Atmosphere 2016, 7, 6. [Google Scholar] [CrossRef]
- Yang, Y.; Luo, Y. Evaluating the performance of remote sensing precipitation products cmorph, persiann, and tmpa, in the arid region of northwest china. Theor. Appl. Climatol. 2014, 118, 429–445. [Google Scholar] [CrossRef]
- Dinku, T.; Ceccato, P.; Grover-Kopec, E.; Lemma, M.; Connor, S.J.; Ropelewski, C.F. Validation of satellite rainfall products over east Africa’s complex topography. Int. J. Remote Sens. 2007, 28, 1503–1526. [Google Scholar] [CrossRef]
- Chen, S.; Hong, Y.; Cao, Q.; Tian, Y.; Hu, J.; Zhang, X.; Li, W.; Carr, N.; Shen, X.; Qiao, L. Intercomparison of precipitation estimates from wsr-88d radar and trmm measurement over continental united states. IEEE Trans. Geosci. Remote 2015, 53, 4444–4456. [Google Scholar] [CrossRef]
- Hirpa, F.A.; Gebremichael, M.; Hopson, T. Evaluation of high-resolution satellite precipitation products over very complex terrain in ethiopia. J. Appl. Meteorol. Clim. 2010, 49, 1044–1051. [Google Scholar] [CrossRef]
- Guo, H.; Chen, S.; Bao, A.; Hu, J.; Gebregiorgis, A.S.; Xue, X.; Zhang, X. Inter-comparison of high-resolution satellite precipitation products over central asia. Remote Sens. 2015, 7, 7181–7211. [Google Scholar] [CrossRef]
- Li, Z.; Yang, D.; Hong, Y. Multi-scale evaluation of high-resolution multi-sensor blended global precipitation products over the yangtze river. J. Hydrol. 2013, 500, 157–169. [Google Scholar] [CrossRef]
- Wang, G. Principles and Methods of PMP/PMF Calculations; China Hydrology and Hydroelectric Press and Yellow River Water Resources Publishing House: Beijing, China; Zhenzhou, China, 1999; ISBN 978-7-80621-323-0. (In Chinese) [Google Scholar]
- Wang, J. Study of design storms in China. J. Hydrol. 1987, 96, 279–291. [Google Scholar] [CrossRef]
- Wang, G.; Li, B.; Wang, J. World’s greatest known point rainfalls and their enveloping curve formula. Adv. Water Sci. 2006, 17, 824. [Google Scholar]
- Shen, Y.; Xiong, A.Y.; Wang, Y.; Xie, P.P. Performance of high-resolution satellite precipitation products over China. J. Geophys. Res. Atmos. 2010, 115. [Google Scholar] [CrossRef]
- Gebregiorgis, A.S.; Tian, Y.; Peters-Lidard, C.D.; Hossain, F. Tracing hydrologic model simulation error as a function of satellite rainfall estimation bias components and land use and land cover conditions. Water Resour. Res. 2012, 48. [Google Scholar] [CrossRef]


| Short Name | Full Name and Details | Temporal Resolution | Spatial Resolution | Input Data | Retrieval Algorithm | References |
|---|---|---|---|---|---|---|
| CMORPH | Climate Prediction Center (CPC) MORPHing technique | Daily | 0.25 | 1998–2013 | Morphing technique | [40] |
| PERSIANN-CDR | Precipitation Estimation from Remotely Sensed Information using Artificial Neural Networks (PERSIANN) Climate Data Record (CDR) | Daily | 0.25 | 1983–2013 | Adaptive artificial neural network | [41] |
| 3B42V7 | Tropical Rainfall Measuring Mission (TRMM) Multi-satellite Precipitation Analysis (TMPA) 3B42 Version 7 | Daily | 0.25 | 1998–2013 | GPCC monthly gauge observation to correct this bias of 3B42RT | [42] |
| Products | CC | RMSE (mm) | ME (mm) | MAE (mm) | BIAS (%) | POD | FAR | CSI |
|---|---|---|---|---|---|---|---|---|
| CMORPH | 0.66 ** | 5.13 | −0.38 | 2.27 | −14.08 | 0.78 | 0.47 | 0.46 |
| PERSIANN-CDR | 0.55 ** | 6.06 | 0.13 | 2.70 | 4.63 | 0.81 | 0.45 | 0.49 |
| 3B42V7 | 0.70 ** | 5.25 | −0.18 | 2.18 | −6.76 | 0.77 | 0.37 | 0.53 |
| Products | CC | RMSE (mm) | ME (mm) | MAE (mm) | BIAS (%) | POD | FAR | CSI |
|---|---|---|---|---|---|---|---|---|
| CMORPH | 0.78 ** | 2.37 | −0.27 | 2.30 | −10.67 | 0.93 | 0.29 | 0.67 |
| PERSIANN-CDR | 0.68 ** | 3.45 | 0.21 | 2.79 | 8.05 | 0.94 | 0.21 | 0.76 |
| 3B42V7 | 0.83 ** | 2.15 | −0.19 | 2.39 | −7.24 | 0.95 | 0.23 | 0.74 |
| CMORPH | PERSIANN-CDR | 3B42V7 | |
|---|---|---|---|
| The highest value of annual maximum daily precipitation | 0.68 ** | 0.08 | 0.71 ** |
| The mean of annual maximum daily precipitation | 0.76 ** | 0.62 ** | 0.83 ** |
| 24-h PMP | 0.63 ** | −0.08 | 0.70 ** |
© 2017 by the authors. Licensee MDPI, Basel, Switzerland. This article is an open access article distributed under the terms and conditions of the Creative Commons Attribution (CC BY) license (http://creativecommons.org/licenses/by/4.0/).
Share and Cite
Yang, Y.; Tang, G.; Lei, X.; Hong, Y.; Yang, N. Can Satellite Precipitation Products Estimate Probable Maximum Precipitation: A Comparative Investigation with Gauge Data in the Dadu River Basin. Remote Sens. 2018, 10, 41. https://doi.org/10.3390/rs10010041
Yang Y, Tang G, Lei X, Hong Y, Yang N. Can Satellite Precipitation Products Estimate Probable Maximum Precipitation: A Comparative Investigation with Gauge Data in the Dadu River Basin. Remote Sensing. 2018; 10(1):41. https://doi.org/10.3390/rs10010041
Chicago/Turabian StyleYang, Yuan, Guoqiang Tang, Xiaohui Lei, Yang Hong, and Na Yang. 2018. "Can Satellite Precipitation Products Estimate Probable Maximum Precipitation: A Comparative Investigation with Gauge Data in the Dadu River Basin" Remote Sensing 10, no. 1: 41. https://doi.org/10.3390/rs10010041