Article

Early Detection of Vitality Changes of Multi-Temporal Norway Spruce Laboratory Needle Measurements—The Ring-Barking Experiment

1
Department of Remote Sensing, Institute of Geography and Geology, University of Wuerzburg, Am Hubland, D-97074 Wuerzburg, Germany
2
Thünen Institute of Forest Ecosystems, Alfred-Moeller-Strasse 1, D-16225 Eberswalde, Germany
3
German Remote Sensing Data Center (DFD), German Aerospace Center (DLR), Muenchener Strasse 20, D-82234 Wessling, Germany
*
Author to whom correspondence should be addressed.
Remote Sens. 2018, 10(1), 57; https://doi.org/10.3390/rs10010057
Submission received: 8 November 2017 / Revised: 22 December 2017 / Accepted: 28 December 2017 / Published: 3 January 2018

Abstract

:
The focus of this analysis is on the early detection of forest health changes, specifically that of Norway spruce (Picea abies L. Karst.). In this analysis, we planned to examine the time (degree of early detection), spectral wavelengths and appropriate method for detecting vitality changes. To accomplish this, a ring-barking experiment with seven subsequent laboratory needle measurements was carried out in 2013 and 2014 in an area in southeastern Germany near Altötting. The experiment was also accompanied by visual crown condition assessment. In total, 140 spruce trees in groups of five were ring-barked with the same number of control trees in groups of five that were selected as reference trees in order to compare their development. The laboratory measurements were analysed regarding the separability of ring-barked and control samples using spectral reflectance, vegetation indices and derivative analysis. Subsequently, a random forest classifier for determining important spectral wavelength regions was applied. Results from the methods are consistent and showed a high importance of the visible (VIS) spectral region, very low importance of the near-infrared (NIR) and minor importance of the shortwave infrared (SWIR) spectral region. Using spectral reflectance data as well as indices, the earliest separation time was found to be 292 days after ring-barking. The derivative analysis showed that a significant separation was observed 152 days after ring-barking for six spectral features spread through VIS and SWIR. A significant separation was detected using a random forest classifier 292 days after ring-barking with 58% separability. The visual crown condition assessment was analysed regarding obvious changes of vitality and the first indication was observed 302 days after ring-barking as bark beetle infestation and yellowing of foliage in the ring-barked trees only. This experiment shows that an early detection, compared with visual crown assessment, is possible using the proposed methods for this specific data set. This study will contribute to ongoing research for early detection of vitality changes that will support foresters and decision makers.

Graphical Abstract

1. Introduction

Climate change has the potential to impact forest and tree species composition. Increased productivity rates may also occur, but only when disturbance events are absent. Short-term changes of disturbance regimes can cause long-term effects on these forest ecosystems. Owing to the historical development in forest management practices in Germany, single aged and homogeneous forest stands are primarily comprised of Norway spruce (Picea abies L. Karst.). In such areas, there is evidence that climate change affects significantly spruce stands beyond natural growing areas [1] and will further increase the vulnerability of spruce in these areas. Increased vulnerability has the potential to lead to higher degrees of stress in the forest. Levitt [2] defines stress as environmental factors that act unfavourably to living organisms. Stress factors can be distinguished between biotic and abiotic factors. Abiotic factors are non-living, such as heavy rainfalls, storm events, mineral shortage and frost. Biotic factors are of living kinds, such as fungi or insects. As stress is a routine event and the effects are dose-dependent [3], it is important to determine at which point the tolerance limit is exceeded. Depending on the strength of a given stress event, this can lead to severe damage or even plant death.
In forest management practice in Germany, tree status and their damage are observed yearly within 16 × 16 km plots. The focus is placed on visual crown condition assessment with respect to defoliation and discolouration. Such assessments are spatially limited and cost intensive. As such, spectral methods using remote sensing offers a cost-efficient alternative. Spectroscopy has been shown to be a tool that has the potential for determining early onset stress. Forest stress, and hence forest health, can be retrieved by changes of biochemical and biophysical parameters such as chlorophyll, carotenoid, anthocyanin, lignin and water content that can be observed with spectral measurements. In particular, changes in pigment absorption regions (480–760 nm) can be linked to decreasing forest health induced by various types of stress [4,5,6,7,8,9]. Based on these findings, many studies have focussed on the early detection of forest health. Cheng et al. [10] have analysed the spectral responses of ring-barked versus bark beetle infested trees on the needle level using wavelet analysis. Their findings showed that ring-barking affects the pigment absorption wavelength regions, whereas changes caused by bark beetle infestation were observed water absorption features. Separability of bark beetle infested and healthy trees was also examined in Niemann et al. [11] on the crown level using hyperspectral data. In this work, it was concluded that an early detection was possible using derivative and separately continuum removal within the red-edge and water features. Fassnacht et al. [12] has investigated early detection of bark beetle with high accuracy using a triangular vegetation index adjusted with wavelengths preselected by a genetic algorithm and known vegetation indices. Contrary to this, Fassnacht et al. [13] resulted in no separability of stressed trees in the form of bark beetle attack from reference trees using the same data set. The methods were based on 1st derivative and continuum removal on selected spectral areas using a genetic algorithm. In addition, Lausch et al. [14], using the same data set again, resulted in low separability between stressed and healthy trees using stress related vegetation indices as well as derivative band ratios. Subsequently, Lausch et al. [14] used a decision tree algorithm for selecting the most important methods to separate stressed and healthy trees.
The results of these studies have demonstrated that early onset stress detection is a difficult task. However, studies based on dual-temporal data such as Cheng et al. [10] (needle level) and Niemann et al. [11] (crown level) resulted in higher accuracies than mono-temporal studies [12,13,14]. Almost all of the described studies make use of derivative data with some making use of preselected stress relevant vegetation indices. Additionally, these approaches also applied feature selection methods to highlight key spectral features related to stress.
Index calculation allows for preselected spectral wavelengths for deriving pigment, water content or other constituents. Derivatives analysis allows for an analysis of the full spectral range focussing on spectral shape. Inflection points of spectral data are returned as peaks in derivative analysis that can be used to highlight the red-edge inflection point and can be used for further metrics [4,15,16,17,18,19,20].
By increasing the temporal resolution of observations of early onset stress as well as using well known metrics, such as indices and derivative data, an improvement of early vitality decline detection may result. In this work, we assess early detection potential using a ring-barking experiment within a mature managed spruce forest in southeastern Germany. This experiment was implemented with multi-temporal spectral needle measurements spanned over two subsequent years. Ring-barking is used to the interrupt the vascular and formative tissue as well as the bark of a tree in order to reduce the tree vitality over the long term and leads towards a slow die-off. The intention of using a ring-barking experiment was to mimic various types of stress.
The objective of this study is thus to determine if early onset stress of Norway spruce in Germany can be detected using spectral reflectance data, index and derivative analysis as well as a random forest classifier for feature selection. The focus is on selecting the most appropriate method, earliest possible detection time and important spectral regions. From this objective, the resulting research questions can be answered:
  • Is it possible to detect change of vitality shortly after the trees are affected by an unspecified stress while the trees still appear green and healthy?
  • Which spectral wavelength regions are highlighted using different methods for identifying various stages of development—and, subsequently, is a time relation detectable?
  • How can ring-barking effects be explained with plant physiology in relation to spectroscopy?
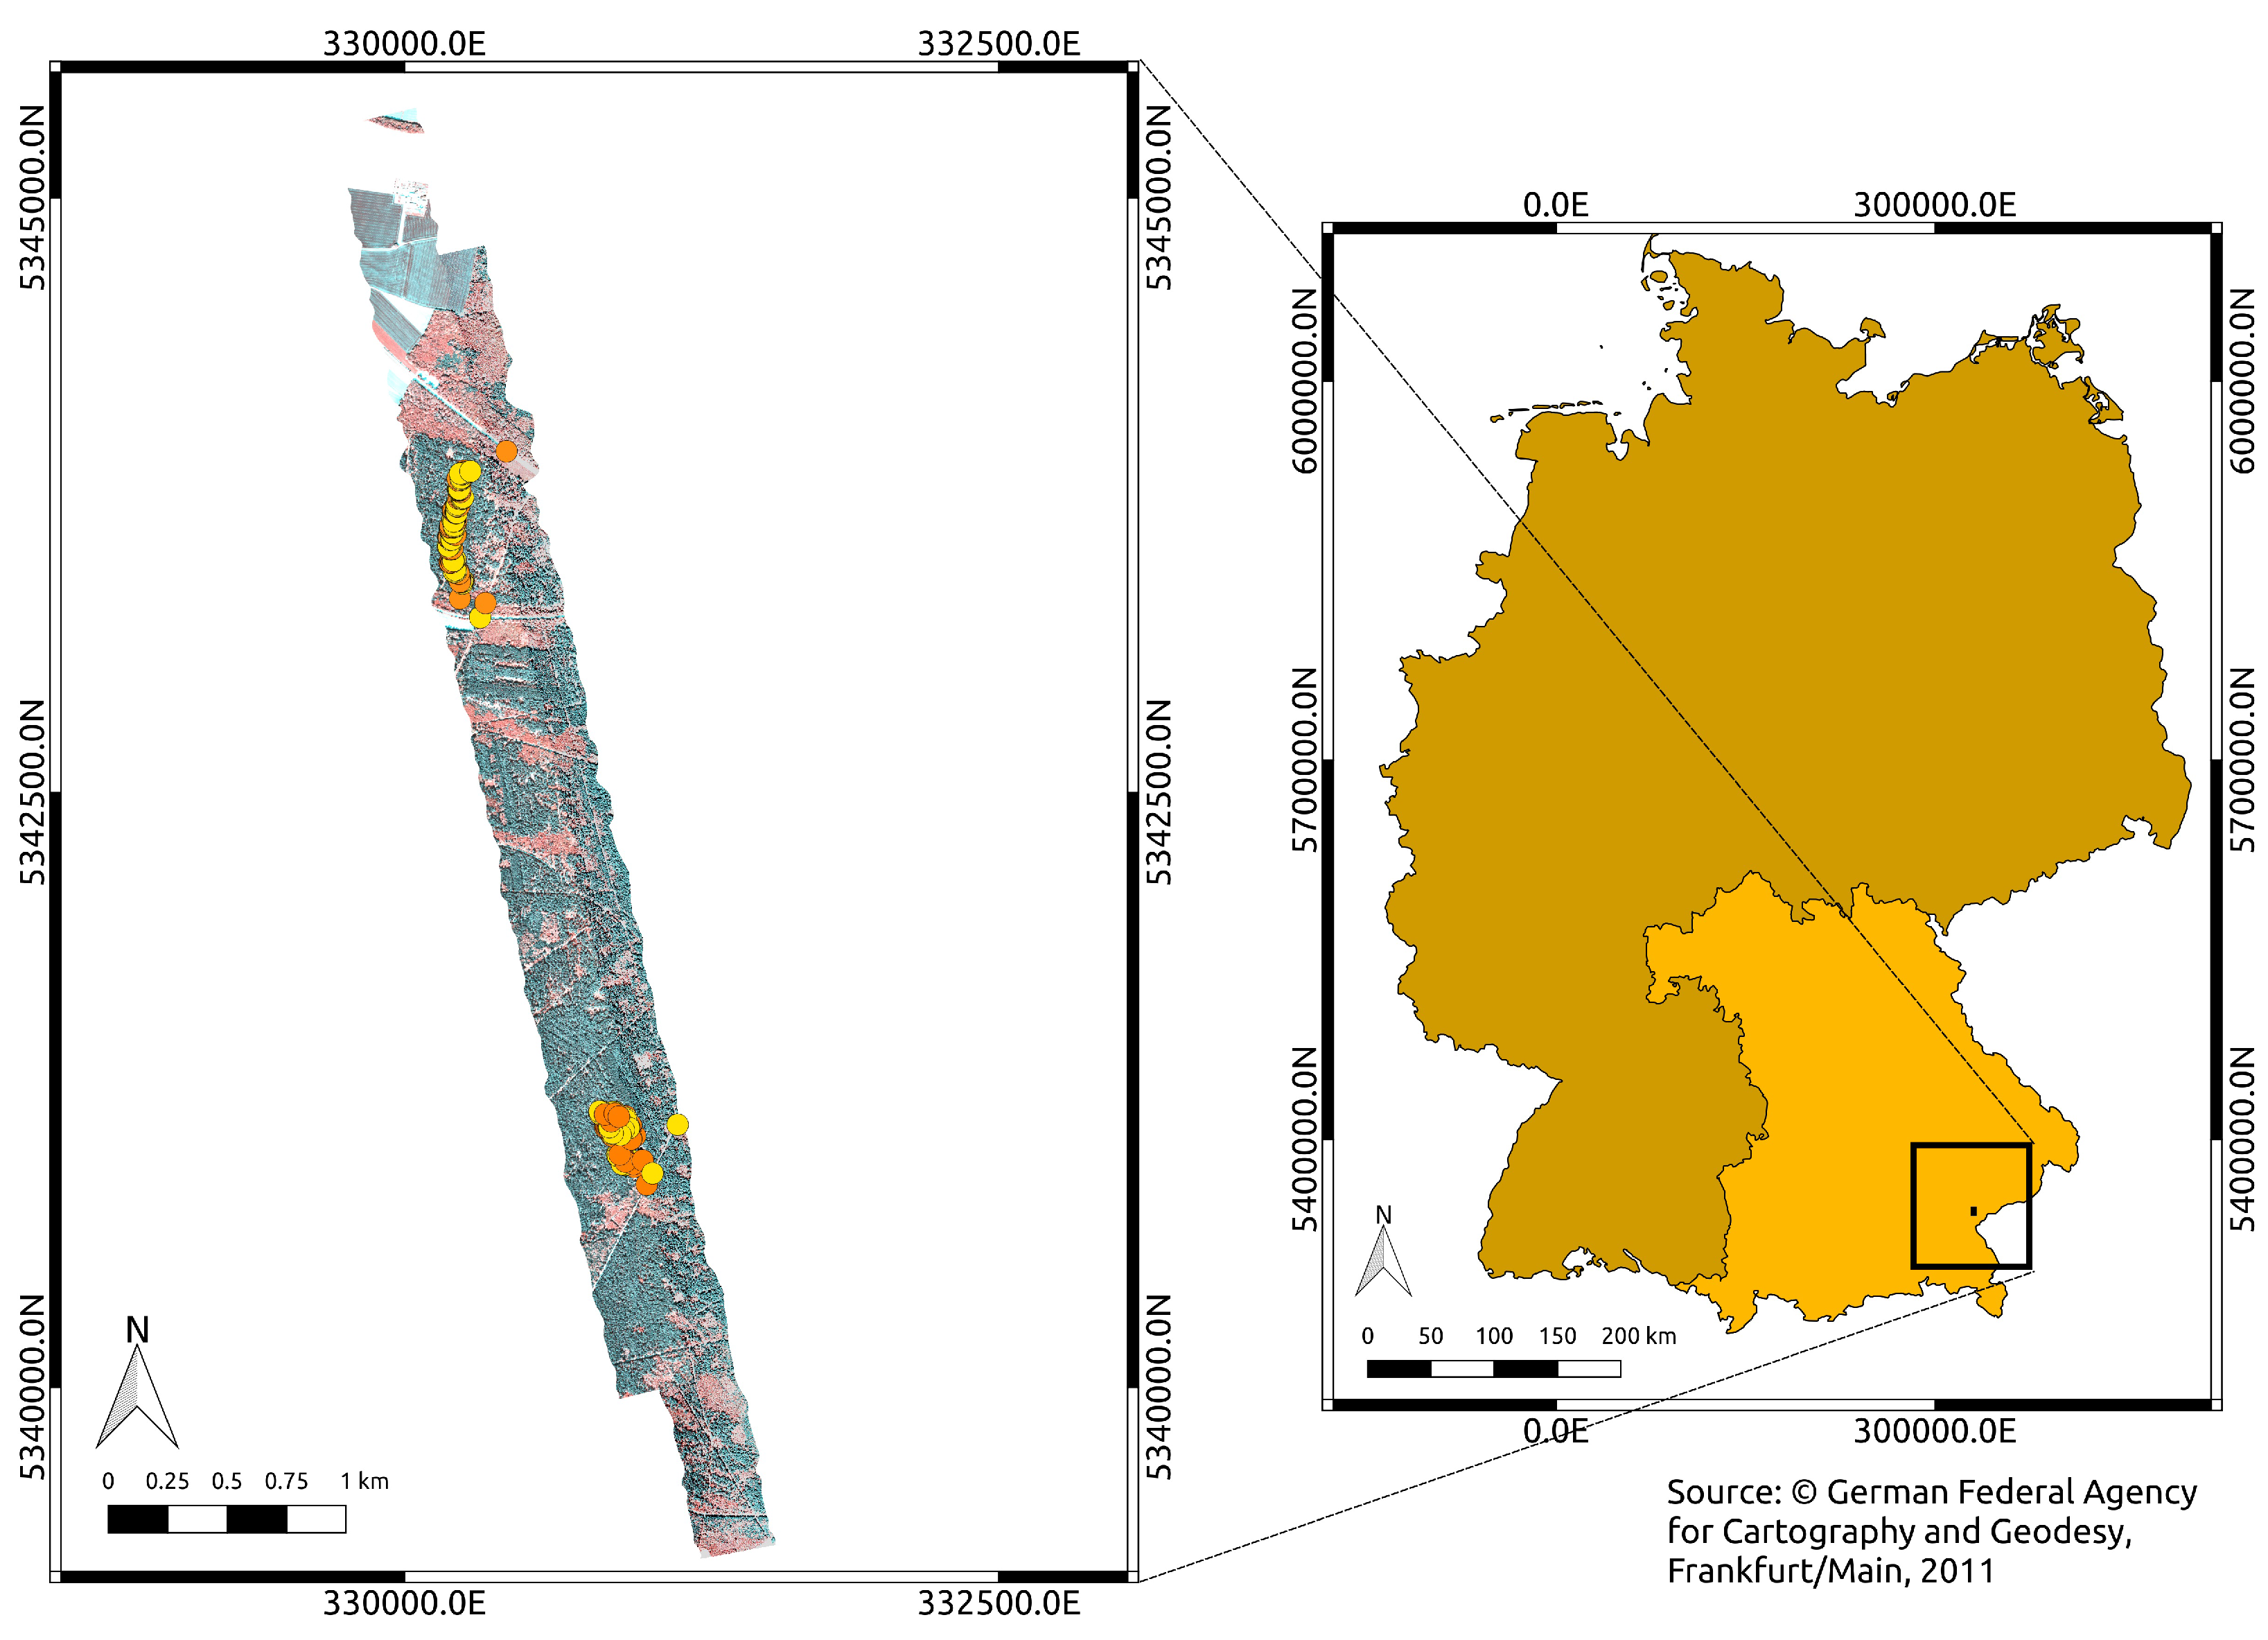
2. Study Area

The study area includes two mature, even aged and managed temperate Norway Spruce (Picea abies L. Karst.) forest sites in southeastern Germany near Altötting ( 48 13 N, 12 43 E) belonging to the forest district of Wasserburg (see Figure 1). The two designated forest stands Einsiedel and Gaderbogen are of age 80–100 and 60-year old spruce trees, respectively. The climate is warm-temperate and characterised by the change from maritime in the west to continental in the east. Soils are mostly luvisol and cambisol [21]. The mean annual precipitation of the study area amounts to approximately 979 mm with mean annual temperature of 8.3 °C in an elevation of approximately 440 m above sea-level.

3. Methods

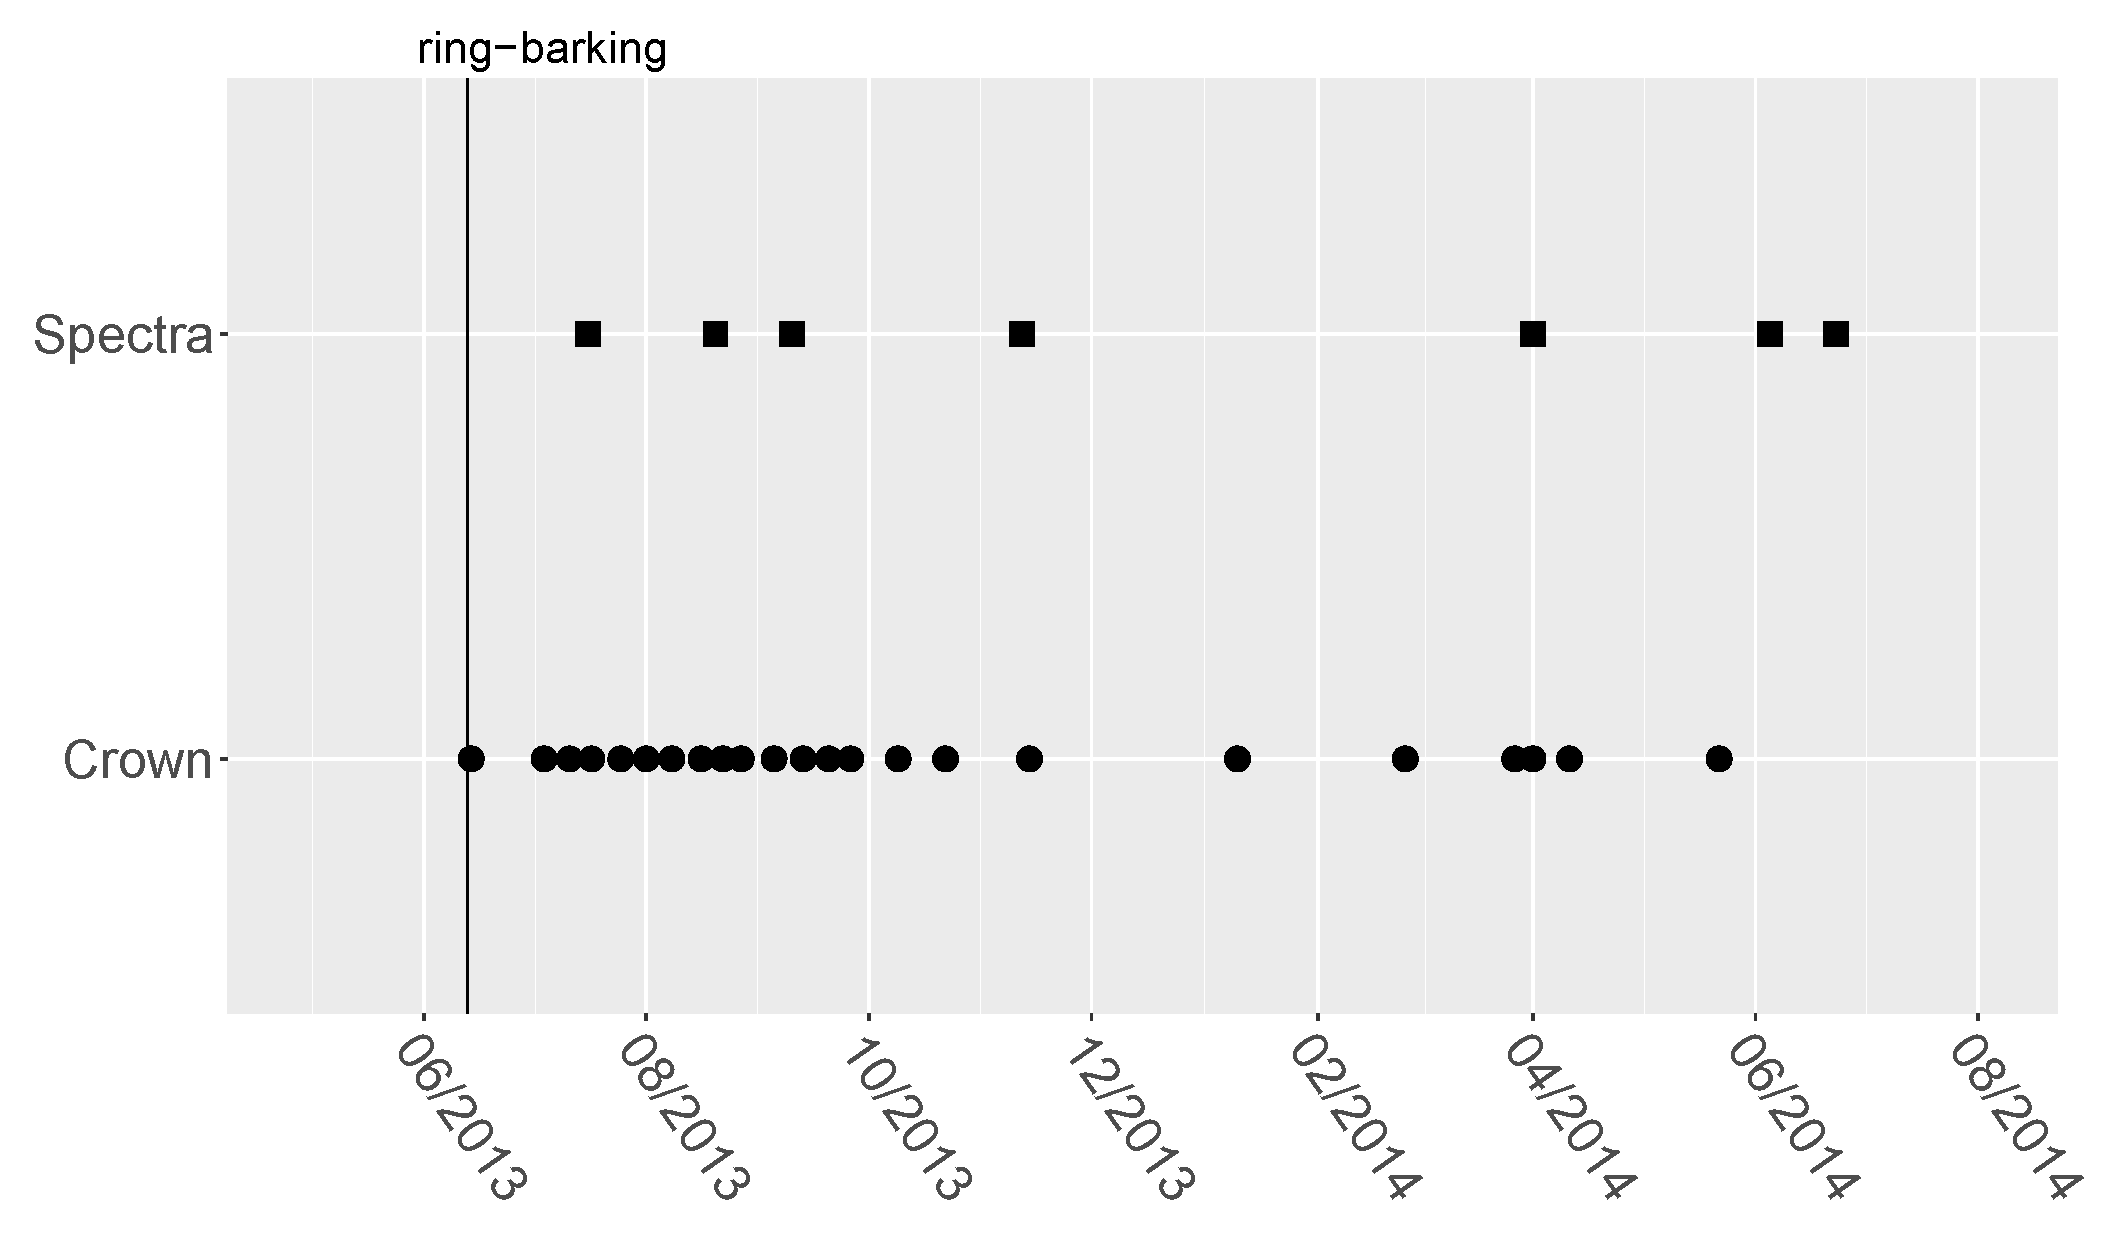
3.1. Ring-Barking Experiment

The experimental set up of the ring-barking experiment contains several airborne hyperspectral observations as well as needle reflectance spectra measurements acquired in the laboratory. On 13th June 2013, 140 vital appearing trees in groups of five trees were selected as ring-barked trees. Additionally, 140 control trees in groups of five close to the ring-barked trees were selected as a reference for unstressed development. Coordinates of tree groups were taken for linkage between results of airborne hyperspectral and laboratory data. The amount of ring-barked and control trees was chosen due to later upscaling of laboratory analysis results to airborne hyperspectral data. The bark, phloem, cambium and primary xylem was removed in a stripe around the preselected ring-barking trees. The cambium is the formative tissue and responsible for secondary growth with producing xylem (inward) and phloem (outward) for water, nutrient and assimilating exchange between root and crown. Through interruption, the tree will be stressed and its vitality declines in the long term. For laboratory needle spectral measurements, needle samples of the upper tree crowns of 16 fixed control and 16 fixed ring-barked trees were collected by tree climbers on seven different dates during 2013 and 2014. Afterwards, spectral measurements were taken in the laboratory on these samples, which were divided into the most recent four needle age classes along a given sample. These four age classes were measured independently to assess if certain age classes showed distinct development during the experiment.
For reference, visual changes in tree crown condition were assessed during the experiment period. The tree crown condition was assessed for yellowing and defoliation effects as well as occurrence of bark beetle for control and ring-barked trees. An overview of the chronological observation distribution is shown in Figure 2.
The occurrences of two stress events during the crown condition assessment were chosen for reference. First, the infestation with bark beetle is taken as a reference. In general, most bark beetle species attack already weakened mature trees and cause a final die-off. Due to the ring-barking event, trees were weakened artificially. As a matter of fact, many of these ring-barked trees were infested by bark beetles. Infestation was visually observed to begin on April 2014 (11th April 2014) (see Figure 3). This time is taken as the reference date for visual detectable changes. Additionally, yellowing is another indicator for date of changes. Yellowing is a natural senescence symptom in deciduous but also coniferous tree species when the oldest needle age is shed from the tree. This natural cycle was also observed in the two-year period. Here, another occurrence of yellowing is detectable for the ring-barked trees starting in April 2014 (11th April 2014) (see Figure 3). This date is taken as reference for a detectable change within the health status of the observed trees, the same as the occurrence of bark beetle.

3.2. Spectral Measurements
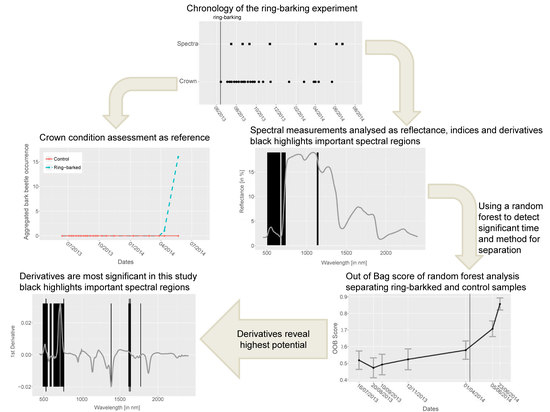
Needle sample reflectance spectra were measured under controlled conditions to generate a dataset without influences by atmospheric conditions or variable illumination. Measurements over the 350 to 2500 nm wavelength region were conducted with an ASD (Analytical Spectral Devices Inc., Boulder, CO, USA) FieldSpec-Pro spectroradiometer that was equipped with an 8°-fore optic. The laboratory is covered with matt black pond foil that has a continuously dark reflection and no significant absorption features [22]. For spectral analysis, the needles were divided into the last four age classes separated by sprouts, cut off the twigs and each age class was separately placed on a plate covered with a matt black 3M varnish to minimise background reflection. The light source was provided by two quartz halogen lamps with a power of 300 Watt each. Spectra were measured with a distance of 15 cm between needles and fore optic. To account for the irregular topography of the sample surface, each measurement was repeated eight times and in between turned by 90°, which was repeated a second time. This resulted in 2048 measurements per date (16 trees per ring-barked and control respectively, four age classes, and 16 measurements each) (see Table 1). The spectrometer was calibrated using a spectralon with a high and constant reflectance in the visible and infrared spectral region for reducing continual measurement errors. Subsequently, the measurements were processed using AS Toolbox v1.13 developed at German Aerospace Center (DLR) [23] for spectralon and jump correction. The mean and standard deviation of these 16 measurements were calculated. A PCA (Principal Component Analysis) for separating the different age classes were run to examine the similarity of age classes between ring-barked and control samples and resulted in significant similarity. Acquisition and processing of needles and laboratory measurements are further described in Einzmann et al. [24].

3.3. Data Analysis

Before any calculation is performed, the spectral measurement data were standardised without centering the data. This results in comparable data with reduced influence of measurement differences especially important for multi-temporal measurements. The centering of data was not chosen, owing to negative values with index calculation. Additionally, the data were grouped by ring-barked and control groups for the two study sites.
The analysis was divided into four parts. The first three parts included analysis of spectra, indices and derivatives. A significance analysis using a one sample Mann–Whitney U test was applied for retrieving information about time of change between ring-barked and control trees. The significance level p = 0.05 was chosen for data comparison. The fourth part of the analysis was a random forest classification using all results from the earlier levels (spectra, indices, derivatives) to determine significant bands and methods.
  • The spectral data were analysed for their separability into ring-barked and control group using a Mann–Whitney-U test.
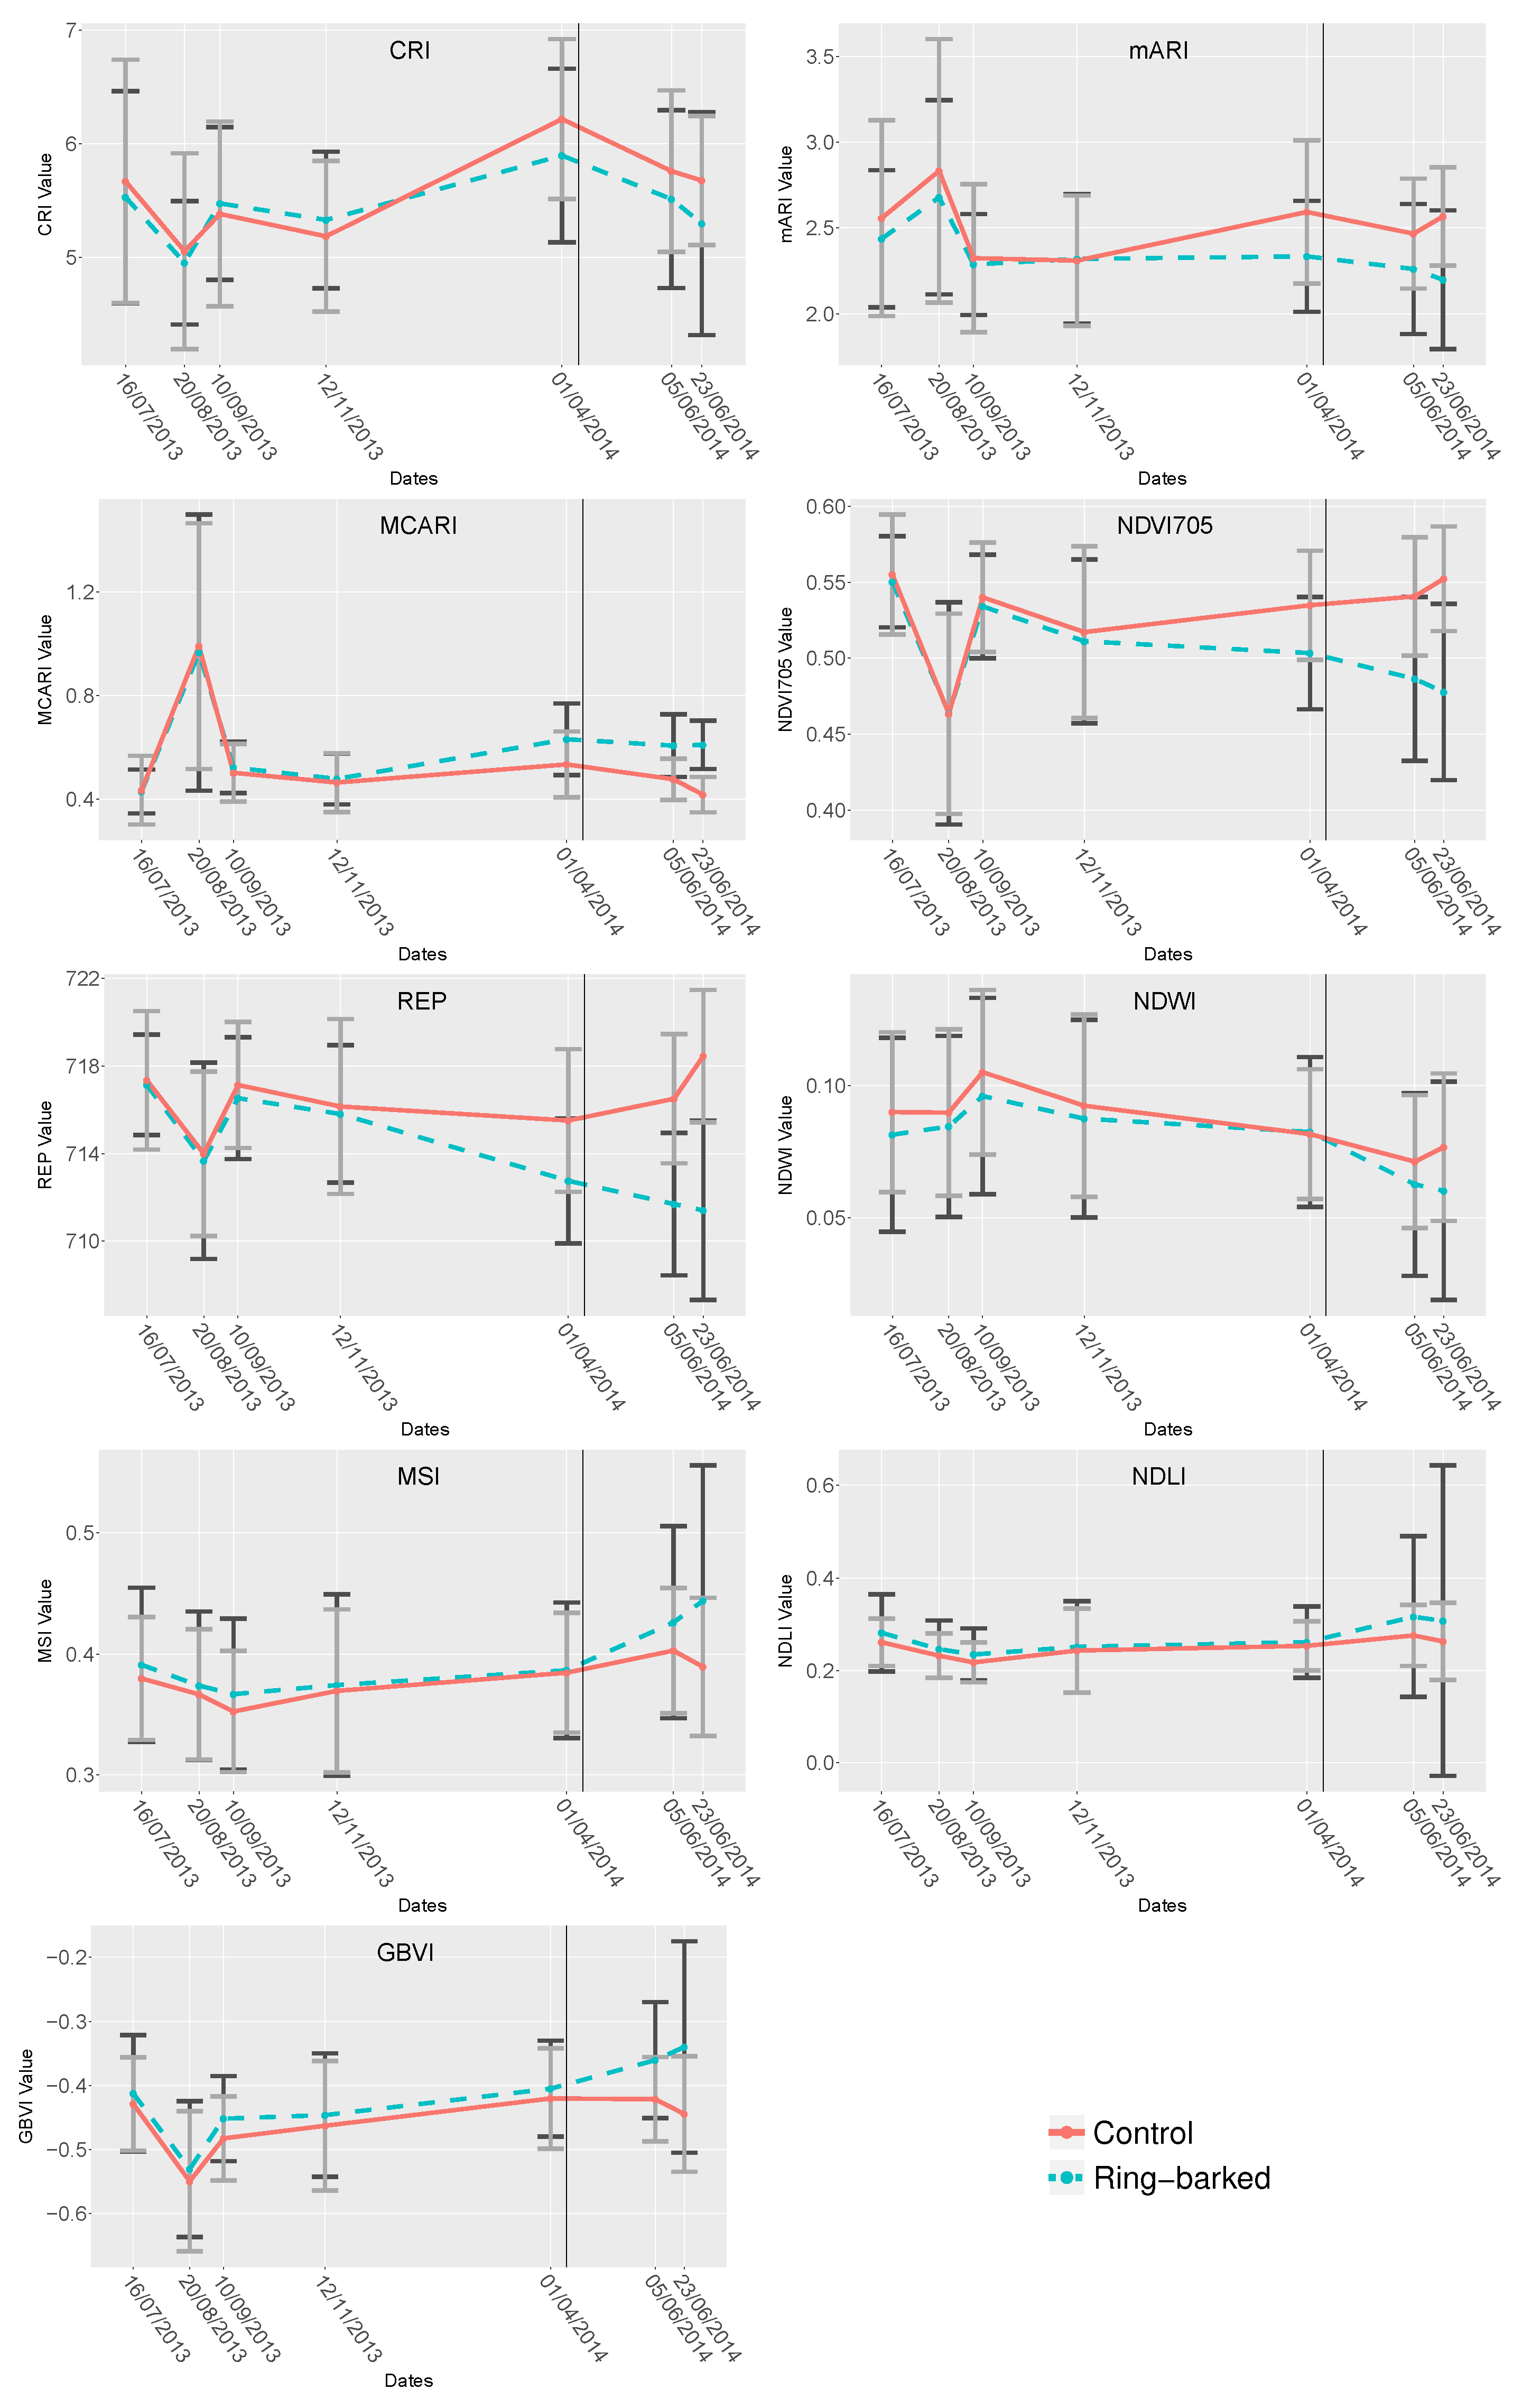
  • Nine known stress related indices, see Table 2, were calculated for their mean and standard deviation and analysed regarding their separability of ring-barked and control measurements using Mann-Whitney-U test.
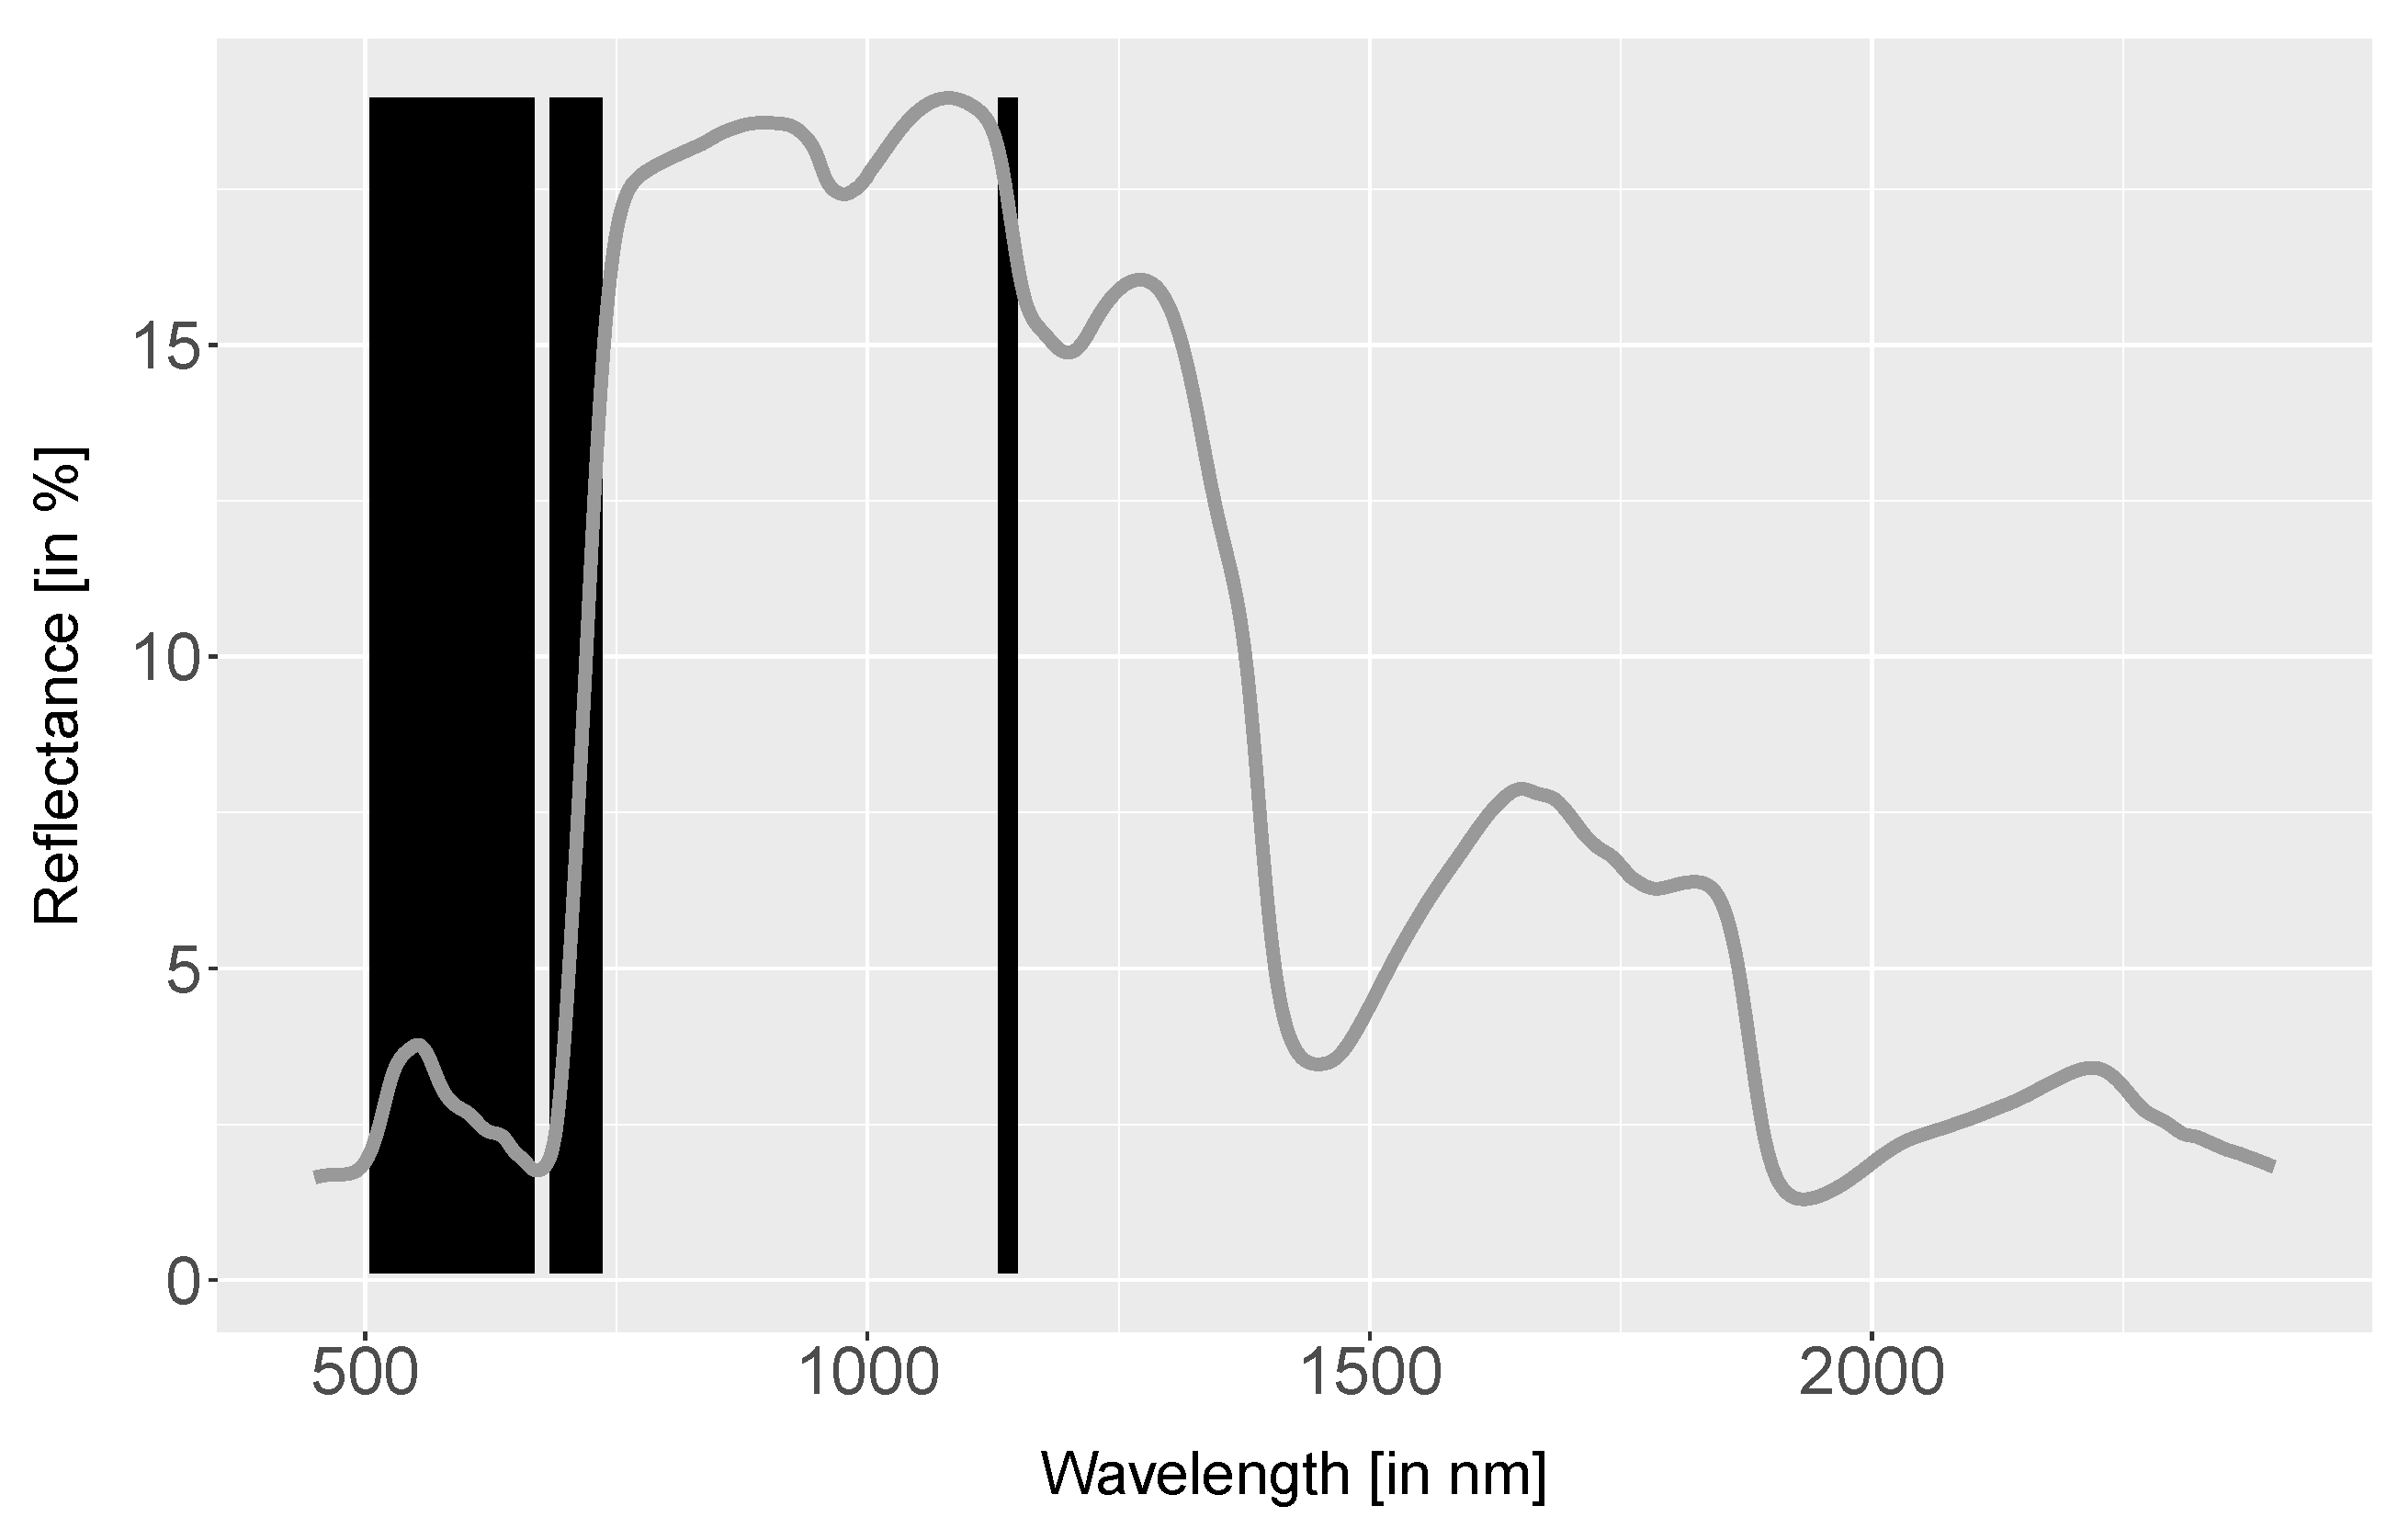
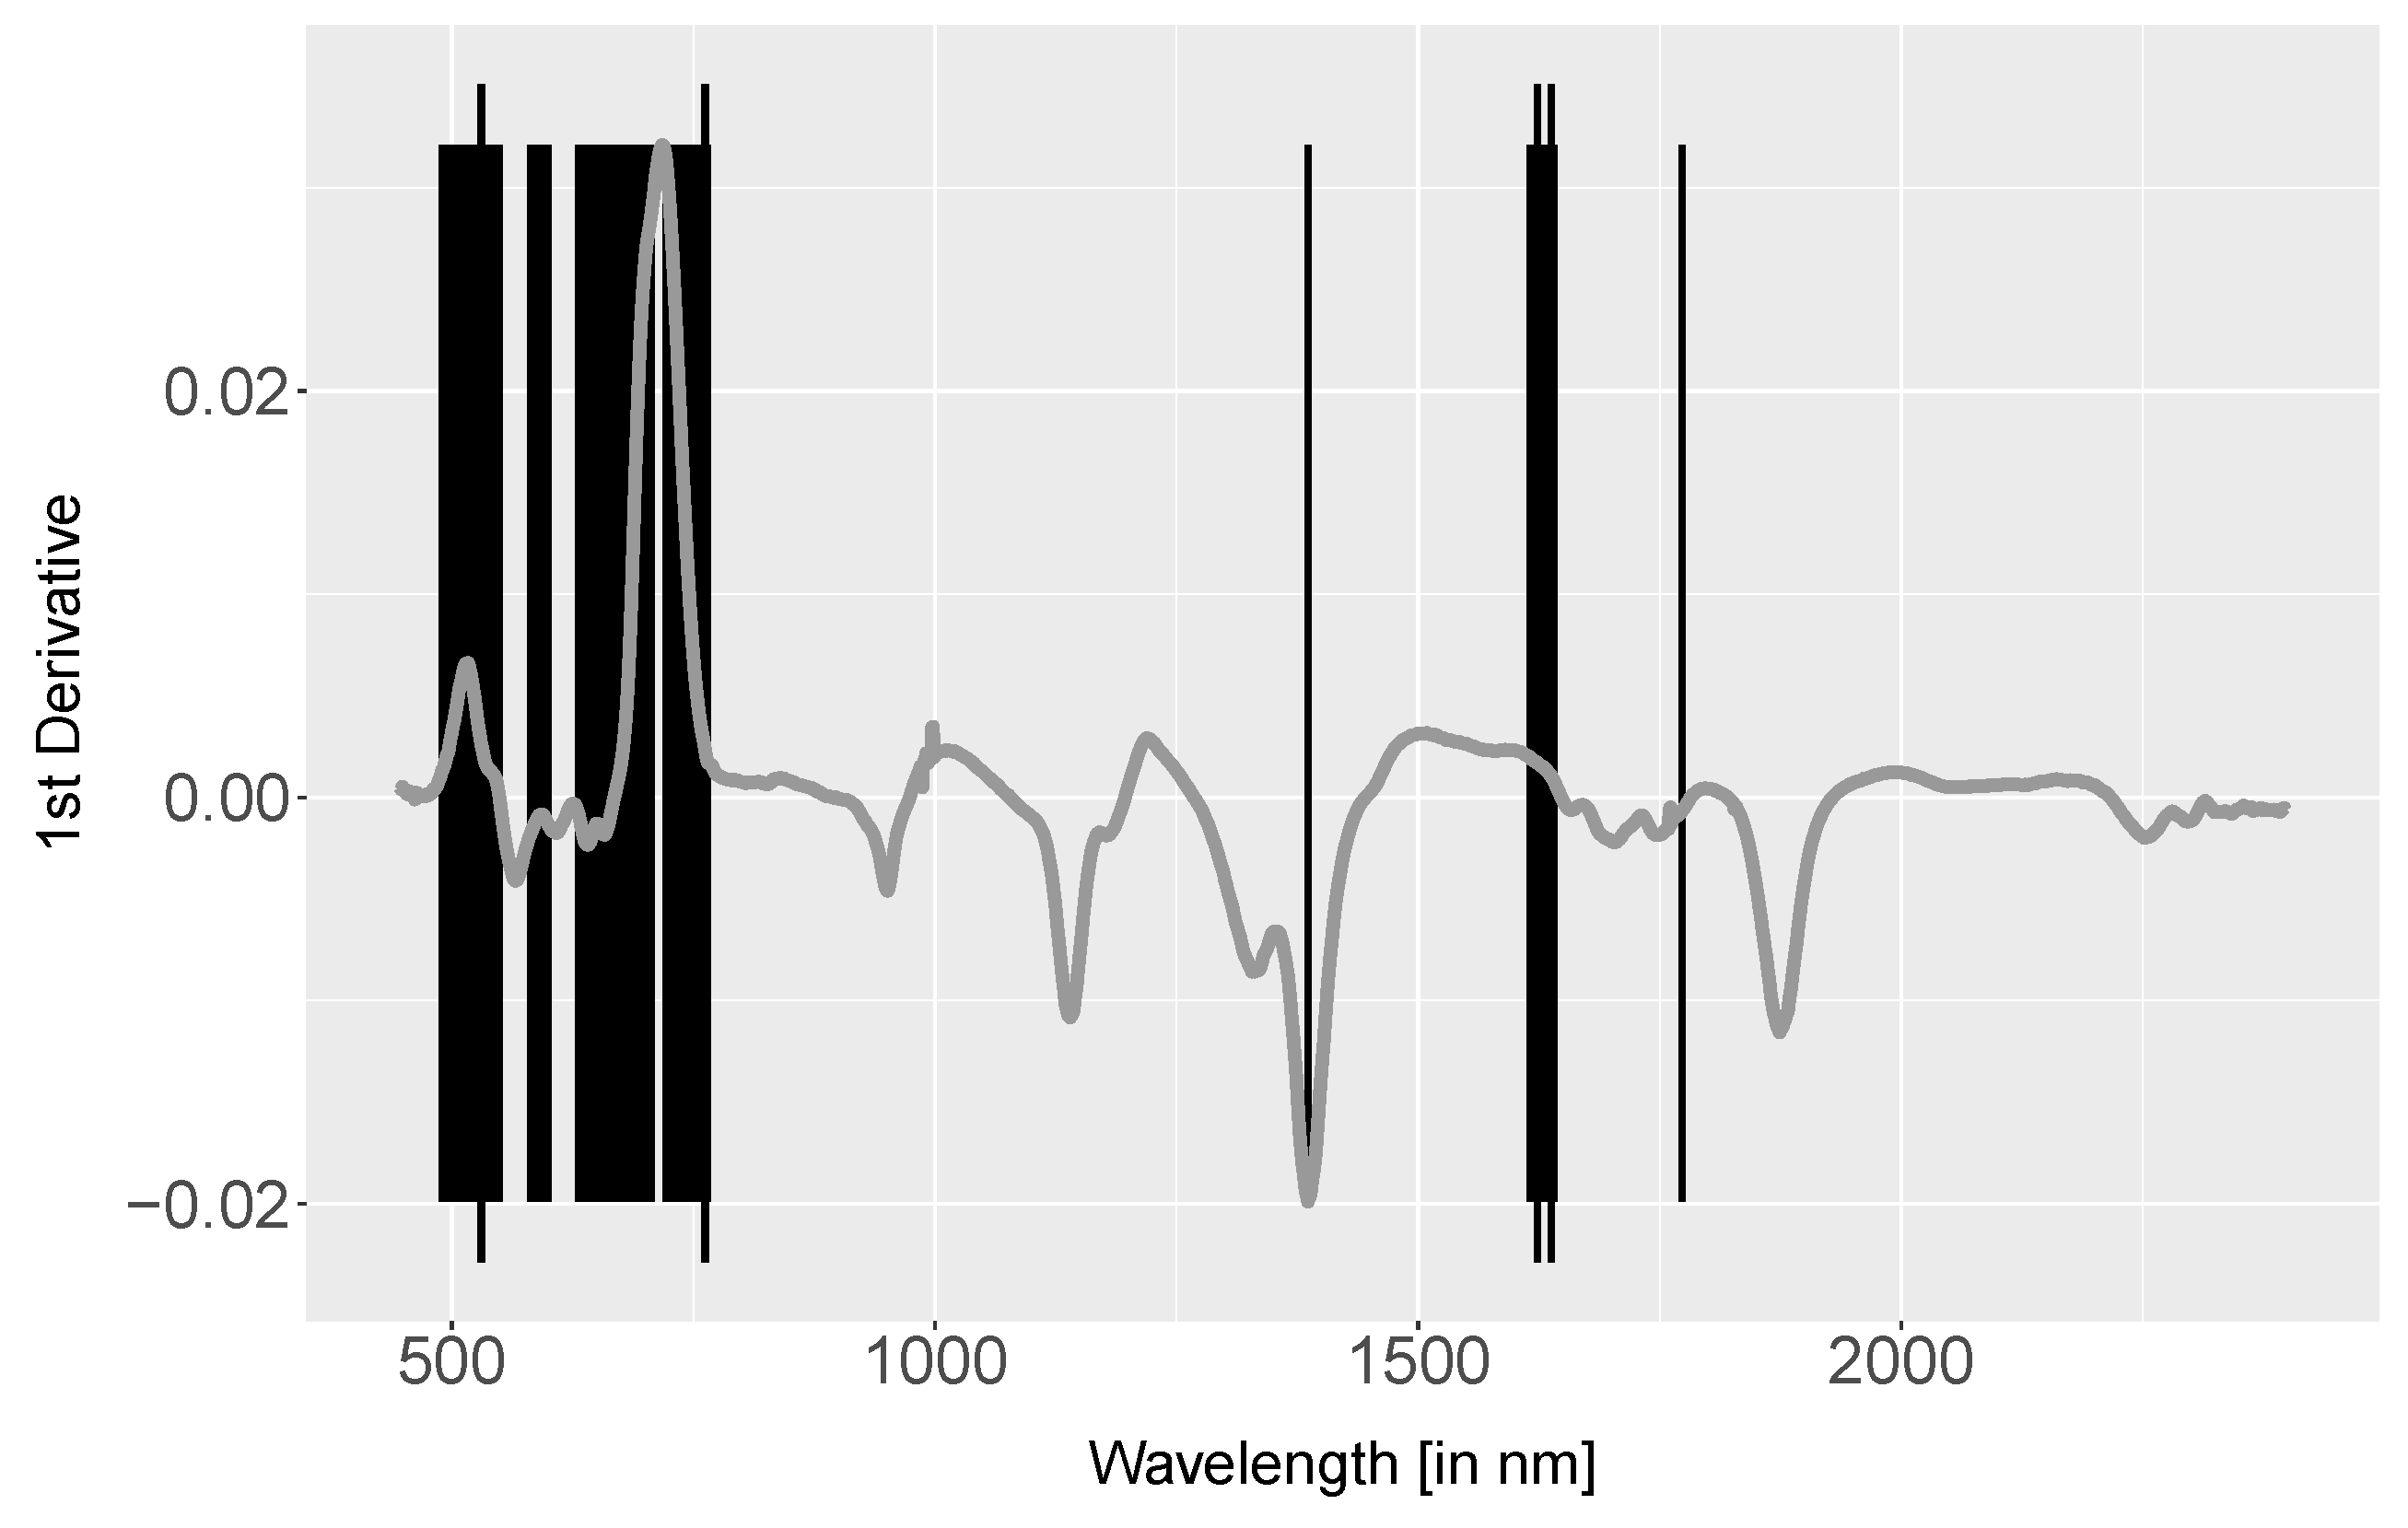
  • The 1st derivative with prior Savitzky–Golay filter of all spectra were derived using the R function ‘savitzkyGolay’ in package ‘prospectr’ with polynomial order = 3 and moving window = 5. Derivatives emphasise the spectral shape, suppress albedo differences and can enhance subtle changes. Inflection points in spectra cause positive or negative peaks in 1st derivative data. Therefore, the 1st derivative is commonly used for extracting the red-edge inflection point. The separability was analysed using a Mann–Whitney-U test.
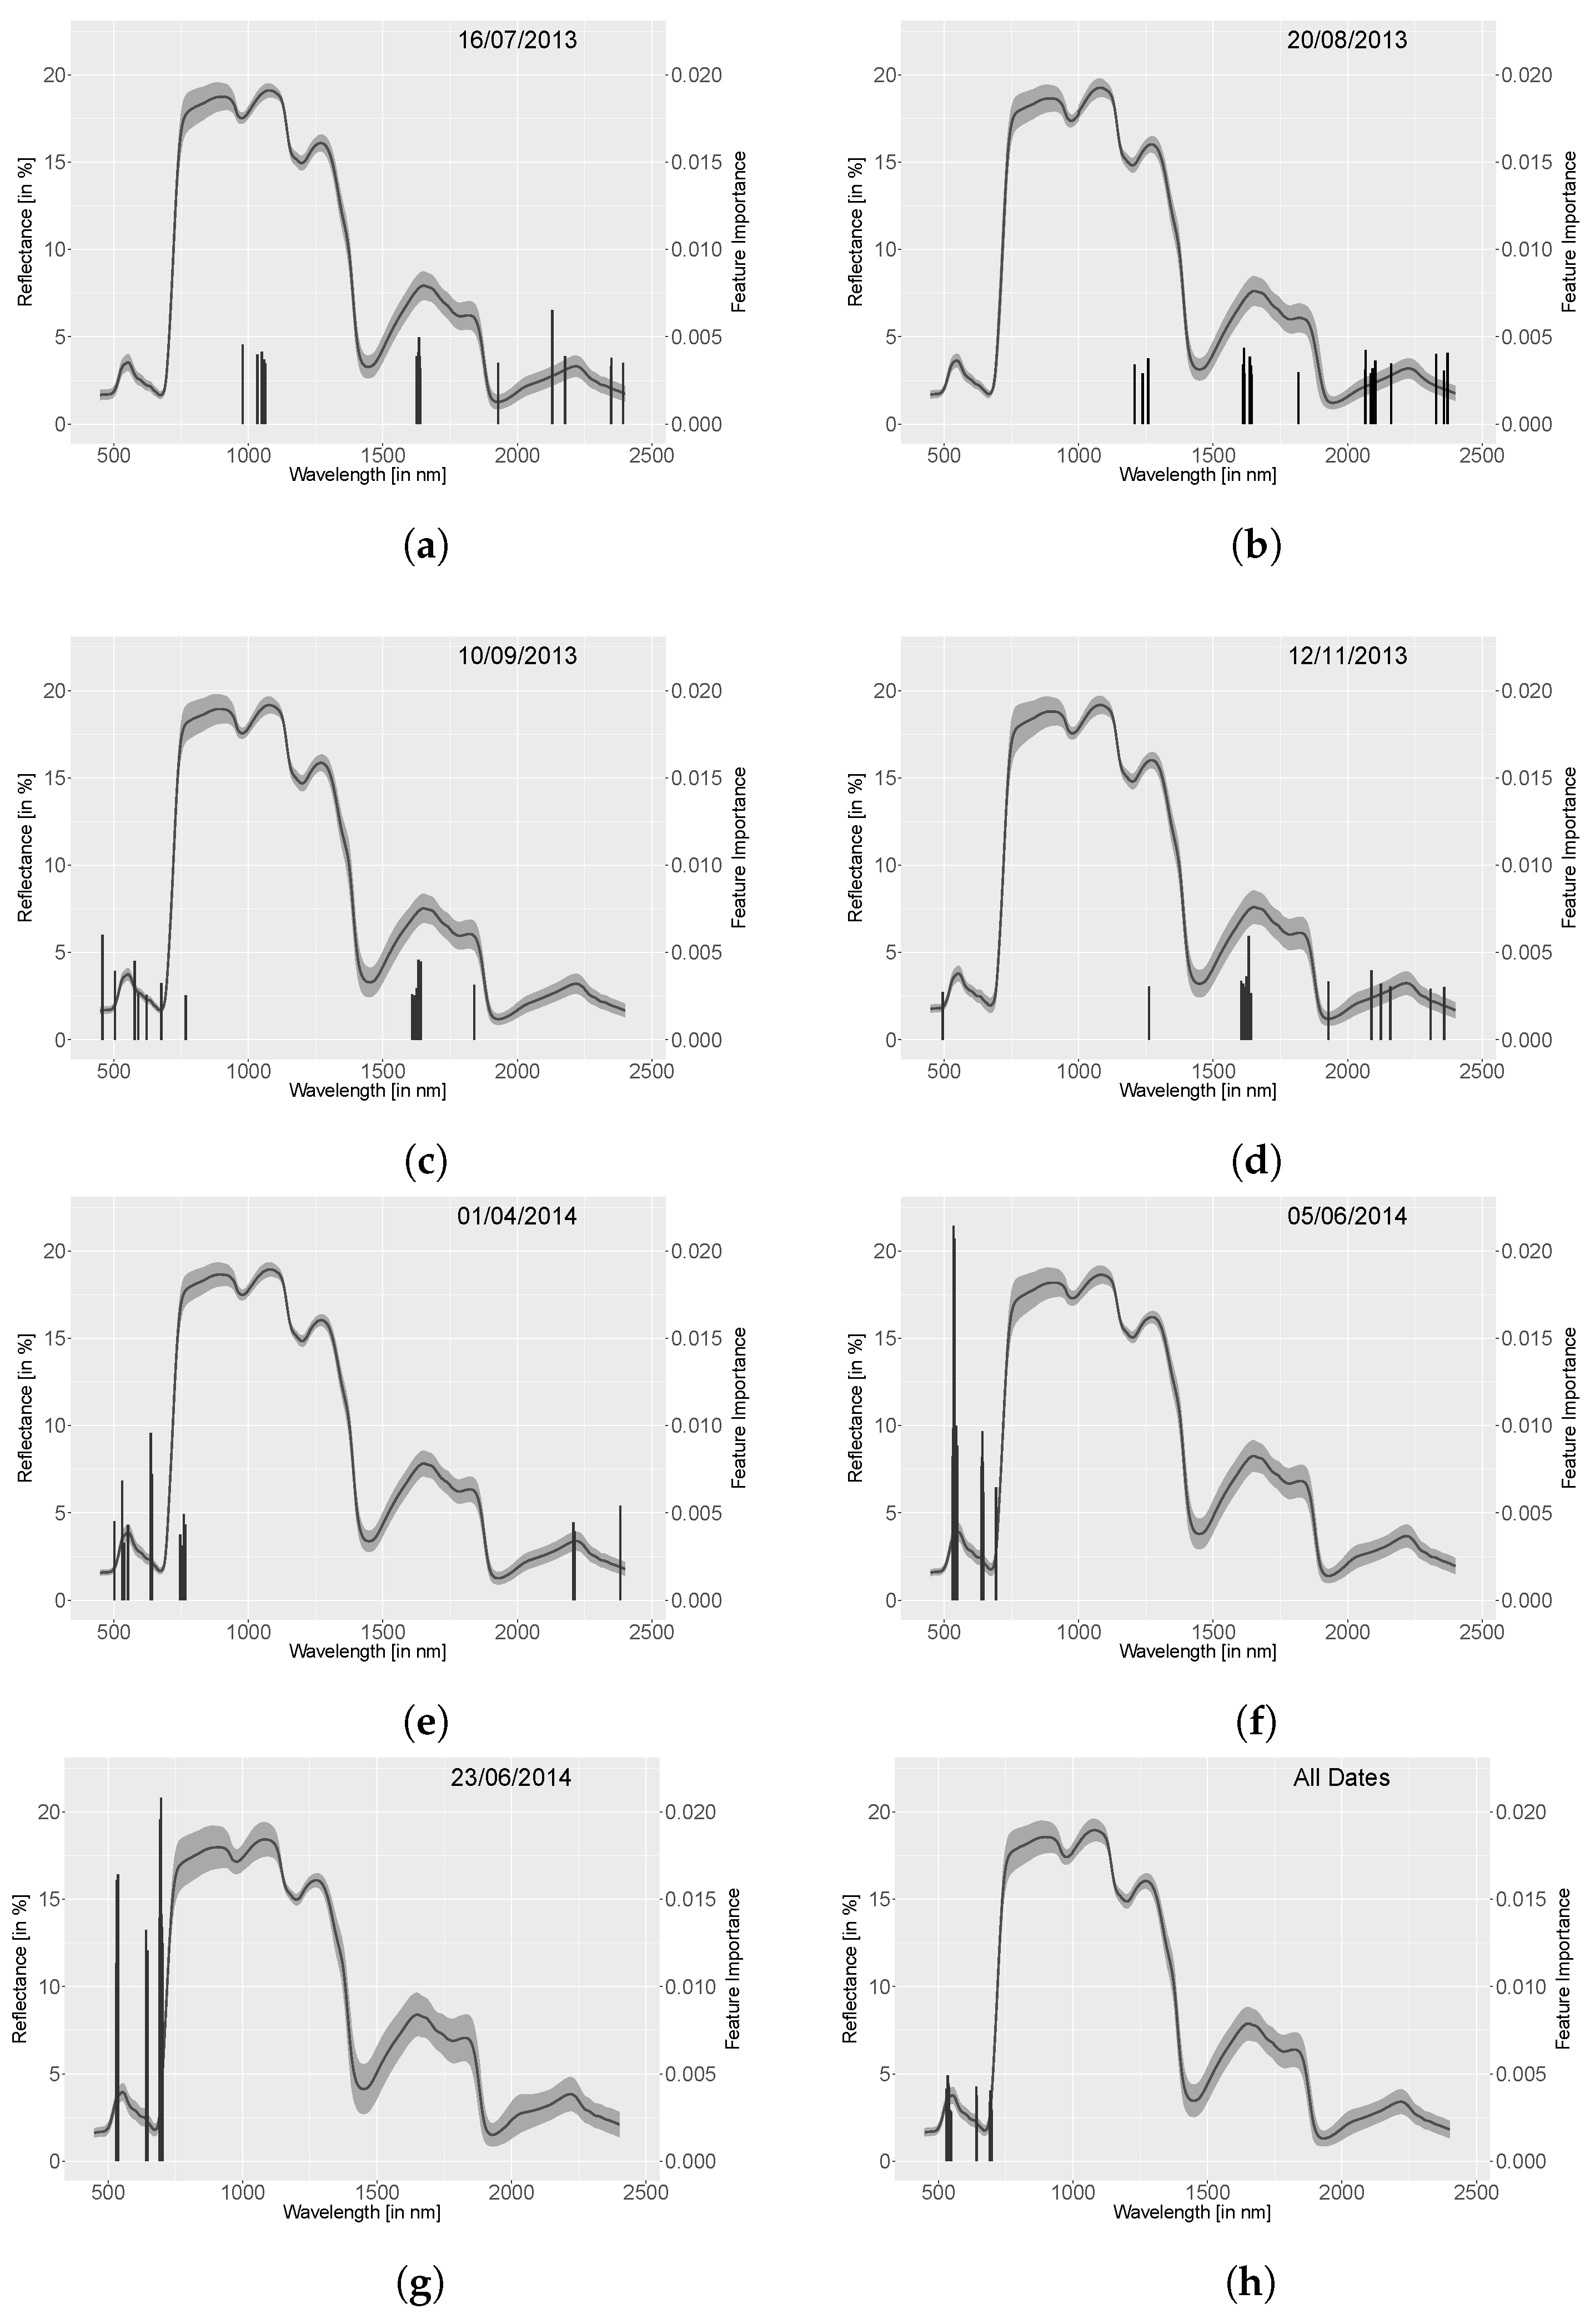
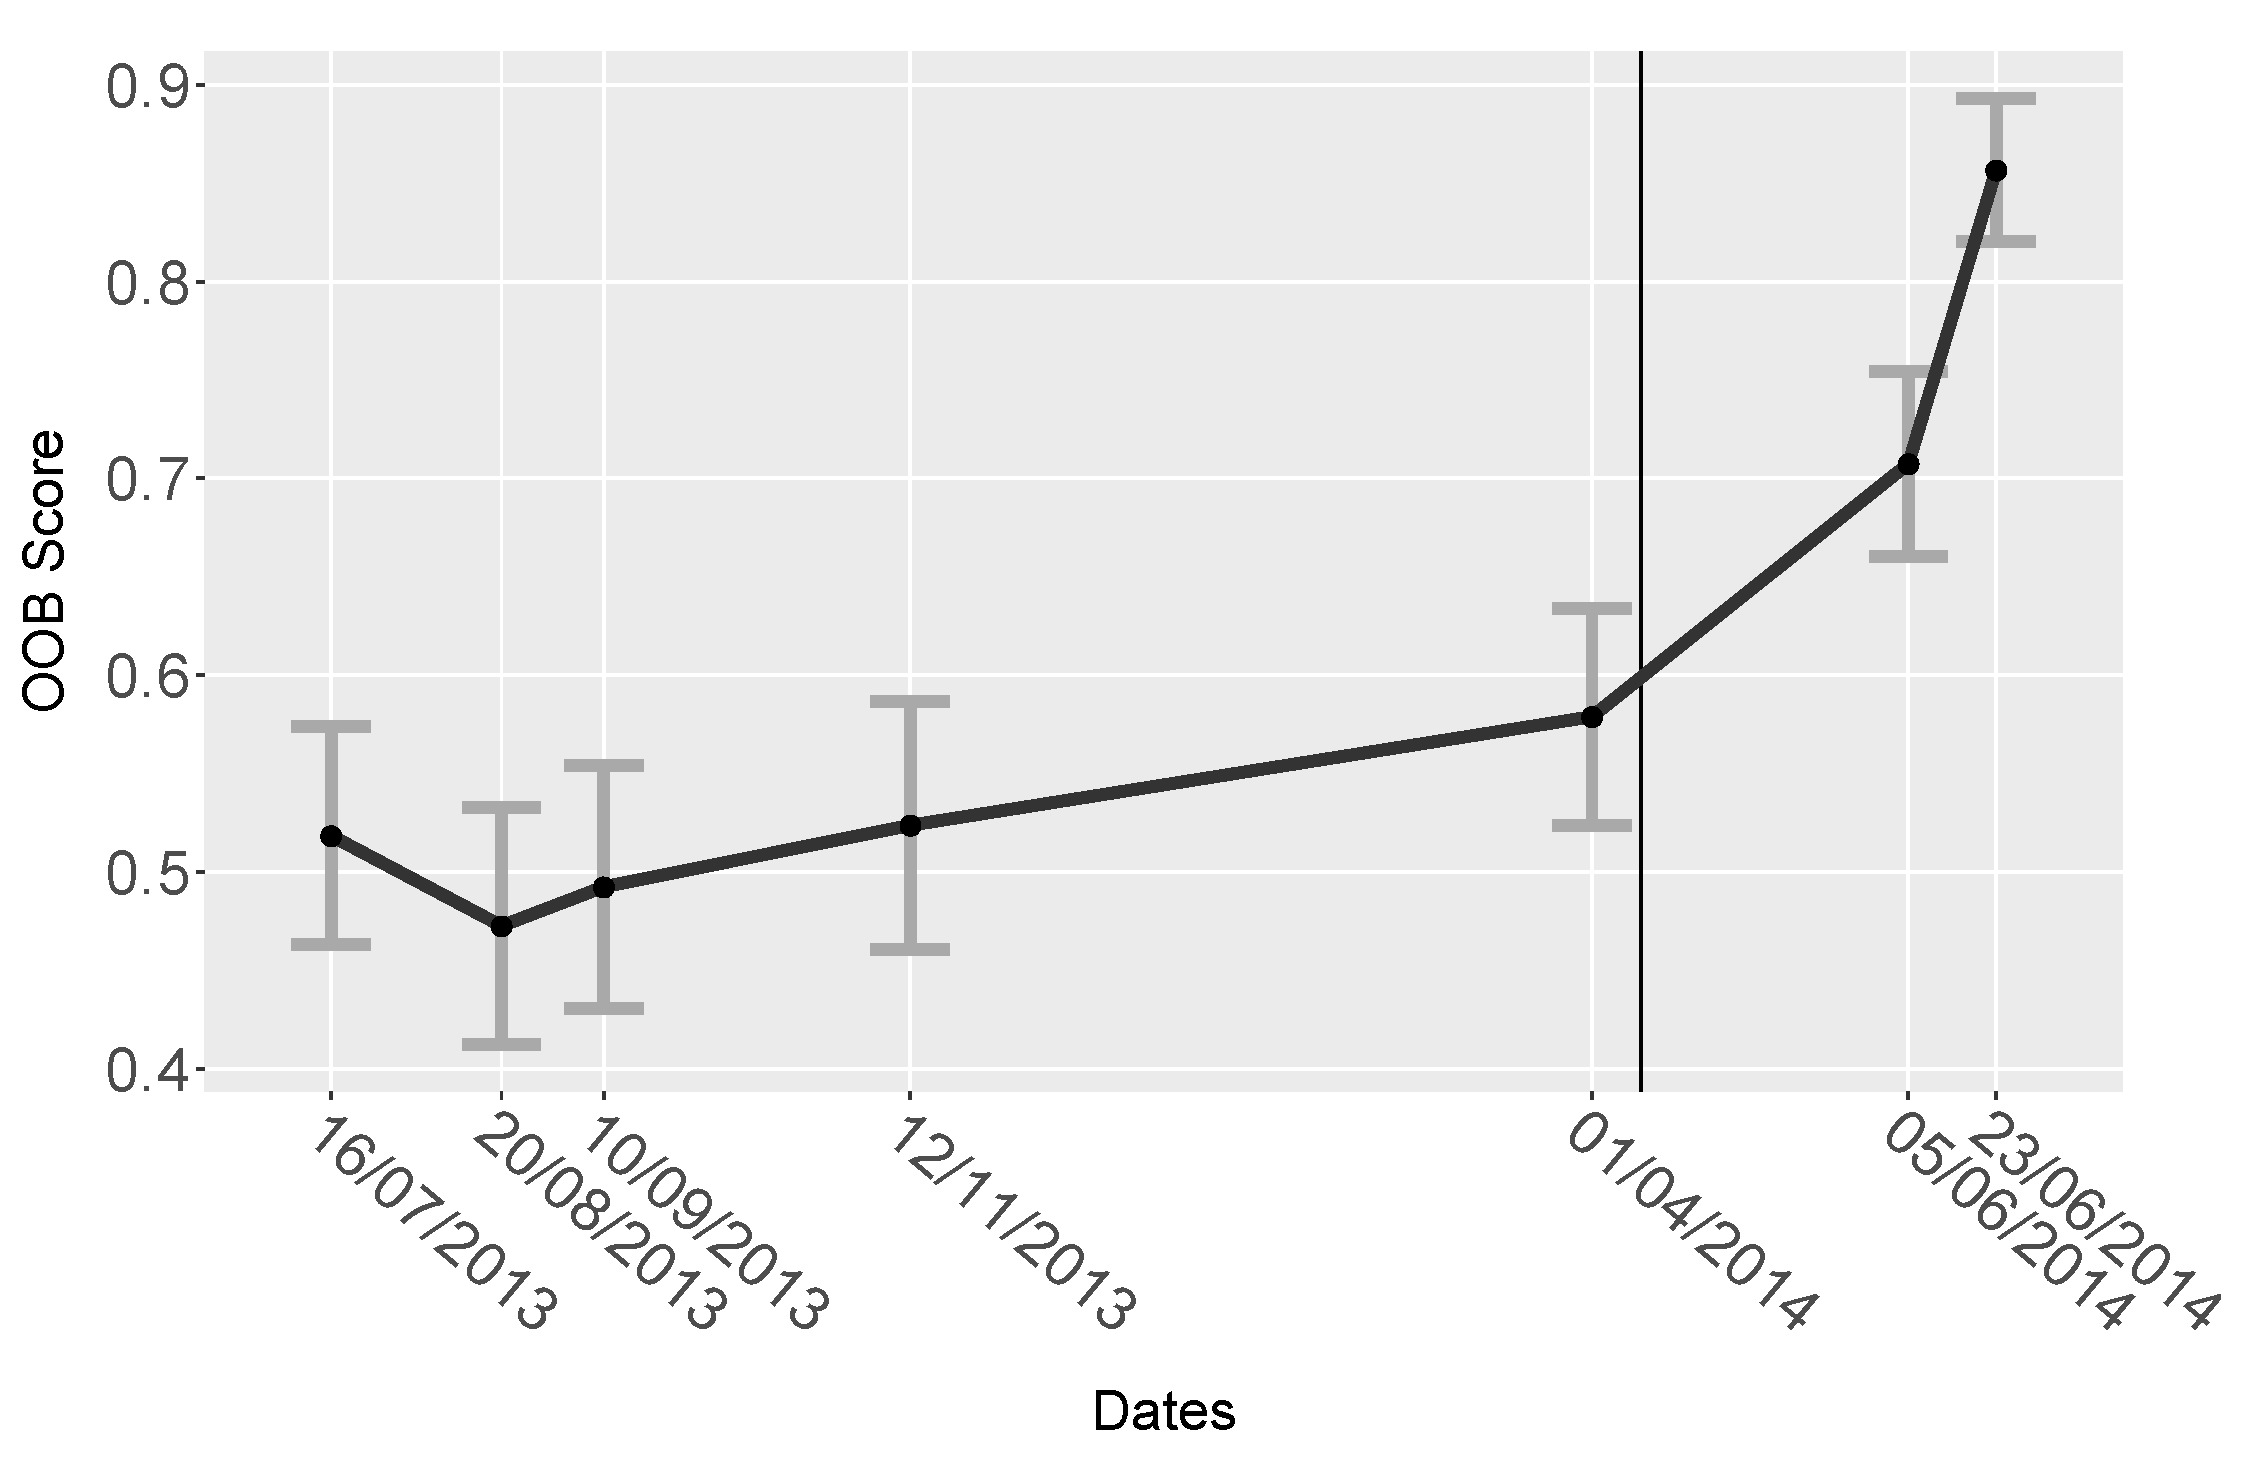
  • A non-parametric tree based random forest classifier [25] was set up with the database of all spectra, indices and derivatives to discriminate ring-barked and control measurements using package ‘scikit-learn’ for P y t h o n 3 . Even though the index and derivative data are calculated out of the spectral data, this approach was selected due to extracting important features for separation and extracting the internal out of bag (OOB) score. This OOB score is 1-the average OOB error calculated at each node using features that are not contained in this bootstrap sample. This allows testing of the random forest during training. A test of bias was performed using the most important method resulting from random forest classification (here derivative data, see Section 4) and running the random forest only on these data. This test did result in similar OOB values and important features. This concludes that the random forest classification of spectral, index and derivative data is neither dependent nor biased. At each node sqrt(n_variables) were randomly sampled for 500 trees. This number was determined by subsequently testing the amount between 10 and 1000 trees and comparing the OOB score that is an inverse internal calculation of misclassification. The benefits of random forest classifiers are that they do not overfit with a large amount of classification trees, they return an internal error estimate (OOB error) and importance of variables as well as estimate strength and correlation [26]. The OOB score here is used for stating the accuracy for separating control and ring-barked measurements as two groups. No split into test and train set is applied here for cross-validation since the accuracy results were not comparable with OOB score due to the limited number of samples. Additionally, the important features for classifying control and ring-barked samples were extracted. This was used for detecting the most appropriate method and spectral range that contribute to a high separability of ring-barked and control samples.

4. Results

The analysis of the spectral data focused on the separability of ring-barked and control samples using the different age classes and sampling dates. Due to the fact that each sample date consists of four separate needle age classes, the first analysis was conducted on specifying the separability between these age classes. For the control samples, age classes 3 and 4 were significantly similar in three out of seven sample dates. In ring-barked samples, the age classes 3 and 4 were significantly similar in all seven sample dates with increasing similarity among all age classes towards the end of the experiment. The test-analysis using individual age classes as well as combining classes (1 and 2, 3 and 4) did not result in clearer results than combining all age classes. Thus, the subsequent spectral analysis was conducted combining all age classes together.

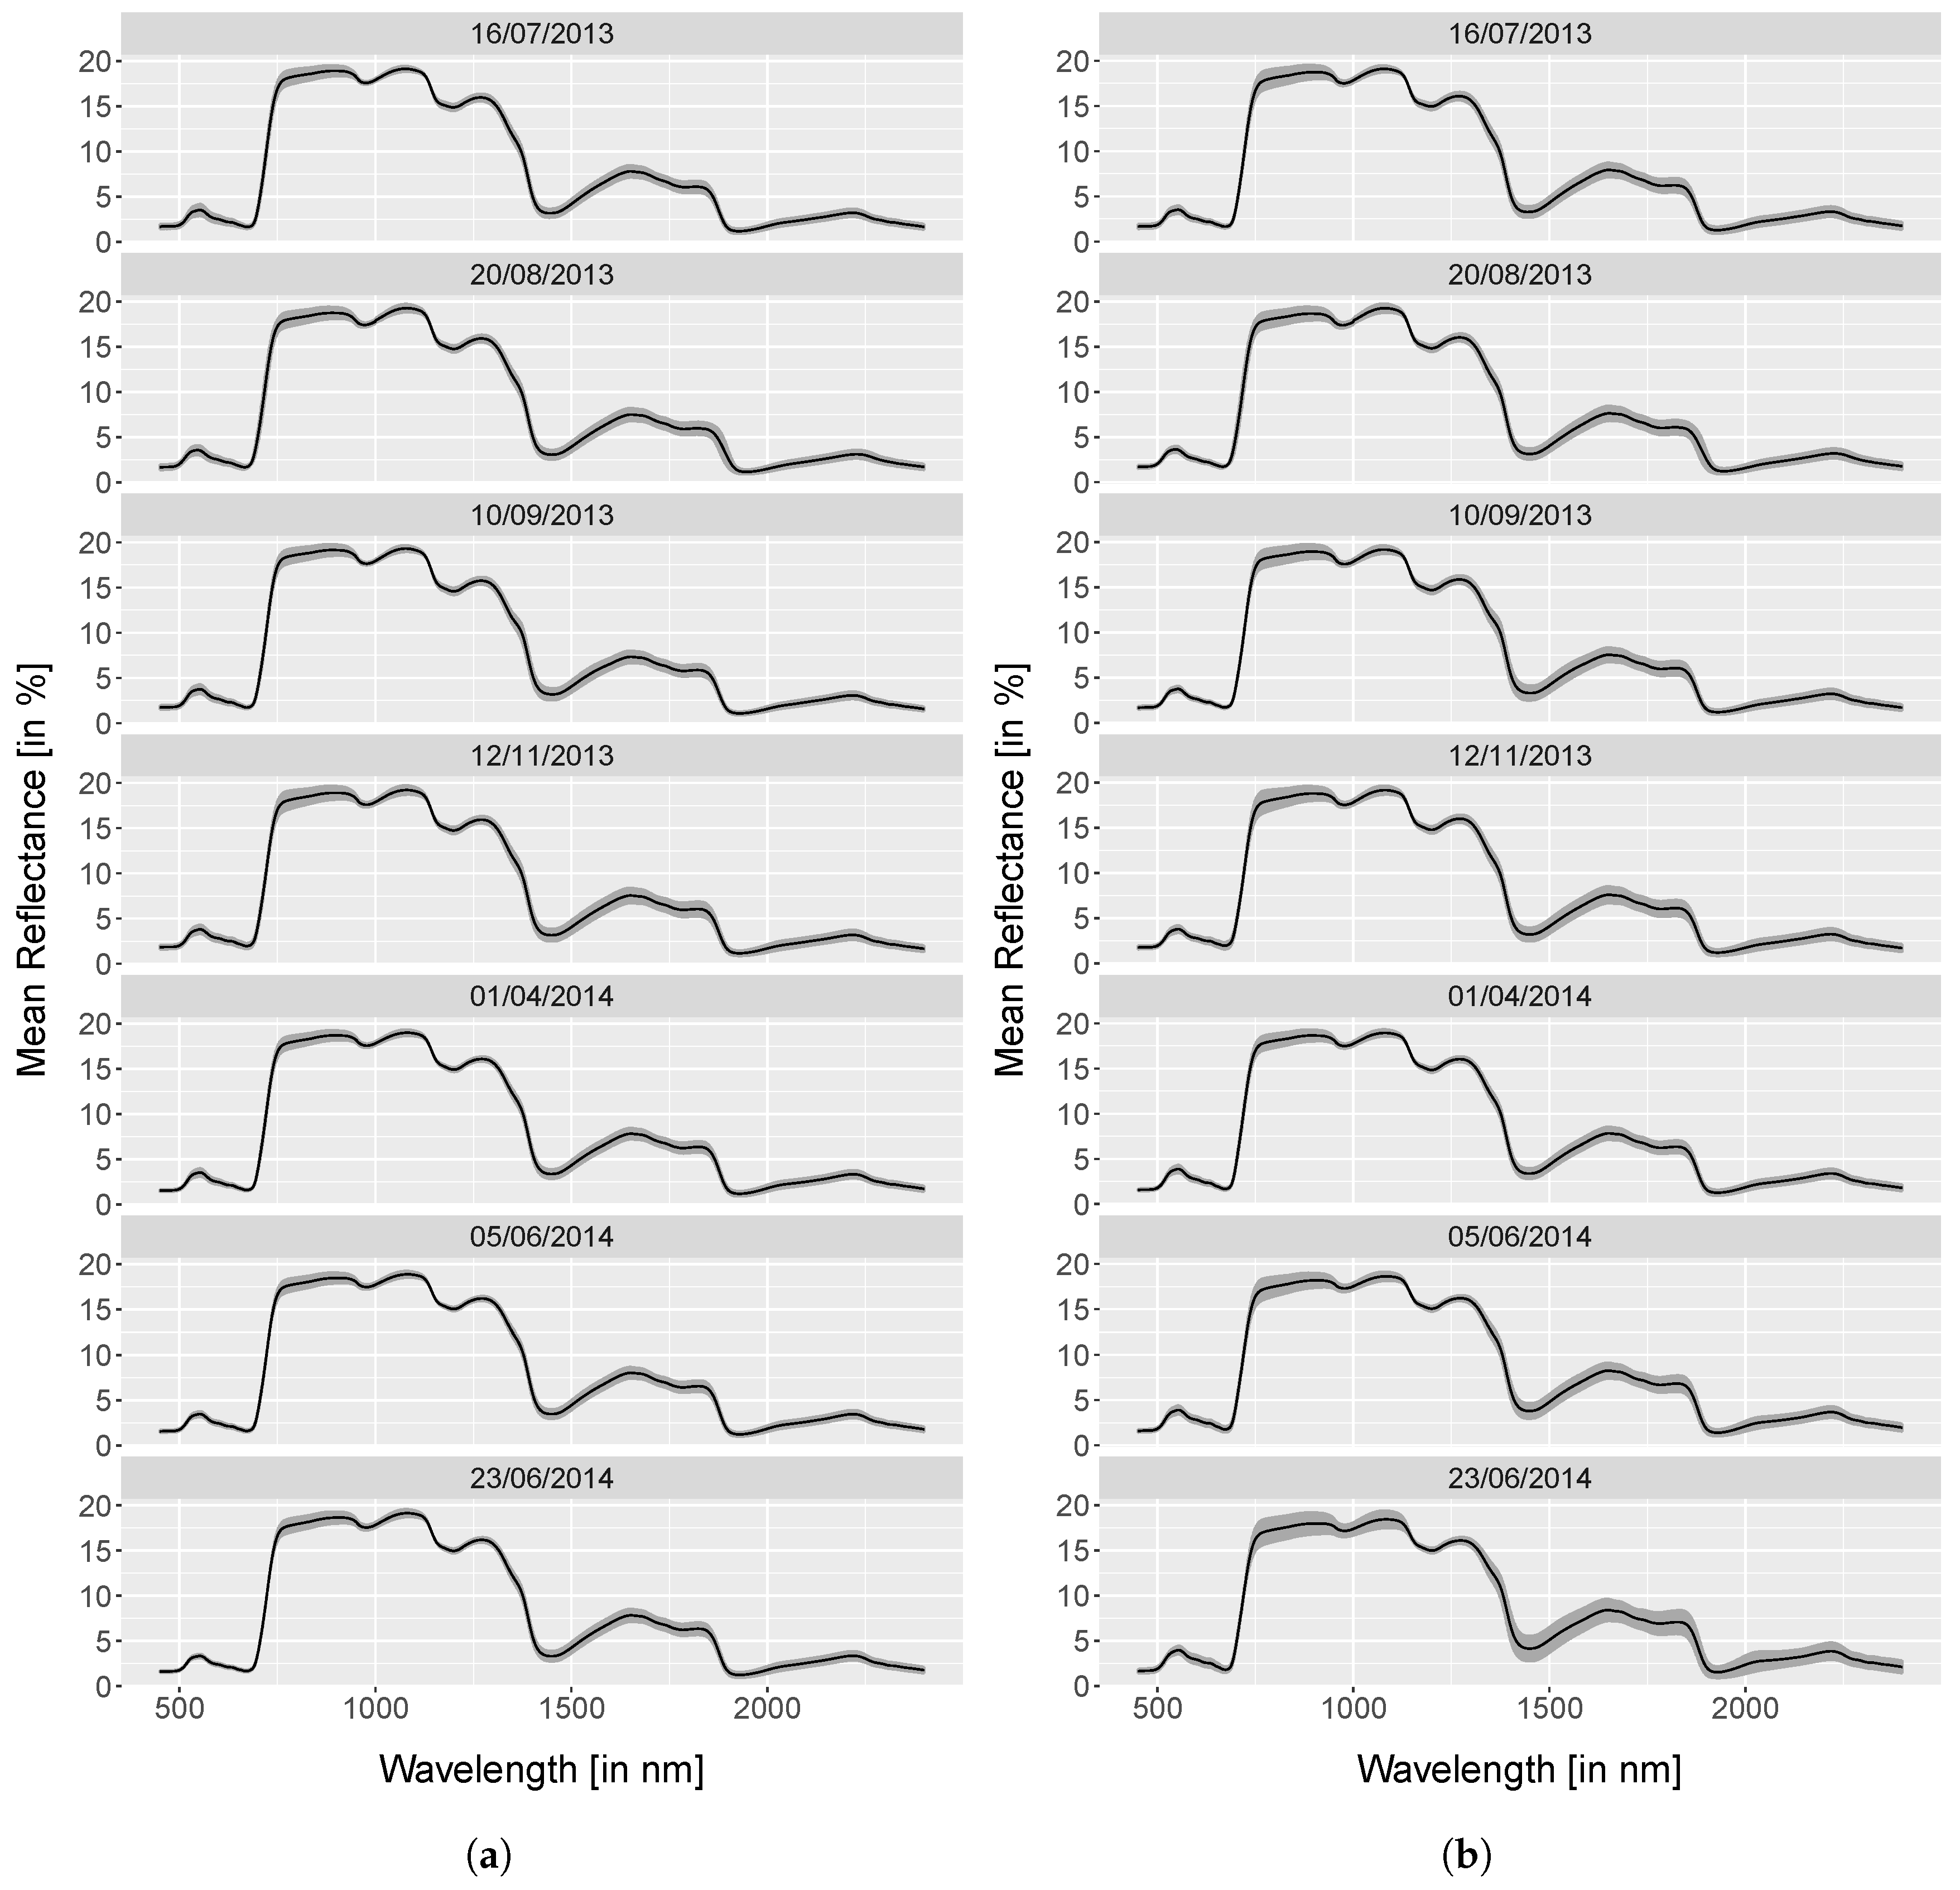
4.1. Spectra Analysis

The spectral data were analysed to show their separability between control and ring-barked samples. Figure 4 illustrates the spectral data as mean (black) and standard deviation (grey) for ring-barked and control measurements, respectively. The ring-barked standard deviation reveal a higher variation in VIS (visible), NIR (near infrared) and SWIR (shortwave infrared) spectral region than control samples.
The Mann–Whitney-U test was used for specifying if, when and in which spectral wavelength range control and ring-barked samples can be separated. Figure 5 shows the significant spectral regions starting from date 5 (1st April 2014). This points out the opposite of the previous figure, which includes a few features in the NIR/SWIR I, whereas the majority of features are located in the VIS and red-edge spectral region with the exception of ∼670 nm.

4.2. Index Analysis

For index analysis, the indices stated in Table 2 were calculated for ring-barked and control samples (Figure 6). The occurrence of yellowing and bark beetle is marked as a black vertical line. All indices reveal a similar trend during the first year that includes a tendency of higher standard deviation of ring-barked samples during the whole experiment compared to control samples that show an increasing trend towards the end of the experiment. A high standard deviation for date 2 (20th August 2013) was observed for the mARI, MCARI, NDVI705 and REP Index (Figure 6).
Separability analysis of ring-barked and control samples showed significant difference in the VIS based indices (mARI, MCARI, NDVI705 and REP) starting on date 5 (1st April 2014), see Table 3. The GBVI separates on date 6 (5th June 2014) and the SWIR based NDLI, NDWI and MSI do not reveal a significant difference between control and ring-barked. In addition, the CRI does not reveal a significant separation except for date 5 (1st April 2014). The significance of most VIS based Indices and insignificance of the SWIR based Indices are consistent with the results of spectral reflectance data analysis in Figure 5.

4.3. Derivative Analysis

The Mann–Whitney-U test was applied to the derivative analysis data with results displayed in Figure 7, which includes features separating control and ring-barked samples. The difference here is the detection of subtle changes between both groups starting on date 4 (12th November 2013) in the chlorophyll absorption region (530 nm, 531 nm, 762 nm, 763 nm) as well as for the water and lignin absorption region (1623 nm, 1638 nm) shown as long vertical lines. Shorter vertical lines indicate features that separate ring-barking and control samples starting on date 5 (1st April 2014). Features for separating both groups from date 5 (1st April 2014) are located in the VIS, NIR as well as a few features in the SWIR spectral region. The main VIS wavelength regions are related to chlorophyll, anthocyanin and red-edge features. For the SWIR, the main features are related to water and lignin features. Derivative data results showed slightly improved separation than for the spectral and index data since control and ring-barked samples can be differentiated in six wavelength features starting on date 4 (12th November 2013).

4.4. Random Forest

After analysing spectral, index and derivative data separately, a random forest classifier was used for defining overall importance of features for separating control and ring-barked samples. In addition, the approach was also used to determine the earliest point in which the two groups can be differentiated. To do this, a database was first generated that includes all spectral, index and derivative data. Figure 8 shows the OOB score which returns the probability of separating ring-barked and control samples. The OOB score for 2013 varyied around 50% and shows increasing separability with a value of 52% on date 4 (12th November 2013) (see Figure 8 and Table 4). The first sample date in 2014 (date 5, 1st April 2014) shows a significant rise of OOB score to 58% with the tendency to further increase towards later dates. The development of the OOB score is very similar to the trend visible for mARI, MCARI, NDVI705 and REP indices as well as for spectral (date 5, 1st April 2014) and derivative analysis (date 4, 12th November 2013).
The 20 most important features across all methods are shown per sample date in Figure 9. Most features were selected from derivative data (date 1–date 6, 16th July 2013 to 5th June 2014) and very few from spectral data (date 7, 23rd June 2014). Index calculations from MCARI only were among these 20 features for separating control and ring-barked samples on date 7 (23rd June 2014) solely. For clarity, the 20 most important features are plotted on the averaged ring-barked spectra per date with corresponding standard deviation (Figure 9).
Important features for date 1 (16th July 2013) are located mainly in the NIR and SWIR spectral region (see Figure 9). The importance of NIR spectral region declines in date 2 (20th August 2013). The SWIR spectral region remains similar, whereas VIS spectral region is sparsly distributed. Distinct distribution is detectable for date 3 (10th September 2013) with an increase of VIS features. The NIR spectral region is not covered on date 3 (10th September 2013) and onwards. The features around 1630 nm show continuous importance throughout date 1 to 4 (16th July 2013 to 12th November 2013). The OOB score indicates low separability between control and ring-barked samples for dates 1 to 4 (16th July 2013 to 12th November 2013), which can be supported by the static development and low importance of features. On the contrary, the importance of SWIR features declines and VIS features increase strongly especially around 540 nm on date 5 (1st April 2014). The influence of the red-edge only starts to be important on date 6 (5th June 2014) and 7 (23rd June 2014) and no features are located in the SWIR spectral region. Aggregating important features over all dates and comparing this to dates 1 to 7 (16th July 2013 to 23rd June 2014) it is evident that the only features that are important were previously selected on date 5 to 7 (1st April 2014 to 23rd June 2014) in the visible region.

5. Discussion

This experiment was designed to mimic various stress types typical of Norway spruce forest stands in Germany. The focus of the analysis was to select the most important analysis method, earliest possible detection and important spectral regions that highlight a physiological reaction to stress events and vitality decline.
The results for the significance test and feature importance show in Figure 7 and Figure 9 a distinct development regarding amplitude and spectral distribution during the time-frame of the experiment. This development can be explained by leaf optical properties related to either in health or stressful situations. Spectral features in the VIS spectral region are related to pigment absorption [34,35], whereas the NIR spectral region is independent of varying chlorophyll content and pigments [36] and reveals low absorbance in general [37]. In the case of the SWIR, wavelengths beyond 1200 nm are heavily impacted by water absorption [37] where a decline of plant water content can reveal lignin and cellulose absorption features. The dates 1 to 4 (16th July 2013 to 12th November 2013) show features of low importance distributed in VIS, NIR and SWIR with an increasing amount of important features around 1630–1640 nm (see Figure 9). Referring to [38,39,40], this region is related to the absorption of plant phenolics such as lignin and cellulose. Cheynier et al. [41], Bhattacharya et al. [42] describe the increase of plant phenolics as a defence strategy to various types of biotic and abiotic stress. This is contrary to the findings of Cheng et al. [10] where no plant phenolics absorption is detected. Additionally, the significance test of derivative data indicate separability between ring-barked and control samples in six single bands related to pigment, water and lignin absorption on date 4 (12th November 2013), among them a feature at wavelength 1640 nm (see Figure 7). Thus, it is most likely that date 4 (12th November 2013) indicates a significant change of ring-barked trees using derivative analysis and can be taken as the initial date of detectable change for this experiment. A more significant change in separability is observable by the start of the following vegetation period, year 2014. An indicator for this is the increasing of OOB Score for ring-barked and control trees on date 5 (1st April 2014). As seen in Figure 8, the separability increased by 6% points from 52% to 58% as well as a decreasing standard deviation among all 200 iterations of classification. This shows a significant development between ring-barked and control samples and proves the separability of control and ring-barked trees.
If one compares the acquisition dates of laboratory measurements and crown condition assessment in Figure 2, the starting date of visible change in the tree crown due to yellowing and bark beetle infestation occurs on 11th April 2014. The separation between ring-barked and control samples using derivative analysis took place 292 days (date 4, 12th November 2013), spectral reflectance and index analysis 10 days (date 5, 1st April 2014) before yellowing and bark beetle investigation (11th April 2014). This shows that an early detection of vitality decline is possible within this experiment using the methods described beforehand. It is important to note that each tree species reacts in a different way to a given stress occurrence, and trees of the same species can also be influenced by micro and macro climatic conditions. This experiment and its results show that multi-temporal analysis is crucial for stress detection and that remote sensing methods, data and techniques offer a great potential for stress detection.
Due to a lack of chemical measurements, this analysis is a qualitative trend study. Further experiments in this field should be performed using chemical measurements as validation data, which allows a quantitative analysis.

5.1. Methods

5.1.1. Spectra Analysis

Spectral data showed first signs of separation between ring-barked and control samples starting on date 5 (1st April 2014) with features located in VIS spectral region and SWIR (see Figure 5). These can be related to reactions of plant physiology as described in Section 5.2. Needle chemical composition and consequently the reflectance is influenced by natural fluctuations that can complicate the detection of early vitality changes. The large difference in the mean and particularly the standard deviation of ring-barked samples over control samples are also indicative of changes in vitality in this experiment.

5.1.2. Index Analysis

Chlorophyll and anthocyanin related indices (mARI, MCARI, NDVI, REP) reveal a high separability from date 5 (1st April 2014), whereas the Carotenoid Reflectance Index (CRI) resulted in no significant separability except for date 5 (1st April 2014). The significance of these indices highlighting changes in pigments for stress detection is explained by plant physiology and pigment reaction in Section 5.2. As soon as SWIR spectral bands are involved for index calculation, the p-value of the Mann–Whitney-U test resulted in no (NDLI, MSI, NDWI) or late significance (GBVI). The low significance of SWIR related indices is the lack of separability in this area as shown in Figure 5. This leads to the assumption that the ring-barking did not interrupt the water and nutrition exchange entirely, which was also stated by Noel [43]. Another sign for changing health status is the increasing standard deviation of ring-barked over control samples (see Figure 6). Rock et al. [4] states this as an indicator for health damage.
The drawback of index calculation for stress detection is the fact that only a restricted number of bands contribute to the classification of target groups. Casas et al. [44] concluded that each index is only applicable for a specific purpose and a selection and combination of indices for different biochemical parameters is important for a comprehensive analysis.

5.1.3. Derivative Analysis

Derivatives are used in various analyses for detecting the stress status of vegetation [16,18,20,45]. The results of derivative analysis are distinct compared to index and spectral data. The separation of control and ring-barked samples was highlighted across six features on date 4 (12th November 2013) related to important pigment (anthocyanin and chlorophyll), water and plant phenolics absorption areas using the Mann–Whitney-U test. Derivative data emphasise spectral shape and subtle changes of data and suppress illumination differences [46]. The subtle detection of changes in plant phenolics within the SWIR spectral region starting on date 4 (12th November 2013) indicates the strength and value of derivative data for stress detection.

5.1.4. Random Forest

The results of spectral, index and derivative significance analysis are partly confirmed by applying a random forest classifier. Here, the OOB score (see Figure 8), verifies the separability of ring-barked and control samples starting from date 5 (1st April 2014) with 58%, which can be taken as first date of significance. The OOB score here is a measure to state at which date the ring-barked and control samples can be separated significantly. Since there is no reference value for an appropriate OOB score available in literature the change from 52% (date 4, 12th November 2013) to 58% (date 5, 1st April 2014) was chosen as the initial time. The increased separability of date 5 (1st April 2014) is similar to the results of spectral, index and derivative analysis. The OOB standard deviation of all 200 random forest iterations decreased from date 5 (1st April 2014) onwards. The OOB score in this study was not to be taken as a value for classification accuracy, but rather as reference for the initial date of change. The significant separation of six features on date 4 (12th November 2013) using derivative analysis (see Figure 7), can only contribute to a OOB score of 52% by the random forest classifier. The importance and distribution of features vary in dates 1 to 4 (16th July 2013 to 12th November 2013) between VIS and SWIR spectral region, which results in low separabilities and thus does not indicate stress occurrence. Rather, it is an indication of natural phenology. The needle spectral measurements were acquired during different stages of vegetated and non-vegetated period. The importance of features increases significantly in the VIS spectral region similar to the OOB score, which implies for the following dates 5 (1st April 2014), 6 (5th June 2014) and 7 (23rd June 2014). The strong importance of anthocyanin absorption area can be explained by plant physiological stress related changes (see Section 5.2).

5.2. Plant Physiology

Late differentiation possibilities between ring-barked and control trees (date 4, 12th November 2013) as well as the yellowing of needles and observed bark beetle attacks on 11th April 2014 can be consistently explained by plant physiological processes.
A fully unimpaired water, nutrient and assimilation transportation system of trees uses several forces as its drive. These forces enable upwards transport of water and nutrients in the xylem to the crown where photosynthesis takes place [47]. Assimilates, produced by photosynthesis, are then transported by the phloem to the tree’s root system or alternatively to buds and fruits. This transportation cycle is directly related to vegetation cycles of trees. Root growth of Norway spruce initiates in spring before bud burst with incipient melt water [48]. It reaches its first maximum from March until April [48] which comes along with intense consumption of embedded carbohydrates [49]. Once sprouting starts, mainly around April, root growth decreases while sprout growth increases. This in turn leads to an increased carbohydrate and water demand in the crown [49]. A second intensified root growth can be observed in autumn when sprout growth stops between September and October [48,50].
If this cycle is interrupted, observable effects depend on the location of the interruption and the affected parts. Ring-barking in this experiment only cut through the bark, the cambium and the primary xylem of the trees at 1.3 m above ground. As the xylem generally is not affected, water and nutrient transportation to the crowns were slightly secured and photosynthesis is possible during the whole growing season, also described in Noel [43]. In contrast, downward assimilates’ transportation was only possible down to the girdled strip. The level of accumulated assimilates in the trunk above the girdled strip continuously increased. In general, trees die within 1–2 years after girdling, whereas each species and each individual reacts differently [43]. Cheng et al. [10] obtained faster reaction of trees to the ring-barking, which underlines the importance to take different tree species as well as micro- and macro-climate into account.
A more likely cause for first detectable differences between ring-barked and control trees in derivative analysis on date 4 (12th November 2013) might be an intensified root growth during autumn 2013 with a lack of carbohydrates from the growing season and consequently a stressed root system. The following intense root growth period commenced in spring 2014. This was the second stressed root growth for ring-barked trees with limited access to carbohydrates. The observed bark beetle attacks as well as yellowing of needles in April 2014 are facile symptoms of degrading trees.
In Figure 9e, important features concentrate on the pigment absorption region between 450 and 750 nm and some single features are located in the SWIR/NIR spectral region. NIR spectral region generally does not change with stress as stated by Carter [6]. These SWIR features refer to water content and lignin and cellulose content from within the needle structure and can be a minor indicator for water stress, as stated above. The pigment absorption area seems to be the most important area for detecting changing vitality referring to this ring-barking experiment (see Figure 9 for all dates). Two areas show up as important from date 5 (1st April 2014) following which are the absorption area of anthocyanin (∼540 nm) and chlorophyll (∼695–735 nm).
Anthocyanin accumulation is hypothetically a response to short-term defence strategy either during development stages or at times of stress [51,52], and its occurrence is mostly related to juvenile or senescence status of vegetative parts [34,53]. It absorbs light, among others, in the red fraction [52,54,55,56,57] and absorbs the same as chlorophyll in ∼540 nm green edge spectral region [57]. Often, anthocyanin is accumulated strongly in times of stress related among others to high quantity of carbohydrate in vegetative parts of a plant [34,51,52,53,57,58,59]. Additionally Jeannette et al. [58] analysed a link of carbohydrate accumulation due to girdling with accumulation of anthocyanin. Deficiency of phosphor and nitrate result in an accumulation of carbohydrate and an increased susceptibility to photo-stress [60,61]. The importance of anthocyanin absorption on date 5 (1st April 2014) (see Figure 9e) can be related to induced stress through ring-barking and thus interrupted carbohydrate exchange from crown to root system, as described above. In addition, the hypothesised diminished root growth leads to reduced nutrient uptake and cause anthocyanin accumulation from date 5 (1st April 2014) following using derivative data (see Figure 7).
Chlorophyll on the other side is the main photosynthetic pigment for green vegetative parts and is affected by environmental induced stress causing a decline of chlorophyll content [5,6,7,55,62] as discussed in the part of anthocyanin. Changes of chlorophyll content can be detected through blue shift of the red-edge inflection point (spectral region near 700 nm) [36,37,63] and in general an increase of reflectance in the chlorophyll absorption areas (400–500 nm and 600–700 nm) [4,6,7,8,37,38,64,65]. Dates 5 (1st April 2014) and 6 (5th June 2014) show a high contribution of the anthocyanin and chlorophyll absorption bands and date 7 (23rd June 2014) concentrates on the red-edge position regarding the chlorophyll absorption region (see Figure 9e–g). This blue shift of the red-edge region as well as the increase of anthocyanin cause the effect of strong yellowing and reddening of the needles of the ring-barked trees, which was observed on date 7 (23rd June 2014) and stated in the laboratory protocol. These findings are again contrary to Cheng et al. [10] where no anthocyanin absorption feature but rather chlorophyll only was detected. This might be revealed from less measurement dates but also because Cheng et al. [10] has analysed a different tree species; thus, results are not totally comparable among different tree species.

6. Conclusions

This ring-barking experiment with seven spectral needle measurements during 2013 and 2014 of ring-barked and control trees as well as regular acquired crown condition assessments shows the potential of research towards early detection of vitality changes within forests, especially regarding Norway spruce. The results show a separation between ring-barked and control samples using derivative analysis 292 days before crown condition assessment detected first visual changes and 152 days after the ring-barking. This can be interpreted as early detection.
Index derivation turned out to be least important for detecting changes in respect to medium important spectral data and highly important derivative analysis. This returned a significance test as well as a random forest classifier analysing the probability of separating ring-barked and control samples as well as returning important features for separation. The ring-barking is causing an interruption of the phloem, cambium and the primary xylem that are important for assimilate transport from the crown towards the root system (phloem) and water and nutrient exchange from the root system towards the crown (xylem) as well as forming both (cambium). Because of this interruption, the root growth is impaired due to the lack of assimilates. Thus, these assimilates are stored primarily in the trunk and crown and cause a yellow discolouring of the foliage. This yellowing is caused due to anthocyanin production within the crown and can be detected within absorption in the 530–550 nm VIS spectral region. Anthocyanin is a pigment being produced often in a stressed situation among a surplus of assimilate content. Especially from date 5 (1st April 2014) onwards, this spectral absorption region increases in importance. Water related SWIR spectral regions are less significant in this experiment and can be explained by the unimpaired connection of secondary xylem for some remained water and nutrient exchange, whereas plant phenolics absorption (around 1660 nm) showed significant changes in date 4 (12th November 2013) that are stress indicators.
This analysis results in detecting the most appropriate preselected method, important spectral regions and time of change within this experiment. Since these findings are based on needle level, an adaptation to crown level using available hyperspectral remote sensing data, acquired on 12 dates during the experiment time, will be performed subsequently. This will support actual research for analysing the feasibility of hyperspectral image data for deriving forest health changes in an early stage.
In this study, a qualitative trend analysis was possible using the available data. Due to the lack of chemical validation data, a quantitative analysis is not feasible. Further research in this field should be realised using chemical measurements as validation data. This study will contribute to ongoing research for early detection of vitality changes that will support foresters and decision makers. Linkage between both datasets, airborne hyperspectral and laboratory data, is planned.

Acknowledgments

This research is based on data of the project E54 “VitTree: Automated assessment of forest tree vitality using up-to-date optical satellite data with enhanced spectral and spatial resolution” funded by the Bavarian State Institute of Food, Agriculture and Forestry (StMELF). The authors thank all contributors within this project. Especially for the spectral needle measurements, we thank Kathrin Einzmann and Markus Immitzer from University of Natural Resources and Life Sciences, Vienna, Austria. For access to the ring-barking, comprehensive crown condition assessment and needle sampling data, we thank the Bavarian State Forestry (BaySF) as well as the State Forest Institute (LWF). The main author’s research is funded by the German Federal Ministry of Economic Affairs and Energy (BMWi) within the project Opt4Environment at the University of Würzburg. This publication was funded by the German Research Foundation (DFG) and the University of Wuerzburg in the funding programme Open Access Publishing.

Author Contributions

A.R. is the principal author of this manuscript, having written the majority of the manuscript, and contributed at all phases of the investigation. L.H. contributed to the data collection as well as provided support with plant physiology explanations and revision. N.P., M.B. and D.R. provided support with design of this study, critical discussion and revision.

Conflicts of Interest

The authors declare no conflict of interest.

References

  1. Kölling, C.; Knoke, T.; Schall, P.; Ammer, C. Überlegungen zum Risiko des Fichtenanbaus in Deutschland vor dem Hintergrund des Klimawandels. Forstarchiv 2009, 80, 42–54. [Google Scholar]
  2. Levitt, J. Water, Radiation, Salt, and Other Stresses, Band 2; Academic Press: Cambridge, MA, USA, 1980. [Google Scholar]
  3. Lichtenthaler, H.K. Vegetation Stress: An Introduction to the Stress Concept in Plants. J. Plant Physiol. 1996, 148, 4–14. [Google Scholar] [CrossRef]
  4. Rock, B.; Hoshizaki, T.; Miller, J. Comparison of in situ and airborne spectral measurements of the blue shift associated with forest decline. Remote Sens. Environ. 1988, 24, 109–127. [Google Scholar] [CrossRef]
  5. Carter, G.A.; Knapp, A.K. Leaf optical properties in higher plants: Linking spectral characteristics to stress and chlorophyll concentration. Am. J. Bot. 2001, 88, 677–684. [Google Scholar] [CrossRef] [PubMed]
  6. Carter, G.A. Responses of Leaf Spectral Reflectance to Plant Stress. Am. J. Bot. 1993, 80, 239. [Google Scholar] [CrossRef]
  7. Carter, G.A. Ratios of leaf reflectances in narrow wavebands as indicators of plant stress. Int. J. Remote Sens. 1994, 15, 697–703. [Google Scholar] [CrossRef]
  8. Hoque, E.; Hutzler, P.J. Spectral blue-shift of red edge minitors damage class of beech trees. Remote Sens. Environ. 1992, 39, 81–84. [Google Scholar] [CrossRef]
  9. Hoque, E.; Hutzler, P.; Hiendl, H. Studies on reflective features of Norway spruce and their possible applications in remote sensing of forest damage. Toxicol. Environ. Chem. 1990, 27, 209–215. [Google Scholar] [CrossRef]
  10. Cheng, T.; Rivard, B.; Sánchez-Azofeifa, G.; Feng, J.; Calvo-Polanco, M. Continuous wavelet analysis for the detection of green attack damage due to mountain pine beetle infestation. Remote Sens. Environ. 2010, 114, 899–910. [Google Scholar] [CrossRef]
  11. Niemann, K.O.; Quinn, G.; Stephen, R.; Visintini, F.; Parton, D. Hyperspectral Remote Sensing of Mountain Pine Beetle with an Emphasis on Previsual Assessment. Can. J. Remote Sens. 2015, 41, 191–202. [Google Scholar] [CrossRef]
  12. Fassnacht, F.E.; Latifi, H.; Koch, B. An angular vegetation index for imaging spectroscopy data—Preliminary results on forest damage detection in the Bavarian National Park, Germany. Int. J. Appl. Earth Obs. Geoinf. 2012, 19, 308–321. [Google Scholar] [CrossRef]
  13. Fassnacht, F.E.; Latifi, H.; Ghosh, A.; Joshi, P.K.; Koch, B. Assessing the potential of hyperspectral imagery to map bark beetle-induced tree mortality. Remote Sens. Environ. 2014, 140, 533–548. [Google Scholar] [CrossRef]
  14. Lausch, A.; Heurich, M.; Gordalla, D.; Dobner, H.J.; Gwillym-Margianto, S.; Salbach, C. Forecasting potential bark beetle outbreaks based on spruce forest vitality using hyperspectral remote-sensing techniques at different scales. For. Ecol. Manag. 2013, 308, 76–89. [Google Scholar] [CrossRef]
  15. Dawson, T.P.; Curran, P.J. Technical note A new technique for interpolating the reflectance red edge position. Int. J. Remote Sens. 1998, 19, 2133–2139. [Google Scholar] [CrossRef]
  16. Cho, M.A.; Skidmore, A.K. A new technique for extracting the red edge position from hyperspectral data: The linear extrapolation method. Remote Sens. Environ. 2006, 101, 181–193. [Google Scholar] [CrossRef]
  17. Mutanga, O.; Skidmore, A.K. Red edge shift and biochemical content in grass canopies. J. Photogramm. Remote Sens. 2007, 62, 34–42. [Google Scholar] [CrossRef]
  18. Grossman, Y.; Ustin, S.; Jacquemoud, S.; Sanderson, E.; Schmuck, G.; Verdebout, J. Critique of stepwise multiple linear regression for the extraction of leaf biochemistry information from leaf reflectance data. Remote Sens. Environ. 1996, 56, 182–193. [Google Scholar] [CrossRef]
  19. Yao, H.; Huang, Y.; Hruska, Z.; Thomson, S.J.; Reddy, K.N. Using vegetation index and modified derivative for early detection of soybean plant injury from glyphosate. Comput. Electron. Agric. 2012, 89, 145–157. [Google Scholar] [CrossRef]
  20. Smith, K.; Steven, M.; Colls, J. Use of hyperspectral derivative ratios in the red-edge region to identify plant stress responses to gas leaks. Remote Sens. Environ. 2004, 92, 207–217. [Google Scholar] [CrossRef]
  21. Bayerisches Landesamt für Umwelt. GeoFachdatenAtlas (Boden Informations System Bayern); Bayerisches Landesamt für Umwelt: Augsburg, Germany, 2016. [Google Scholar]
  22. Bayer, A. Methodological Developments for Mapping Soil Constituents Using Imaging Spectroscopy. Ph.D. Thesis, University Potsdam, Potsdam, Germany, February 2013. [Google Scholar]
  23. Dorigo, W.; Bachmann, M.; Heldens, W. AS Toolbox and Processing of Field Spectra—User’s Manual; Technical Report; German Aerospace Center: Wessling, Germany, 2006. [Google Scholar]
  24. Einzmann, K.; Ng, W.T.; Immitzer, M.; Pinnel, N.; Atzberger, C.; Atzberger, C. Method Analysis for Collecting and Processing in-situ Hyperspectral Needle Reflectance Data for Monitoring Norway Spruce<BR> Methodenanalyse zur Erfassung und Prozessierung hyperspektraler in-situ Nadelreflexionsdaten zum Monitoring von Fichten. Photogramm. Fernerkund. Geoinf. 2014, 2014, 423–434. [Google Scholar]
  25. Breiman, L. Classification and Regression Trees; Chapman & Hall: London, UK, 1984; p. 358. [Google Scholar]
  26. Breiman, L. Random Forests. Mach. Learn. 2001, 45, 5–32. [Google Scholar] [CrossRef]
  27. Gitelson, A.A.; Keydan, G.P.; Merzlyak, M.N. Three-band model for noninvasive estimation of chlorophyll, carotenoids, and anthocyanin contents in higher plant leaves. Geophys. Res. Lett. 2006, 33, L11402. [Google Scholar] [CrossRef]
  28. Daughtry, C. Estimating Corn Leaf Chlorophyll Concentration from Leaf and Canopy Reflectance. Remote Sens. Environ. 2000, 74, 229–239. [Google Scholar] [CrossRef]
  29. Sims, D.A.; Gamon, J.A. Relationships between leaf pigment content and spectral reflectance across a wide range of species, leaf structures and developmental stages. Remote Sens. Environ. 2002, 81, 337–354. [Google Scholar] [CrossRef]
  30. Gao, B.C. NDWI—A normalized difference water index for remote sensing of vegetation liquid water from space. Remote Sens. Environ. 1996, 58, 257–266. [Google Scholar] [CrossRef]
  31. Hunt, E.R.; Rock, B. Detection of changes in leaf water content using Near- and Middle-Infrared reflectances. Remote Sens. Environ. 1989, 30, 43–54. [Google Scholar]
  32. Serrano, L.; Peñuelas, J.; Ustin, S.L. Remote sensing of nitrogen and lignin in Mediterranean vegetation from AVIRIS data: Decomposing biochemical from structural signals. Remote Sens. Environ. 2002, 81, 355–364. [Google Scholar] [CrossRef]
  33. Delegido, J.; Verrelst, J.; Rivera, J.P.; Ruiz-Verdú, A.; Moreno, J. Brown and green LAI mapping through spectral indices. Int. J. Appl. Earth Obs. Geoinf. 2015, 35, 350–358. [Google Scholar] [CrossRef]
  34. Gitelson, A.A.; Merzlyak, M.N.; Chivkunova, O.B. Optical properties and nondestructive estimation of anthocyanin content in plant leaves. Photochem. Photobiol. 2001, 74, 38–45. [Google Scholar] [CrossRef]
  35. Blackburn, G.A. Quantifying Chlorophylls and Caroteniods at Leaf and Canopy Scales: An Evaluation of Some Hyperspectral Approaches. Remote Sens. Environ. 1998, 66, 273–285. [Google Scholar] [CrossRef]
  36. Gitelson, A.A.; Merzlyak, M.N. Signature Analysis of Leaf Reflectance Spectra: Algorithm Development for Remote Sensing of Chlorophyll. J. Plant Physiol. 1996, 148, 494–500. [Google Scholar] [CrossRef]
  37. Gates, D.M.; Keegan, H.J.; Schleter, J.C.; Weidner, V.R. Spectral Properties of Plants. Appl. Opt. 1965, 4, 11. [Google Scholar] [CrossRef]
  38. Curran, P.J. Remote-Sensing of Foliar Chemistry. Remote Sens. Environ. 1989, 30, 271–278. [Google Scholar] [CrossRef]
  39. Kokaly, R.F.; Skidmore, A.K. Plant phenolics and absorption features in vegetation reflectance spectra near 1.66 μm. Int. J. Appl. Earth Obs. Geoinf. 2015, 43, 55–83. [Google Scholar] [CrossRef]
  40. Elvidge, C.D. Visible and near infrared reflectance characteristics of dry plant materials. Int. J. Remote Sens. 1990, 11, 1775–1795. [Google Scholar] [CrossRef]
  41. Cheynier, V.; Comte, G.; Davies, K.M.; Lattanzio, V.; Martens, S. Plant phenolics: Recent advances on their biosynthesis, genetics, and ecophysiology. Plant Physiol. Biochem. 2013, 72, 1–20. [Google Scholar] [CrossRef] [PubMed]
  42. Bhattacharya, A.; Sood, P.; Citovsky, V. The roles of plant phenolics in defence and communication during Agrobacterium and Rhizobium infection. Mol. Plant Pathol. 2015, 11, 705–719. [Google Scholar] [CrossRef] [PubMed]
  43. Noel, A.R.A. The girdled tree. Bot. Rev. 1970, 36, 162–195. [Google Scholar] [CrossRef]
  44. Casas, A.; Riaño, D.; Ustin, S.; Dennison, P.; Salas, J. Estimation of water-related biochemical and biophysical vegetation properties using multitemporal airborne hyperspectral data and its comparison to MODIS spectral response. Remote Sens. Environ. 2014, 148, 28–41. [Google Scholar] [CrossRef]
  45. Zarco-Tejada, P.; Pushnik, J.; Dobrowski, S.; Ustin, S. Steady-state chlorophyll a fluorescence detection from canopy derivative reflectance and double-peak red-edge effects. Remote Sens. Environ. 2003, 84, 283–294. [Google Scholar] [CrossRef]
  46. Curran, P.J.; Dungan, J.L.; Macler, B.A.; Plummer, S.E. The effect of a red leaf pigment on the relationship between red edge and chlorophyll concentration. Remote Sens. Environ. 1991, 35, 69–76. [Google Scholar] [CrossRef]
  47. Nultsch, W. Allgemeine Botanik; Thieme: Stuttgart, Germany, 1996. [Google Scholar]
  48. Resa, F. Ueber Die Periode der Wurzelbildung; Carthouse: Bonn, Germany, 1877. [Google Scholar]
  49. Raven, P.H.; Evert, R.F.; Eichhorn, S.E. Biologie der Pflanzen; Gruyter: Berlin, Germany, 2006. [Google Scholar]
  50. Puhe, J. Growth and development of the root system of Norway spruce (Picea abies) in forest stands—A review. For. Ecol. Manag. 2003, 175, 253–273. [Google Scholar] [CrossRef]
  51. Steyn, W.J.; Wand, S.J.E.; Holcroft, D.M.; Jacobs, G. Anthocyanins in vegetative tissues: A proposed unified function in photoprotection. New Phytol. 2002, 155, 349–361. [Google Scholar] [CrossRef]
  52. Gitelson, A.; Jacquemoud, S.; Schaepman, M.; Asner, G.P.; Gamon, J.A.; Zarco-Tejada, P. Retrieval of foliar information about plant pigment systems from high resolution spectroscopy. Remote Sens. Environ. 2009, 113, S67–S77. [Google Scholar]
  53. Chalker-Scott, L. Environmental Significance of Anthocyanins in Plant Stress Responses. Photochem. Photobiol. 1999, 70, 1–9. [Google Scholar] [CrossRef]
  54. Burger, J.; Edwards, G.E. Photosynthetic Efficiency, and Photodamage by UV and Visible Radiation, in Red versus Green Leaf Coleus Varieties. Plant Cell Physiol. 1996, 37, 395–399. [Google Scholar] [CrossRef]
  55. Blackburn, G.A. Hyperspectral remote sensing of plant pigments. J. Exp. Bot. 2007, 58, 855–867. [Google Scholar] [CrossRef] [PubMed]
  56. McClure, J.W. Physiology and Functions of Flavonoids. In The Flavonoids; Springer: Boston, MA, USA, 1975; pp. 970–1055. [Google Scholar]
  57. Gitelson, A.; Merzlyak, M. Non-Destructive Assessment of Chlorophyll Carotenoid and Anthocyanin Content in Higher Plant Leaves: Principles and Algorithms. Pap. Nat. Resour. 2004, 263, 78–94. [Google Scholar]
  58. Jeannette, E.; Reyss, A.; Gregory, N.; Gantet, P.; Prioul, J.L. Carbohydrate metabolism in a heat-girdled maize source leaf. Plant Cell Environ. 2000, 23, 61–69. [Google Scholar] [CrossRef]
  59. Barker, D.H.; Seaton, G.G.R.; Robinson, S.A. Internal and external photoprotection in developing leaves of the CAM plant Cotyledon orbiculata. Plant Cell Environ. 1997, 20, 617–624. [Google Scholar] [CrossRef]
  60. Lauer, M.J.; Pallardy, S.G.; Blevins, D.G.; Randall, D.D. Whole Leaf Carbon Exchange Characteristics of Phosphate Deficient Soybeans (Glycine max L.). Plant Physiol. 1989, 91, 848–854. [Google Scholar] [CrossRef] [PubMed]
  61. Paul, M.J.; Driscoll, S.P. Sugar repression of photosynthesis: the role of carbohydrates in signalling nitrogen deficiency through source:sink imbalance. Plant Cell Environ. 1997, 20, 110–116. [Google Scholar] [CrossRef]
  62. Larcher, W.W. Physiological Plant Ecology: Ecophysiology and Stress Physiology of Functional Groups; Springer: Berlin/Heidelberg, Germany, 1995; p. 506. [Google Scholar]
  63. Horler, D.; Dockray, M.; Barber, J.; Barringer, A. Red edge measurements for remotely sensing plant chlorophyll content. Adv. Space Res. 1983, 3, 273–277. [Google Scholar] [CrossRef]
  64. Gitelson, A.A.; Merzlyak, M.N.; Lichtenthaler, H.K. Detection of Red Edge Position and Chlorophyll Content by Reflectance Measurements Near 700 nm. J. Plant Physiol. 1996, 148, 501–508. [Google Scholar] [CrossRef]
  65. Carter, G.A. Primary and Secondary Effects of Water Content on the Spectral Reflectance of Leaves. Am. J. Bot. 1991, 78, 916. [Google Scholar] [CrossRef]
Figure 1. Study Area in southeast Germany; two flightlines of hyperspectral HySpex airborne sensor covering study area, yellow points = ring-barked groups and orange points = control groups.
Remotesensing 10 00057 g001
Figure 2. Overview of observation distribution for the ring-barking experiment − Spectra = needle sampling, Crown = crown condition assessment.
Remotesensing 10 00057 g002
Figure 3. Aggregated bark beetle occurrence (a) and averaged yellowing rate (logarithmic enhanced) (b) for ring-barked and control trees.
Remotesensing 10 00057 g003
Figure 4. Mean and standard deviation of needle spectral measurements of control (a) and ring-barked trees (b).
Remotesensing 10 00057 g004
Figure 5. Significant features (black vertical lines) for separating ring-barked and control samples from date 5 (1st April 2014) using spectral data.
Remotesensing 10 00057 g005
Figure 6. Index calculation for ring-barked and control group including standard deviation.
Remotesensing 10 00057 g006
Figure 7. Significant features in derivative data for separating ring-barked and control samples from date 4 (12th November 2013) onwards.
Remotesensing 10 00057 g007
Figure 8. Out Of Bag Score and standard deviation derived from 200 random forest iterations for separating ring-barked and control samples all ages combined together.
Remotesensing 10 00057 g008
Figure 9. Twenty important features for separating ring-barked and control samples resulting of random forest analysis per date (ag) and all dates combined (h) height indicate importance.
Remotesensing 10 00057 g009
Table 1. Overview of sampling dates of needle samples and age classes for ring-barked and control trees, respectively.
SampleDateMeasurementsAge ClassesTrees
116th July 201316432
220th August 201316432
310th September 201316432
412th November 201316432
51st April 201416432
65th June 201416432
723rd June 201416432
Table 2. Stress related indices and their referenceused in this analysis.
IndicesFormularReference
CRI ( R 510 1 R 710 1 ) × R 800 [27]
mARI ( R 540 1 R 710 1 ) × R 800 [27]
MCARI ( R 700 R 670 ) 0.2 × ( R 700 R 550 ) × ( R 700 R 670 ) [28]
NDVI705 R 750 R 705 R 750 + R 705 [29]
REP ( c 1 c 2 ) m 1 m 2 [16] m and c represent slope and intercept of two lines extrapolated from derivative data, their intersection is REP
NDWI R 860 R 1240 R 860 + R 1240 [30]
MSI R 1600 R 820 [31]
NDLI l o g ( 1 R 1754 ) l o g ( 1 R 1680 ) l o g ( 1 R 1754 ) + l o g ( 1 R 1680 ) [32]
GBVI R 2000 R 2100 R 2000 [33]
CRI—Carotenoid Reflectance Index; mARI—Modified Anthocyanin Reflectance Index; MCARI—Modified Chlorophyll Absorption in Reflectance Index; NDVI705—Red Edge Normalised Difference Vegetation Index; REP—Red Edge Position; NDWI—Normalised Difference Water Index; MSI—Moisture Stress Index; NDLI—Normalised Difference Lignin Index; GBVI—Green Brown Vegetation Index.
Table 3. Mann–Whitney-U significance test for separating ring-barked and control measurements using index analysis, significance level p = 0.05.
CRImARIMCARINDVI705REPNDWIMSINDLIGBVI
Datep-Valuep-Valuep-Valuep-Valuep-Valuep-Valuep-Valuep-Valuep-Value
16th July 20130.6450.4920.5090.6740.5090.3670.6170.5350.412
20th August 20130.6260.3960.9840.8890.7850.5530.5980.4040.553
10th September 20130.4750.5890.4190.6840.4040.3460.4270.2360.132
12th November 20130.4750.7740.1500.5800.4920.5710.8470.8890.544
1st April 2014 0.052 0.014 0.007 0.001 0.001 0.8680.9420.9310.645
5th June 20140.216 0.026 2.0 × 10 6 3.1 × 10 5 2.5 × 10 7 0.2820.2820.589 0.005
23rd June 20140.082 8.1 × 10 5 1.3 × 10 13 1.1 × 10 8 4.2 × 10 11 0.1030.0770.360 0.009
Table 4. Random forest classification as Out Of Bag Score and corresponding standard deviation for separating control and ring-barked samples.
DateOOB ScoreStDev
16th July 20130.520.055
20th August 20130.470.060
10th September 20130.490.062
12th November 20130.520.063
1st April 20140.580.055
5th June 20140.710.047
23rd June 20140.860.036

