SPI-Based Analyses of Drought Changes over the Past 60 Years in China’s Major Crop-Growing Areas


1
National Hulunber Grassland Ecosystem Observation and Research Station, Institute of Agricultural Resources and Regional Planning, Chinese Academy of Agricultural Sciences, Beijing 100081, China
2
State Key Laboratory of Remote Sensing Science, Institute of Remote Sensing and Digital Earth Research, Chinese Academy of Science and Beijing Normal University, Beijing 100086, China
3
Beijing Research Center of Intelligent Equipment for Agriculture, Beijing Academy of Agriculture and Forestry Sciences, Beijing 100081, China
4
Key Laboratory of Ecosystem Network Observation and Modeling, Institute of Geographic Sciences and Natural Resources Research, University of Chinese academy of Science, Beijing 100086, China
5
College of Resources and Environments, Hunan Agricultural University, Changsha 410128, China
*
Author to whom correspondence should be addressed.
Remote Sens. 2018, 10(2), 171; https://doi.org/10.3390/rs10020171
Submission received: 1 December 2017
/
Revised: 19 January 2018
/
Accepted: 23 January 2018
/
Published: 25 January 2018
(This article belongs to the Special Issue Advances in Quantitative Remote Sensing in China – In Memory of Prof. Xiaowen Li)
Abstract
:This study analyzes the changes in drought patterns in China’s major crop-growing areas over the past 60 years. The analysis was done using both weather station data and Tropical Rainfall Measuring Mission (TRMM) Microwave Imager (TMI) rainfall data to calculate the Standardized Precipitation Index (SPI). The results showed that the occurrences of extreme drought were the most serious in recent years in the Southwest China and Sichuan crop-growing areas. The Yangtze River (MLRY) and South China crop-growing areas experienced extreme droughts during 1960–1980, whereas the Northeast China and Huang–Huai–Hai crop-growing areas experienced extreme droughts around 2003. The analysis showed that the SPIs calculated by TRMM data at time scales of one, three, and six months were reliable for monitoring drought in the study regions, but for 12 months, the SPIs calculated by gauge and TRMM data showed less consistency. The analysis of the spatial distribution of droughts over the past 15 years using TMI rainfall data revealed that more than 60% of the area experienced extreme drought in 2011 over the MLRY region and in 1998 over the Huang–Huai–Hai region. The frequency of different intensity droughts presented significant spatial heterogeneity in each crop-growing region.
1. Introduction
Droughts caused by long-term shortages of precipitation are a global issue. Droughts generally occur randomly, last for long periods of time, and impact large areas [1,2,3]. Compared to the impacts of other natural disasters, the impacts of drought on agricultural production and food safety are more significant [4]. Droughts have long been monitored and analyzed, and with the evolving awareness of drought occurrences, drought monitoring methods are continuously improving. These improvements are mainly reflected in the methodologies and data sources used. In the mid-1900s, drought monitoring was primarily done through drought estimation using precipitation alone or combined with other meteorological elements [5]. For example, Thornthwaite [6] proposed using precipitation minus evapotranspiration as an index of drought, and Van et al. [7] proposed the concept of agricultural drought days. After the mid-1900s, the monitoring of meteorological droughts was more actively studied. Palmer [8] corrected deficiencies in previous drought monitoring indices and proposed the Palmer drought severity index in 1965. McKee et al. [9] proposed the Standardized Precipitation Index (SPI) for drought monitoring in Colorado, USA. In addition, several drought monitoring methods have been proposed and used in different areas, such as the meteorological drought composite index (CI) proposed by the China Meteorological Administration [10] and the Standardized Precipitation–Evapotranspiration Index (SPEI), which combines the features of the SPI and the Palmer drought index [11,12].
Compared to remote sensing data, meteorological data from weather stations generally cover longer periods of time and are more precise. Thus, meteorological drought monitoring methods are more advantageous for analyzing the periodicities of drought. Meanwhile, remote sensing data cover larger areas, are less constrained by geographic conditions, and thus are more suitable for large-scale drought monitoring. At present, drought monitoring methods based on remote sensing data, e.g., the Temperature Vegetation Drought Index (TVDI) [13,14], Vegetation Condition Index (VCI) [15], and Microwave Integrated Drought index (MIDI) [16], are mainly focused on using vegetation indices, land surface temperatures and microwave data. In addition, many methods were also proposed to monitor agricultural drought. For example, Lessel et al. presented a method based on quasi-climatological anomalies of remotely sensed data to monitor agricultural drought [17]. Tigkas et al. proposed an Effective Reconnaissance Drought Index (eRDI) to improve the ability to assess agricultural drought [18]. Li et al. developed a new agricultural drought index based on the Variable Infiltration Capacity (VIC) model coupled with an irrigation scheme and a reservoir module to monitor drought [19].
With global climate change, China, whose per capita cultivated land is only 32% that of the global average, has suffered severe droughts in recent decades [4,20]. The economic losses caused by droughts far exceed those caused by other natural disasters. Several studies have revealed changes in drought in China for different regions by using ground gauge data [4,21,22,23,24,25,26,27] and TRMM precipitation products. For example, Hui et al. evaluated drought in the Jiangsu Province by using TRMM 3B43 data [28], and Zeng et al. used TRMM data to monitor drought in the Lancang River Basin [29]. In general, such studies mainly covered individual watersheds or plains and rarely aimed at researching meteorological changes in drought across the major crop-growing areas. In this study, two data sources were used, including weather station data with longer monitoring and recording histories and the Tropical Rainfall Measuring Mission (TRMM) [30] Microwave Imager (TMI) precipitation data (3B43) with a better spatial distribution. SPI was adopted to analyze the changes in drought in the major crop-growing areas of China over the past 60 years using meteorological data, and the SPI calculated using the TRMM 3B43 product for the years of 1998 to 2013 was validated by the meteorological data. Finally, the spatial and temporal features of drought area were analyzed by the TRMM data in the major crop-growing areas of China.
2. Study Area and Data
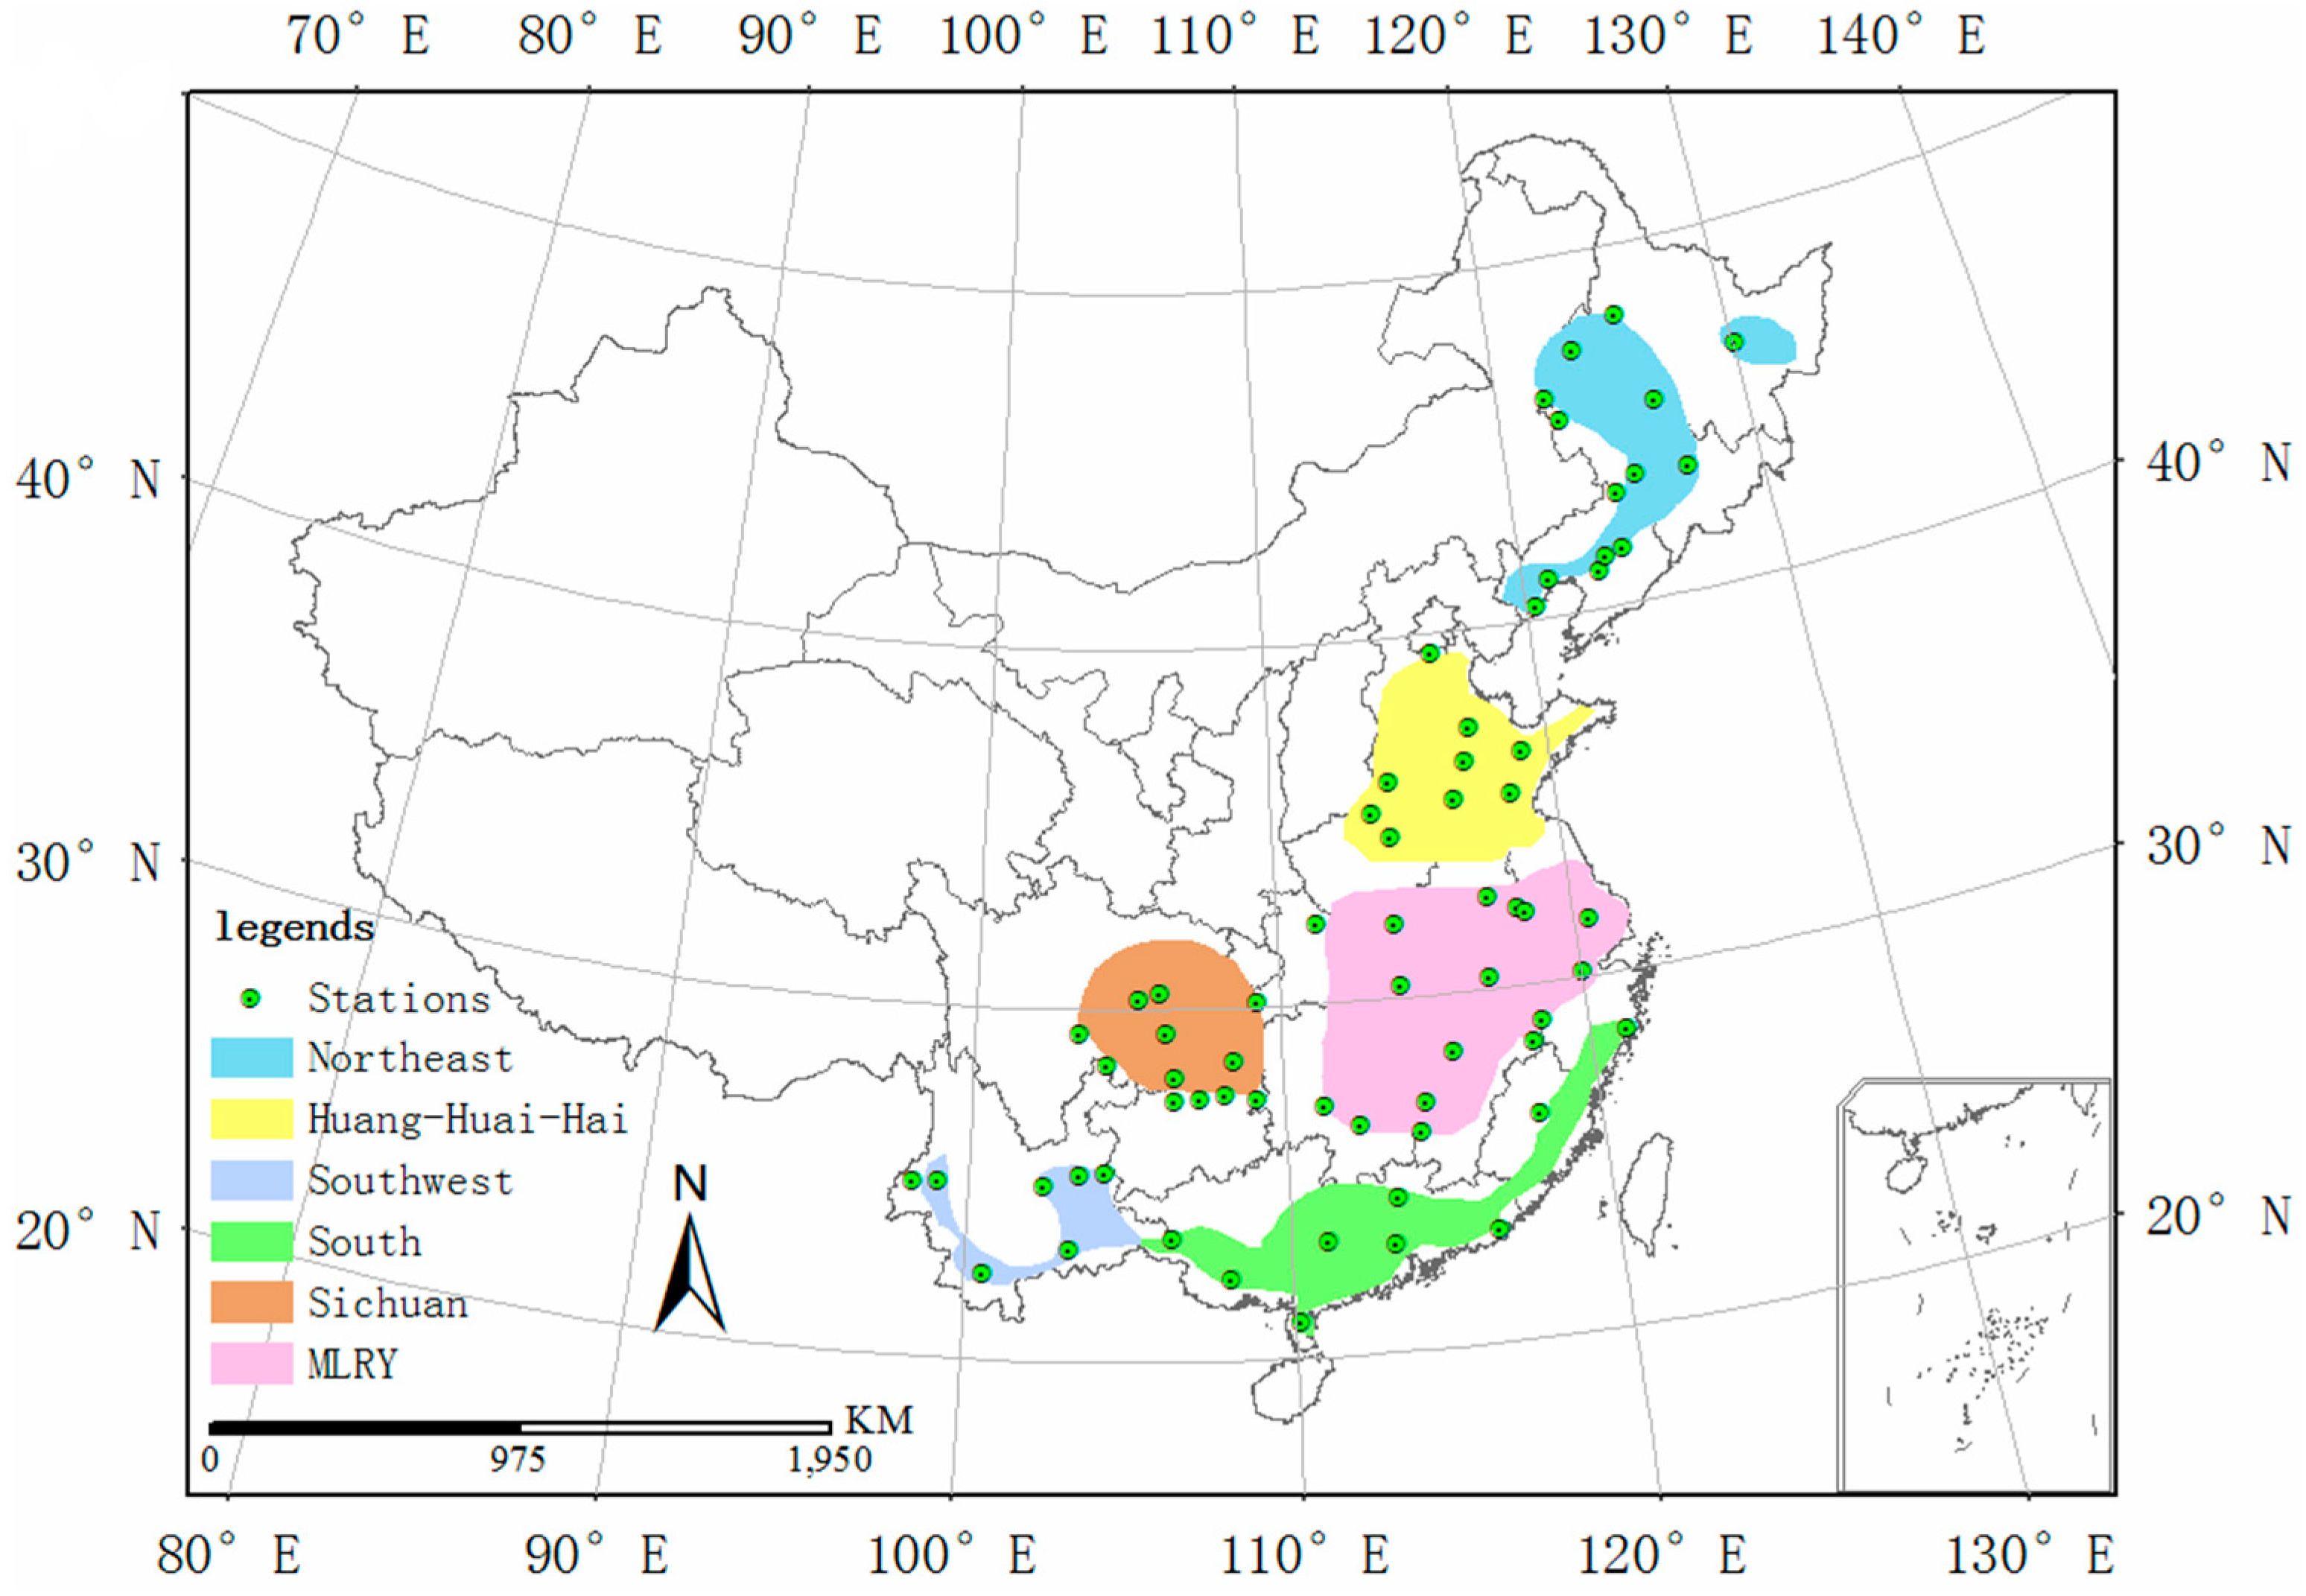
The National Regionalization of Priority Development Areas (access at: http://www.gov.cn/zwgk/2011-06/08/content_1879180.htm) was released on 21 December 2010 by the State Council of China. Based on the planning for China’s agricultural strategy given in this notice, the research area of this study was selected, as shown in Figure 1. According to a previous study [31], major crop-growing areas in different geographic locations were subject to the influences of various types of monsoons. For example, Southwest China and the Sichuan area were mainly influenced by the combined effects of the Southwest monsoons from the Indian Ocean and the summer monsoons from the Pacific Ocean. Meanwhile, the South China area, the middle and lower reaches of the Yangtze River (MLRY), the Huang–Huai–Hai area, and Northeast China were mainly influenced by summer monsoons from the Pacific Ocean. Due to the different arrival times of the monsoons, the starting time of the rainy seasons varies from south to north, as shown in Table 1.
The data used in this study include weather station data and remote sensing rainfall data. The weather station data were obtained from meteorological data sharing websites (access at: http://data.cma.cn/). The daily data from 752 basic or standardized ground meteorological stations were collected from 1951 to 2013. Since the observed precipitation data were not continuous at some stations but the SPI computation requires complete data, the data were filtered using the following rule: the data from any station with more than one day of data missing or containing abnormal measurements were excluded. Hence, 64 stations in or near the research regions were obtained, as shown in Figure 1. In addition, the daily precipitation values were merged to obtain the monthly rainfall data to calculate the monthly SPI values.
The TRMM satellite was launched in 1997 for weather and climate research [32]. In 2014, it suffered some battery issues and did not have enough propellant to support the required orbit altitude, so it had to turn off the Visible and Infrared Scanner (VIRS) and slowly decayed in orbit while continuing to collect data. The satellite stopped gathering data on 15 June 2015. This study used the TRMM 3B43 monthly precipitation data with a resolution of 0.25 degrees from 1998 to 2013 as the satellite gauged data to explore a robust spatial characterization of drought.
3. Methodology
The SPI based on the best fit of the precipitation to a probability distribution was designed by McKee et al. [9] for drought monitoring in Colorado, USA. SPI at different time scales can be used to monitor the impacts of decreased rainfall on different habitats [5]. Shorter time scales (one to three months) can be used for drought monitoring and early warning signs, as well as drought severity estimations. Time scales of six to 24 months can be used to monitor the impacts of decreased rainfall on hydrology, reservoirs, and surface water. To analyze the periodicities and variations of droughts over a long time period, the time span of the SPI should be set to six to 24 months.
Compared to PDSI [8] and SPEI [11], SPI only requires precipitation for its estimation to measure droughts at different time scales, and it is less complex to calculate than others. However, the SPI does not account for factors that influence evapotranspiration (e.g., soil types and temperature) [33]. Although it is plausible to consider additional variables in drought monitoring, the TRMM data were used to monitor the drought, and there is no gauged temperature for the TRMM coverage region. Hence, the simple SPI was selected in the study to monitor the changes in drought.
The SPIs for short timescales can monitor drought well, but these data are not suitable to trace the potential impacts of long periods of dryness on agriculture and water supply [33]. However, the proper characterization of agricultural drought depends on many factors, such as crop type and cultivation period. Using the same SPI for different plant regions may cause different degrees of drought damage for the crops. Hence, this study mainly analyzed the long-term change in drought among the plant regions, and a timescale with a cumulative duration of 12 months was used to analyze the change in drought in the main crop-growing areas of China.
The mean SPI calculated by Equation (1) can be used to evaluate general drought intensity when the gauge points are almost evenly distributed spatially:
where is the mean SPI, is the SPI at time for site , and is the number of total stations for the region. As shown in Figure 1, the gauge stations are almost evenly distributed in each crop-growing region, hence Equation (1) was used to present the general drought intensity for each crop-growing region.
The TRMM 3B43 data in the study regions were extracted, and the projection was converted to the Albers projection to obtain the equation area for each pixel. The rainfall of pixels among each region was extracted from the average monthly TRMM rainfall raster data from 1998 to 2013. In this way, time series of the spatial rainfall distribution were obtained. Then, time scales of one, three, six, and 12 months were used to calculate the SPI.
Dryness and wetness severity classifications according to the SPI values are listed in Table 2.
4. Results
4.1. Drought Results by Using Gauge Data
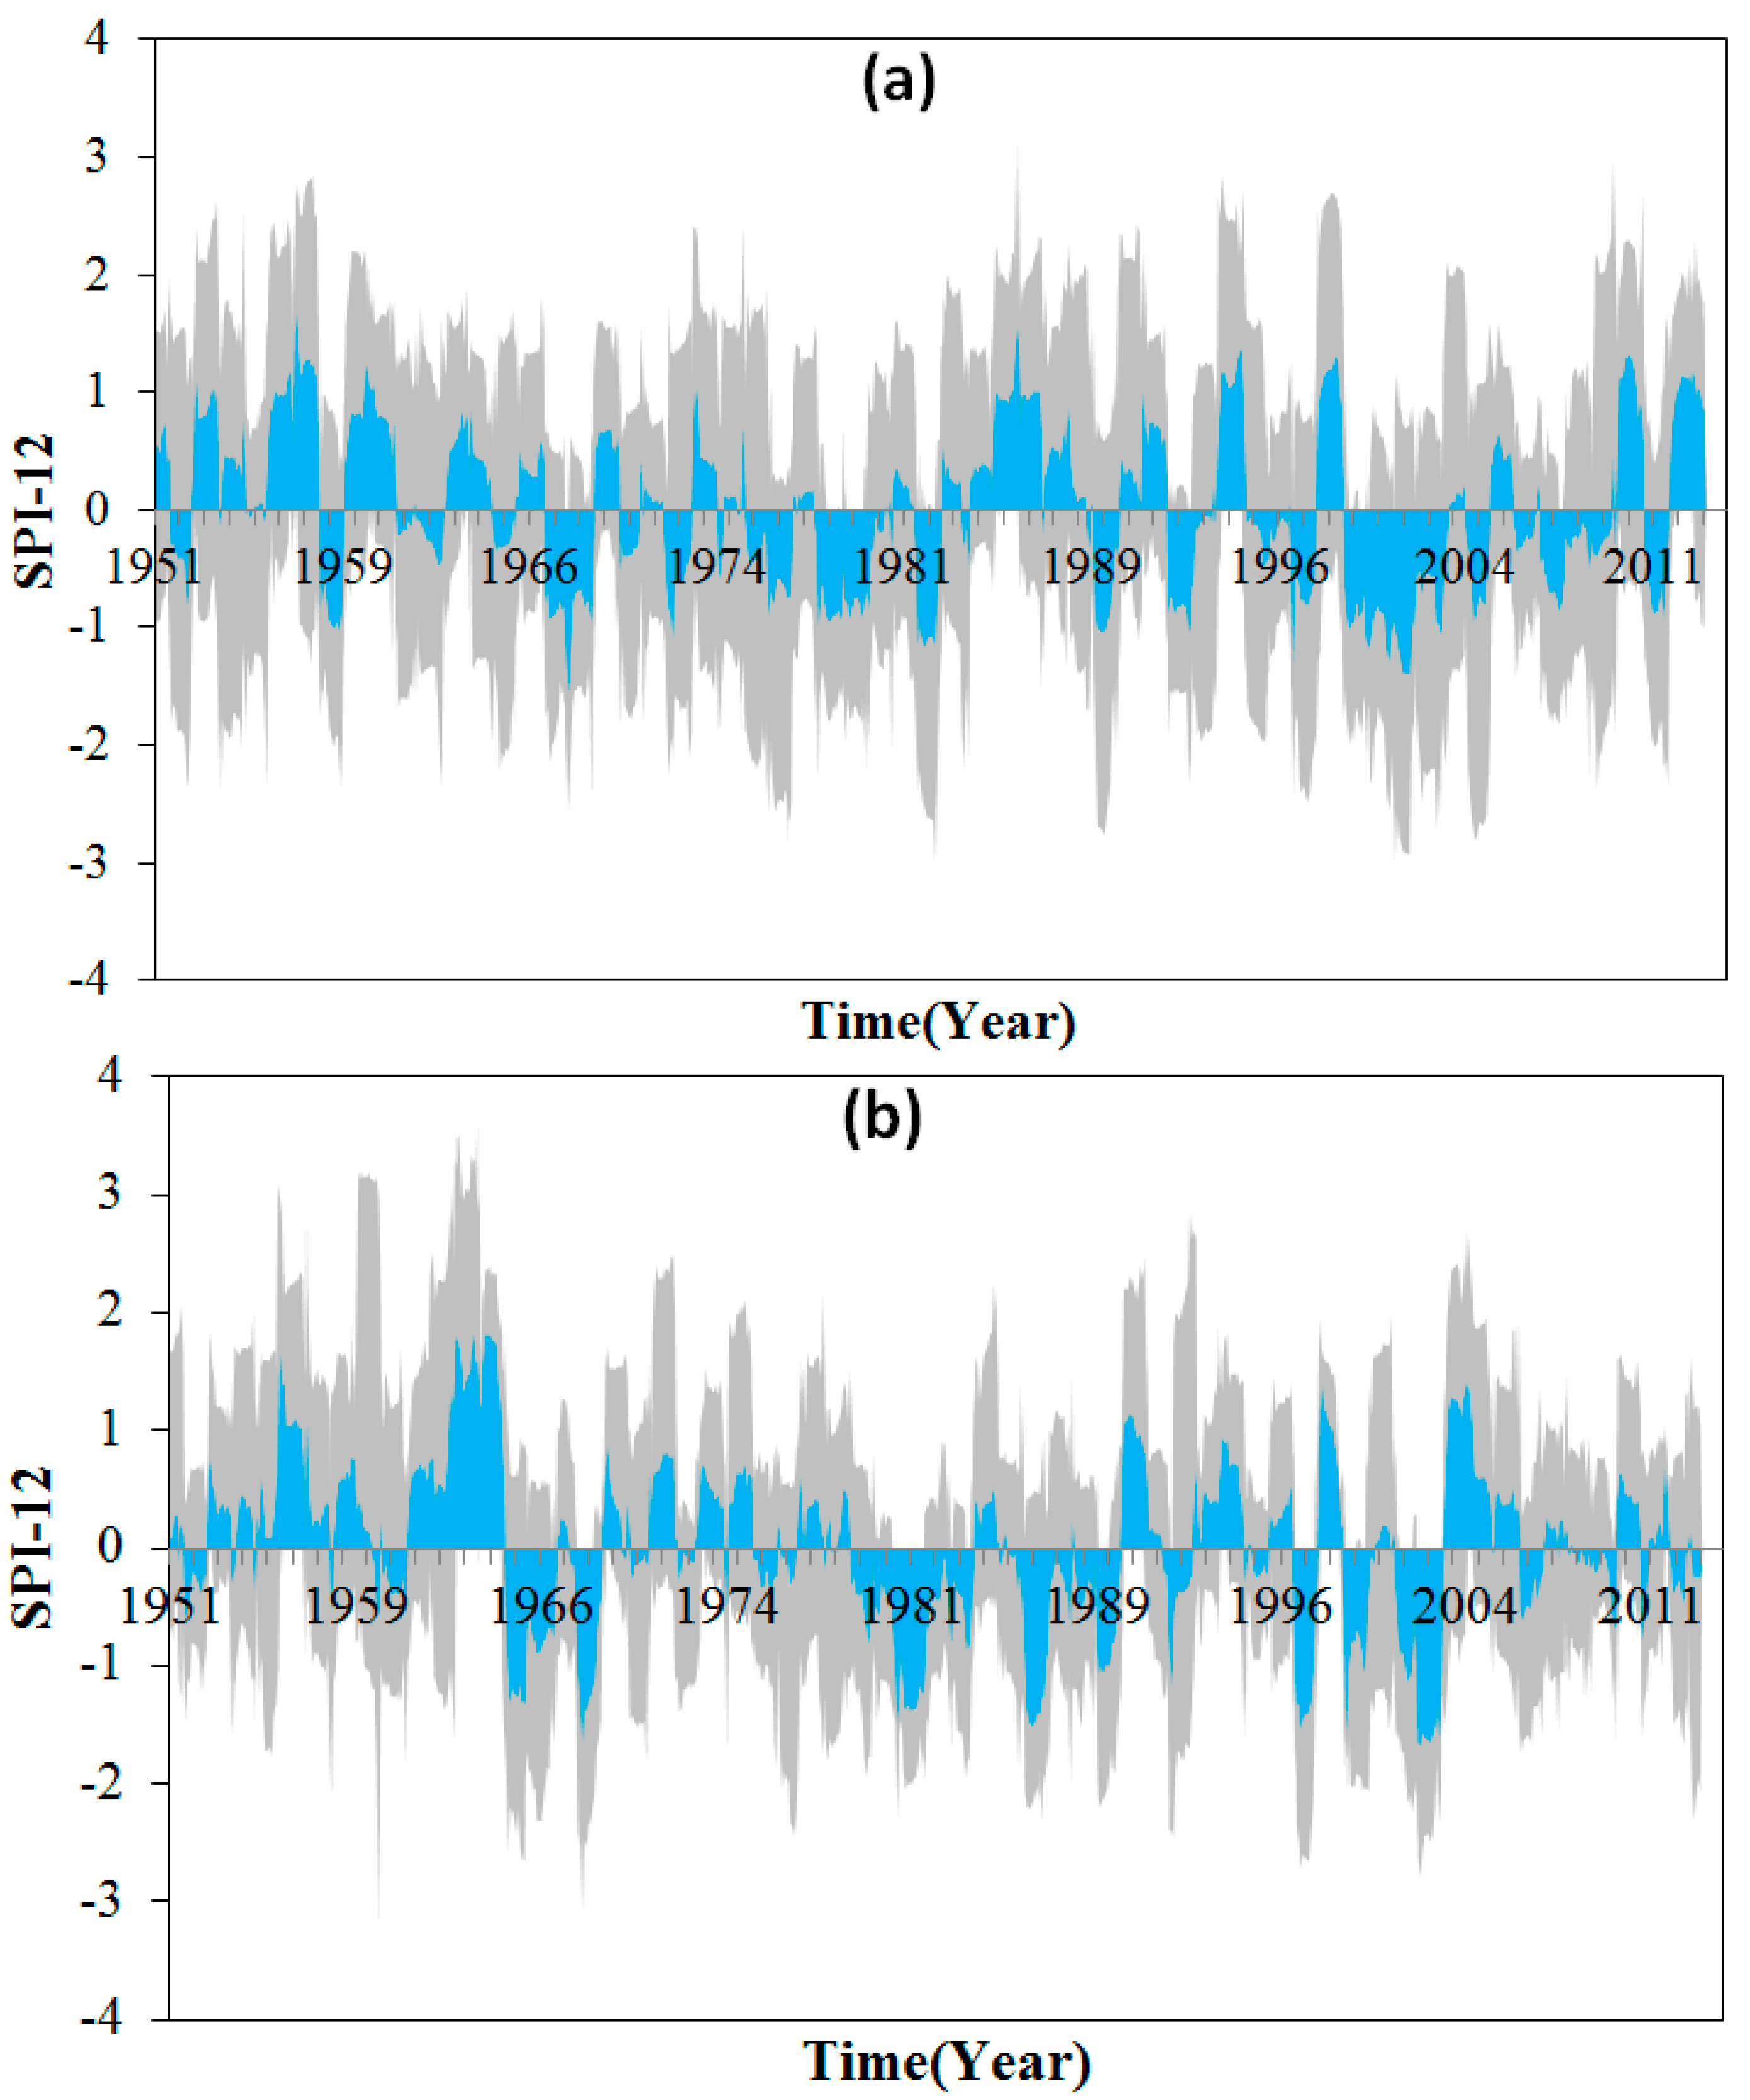
The SPI at a time scale of 12 month was used here to analyze the changes in drought in the study regions, as shown by the gray filled areas in Figure 2, Figure 3 and Figure 4. The mean SPIs for each region calculated by equation (1) are presented as the blue filled areas shown in Figure 2, Figure 3 and Figure 4. As shown in Figure 2a, the Northeast China crop-growing area experienced adequate precipitation before 1965, with rare drought occurrences. The end of the 1960s was a time of wet-to-dry transitions in the area, and then a 20-year dry period occurred in the area and reached its peak at the end of the 1970s. The precipitation increased in the 1980s, and the drought was alleviated to a certain extent. In 1990s, the droughts and wet periods changed every three years. After 2000, the subsequent droughts lasted for 10 years, and the intensity was more severe than the droughts of the 1970s. In 2010, the precipitation gradually increased, and the droughts were alleviated slightly.
The Huang–Huai–Hai crop-growing area also had low occurrences of drought before 1964, during which this area was moist, as shown in Figure 2b. At the beginning of 1965, the drought intensified, reaching its peak at the end of the 1960s. The 1970s was a relatively moist stage, and after this period, precipitation decreased and the drought intensified. The drought reached its peak at the end of the 1980s and gradually lessened over the following 10 years. Entering the 21st century, the drought situation intensified once again. However, the duration of this drought was less than those of the droughts in the 1980s, and after 2010, the occurrences of drought gradually lessened.
In the 1950s, the MLRY crop-growing area was relatively wet (Figure 3a). However, it was extremely dry in the following 10 years, and the drought reached its peak in 1966. In the 1970s, the wet periods and droughts changed over time spans of three years, and the drought intensified at the end of the 1970s. This extreme drought was the driest period from 1951 to 2013. In the 1980s and 1990s, the area was quite wet. In the 21st century, the intensity of drought in this region was enhanced. In the year of 2004 and 2011, the area was impacted by an extreme drought.
Figure 3b indicates that the most intense drought in the past 60 years occurred during the 1950s to 1960s. At the end of the 1970s, the drought lessened slightly. The mid-1980s experienced relatively wet periods. In the following 10 years, the drought intensified again and reached its peak at the beginning of the 1990s. The lowest period of drought intensity occurred in the early 21st century. However, after 2003, the occurrences of drought became more frequent, and the area entered another relatively dry period.
At the beginning of the 1950s, the Sichuan basin region experienced an extreme wet period, and at the end of the 1950s, a short, mild arid period occurred in the basin. In the next twenty years, except for the years around 1966 and 1970, this area experienced a wet period. At the end of the 1970s and at the beginning of the 1980s, the drought was intensified over this region. During the 1980s and 1990s, the drought gradually intensified and reached its peak in 1996. In the early 21st century, the drought in the area was alleviated. However, the drought gradually intensified until approximately 2004, when the most severe drought of the past 60 years occurred.
The variation of the drought in Southwest China was similar to that of the Sichuan basin, as shown in Figure 4b. A low-intensity drought occurred around 1960, and in the following 20 years, the occurrences of drought gradually decreased. Around 1980, this region experienced severe drought, similar to that in 1960. In the 1990s and the beginning of the 21st century, the drought intensity decreased, and this region experienced a wet period. However, after 2008, the drought intensified again and the most extreme drought of the past 60 years occurred. Overall, the trends on drought occurrences in the Sichuan area and Southwest China were similar around 1960 and 1980. After 2008, the droughts in both areas intensified significantly.
4.2. Drought Results by Using TRMM Data
Although some spatial interpolations that use interpolation techniques (e.g., Inverse Distance Weighted (IDW), Kriging etc. [34],) may help to infer drought conditions at large scales, they still face high uncertainties [33]. For example, altitude differences in mountainous regions and the random property of precipitation makes it very difficult to predict the correct values near in the adjacent areas. Compared to ground station gauge rainfall data, the advantage of TRMM data is that TRMM data provide better spatial coverage. On the other hand, as shown in Section 3 and Section 5.1, the time span of 6 to 24 months can be used to analyze the periodicities and variations in the drought over a long time period, and the SPI calculated by the TRMM data at s time scale of 12 months was not very accurate for evaluating the change in drought and. Hence, the SPI at a time scale of 6 months was selected to monitor drought in this section.
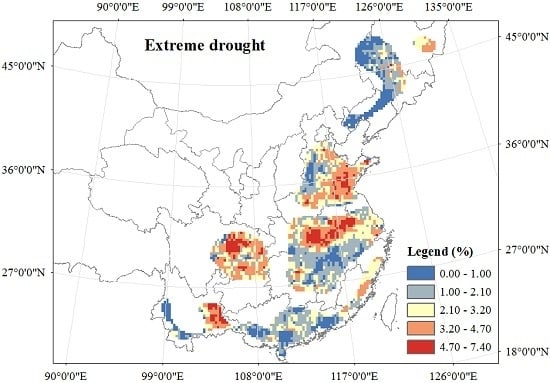
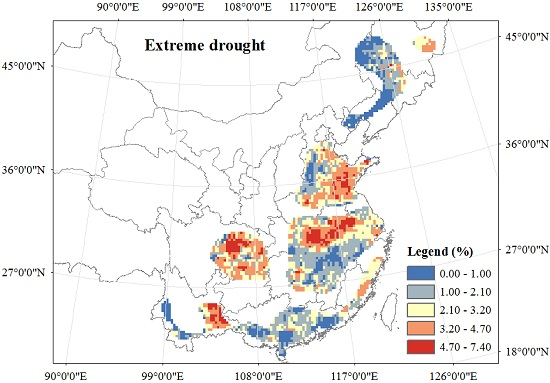
The frequencies of moderate, severe, and extreme drought are presented in Figure 5 to show the spatial distribution of different intensities of drought. Figure 5 shows that there are significant spatial differences in the probability of different intensity droughts among each crop-growing region. The northeast region suffered less extreme droughts than other regions but a high frequency of moderate droughts. The southeastern part of the Huang–Huai–Hai region suffered a high frequency of extreme droughts, but the north Huang–Huai–Hai region presented a high frequency of moderate and severe droughts. The north region of the MLRY region presented a high frequency of extreme droughts, whereas the frequency of moderate droughts was high in the south MLRY region. For the south region, the extreme droughts occurred less frequently in this region, but there was often a high frequency of moderate droughts in this region. Both the Sichuan and southwest crop-growing regions were less influenced by moderate droughts. The frequency of extreme droughts was quite high in the east part of the southwest region and the northeastern part of the Sichuan region.
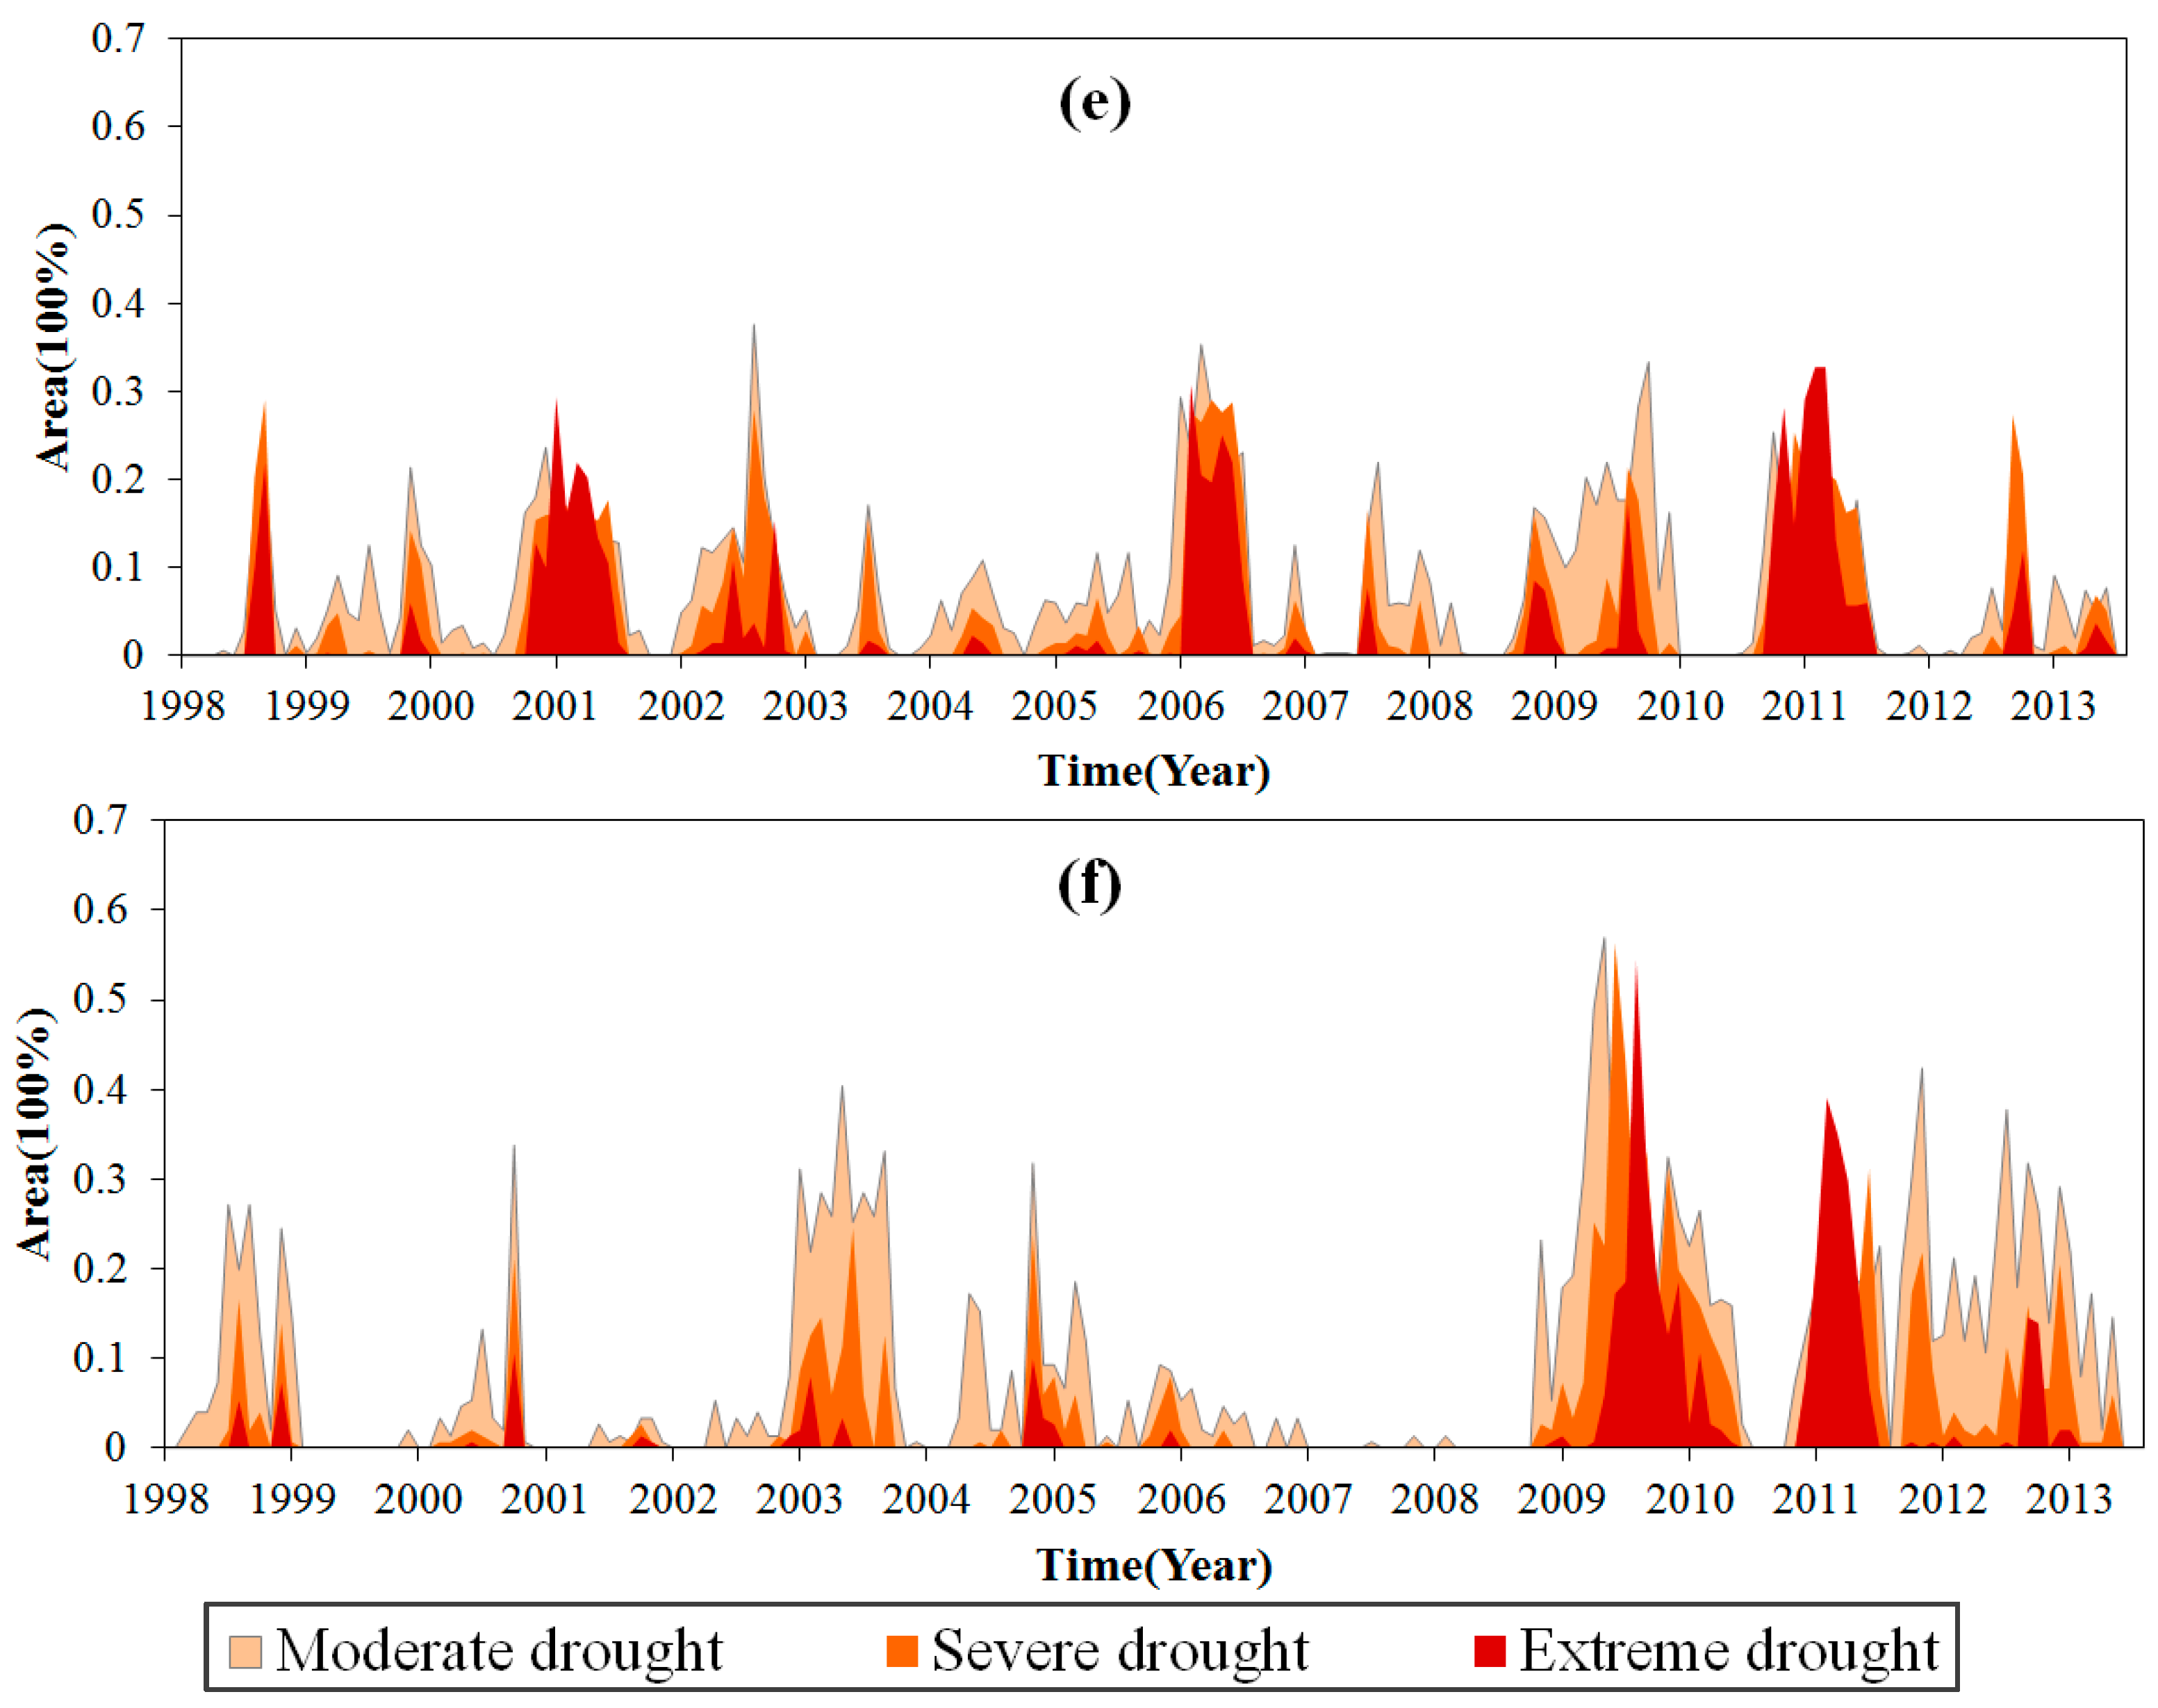
In addition, the area percentages of the crop-growing regions under different drought intensities are presented in Figure 6 to further analyze the drought changes in spatial and temporal scales. In Figure 6, moderately dry regions are depicted in peach, severely dry regions are depicted in orange, and extremely dry regions are depicted in red.
Figure 6 shows that the driest period in terms of drought severity was 2003 for the northeast region and that no severe drought occurred in this region from 1998 to 2010. In all, the area and frequency of extreme droughts in this region were lower than other regions. For the Huang–Huai–Hai region, the drought was severe from 1998 to 2002, but from 2003 to 2013, only a small percentage of this region suffered drought. The MLRY region suffered extreme drought in 2011, and more than 60% of the area experienced extreme drought. At the end of 1998 and 2001, this region also experienced extreme drought. The area and frequency of extreme drought in South China were quite low in 1998 to 2013, and this region experienced extreme drought in 2003, 2005, and 2011. The Sichuan basin suffered extreme drought in 2001, 2006, and 2011, and the characteristics of droughts in this region were that the percentage of severe drought accounted for a larger proportion than droughts of other intensities. The Southwest region suffered quite a wet period before 2009, but this region suffered severe drought after 2009. In all, the North of China (the Huang–Huai–Hai and the Northeast regions) experienced severe drought from 1998 to 2003, whereas the MLRY, the South, the Southern, and the Sichuan regions experienced severe drought around 2011.
5. Discussion
5.1. Reliability of Using the TRMM Data
Since satellite-derived data estimates precipitation indirectly and depends on the properties of cloud tops and path-integrated hydrometeor content [34], the results of retrieval precipitation data must be evaluated. The validation of TRMM data has been widely conducted, and the study performed by Chen et al. [35] showed that the TRMM 3B43 achieved reasonable accuracy in most regions of China, which includes the study regions of the study.
Another problem of using TRMM data to calculate SPI is that SPI calculations often require more than 40 years of accumulated precipitation, but TRMM data only include rainfall for 15 years, which is a short length of time to calculate the SPI. There is no comparison between the SPI values calculated by TRMM data and gauge data in the study regions. Hence, it is a prerequisite to evaluate the reliability of using TRMM data to calculate the SPI before these data are used to monitor drought in the crop-growing regions.
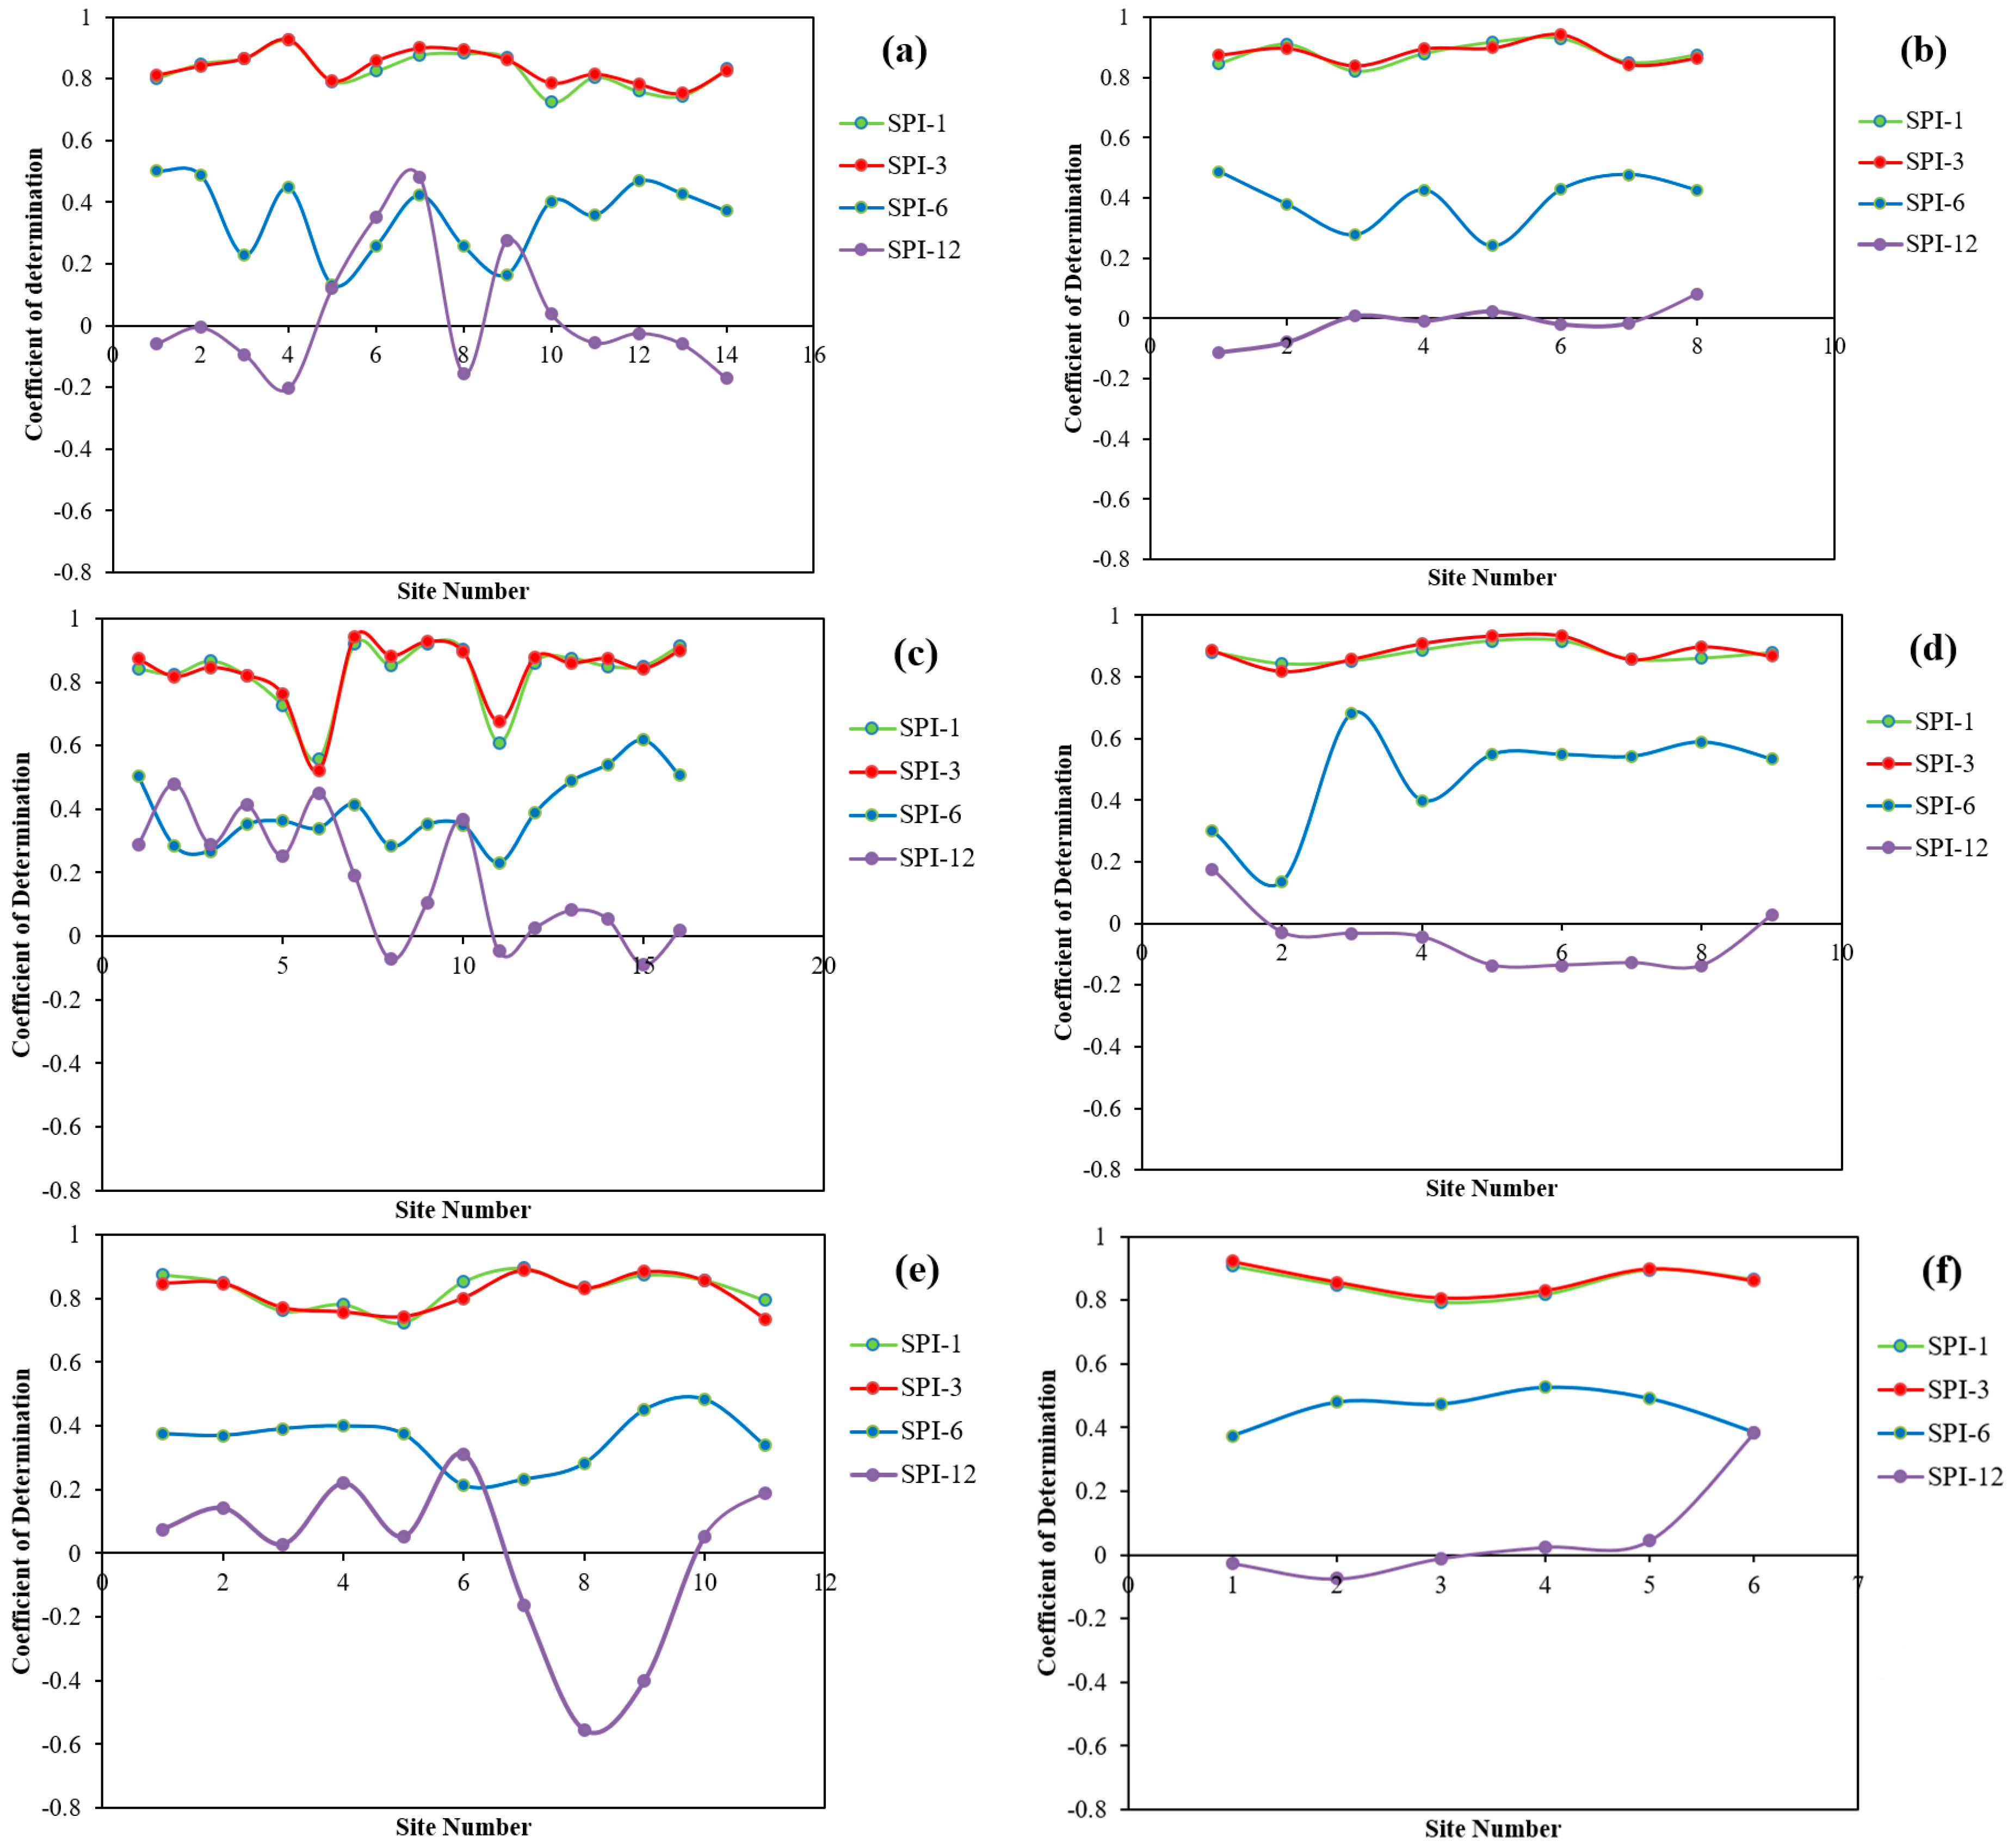
The monthly gauge data with long records from 1951 to 2013, monthly TRMM 3B43 data were selected, and the TRMM data corresponding to the stations were extracted. The SPIs were calculated at time scales of one, three, six, and twelve months for each station and TRMM extracted data. Then, the SPIs for each station between 1998 and 2013 were selected to match the SPIs calculated by TRMM extracted data, and a multiple linear regression fit was used to compare the two SPIs. In general, the SPIs at time scales of one, three, and six months were significant with corresponding TRMM extracted data (p < 0.01), but the SPIs at a time scale of twelve months were not significant. Figure 7 presents the detailed coefficient of determination R2 for difference regions.
Figure 7 indicates that the correlations between the SPIs at time scales of 1, 3 months (station data and TRMM data) are quite high, as most of the correlations are greater than 0.8. More specifically, in addition to the Huang–Huai–Hai area, the other regions present high fitting coefficients, and the coefficients of the South of China, e.g., South China, Sichuan basin, Southwest China, are higher than those of North of China, e.g., the MLRY and Northeast. The reason for this may be due to the uncertainty of TRMM data to sense frozen precipitation in winter in the North of China [36]. For the SPIs at the time scale of 6 months, most of the coefficients of determination range from 0.3 to 0.5 for most regions. For the SPIs at the time scale of 12 months, the coefficients of determination are predominantly low, and this may be due to the short measurement series. As a whole, the SPIs calculated by using the TRMM data at time scales of 1, 3 and 6 months are reliable for monitoring drought in the study regions.
5.2. Comparison between TRMM and Station Data
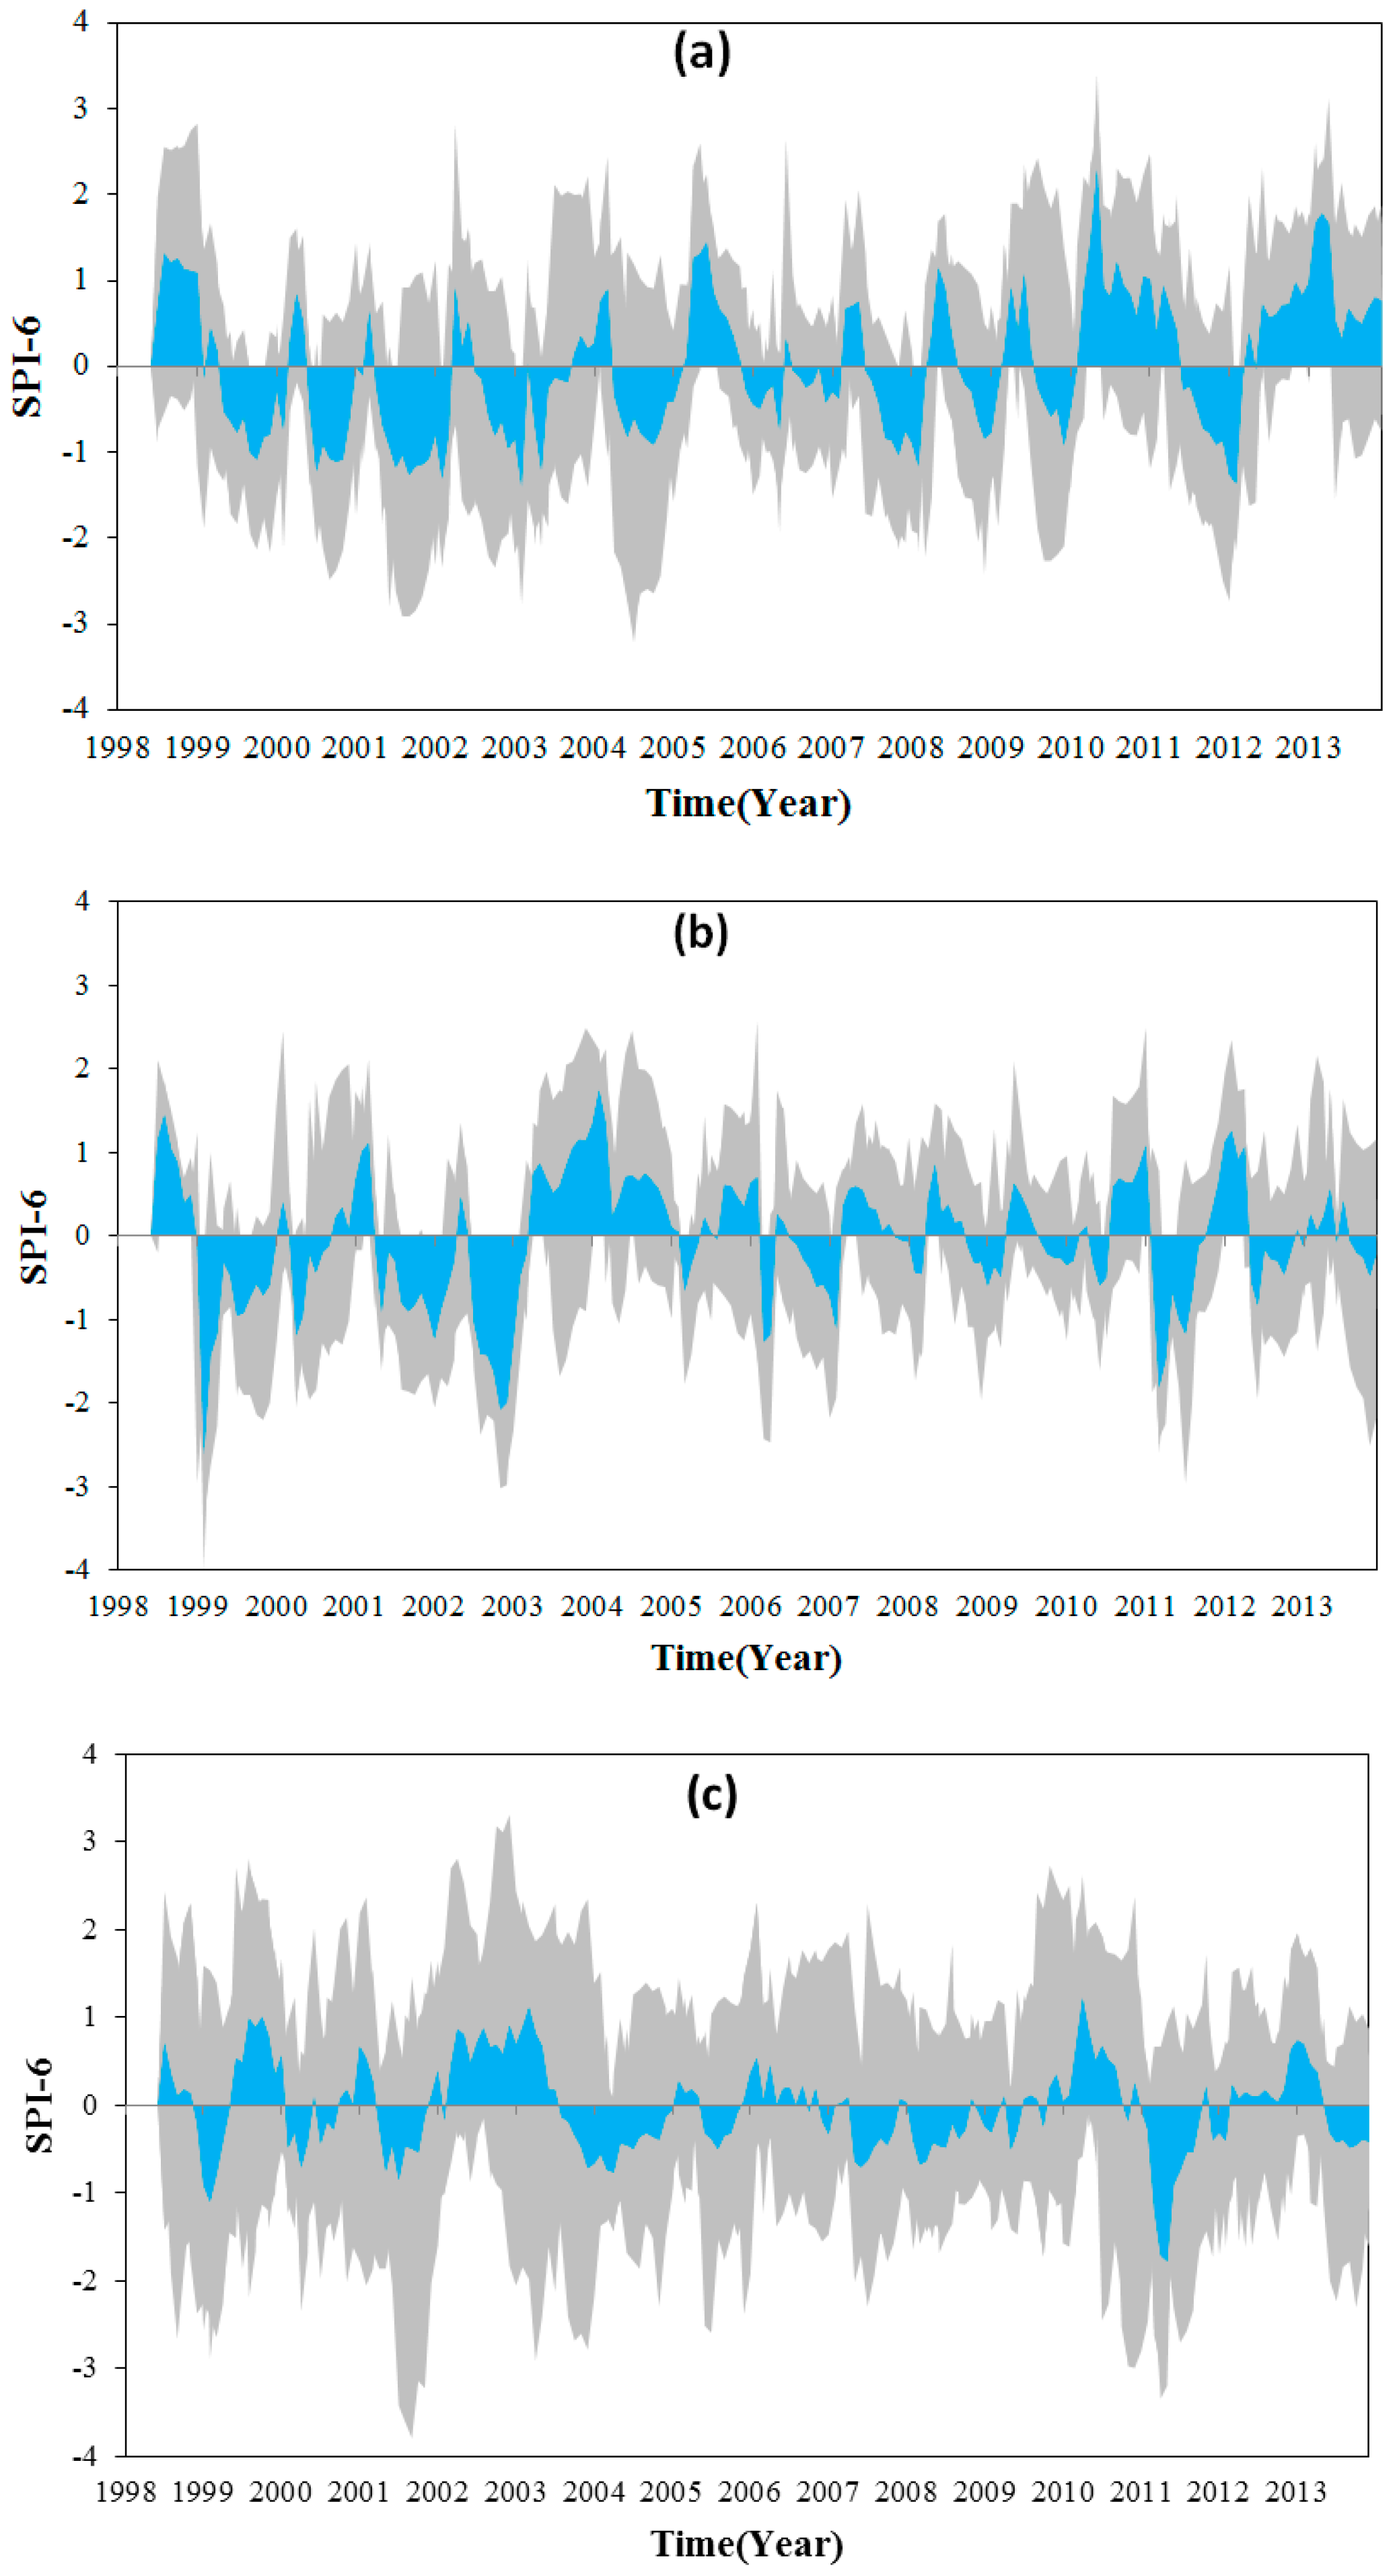
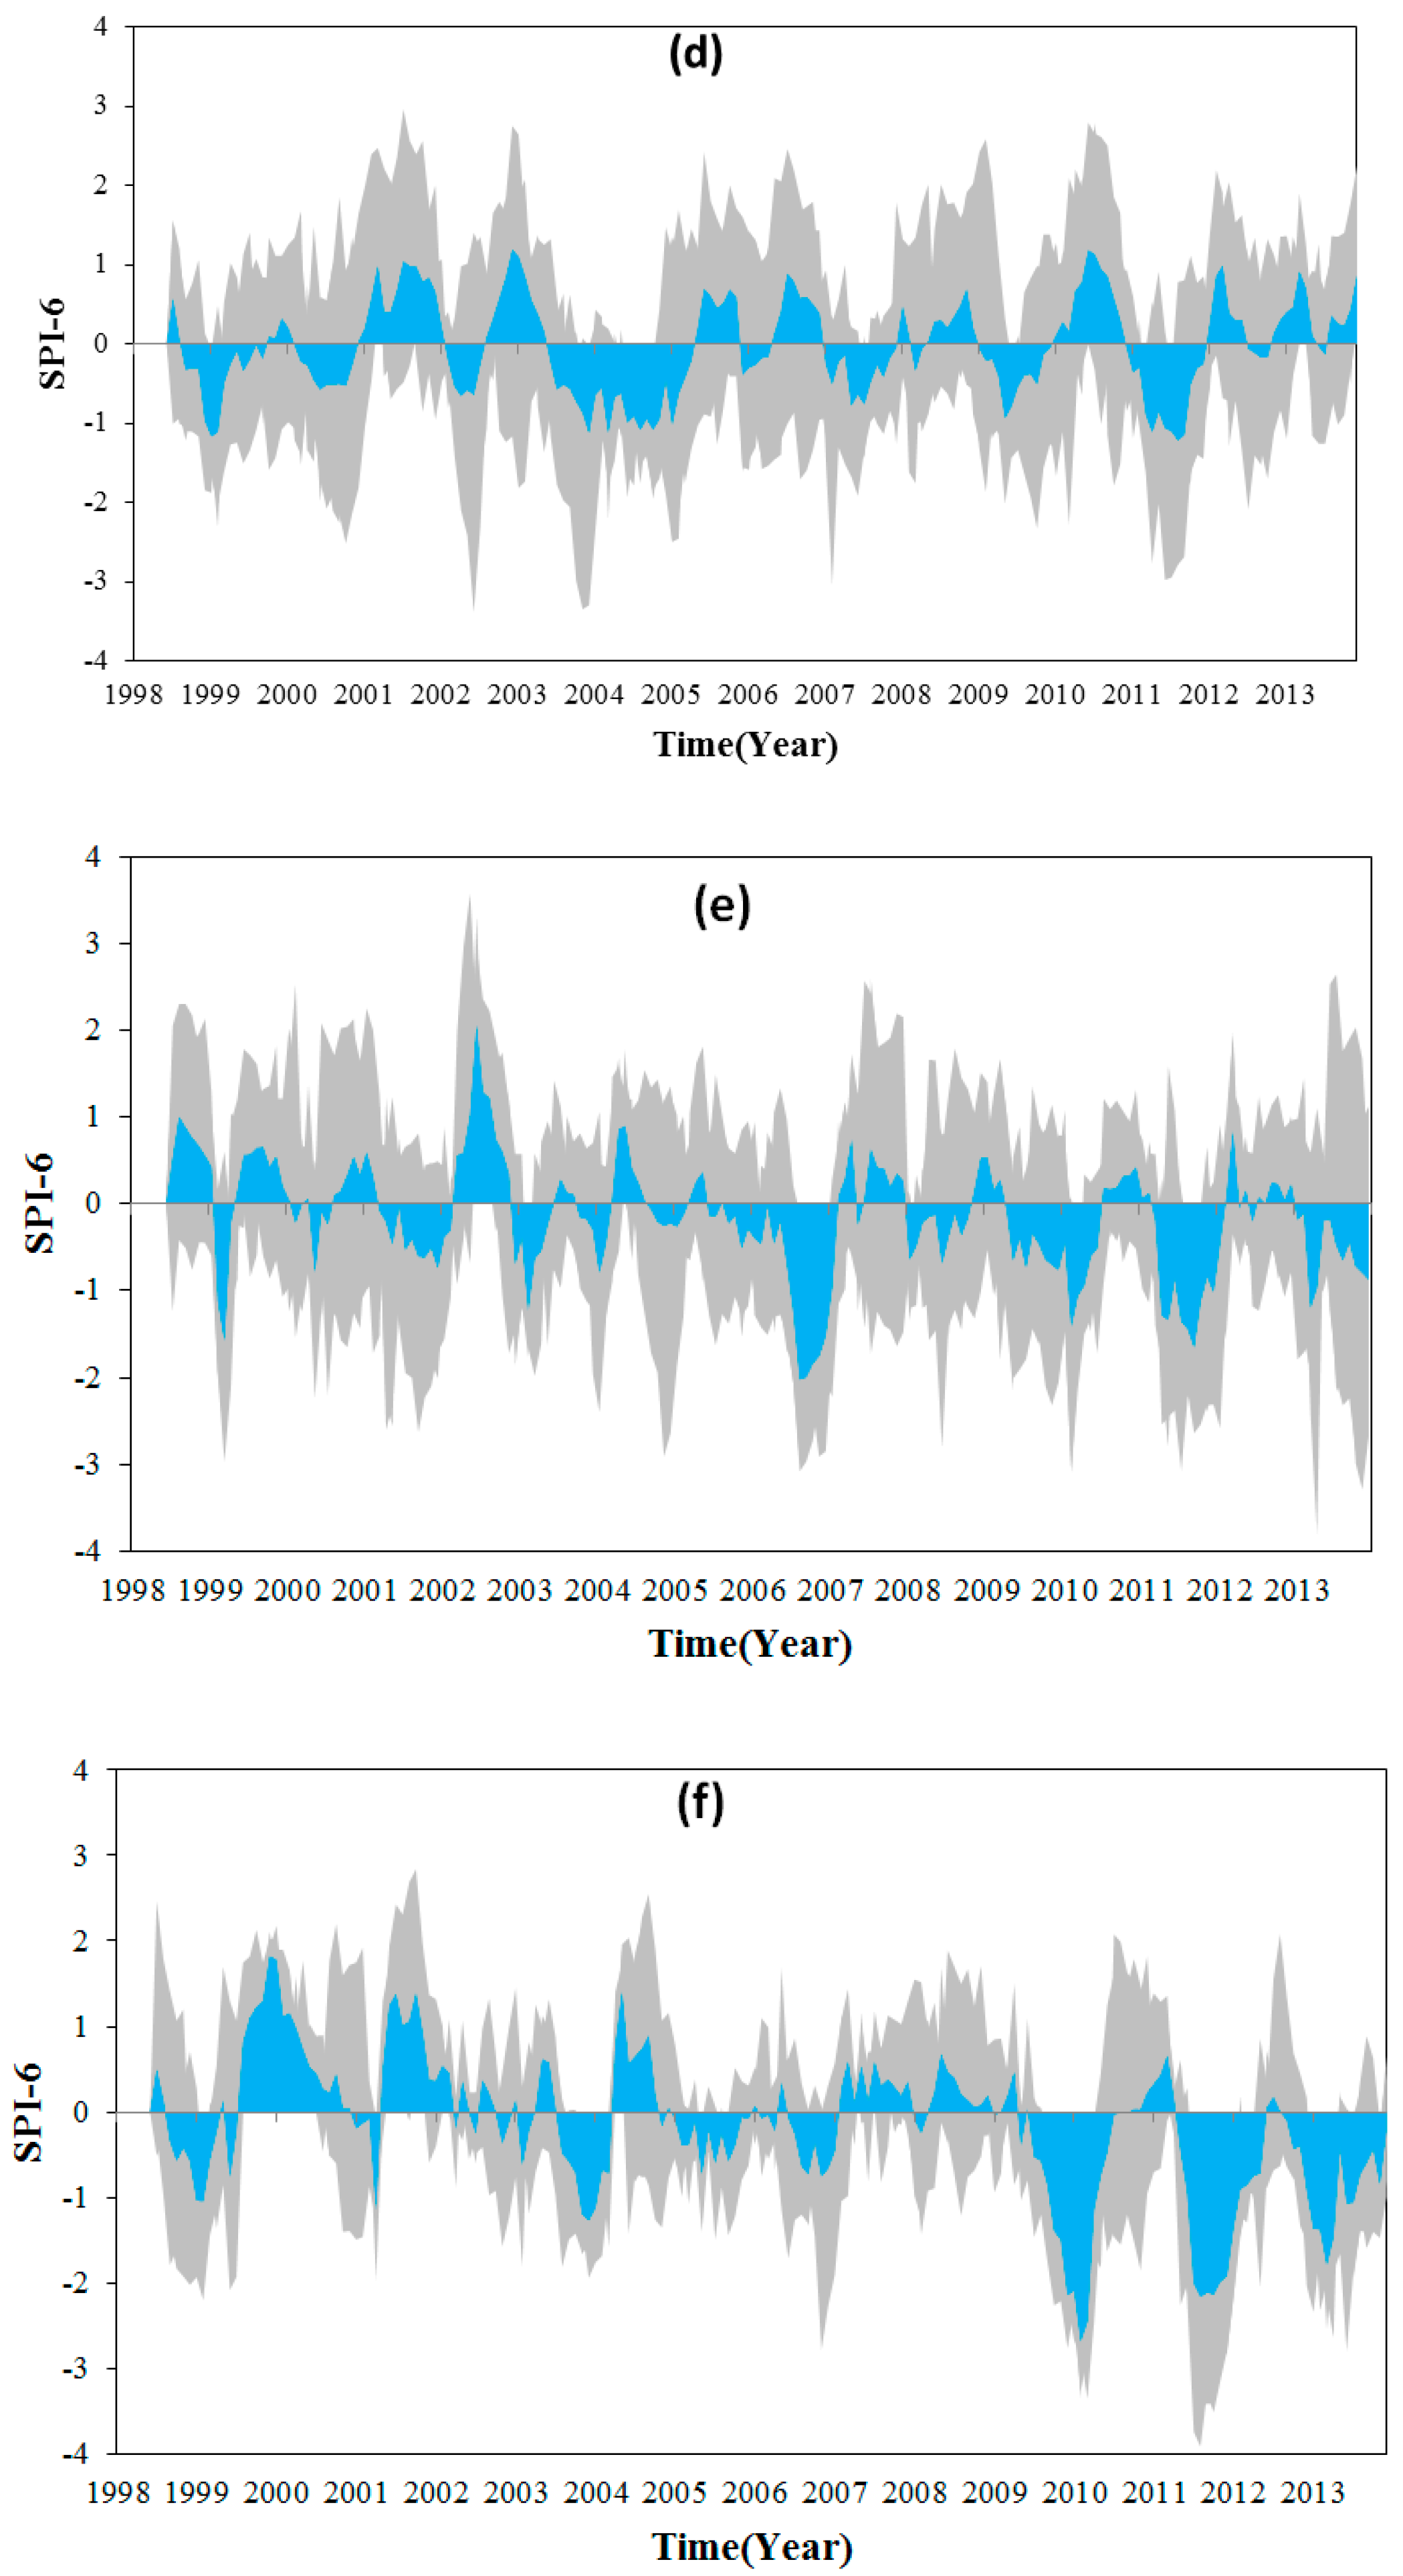
SPIs calculated at a time scale of 6 months by gauge data were selected, and are depicted as the gray filled areas shown in Figure 8. The mean SPIs for each region calculated by Equation (1) are presented as the blue filled areas. As can be seen in Figure 6, Figure 7 and Figure 8, the changes in drought presented in Figure 8 from year of 1998 to 2013 were similar to the changes monitored by TRMM data shown in Figure 6. Most of the drought events detected by station gauge data were also detected by TRMM data; this means the TRMM data provide not only the spatial coverage of the drought, but also accurate drought intensities at specific time scale compared to station gauge data.
Droughts are climatic events caused by various factors. When the factors that influence precipitation do not satisfy the requirements for precipitation in an area, climatic abnormities occur, i.e., droughts or floods. In recent decades, the temperature across China has gradually increased. The increases in temperature inevitably accelerate surface evapotranspiration. In addition, industrialization in China is consuming more and more water resources. Thus, reasonable approaches to coping with severe drought include constructing additional water conservation facilities in areas with a high frequency of severe, extreme droughts and improving water use efficiency in agricultural production.
6. Conclusions
In this study, weather station data with longer recording histories and TMI precipitation data were used to calculate the SPI values for the major crop-growing areas of China. The analyses of drought based on weather station data showed that the driest periods in the past 60 years were at the end of the 1960s, the years around 1980 and the beginning of the 21st century in the Northeast and Huang–Huai–Hai areas; 1966 and 1980 for the MLRY region; and the middle of the 1950s for South China. For the Sichuan basin and Southwest China areas, after 2005, these regions suffered the most extreme drought in the past 60 years.
The validation based on station gauge rainfall data showed that the SPIs calculated using TRMM data at time scales of one, three, and six months were reliable for monitoring drought in crop-growing regions. The analyses of drought based on TMI data from 1989 to 2013 showed that the frequency of different intensity droughts presented significant spatial heterogeneity in each crop-growing region. The extreme droughts mainly occurred in the east part of the southwest region and the northeastern part of the Sichuan region, whereas the north part of the MLRY region, the southeastern part of the Huang–Huai–Hai region, and the Northeast region suffered less extreme drought than the other regions. The droughts monitored by TRMM data were almost coincident with gauged data.
Acknowledgments
This work was supported by the Natural Science Foundation of China (No. 41571427), Natural Key Project of China (No. 2016YFC0500203), Innovative group guide project (Grant No. Y2017JC33) and Open Fund of State Key Laboratory of Remote Sensing Science (Grant No. OFSLRSS201708).
Author Contributions
Lang Xia, Fen Zhao, and Kebiao Mao conceived the research. Lang Xia and Kebiao Mao wrote the manuscript. Lang Xia, Fen Zhao and Kebiao Mao edited the manuscript. Lang Xia, Fen Zhao, Kebiao Mao, Tongren Xu, Zijin Yuan, and Zhiyuan Zuo contributed to the data analyses. All the authors reviewed the manuscript.
Conflicts of Interest
The authors declare no conflicts of interest.
References
- Hyman, G.; Fujisaka, S.; Jones, P.G.; Wood, S.; De Vicente, M.C.; Dixon, J. Strategic approaches to targeting technology generation: Assessing the coincidence of poverty and drought-prone crop production. Agric. Syst. 2008, 98, 50–61. [Google Scholar] [CrossRef]
- Dai, A. Drought under global warming: A review. Wiley Interdiscip. Rev. Clim. Chang. 2011, 2, 45–65. [Google Scholar] [CrossRef]
- Dai, A. Increasing drought under global warming in observations and models. Nat. Clim. Chang. 2013, 3, 52–58. [Google Scholar] [CrossRef]
- Chen, H.; Sun, J. Changes in Drought Characteristics over China Using the Standardized Precipitation Evapotranspiration Index. J. Clim. 2015, 28, 5430–5447. [Google Scholar] [CrossRef]
- Heim, R.R., Jr. A review of twentieth-century drought indices used in the United States. Bull. Am. Meteorol. Soc. 2002, 83, 1149–1165. [Google Scholar]
- Thornthwaite, C.W. An approach toward a rational classification of climate. Geogr. Rev. 1948, 38, 55–94. [Google Scholar] [CrossRef]
- Van Bavel, C.H.M.; Verlinden, F.J. Agricultural Drought in North Carolina: Technicial Bulletin No. 122; Agriclultural Experiment Station, North Carolina State College: Raleigh, NC, USA, 1956. [Google Scholar]
- Palmer, W.C. Meteorological Drought; US Department of Commerce, Weather Bureau: Washington, DC, USA, 1965.
- McKee, T.B.; Doesken, N.J.; Kleist, J. The relationship of drought frequency and duration to time scales. In Proceedings of the Eighth Conference on Applied Climatology, Anaheim, CA, USA, 17–22 January 1993; pp. 179–184. [Google Scholar]
- Zhang, Q.; Zou, X.K.; Xiao, F.J.; Lü, H.Q.; Liu, H.B.; Zhu, C.H.; Zhu, S.Q. An Classification of Meteorological Drought; China Meteorological Press: Beijing, China, 2008; pp. 33–53. (In Chinese) [Google Scholar]
- Vicente-Serrano, S.M.; Beguería, S.; López-Moreno, J.I. A multiscalar drought index sensitive to global warming: The standardized precipitation evapotranspiration index. J. Clim. 2010, 23, 1696–1718. [Google Scholar] [CrossRef]
- Beguería, S.; Vicente-Serrano, S.M.; Reig, F.; Latorre, B. Standardized precipitation evapotranspiration index (SPEI) revisited: Parameter fitting, evapotranspiration models, tools, datasets and drought monitoring. Int. J. Climatol. 2014, 34, 3001–3023. [Google Scholar] [CrossRef]
- Sandholt, I.; Rasmussen, K.; Andersen, J. A simple interpretation of the surface temperature-vegetation index space for assessment of surface moisture status. Remote Sens. Environ. 2002, 79, 213–224. [Google Scholar] [CrossRef]
- Yao, Y.; Liang, S.; Qin, Q.; Wang, K. Monitoring Drought over the Conterminous United States Using MODIS and NCEP Reanalysis-2 Data. J. Appl. Meteorol. Climatol. 2010, 49, 1665–1680. [Google Scholar] [CrossRef]
- Quiring, S.M.; Ganesh, S. Evaluating the utility of the Vegetation Condition Index (VCI) for monitoring meteorological drought in Texas. Agric. For. Meteorol. 2010, 150, 330–339. [Google Scholar] [CrossRef]
- Zhang, A.; Jia, G. Monitoring meteorological drought in semiarid regions using multi-sensor microwave remote sensing data. Remote Sens. Environ. 2013, 134, 12–23. [Google Scholar] [CrossRef]
- Jerrod, L.; Sweeney, A.; Ceccato, P. An agricultural drought severity index using quasi-climatological anomalies of remotely sensed data. Int. J. Remote Sens. 2016, 37, 913–925. [Google Scholar]
- Tigkas, D.; Vangelis, H.; Tsakiris, G. An enhanced effective Reconnaissance drought index for the characterisation of agricultural drought. Environ. Process. 2017, 4, 1–12. [Google Scholar] [CrossRef]
- Li, Z.; Hao, Z.; Shi, X.; Déry, S.J.; Li, J.; Chen, S.; Li, Y. An agricultural drought index to incorporate the irrigation process and reservoir operations: A case study in the Tarim River Basin. Glob. Planet. Chang. 2016, 143, 10–20. [Google Scholar] [CrossRef]
- Barriopedro, D.; Gouveia, C.M.; Trigo, R.M.; Wang, L. The 2009/10 drought in China: Possible causes and impacts on vegetation. J. Hydrometeorol. 2012, 13, 1251–1267. [Google Scholar] [CrossRef]
- Song, L.; Deng, Z.; Dong, A. Hot Topics of Global Change—Drought; China Meteorological Press: Beijing, China, 2003. (In Chinese) [Google Scholar]
- Zou, X.; Zhai, P.; Zhang, Q. Variations in droughts over China: 1951–2003. Geophys. Res. Lett. 2005, 32, 4. [Google Scholar] [CrossRef]
- Zhai, J.; Su, B.; Krysanova, V.; Vetter, T.; Gao, C.; Jiang, T. Spatial variation and trends in PDSI and SPI indices and their relation to streamflow in 10 large regions of China. J. Clim. 2010, 23, 649–663. [Google Scholar] [CrossRef]
- Wang, A.; Lettenmaier, D.; Sheffield, J. Soil moisture drought in China, 1950–2006. J. Clim. 2011, 24, 3257–3271. [Google Scholar] [CrossRef]
- Lin, W.; Wen, C. Characteristics of multi-timescale variabilities of the drought over last 100 years in Southwest China. Adv. Meteorol. Sci. Technol. 2012, 2, 21–26. [Google Scholar]
- Zhang, M.; He, J.; Wang, B.; Wang, S.; Li, S.; Liu, W.; Ma, X. Extreme drought changes in Southwest China from 1960 to 2009. J. Geogr. Sci. 2013, 23, 3–16. [Google Scholar] [CrossRef]
- Yu, M.; Li, Q.; Hayes, M.J.; Svoboda, M.D.; Heim, R.R. Are droughts becoming more frequent or severe in China based on the standardized precipitation evapotranspiration index: 1951–2010. Int. J. Climatol. 2014, 34, 545–558. [Google Scholar] [CrossRef]
- Tao, H.; Fischer, T.; Zeng, Y.; Fraedrich, K. Evaluation of TRMM 3B43 precipitation data for drought monitoring in Jiangsu Province, China. Water 2016, 8, 221. [Google Scholar] [CrossRef]
- Zeng, H.; Li, L.; Li, J. The evaluation of TRMM Multisatellite Precipitation Analysis (TMPA) in drought monitoring in the Lancang River Basin. J. Geogr. Sci. 2012, 22, 273–282. [Google Scholar] [CrossRef]
- Kummerow, C.; Simpson, J.; Thiele, O.; Barnes, W.; Chang, A.T.C.; Stocker, E.; Ashcroft, P. The status of the Tropical Rainfall Measuring Mission (TRMM) after two years in orbit. J. Appl. Meteorol. 2000, 39, 1965–1982. [Google Scholar] [CrossRef]
- Wang, B.; Wu, Z.; Li, J.; Liu, J.; Chang, C.P.; Ding, Y.; Wu, G. How to measure the strength of the East Asian summer monsoon. J. Clim. 2008, 21, 4449–4463. [Google Scholar] [CrossRef]
- Nicholson, S.E.; Some, B.; McCollum, J.; Nelkin, E.; Klotter, D.; Berte, Y.; Noukpozounkou, J.N. Validation of TRMM and other rainfall estimates with a high-density gauge dataset for West Africa, Part II: Validation of TRMM rainfall products. J. Appl. Meteorol. 2003, 42, 1355–1368. [Google Scholar] [CrossRef]
- De Jesús, A.; Breña-Naranjo, J.A.; Pedrozo-Acuña, A.; Alcocer Yamanaka, V.H. The use of TRMM 3B42 product for drought monitoring in Mexico. Water 2016, 8, 325. [Google Scholar] [CrossRef]
- Cressie, N. The origins of kriging. Math. Geol. 1990, 22, 239–252. [Google Scholar] [CrossRef]
- Smith, T.M.; Arkin, P.A.; Bates, J.J.; Huffman, G.J. Estimating Bias of Satellite-Based Precipitation Estimates. J. Hydrometeorol. 2006, 7, 841–856. [Google Scholar] [CrossRef]
- Chen, F.; Li, X. Evaluation of IMERG and TRMM 3B43 monthly precipitation products over mainland China. Remote Sens. 2016, 8, 472. [Google Scholar] [CrossRef]
Figure 1.
Study areas and meteorological station locations.

Figure 2.
The SPI values for 1951–2013 for (a) Northeast China and (b) Huang–Huai–Hai.

Figure 3.
The SPI values for 1951–2013 for (a) MLRY and (b) South areas.
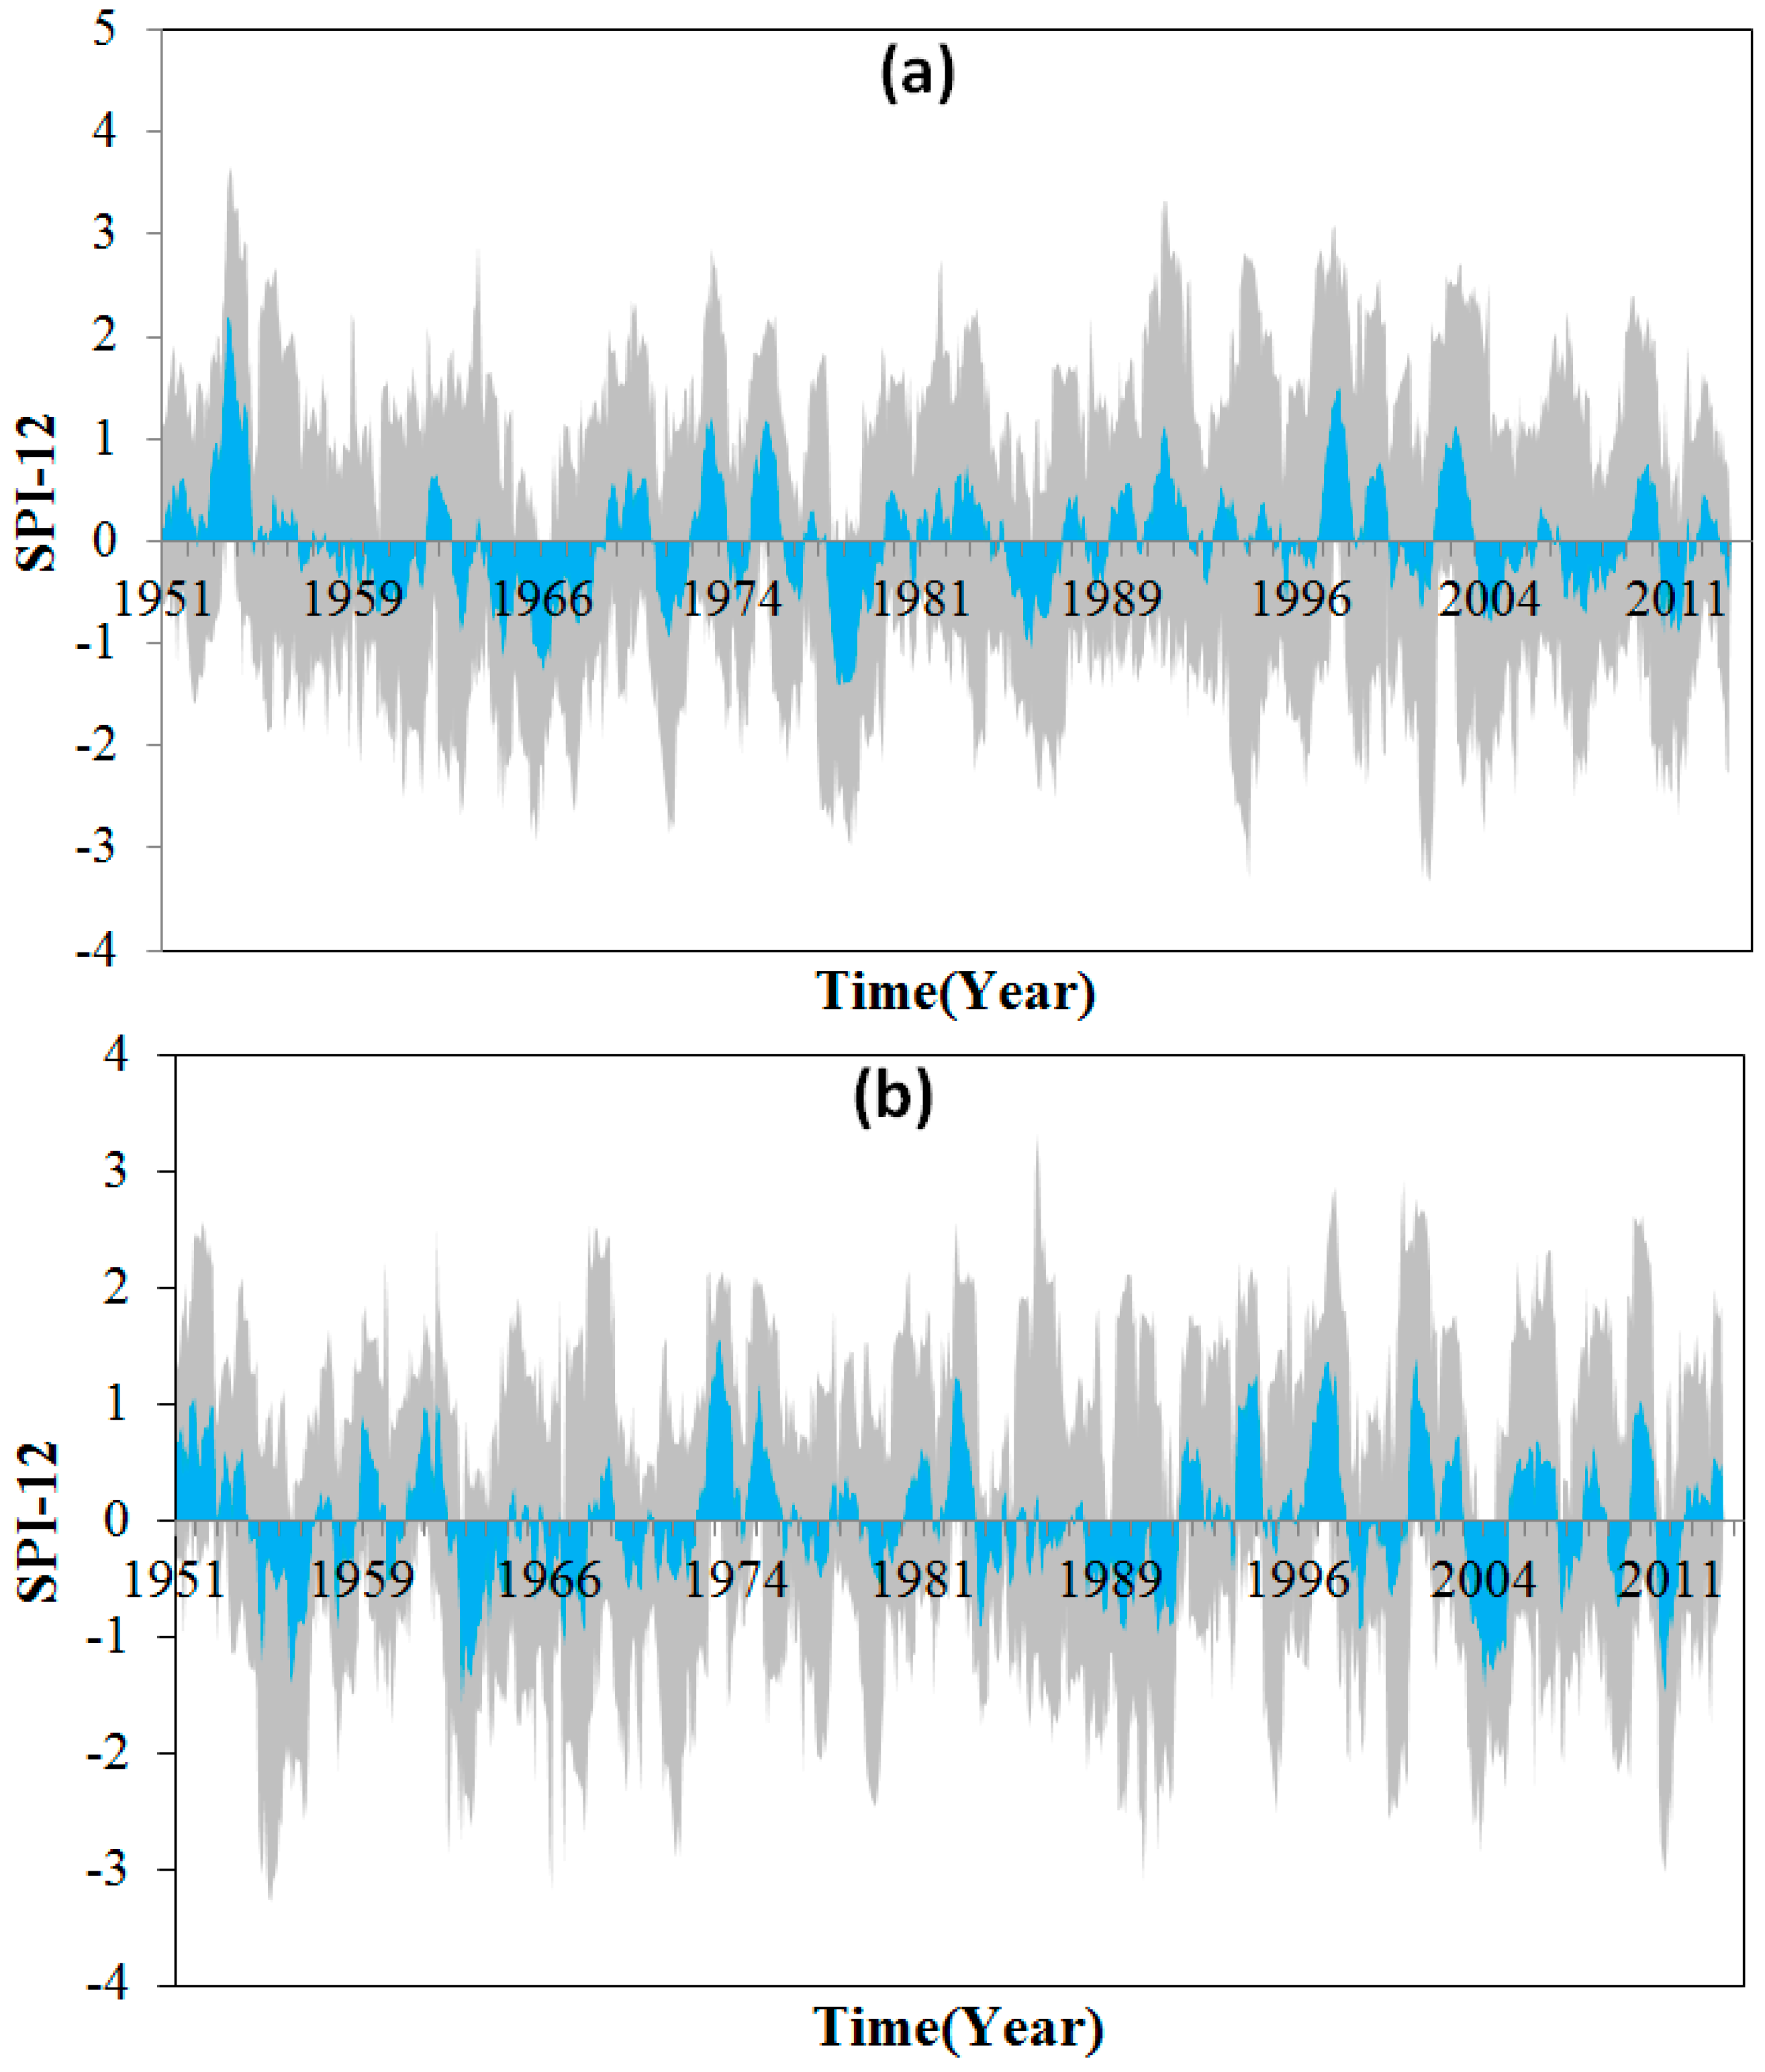
Figure 4.
The SPI values for 1951–2013 for (a) Sichuan basin and (b) Southwest China.
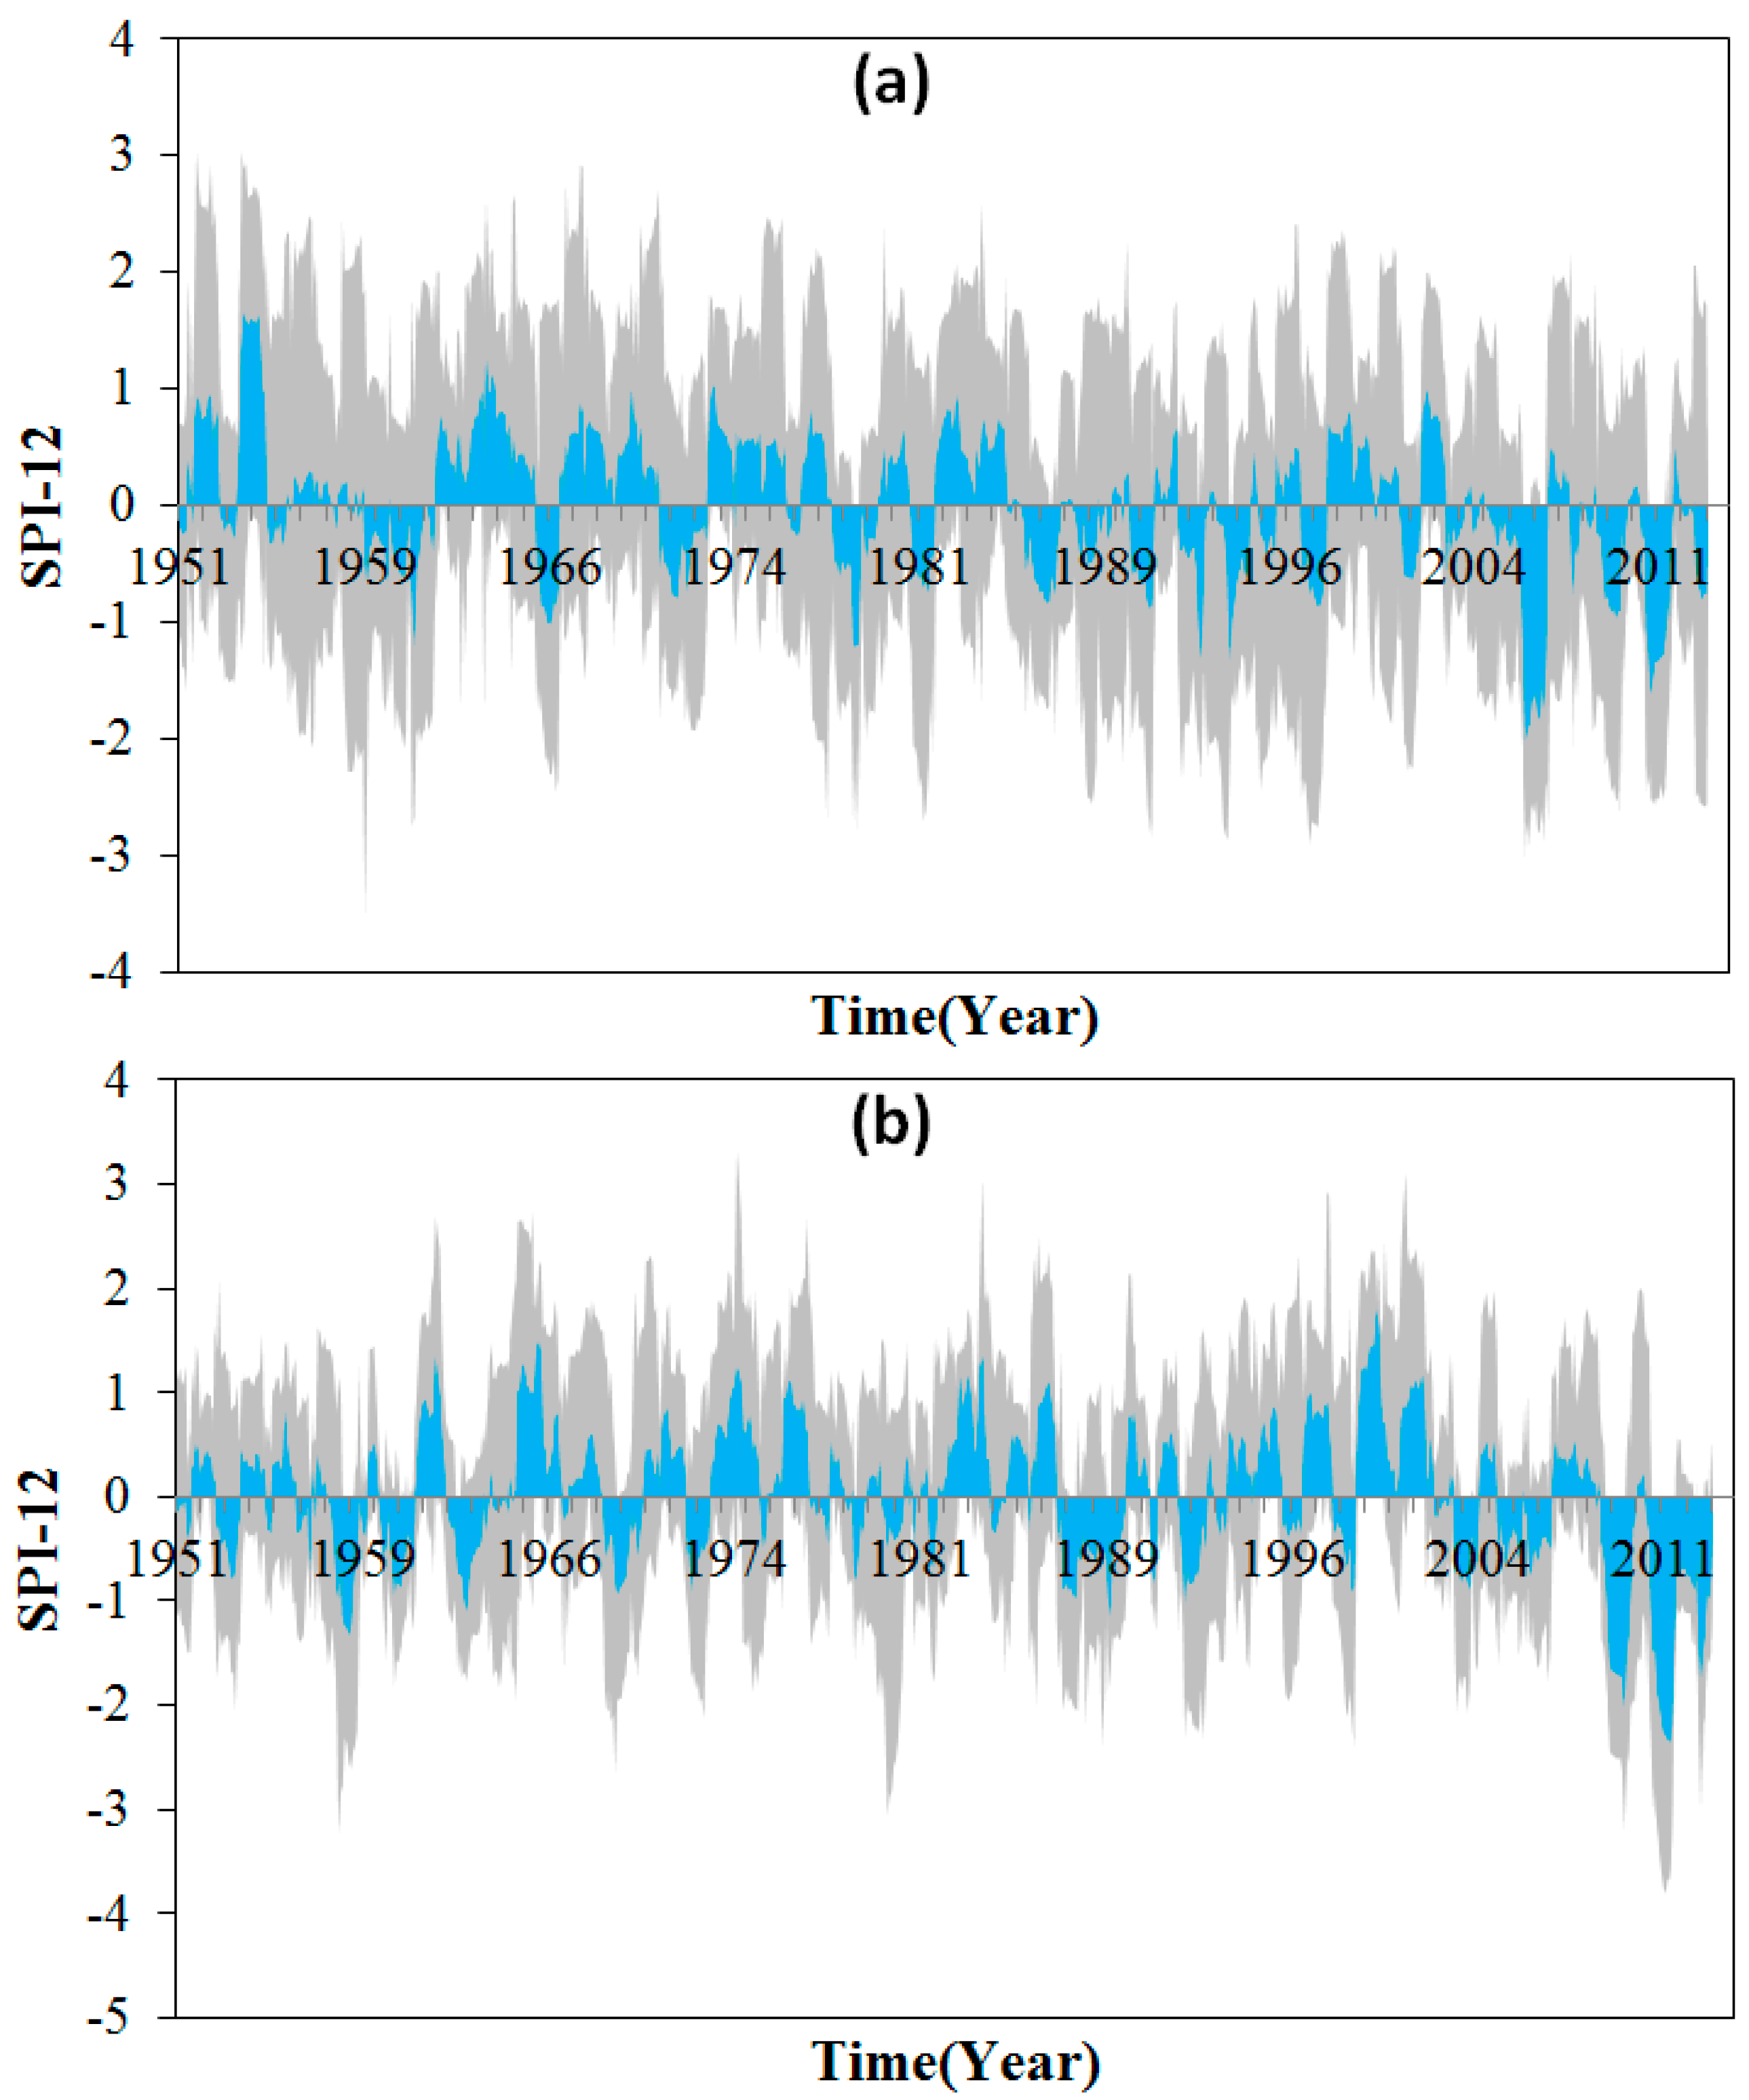
Figure 5.
Frequencies of moderate droughts, severe droughts and extreme droughts for different regions from 1998 to 2013.
Figure 5.
Frequencies of moderate droughts, severe droughts and extreme droughts for different regions from 1998 to 2013.
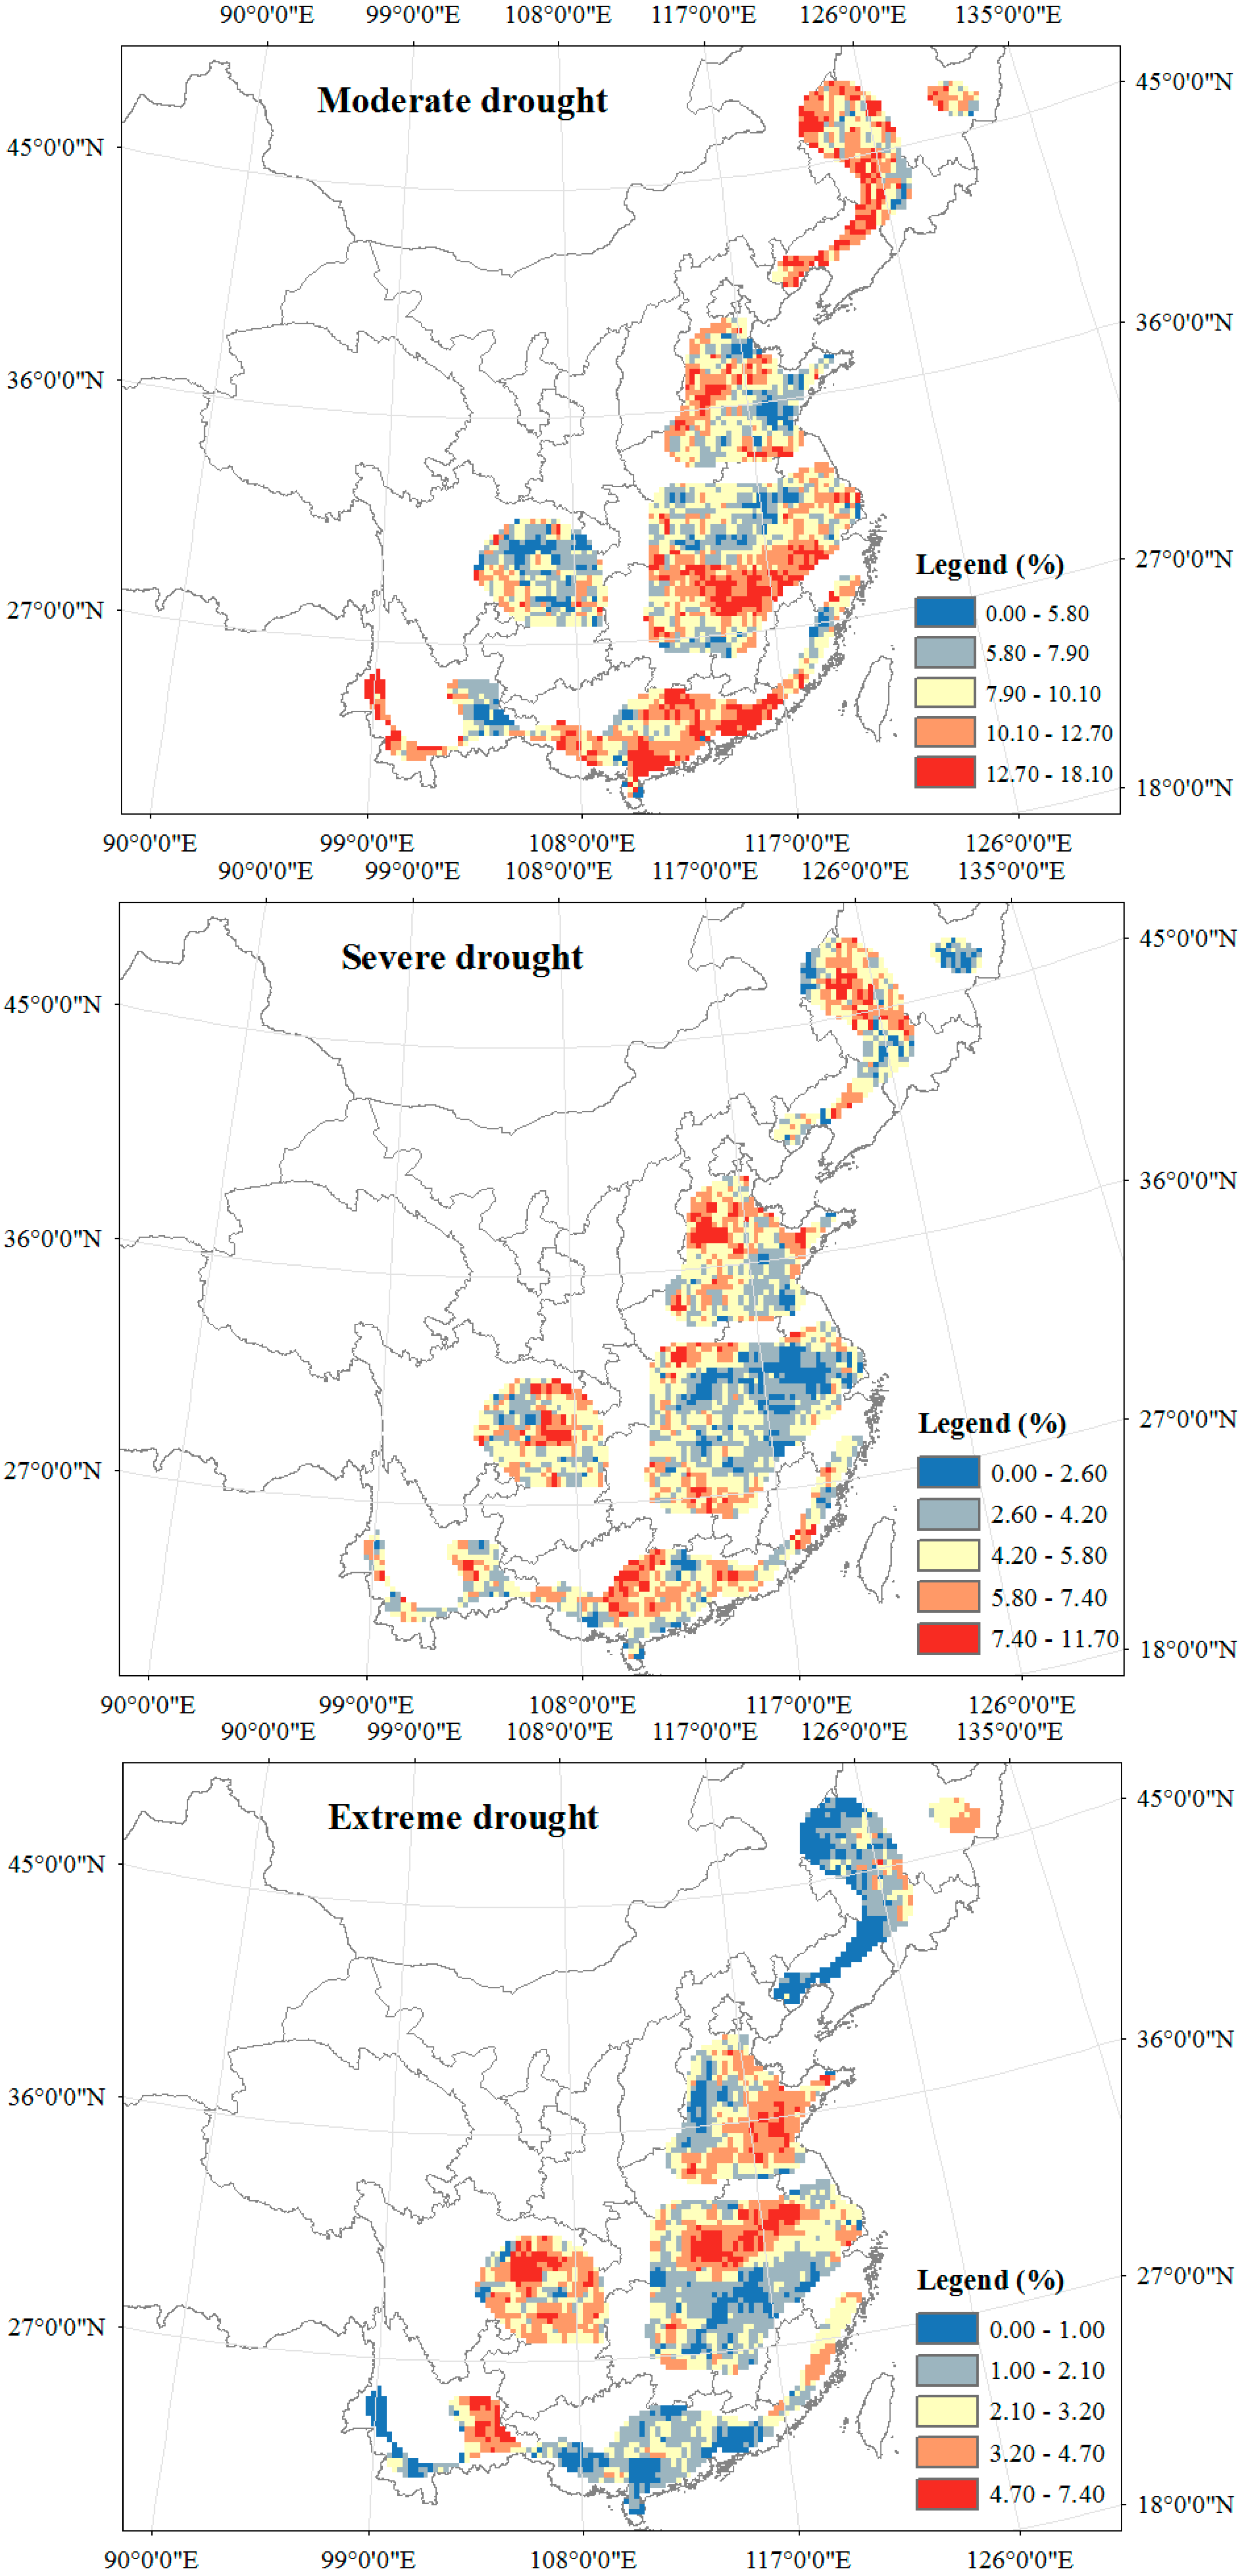
Figure 6.
TRMM 3B43 for drought monitoring (SPI at time scale of six months) for different regions: (a) Northeast; (b) Huang–Huai–Hai; (c) MLRY; (d) South; (e) Sichuan basin; and (f) Southwest.
Figure 6.
TRMM 3B43 for drought monitoring (SPI at time scale of six months) for different regions: (a) Northeast; (b) Huang–Huai–Hai; (c) MLRY; (d) South; (e) Sichuan basin; and (f) Southwest.
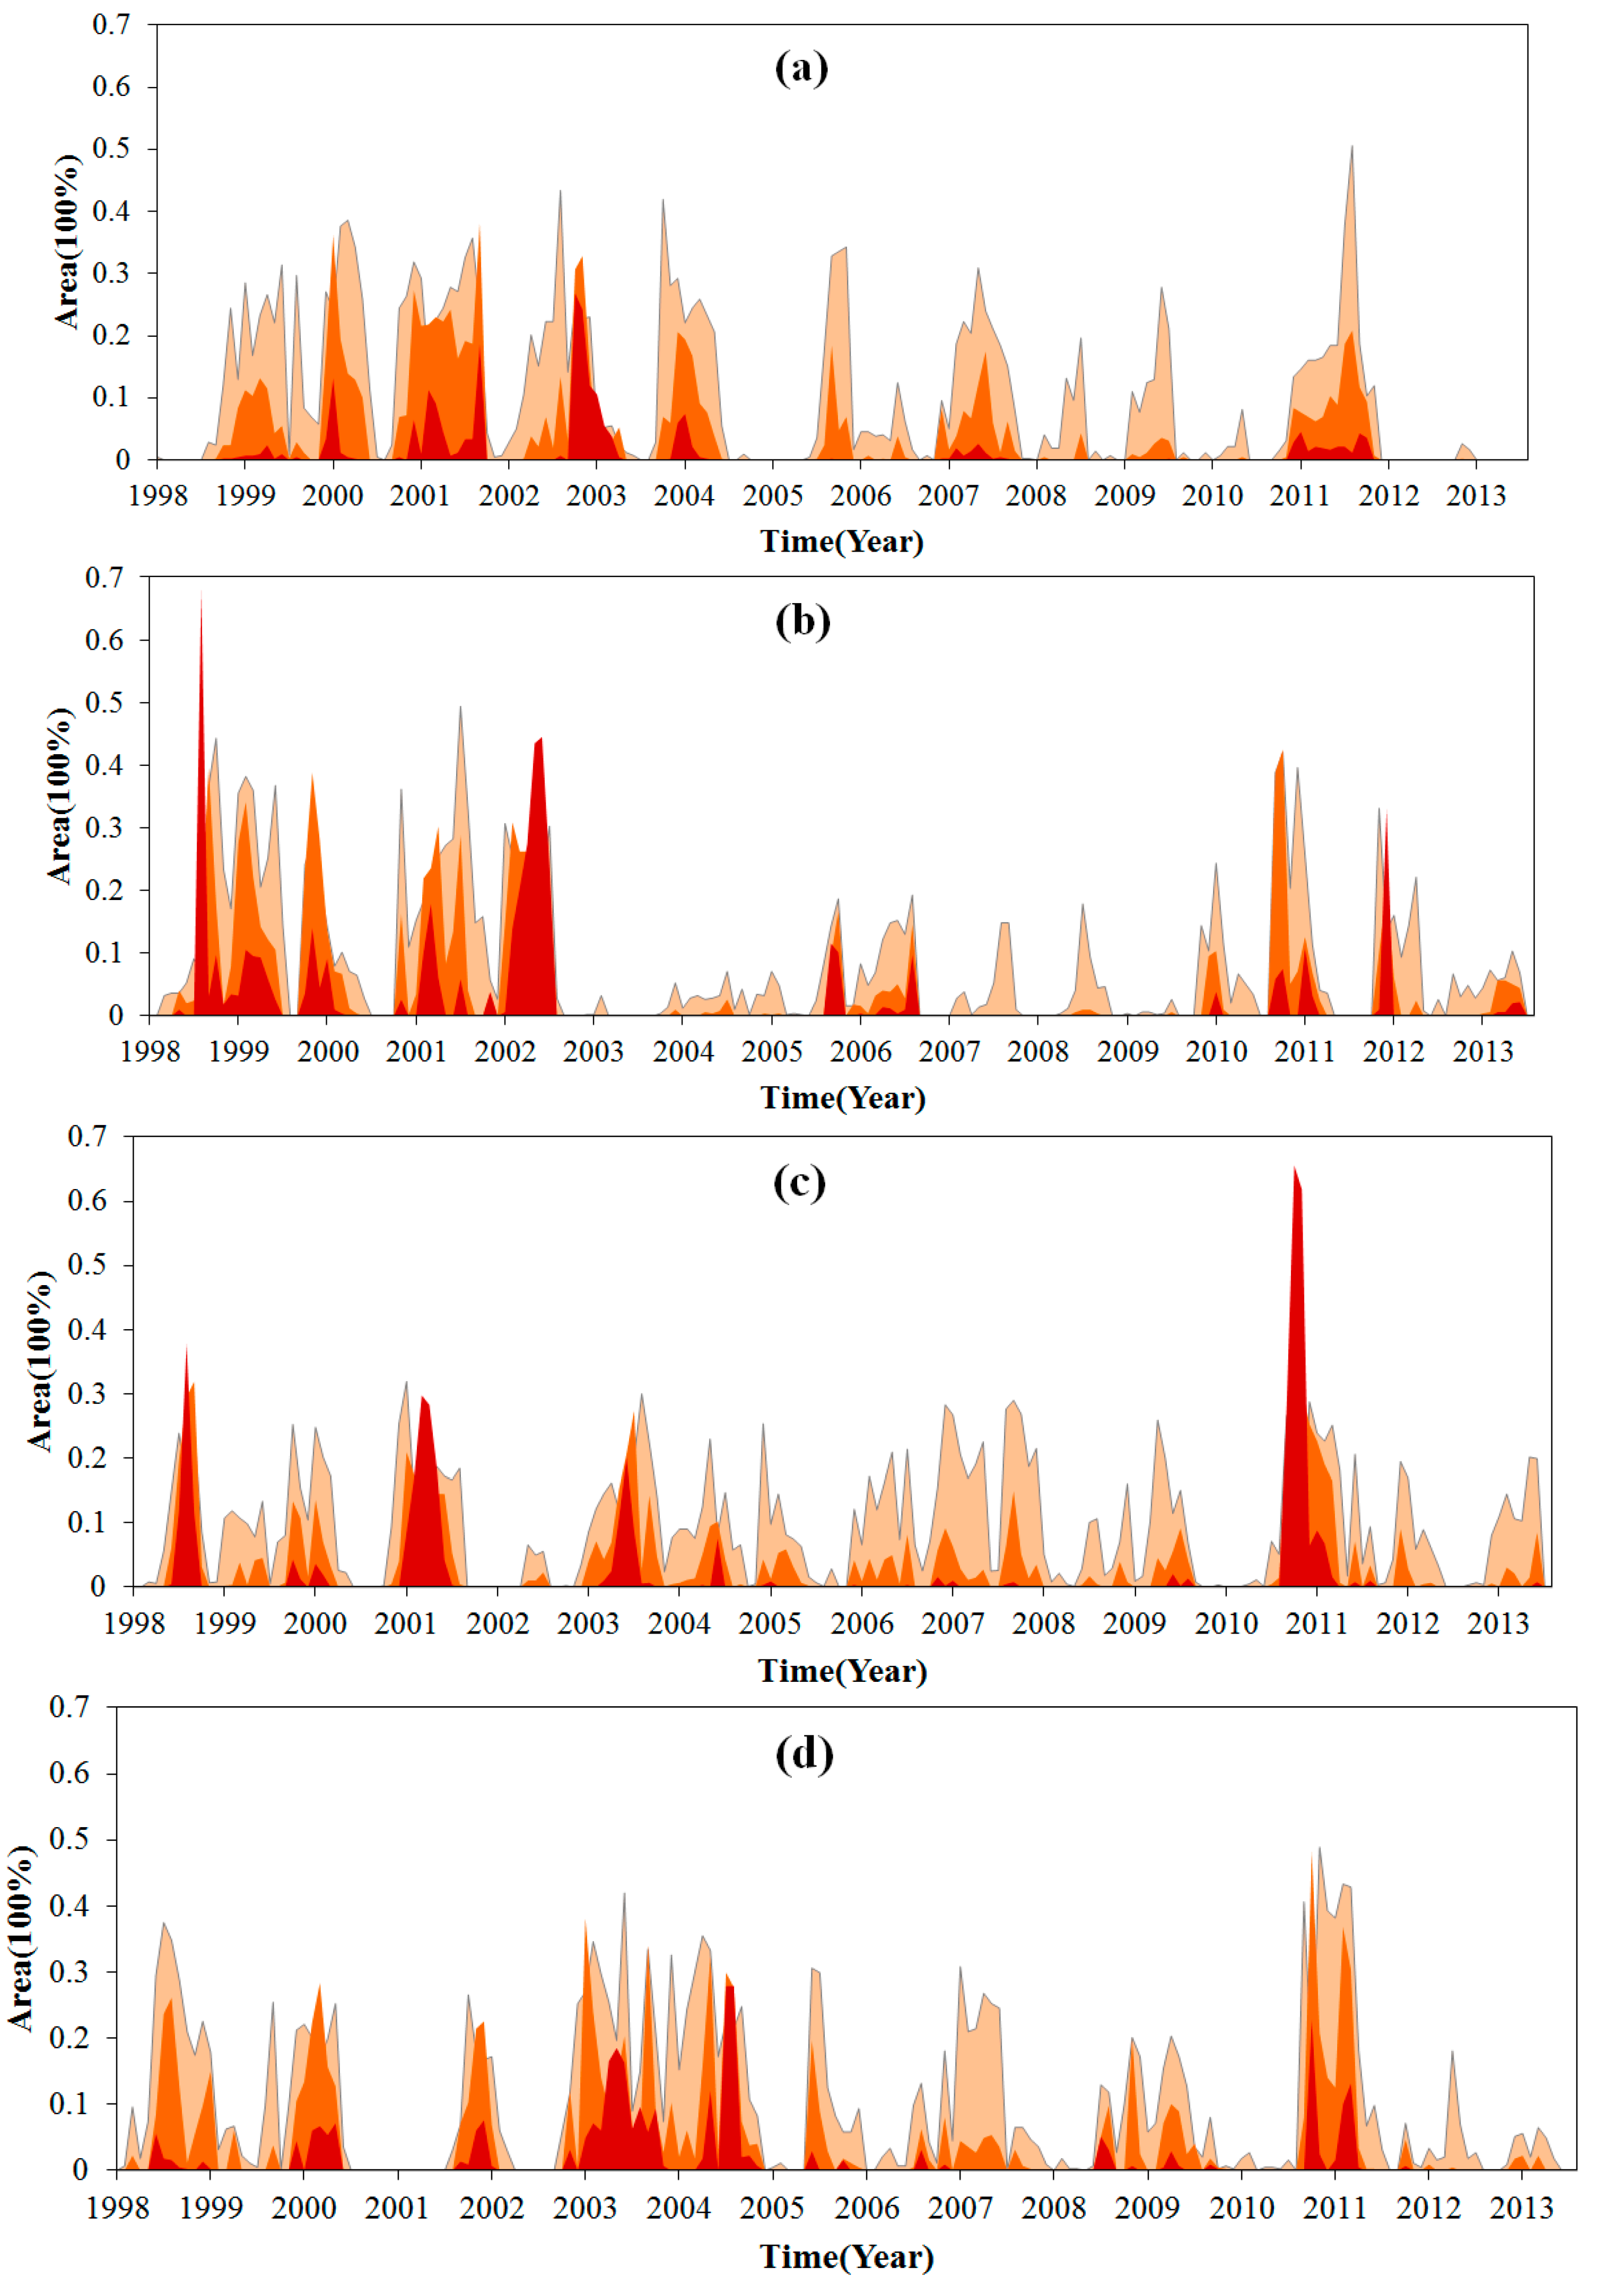

Figure 7.
Coefficient of determination R2 between two datasets for difference regions: (a) Northeast; (b) Huang–Huai–Hai; (c) MLRY; (d) South; (e) Sichuan basin; (f) Southwest.
Figure 7.
Coefficient of determination R2 between two datasets for difference regions: (a) Northeast; (b) Huang–Huai–Hai; (c) MLRY; (d) South; (e) Sichuan basin; (f) Southwest.

Figure 8.
Gauge data for drought monitoring (SPI at time scale of 6 month) for difference regions: (a) Northeast, (b) Huang–Huai–Hai, (c) MLRY, (d) South, (e) Sichuan basin and (f) Southwest.
Figure 8.
Gauge data for drought monitoring (SPI at time scale of 6 month) for difference regions: (a) Northeast, (b) Huang–Huai–Hai, (c) MLRY, (d) South, (e) Sichuan basin and (f) Southwest.


Table 1.
Information on the study areas.
| Crop-Growing Area | Rainy Season | Annual Average Precipitation (mm) | Major Crops |
|---|---|---|---|
| Northeast China | July–September | 500–750 | Wheat, Corn, Rice |
| Huang–Huai–Hai | July–September | 400–800 | Wheat, Corn, Rice |
| MLRY | May–August | 1000–1600 | Rice, Wheat |
| South China | March–September | 1500–2000 | Rice, Corn |
| Sichuan | April–August | 900–1200 | Rice, Wheat |
| Southwest China | May–October | 1000–2000 | Rice, Wheat |
Table 2.
Drought intensities according to SPI values.
| SPI Value | Drought Level |
|---|---|
| Extreme wet | |
| Very wet | |
| Moderate wet | |
| Normal | |
| Moderate drought | |
| Severe drought | |
| Extreme drought |
© 2018 by the authors. Licensee MDPI, Basel, Switzerland. This article is an open access article distributed under the terms and conditions of the Creative Commons Attribution (CC BY) license (http://creativecommons.org/licenses/by/4.0/).
Share and Cite
MDPI and ACS Style
Xia, L.; Zhao, F.; Mao, K.; Yuan, Z.; Zuo, Z.; Xu, T. SPI-Based Analyses of Drought Changes over the Past 60 Years in China’s Major Crop-Growing Areas. Remote Sens. 2018, 10, 171. https://doi.org/10.3390/rs10020171
AMA Style
Xia L, Zhao F, Mao K, Yuan Z, Zuo Z, Xu T. SPI-Based Analyses of Drought Changes over the Past 60 Years in China’s Major Crop-Growing Areas. Remote Sensing. 2018; 10(2):171. https://doi.org/10.3390/rs10020171
Chicago/Turabian StyleXia, Lang, Fen Zhao, Kebiao Mao, Zijin Yuan, Zhiyuan Zuo, and Tongren Xu. 2018. "SPI-Based Analyses of Drought Changes over the Past 60 Years in China’s Major Crop-Growing Areas" Remote Sensing 10, no. 2: 171. https://doi.org/10.3390/rs10020171
Note that from the first issue of 2016, this journal uses article numbers instead of page numbers. See further details here.