Stability Monitoring of the VIIRS Day/Night Band over Dome C with a Lunar Irradiance Model and BRDF Correction

1
Key Laboratory of Quantitative Remote Sensing Information Technology, Academy of Opto-Electronics, Chinese Academy of Sciences, Beijing 100094, China
2
University of Chinese Academy of Sciences, Beijing 100049, China
3
Department of Astronomy, University of Maryland, College Park, MD 20742, USA
*
Author to whom correspondence should be addressed.
Remote Sens. 2018, 10(2), 189; https://doi.org/10.3390/rs10020189
Submission received: 21 November 2017
/
Revised: 10 January 2018
/
Accepted: 22 January 2018
/
Published: 27 January 2018
Abstract
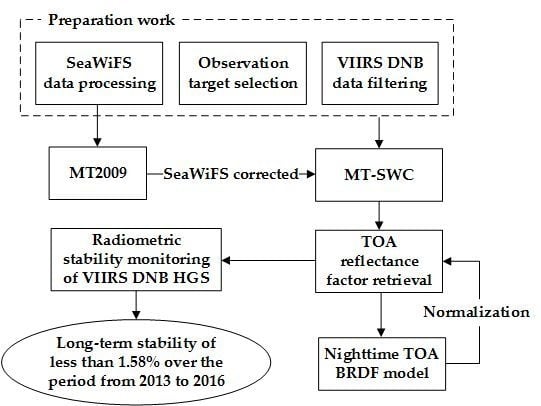
:The unique feature of the Visible Infrared Imager Radiometer Suite (VIIRS) day/night band (DNB) is its ability to take quantitative measurements of low-light scenes at night. In order to monitor the stability of the high gain stage (HGS) of the DNB, nighttime observations over the Dome C site under moonlight are analyzed in this study. The Miller and Turner 2009 (MT2009) lunar irradiance model has been used to simulate lunar illumination over Dome C. However, the MT2009 model does not differentiate the waxing and waning lunar phases. In this paper, the MT-SWC (SeaWiFS Corrected) lunar irradiance model differentiating the waxing and waning lunar phases is derived by correcting the MT2009 model using lunar observations made by the Sea-Viewing Wide Field-of-View Sensor (SeaWiFS). In addition, a top of atmosphere (TOA) bi-directional reflectance distribution function (BRDF) model during nighttime over Dome C is developed to remove the angular dependence from the nighttime TOA reflectance. The long-term stability monitoring of the DNB high-gain stage (HGS) reveals a lower reflectance factor in 2012 in comparison to the following years, which can be traced back to the change in relative spectral response (RSR) of National Oceanic & Atmospheric Administration’s (NOAA’s) Interface Data Processing Segment (IDPS) VIIRS DNB in April 2013. It also shows the radiometric stability of DNB data, with long-term stability of less than 1.58% over the periods from 2013 to 2016. This method can be used to monitor the radiometric stability of other low-light observing sensors using vicarious calibration sites under moonlight illumination.
1. Introduction
The Visible Infrared Imager Radiometer Suite (VIIRS) onboard the Suomi National Polar-Orbiting Partnership (Suomi-NPP) spacecraft was successfully launched on 28 October 2011 [1]. It is a scanning radiometer providing measurements of land, atmosphere, cryosphere, and oceans over visible and infrared spectral regions. The VIIRS has 22 imaging and radiometric bands, including 14 reflective solar bands (RSB), seven thermal emissive bands, and one day/night band (DNB).
A unique feature of the VIIRS DNB sensor is its ability to provide quantitative measurements of low-light scenes over a sun-synchronous orbit 824 km above the earth. It is the first fully-calibrated nighttime low-light panchromatic channel covering wavelengths from 500 to 900 nm. It introduces a unique frontier of nighttime environmental sensing capabilities [2] and has also been applied in various socio-economic studies [3,4,5,6]. The primary mission of DNB is to provide sensor data records (SDR) of clouds and other Earth features over illumination levels ranging from full sunlight to quarter moon [7,8]. This wide dynamic range of radiance measurements made by DNB is possible through three gain stages: low-gain (LGS), mid-gain (MGS), and high-gain (HGS). The calibration of DNB requires accurate knowledge of dark offsets and gain factors for each DNB stage. The dark offsets are determined using the Earth view [9]. The DNB LGS gain is determined by solar diffuser calibration (also known as the onboard calibration). Since the radiance range covered by the three gain stages has sufficient overlap, the cross-stage ratio of the MGS/LGS and the HGS/MGS can be determined by using the Earth view data in the day–night terminator region with overlapping radiance between the stages. Thus, the MGS values are determined by multiplying the LGS gains with the MGS/LGS and the HGS values are obtained by multiplying the MGS gains with the HGS/MGS gain ratios [9,10].
The radiometric stability of DNB using moonlight or nightlight point sources has been studied by Liao et al. [11], Cao et al. [12], Shao et al. [13], and Qiu et al. [14]. Liao et al. [11] used Railroad Valley Playa under lunar illumination as the vicarious calibration site to evaluate the radiometric accuracy of the DNB. The results from Liao et al. show that the radiometric calibration uncertainty in HGS is about 15%. Cao et al. [12] have assessed the stability of the calibration of the VIIRS DNB during the nighttime using active nightlights from city streets, bridges, airports, or ships and proposed the monitoring of the stability of the VIIRS DNB calibration using properly designed light source. Shao et al. [13] and Qiu et al. [14] demonstrated the feasibility of vicarious calibration using nighttime observations over Dome C under moonlight, however, only the observations under nadir view in 2012 and 2013 are used and the bi-directional reflectance distribution function (BRDF) effect is not taken into account. Since the quality of DNB imagery may be affected by stray light contamination, the characterization of stray light has been studied and applied to stray light correction [10,15]. Qiu et al. [16,17] assessed the stray light correction method using observations over Dome C under lunar illumination from DNB data processed by the Interface Data Processing Segment (IDPS) and National Aeronautics and Space Administration’s (NASA’s) Land Product Evaluation and Algorithm Test Element (Land PEATE).
The nighttime top of atmosphere (TOA) reflectance over Dome C can be retrieved using DNB observations under lunar illumination. Two lunar irradiance models have been developed: (1) the robotic lunar observatory (ROLO) lunar irradiance model [18] and (2) the Miller and Turner 2009 (MT2009) model. The ROLO model has been applied to support operational lunar calibration using the Sea-Viewing Wide Field-of-View Sensor (SeaWiFS), Moderate Resolution Imaging Spectroradiometer (MODIS), and the Visible Infrared Imager Radiometer Suite (VIIRS) [19,20,21,22]. The MT2009 model was developed to improve the quantitative algorithm for general cloud detection and reflectance retrieval at night. We use the MT2009 model since it is publicly available. The MT2009 lunar irradiance model is based on the state-of-the-art solar source observations [23] and lunar spectral albedo data [24]. The model accounts for the time-varying Sun/Earth/Moon geometry and lunar phase and produces 1-nm resolution irradiance spectra over an interval of 0.2–2.8 μm on a specific date and time [25]. However, the MT2009 model is not as accurate as ROLO due to the compromises that have been made, including the ignoring of the opposition effect, the libration, and the difference between waxing and waning lunar phases. Therefore, the SeaWiFS lunar observations are used to correct the MT2009 model to distinguish the waxing and waning lunar phases.
To evaluate the stability of DNB HGS, the Dome C site was selected as the ground target for its clear skies and radiometric stability in this study. Cao C et al. [26] demonstrated Dome C as a community reference standard site for consistent calibration of VNIR radiometers. Since the BRDF effect at the Dome C site is very strong, the model characterizing the angular (illuminating and viewing angle) dependence over Dome C has been developed [27,28]. Under solar illumination, the anisotropic reflectance factor model at the Dome C site has been used by polar orbiting satellite sensors including Terra and Aqua MODIS, NOAA-15, -16, -17, -18, and Meteorological Operational satellite A (Metop-A), Advanced Very High Resolution Radiometer (AVHRR), and Environmental Satellite (ENVSAT) Advanced Along Track Scanning Radiometer (AATSR) to evaluate their calibration stability and consistency [29,30].
In this paper, we extend the same algorithm to the nighttime scene over Dome C under lunar illumination from 2012 to 2016. It is shown that the reflectance derived from the VIIRS DNB HGS is approximately 5.5% higher than the measurement made by other sensors [13,14] and has a strong lunar phase dependence. Through lunar observations made by SeaWiFS, the MT2009 lunar irradiance model is corrected and applied to the nighttime reflectance retrieval. The corrected reflectance factor is lunar phase-independent and the nighttime TOA BRDF model at the Dome C site is evaluated using the corrected results. Furthermore, the angular dependence is removed from corrected nighttime reflectance factor, and the long-term radiometric stability of VIIRS DNB HGS is evaluated.
The first section of this paper gave a brief introduction of the study as a whole. The second section introduces the details of processing method, including the on-orbit radiometric performance of the VIIRS DNB, Dome C and its BRDF effect, the criteria of selection of observations, the MT2009 lunar irradiance model and its correction using lunar observations made by SeaWiFS, and reflectance retrieval using the VIIRS nighttime DNB. The third section shows the results, including analysis of the reflectance derived by VIIRS nighttime DNB, the correction of the MT2009 lunar irradiance model using lunar observations made by SeaWiFS, the BRDF effect upon corrected reflectance factor, and the radiometric stability of the VIIRS DNB HGS. The fourth section discusses the results and the limitations of the method. The fifth section gives the conclusions of this paper.
2. Methodology
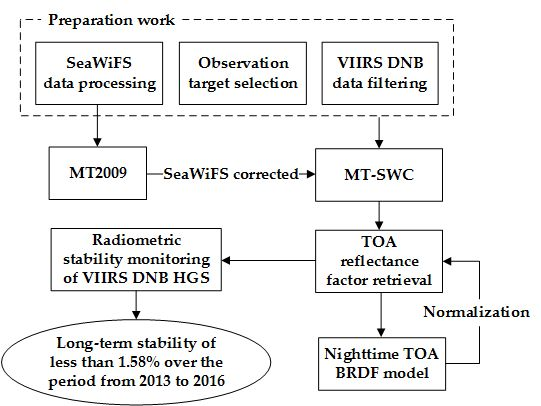
In this study, the Dome C site is selected as the observation target to evaluate the radiometric stability of DNB HGS. The overall procedures of analysis are: selection of observations, retrieval of nighttime reflectance, correction of the MT2009 lunar irradiance model using SeaWiFS lunar observations, characterization of the BRDF effect of Dome C and its removal, and the analysis of radiometric stability of the DNB. The details of the analysis method are described below.
2.1. VIIRS DNB
The VIIRS DNB is capable of sensing over seven orders of magnitude in dynamic range by using four imaging arrays that comprise of three gain stages: LGS, MGS, and HGS. The array has much higher resolution than the requirement of 750 m, enabling a nearly constant ground resolution of 750 m through an on-chip aggregation process that varies over the scan swath. The LGS is used to observe daytime scenes and has a neutral density filter to prevent saturation in full daylight. The MGS is used to observe dawn or dusk scenes near the Earth’s day-night terminator and requires time delay integration (TDI) to increase signal strength. The HGS is used to observe nighttime scenes under lunar illumination or late twilight and also requires TDI to increase signal strength. We only focus on the radiometric stability monitoring of the DNB HGS in this study.
The radiometric parameter of DNB is shown in Table 1 [10]. Due to the saturation of the HGS, it is hard to directly use the solar diffusor (SD) for radiance calibration. However, the HGS calibration is achieved by transferring from the LGS, using on-orbit calibration, to the MGS, and then to the HGS. This process, however, may introduce some uncertainties to the HGS calibration.
In this paper, the VIIRS DNB data are processed in the IDPS and stored in the NOAA Comprehensive Large Array-data Stewardship System (CLASS) satellite data archive (http://www.class.ncdc.noaa.gov) [31].
2.2. Dome C Site
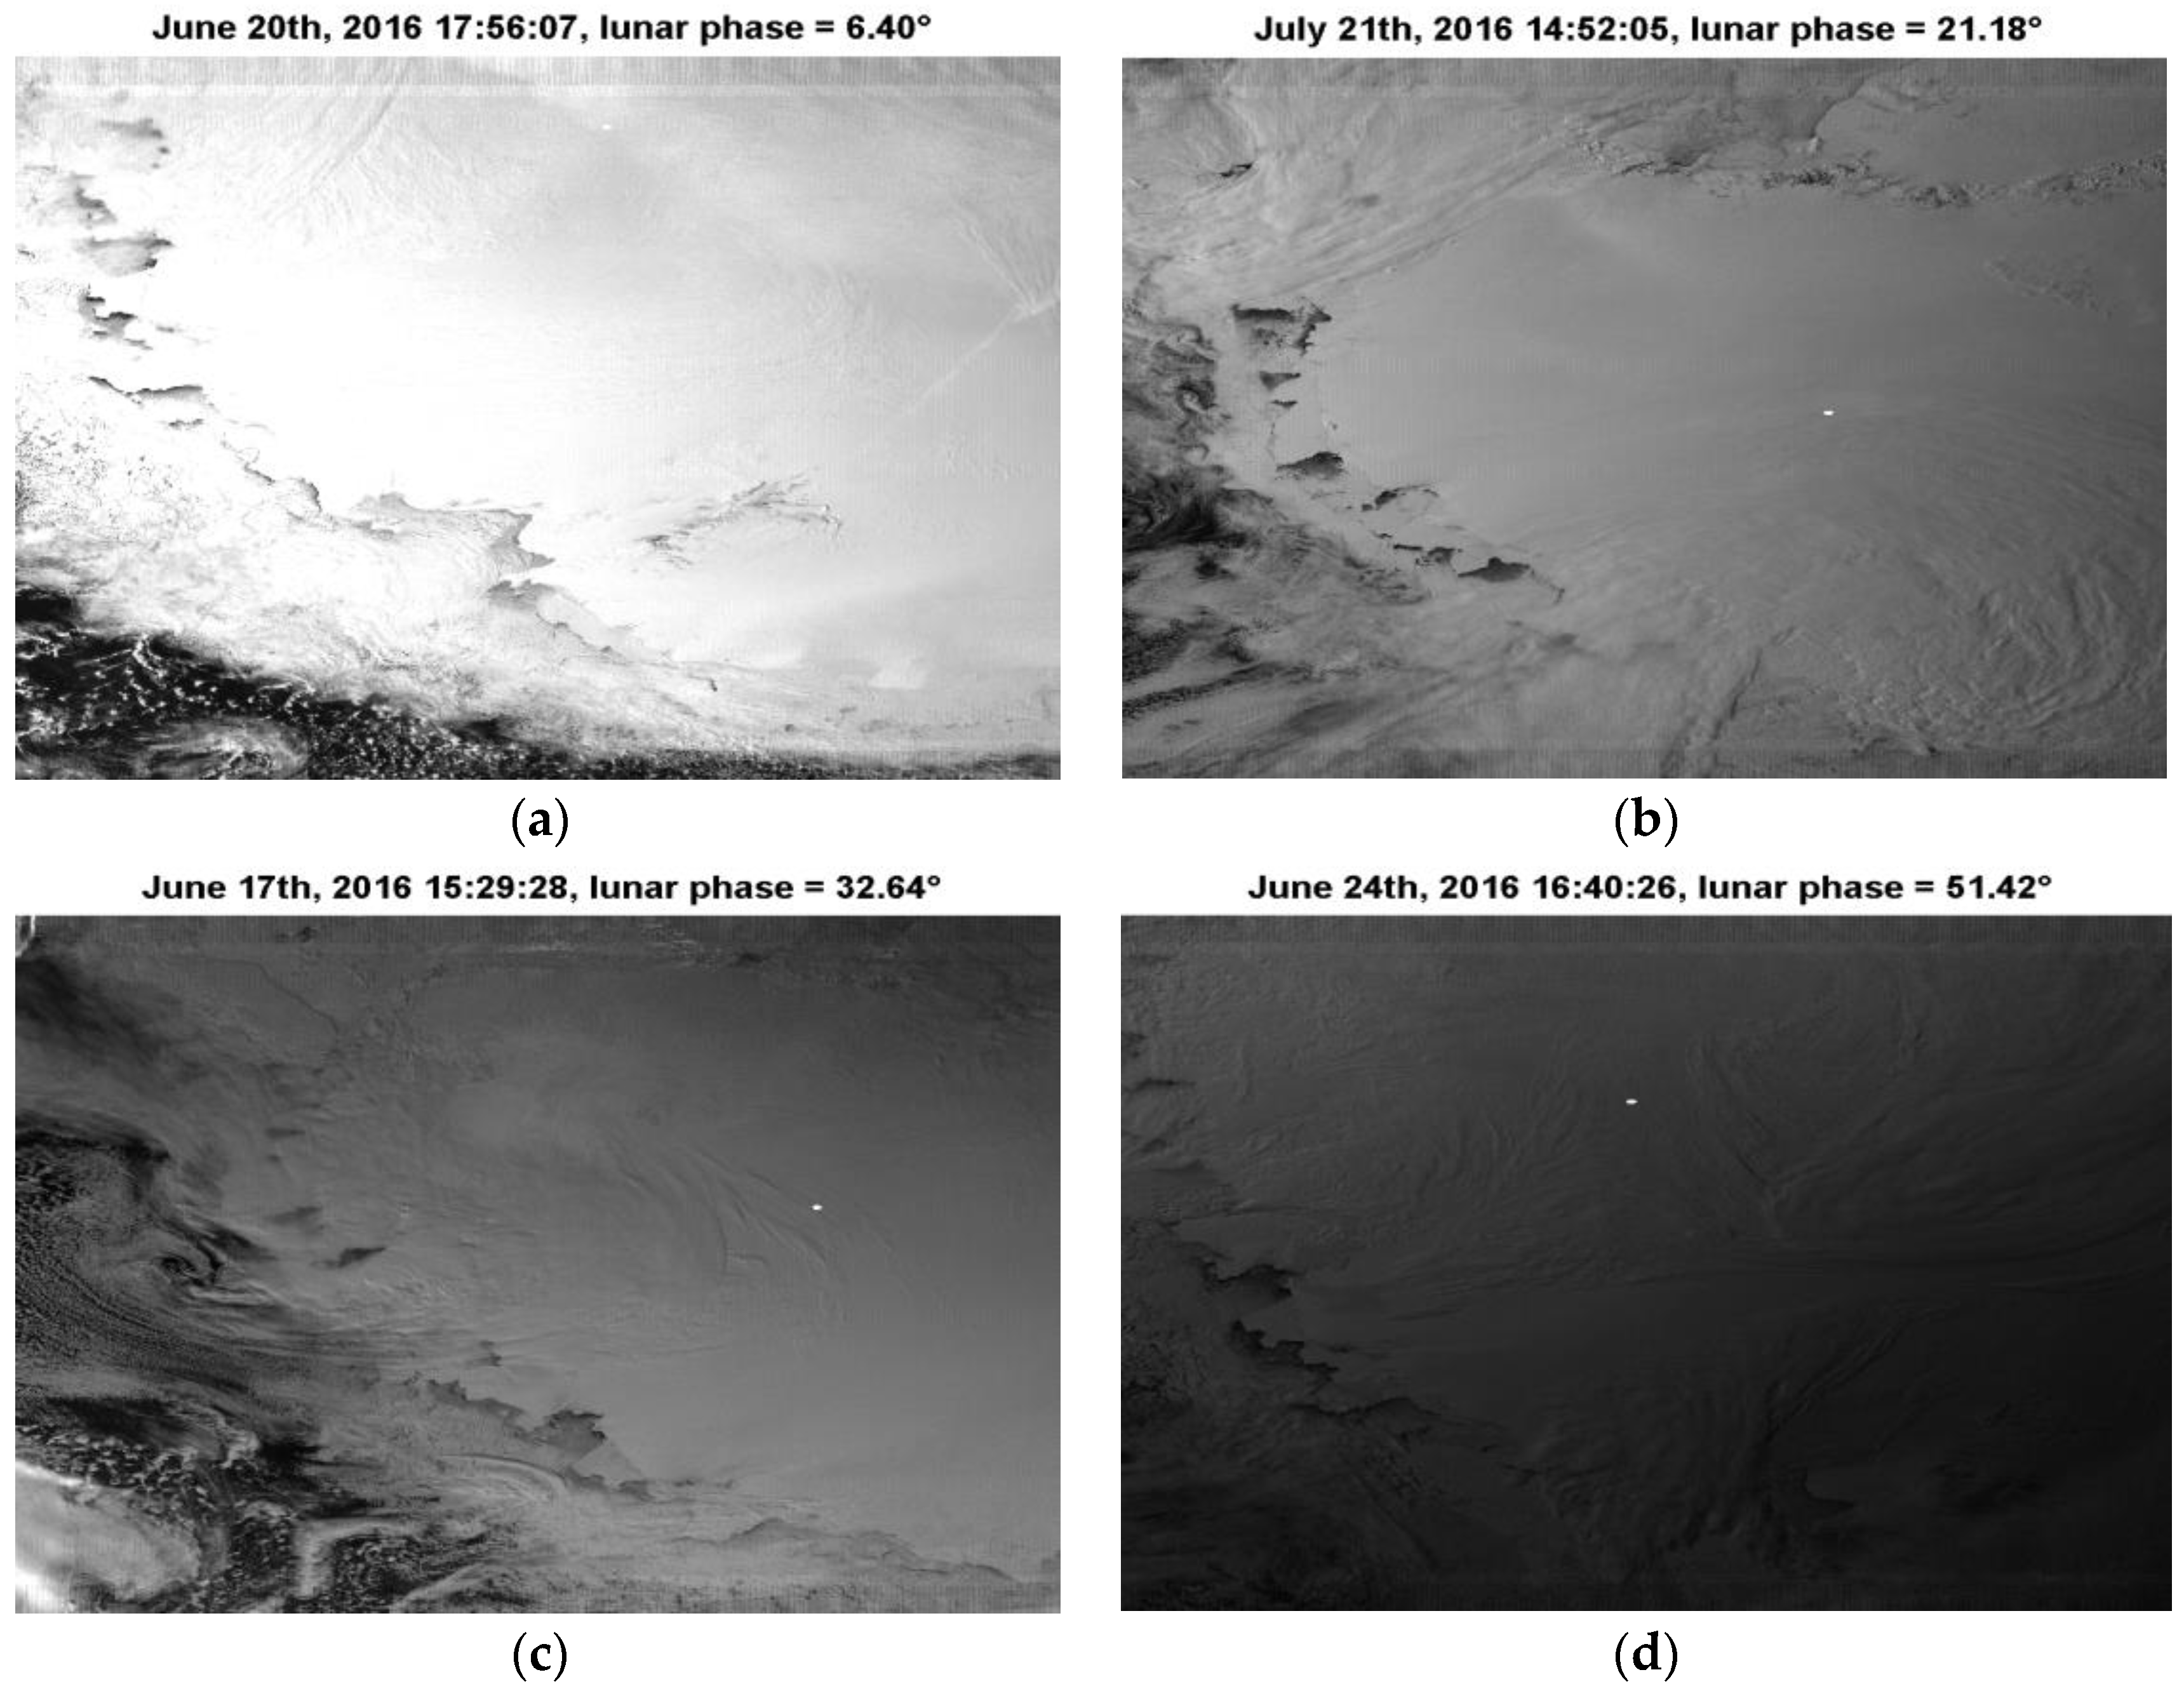
The site of interest is Antarctic Dome C. It is located at −75.1 degrees latitude and 123.35 degrees longitude in the Southern Hemisphere with a mean elevation of 3.2 km above sea level. The site surface is covered with uniformly-distributed permanent snow, the atmospheric absorption is low, and skies are generally clear, with more than 75% of days each year being cloud-free [26,32,33]. Due to these advantages, Dome C is one of the Committee on Earth Observation Satellites (CEOS)-endorsed vicarious calibration sites. On the other hand, the Dome C site shows significant BRDF effect at high solar/lunar zenith angles [26,29,32]. In this study, a circular area with a 10-km radius centered at 75.1°S, 123.35°E is selected as the region of interest (ROI) and the average radiance over the ROI is calculated to characterize the measurement of Dome C made by VIIRS DNB. Figure 1 shows the image of Dome C under moonlight at different lunar phases, where white points show the ROI of the Dome C site. The lunar phase is defined by the Sun–Moon–Earth angle. The negative lunar phase angle indicates the waxing phase, while the positive lunar phase angle indicates the waning phase. When the absolute value of lunar phase angle decreases, the more illuminated lunar surface will be seen. When lunar phase is close to zero degrees, i.e., near the full moon, the whole lunar surface can be seen. The Dome C site appears much brighter when the lunar phase is close to the full moon due to the opposition effect.
2.3. Selection of Observations
The following criteria is used to select the VIIRS DNB observation data:
- The absolute value of lunar phase angle is required to be lower than 90 degrees (half-moon) to ensure sufficient lunar illumination over Dome C.
- Spatial uniformity (ratio of one standard deviation to the mean reflectance calculated over the ROI) with a threshold value of 5% is applied to the entire dataset to exclude clouds. Since clouds are typically non-uniform, while Dome C is spatially uniform, large spatial variations are typical indicators of clouds. The 5% threshold is chosen to guarantee a sufficient number of cases for the analysis [29].
- The lunar zenith angle is required to be less than 80 degrees since the anisotropic reflectance factor model with a high lunar zenith angle is less accurate.
With all of the restrictions applied, approximately 12 days are selected each month from May to August each year. There is a total of 607 selected cases from 2012 to 2017. Figure 2a shows the zenith and azimuth angular distribution of VIIRS DNB and the Moon for the selected observations. The zenith angle is measured from the z-axis and the azimuth angle is measured clockwise from the north. The center indicates the location of the Dome C site. The lunar zenith angle ranges from 54.2 to 79.9 degrees, with 502 cases distributed in the range between 54.2 and 70 degrees and 105 cases distributed in the range between 70 and 79.9 degrees. Figure 2b shows the distribution of VIIRS DNB relative to the Moon over Dome C in the polar coordinate system. The relative azimuth is defined as the angle measured clockwise from lunar azimuth angle to the VIIRS azimuth angle [28]. All of the VIIRS zenith angles are less than 67.5 degrees.
2.4. Lunar Irradiance Model
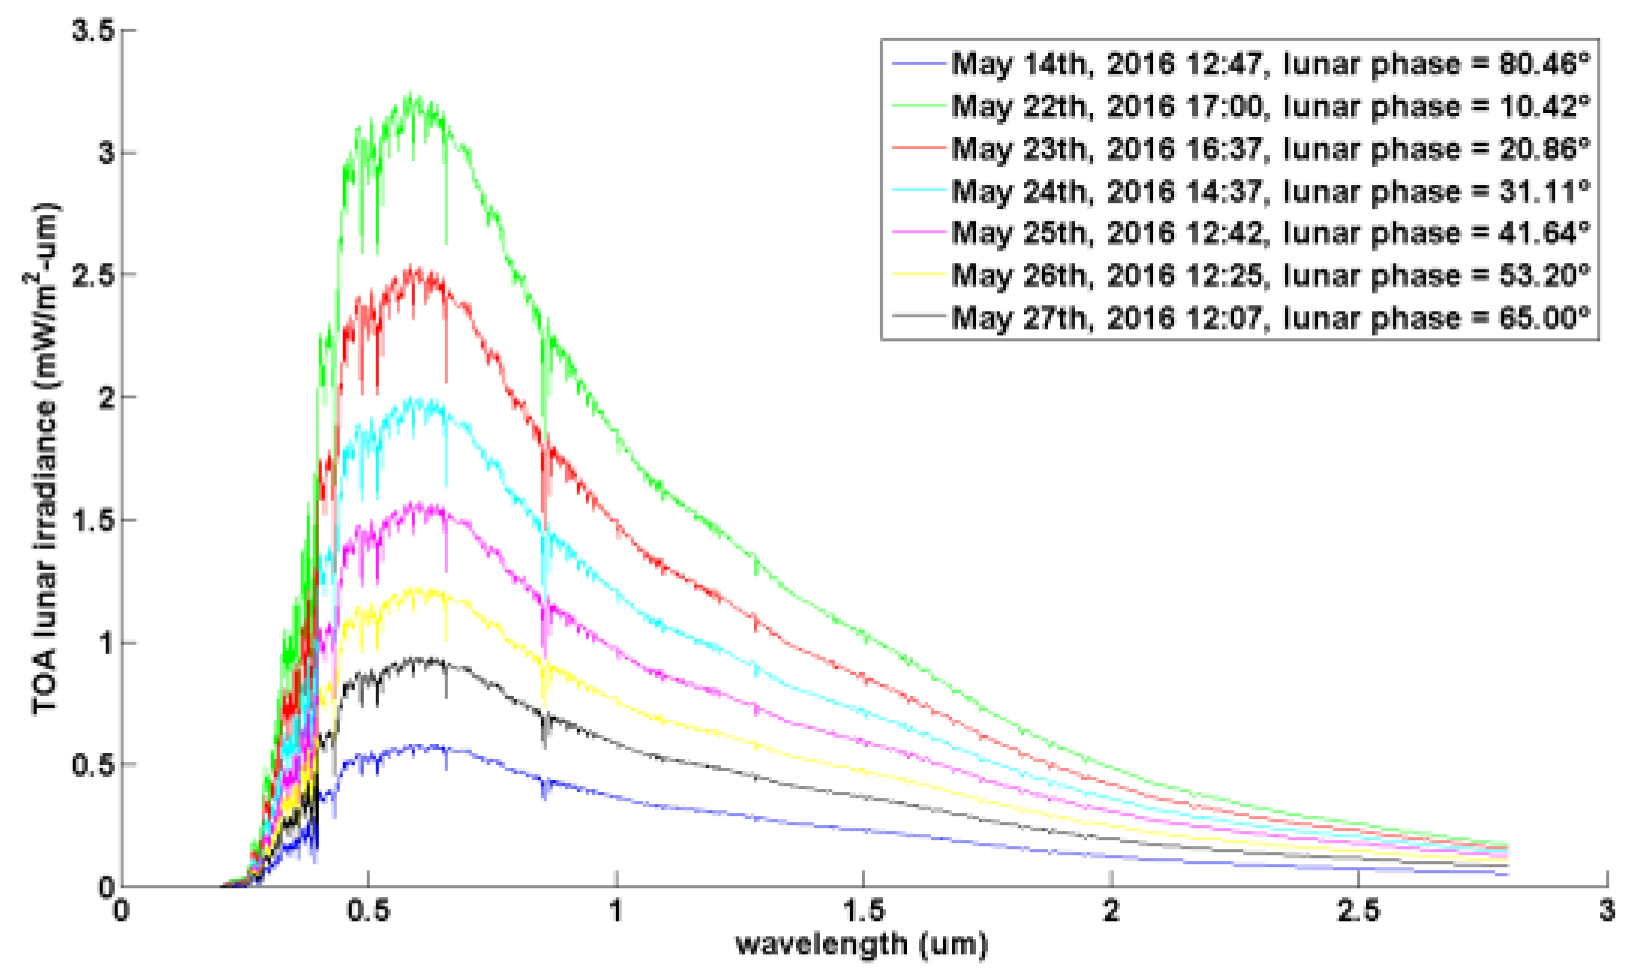
The MT2009 lunar irradiance model [25] was used to quantify the TOA spectral irradiance of the Moon at night. It covers the spectral range from 0.2 to 2.8 μm at 1 nm resolution. The lunar irradiance is quite sensitive to the lunar phase angle, especially when approaching the full moon. This is known as the opposition effect. The current version of the MT2009 model has large uncertainty for lunar phases below 10 degrees. Moreover, the model does not differentiate the waxing and waning lunar phases, which further makes the lunar model inaccurate since the actual lunar surface is inhomogeneous due to the distribution of highland and dark mare on the lunar surface [34]. The uncertainties embedded in MT2009 range from 7 to 17% for typical observing conditions. In this paper, the MT2009 model is corrected to distinguish the waxing and waning lunar phases between 5 and 90 degrees using the lunar observations made by SeaWiFS. Figure 3 shows six examples of TOA lunar irradiance spectral curves. It can be seen that the TOA lunar irradiance is quite sensitive to the lunar phase.
2.5. Reflectance Factor of Dome C Derived from DNB Data
After applying the selection criteria from Section 2.3 to DNB observations over Dome C from 2012 to 2016, the nighttime TOA reflectance factor from April to August in each year is derived. By convolving the lunar spectral irradiance from the MT2009 model with DNB RSR, the down-welling TOA lunar irradiance is derived using Equation (1):
where IMT(λ) is the lunar irradiance spectra obtained from the MT2009 model for a specific date. TOA radiance is then calculated as:
where θm is the lunar zenith angle. The TOA reflectance factor of Dome C is derived using the formula:
where LDNB denotes the average DNB radiance over Dome C, i.e., averaged over 10 km around the ROI. The subscript of rDNB-MT denotes the radiance of moonlight is calculated using the original version of the MT2009.
2.6. Correction of MT2009 Using Lunar Observations from SeaWiFS
In this study, the SeaWiFS lunar observations are used to correct the MT2009 lunar irradiance model, in particular, to account for dependence of lunar irradiance on the waxing and waning lunar phases. The SeaWiFS instrument onboard the SeaStar spacecraft was launched to low Earth orbit on 1 August 1997. It has eight RSBs, whose central wavelengths and bandwidths are shown in Table 2. As part of the calibration strategy, the SeaWiFS Project uses monthly lunar calibrations to monitor the on-orbit radiometric stability of SeaWiFS over the course of its mission [20,35]. The measurements are made at near-full moon and are later extended to high lunar phase angles. The long-term stability value of the SeaWiFS TOA radiances is 0.13%, which is derived from the lunar time series. The precision of the SeaWiFS measurement is 0.16% using solar calibration and 0.13% using lunar calibration [36]. A typical calibrated lunar image in Band 1 is shown in Figure 4a. The lunar phase angle was 5.71 degrees on 10 July 1998. The image has 100 scan lines from top to bottom and each scan line contains 100 samples.
In this study, the samples in the central core of the lunar images with radiance greater than 1% of maximum radiance are qualified as lunar pixels. The lunar signal is determined to be the summation of qualified pixel radiance in each scan line and is shown in Figure 4b. The disk-integrated radiance is calculated by summing up all the lunar signals in each scan line. By multiplying the solid angle of each lunar pixel with the disk-integrated radiance, the lunar irradiance is derived [37]. The lunar irradiance is then corrected to the mean Earth/Sun and mean Earth/Moon distance for model construction.
Since the mismatch between sampling rate and rotation rate of the spacecraft during the measurement causes elongation in the vertical direction in the lunar image, the derived lunar irradiance is, thus, over-estimated [37,38]. The lunar irradiance is corrected by applying an oversampling factor, which is defined as the ratio of the elongated lunar size to the expected lunar size [38]:
where is the mean instrument—Moon distance, i.e., 384,400 km, Dim is the instrument—Moon distance, and Ynom = 5.625 is the expected Moon diameter in terms of number of SeaWiFS pixels at the mean instrument—Moon distance. Yelon is the elongated Moon size in the image. It is defined as the separation between the top and bottom edge of the Moon [19]. The uncertainty in determining Yelon is the major error source in SeaWiFS lunar observations. The oversampling factor fs is calculated at the mean instrument—Moon distance since the lunar irradiance has been corrected to the mean instrument—Moon distance.
The bias between the SeaWiFS lunar observations and MT2009 is defined by:
where ISeaWiFS is the SeaWiFS lunar irradiance and IMT2009 is the lunar irradiance simulated with the MT2009 model. The bias δb(B) derived for eight SeaWiFS bands is interpolated to be δb(λ) in 1-nm resolution for the DNB spectral region; the bias δb-DNB for the DNB spectral region is derived using Equation (6):
Given the bias δb-DNB derived from the SeaWiFS lunar observations for different lunar phase angles, least square fitting is applied to derive the bias function under different lunar phase δb-DNB(Φ). The correction factor fc(Φ) for the MT2009 lunar irradiance model is defined by:
where Φ represents lunar phase angle. The lunar irradiance derived from MT2009 is corrected using Equation (8):
The corrected version of MT2009 is called the MT2009 SeaWiFS Corrected (MT-SWC) lunar irradiance model.
2.7. The Anisotropic Reflectance Factor Model of the Dome C Site
The bidirectional reflectance factor function (BRDF) describes the scattering of a parallel beam of incident light from one direction in the hemisphere into another direction in the hemisphere [39]. It is expressed as the ratio of infinitesimal quantities shown in Equation (9). L(θr, ϕr) represents the radiance reflected into the direction of (θr, ϕr), E(θi, ϕi) represents the incident flux from the direction of (θi, ϕi), and ϕ equals ϕv − ϕ0.
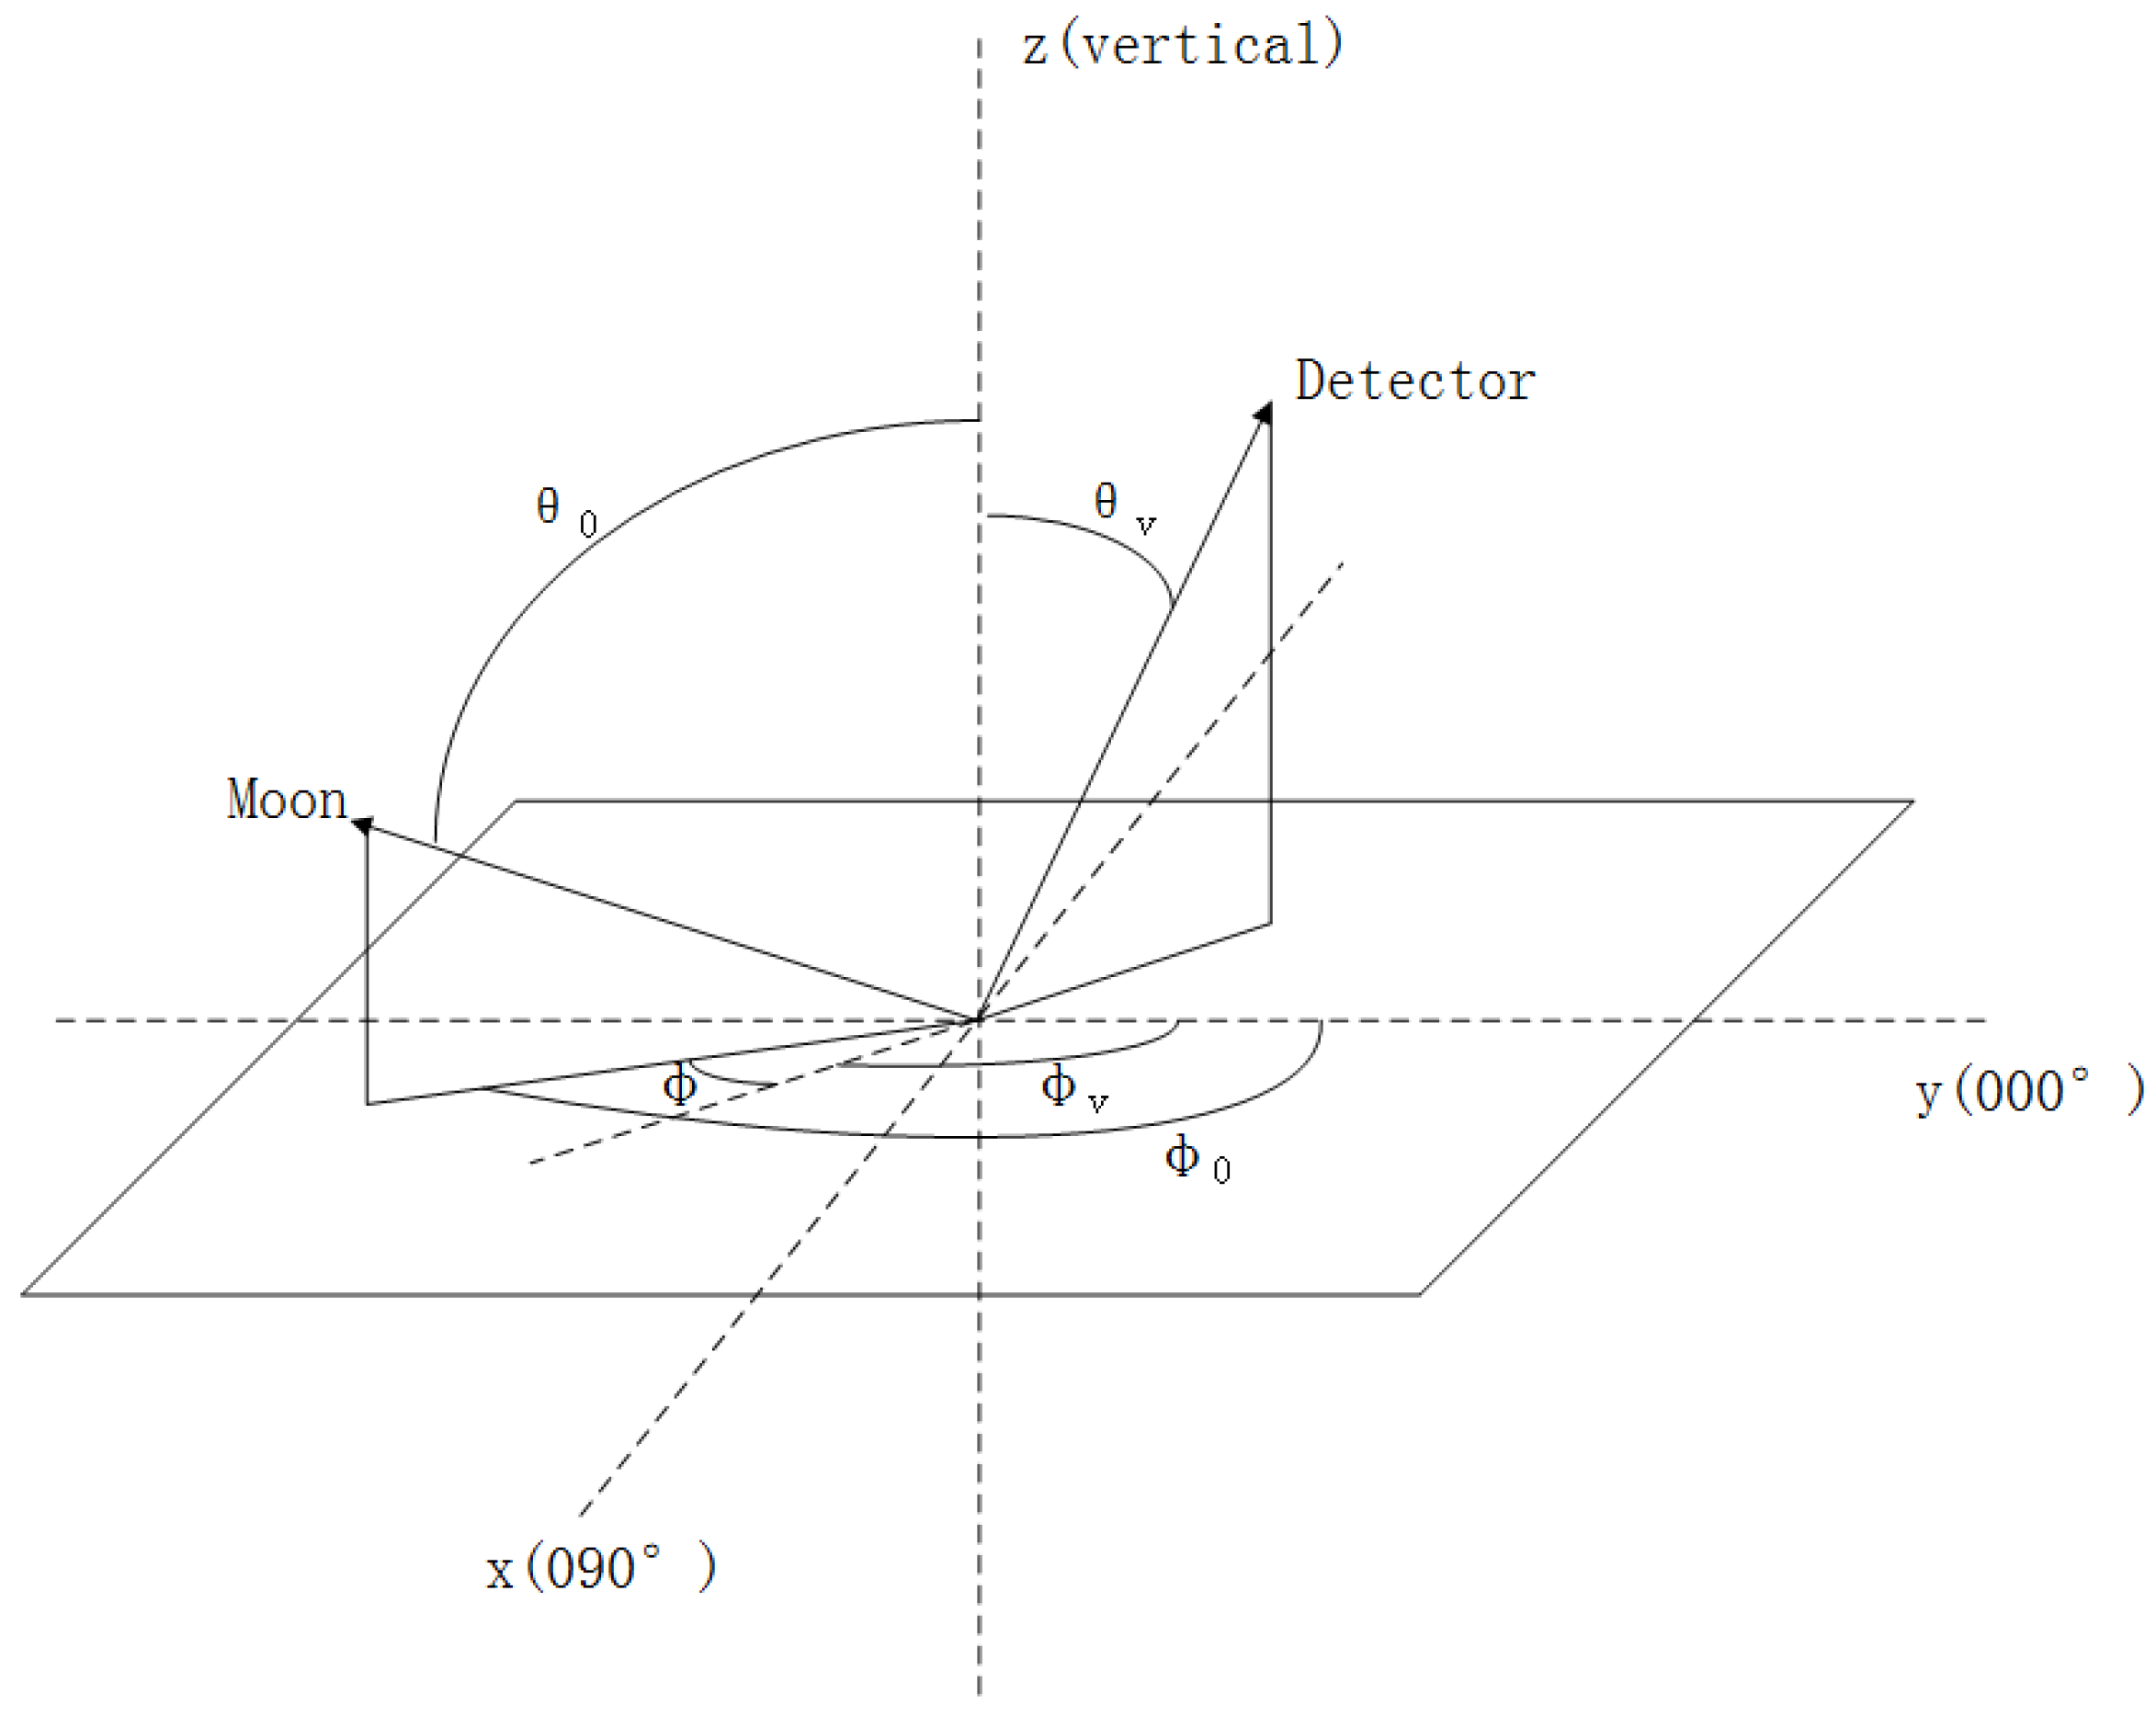
The definition of lunar zenith angle (θ0), viewing zenith angle (θv), lunar azimuth angle (ϕ0), viewing azimuth angle (ϕv), and relative azimuth angle (ϕ) are shown in Figure 5, where the zenith angle is measured from the z-axis and the azimuth angle is measured clockwise from the north (0°). The relative azimuth is defined as the angle measured clockwise from the lunar azimuth angle to the VIIRS azimuth angle [28].
The BRDF is expressed as the ratio of infinitesimal quantities, it cannot be directly measured. We choose to use the measurements in the form of the anisotropic reflectance factor (R), which is defined as follows:
where indicates the radiance reflected to the direction of (θv, ϕv) by Dome C when the incident moonlight is from the direction of (θ0, ϕ0). The numerator of the equation indicates the reflected radiance integrated over the entire hemisphere.
The incident moonlight can be divided into two parts: the direct moonlight, and the diffuse moonlight. The bidirectional reflectance factor (BRF) is defined by the ratio of the reflected radiant flux from the surface area to the reflected radiant flux from an ideal and diffuse surface of the same area under identical view geometry and single direction illumination. The hemispherical directional reflectance factor (HDRF) has the same definition as the BRF except that the incident flux is from the entire hemisphere [28,39,40]. The measured reflectance factor is interpolated between the BRF and the HDRF, which is given in Equation (11), where d ranges between 0 and 1 and denotes the fractional amount of direct radiant flux [40].
Since the atmospheric influence is low at the Dome C site, the influence of diffuse moonlight is small when lunar zenith angle is small. Therefore, the reflectance factor can be written in the form of Equation (12):
where indicates the irradiance of direct moonlight from the direction of (θ0, ϕ0).
Since the atmospheric effect at the Dome C site is small, the amount of direct moonlight reaching to the ground is large. However, as the lunar zenith angle is increasing, the influence of atmosphere is also increasing.
The spectral albedo (α) is actually the bihemispherical reflectance (BHR), which is the ratio of reflected to incident flux as a function of wavelength [40]. If the atmospheric influence is not taken into account, α can be written in the form of Equation (13):
where the numerator of the equation indicates the reflected radiance integrated over the entire hemisphere, and the denominator of the equation indicates the incident radiance integrated over the entire hemisphere.
Combining Equations (10), (12), and (13), the relationship between the anisotropic reflectance factor (R) from the Hudson model and the reflectance factor (r) derived from the DNB is given in Equation (14):
where ϕ denotes relative azimuth angle defined in Figure 5. The albedo α is obtained from the measurements made by Hudson et al. [28,30,41].
As we mentioned earlier in the paper, the BRDF effect is strong at Dome C. Thus, to accurately evaluate the radiometric stability of DNB HGS, the BRDF effect due to different view geometries with varying lunar zenith angles and sensor viewing angles needs to be taken into account and removed. Many studies have been performed to characterize the BRDF at Dome C. Warren et al. [27] measured the anisotropic reflectance factor at the South Pole Station at 0.60, 0.66, and 0.90 μm with a solar zenith angle from 67 to 89 degrees. Hudson et al. [28] extended the measurements of Warren et al. [27] by covering a broader spectral range (from 0.35 to 2.4 μm) with higher spectral resolution (3 to 30 nm) and a wider range of solar zenith angles (from 51 to 87 degrees). Wu et al. [29] compared the Warren model with the TOA reflectance factor over Dome C observed by MODIS during the daytime and found that the Warren model matches the TOA reflectance factor by better than 5%. According to the radiative transfer simulations by moderate resolution atmospheric transmission (MODTRAN), the dominant atmospheric effects at the Dome C site are Rayleigh scattering and ozone absorption, which can have strong effects only upon short wavelengths, especially below 500 nm [30,32,42].
According to Warren et al., the R can be represented in terms of ϕ [27]:
where the c1, c2, c3 is represented by θv:
The coefficients ai, (i = 0, 1, 2, and 3) are a quadratic function of cosθ0:
where the 12 coefficients b0i, b1i, b2i (i = 0, 1, 2, and 3) can be estimated by a least-squares best fit to the measurements. Since the intention of this paper is to monitor the stability of the radiometric stability of VIIRS DNB HGS, the atmospheric effects at the Dome C site are not considered when parameterization is performed.
In this study, we choose to use the model developed by Hudson et al. to characterize the BRDF effect of Dome C during the daytime. The measurements made by Hudson et al. are modeled with the first two terms of the empirical orthogonal functions (EOFs) which determine the dominant fraction of the variance in the data. There are, in total, 1775 different angular patterns with observations made at 71 different solar zenith angles and 25 different wavelengths. Each angular pattern contains samples of R gridded at six viewing zenith angles and 48 viewing azimuth angles. The measurements are divided into six different groups based on the different spectral region and solar zenith angle. Each group of measurements is used to perform the parameterization of the model in Equation (18):
For each angular pattern, R is a 288 × 1 vector, 1 is a 288 × 1 vector of ones, U is a 288 × 2 matrix whose first column corresponds to the first EOFs and the second column corresponds to the second EOFs, Σ is a 2 × 2 diagonal matrix with positive scale factors on the diagonal, and V is a 1 × 2 vector. We only use the first two groups of parameterization considering the spectral region of DNB and the range of the lunar zenith angle.
We choose the model developed by Hudson et al. for the following two reasons: (1) the range of the solar zenith angles in the measurements made by Hudson et al. covers the range of lunar zenith angles at the Dome C site observed by the VIIRS DNB; and (2) the spectral resolution of Hudson is higher than for the measurements taken by Warren et al. and it is more suitable for the DNB since the DNB is a panchromatic RSB. The modeled RS(B) in each sampled band is interpolated to derive the RS(λ) at 1-nm resolution over the DNB spectral region from 500 nm to 900 nm. RS(λ) is then convoluted with RSR(λ) to obtain the surface R of DNB (RDNB-S) at the Dome C site:
Figure 6 shows the results of the anisotropic reflectance factor R in DNB spectral region under different lunar zenith angles using the model developed by Hudson et al. The red points indicate the samples RDNB-S placed every 15 degrees in both the viewing zenith angle and relative azimuth angle starting at 22.5 degrees and 0 degrees, respectively. Figure 6 shows that the patterns of RDNB-S change from a nearly isotropic form to an anisotropic form as the lunar zenith angle increases, indicating a progression from a nearly Lambertian reflectance to a strongly forward-peaked reflectance. The nadir view RDNB-S decreases as the lunar zenith angle increases.
The TOA BRDF model is developed by best least square fitting of the analytical function of Warren model to the TOA reflectance factor derived from the VIIRS DNB. TOA R values for the VIIRS DNB, denoted as RDNB-T, are determined by applying Equation (14). The anisotropic reflectance factor RDNB-S derived from the Hudson et al. model is used as a reference for comparison with the nighttime TOA BRDF model.
3. Results
In this section, the results are given. The nighttime TOA reflectance factor in each year is analyzed. The MT-SWC lunar irradiance model is derived by correcting the MT2009 model using lunar observations made by SeaWiFS. The TOA BRDF model at Dome C is derived and compared with the anisotropic reflectance factor RDNB-S derived from the Hudson model. Finally, the radiometric stability monitoring of VIIRS DNB HGS from 2012 to 2016 is achieved.
3.1. Nighttime Reflectance Factor of Dome C from DNB Data
The results of nighttime TOA reflectance factor (rDNB-MT) at the Dome C site are shown in Table 3 and plotted in Figure 7a. It can be seen that the mean TOA reflectance factor in 2012 is lower by 5.69% than that in the following years from 2013 to 2017, which is in agreement with the trend of daytime observations of DNB over deep convective clouds (DCCs) from 2012 to 2015 [43]. This is attributed to UV-induced darkening of rotating telescope assembly (RTA) mirrors [44,45,46,47]. While the mirror experienced quick degradation in 2012, DNB RSR was not changed until April 2013. Figure 7b shows the DNB RSR used in the IDPS data archive before and after April 2013. The change of DNB RSR has about a 3–4% impact on the HGS gain [48]. The reflectance factor in 2012 is derived using RSR before 22 April 2013. The reflectance factor from 2013 to 2017 is derived using RSR after 22 April 2013. Though the time variation of the trend of DNB HGS is in agreement with that of the trend of DNB LGS, the magnitude of the trend of DNB HGS from 2013 to 2017 is higher than that of the other sensors due to the MT2009 model and the BRDF, which will be discussed later.
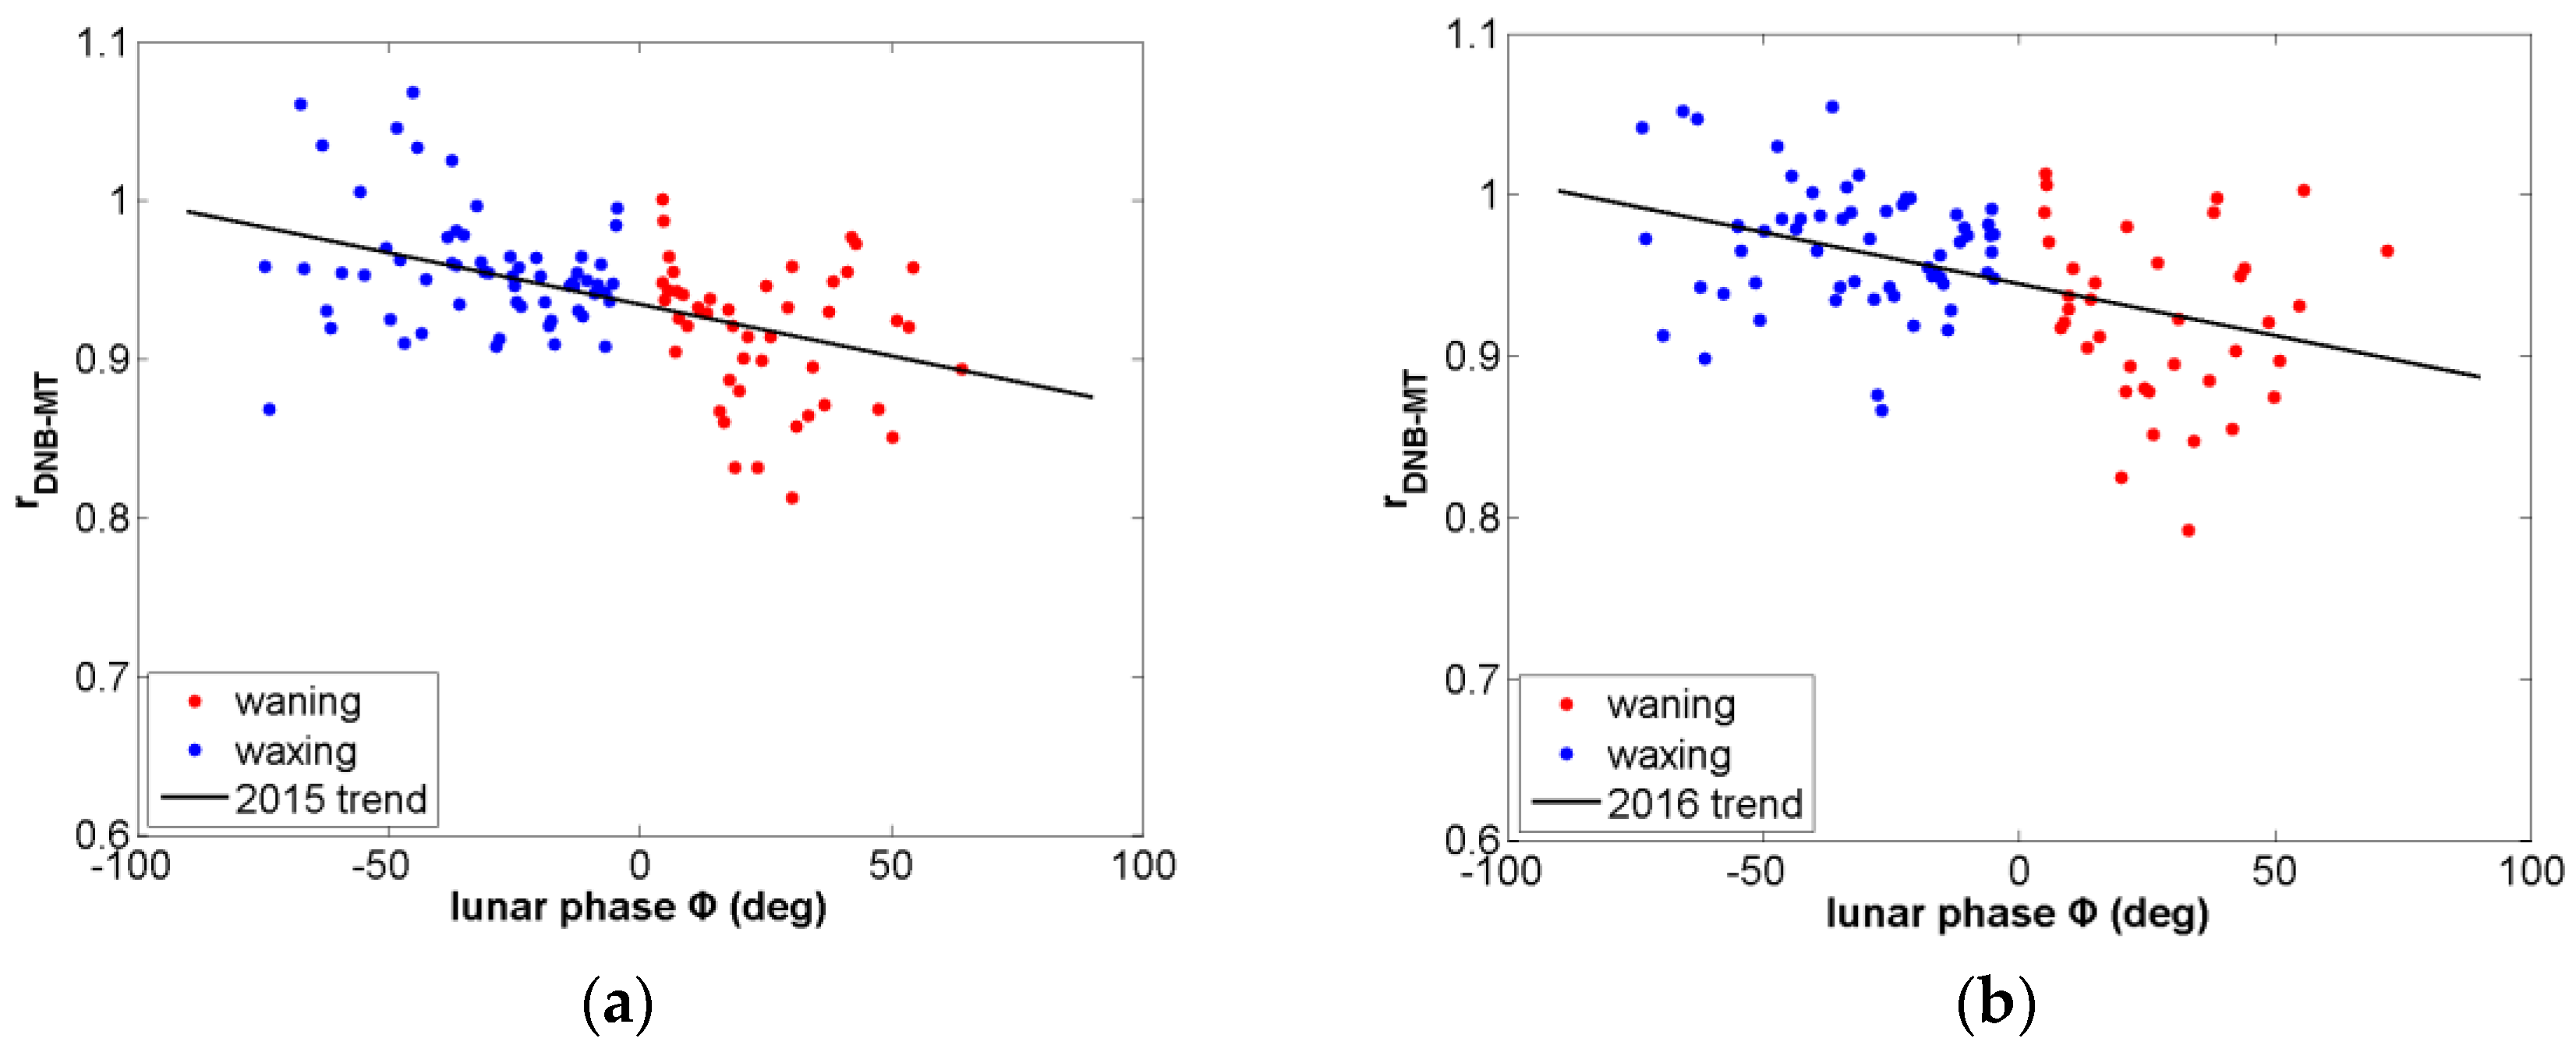
The DNB nighttime TOA reflectance factor rDNB-MT at Dome C under different lunar phase angles is illustrated in Figure 8. The results in 2015 and 2016 are selected as examples and are shown in Figure 8a,b, respectively. It is found that the TOA reflectance factor rDNB-MT has a strong dependence on the waxing and waning lunar phases. We have also noticed that the reflectance factor increases rapidly near full moon due to the opposition effect.
The nighttime TOA reflectance factor at Dome C derived from the DNB is higher than the TOA reflectance factor derived from Hyperion sensor onboard Earth Observing One (EO-1) [13]. One potential factor resulting in the disagreement is the accuracy of the MT2009 model. Since the MT2009 model does not account for the opposition effect, it predicts that the lunar irradiance is lower than the actual value when the lunar phase approaches full moon. In addition, as the MT2009 model equalizes the irradiance between the waxing and waning lunar phases, the modeled irradiance may be over-estimated during the waning lunar phase and under-estimated during the waxing lunar phase.
3.2. Correction with the MT-SWC Lunar Irradiance Model
The bias δb between the MT2009 model and the SeaWiFS lunar observations is shown in Figure 9, where band #4 is chosen as an example of the eight SeaWiFS bands. Figure 9a illustrates the bias δb near the full moon with the lunar phase angle of less than 10 degrees, where the irradiance of reflected sunlight increases rapidly when the lunar phase is close to full moon. The comparison between the SeaWiFS lunar observations and the MT2009 lunar irradiance model is consistent with the comparison between Hyperion 2004 reflectance and the modeled reflectance with MT2009 for a lunar phase angle of seven degrees [49]. Figure 9b illustrates the bias δb when the absolute lunar phase angle is larger than 20 degrees. It is shown that the average of the bias δb during the waxing lunar phase is larger than that during the waning lunar phase due to the asymmetric distribution of highland and dark maria between the left and right sides of the lunar surface.
To remove the lunar phase dependence from the nighttime TOA reflectance factor rDNB-MT, a linear function of lunar phase Φ in Equation (20) is used to fit the bias δb in each of the five SeaWiFS bands (510 nm, 555 nm, 670 nm, 765 nm, and 865 nm) within the DNB spectral region:
Since the lunar irradiance increases rapidly due to the opposition effect, the dataset is divided into two groups according to the range of lunar phase and the result is shown in Table 4.
The bias δb(Φ) under lunar phase from –90 to 90 degrees in 1-degree resolution is then interpolated to DNB spectral region and is shown in Figure 10. Following Equation (6), the bias δb(Φ) performs a convolution with DNB RSR to derive the bias in the DNB spectral region δb-DNB(Φ). Finally, δb-DNB(Φ) is converted to the correction factor fc(Φ) using Equation (7). The lunar irradiance model derived from MT2009 is corrected using Equation (8).
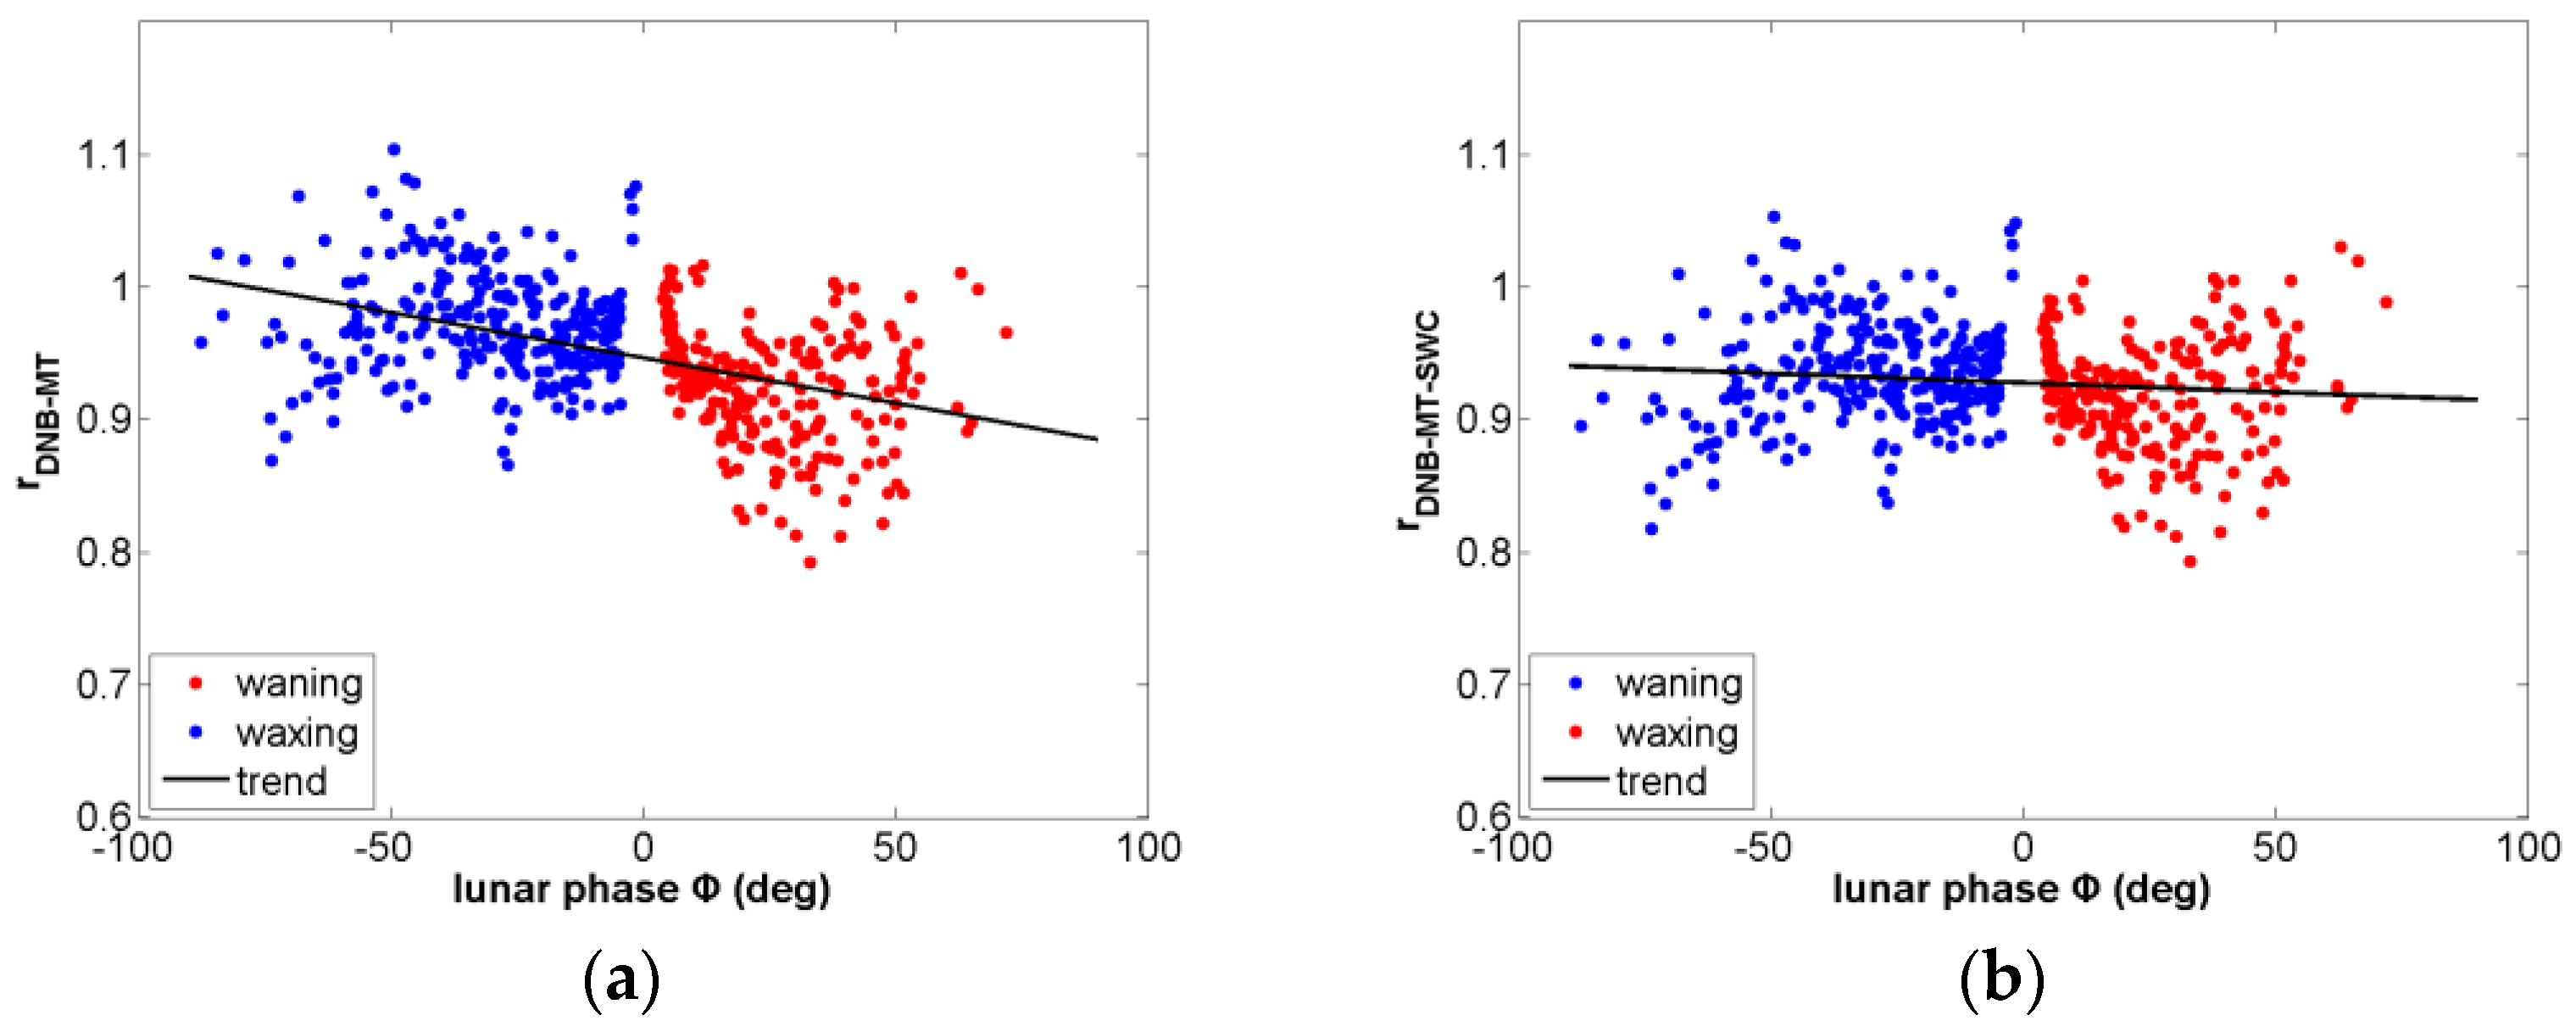
The TOA nighttime reflectance factor rDNB-MT is corrected to the reflectance factor using the MT-SWC lunar irradiance model (rDNB-MT-SWC). The comparison between rDNB-MT and rDNB-MT-SWC at Dome C from 2013 to 2017 is shown in Figure 11. The nighttime reflectance factor in 2012 is not included due to the rapid degradation of the RTA. The average nighttime reflectance factor after correction is 0.9286 ± 0.0412 and the slope of the fitted line changes from −0.7 × 10⁻⁴ degree−1 to −0.1 × 10⁻⁴ degree−1, demonstrating the effectiveness of removing the waxing and waning lunar phase dependence from the nighttime TOA reflectance factor.
The results of the nighttime TOA reflectance factor rDNB-MT-SWC at the Dome C site are shown in Table 5. Compared with the results derived using the original MT2009 lunar irradiance model, the average values of the corrected results in each year from 2012 to 2017 are 2.71%, 2.40%, 2.35%, 2.32%, 2.35%, and, 2.08% less than the results shown in Table 3 respectively. The uncertainty of corrected results in each year from 2012 to 2017 are 0.81%, 0.23%, 0.86%, 0.41%, 0.45%, and 1.08% less than the results shown in Table 3 respectively.
3.3. Characterization and Removal of the Angular Dependence from RDNB-T
The comparison between the corrected TOA anisotropic reflectance factor RDNB-T from 2013 to 2017 and the reflectance factor derived from the Hudson BRDF model is shown in Figure 12. It can be seen that most of the bias between the corrected TOA R and the Hudson BRDF model ranges between −10% and 10%. The bias increases as the lunar zenith angle is approaching 80 degrees.
The lunar zenith angles (θ0) of nighttime RDNB-T from 2013 to 2017 are in the range of (50°, 80°). The coefficients in Equations (15)–(17) are determined by a least square best fit to the corrected RDNB-T from 2013 to 2016 and the resulting coefficient values are given in Table 6. The TOA BRDF model is derived and the fitting residual quantified by RMSE is 4.64%. The corrected RDNB-T in 2017 is used for validation.
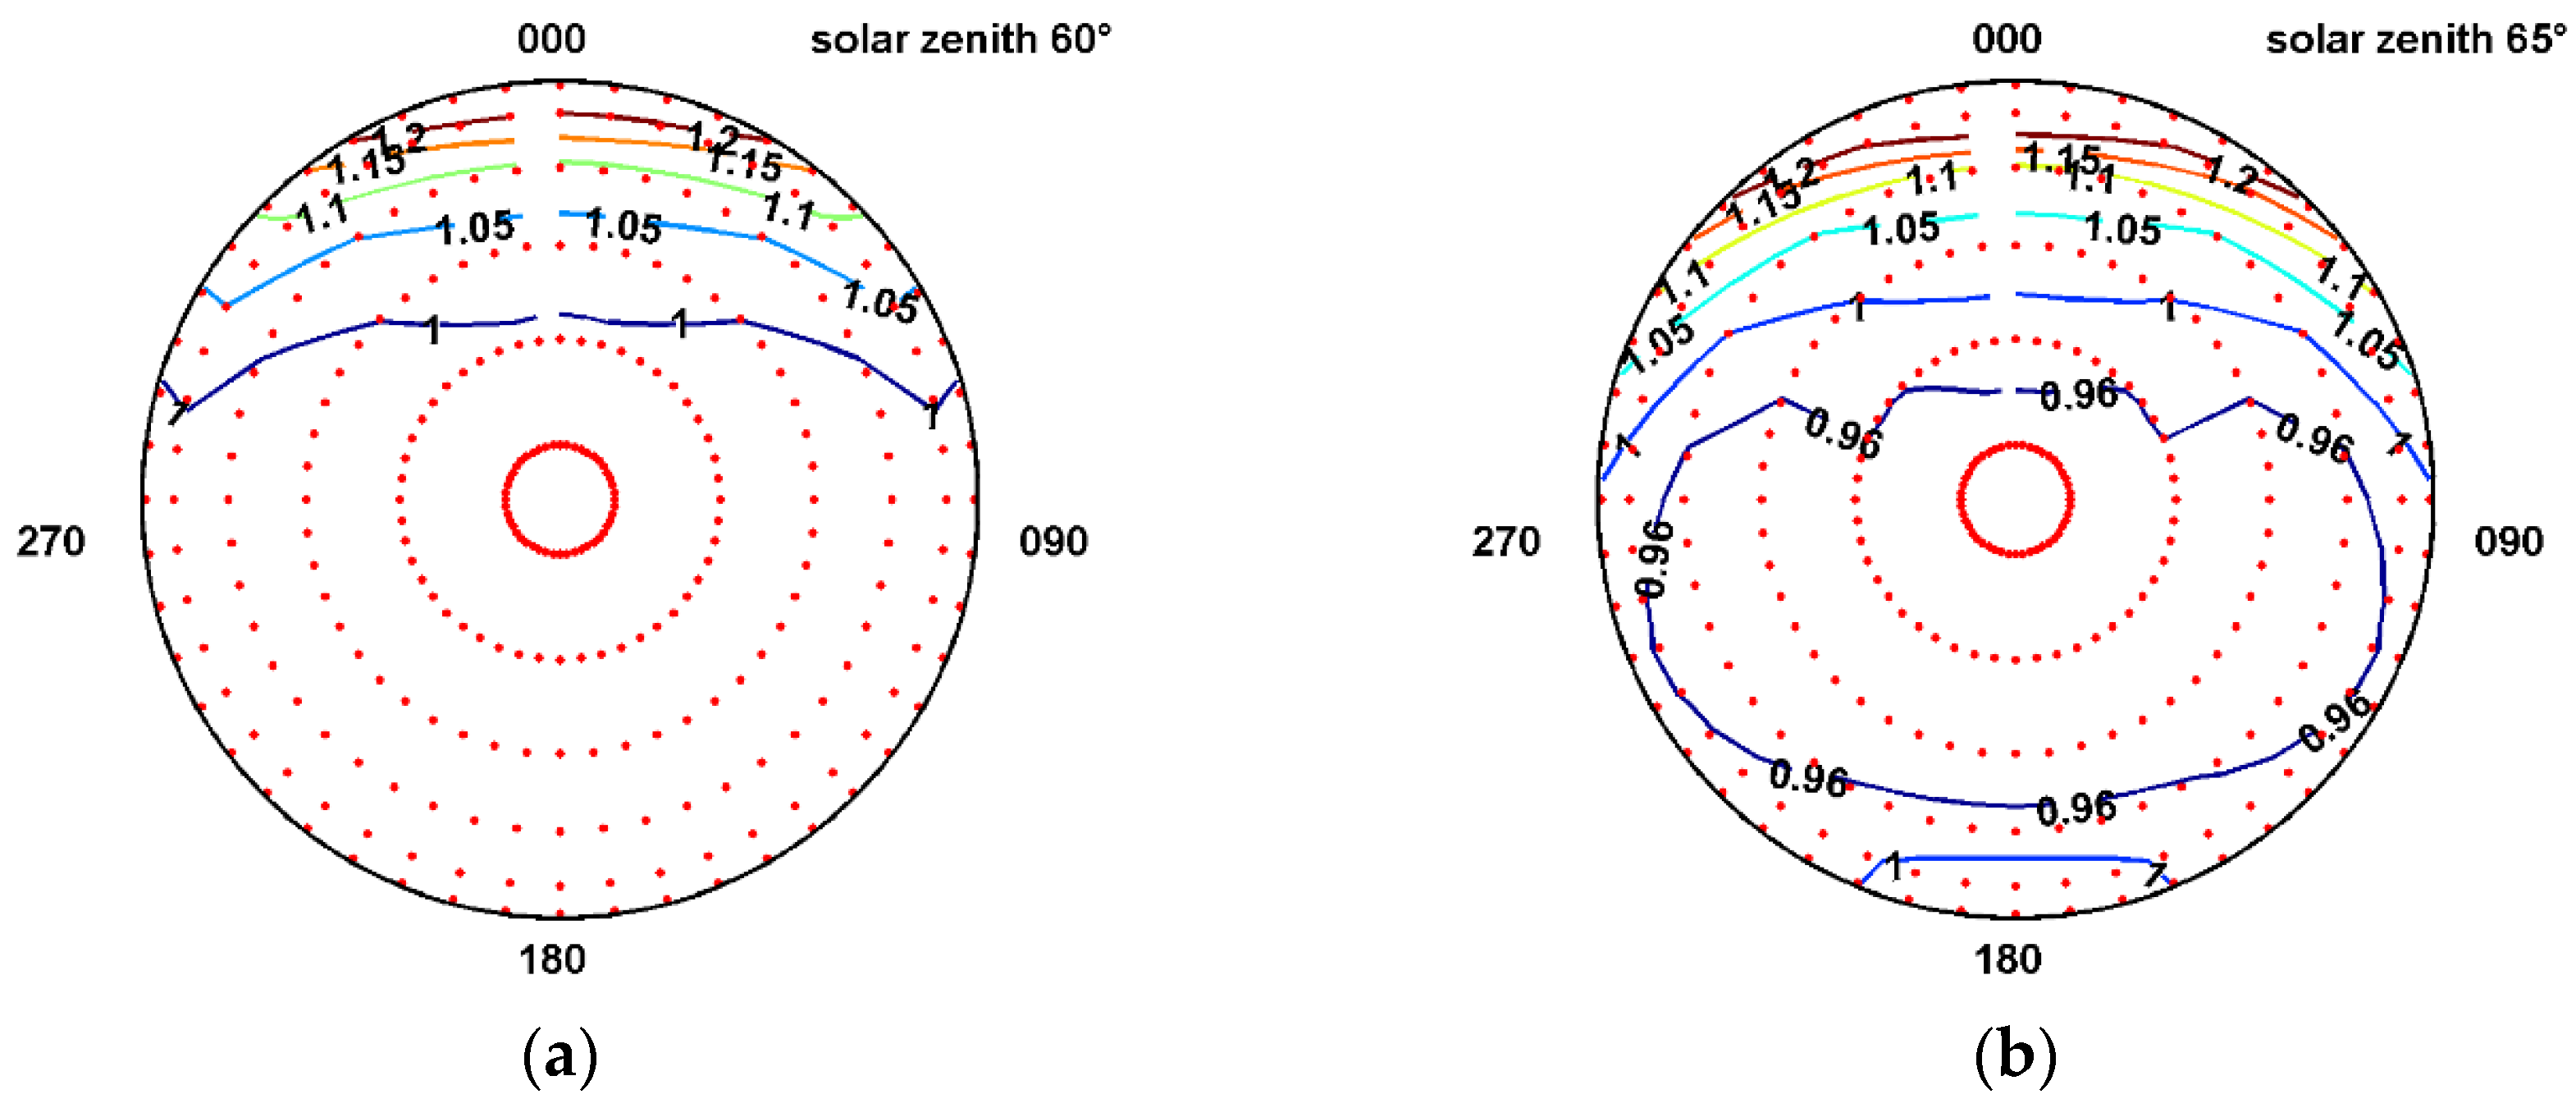
In order to evaluate the effectiveness of the derived nighttime TOA BRDF model, we derive RDNB-T under the same angular grid with the RDNB-S derived from the model developed by Hudson et al. The angular grid is distributed every 15 degrees starting from 7.5 to 82.5 degrees for the VIIRS zenith angle θv and every 7.5 degrees starting from 0 to 360 degrees for the VIIRS relative azimuth angle ϕr. The scatter plot RDNB-S vs. RDNB-T with correlation values at 60, 65, 70, and 75 degrees of the lunar zenith angle θ0 are shown as examples in Figure 13a–d. The correlations between RDNB-T and RDNB-S at Dome C are shown in Figure 13e. It can be seen from Figure 13a,b,e that the lunar zenith angle for a high correlation above 0.9 is located between 53 and 70 degrees, while the lunar zenith angle for a lower correlation between 0.8 and 0.9 is located between 70 and 75 degrees, which can be seen in Figure 13c,e. The lowest correlation is below 0.8 and is located between 75 and 80 degrees for the lunar zenith angle, which can be seen in Figure 13d,e. The change of correlation is due to the limited coverage of the available lunar zenith angle. For DNB observations used in the fitting, there are 343 cases with θ0 between 50 and 70 degrees, 49 cases with θ0 between 70 and 75 degrees, and 26 cases with θ0 between 75 and 80 degrees. Figure 13a–d show deviations from the blue benchmark line indicating the agreement between the value of RDNB-S and RDNB-T. The deviation is mainly due to the difference in the observation geometry for the DNB and the Hudson BRDF model. Figure 13f shows the observation geometry for the DNB from 2012 to 2016 and the Hudson BRDF model. It can be seen that the coverage of viewing zenith angle below 67.5 degrees is almost the same for the DNB and the Hudson BRDF model. On the other hand, the observations made by the DNB are scarce in the region where the relative azimuth angle ranges between −30 and 180 degrees and the viewing zenith angle ranges between 40 and 82.5 degrees. Figure 13g shows the observation geometry for the DNB from 2012 to 2016 and Hudson BRDF model when lunar zenith angle ranges between 70 and 80 degrees, illustrating the limited observations made by the VIIRS DNB under this range of lunar zenith angle. Also, when the lunar zenith angle is approaching 80 degrees, the incident moonlight will be more influenced by the atmosphere.
The contour of RDNB-T at Dome C derived from the nighttime DNB is shown in Figure 14a–d. The samples are taken in the same way with the RDNB-S as shown in Figure 7. The angular pattern becomes anisotropic as the lunar zenith angle increases, which is in agreement with RDNB-S. The bias between RDNB-T and RDNB-S is defined as:
With samples for the VIIRS zenith angle θv at 67.5 and 82.5 degrees removed, the bias under the corresponding VIIRS zenith and relative azimuth angles is shown in Figure 14e–h. The overall bias at values 60, 65, and 70 degrees of the lunar zenith angle is relatively lower than that at 75 degrees, which is due to the limited observations at high lunar zenith angles. In addition, the good agreement occurs near nadir viewing angle for all four cases. The bias between the surface and TOA R is mainly a result of the atmospheric effects, which have not been taken into account.
The black sky albedo derived from the TOA BRDF model is also compared with the mean black sky albedo in the 300~700 nm wavelength interval derived from the standard V005 surface BRDF and Albedo Product (MCD43A1) in 2015 from October to December [50,51]. The MCD43A1 describes the reflectance anisotropy in a 500-m grid using the RossThickLiSparse Reciprocal BRDF model. The Dome C site is located in line 1224, and sample 412 in tile h21v16. We only take parameters whose quality flags (QAs) equal 0, indicating a sufficient number of high-quality, cloud-free observations used to build the BRDF model. The black sky albedo from our BRDF model is derived by integrating over the entire hemisphere in the viewing direction. The comparison between the MCD43A1 and the nighttime TOA BRDF model under the lunar zenith angle from 50 to 80 degrees is shown in Figure 15. It can be seen that the bias increases as the lunar zenith angle approaches 80 degrees, following the same trend as that shown in Figure 14e–h, due to fewer observations under the lunar zenith angle between 70 and 80 degrees, different spectral response function, and increasing atmospheric effect. Based on the comparison shown in Figure 14 and Figure 15, observations under lunar zenith angle greater than 70 degrees are screened out to derive the normalized RDNB-T.
In order to remove the angular dependence from RDNB-T, the measurements of RDNB-T need to be normalized by the model derived reflectance factor. The normalization is performed using the Hudson BRDF model and the TOA BRDF model, and the result of normalized RDNB-T (RDNB-T-N) is shown in Table 7. RDNB-T-N in 2017 can be treated as a reference to see the effectiveness of the nighttime BRDF model. Compared with the uncertainty of nighttime TOA reflectance factor rDNB-MT, which is shown in Table 5, the uncertainty of RDNB-T-N in the years from 2012 to 2017 is lowered by 1.08%, 1.04%, 0.49%, 1.01%, 0.66%, and 0.15% using the normalization performed by the Hudson BRDF model and 1.44%, 1.34%, 0.84%, 1.20%, 1.08%, and 0.69% using the normalization performed by the TOA BRDF model, respectively. The remaining uncertainty in each year is mainly due to the calibration uncertainty of the VIIRS DNB HGS, which is created by transferring from LGS gains to MGS gains and, finally, to HGS gains. The uncertainty of normalized RDNB-T-N by the nighttime TOA BRDF model in 2017 is 0.54% less than that by the Hudson BRDF model, indicating that the nighttime TOA BRDF model is more suitable to the reflectance factor derived from the VIIRS DNB HGS. However, since the BRDF model derived in this paper is based on the uncorrected TOA reflectance factor, the BRDF model may only be applied to monitoring the radiometric stability of VIIRS DNB HGS.
The removal of observations with large uncertainty under lunar zenith angle from 70 to 80 degrees also contributes to the lowered uncertainty shown in Table 7 compared with Table 5. We gave the normalization results for all the RDNB-T samples performed by using the nighttime TOA BRDF model in Table 8. Compared with the results shown in Table 5, the uncertainty of RDNB-T-N in the years from 2012 to 2017 is lowered by 0.74%, 0.59%, 0.56%, 0.48%, 0.73%, and 0.61%, respectively, owing to the removal of the BRDF effect.
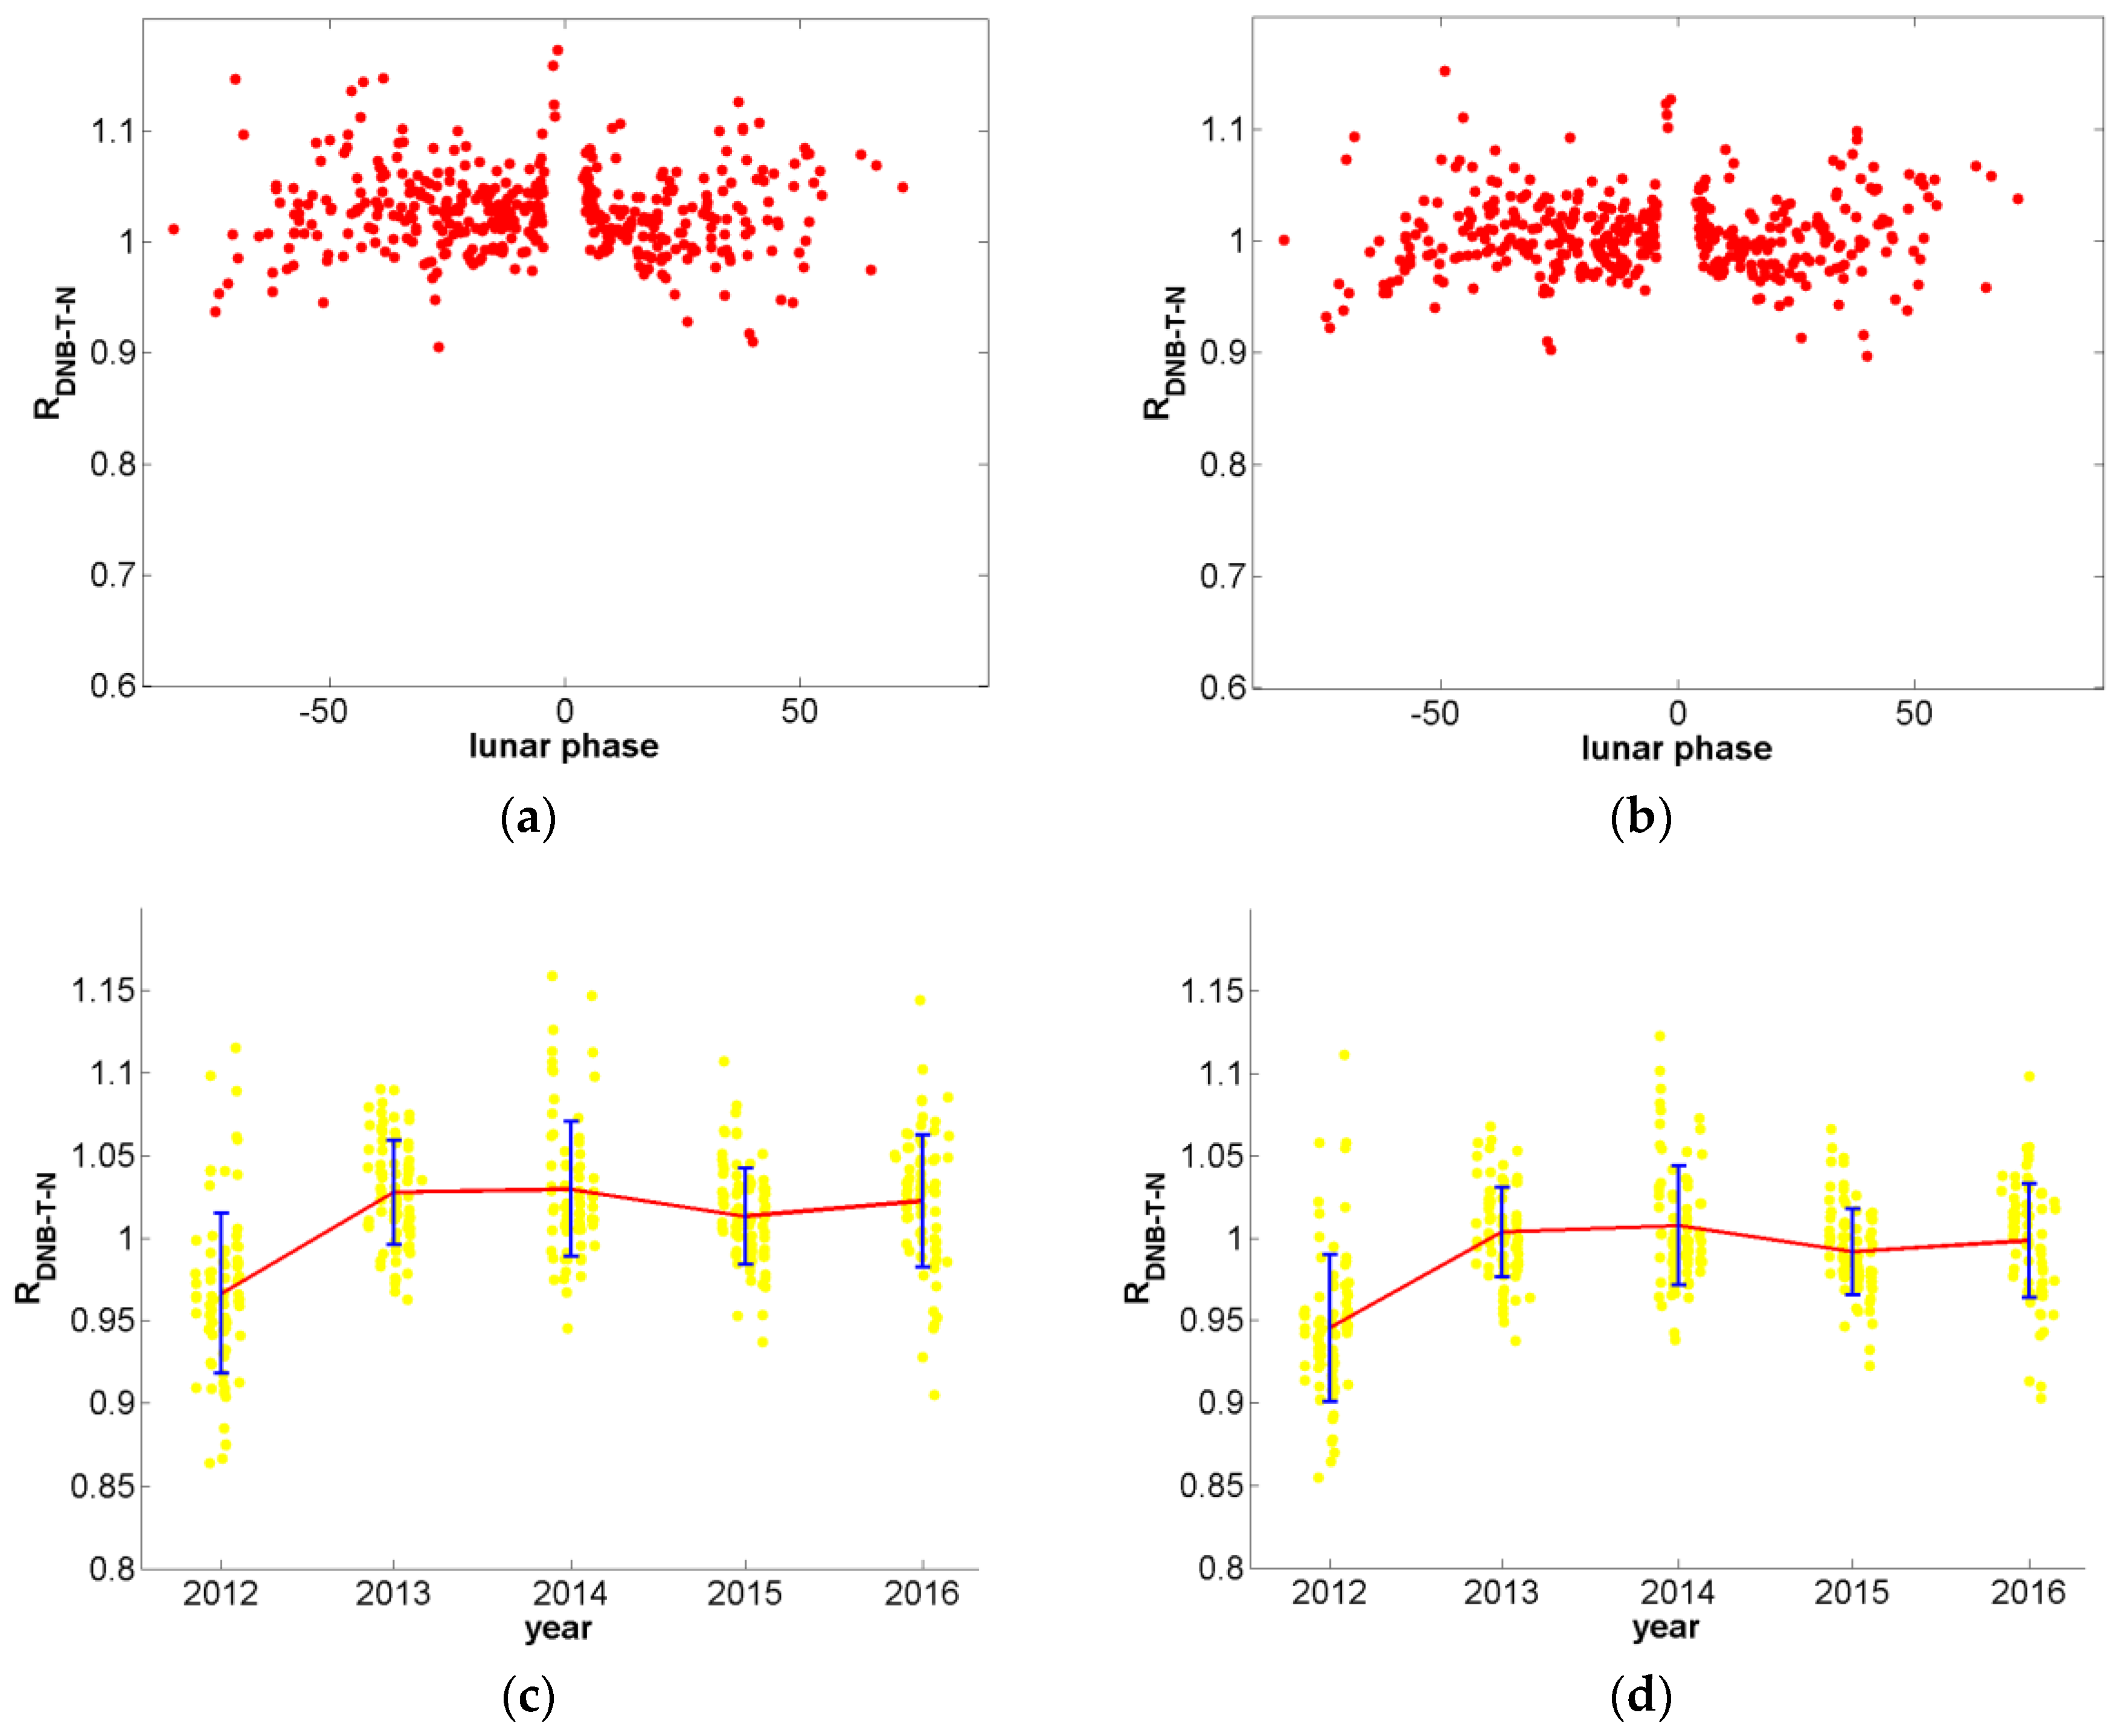
The normalized RDNB-T-N from 2013 to 2017 under different lunar phases is shown in Figure 16a,b and the trend of RDNB-T-N during the periods from 2012 to 2016 is illustrated in Figure 16c,d. The yellow scattered points represent the RDNB-T-N and the overlaid blue bar indicates the standard deviation of RDNB-T-N in each year. The left side of the result is derived from the normalization performed by the Hudson BRDF model and the right side is from the nighttime TOA BRDF model. It can be seen from Figure 16a,b that greater reduction in dispersion is accomplished by the nighttime TOA BRDF model since it was applied to the same data from which it was derived. However, the comparison of RDNB-T-N in 2017 shown in Table 7 demonstrates the nighttime TOA BRDF model is more suitable to the VIIRS DNB HGS. The comparison between Figure 11b and Figure 16b illustrates that the reduction in uncertainty is accomplished after a series of processing method. The comparison between Figure 16c and d illustrates a similar radiometric trend from 2012 to 2016, though the mean value and standard deviation of normalized RDNB-T in each year shown in Figure 16c appear to be greater than the corresponding values shown in Figure 16d. The long-term stability monitoring of the DNB shown in Figure 16c,d reveals a 5.44% and 5.49%, corresponding to the result derived from the Hudson BRDF model the nighttime TOA BRDF model respectively, lower reflectance factor in 2012 in comparison to the following years, which can be traced to the change of the RSR of the VIIRS DNB. This is consistent with the trend of daytime observation over DCCs from 2012 to 2015. Figure 16c,d demonstrate that the radiometric condition of DNB data from NOAA’s IDPS has a long-term stability of less than 1.53% and 1.58%, corresponding to the result derived from the Hudson BRDF model the nighttime TOA BRDF model respectively, over the periods from 2013 to 2016.
4. Discussion
4.1. The Challenge of the Study
The VIIRS DNB uses three gain stages to cover a wide dynamic range (day and night) that spans over seven orders of magnitude. The radiance detected by the VIIRS HGS can be lower than 10−9 W·cm−2·sr−1, which makes DNB calibration more complicated and challenging. The calibration parameters for DNB LGS are determined using a solar diffuser onboard the S-NPP/VIIRS. However, for the MGS and HGS of DNB, the gain values are obtained by propagating LGS calibration through the LGS/MGS and MGS/HGS gain ratio which is performed once a month during the New Moon near the terminator region. The dark offsets for all three DNB gain stages are also determined once a month during the New Moon. Due to the lack of a stable nighttime light source with a radiance level suitable for radiance calibration of the DNB HGS, it is quite challenging to monitor the radiometric stability of the DNB HGS.
This paper developed a scheme to reduce the uncertainty in monitoring the calibration stability of DNB HGS using pseudo invariant calibration sites such as Dome C under the illumination of moonlight. There have been several studies, such as [10,13,14], that either use DNB observations of the Moon or vicarious sites under moonlight to monitor DNB calibration uncertainty. In [10], direct observations of the Moon by DNB from 2012 to 2013 were monitored and it was determined that DNB calibration uncertainty was within 15%. In [13,14], the feasibility of monitoring calibration uncertainty of DNB was demonstrated using about two years of DNB observations of Dome C and Greenland under moonlight with various lunar phases. It was determined that DNB calibration uncertainty is within 8% [13,14]. The studies in [13,14] are all limited to using data from the nadir view of DNB which results in very few observations of calibration sites. In addition, the MT2009 lunar irradiance model used in [13,14] to derive the TOA reflectance of the calibration site from DNB observation does not differentiate the waxing and waning lunar phases. For a lunar phase angle of the same absolute value, the lunar irradiance difference between the waxing and waning lunar phases can be of several percent [17]. The inherent indistinguishable bias between the waxing and waning lunar phases in the MT2009 lunar irradiance model [24] increases the uncertainty in monitoring the calibration of the DNB HGS by using such a model. In addition, previous studies in [13,14] focused on the DNB nadir view of the vicarious site and were unable to take the BRDF effect into account due to very limited number, i.e., less than ten during each season, of observations under such view geometry. All of the above uncertainty factors make long term stability monitoring of DNB difficult.
4.2. The Analysis of the Results
In this paper, the reduction of uncertainty in monitoring long term DNB calibration stability is accomplished by including off-nadir DNB observations of the calibration site, carrying out a strict screening process in selecting qualified observations (Section 2.3), improving the lunar irradiance model by correcting the MT2009 lunar irradiance model based on the lunar observations made by SeaWiFS, and performing the BRDF characterization of the calibration site.
When applying the MT2009 lunar irradiance model directly to derive the TOA reflectance factor of Dome C from DNB, there appears to be a non-physical slope (ca. −0.7 × 10⁻⁴ degree−1) in the derived TOA reflectance factor vs. lunar phase with the TOA reflectance factor during the waxing lunar phase being higher than that during the waning lunar phase. In this paper, the lunar observations made by SeaWiFS were used to remove the lunar phase dependence from the nighttime TOA reflectance factor. The radiometric calibration of SeaWiFS was very stable. The long-term stability of the TOA radiances derived from lunar time series is 0.13% [20]. The biases of lunar observations relative to the ROLO photometric model of the Moon are 2~3% and the biases from the vicarious calibration against the Marine Optical Buoy (MOBY) are 1–2% [19,20]. The MT-SWC lunar irradiance model derived in this paper is based on the comparison between the MT2009 lunar irradiance model and the SeaWiFS lunar observations in DNB spectral region. After applying the MT-SWC lunar irradiance model to the nighttime TOA reflectance, the slope of the fitted line changes from −0.7 × 10⁻⁴ degree−1 to −0.1 × 10⁻⁴ degree−1. The removal of lunar phase dependence from nighttime TOA reflectance factor demonstrates the effectiveness of the MT-SWC model in differentiating the waxing and waning lunar phases.
In [33] Miller et al. found that the nighttime reflectance of Salar de Uyuni also showed a strong dependence on the waxing and waning lunar phases. In order to remove the lunar phase dependence from the nighttime reflectance, Miller et al. compared the MT2009 lunar irradiance model and the lunar irradiance data from Meteosat Second Generation (MSG) at 0.6 and 0.8 μm bands. They used a sixth-order polynomial function to fit the percent error and corrected the MT2009 lunar irradiance model [33].
By including the off-nadir DNB observations of Dome C, the number of observations of Dome C under moonlight increases greatly to approximately 100 cases per season, which enables the BRDF characterization of Dome C from DNB observations during the nighttime. In the past, the anisotropic reflectance factor R at the Dome C site has been characterized using the Warren [27] or Hudson [28] models during the day time [29,30]. Since lunar light illuminated onto Dome C varies with lunar phases, the BRDF characterization of Dome C can only be made possible by having a lunar irradiance model, such as the MT-SWC developed in this paper. The comparison between the daytime anisotropic reflectance factor R from Hudson et al. [28] and the nighttime anisotropic reflectance factor R derived in this paper at Dome C reveals a correlation above 0.9 for a lunar zenith angle between 52 and 70 degrees, indicating a consistency between daytime and nighttime R at the Dome C site.
The trend of TOA reflectance factor (RDNB-T-N) of Dome C derived from the DNB HGS from 2012 to 2016 is consistent with that of TOA reflectance of DCC derived from the DNB LGS from 2012 to 2015. Both trends show an increase from 2012 to 2013 before the RSR change in IDPS. After the change of the RSR, the trends become stable. The consistency between the daytime TOA reflectance of DCC in [34] and the nighttime TOA reflectance factor of Dome C in this study can be traced to the calibration of HGS, which is achieved by propagating the LGS calibration through the LGS/MGS and the MGS/HGS gain ratio. The long-term stability of DNB LGS since May 2013 is 0.5% derived from monthly DCC reflectance. The long-term stability of DNB HGS from 2013 to 2016 is less than 1.58%, derived from the reflectance factor of Dome C. However, the HGS gains in the NASA VIIRS Characterization Support Team (VCST) look up table (LUT) are about 6–7% higher than those in the IDPS LUT after the RSR updates in April 2013 [48], indicating that the reflectance factor of Dome C using VCST may be even greater than in the results derived in this study.
4.3. Limitations
There do, however, exist a number of limitations in this study. Firstly, due to the limited lunar phase coverage and the spectral resolution of the SeaWiFS lunar observations, the correction of the MT2009 lunar irradiance model only used the first-order linear model. The uncertainty of the MT-SWC model can be large. Secondly, after removing the angular dependence from the nighttime TOA reflectance factor, the standard deviation in each year from 2012 to 2016 is 4.73%, 2.74%, 3.59%, 2.64%, and 3.45%, respectively, which can be due to the calibration uncertainty of VIIRS DNB HGS. Finally, since the RTA degraded quickly in 2012, DNB RSR should be continuously changing [43,44,46,47]. However, only the prelaunch-determined DNB RSR was used before 22 April 2013 in this study, adding uncertainty to the nighttime TOA reflectance factor in 2012. Therefore, the uncertainty in 2012 is higher than in the following years. However, the remaining uncertainty in each year does not have a negative effect upon monitoring the stability of the VIIRS DNB HGS.
5. Conclusions
In order to evaluate the radiometric stability of the VIIRS DNB HGS, the Dome C site is selected as the observation site for its clear skies and radiometric stability. The nighttime TOA reflectance factor in the Dome C site from 2012 to 2017 is derived using the MT2009 lunar irradiance model and VIIRS DNB observations. It is found that the nighttime reflectance factor in each year shows a strong dependence on the waxing and waning lunar phases. The MT-SWC lunar irradiance model is developed by correcting the MT2009 lunar irradiance model based on SeaWiFS lunar observations. The lunar phase dependence is effectively removed from the nighttime TOA reflectance factor after using the MT-SWC lunar irradiance model. Based on the corrected results, a nighttime BRDF model is developed and is validated by comparison to the anisotropic reflectance factor R derived from the model developed by Hudson et al. [28], the black sky albedo derived from MCD43A1, and the anisotropic reflectance factor in 2017. The normalized results performed by the Hudson BRDF model and the nighttime TOA BRDF model reveal 5.44% and 5.49% lower reflectance factors, respectively, in 2012 in comparison to the following years, which can be traced to the change of the VIIRS DNB RSR. The results from the Hudson BRDF model and the nighttime TOA BRDF model also show long-term stability of less than 1.53% and 1.58% over the periods from 2013 to 2016 respectively. The trend of TOA reflectance factor at the Dome C site from DNB HGS is consistent with the TOA reflectance of observations over DCCs from the DNB LGS.
One of the advancements in this study is the development of the nighttime TOA BRDF model at the Dome C site using the VIIRS DNB HGS. Compared to the constant solar light source during the daytime, the irradiance of moonlight changes with the lunar phases. In addition, the uncertainty of the VIIRS DNB HGS is higher than that of the LGS. Therefore, the nighttime conditions are more complex than daytime conditions. The nighttime R of Dome C derived in this paper is consistent with the anisotropic reflectance factor model developed by Hudson et al. [28] and is validated by the TOA anisotropic reflectance factor in 2017. Another advancement is the MT-SWC lunar irradiance model differentiating the waxing and waning lunar phases. It is derived by correcting the MT2009 lunar irradiance model based on lunar observations made by SeaWiFS. The algorithm developed in this paper can be applied to monitor the radiometric stability of other low-light observing sensors using a vicarious calibration site under moonlight illumination.
Acknowledgments
We would like to thank Gene Eplee for providing the SeaWiFS lunar data and fruitful discussions on the processing of lunar images. We also thank Steven Miller for making his lunar irradiance model publicly available. We also thank the China Scholarship Council for providing a scholarship for this work.
Author Contributions
All authors made contributions to the design of the experiments. Xiangzhao Zeng wrote the programs and performed the experiments, the results were examined by all authors. Xiangzhao Zeng and Xi Shao wrote the manuscript and all authors approved the final manuscript.
Conflicts of Interest
The authors declare no conflict of interest.
References
- Cao, C.; De Luccia, F.J.; Xiong, X.; Wolfe, R.; Weng, F. Early on-orbit performance of the visible infrared imaging radiometer suite onboard the Suomi National Polar-Orbiting Partnership (S-NPP) satellite. IEEE Trans. Geosci. Remote Sens. 2014, 52, 1142–1156. [Google Scholar] [CrossRef]
- Miller, S.D.; Mills, S.P.; Elvidge, C.D.; Lindsey, D.T.; Lee, T.F.; Hawkins, J.D. Suomi satellite brings to light a unique frontier of nighttime environmental sensing capabilities. Proc. Natl. Acad. Sci. USA 2012, 109, 15706–15711. [Google Scholar] [CrossRef] [PubMed]
- Cao, C.; Shao, X.; Uprety, S. Detecting light outages after severe storms using the S-NPP/VIIRS day/night band radiances. IEEE Geosci. Remote Sens. Lett. 2013, 10, 1582–1586. [Google Scholar] [CrossRef]
- Jing, X.; Shao, X.; Cao, C.; Fu, X.; Yan, L. Comparison between the Suomi-NPP day-night band and DMSP-OLS for correlating socio-economic variables at the provincial level in China. Remote Sens. 2016, 8, 17. [Google Scholar] [CrossRef]
- Li, X.; Xu, H.; Chen, X.; Li, C. Potential of NPP-VIIRS nighttime light imagery for modeling the regional economy of China. Remote Sens. 2013, 5, 3057–3081. [Google Scholar] [CrossRef]
- Yu, B.; Shi, K.; Hu, Y.; Huang, C.; Chen, Z.; Wu, J. Poverty evaluation using NPP-VIIRS nighttime light composite data at the county level in China. IEEE J. Sel. Top. Appl. Earth Obs. Remote Sens. 2015, 8, 1217–1229. [Google Scholar] [CrossRef]
- Miller, S.D.; Straka, W.; Mills, S.P.; Elvidge, C.D.; Lee, T.F.; Solbrig, J.; Walther, A.; Heidinger, A.K.; Weiss, S.C. Illuminating the capabilities of the Suomi national polar-orbiting partnership (NPP) visible infrared imaging radiometer suite (VIIRS) day/night band. Remote Sens. 2013, 5, 6717–6766. [Google Scholar] [CrossRef]
- Cao, C.; Xiong, J.; Blonski, S.; Liu, Q.; Uprety, S.; Shao, X.; Bai, Y.; Weng, F. Suomi NPP VIIRS sensor data record verification, validation, and long-term performance monitoring. J. Geophys. Res. Atmos. 2013, 118, 11664–11678. [Google Scholar] [CrossRef]
- Mills, S.; Jacobson, E.; Jaron, J.; McCarthy, J.; Ohnuki, T.; Plonski, M.; Searcy, D.; Weiss, S. Calibration of the VIIRS day/night band (DNB). In Proceedings of the American Meteorological Society 6th Annual Symposium on Future National Operational Environmental Satellite Systems-NPOESS and GOES-R, Atlanta, GA, USA, 17–21 January 2010; Volume 9. [Google Scholar]
- Mills, S.; Weiss, S.; Liang, C. VIIRS day/night band (DNB) stray light characterization and correction. In Proceedings of the SPIE Optical Engineering + Applications, San Diego, CA, USA, 25–29 August 2013. [Google Scholar]
- Liao, L.B.; Weiss, S.; Mills, S.; Hauss, B. Suomi NPP VIIRS day/night band on-orbit performance. J. Geophys. Res. Atmos. 2013, 118, 12705–12718. [Google Scholar] [CrossRef]
- Cao, C.; Bai, Y. Quantitative analysis of VIIRS DNB nightlight point source for light power estimation and stability monitoring. Remote Sens. 2014, 6, 11915–11935. [Google Scholar] [CrossRef]
- Shao, X.; Cao, C.; Uprety, S. Vicarious calibration of S-NPP/VIIRS day-night band. In Proceedings of the SPIE Optical Engineering + Applications, San Diego, CA, USA, 25–29 August 2013. [Google Scholar]
- Qiu, S.; Shao, X.; Cao, C.; Uprety, S. Feasibility demonstration for calibrating Suomi-National Polar-Orbiting Partnership Visible Infrared Imaging Radiometer Suite day/night band using Dome C and Greenland under moon light. J. Appl. Remote Sens. 2016, 10, 016024. [Google Scholar] [CrossRef]
- Lee, S.; Cao, C. Soumi NPP VIIRS Day/Night Band Stray Light characterization and correction using calibration view Data. Remote Sens. 2016, 8, 138. [Google Scholar] [CrossRef]
- Qiu, S.; Shao, X.; Cao, C.; Wang, W. Vicarious validation of straylight correction for VIIRS day/night band using Dome-C. In Proceedings of the SPIE Optical Engineering+ Applications, San Diego, CA, USA, 9–13 August 2015. [Google Scholar]
- Qiu, S.; Shao, X.; Cao, C.Y.; Uprety, S.; Wang, W.H. Assessment of straylight correction performance for the VIIRS Day/Night Band using Dome-C and Greenland under lunar illumination. Int. J. Remote Sens. 2017, 38, 5880–5898. [Google Scholar] [CrossRef]
- Kieffer, H.; Stone, T. The spectral irradiance of the Moon. Astron. J. 2005, 129, 2887–2901. [Google Scholar] [CrossRef]
- Barnes, R.A.; Eplee, R.E.; Patt, F.S.; Kieffer, H.H.; Stone, T.C.; Meister, G.; Butler, J.J.; McClain, C.R. Comparison of SeaWiFS measurements of the Moon with the US Geological Survey lunar model. Appl. Opt. 2004, 43, 5838–5854. [Google Scholar] [CrossRef] [PubMed]
- Eplee, R.E., Jr.; Meister, G.; Patt, F.S.; Franz, B.A.; McClain, C.R. Uncertainty assessment of the SeaWiFS on-orbit calibration. In Proceedings of the SPIE Optical Engineering + Applications, San Diego, CA, USA, 21–25 August 2011. [Google Scholar]
- Sun, J.; Eplee, R.E.; Xiong, X.; Stone, T.; Meister, G.; McClain, C.R. MODIS and SeaWiFS on-orbit lunar calibration. In Proceedings of the SPIE Optical Engineering + Applications, San Diego, CA, USA, 10–14 August 2008. [Google Scholar]
- Eplee, R.E.; Turpie, K.R.; Meister, G.; Patt, F.S.; Fireman, G.F.; Franz, B.A.; McClain, C.R. A synthesis of VIIRS solar and lunar calibrations. In Proceedings of the SPIE Optical Engineering + Applications, San Diego, CA, USA, 25 August 2013. [Google Scholar]
- Thuillier, G.; Hersé, M.; Foujols, T.; Peetermans, W.; Gillotay, D.; Simon, P.C.; Mandel, H. The solar spectral irradiance from 200 to 2400 nm as measured by the SOLSPEC spectrometer from the ATLAS and EURECA missions. Sol. Phys. 2003, 214, 1–22. [Google Scholar] [CrossRef]
- Lane, A.; Irvine, W. Monochromatic phase curves and albedos for the lunar disk. Astron. J. 1973, 78, 267–277. [Google Scholar] [CrossRef]
- Miller, S.; Turner, R. A dynamic lunar spectral irradiance data set for NPOESS/VIIRS day/night band nighttime environmental applications. IEEE Trans. Geosci. Remote Sens. 2009, 47, 2316–2329. [Google Scholar] [CrossRef]
- Cao, C.; Uprety, S.; Xiong, J.; Wu, A.; Jing, P.; Smith, D.; Chander, G.; Fox, N.; Ungar, S. Establishing the Antarctic Dome C community reference standard site towards consistent measurements from Earth observation satellites. Can. J. Remote Sens. 2010, 36, 498–513. [Google Scholar] [CrossRef]
- Warren, S.; Brandt, R.; Hinton, P. Effect of surface roughness on bidirectional reflectance of Antarctic snow. J. Geophys. Res. 1998, 103, 25789–25807. [Google Scholar] [CrossRef]
- Hudson, S.R.; Warren, S.G.; Brandt, R.E.; Grenfell, T.C.; Six, D. Spectral bidirectional reflectance of Antarctic snow: Measurements and parameterization. J. Geophys. Res. 2006, 111. [Google Scholar] [CrossRef]
- Uprety, S.; Cao, C. Radiometric and spectral characterization and comparison of the Antarctic Dome C and Sonoran Desert sites for the calibration and validation of visible and near-infrared radiometers. J. Appl. Remote Sens. 2012, 6, 063541. [Google Scholar] [CrossRef]
- Wu, A.; Xiong, X.; Cao, C. Using BRDF derived from MODIS observations over Dome C to characterize calibration stability and consistency of POS sensors. In Proceedings of the SPIE Optical Engineering + Applications, San Diego, CA, USA, 2–6 August 2009. [Google Scholar]
- NOAA Class—National Oceanic and Atmospheric Administration. Available online: http://www.class.ncdc.noaa.gov (accessed on 9 February 2017).
- Blonski, S.; Cao, C.; Uprety, S.; Shao, X. Using Antarctic Dome C site and simultaneous nadir overpass observations for monitoring radiometric performance of NPP VIIRS instrument. In Proceedings of the 2012 IEEE International Geoscience and Remote Sensing Symposium, Munich, Germany, 22–27 July 2012; pp. 1061–1064. [Google Scholar]
- Uprety, S.; Cao, C. Using the Dome C site to characterize AVHRR near-infrared channel for consistent radiometric calibration. In Proceedings of the SPIE Optical Engineering + Applications, San Diego, CA, USA, 21–25 August 2011. [Google Scholar] [CrossRef]
- Miller, S.D.; Combs, C.; Wagner, S.; Viticchiè, B.; Walther, A.; Solbrig, J. Validation and refinement of a lunar irradiance model for Suomi NPP VIIRS Day-Night Band quantitative nighttime applications. In Proceedings of the AGU Fall Meeting, San Francisco, CA, USA, 15–19 December 2014; Volume 1, p. 3. [Google Scholar]
- Woodward, R. Modeling of the SeaWiFS Solar and Lunar Observations. National Aeronautics and Space Administration, Goddard Space Flight Center: Greenbelt, MD, USA, 1993. [Google Scholar]
- Barnes, R.; Eplee, R.; Patt, F. SeaWiFS measurements of the Moon. In Proceedings of the SPIE Remote Sensing, Barcelona, Spain, 21–25 September 1998; pp. 311–324. [Google Scholar]
- Barnes, R.A.; Eplee, R.E., Jr.; Patt, F.S.; McClain, C.R. Changes in the radiometric sensitivity of SeaWiFS determined from lunar and solar-based measurements. Appl. Opt. 1999, 38, 4649–4664. [Google Scholar] [CrossRef] [PubMed]
- Kieffer, H.; Anderson, J.; Becker, K. Radiometric calibration of spacecraft using small lunar images. In Proceedings of the SPIE Remote Sensing, Florence, Italy, 20–23 September 1999; pp. 193–205. [Google Scholar]
- Nicodemus, F.E.; Stati Uniti d’America. National Bureau of Standards. Geometrical Considerations and Nomenclature for Reflectance; National Bureau of Standards, US Department of Commerce: Washington, DC, USA, 1977.
- Schaepman-Strub, G.; Schaepman, M.E.; Painter, T.H.; Dangel, S.; Martonchik, J.V. Reflectance quantities in optical remote sensing-definitions and case studies. Remote Sens. Environ. 2006, 103, 27–42. [Google Scholar] [CrossRef]
- Xiong, X.; Wu, A.; Wenny, B. Using Dome C for moderate resolution imaging spectroradiometer calibration stability and consistency. J. Appl. Remote Sens. 2009, 3, 033520. [Google Scholar] [CrossRef]
- Uprety, S.; Cao, C. A comparison of the Antarctic Dome C and Sonoran Desert sites for the cal/val of visible and near infrared radiometers. In Proceedings of the SPIE Optical Engineering + Applications, San Diego, CA, USA, 1–5 August 2010. [Google Scholar]
- Wang, W.; Cao, C. Monitoring the NOAA operational VIIRS RSB and DNB calibration stability using monthly and semi-monthly deep convective clouds time series. Remote Sens. 2016, 8, 32. [Google Scholar] [CrossRef]
- Xiong, X.; Butler, J.; Chiang, K.; Efremova, B.; Fulbright, J.; Lei, N.; McIntire, J.; Oudrari, H.; Sun, J.; Wang, Z.; et al. VIIRS on-orbit calibration methodology and performance. J. Geophys. Res. 2014, 119, 5065–5078. [Google Scholar] [CrossRef]
- Lei, N.; Xiong, X.; Guenther, B. Modeling the detector radiometric gains of the Suomi NPP VIIRS reflective solar bands. IEEE Trans. Geosci. Remote Sens. 2015, 53, 1565–1573. [Google Scholar] [CrossRef]
- De Luccia, F.; Moyer, D.; Johnson, E.; Rausch, K.; Lei, N.; Chiang, K.; Xiong, X.; Fulbright, J.; Haas, E.; Iona, G. Discovery and characterization of on-orbit degradation of the visible infrared imaging radiometer suite (VIIRS) rotating telescope assembly (RTA). In Proceedings of the SPIE Optical Engineering + Applications, San Diego, CA, USA, 12–16 August 2012. [Google Scholar]
- Ciofalo, M.R.; Fuqua, P.D.; Barrie, J.D.; Meshishnek, M.J.; Chu, C.T.; Chaney, J.A.; Moision, R.M. Root cause determination of on-orbit degradation of the VIIRS rotating telescope assembly. In Proceedings of the SPIE Optical Engineering + Applications, San Diego, CA, USA, 12–16 August 2012. [Google Scholar]
- Lee, S.; Chiang, K.; Xiong, X.; Sun, C.; Anderson, S. The S-NPP VIIRS Day-Night Band on-orbit calibration/characterization and current state of SDR products. Remote Sens. 2014, 6, 12427–12446. [Google Scholar] [CrossRef]
- Eplee, R.E.; Barnes, R.A.; Patt, F.S.; Meister, G.; McClain, C.R. SeaWiFS lunar calibration methodology after six years on orbit. In Proceedings of the SPIE, Denver, CO, USA, 2–6 August 2004; pp. 1–13. [Google Scholar]
- Schaaf, C.B.; Liu, J.; Gao, F.; Strahler, A.H. Aqua and Terra MODIS albedo and reflectance anisotropy products. In Land Remote Sensing and Global Environmental Change. NASA’s Earth Observing System and the Science of ASTER and MODIS; Ramachandran, B., Justice, C.O., Abrams, M.J., Eds.; Springer-Verlag: New York, NY, USA, 2010; pp. 549–561. [Google Scholar]
- Schaaf, C.B.; Gao, F.; Strahler, A.H.; Lucht, W.; Li, X.; Tsang, T.; Strugnell, N.C.; Zhang, X.; Jin, Y.; Muller, J.-P.; et al. First operational BRDF, albedo nadir reflectance products from MODIS. Remote Sens. Environ. 2002, 83, 135–148. [Google Scholar] [CrossRef]
Figure 1.
Observations of Dome C under moonlight in different lunar phases. (a) 5.89 degrees; (b) 20.76 degrees; (c) 32.14 degrees; and (d) 50.81 degrees.
Figure 1.
Observations of Dome C under moonlight in different lunar phases. (a) 5.89 degrees; (b) 20.76 degrees; (c) 32.14 degrees; and (d) 50.81 degrees.

Figure 2.
(a) The distribution of the Moon and the Visible Infrared Imager Radiometer Suite (VIIRS) DNB in polar coordinates; and (b) the distribution of the VIIRS DNB relative to the Moon in polar coordinates.
Figure 2.
(a) The distribution of the Moon and the Visible Infrared Imager Radiometer Suite (VIIRS) DNB in polar coordinates; and (b) the distribution of the VIIRS DNB relative to the Moon in polar coordinates.
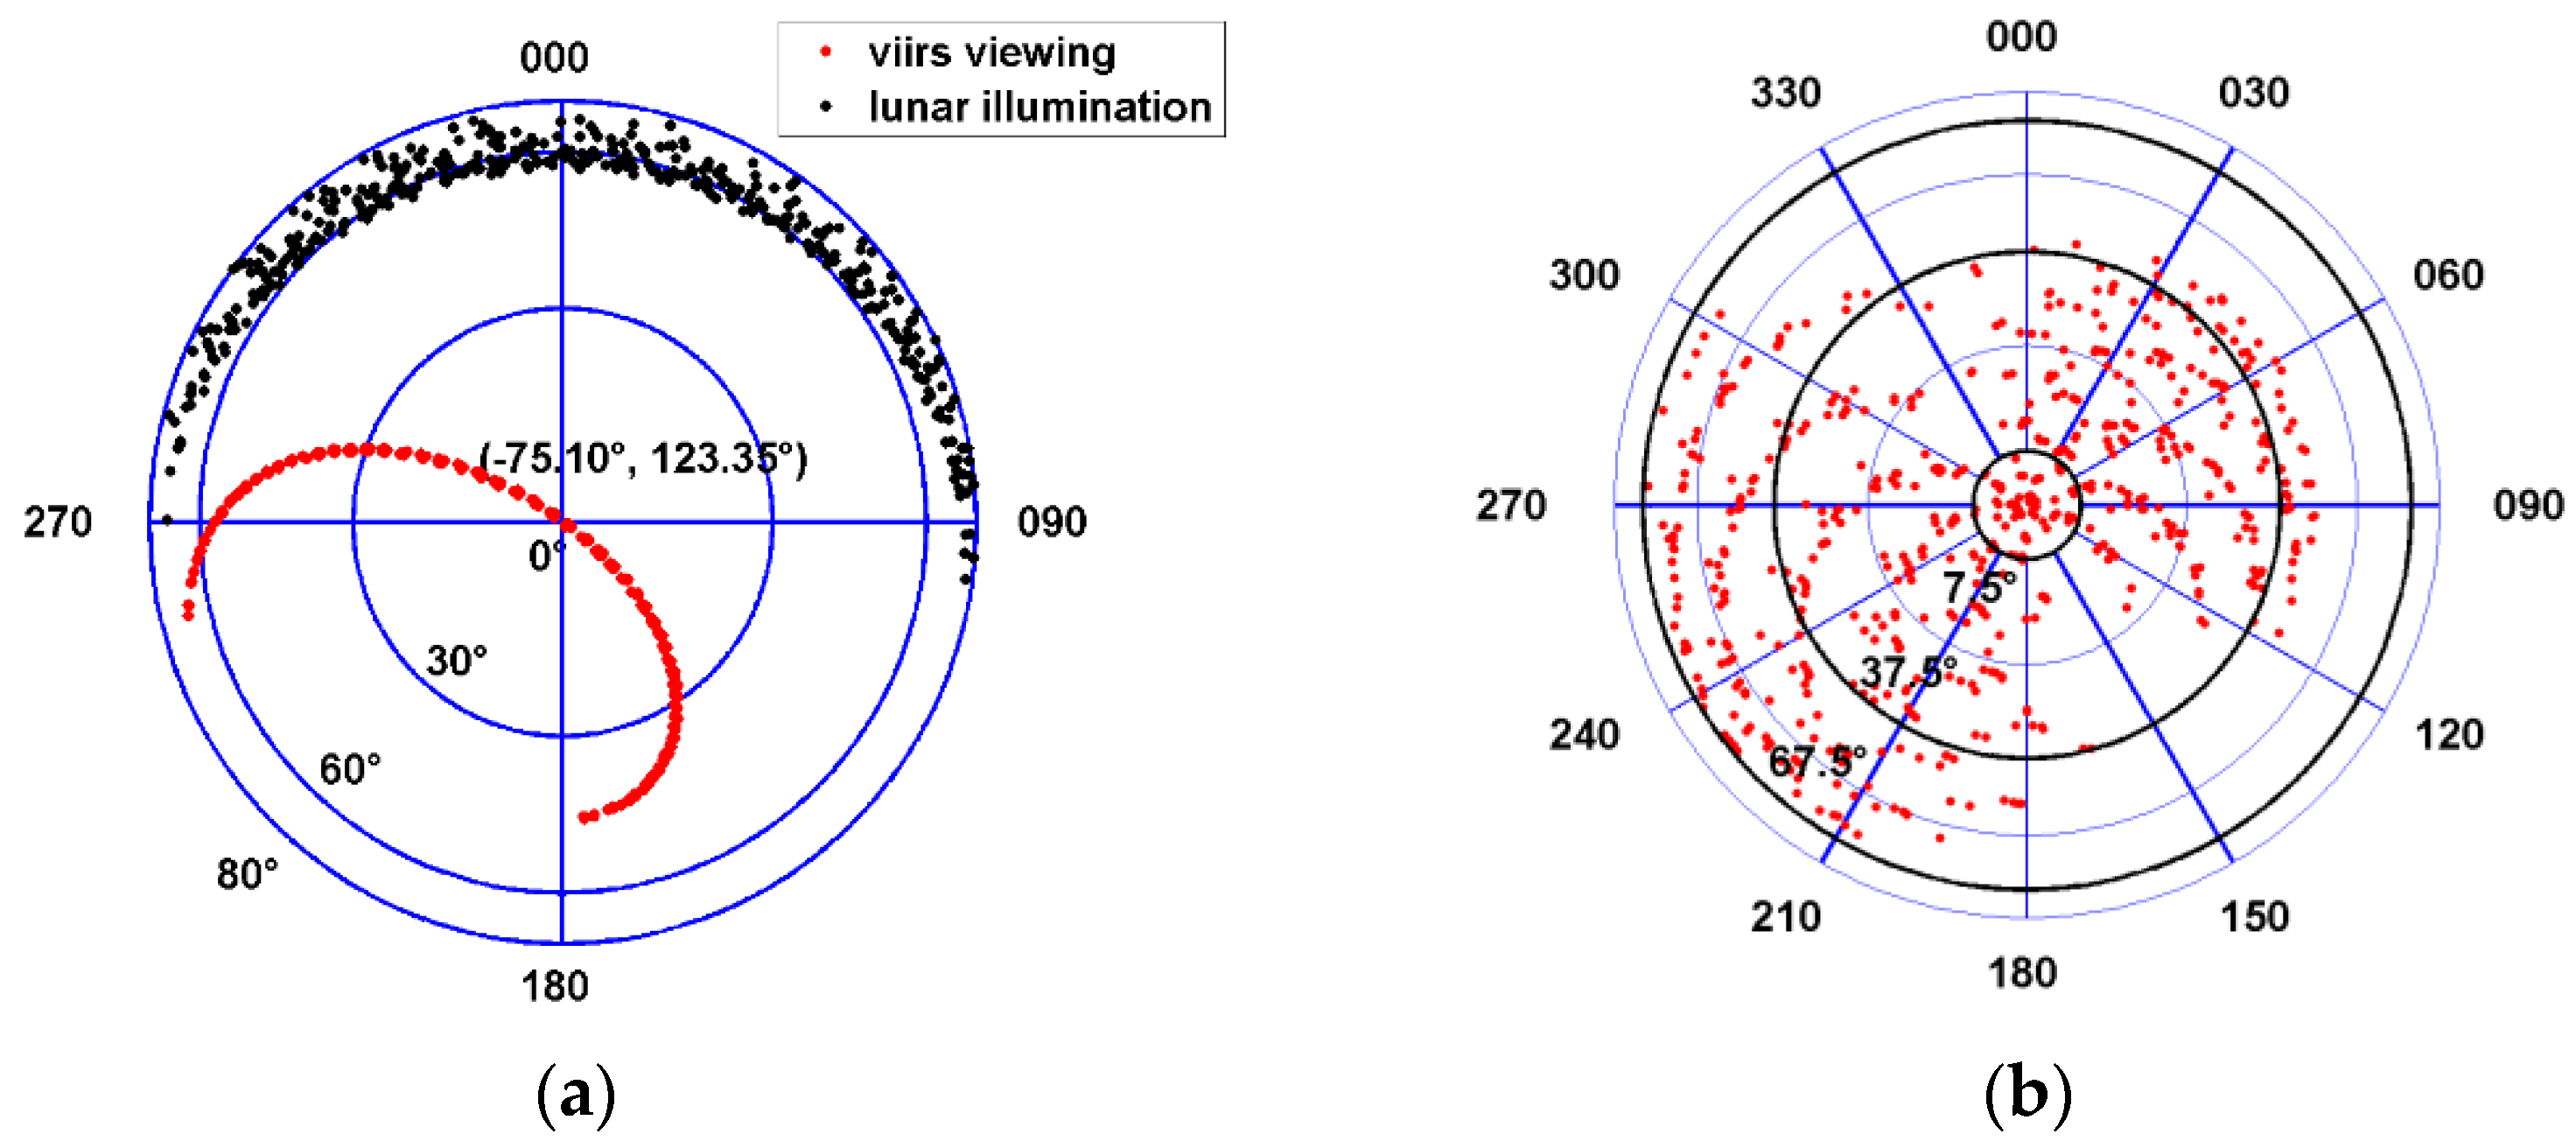
Figure 3.
The top of atmosphere (TOA) lunar irradiance spectral curves under different lunar phase produced by the Miller and Turner 2009 (MT2009) lunar irradiance model.
Figure 3.
The top of atmosphere (TOA) lunar irradiance spectral curves under different lunar phase produced by the Miller and Turner 2009 (MT2009) lunar irradiance model.

Figure 4.
(a) Example of the imagery of SeaWiFS lunar observations; and (b) the sum of lunar radiance over all samples along each scan vs. the scan line number.
Figure 4.
(a) Example of the imagery of SeaWiFS lunar observations; and (b) the sum of lunar radiance over all samples along each scan vs. the scan line number.
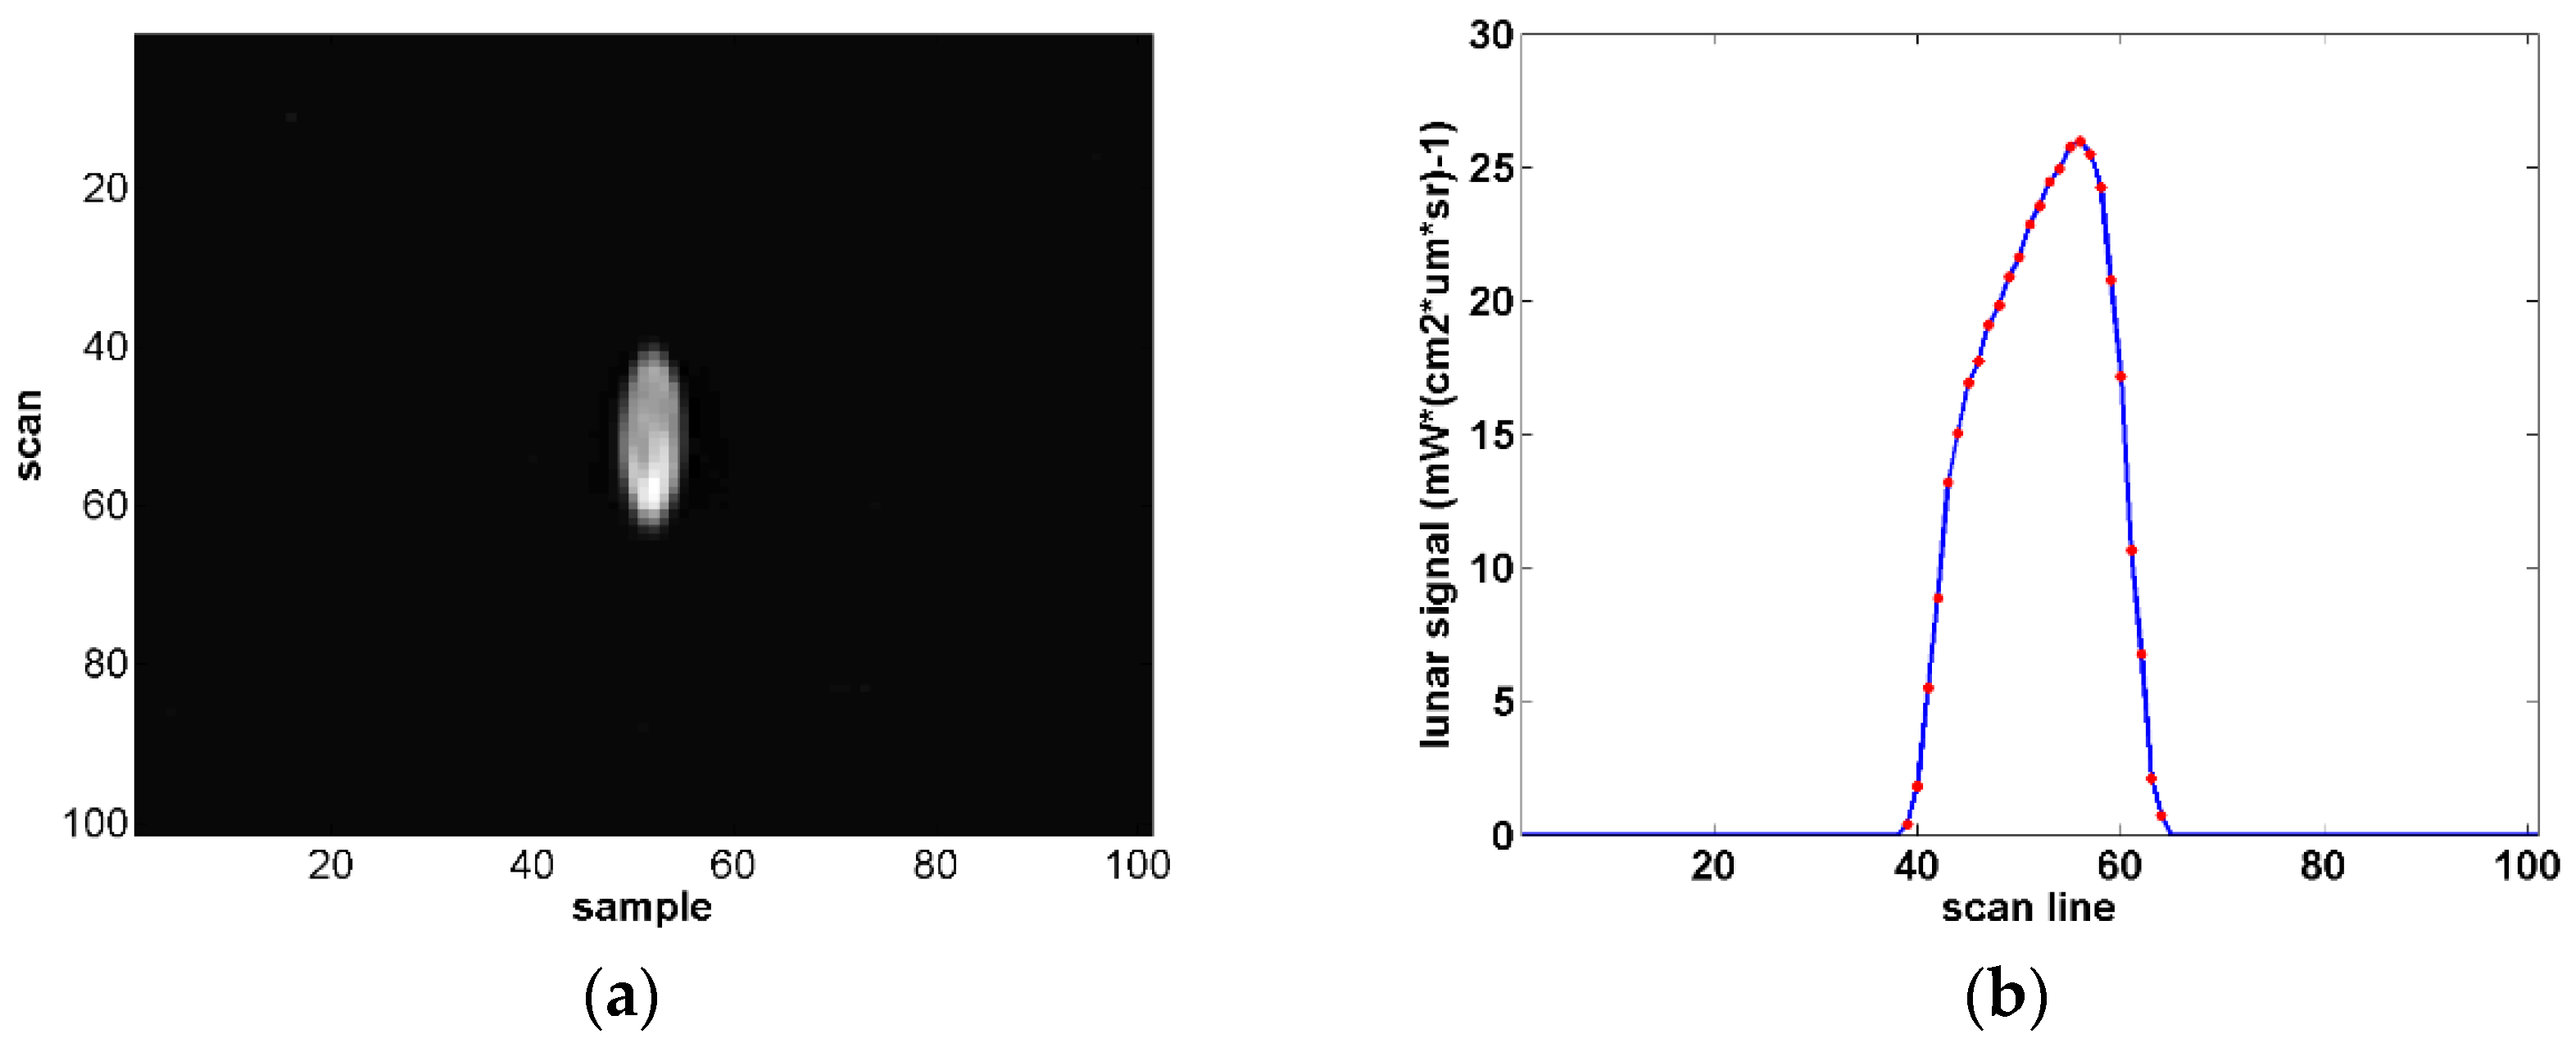
Figure 5.
The definitions of the lunar zenith angle (θ0), viewing zenith angle (θv), lunar azimuth angle (ϕ0), viewing azimuth angle (ϕv), and relative azimuth angle (ϕ).
Figure 5.
The definitions of the lunar zenith angle (θ0), viewing zenith angle (θv), lunar azimuth angle (ϕ0), viewing azimuth angle (ϕv), and relative azimuth angle (ϕ).

Figure 6.
The modeled anisotropic reflectance factor of Dome C in the DNB spectral region (RDNB-S) derived from the Hudson model, for cases with lunar zenith equal to (a) 60 degrees; (b) 65 degrees; (c) 70 degrees; and (d) 75 degrees.
Figure 6.
The modeled anisotropic reflectance factor of Dome C in the DNB spectral region (RDNB-S) derived from the Hudson model, for cases with lunar zenith equal to (a) 60 degrees; (b) 65 degrees; (c) 70 degrees; and (d) 75 degrees.

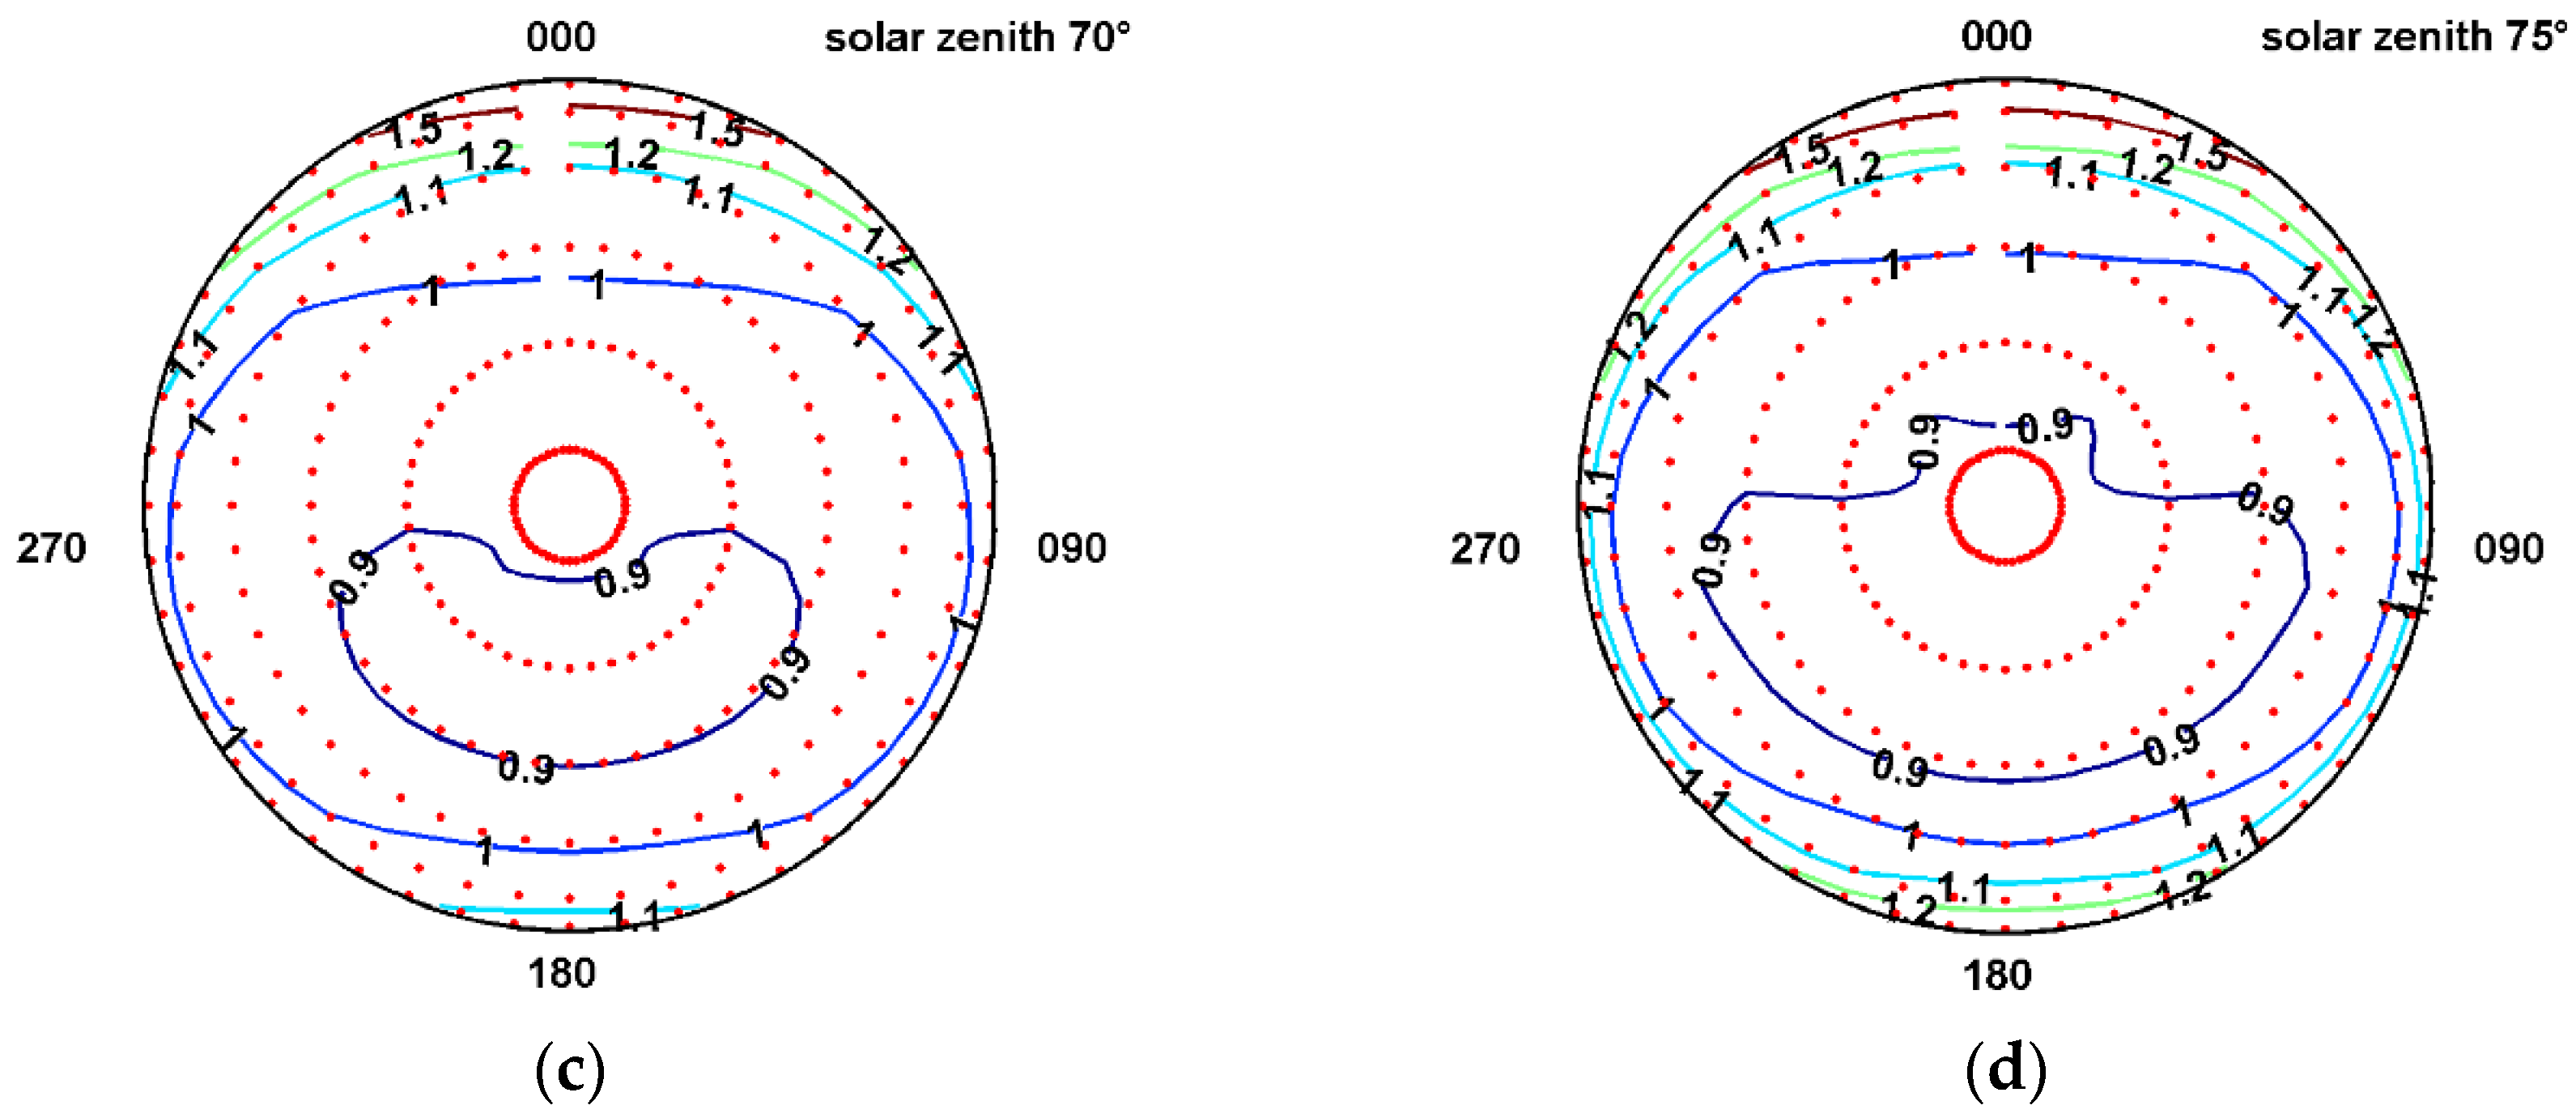
Figure 7.
(a) The trends of nighttime TOA reflectance factor rDNB-MT at the Dome C site from 2012 to 2017; (b) the DNB RSR used in the IDPS data archive before and after 22 April 2013.
Figure 7.
(a) The trends of nighttime TOA reflectance factor rDNB-MT at the Dome C site from 2012 to 2017; (b) the DNB RSR used in the IDPS data archive before and after 22 April 2013.
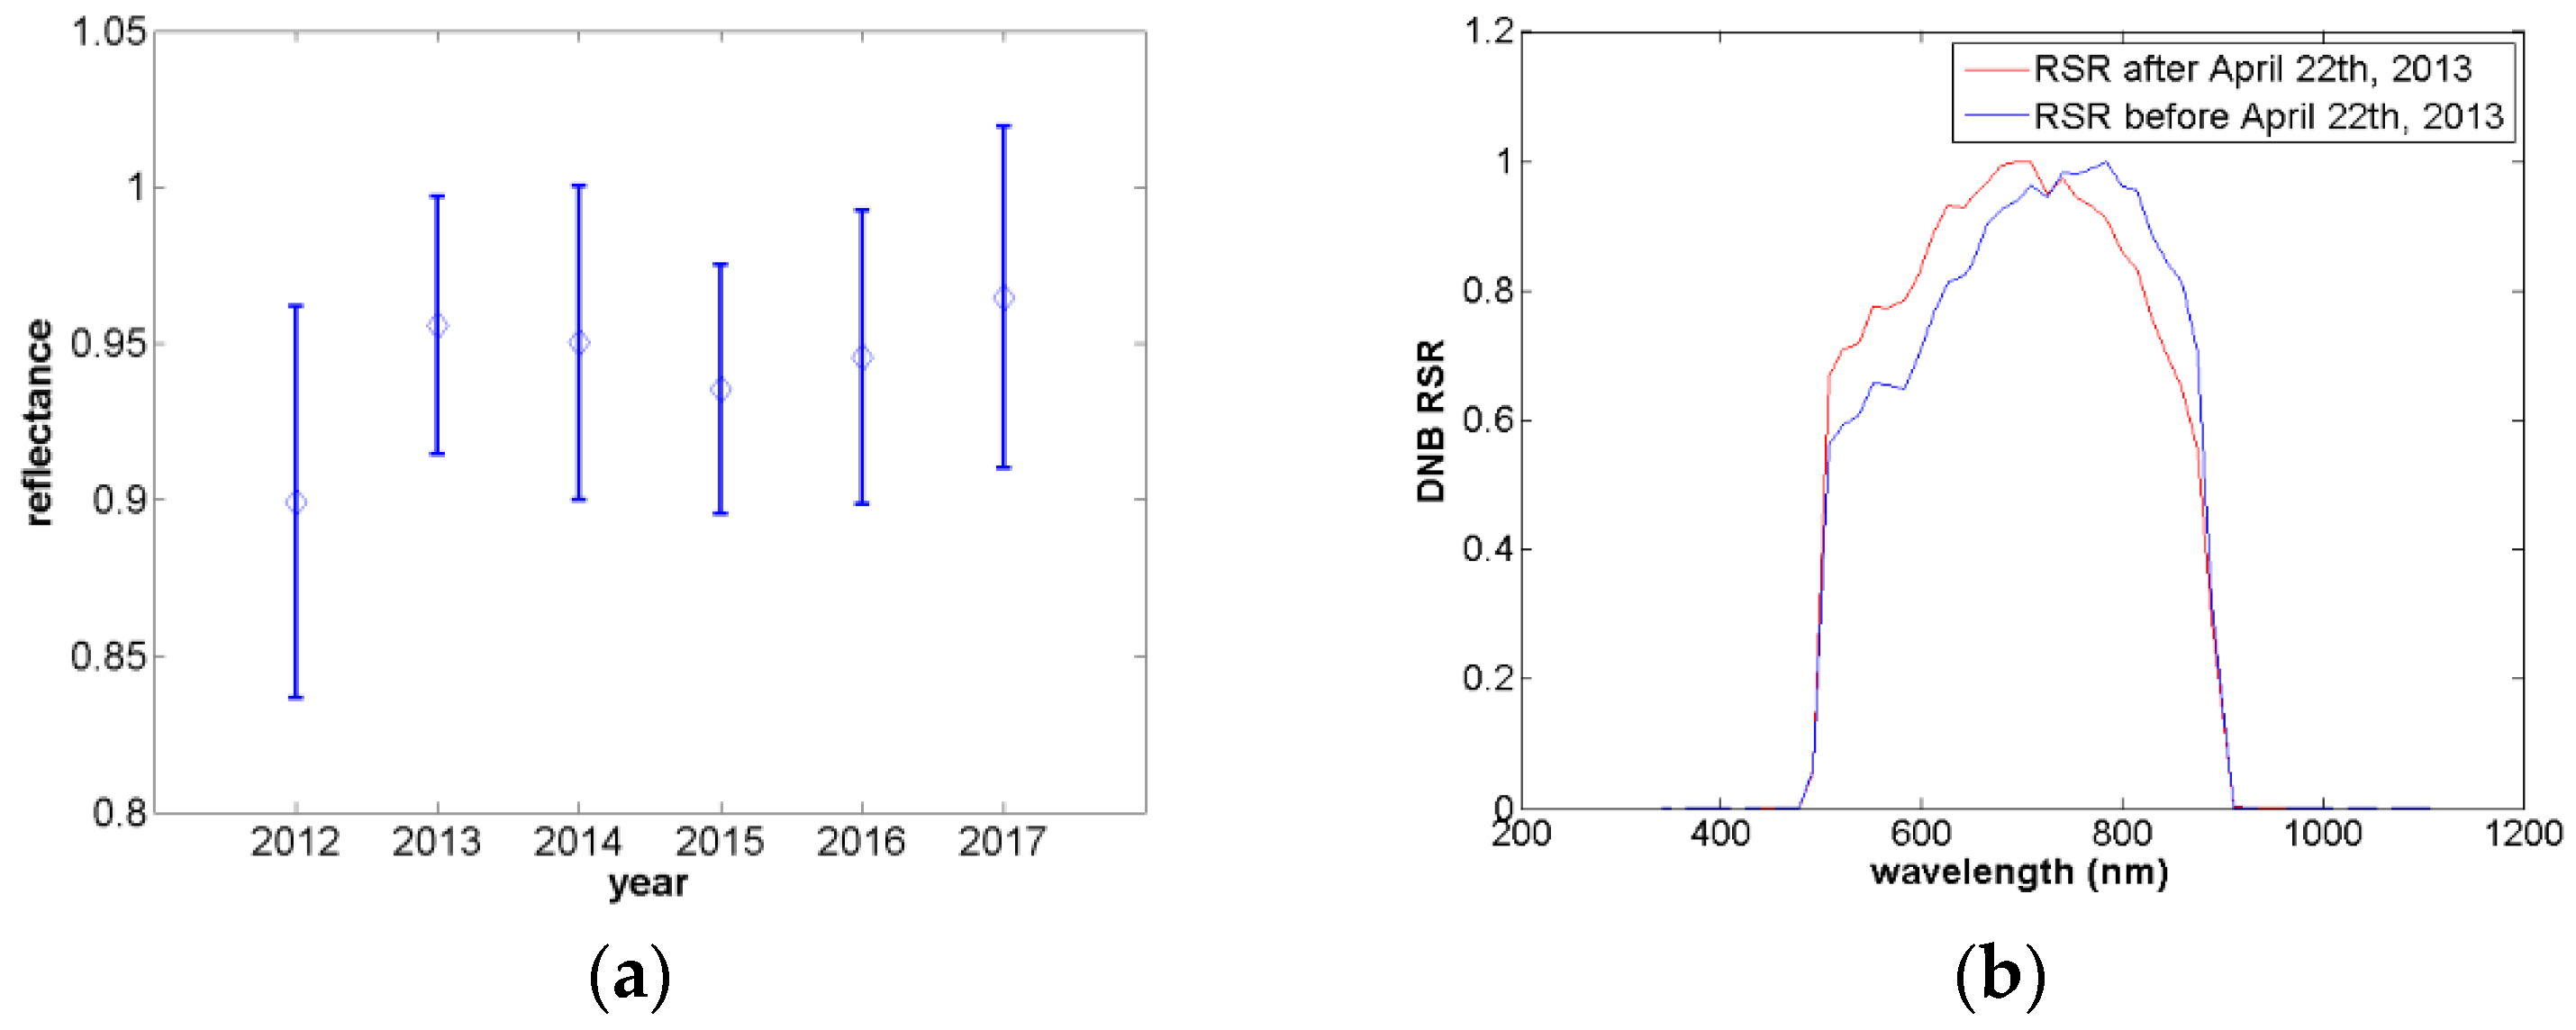
Figure 8.
The distribution of the TOA rDNB-MT reflectance factor under different lunar phase angles. (a) 2015; and (b) 2016.
Figure 8.
The distribution of the TOA rDNB-MT reflectance factor under different lunar phase angles. (a) 2015; and (b) 2016.

Figure 9.
The bias δb between the SeaWiFS lunar observations and the MT2009 model. (a) The absolute lunar phase lower than 10 degrees; and (b) the absolute lunar phase larger than 20 degrees.
Figure 9.
The bias δb between the SeaWiFS lunar observations and the MT2009 model. (a) The absolute lunar phase lower than 10 degrees; and (b) the absolute lunar phase larger than 20 degrees.
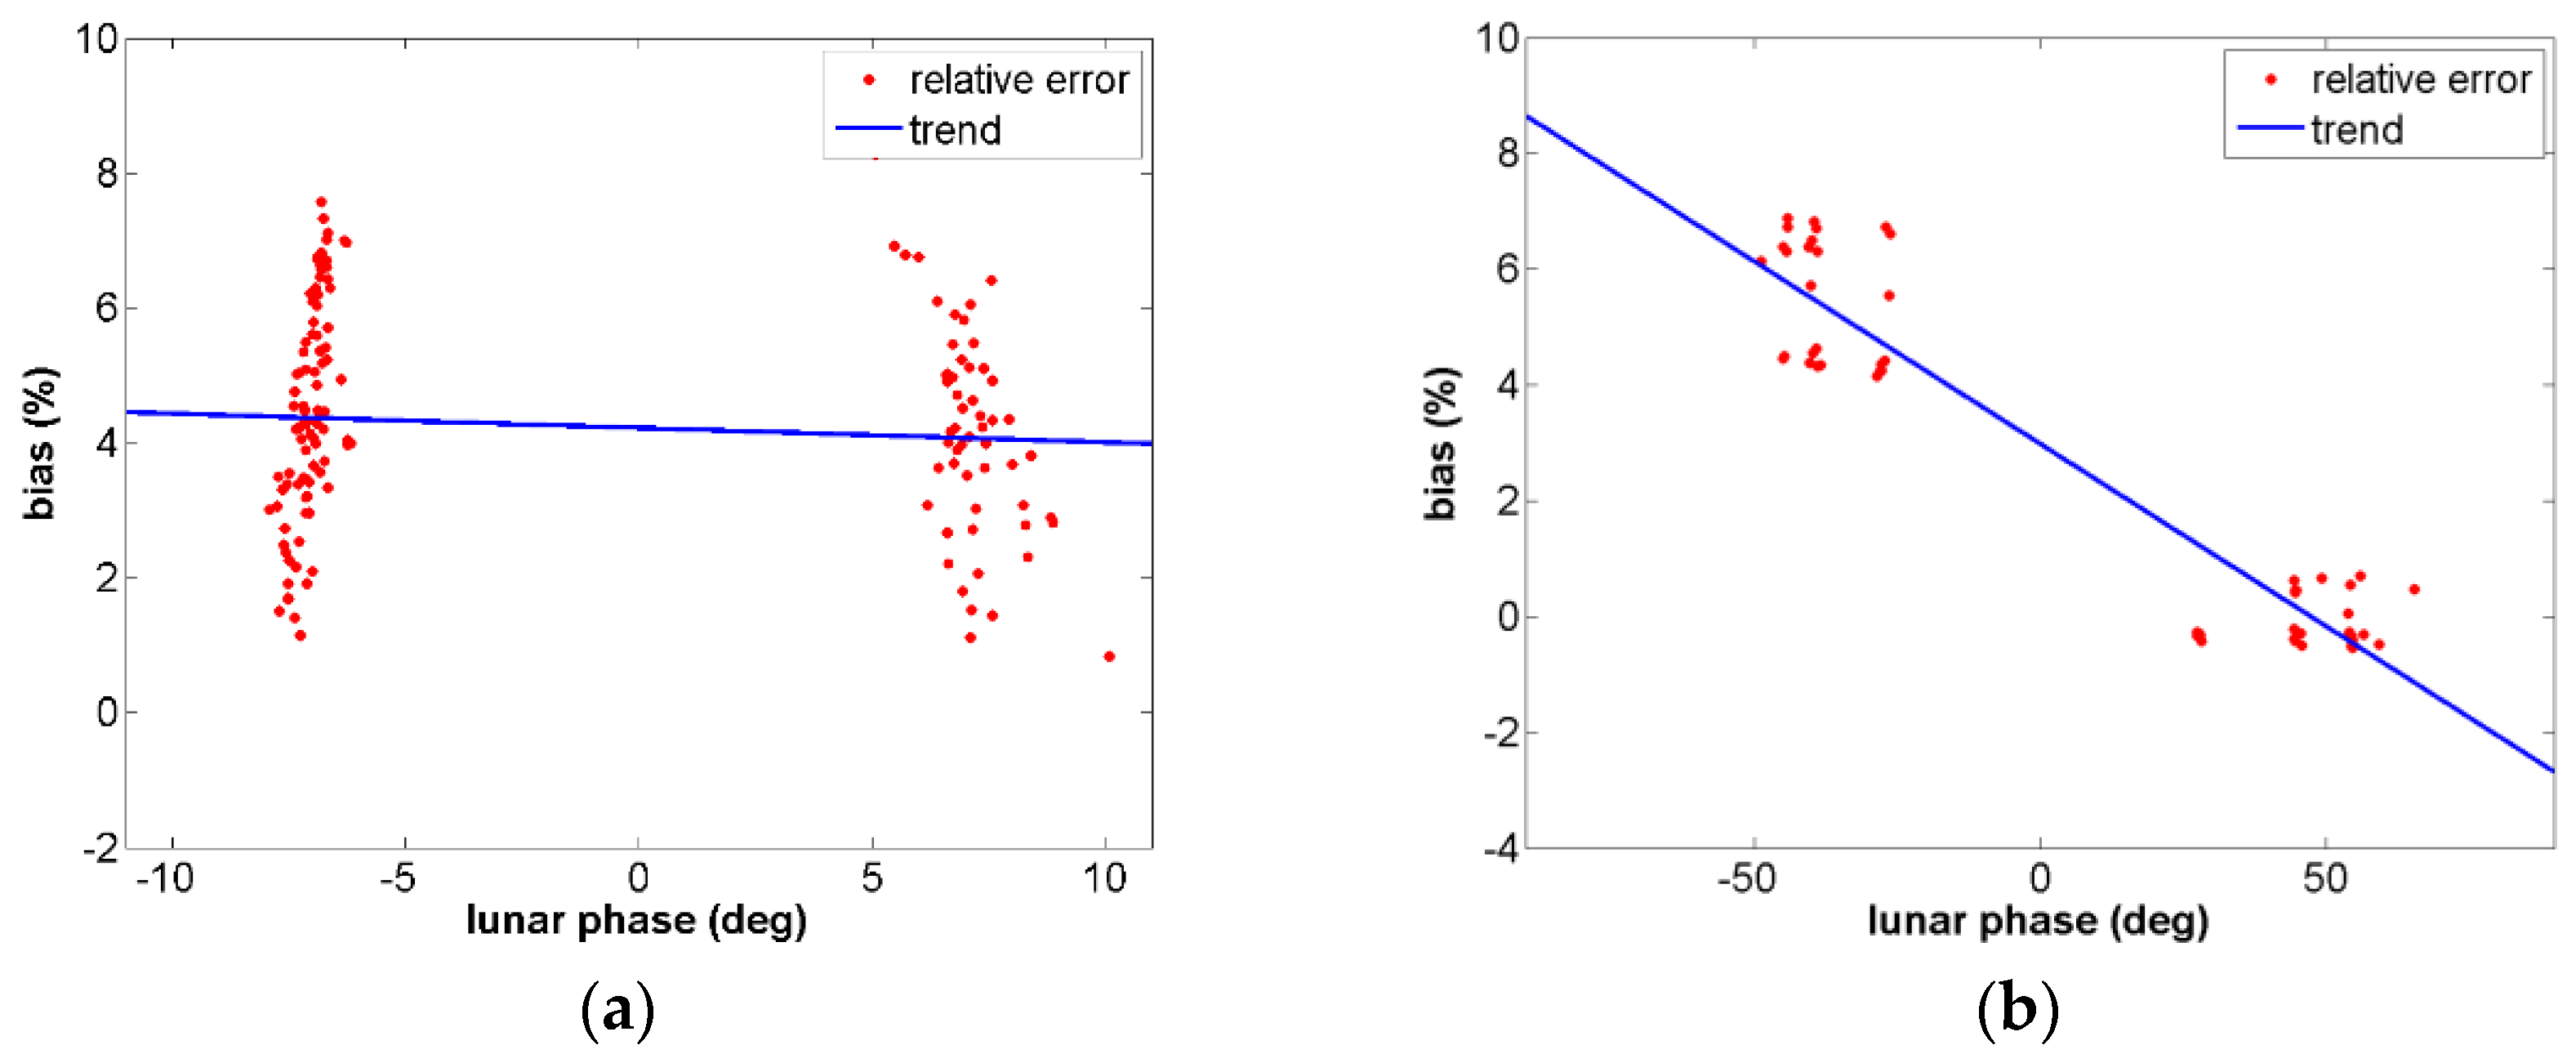
Figure 10.
The correction factor under the lunar phase from −90 to 90 degrees.

Figure 11.
The removal of lunar phase dependence from the nighttime TOA reflectance factor from 2013 to 2017 at Dome C; (a) The plot of rDNB-MT vs. Φ; (b) The plot of rDNB-MT-SWC vs. Φ.
Figure 11.
The removal of lunar phase dependence from the nighttime TOA reflectance factor from 2013 to 2017 at Dome C; (a) The plot of rDNB-MT vs. Φ; (b) The plot of rDNB-MT-SWC vs. Φ.

Figure 12.
The bias between corrected TOA R and the Hudson BRDF model under lunar zenith angle between 53 and 80 degrees.
Figure 12.
The bias between corrected TOA R and the Hudson BRDF model under lunar zenith angle between 53 and 80 degrees.
Figure 13.
The comparison between RDNB-T and RDNB-S at Dome C. (a–e) plot of correlation between RDNB-T and RDNB-S for various lunar zenith angles; (f) The comparison of observation geometry between the DNB and the Hudson BRDF model; (g) The comparison of observation geometry between the DNB and the Hudson BRDF model for lunar zenith angle between 70 and 80 degrees.
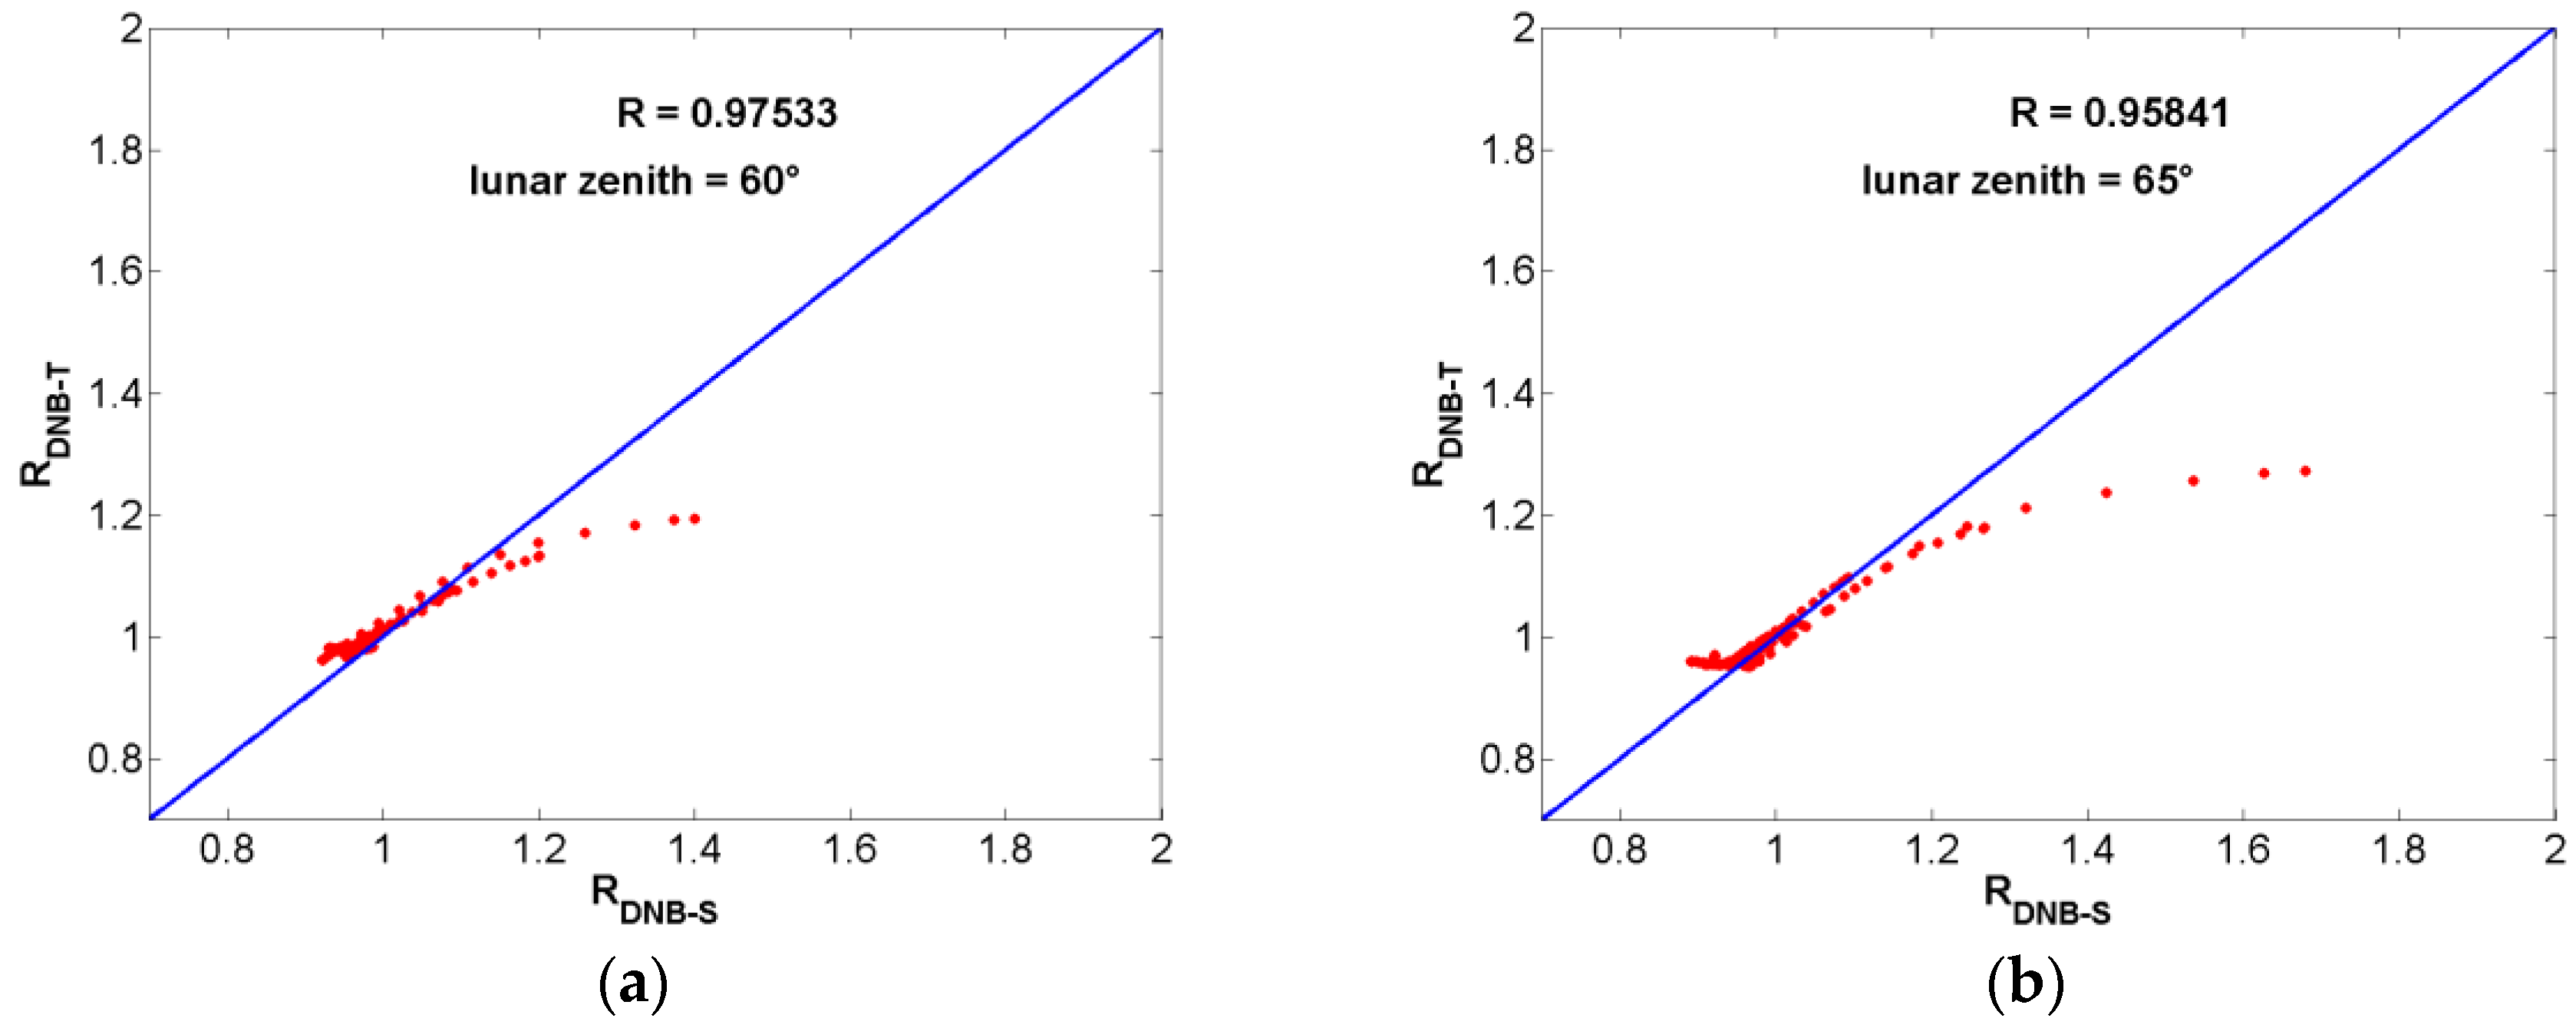
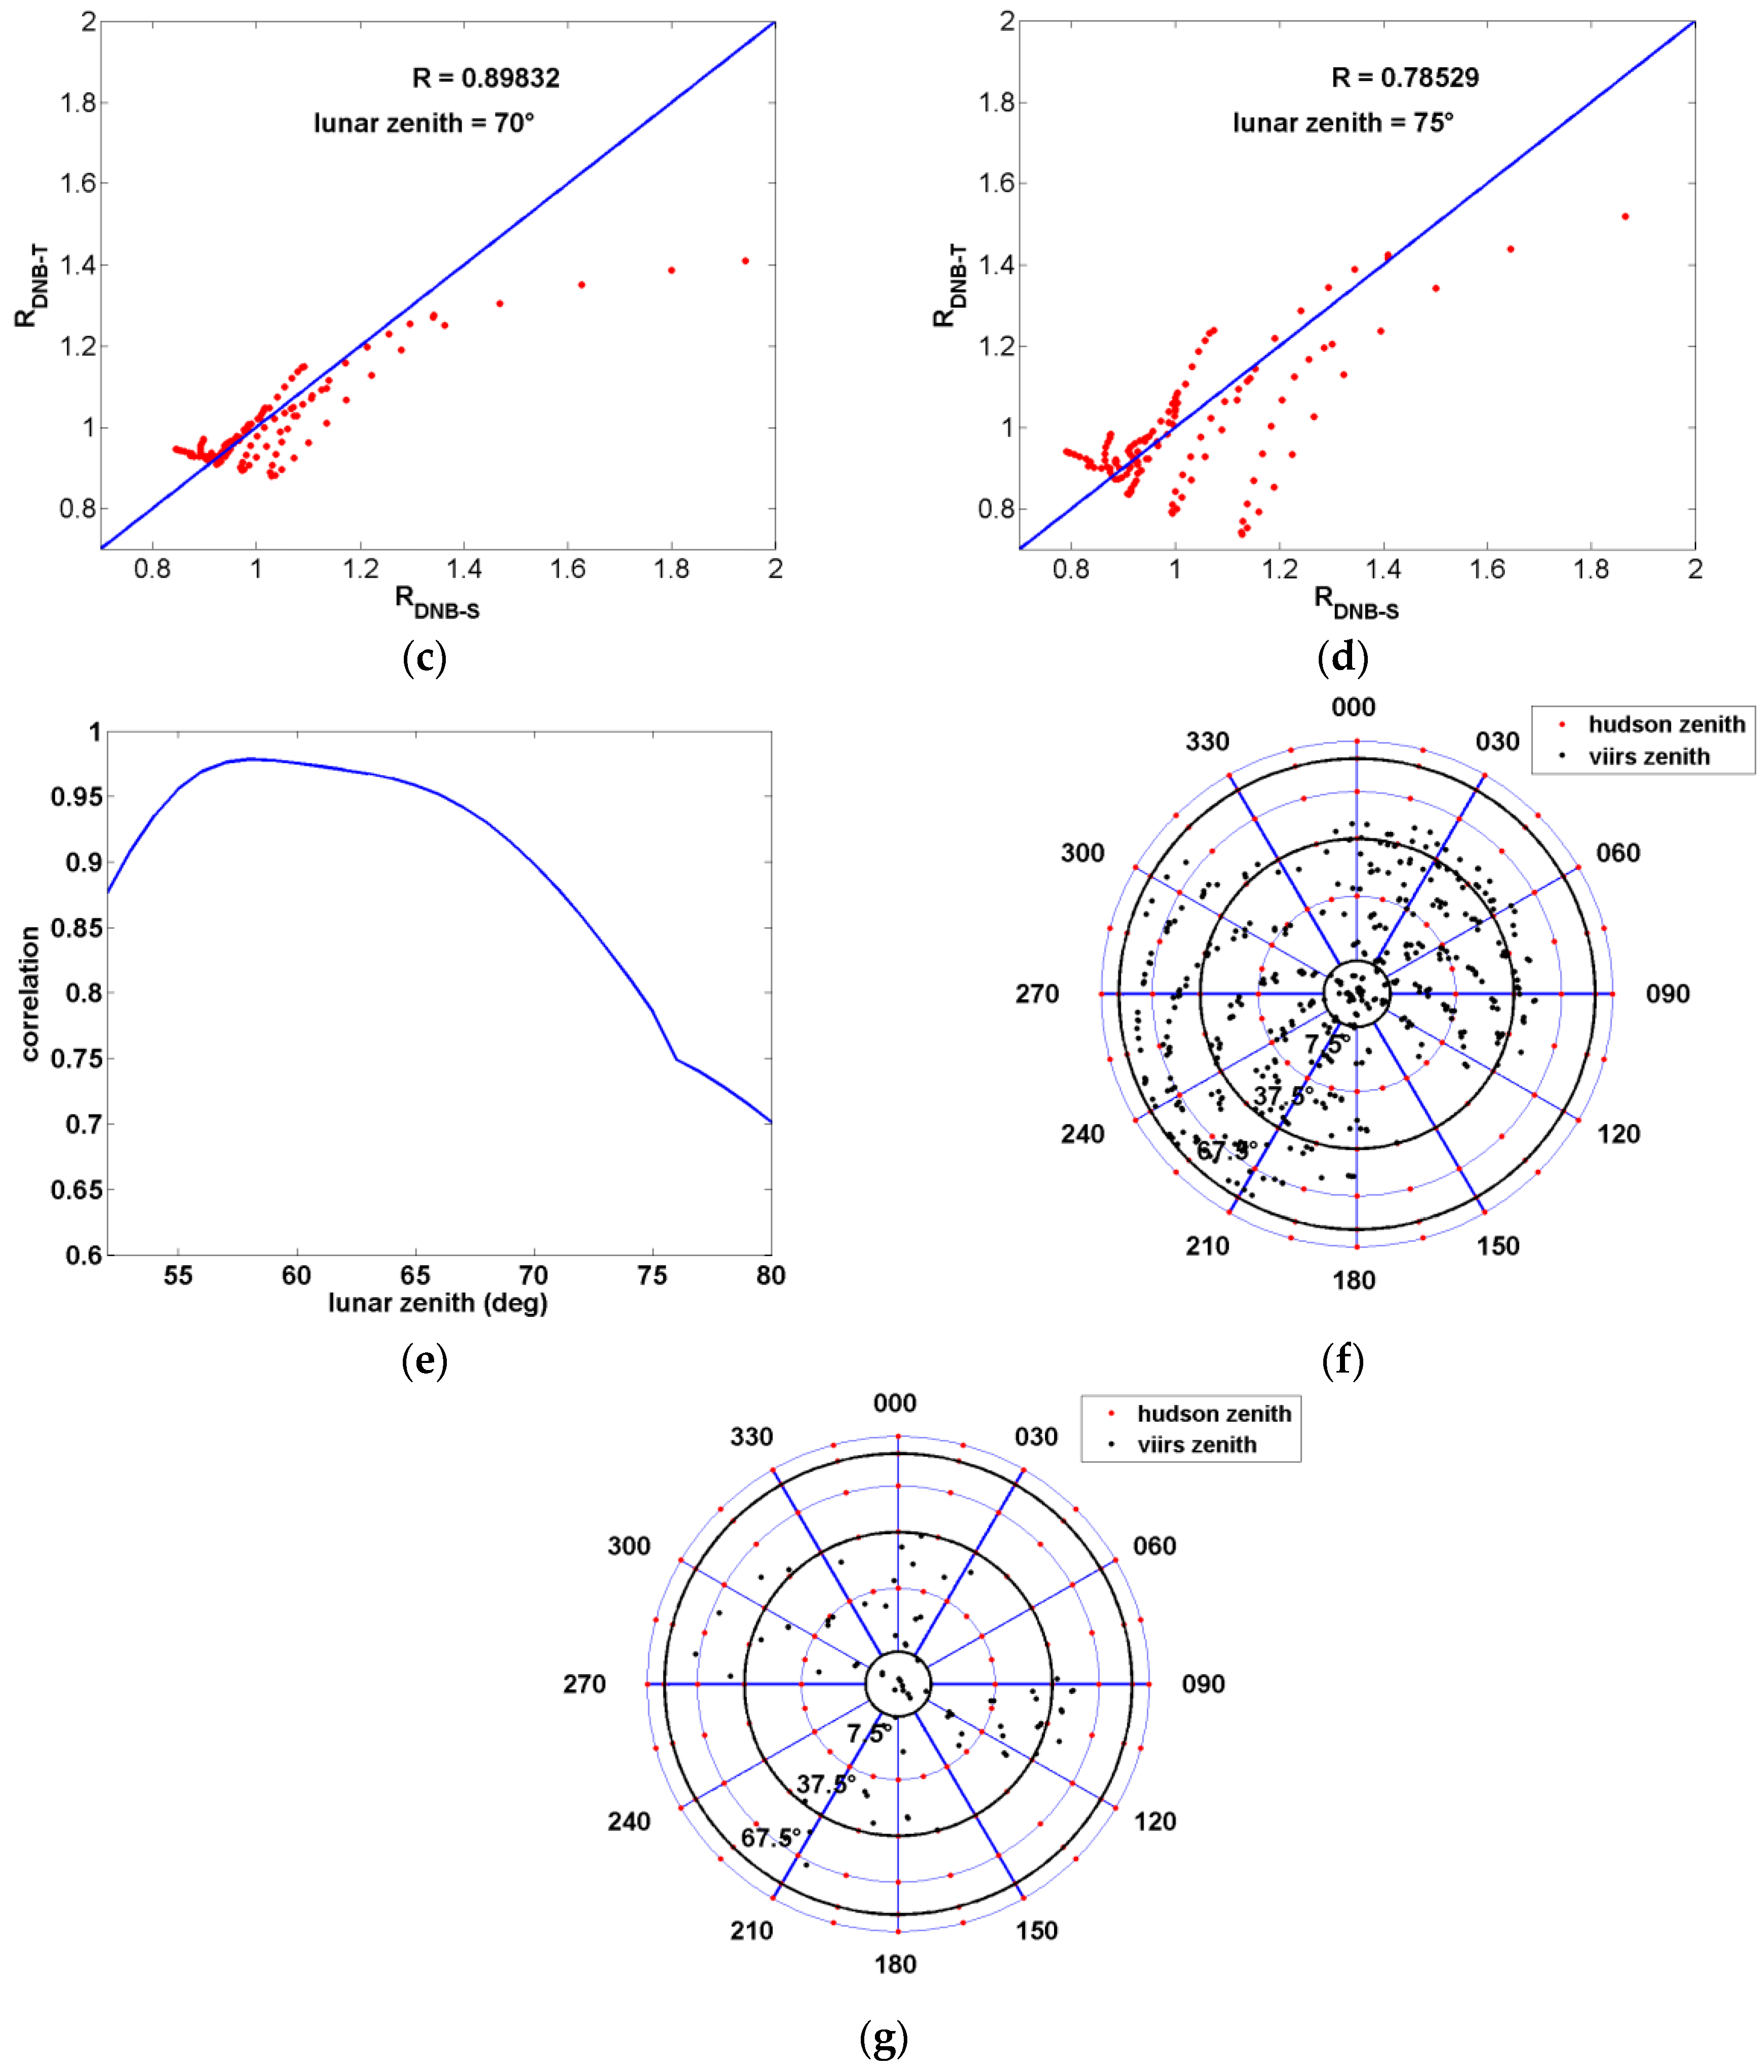
Figure 14.
(a–d) the contour of RDNB-T at Dome C and (e–h) the contour of bias between RDNB-T and RDNB-S.
Figure 14.
(a–d) the contour of RDNB-T at Dome C and (e–h) the contour of bias between RDNB-T and RDNB-S.
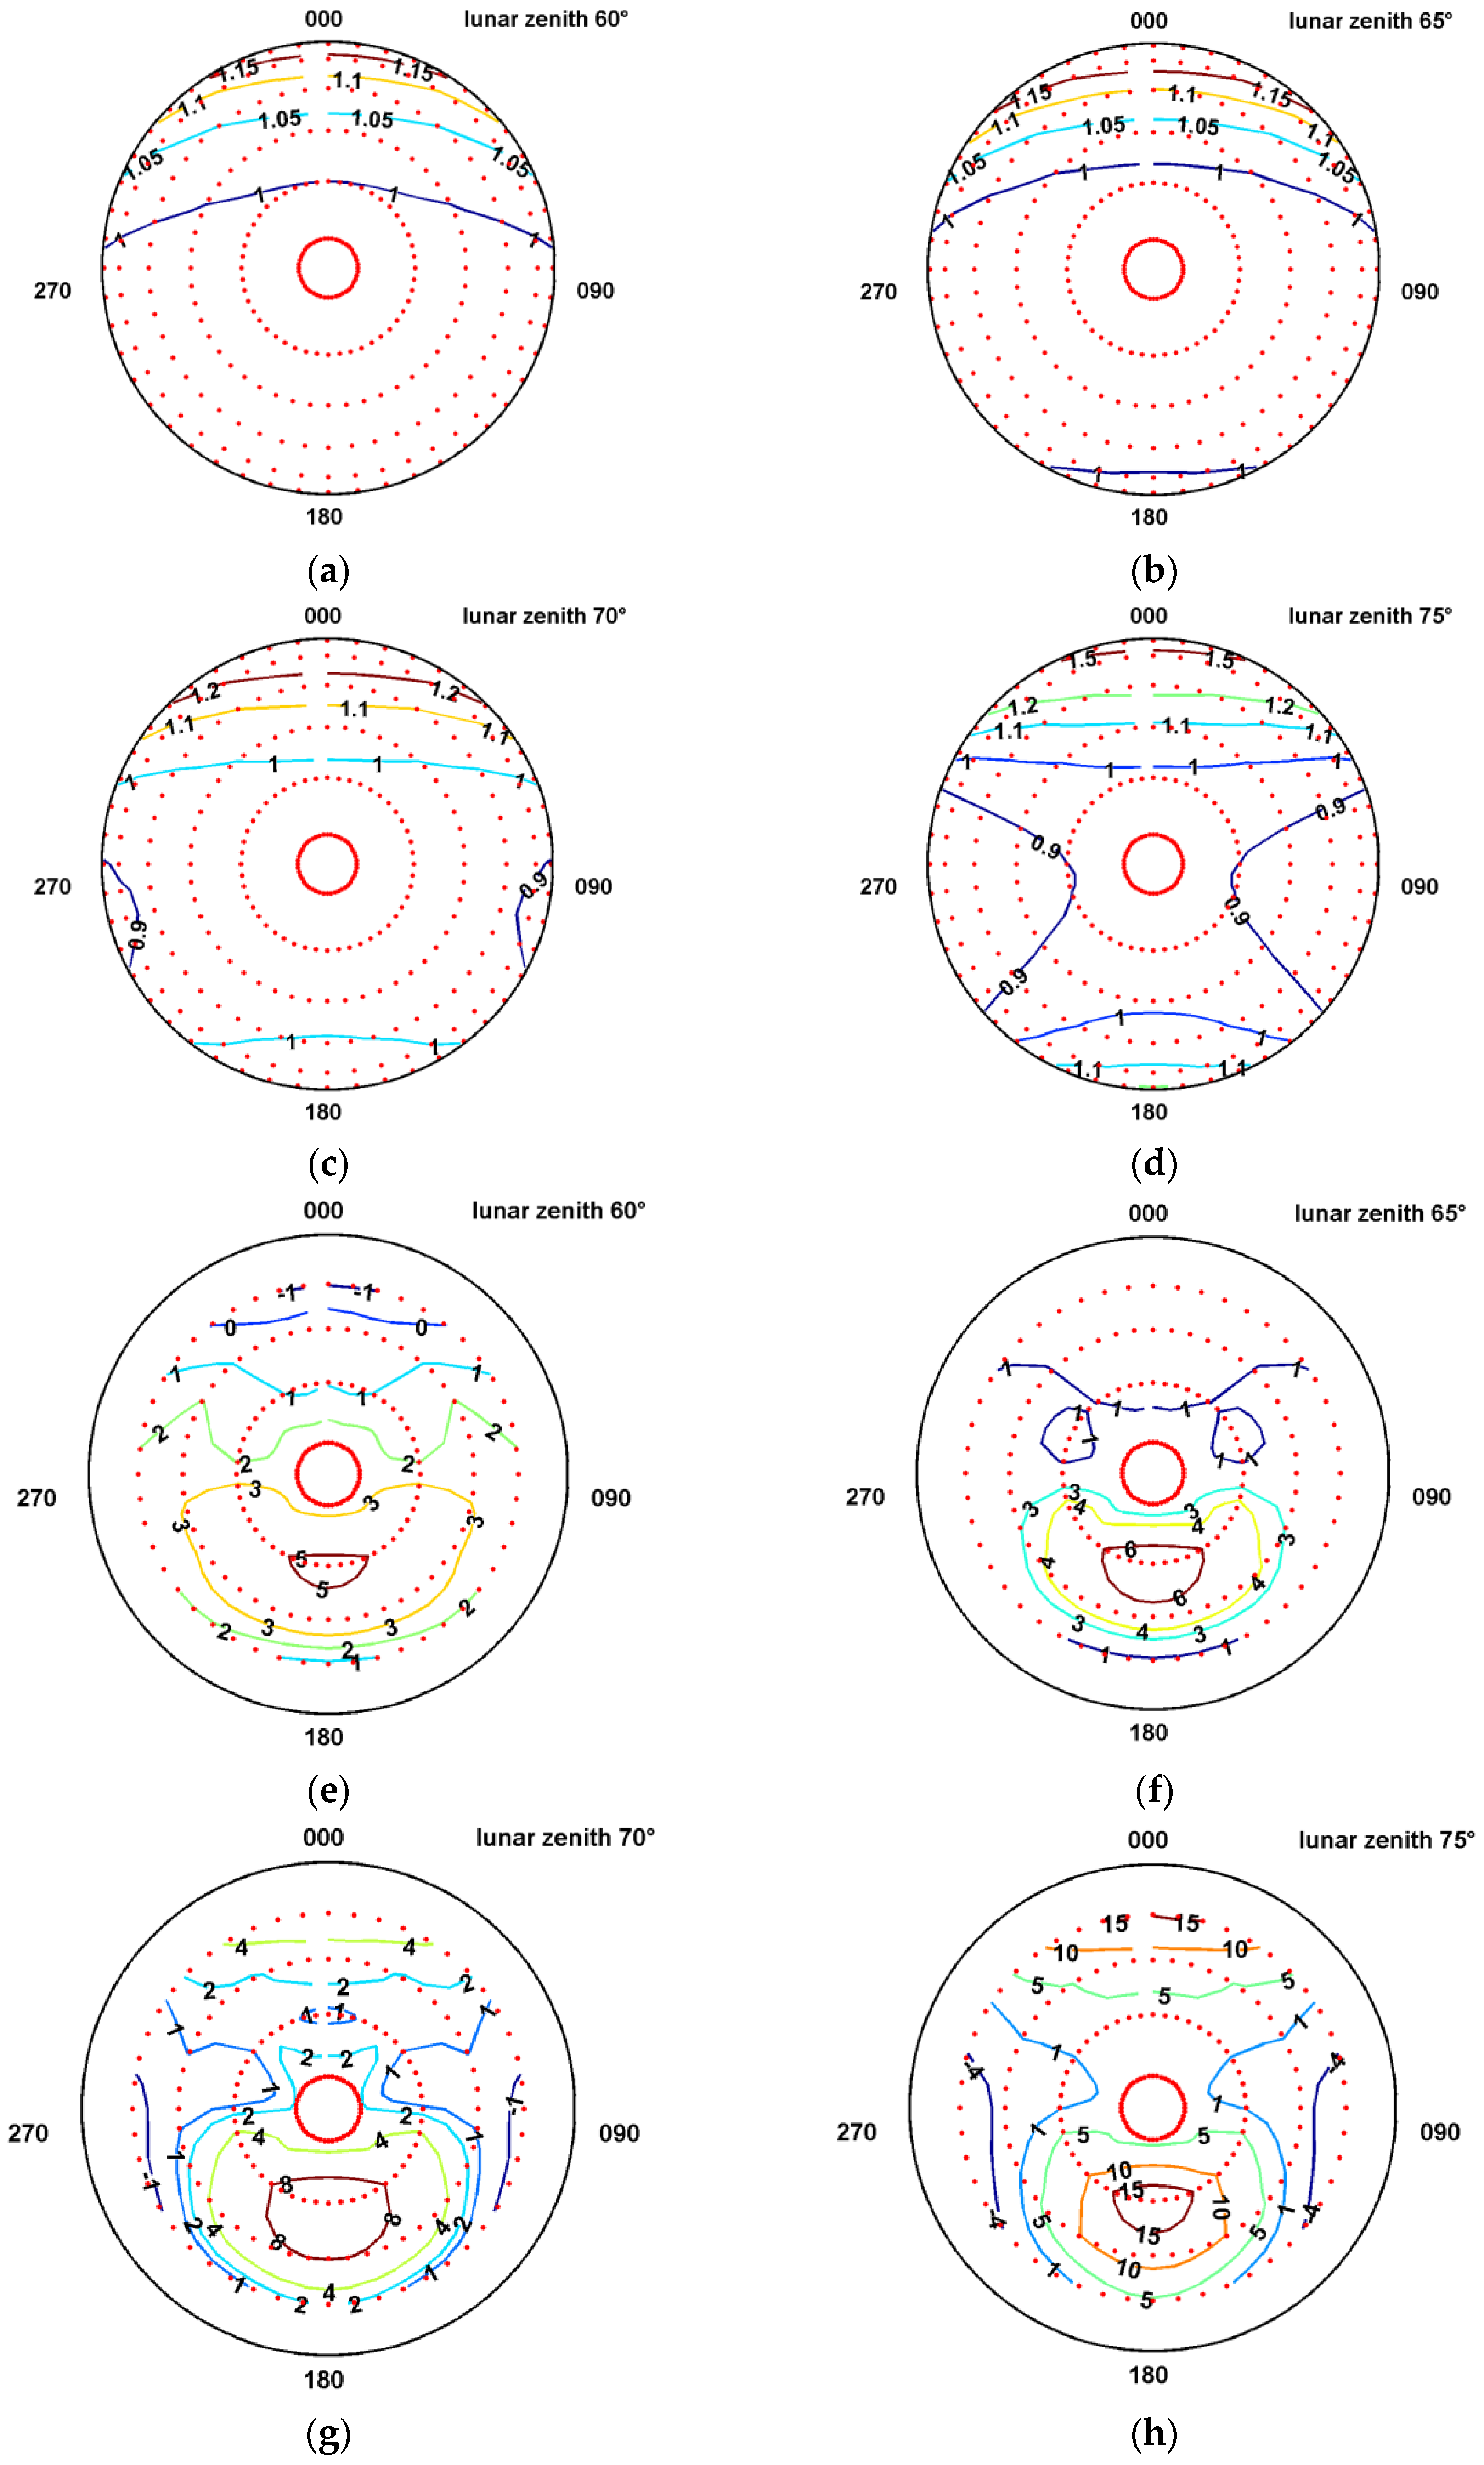
Figure 15.
(a) The comparison of black sky albedo from MCD43A1 and the nighttime TOA BRDF model; (b) bias of black sky albedo derived from the MCD43A1 product and the nighttime TOA BRDF model.
Figure 15.
(a) The comparison of black sky albedo from MCD43A1 and the nighttime TOA BRDF model; (b) bias of black sky albedo derived from the MCD43A1 product and the nighttime TOA BRDF model.
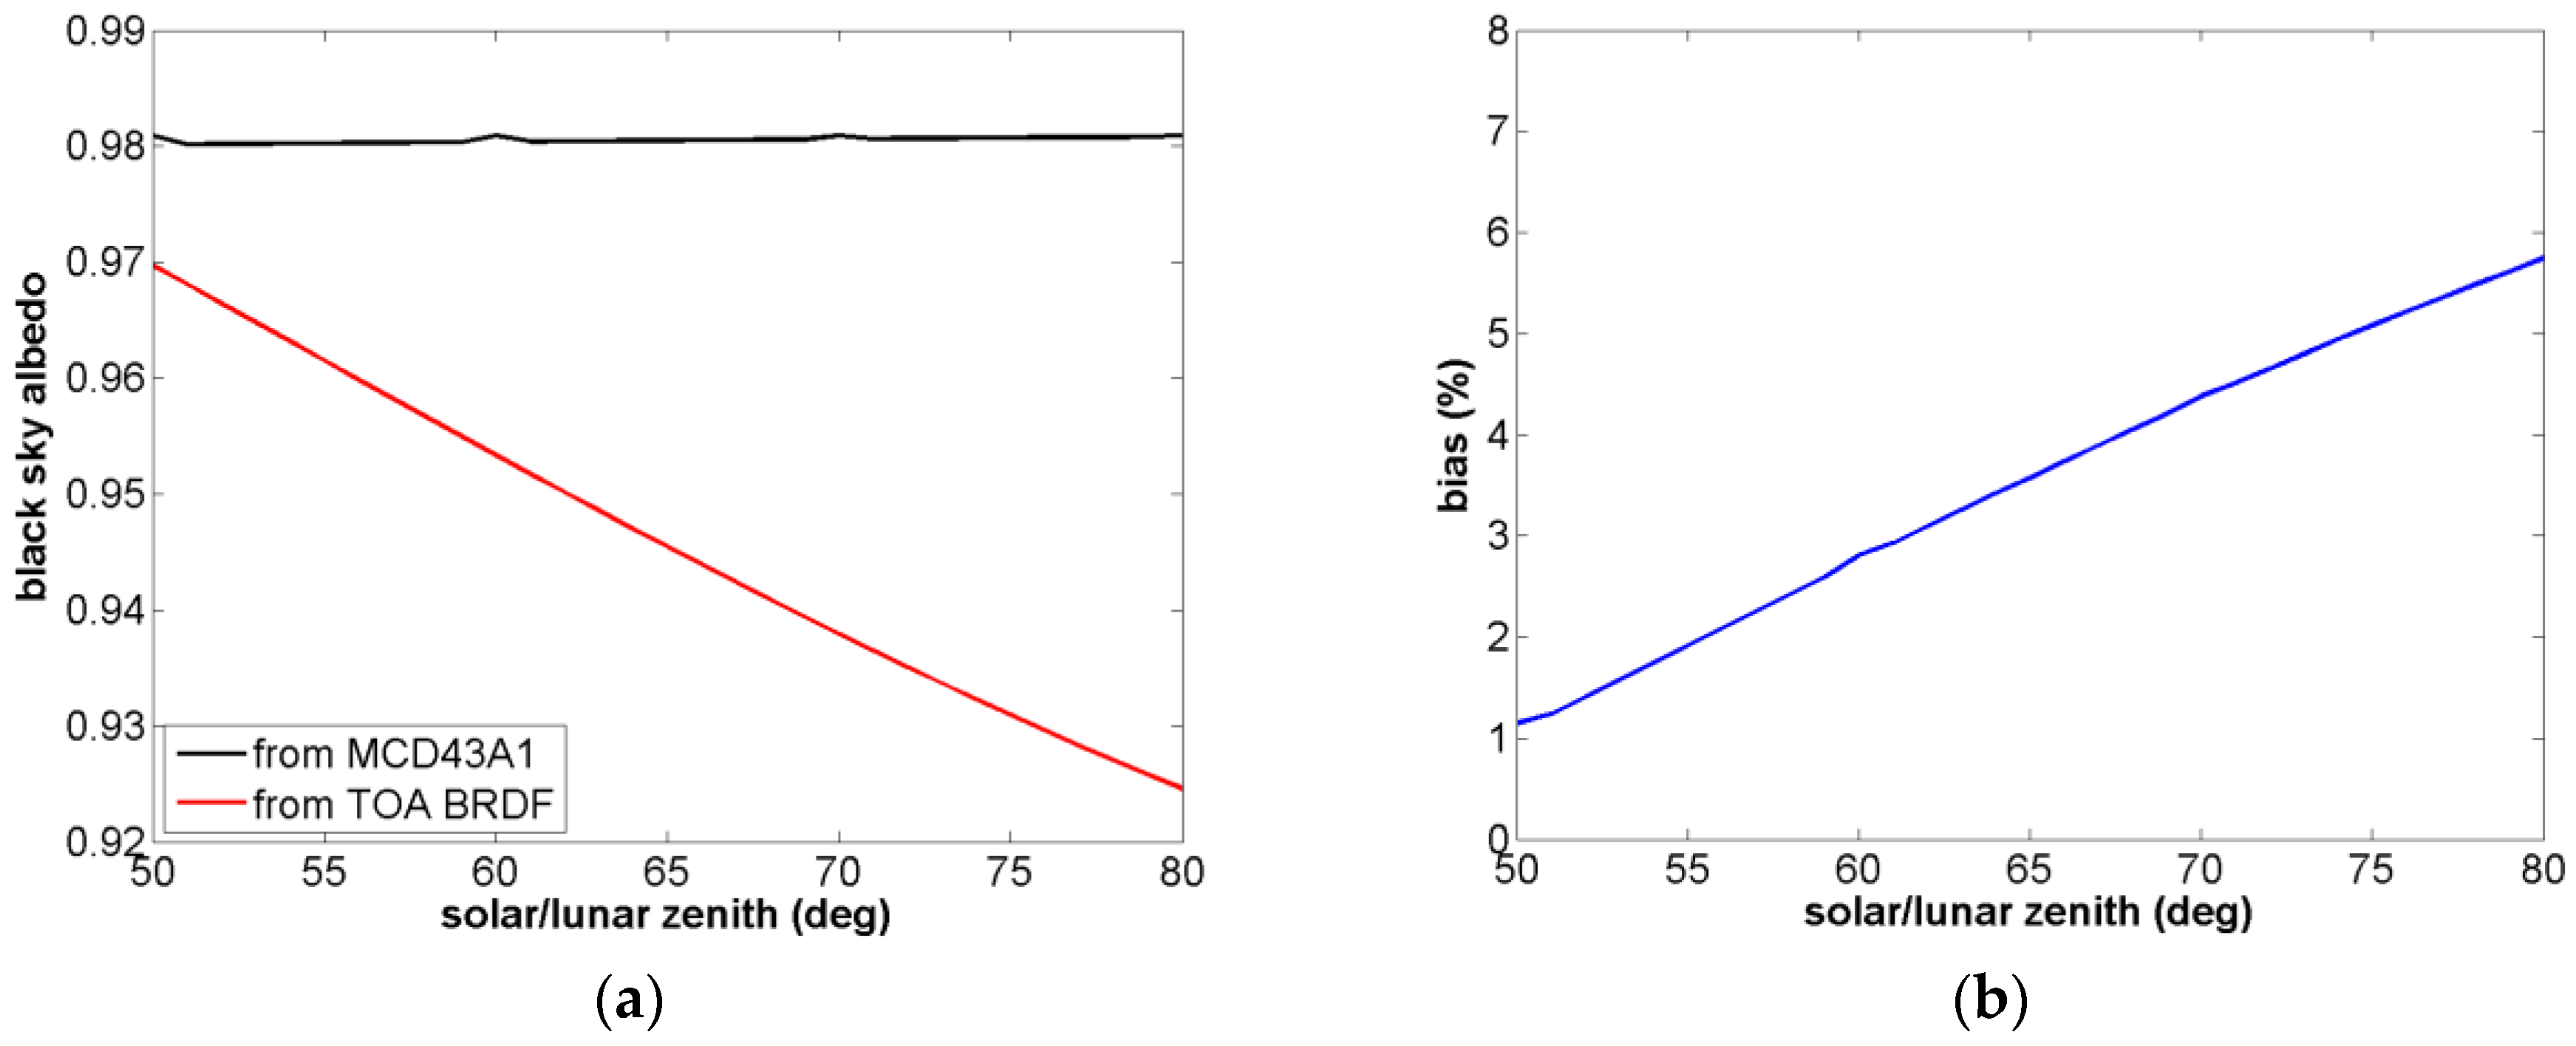
Figure 16.
The RDNB-T-N normalized by (a) the Hudson BRDF model and (b) the nighttime TOA BRDF model under different lunar phases from 2013 to 2017; The trend of RDNB-T-N normalized by (c) the Hudson BRDF model and (d) the nighttime TOA BRDF model from 2012 to 2016.
Figure 16.
The RDNB-T-N normalized by (a) the Hudson BRDF model and (b) the nighttime TOA BRDF model under different lunar phases from 2013 to 2017; The trend of RDNB-T-N normalized by (c) the Hudson BRDF model and (d) the nighttime TOA BRDF model from 2012 to 2016.

Table 1.
Radiometric parameters of the day/night band (DNB). HGS: high-gain stage; MGS: mid-gain stage; LGS: low-gain stage.
Table 1.
Radiometric parameters of the day/night band (DNB). HGS: high-gain stage; MGS: mid-gain stage; LGS: low-gain stage.
| Spectral passband center | Model estimate 694 nm |
| Spectral passband bandwidth | Model estimate 375 nm |
| Dynamic range | 3 × 10⁻⁹–0.0186 W·cm−2·sr−1 |
| Relative radiometric gains | 119,000:477:1 (HGS:MGS:LGS) |
Table 2.
Sea-Viewing Wide Field-of-View Sensor (SeaWiFS) bands.
| Band | 1 | 2 | 3 | 4 | 5 | 6 | 7 | 8 |
| Central Wavelength (nm) | 412 | 443 | 490 | 510 | 555 | 670 | 765 | 865 |
| Bandwidth (nm) | 20 | 20 | 20 | 20 | 20 | 20 | 40 | 40 |
Table 3.
Results of the nighttime TOA reflectance factor rDNB-MT at the Dome C site.
| Year | 2012 | 2013 | 2014 | 2015 | 2016 | 2017 |
| Mean ()) | 0.8992 | 0.9559 | 0.9502 | 0.9353 | 0.9456 | 0.9648 |
| Standard deviation (1δ) | 0.0628 | 0.0412 | 0.0503 | 0.0398 | 0.0471 | 0.0547 |
| Uncertainty (δ/) | 6.98% | 4.31% | 5.29% | 4.25% | 4.98% | 5.67% |
Table 4.
Fitting results of Equation (17).
| Φ | Band | 4 | 5 | 6 | 7 | 8 |
| 5 < |Φ| ≤ 10 | a | −0.0005 | −0.0002 | −0.0004 | −0.0005 | −0.0005 |
| c | 0.0184 | 0.0422 | 0.0187 | 0.0419 | 0.0293 | |
| 10 < |Φ| ≤ 90 | a | −0.0006 | −0.0006 | −0.0006 | −0.0006 | −0.0005 |
| c | 0.0149 | 0.0298 | 0.0292 | 0.0332 | −0.0552 |
Table 5.
Results of corrected nighttime TOA reflectance factor rDNB-MT-SWC at the Dome C site.
| Year | 2012 | 2013 | 2014 | 2015 | 2016 | 2017 |
| Mean () | 0.8748 | 0.9330 | 0.9279 | 0.9136 | 0.9234 | 0.9447 |
| Standard Deviation (1δ) | 0.0540 | 0.0380 | 0.0411 | 0.0351 | 0.0418 | 0.0434 |
| Uncertainty (δ/) | 6.17% | 4.08% | 4.43% | 3.84% | 4.53% | 4.59% |
Table 6.
Derived model coefficients in Equations (15)–(17).
| i = 0 | i = 1 | i = 2 | i = 3 |
| b00 = 0.8943 | b01 = 0.2036 | b02 = −0.5673 | b03 = 1.3569 |
| b10 = −0.0307 | b11 = 0.2505 | b12 = 1.6137 | b13 = −5.0113 |
| b20 = 0.4101 | b21 = −1.0522 | b22 = −1.4435 | b23 = 4.8229 |
Table 7.
Results of RDNB-T-N at the Dome C site.
| Normalized by the Hudson BRDF Model | ||||||
| Year | 2012 | 2013 | 2014 | 2015 | 2016 | 2017 |
| Mean () | 0.9672 | 1.0277 | 1.0292 | 1.0139 | 1.0205 | 1.0428 |
| Standard Deviation (1δ) | 0.0492 | 0.0312 | 0.0406 | 0.0287 | 0.0395 | 0.0463 |
| Uncertainty (δ/) | 5.09% | 3.04% | 3.94% | 2.83% | 3.87% | 4.44% |
| Normalized by the nighttime TOA BRDF Model | ||||||
| Year | 2012 | 2013 | 2014 | 2015 | 2016 | 2017 |
| Mean () | 0.9454 | 1.0036 | 1.0075 | 0.9917 | 0.9985 | 1.0208 |
| Standard Deviation (1δ) | 0.0447 | 0.0275 | 0.0362 | 0.0261 | 0.0345 | 0.0398 |
| Uncertainty (δ/) | 4.73% | 2.74% | 3.59% | 2.64% | 3.45% | 3.90% |
Table 8.
Results of RDNB-T-N at Dome C site using all the observation samples.
| Normalized by the Hudson BRDF Model | ||||||
| Year | 2012 | 2013 | 2014 | 2015 | 2016 | 2017 |
| Mean () | 0.9450 | 1.0058 | 1.0071 | 0.9886 | 0.9991 | 1.0212 |
| Standard Deviation (1δ) | 0.0513 | 0.0351 | 0.0390 | 0.0332 | 0.0380 | 0.0407 |
| Uncertainty (δ/) | 5.43% | 3.49% | 3.87% | 3.36% | 3.80% | 3.98% |
© 2018 by the authors. Licensee MDPI, Basel, Switzerland. This article is an open access article distributed under the terms and conditions of the Creative Commons Attribution (CC BY) license (http://creativecommons.org/licenses/by/4.0/).
Share and Cite
MDPI and ACS Style
Zeng, X.; Shao, X.; Qiu, S.; Ma, L.; Gao, C.; Li, C. Stability Monitoring of the VIIRS Day/Night Band over Dome C with a Lunar Irradiance Model and BRDF Correction. Remote Sens. 2018, 10, 189. https://doi.org/10.3390/rs10020189
AMA Style
Zeng X, Shao X, Qiu S, Ma L, Gao C, Li C. Stability Monitoring of the VIIRS Day/Night Band over Dome C with a Lunar Irradiance Model and BRDF Correction. Remote Sensing. 2018; 10(2):189. https://doi.org/10.3390/rs10020189
Chicago/Turabian StyleZeng, Xiangzhao, Xi Shao, Shi Qiu, Lingling Ma, Caixia Gao, and Chuanrong Li. 2018. "Stability Monitoring of the VIIRS Day/Night Band over Dome C with a Lunar Irradiance Model and BRDF Correction" Remote Sensing 10, no. 2: 189. https://doi.org/10.3390/rs10020189
Note that from the first issue of 2016, this journal uses article numbers instead of page numbers. See further details here.