Retrieval of Aerosol Optical Depth in the Arid or Semiarid Region of Northern Xinjiang, China


1
College of Global Change and Earth System Science, Beijing Normal University, Beijing 100875, China
2
Satellite Environment Center, Ministry of Environmental Protection of China, Beijing 100094, China
3
Geomatics College, Shandong University of Science and Technology, Qingdao 266590, China
4
State Key Laboratory of Remote Sensing Science, Jointly Sponsored by Beijing Normal University and Institute of Remote Sensing and Digital Earth of Chinese Academy of Sciences, Beijing 100875, China
*
Authors to whom correspondence should be addressed.
Remote Sens. 2018, 10(2), 197; https://doi.org/10.3390/rs10020197
Submission received: 28 November 2017
/
Revised: 11 January 2018
/
Accepted: 26 January 2018
/
Published: 29 January 2018
(This article belongs to the Special Issue Advances in Quantitative Remote Sensing in China – In Memory of Prof. Xiaowen Li)
Abstract
:Satellite remote sensing has been widely used to retrieve aerosol optical depth (AOD), which is an indicator of air quality as well as radiative forcing. The dark target (DT) algorithm is applied to low reflectance areas, such as dense vegetation, and the deep blue (DB) algorithm is adopted for bright-reflecting regions. However, both DT and DB algorithms ignore the effect of surface bidirectional reflectance. This paper provides a method for AOD retrieval in arid or semiarid areas, in which the key points are the accurate estimation of surface reflectance and reasonable assumptions of the aerosol model. To reduce the uncertainty in surface reflectance, a minimum land surface reflectance database at the spatial resolution of 500 m for each month was constructed based on the moderate-resolution imaging spectroradiometer (MODIS) surface reflectance product. Furthermore, a bidirectional reflectance distribution function (BRDF) correction model was adopted to compensate for the effect of surface reflectance anisotropy. The aerosol parameters, including AOD, single scattering albedo, asymmetric factor, Ångström exponent and complex refractive index, are determined based on the observation of two sunphotometers installed in northern Xinjiang from July to August 2014. The AOD retrieved from the MODIS images was validated with ground-based measurements and the Terra-MODIS aerosol product (MOD04). The 500 m AOD retrieved from the MODIS showed high consistency with ground-based AOD measurements, with an average correlation coefficient of ~0.928, root mean square error (RMSE) of ~0.042, mean absolute error (MAE) of ~0.032, and the percentage falling within the expected error (EE) of the collocations is higher than that for the MOD04 DB product. The results demonstrate that the new AOD algorithm is more suitable to represent aerosol conditions over Xinjiang than the DB standard product.
1. Introduction
Xinjiang province in northwest China is part of the Central Asian dust storm area, which is one of the main sources of dust aerosols [1]. In recent years, many Xinjiang cities, especially the capital, Urumqi, have suffered a severe deterioration in air quality with significant contributions from atmospheric particulates [2]. Aerosols can significantly influence the ecosystem, climate and hydrological cycle by affecting radiative forcing [3] and its relation with the air quality indicators proportionated for sustainable development [4]. High aerosol pollution events have a wide-ranging impact on visibility [5] and human health [6]. Scientific data about the spatial and temporal dynamic of dust aerosol in Xinjiang are needed by the local government to facilitate development of policies to protect the ecosystem and diminish dust storms. Due to the lack of ground stations in this vast area, satellite retrieval is the practical way to provide the spatial and temporal distribution of aerosol optical depth (AOD) [7,8,9].
Many satellite sensors have released AOD products, including the total ozone mapping spectrometer (TOMS) [10], geostationary operational environmental satellite (GOES) [11], ozone monitoring instrument (OMI) [12], medium resolution imaging spectroradiometer (MERIS) [13], advanced very high resolution radiometer (AVHRR) [14], multi-angle imaging spectroradiometer (MISR) [15], sea-viewing wide field-of-view sensor (SeaWiFS) [16], moderate-resolution imaging spectroradiometer (MODIS) [17], and visible infrared imaging radiometer suite (VIIRS) [18]. Yet, the quality of AOD products over arid/semiarid areas, such as Xinjiang, is relatively low due to a large bias in the surface reflectance estimation as well as the aerosol model used in the retrieval algorithms. The operational MODIS AOD product over land is based on two algorithms: the dark target (DT) and deep blue (DB) algorithms [19]. In the Xinjiang area, the MODIS AOD product is mostly retrieved with the DB algorithm which is applied over bright areas, where the surface reflectance is relatively high, and distinguishing atmospheric aerosol contributions from the satellite sensor energy is difficult.
In the DB algorithm, for arid and semiarid regions, the surface reflectance was determined based on a pre-calculated surface reflectance database, which was compiled based on the minimum reflectivity method at the resolution of 0.1° × 0.1° for each season using MODIS images [20]. The derived surface reflectance database therefore depends on the scattering angle, normalized difference vegetation index (NDVI), and season. Most of the validation studies concluded that, in general, MODIS DB retrieved aerosol products were comparable to aerosol robotic network (AERONET) data, and an expected error (EE) envelope could be defined that contained approximately 50–70% of the matchups [21]. Bilal and Nichol reported up to 75–80% of the DB retrievals within the EE [22]. One of the major error sources for the DB algorithm is the difference between the surface reflectance corresponding to the images and that from the pre-calculated database, as a result of the anisotropic surface reflectance. Another crucial aspect in AOD retrieval is the aerosol model. In the DB algorithm, the microphysical and optical properties of aerosols are based on a cluster analysis of the global AERONET database through 2010 [17]. However, the aerosol characteristics vary locally, and they cannot be accurately described using a global aerosol model, which increases the uncertainty in AOD retrieval [23].
In this paper, a monthly minimum land surface reflectance (MLSR) database for Xinjiang area (band: blue; resolution: 500 m; time span: 2010–2014) was established using MODIS surface reflectance product (MOD09A1), based on the minimum synthesis technique (MST) method to reduce the impact of cloud contamination [20,24,25]. A bidirectional reflectance distribution function (BRDF) correction model for angle normalization was adopted to compensate the effect of surface reflectance anisotropy. In addition, the CE-318 sunphotometer data are used to determine the aerosol characteristics of the study area.
2. Field Measurements and Data Used
The CE-318 sunphotometer is an automatic ground-based radiometer measuring both direct solar irradiance and diffuse sky radiance for almucantar and principal solar planes with a 1.2° field of view. Although the channel wavelength configuration depends on the instrument version, filters at 440, 500, 675, 870, 940 and 1020 nm wavelengths are always present [26], with an uncertainty of 0.01–0.02 [27]. The Microtops II sunphotometer is a portable, manually-operated instrument which measures AOD through direct solar irradiance measurements in five wavebands (380, 500, 675, 870, and 1020 nm) with an uncertainty of ~0.015–0.02 [28,29].
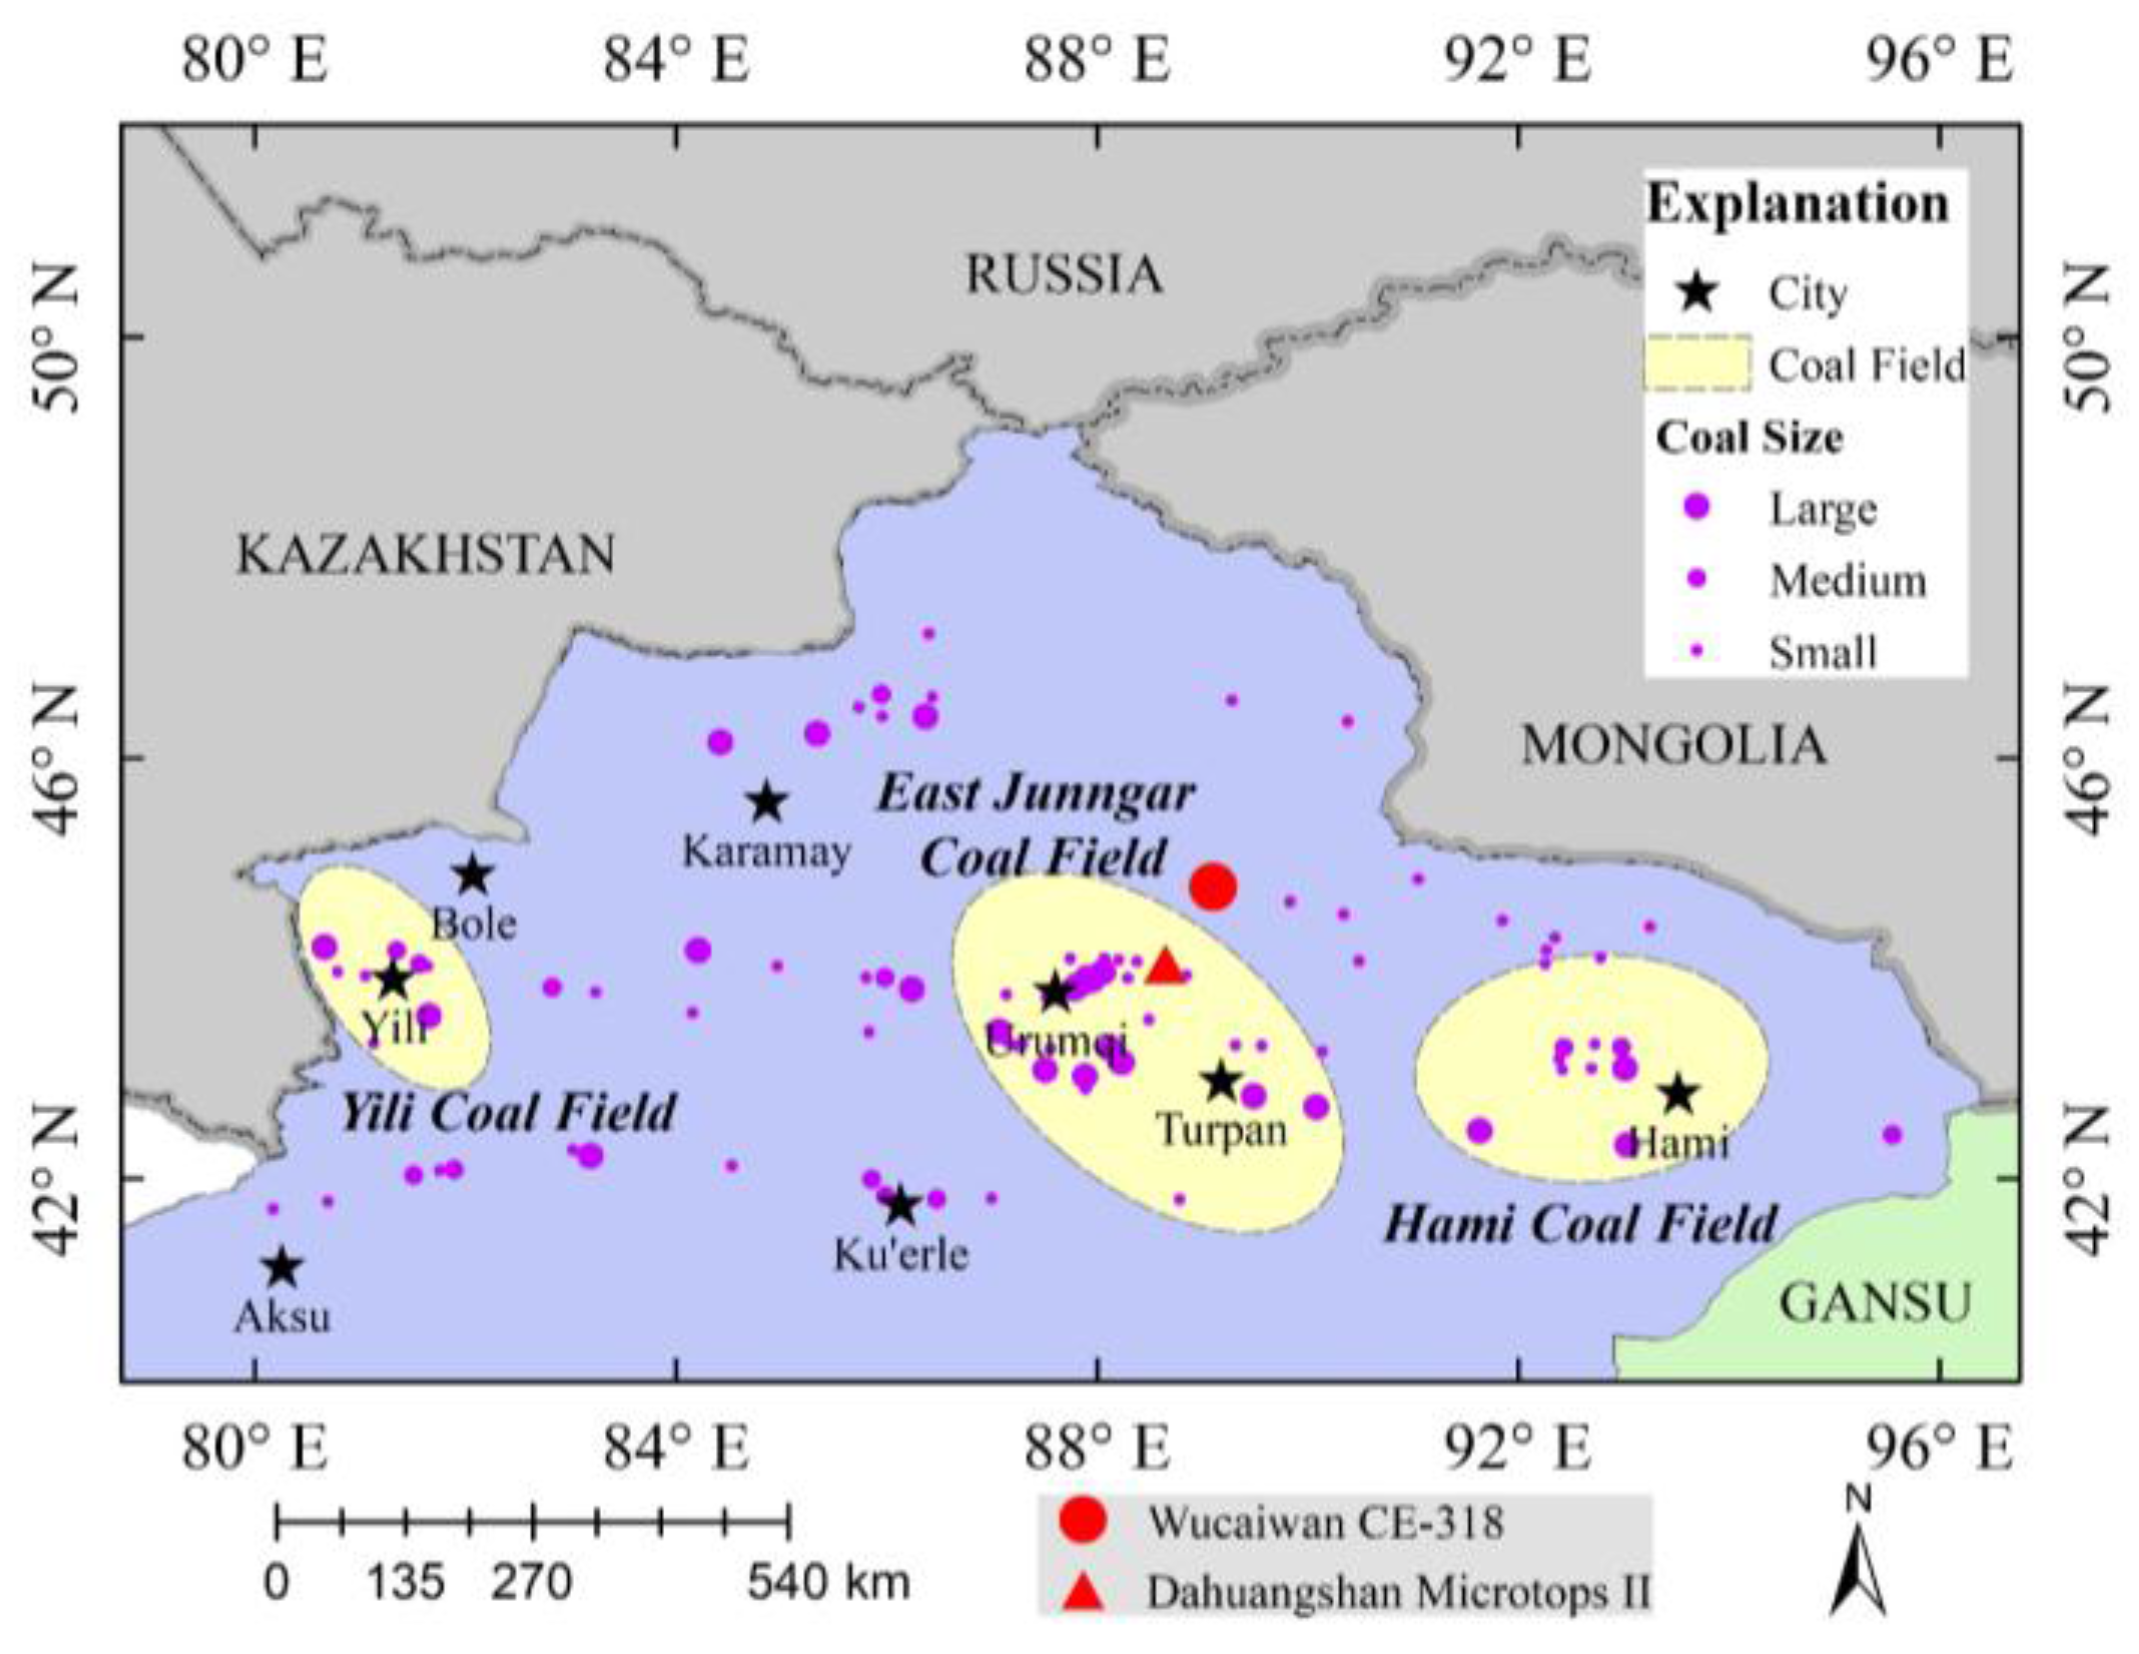
In order to obtain the characteristic parameters of atmospheric aerosol in the study area, the CE-318 and Microtops II sunphotometers were used at two ground-observed sites (Dahuangshan and Wucaiwan site). The Dahuangshan site is located in a coal mining area with sparse vegetation coverage and the Microtops II sunphotometer observation was carried out from 10 July to 24 August 2014. The Wucaiwan site is located in a remote rural area near the Gurbantunggut Desert and the CE-318 sunphotometer observation was carried out from 15 July to 21 August 2014. A map of the study area is shown in Figure 1, and the detailed information of sites and instruments is presented in Table 1.
The MODIS (Terra) data products, namely calibrated radiance product (MOD02HKM), geolocation product (MOD03), surface reflectance product (MOD09A1), BRDF/albedo product (MCD43A1), and the Collection 6 (C6) aerosol product (MOD04), were obtained from the Level-1 and Atmosphere Archive & Distribution System (LAADS) Distributed Active Archive Center (DAAC) at the Goddard Space Flight Center (GSFC) (http://ladsweb.nascom.nasa.gov). The information of these satellite products and their applications is listed in Table 2.
3. Methodology
The top-of-atmosphere (TOA) reflectance (), measured by a satellite sensor, is a function of surface and atmosphere optical parameters as well as solar/view zenith and azimuth angles; it can be estimated using Equation (1):
where is the solar zenith angle, is the view zenith angle, is the relative azimuth angle, is the aerosol optical depth, is the aerosol reflectance resulting from multiple scattering in the absence of molecules; is the Rayleigh reflectance resulting from multiple scattering in the absence of aerosols; is the surface reflectance; and are the transmissions of the atmosphere on the sun-surface path and the surface-sensor path, respectively; and is the atmospheric backscattering ratio to account for multiple reflections between the surface and atmosphere.
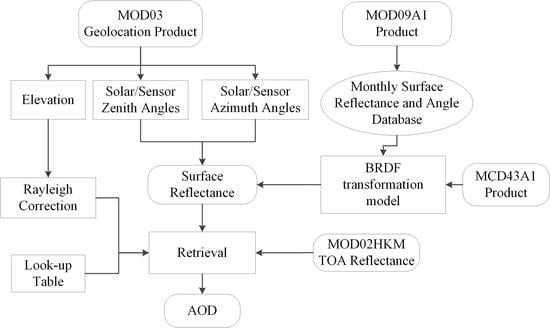
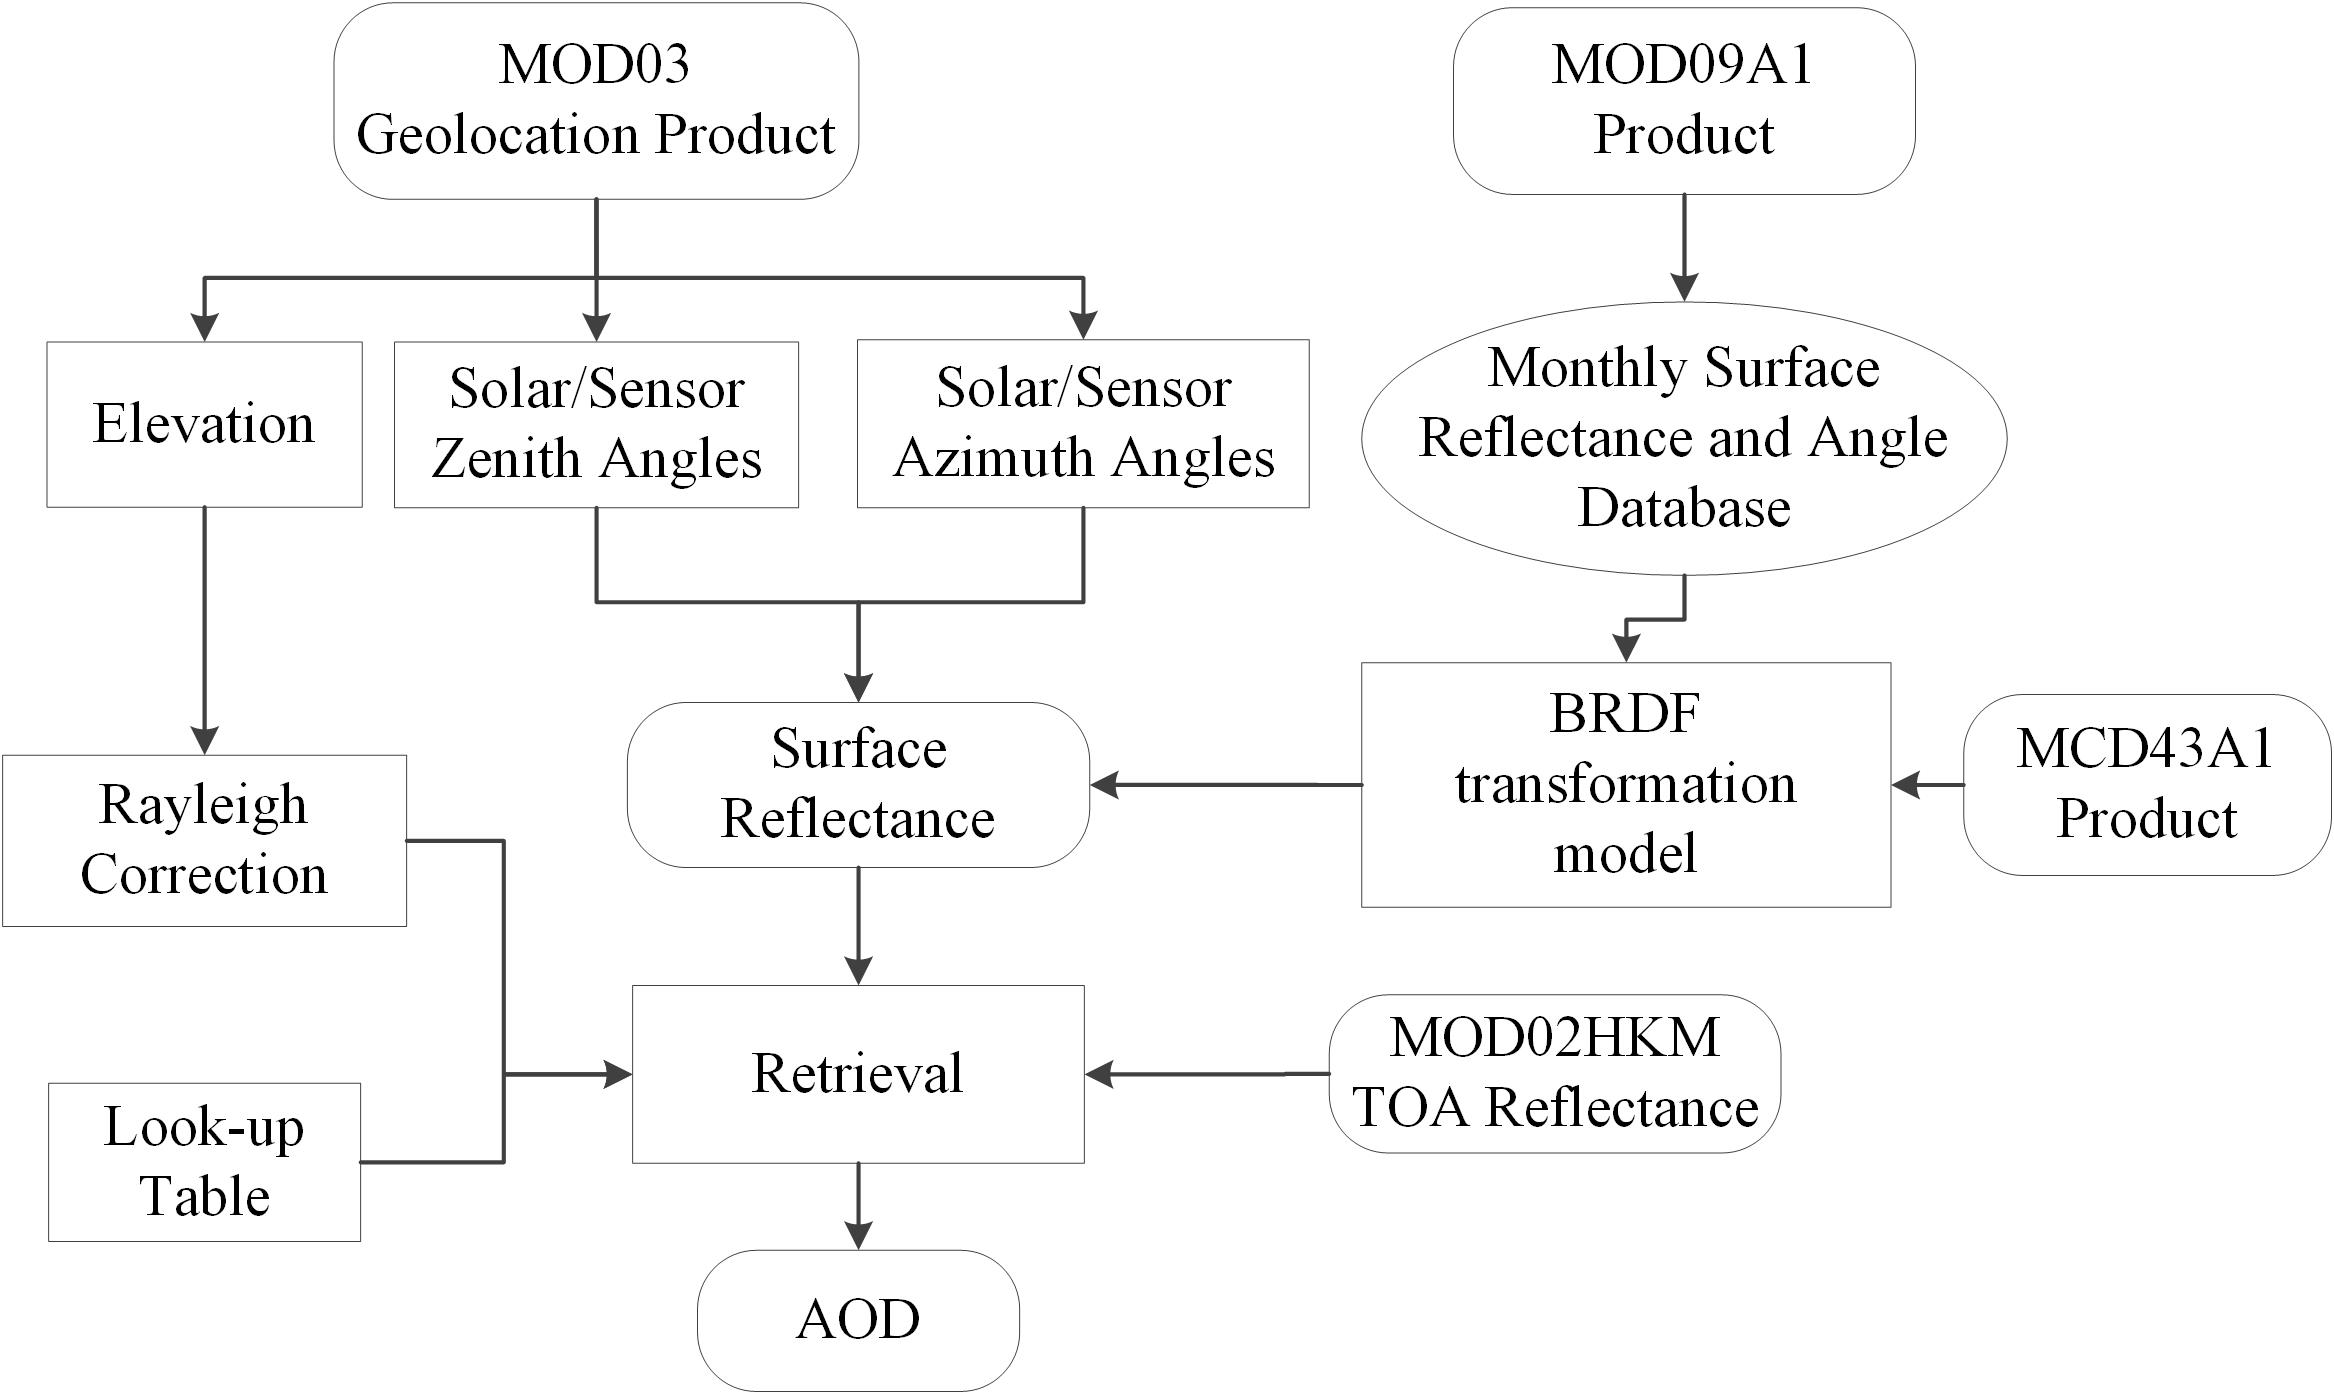
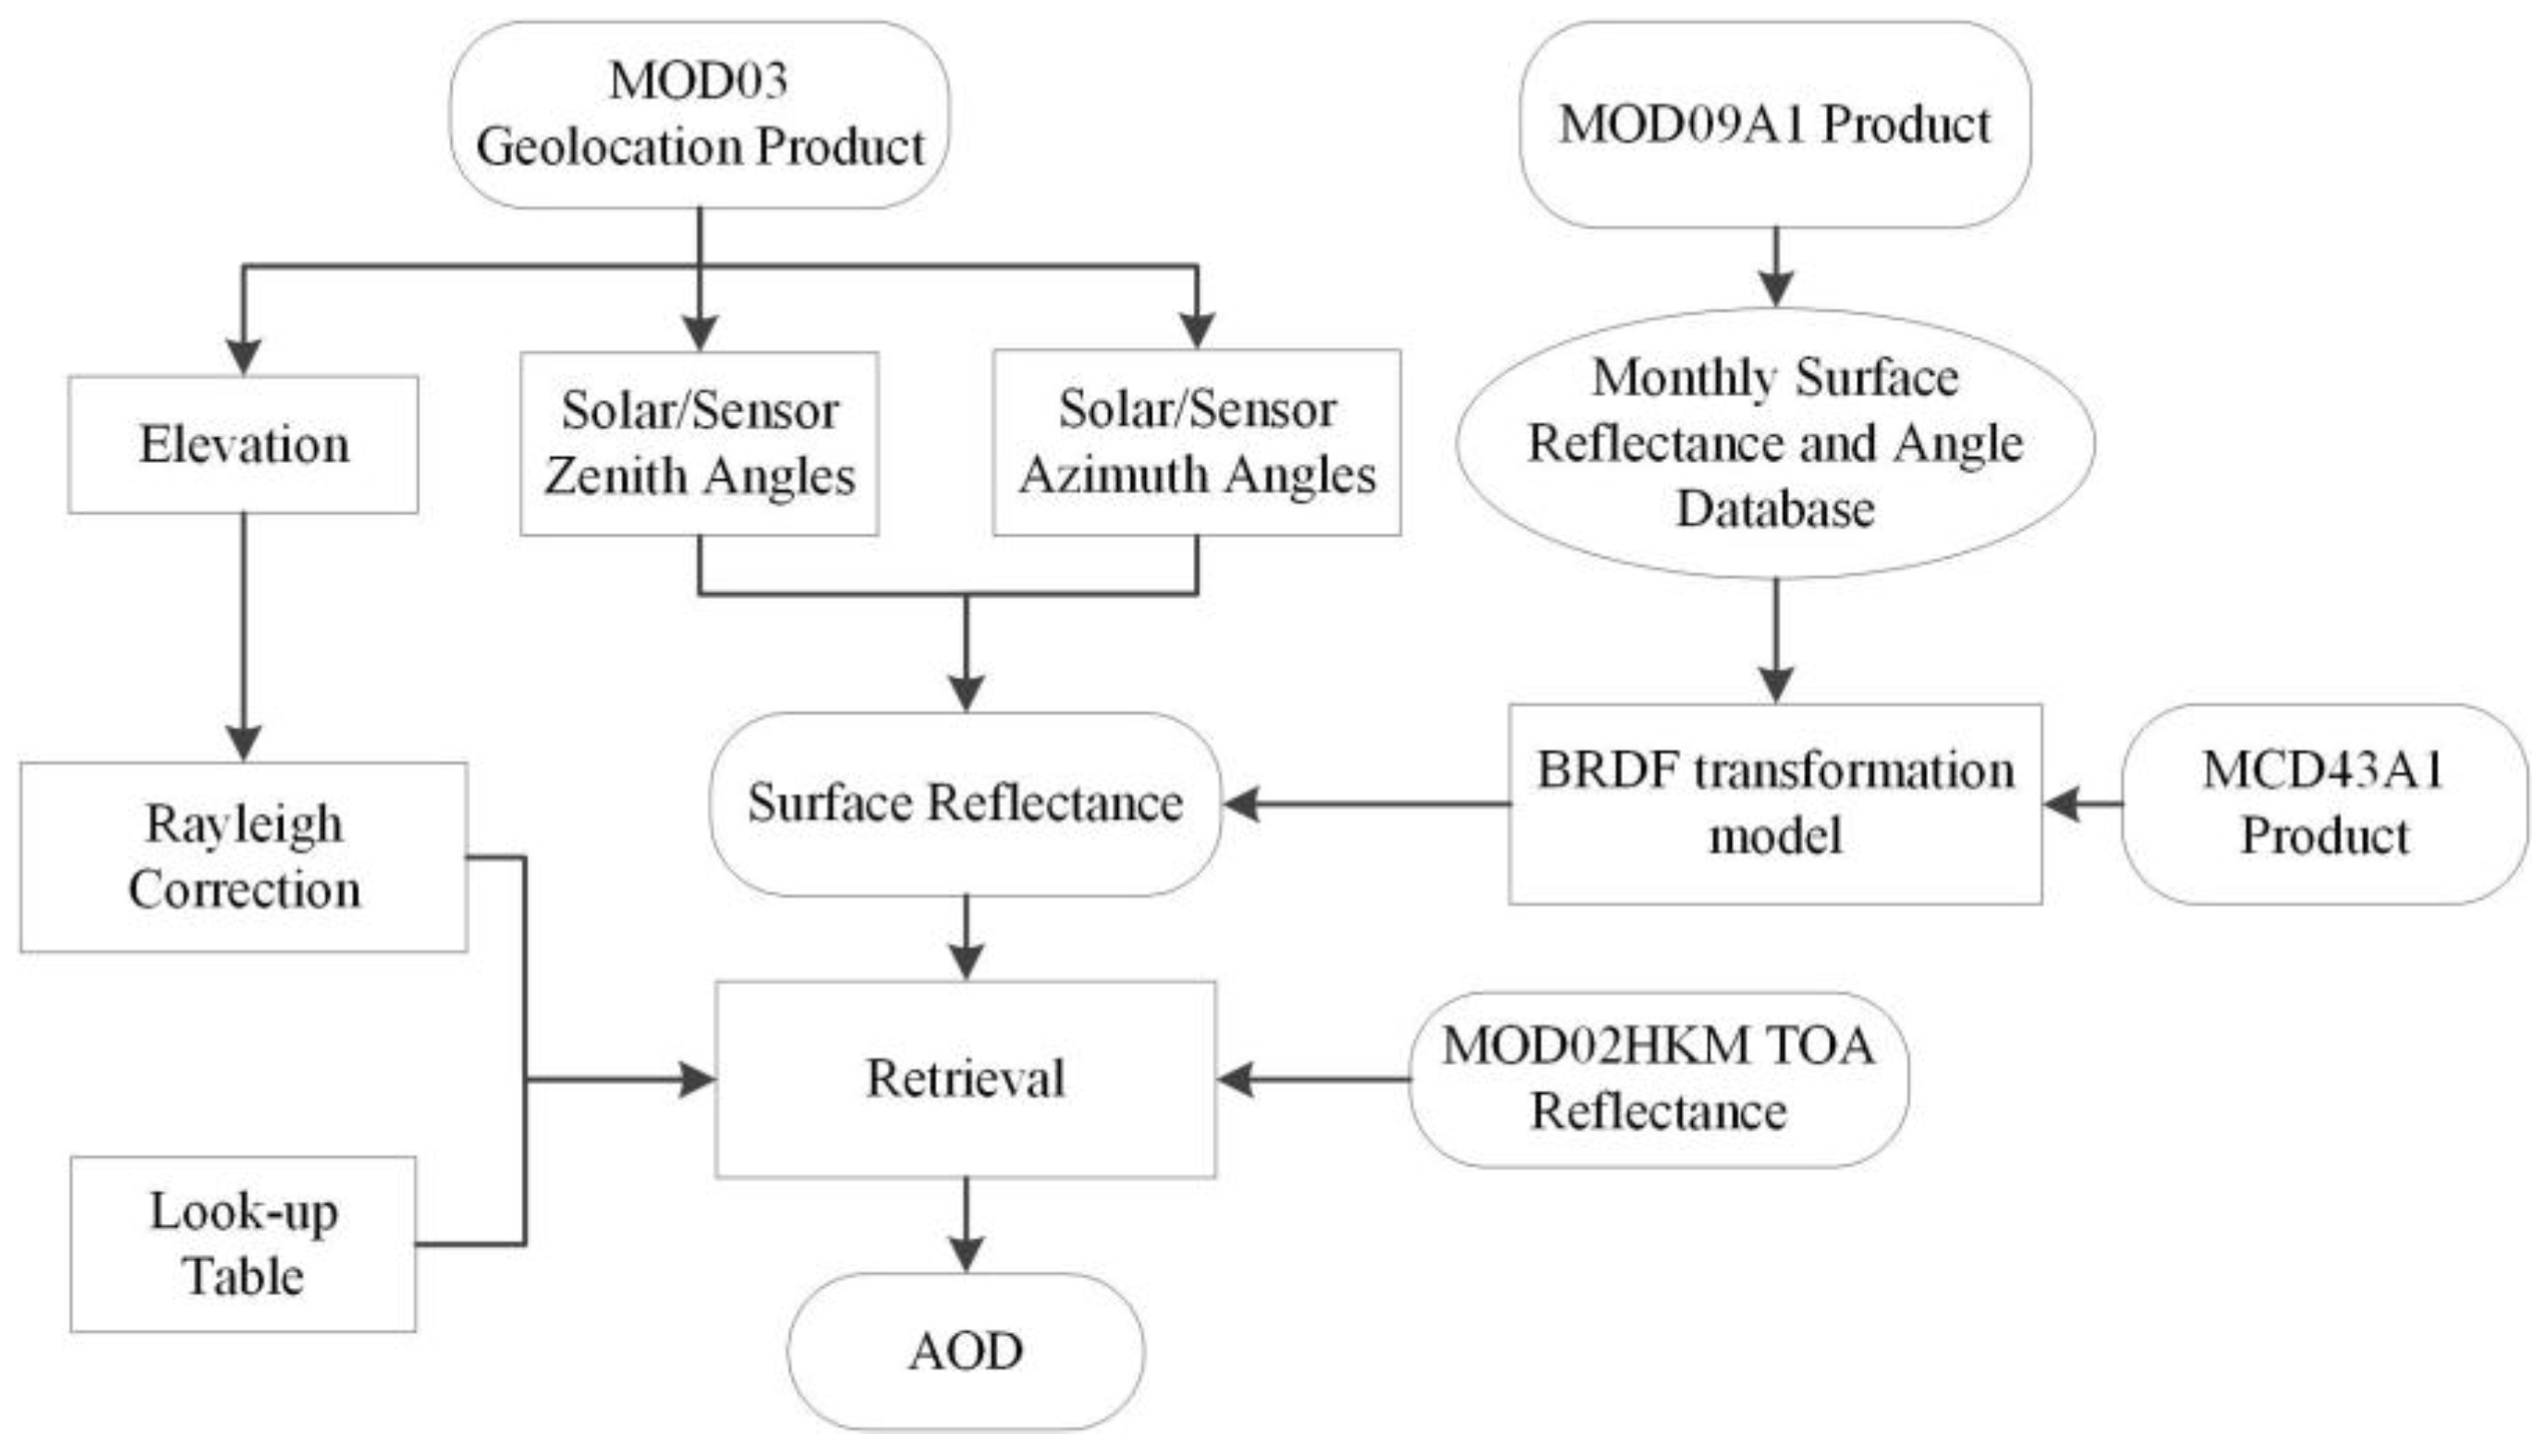
Equation (1) indicates that the TOA reflectance comes from two parts: the pure atmospheric contribution (the first two terms in Equation (1)) and the combination of the atmosphere and land (the last term in Equation (1)). A key step of the satellite-retrieved AOD is to remove the surface contributions from the satellite image. An overview of our retrieval algorithm is represented as a dataflow diagram in Figure 2. This algorithm cannot retrieve cloud-contaminated pixels; therefore, before beginning the retrieval processing, we screened areas for the presence of clouds, and used the universal dynamic threshold cloud detection algorithm for cloud detection [30]. The surface reflectance for a given pixel was then determined from the pre-calculated MLSR and angle information database, which was built using MOD09A1 products. The aerosol model is an important parameter that affects the precision of AOD retrieval and must be considered carefully. In this study, it was established by the ground-based measurements data.
3.1. Construction of Surface Database
In order to remove the surface contributions from the satellite signal, a database of surface reflectance was built for the AOD retrieval. The MOD09A1 dataset provides surface reflectance at 500 m resolution in sinusoidal projection. Each MOD09A1 pixel has the best possible observation during an 8-day period as selected by high observation coverage, small view angle, absence of clouds or cloud shadow, and low aerosol loading. Validation has been carried out for the MOD09 which indicated that 50.52% of the observations in the blue band were within the MODIS theoretical uncertainty of ±(0.005 + 5% × ), where is the surface reflectance [31]. In this study, MOD09A1 datasets for 5 years (2010–2014) and six tiles (H23-H25 and V04-V05) were used to build the surface reflectance database to support AOD retrieval.
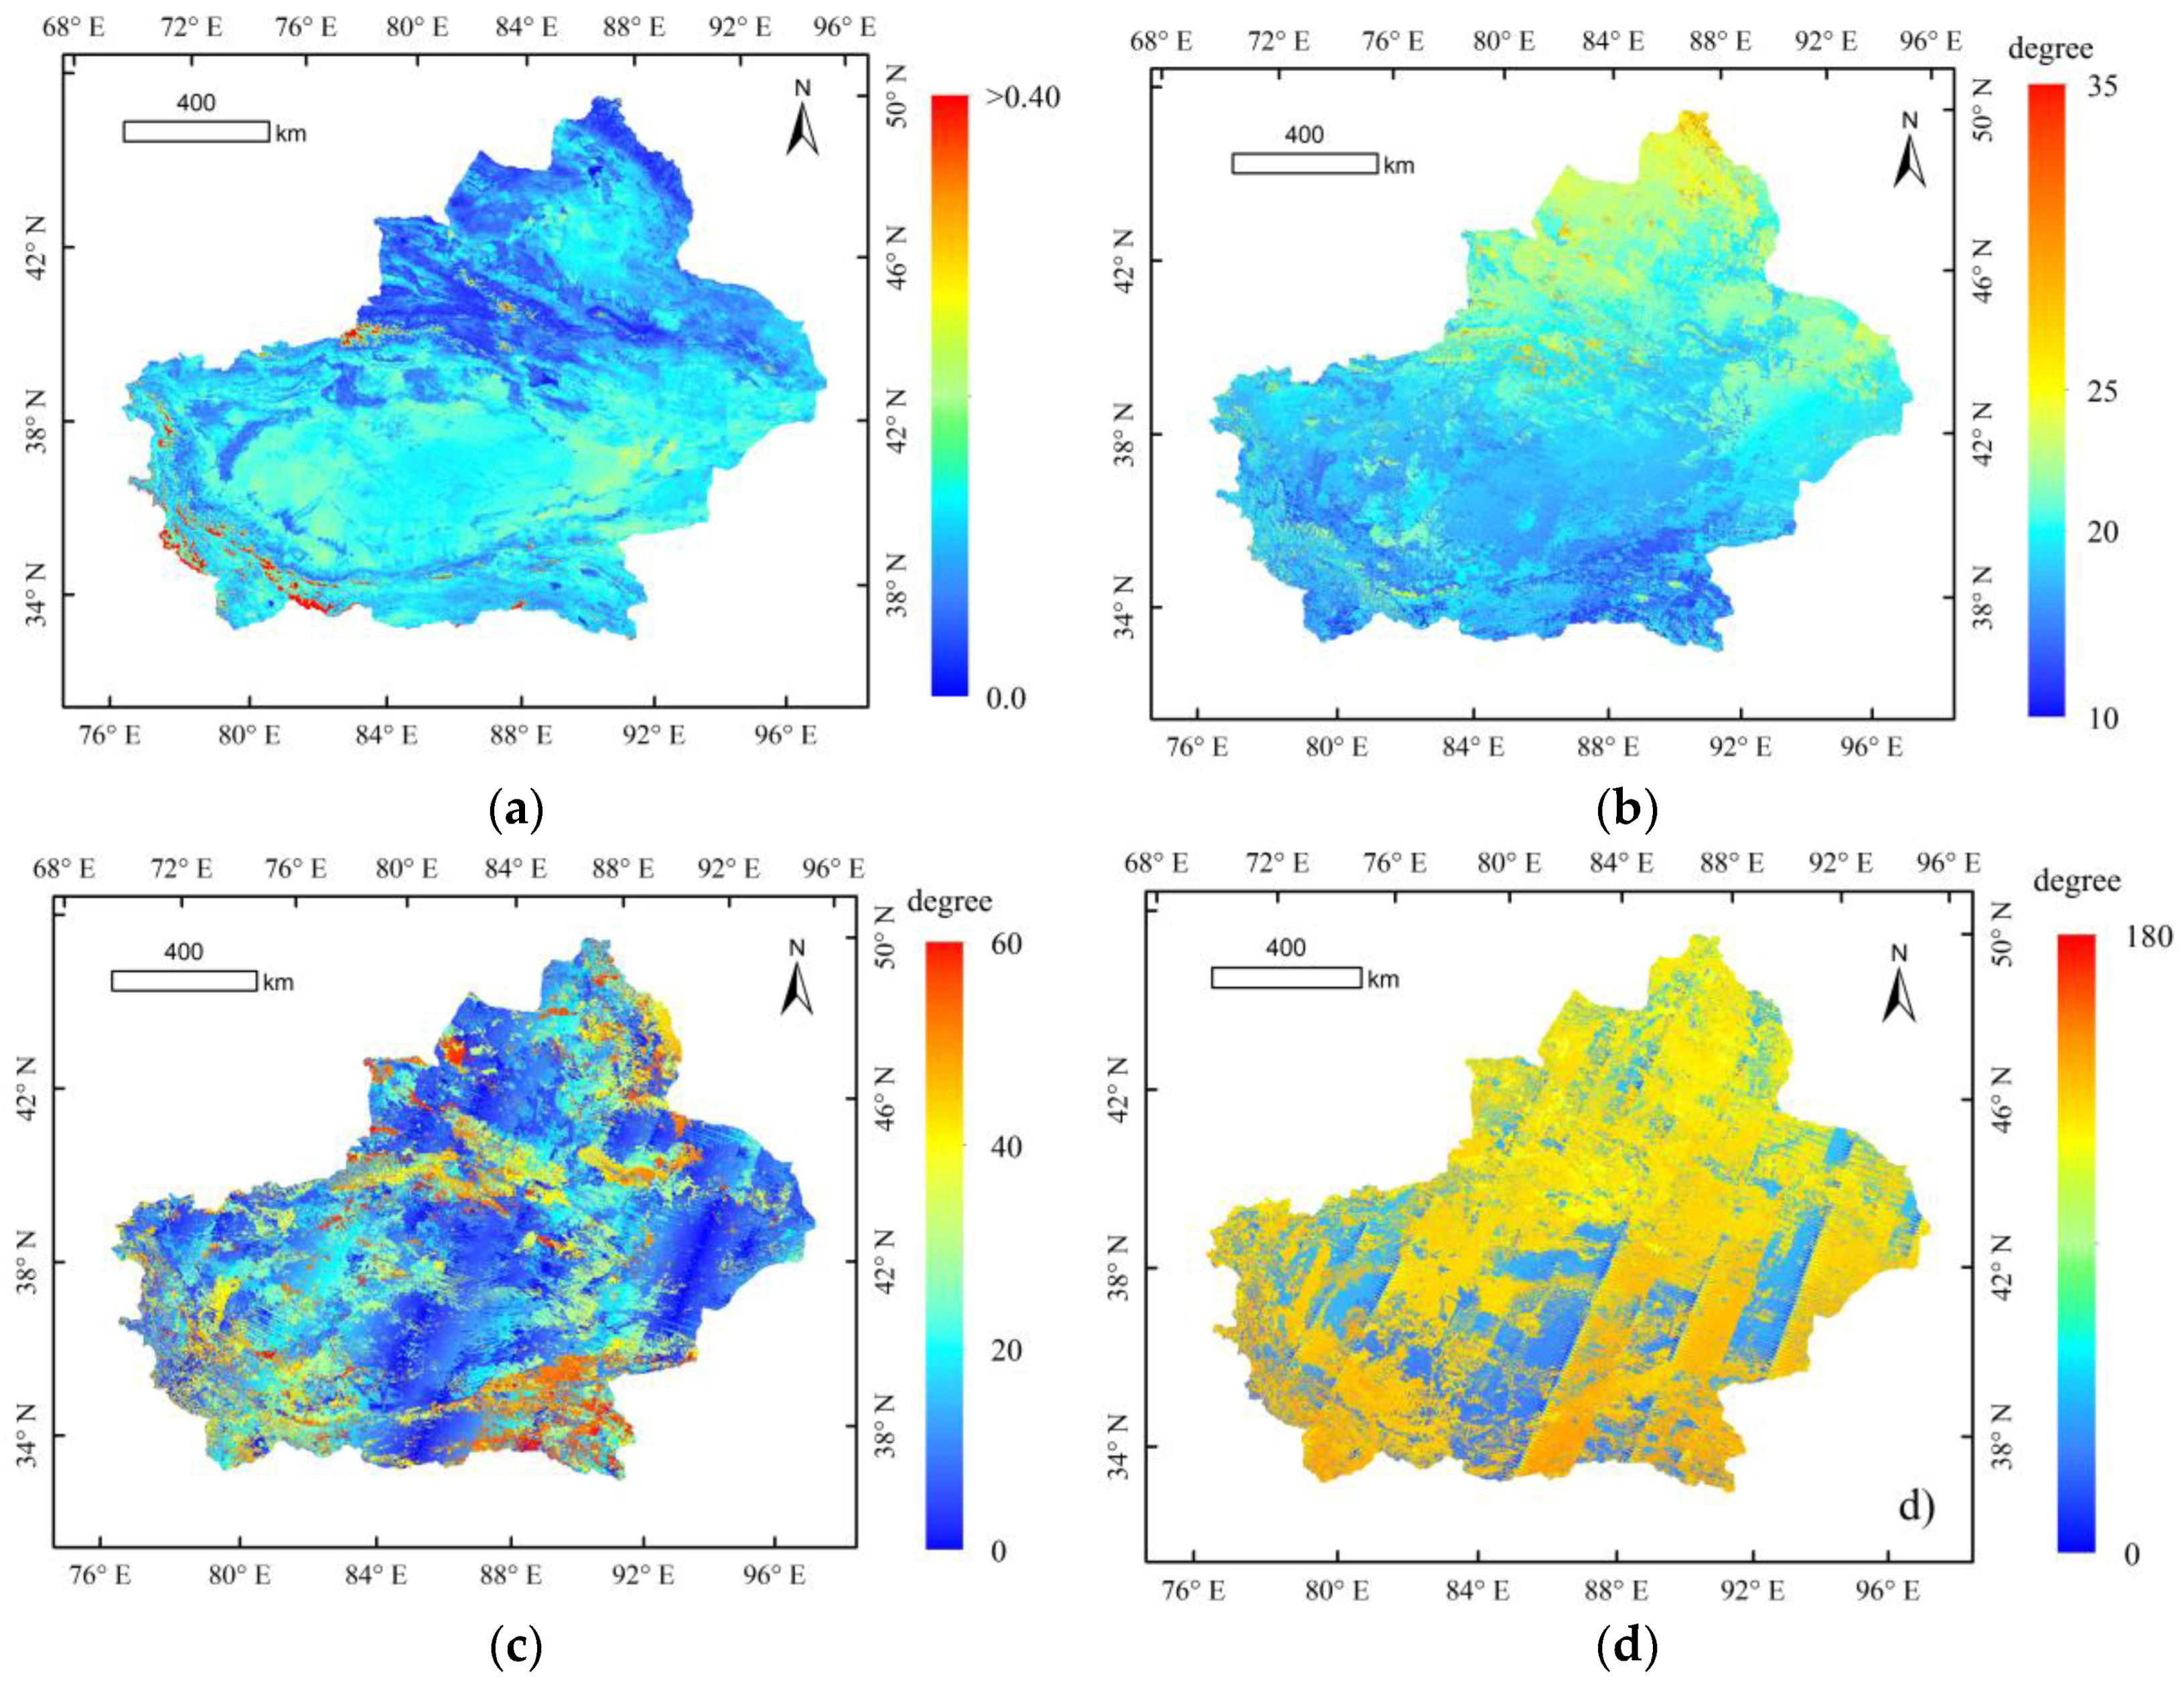
Ideally, the MOD09A1 product should be the surface reflectance corrected for aerosol effect and cloud masked in the quality flag. However, detection of thin cloud or subpixel cloud are difficult, and there is also uncertainly in the aerosol effect correction [31]. Following the approach in the paper by Sun et al. [32], we adopted the criterion of minimum land surface reflectance (MLSR) for database synthesis because it is the most efficient way to avoid cloud contamination. In each 500 m pixel, the lowest surface reflectance value in the twenty images time series, i.e., four images per month for 5 successive years, was identified as the clearest observation. In order to correct the effect of surface bidirectional reflectance in AOD retrieval, the angle information in MOD09A1 was stored in the MLSR database along with the minimum reflectance. Figure 3 shows the distribution of surface reflectance in July, as well as the solar/view zenith and relative azimuth angles.
3.2. BRDF Correction Surface Reflectance
In the aerosol retrieval algorithm, the accurate determination of the surface reflectance is one of the most crucial concerns. For the DB algorithm, the surface reflectance is prescribed by one of several methods, dependent on location, season, and land cover type, from a global surface reflectance database in visible bands. However, all methods do not consider the influence of imaging geometry. As the surface has anisotropic reflection characteristics and the geometric angles of the satellite sensors vary, the surface reflectance of the MLSR is different from that of images used to retrieve AOD. Thus, the pre-calculated MLSR database cannot be directly used for AOD retrieval. In this study, we adopted the kernel-driven BRDF model for the correction of the effects of anisotropic reflection of the surface. The correction model was proposed based on the kernel-driven BRDF model. The kernel-driven BRDF model is a semi-empirical models which is derived as a simplification of physically based BRDF models, with the merit of its linear form and small number of model parameters. It can be generally described by Equation (2) [33]:
where and are the volumetric and geometric kernels, respectively, which are functions of illumination and viewing geometry, describing volume and geometric scattering from surface elements , are the weights for the volumetric and geometric kernels, respectively, and is to the weight of the isotropic reflectance.
By simply normalizing the kernel weights with the isotropic weight, we define the anisotropy shape factors as and . Then, the directional surface reflectance under geometric angle , , can be predicted from the direction surface reflectance in the MLSR database under geometric angle , , , with Equation (3):
Studies show that the combination of Ross–Thick and Li-SparseR (RTLSR) kernels works well with the observed data [34], and the , , and parameters of this combination are provided in the MCD43A1 products. However, as inversion of the BRDF is difficult, the BRDF parameters in MCD43A1 are noisy and cannot be directly used. Vermote et al. showed that the anisotropy of the surface is related to vegetation status [35]. So, in this study, we classify the study area into three categories, i.e., sparse vegetation, median vegetation and dense vegetation, according to the threshold of the Enhanced Vegetation Index (EVI). Statistical mean values of A1 and A2 were calculated for each category from pixels marked as best quality (QC = 0) in the MCD43A1 product. The mean values of A1 and A2 were then applied for all pixels in the category. The statistical mean values of A1 and A2 are shown in Table 3.
3.3. Aerosol Parameter Determination
To reduce the computation requirement, a look-up table (LUT) was constructed using the latest version (Version 2.1 Vector Code) of the 6S (second simulation of the satellite signal in the solar spectrum) (6SV) radiative transfer model (RTM) [36]. The 6SV code is a widely-used radiative transfer code that simulates the satellite signal accounting for elevated targets. One of the practical advantages of 6SV is that it provides standard atmosphere and aerosol models. The 6SV model was used to construct a LUT of atmosphere optical parameters according to the parameters values listed in Table 4.
In this work, the CE-318 ground-based data were used to determine the aerosol microphysical and optical parameters, such as the Ångström exponent (AE), complex refractive index (RI), single scattering albedo (SSA), and asymmetric factor (g). The AE can be used to determine aerosol models; for example, the AE of desert aerosols is −1.0 to 0.5 [37]. For the desert model, the value of the real part of RI is 1.5–1.6 and the value of the imaginary part is approximately 0.01. Table 5 shows the values of the AE and RI in the study. The aerosol optical parameters, including the SSA and g at four wavelengths (i.e., 440, 675, 870, and 1020 nm; Figure 4), were retrieved from sky radiance almucantar measurements and direct sun measurements by a CE-318 sunphotometer. In this study, the first step is to calculate the average values of SSA and g at 440 and 675 nm, and then the inverse distance weighting interpolation [38] is adopted to obtain the values of SSA and g at 550 nm, which is 0.827 and 0.910, respectively.
3.4. Rayleigh Correction for Elevation Effect
Within the MODIS blue wavelength range, where Rayleigh scattering is relatively important compared to longer wavelengths, neglect of polarization in the radiative transfer code leads to significant errors in the calculated reflectances [39]. At sea level, the Rayleigh optical thickness (ROT) at visible channels can be estimated with an empirical function of wavelength [40]:
At a height above sea level, the ROT should be modulated by atmospheric pressure or elevation [41]:
where z is the ground height above sea level in kilometers, and 8.5 is the exponential scale height of the atmosphere. In this study, the MOD03 product was used for providing the altitude z for each pixel.
3.5. Error Indicators
The error statistics of the algorithm were verified by comparing the satellite-retrieved AOD with ground-based measurements from sunphotometers. We used the following four indicators to evaluate the error: the correlation coefficient (R), mean absolute error (MAE), root mean square error (RMSE), and EE. R is an indicator of relative agreement between satellite-retrieved AOD and ground-observed AOD; the MAE is the most natural measure of mean error magnitude; the RMSE is used to measure the systematic and random differences between these two AOD observations; and the EE, representing the confidence envelopes of the retrieval algorithm, is used to evaluate the quality of a new algorithm relative to MODIS C6 AOD. Good matches of satellite-retrieved AOD are reported when the satellite-retrieved AOD falls within the envelope. The statistical indicators are defined as follows:
where is the ground-based sunphotometer measurement of AOD, is the satellite-retrieved AOD; and are average values of and .
4. Results and Discussion
4.1. Spatial Distribution of AOD
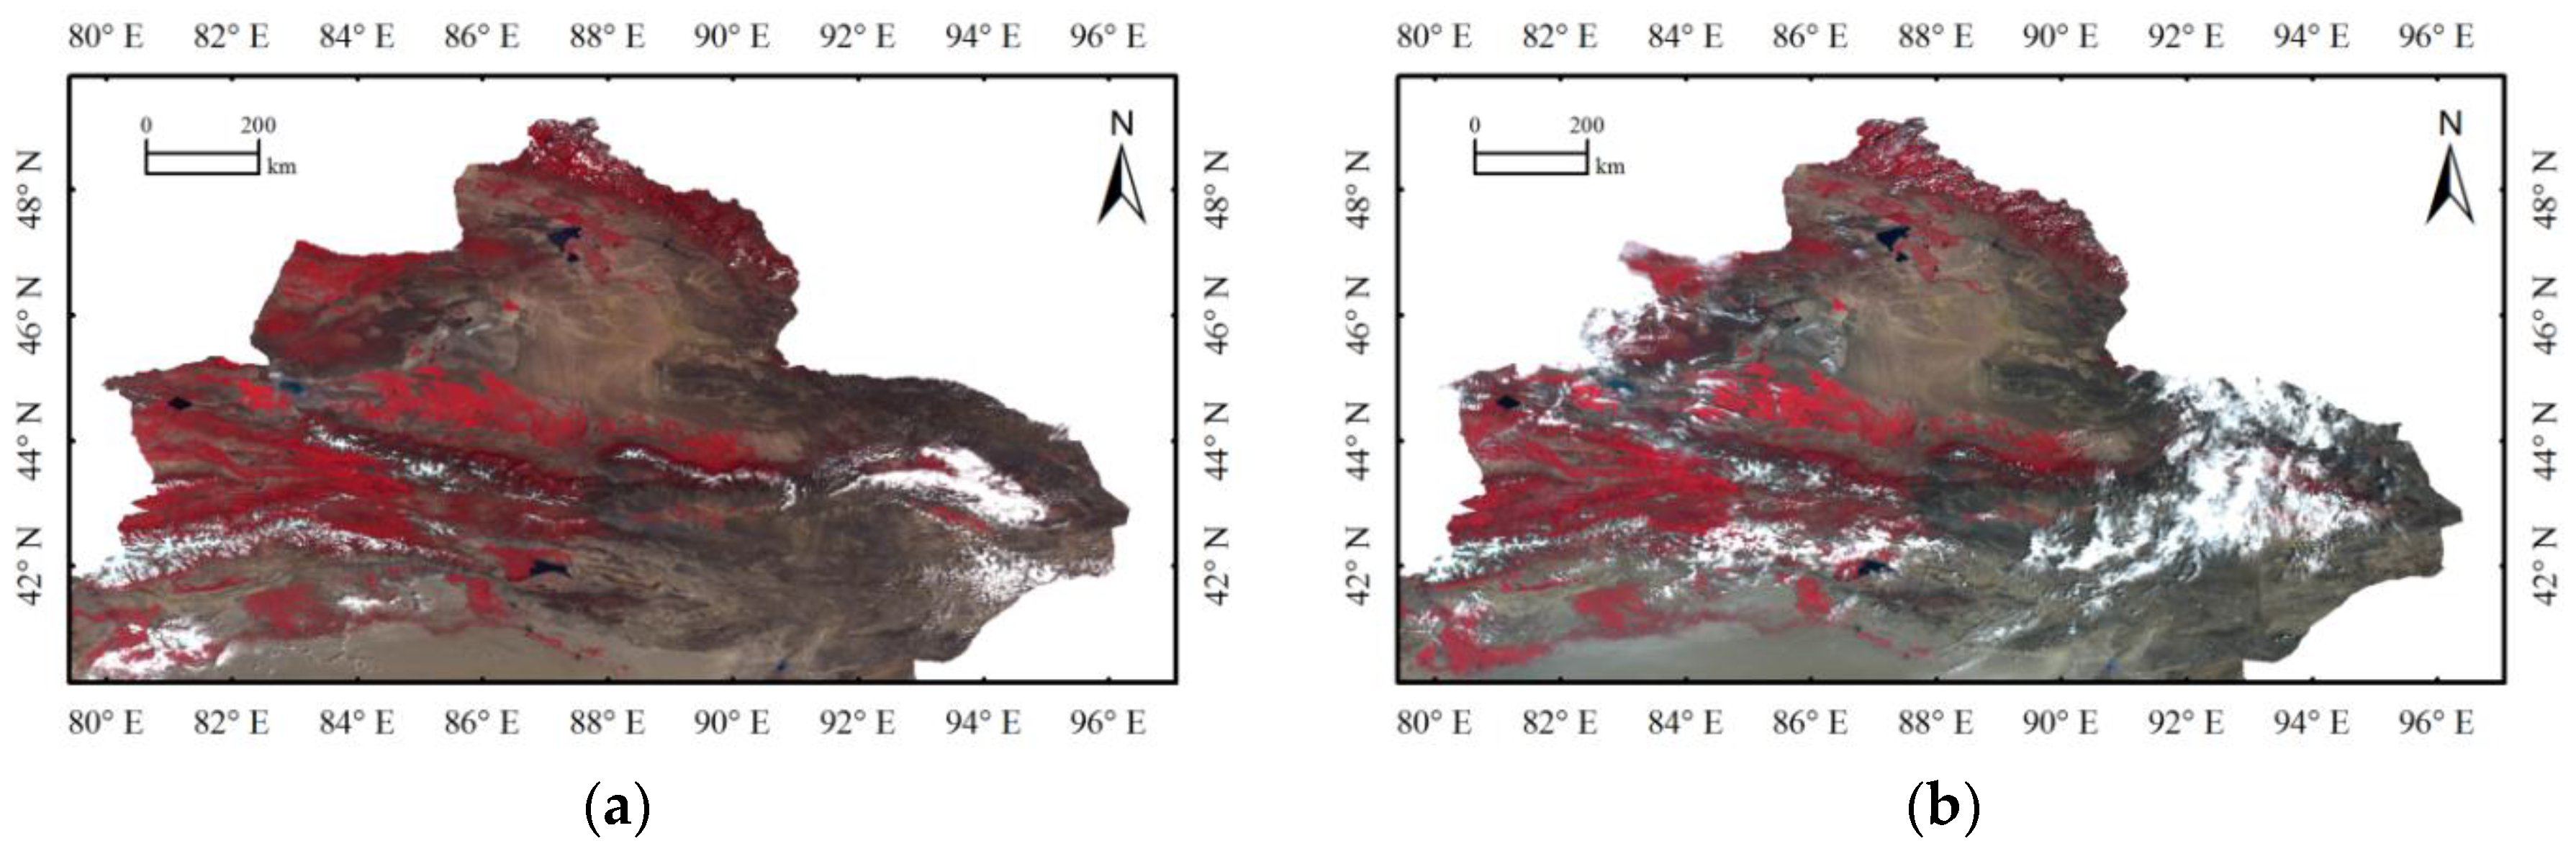
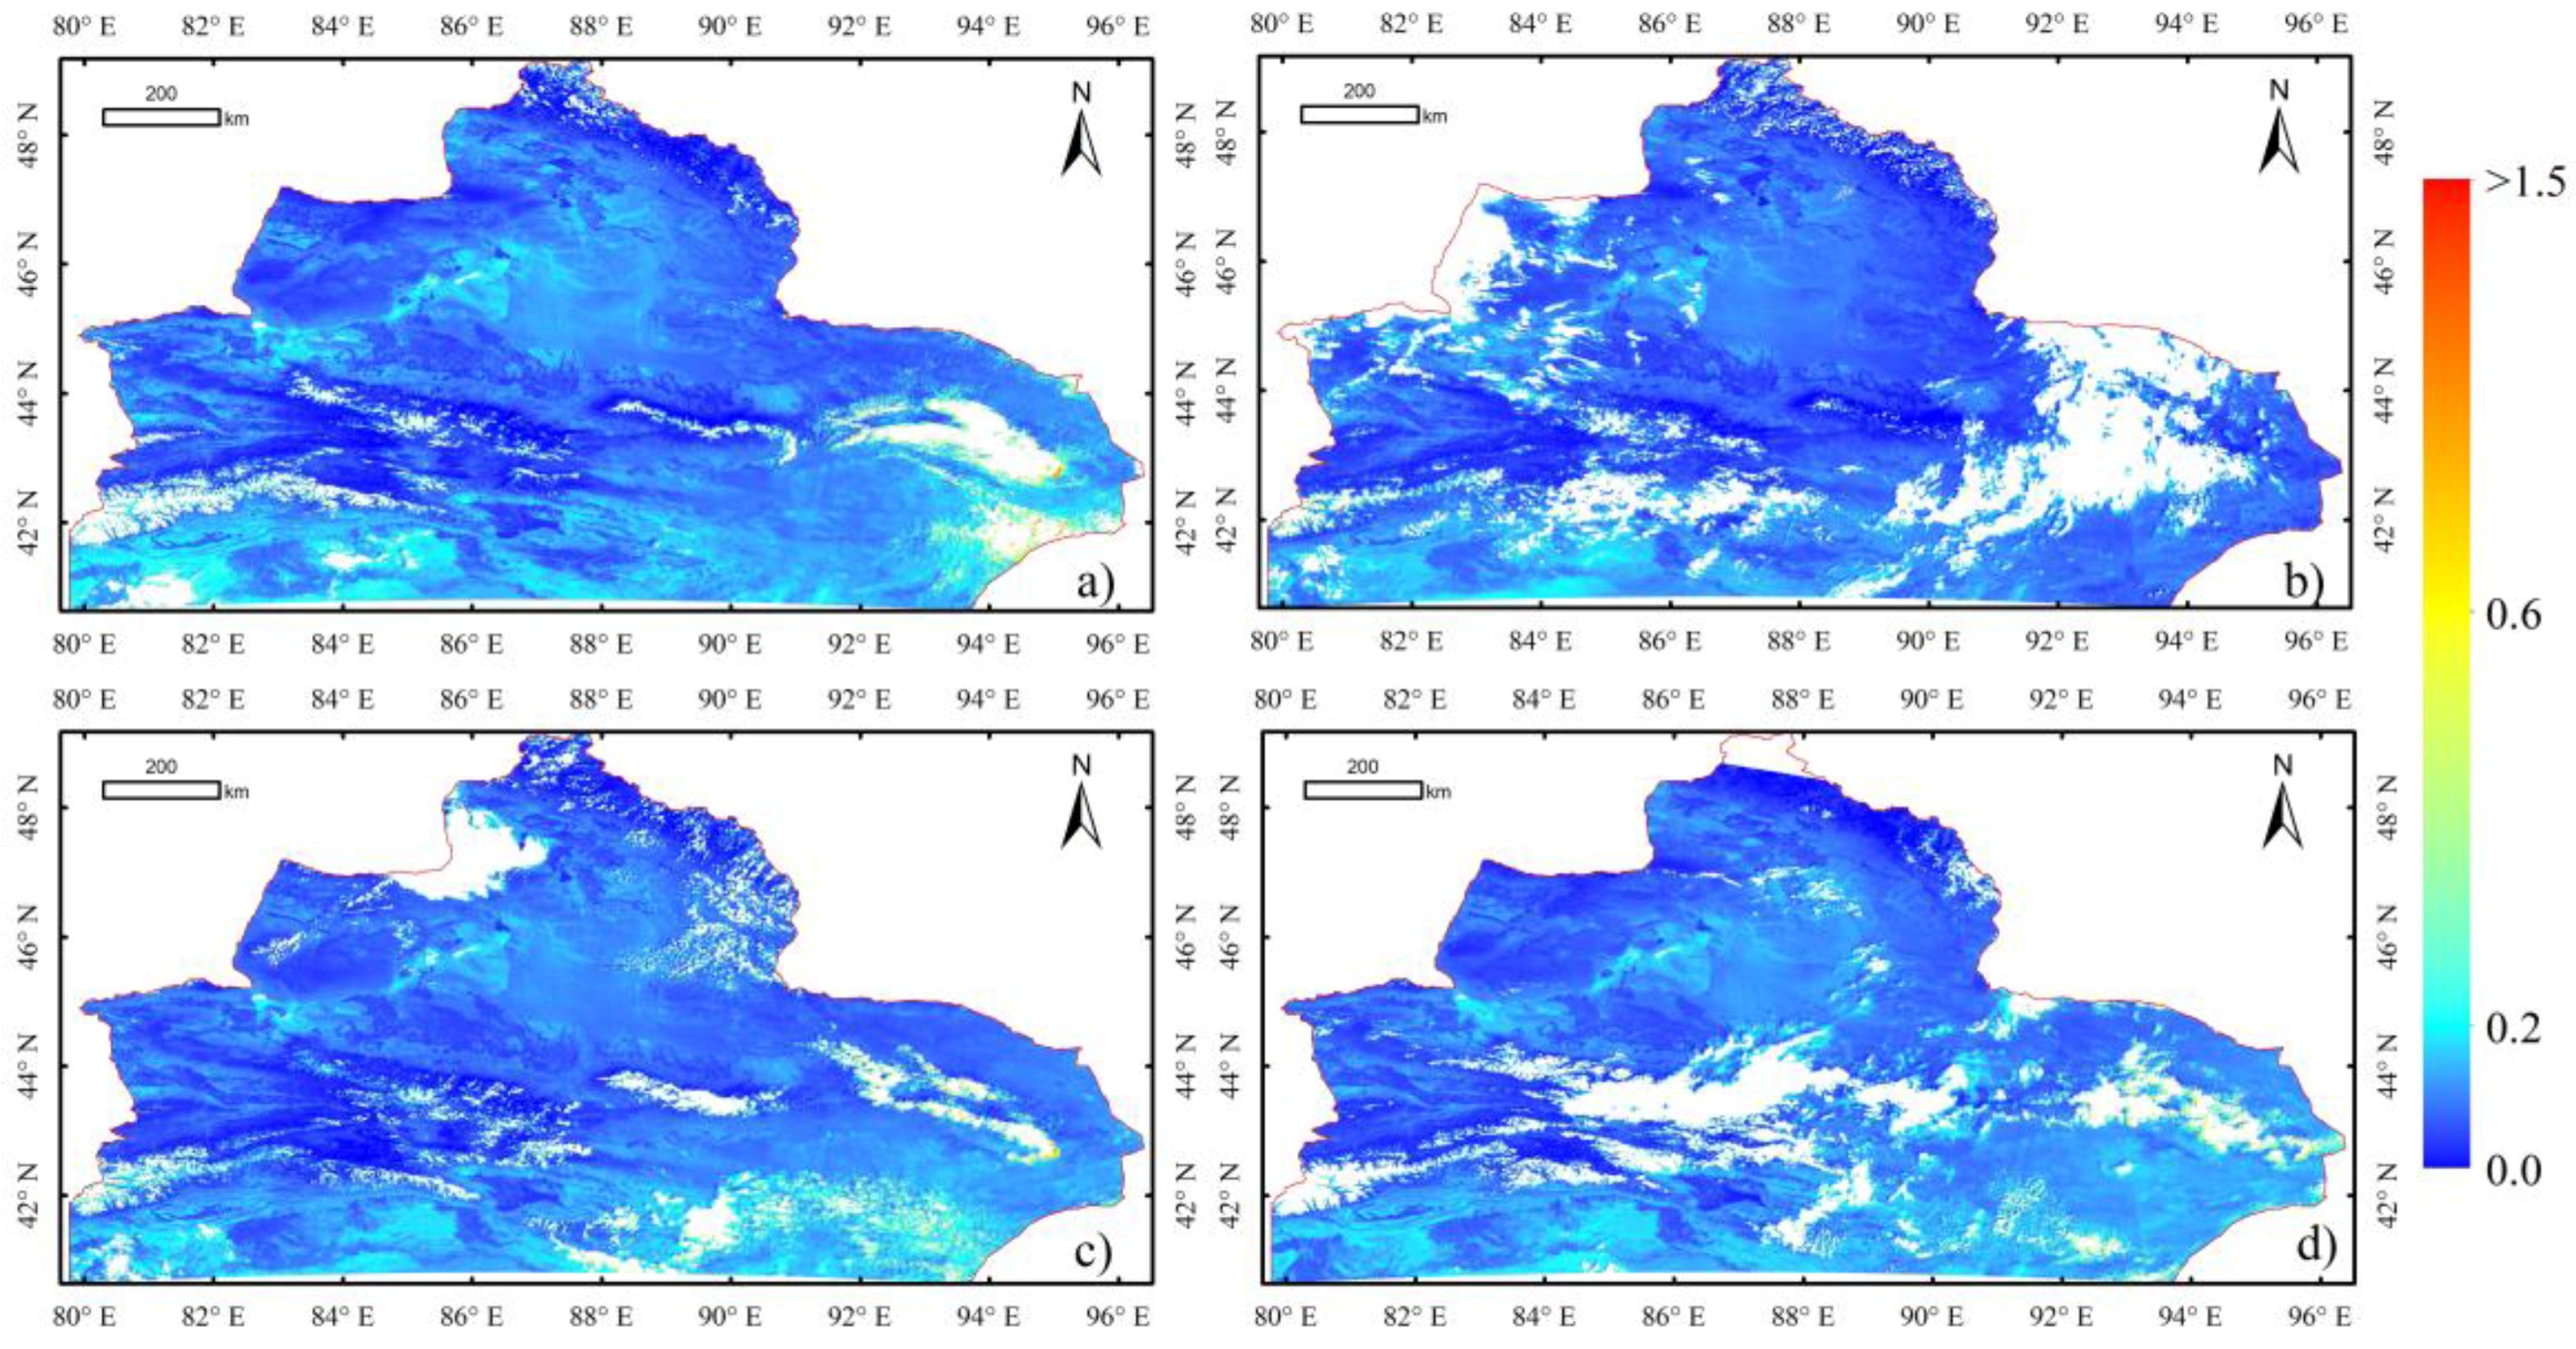
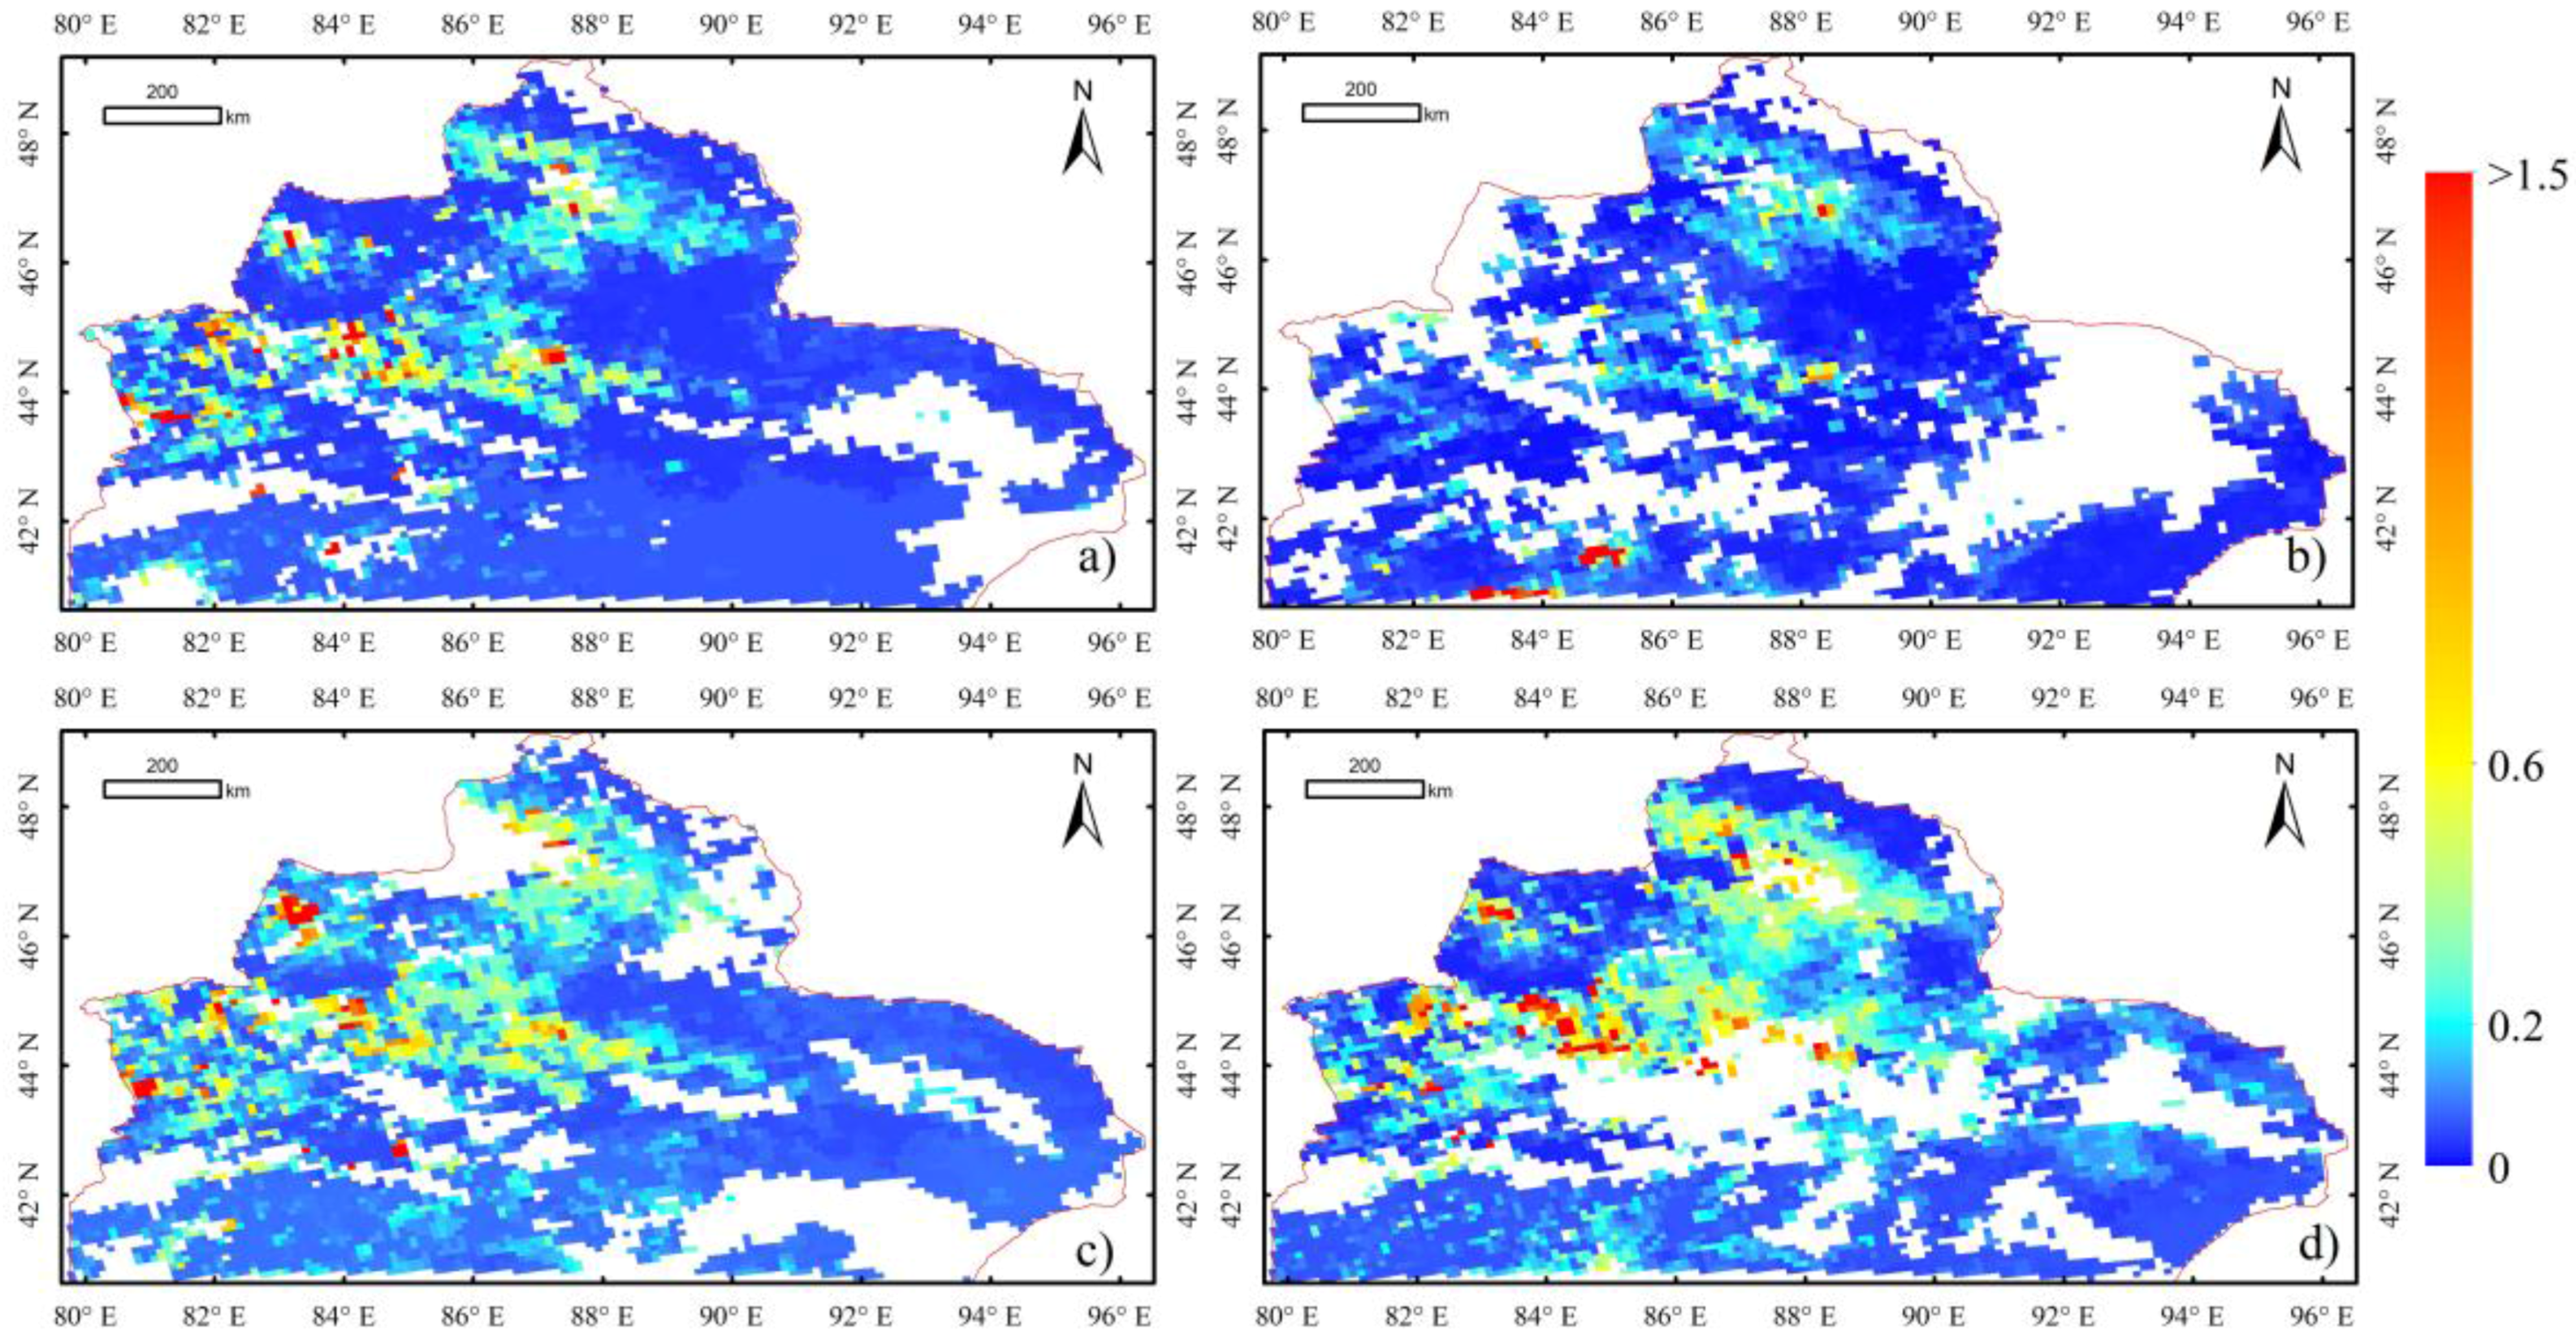
In this study, 55 MOD02HKM images from July and August 2014 were selected to retrieve AOD. Figure 5 shows the MODIS standard false-color images (R, G, B: 2, 1, 4) in the northern Xinjiang area for 11 July, 15 July, 12 August and 21 August 2014. The landscapes of this area includes the Altai Mountains, Tianshan Mountains, and Gurbantunggut Desert, which are located in the Zhungeer basin and exhibit high surface reflectance in the blue band (Figure 3a). Figure 6 shows the spatial distribution of AOD retrieved from MODIS at a 500-m resolution, corresponding to the images in Figure 5. The MODIS C6 DB AOD products (10 km) are shown in Figure 7. The satellite-retrieved AOD from OLI data is more suitable than C6 DB AOD to represent the spatial pattern of aerosols over bright-reflecting source regions of northern Xinjiang. The revealed details in the aerosol distribution and variability are valuable in the study of transient aerosols. These results demonstrate that the new algorithm can achieve a continuous AOD distribution even in the bare land or desert areas, which have a high reflectance.
4.2. Validation
The satellite-retrieved AOD were validated at the two ground sites. As satellite-retrieved AOD retrievals are at 550 nm, the ground observations are not available at this wavelength, data are interpolated to 550 nm using the Ångström function [42], defined as
where is the AOD at wavelength , is the turbidity factor, and is the band index. and can be estimated from sunphotometer observations of AOD at two wavelengths and , with the following expression:
Referring to the results of previous studies [43,44], the nearest available pair of wavelengths from CE-318 and Microtops II sunphotometer (normally 675 nm and either 440 or 500 nm) are used.
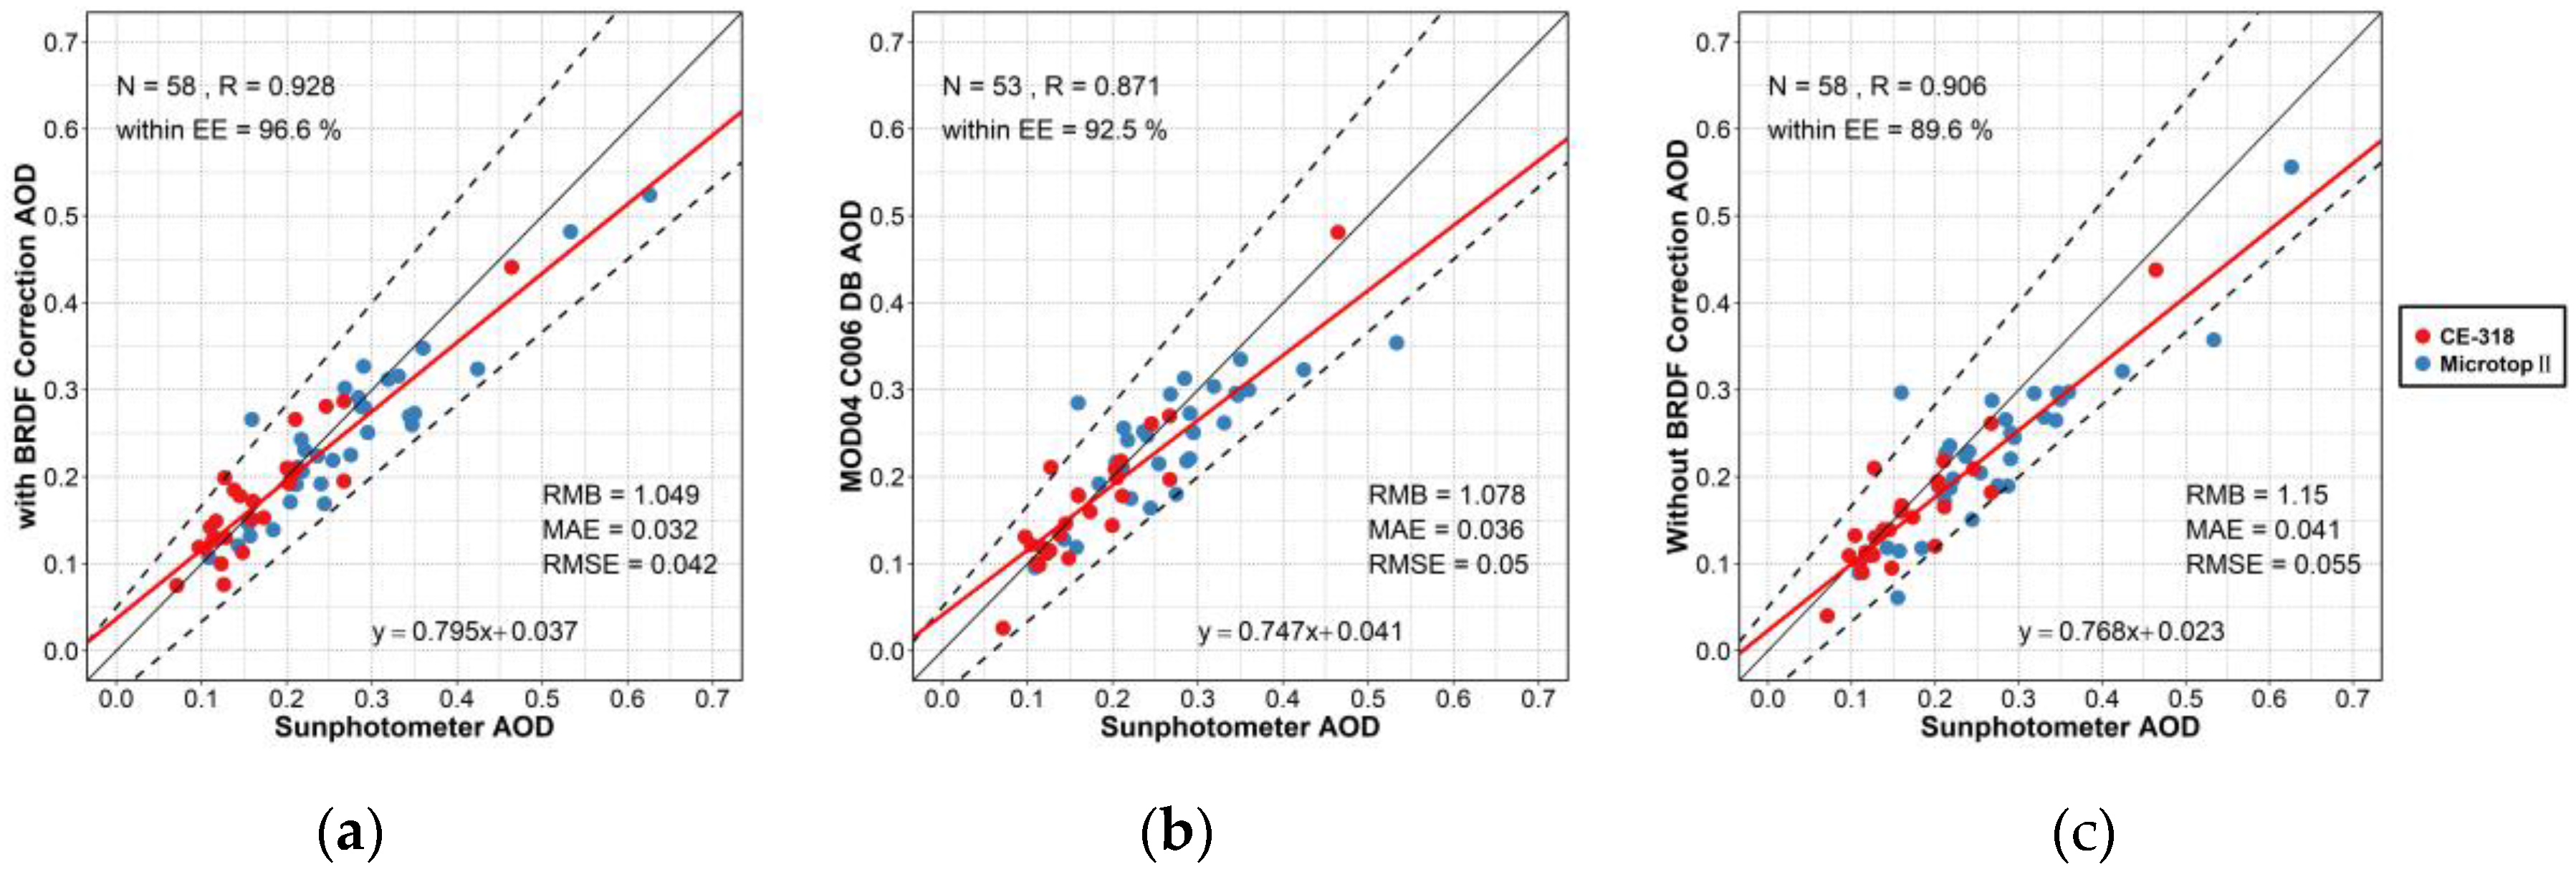
In this study, to match the instantaneous AOD value provided by satellites with the repeated measurements observed by sunphotometers, we followed the matchup methodology of Ichoku et al. [45]. The ground-observed data averaged within 30 min of the MODIS overpass are extracted and compared with MODIS AOD data averaged within 1.5 km (3 × 3 pixels) surrounding of the ground site. A total of 32 and 26 of the satellite-retrieved AOD observations coincided with Dahuangshan and Wucaiwan AOD measurements, as shown in Table 6. The AOD from the new algorithm achieved high correlation (~0.918–0.928) with low absolute error (~0.025–0.037), relative error (~13.9–16.7%) and the percentage falling within the EE of the collocations is ~96.9%, 96.2% at the Dahuangshan and Wucaiwan site, respectively. The total average absolute error and relative error were ~0.036 and ~16.6%, respectively, and with ~96.6% collocations falling within the EE envelope. These results indicate that the new algorithm could retrieve AOD with high accuracy and stability.
Figure 8 shows the scatter plots of the satellite-retrieved AOD against those obtained from the ground-based sunphotometer during the study period. Figure 8a is the results of the proposed algorithm. Figure 8b is the scatter plots of MODIS DB AOD at 10 km resolution against ground-based measurements. Figure 8c is the result of retrieved AOD without angle normalization, which used the same pre-calculated MLSR database as Figure 8a. It is evident that the new algorithm retrievals have the highest percentage within EE (~96.6%), highest correlations with AERONET AOD measurements (R = ~0.928) and smallest RMSE (~0.042) and MAE (~0.032). The AOD from MODIS DB was also highly correlated (R = 0.871), and the RMSE was 0.050 and MAE was 0.036. Nearly 92.5% of the collections fell within the EE envelope. Notably, the retrieved AOD values from new algorithm were close to the 1:1 line (slope = ~0.795, intercept = ~0.037), whereas the DB AODs were far from the line (slope = ~0.747, intercept = ~0.041). The retrieved AOD form without angle normalization has relatively low accuracy, with R = ~0.906, RMSE = ~0.055, and MAE = ~0.041. Only nearly 89.6% of the collocations fell within the EE envelope. This implies that angle normalization can improve the retrieval accuracy and is necessary for the AOD retrieval.
4.3. Uncertainty Analysis
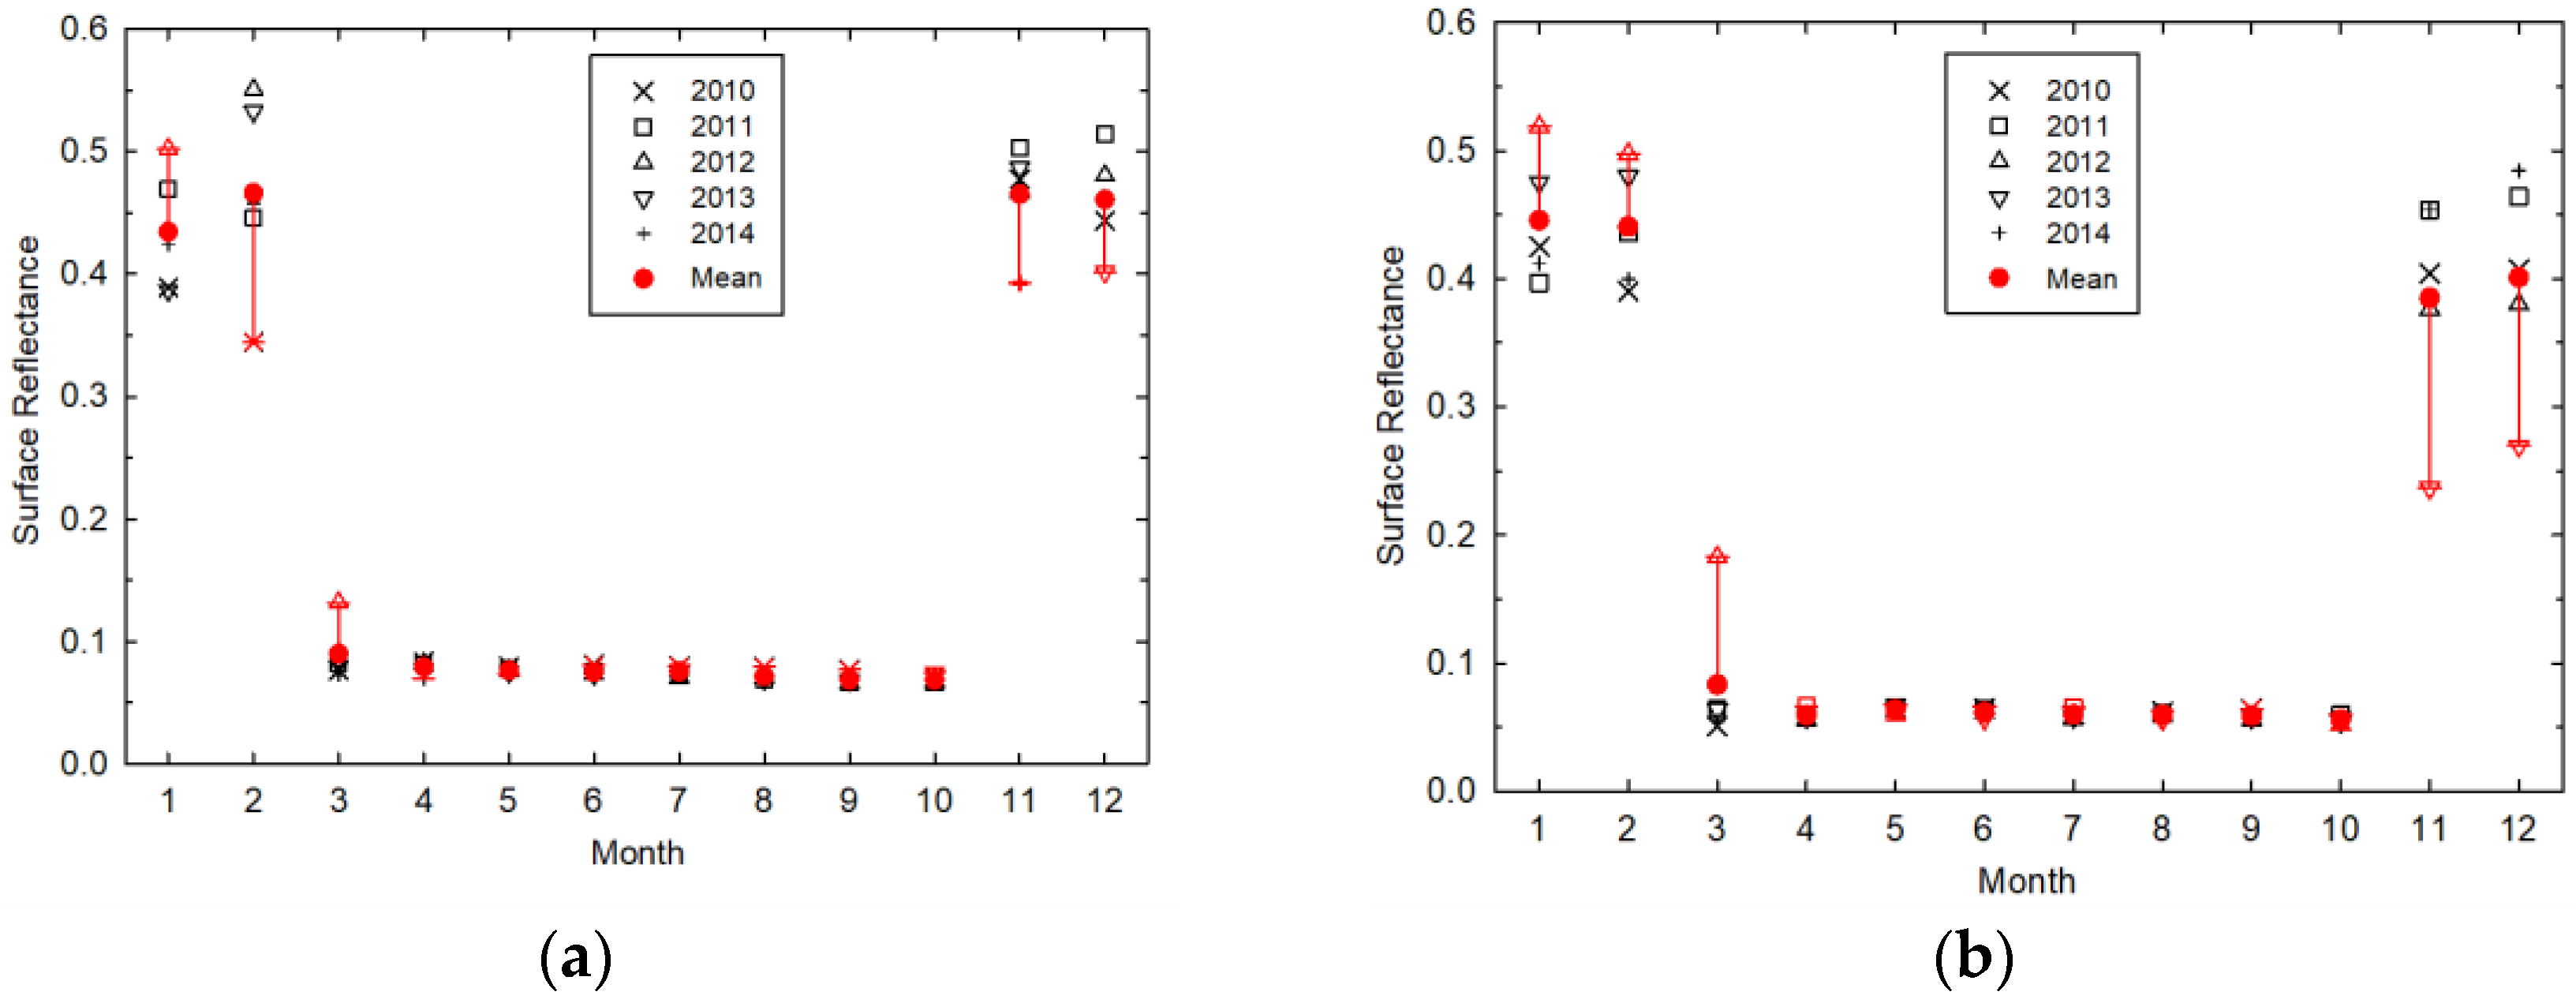
Errors in AOD retrieval are attributed to several factors, including surface reflectance estimation and the aerosol model [46]. In this study, we assumed the change in surface reflectance within a few days to be negligible and thus determined the surface reflectance from the MLSR database and BRDF correction model. Changes in land cover doubtlessly lead to some errors in determining the true reflectance. Studies by Kaufman et al. show that errors of about 0.01 in assumed surface reflectance lead to errors on the order of 0.1 in AOD retrieval [47]. The land cover in Xinjiang has a strong seasonal cycle; most of the area is covered by sparse and dry vegetation between March and October, and snow is frequent in winter [48]. Figure 9a,b shows the variations in surface reflectance in the blue band around the two sites from MODIS data during the same month in different years. As shown in Figure 9, the yearly variation in the same month was small and mainly in a range of 0.01, except for winter. The surface reflectance exhibited a stable variation during April to October, with an absolute difference value of ±0.01. However, the surface reflectance decreased by almost 0.35 from February to March; and increased by 0.40 from October to November. Such a variation is related to the snow melting and accumulation in March and November, respectively. In addition, due to the differences in snowfall in different years, the change in surface reflectance in winter is more obvious than in other seasons. Thus, it is not appropriate to determine surface reflectance through the MLSR database from November to February.
5. Conclusions
In this study, a modified aerosol retrieval algorithm was proposed for retrieving AOD over the arid/semiarid region of northern Xinjiang from MODIS data at 500 m spatial resolution. The assumptions in this algorithm are as follows: the variation in surface reflectance is small over a month, and single scattering albedo (SSA) and asymmetry factors (g) are regionally constant for a few days. The MODIS surface reflectance products (MOD09A1) were used to determine the surface reflectance, and a LUT was constructed based on the 6SV RTM, which uses SSA and g values from ground-based measurements. The retrieved AOD values were validated by ground-based sunphotometer observations in two sites and compared with the MODIS DB AOD products. The results show that the new algorithm accurately retrieved aerosol AOD over the arid/semiarid region of northern Xinjiang, and the retrieved aerosol distribution contained more spatial details and variability than that of the DB AOD products. In this study, a BRDF correction model was applied to reduce the effect of surface reflectance anisotropy in AOD retrieval; thus, the retrieval ability is improved especially over the area with obvious surface bidirectional reflectance characteristics. However, according to the uncertainty analysis, the proposed algorithm has some limitations that should be improved: (1) Errors may occur by using constant values of SSA and g for the day of retrieval; (2) the MLSR database approach was sometimes found to be unsuccessful over snow surfaces, particularly when seasonal changes are significant, such as the snow melting in March and accumulation in November, respectively; (3) the BRDF correction only considered the mean values of anisotropy shape factors; thus, it ignored the variation of BRDF shape within the categories of land surface. These limitations will be explored in our future studies.
Acknowledgments
The authors acknowledge the NASA Goddard Space Flight Center for providing the MODIS data. This study was supported by the National Natural Science Foundation of China (41371356), the Fundamental Research Funds for the Central Universities (312231103) and the State’s Key Project of Research and Development Plan of China (2016YFA0600103).
Author Contributions
Xinpeng Tian and Lin Sun performed the new AOD algorithm research and prepared the paper. Sihai Liu helped with the ground-based data and satellite remote sensing data collection and processing. Qiang Liu provided advice and suggestions.
Conflicts of Interest
The authors declare no conflict of interest.
References
- Zhang, X.X.; Sharratt, B.; Chen, X.; Wang, Z.F.; Liu, L.Y.; Guo, Y.H.; Li, J.; Chen, H.S.; Yang, W.Y. Dust deposition and ambient PM 10 concentration in Northwest China: Spatial and temporal variability. Atmos. Chem. Phys. 2017, 17, 1699–1711. [Google Scholar] [CrossRef]
- Mamtimin, B.; Meixner, F.X. Air pollution and meteorological processes in the growing dryland city of urumqi (Xinjiang, China). Sci. Total Environ. 2011, 409, 1277–1290. [Google Scholar] [CrossRef] [PubMed]
- Ramanathan, V.; Crutzen, P.J.; Kiehl, J.T.; Rosenfeld, D. Atmosphere—Aerosols, climate, and the hydrological cycle. Science 2001, 294, 2119–2124. [Google Scholar] [CrossRef] [PubMed]
- Klemm, R.J.; Mason, R.M. Aerosol research and inhalation epidemiological study (ARIES): Air quality and daily mortality statistical modeling—Interim results. J. Air Waste Manag. 2000, 50, 1433–1439. [Google Scholar] [CrossRef] [PubMed]
- Cheung, H.C.; Wang, T.; Baumann, K.; Guo, H. Influence of regional pollution outflow on the concentrations of fine particulate matter and visibility in the coastal area of southern china. Atmos. Environ. 2005, 39, 6463–6474. [Google Scholar] [CrossRef]
- Pope, C.A.; Ezzati, M.; Dockery, D.W. Fine particulate air pollution and life expectancies in the united states: The role of influential observations. J. Air Waste Manag. 2013, 63, 129–132. [Google Scholar] [CrossRef]
- Mao, J.D.; Sheng, H.J.; Zhao, H.; Zhou, C.Y. Observation study on the size distribution of sand dust aerosol particles over Yinchuan, China. Adv. Meteorol. 2014, 2014, 157645. [Google Scholar] [CrossRef]
- Xin, J.Y.; Du, W.P.; Wang, Y.S.; Gao, Q.X.; Li, Z.Q.; Wang, M.X. Aerosol optical properties affected by a strong dust storm over central and northern china. Adv. Atmos. Sci. 2010, 27, 562–574. [Google Scholar] [CrossRef]
- Sun, L.; Li, R.B.; Tian, X.P.; Wei, J. Analysis of the temporal and spatial variation of aerosols in the Beijing-Tianjin-Hebei region with a 1 km aod product. Aerosol. Air Qual. Res. 2017, 17, 923–935. [Google Scholar] [CrossRef]
- Torres, O.; Bhartia, P.K.; Herman, J.R.; Sinyuk, A.; Ginoux, P.; Holben, B. A long-term record of aerosol optical depth from toms observations and comparison to aeronet measurements. J. Atmos. Sci. 2002, 59, 398–413. [Google Scholar] [CrossRef]
- Prados, A.I.; Kondragunta, S.; Ciren, P.; Knapp, K.R. Goes aerosol/smoke product (GASP) over north america: Comparisons to aeronet and modis observations. J. Geophys. Res. Atmos. 2007, 112. [Google Scholar] [CrossRef]
- Torres, O.; Tanskanen, A.; Veihelmann, B.; Ahn, C.; Braak, R.; Bhartia, P.K.; Veefkind, P.; Levelt, P. Aerosols and surface UV products from ozone monitoring instrument observations: An overview. J. Geophys. Res. Atmos. 2007, 112. [Google Scholar] [CrossRef]
- Vidot, J.; Santer, R.; Aznay, O. Evaluation of the meris aerosol product over land with aeronet. Atmos. Chem. Phys. 2008, 8, 7603–7617. [Google Scholar] [CrossRef]
- Riffler, M.; Popp, C.; Hauser, A.; Fontana, F.; Wunderle, S. Validation of a modified AVHRR aerosol optical depth retrieval algorithm over central Europe. Atmos. Meas. Tech. 2010, 3, 1255–1270. [Google Scholar] [CrossRef] [Green Version]
- Kahn, R.A.; Gaitley, B.J.; Garay, M.J.; Diner, D.J.; Eck, T.F.; Smirnov, A.; Holben, B.N. Multiangle imaging spectroradiometer global aerosol product assessment by comparison with the aerosol robotic network. J. Geophys. Res. Atmos. 2010, 115. [Google Scholar] [CrossRef]
- Sayer, A.M.; Hsu, N.C.; Bettenhausen, C.; Jeong, M.J.; Holben, B.N.; Zhang, J. Global and regional evaluation of over-land spectral aerosol optical depth retrievals from seawifs. Atmos. Meas. Tech. 2012, 5, 1761–1778. [Google Scholar] [CrossRef]
- Levy, R.C.; Mattoo, S.; Munchak, L.A.; Remer, L.A.; Sayer, A.M.; Patadia, F.; Hsu, N.C. The collection 6 modis aerosol products over land and ocean. Atmos. Meas. Tech. 2013, 6, 2989–3034. [Google Scholar] [CrossRef]
- Jackson, J.M.; Liu, H.Q.; Laszlo, I.; Kondragunta, S.; Remer, L.A.; Huang, J.F.; Huang, H.C. Suomi-NPP VIIRS aerosol algorithms and data products. J. Geophys. Res. Atmos. 2013, 118, 12673–12689. [Google Scholar] [CrossRef]
- Remer, L.A.; Mattoo, S.; Levy, R.C.; Munchak, L.A. Modis 3 km aerosol product: Algorithm and global perspective. Atmos. Meas. Tech. 2013, 6, 1829–1844. [Google Scholar] [CrossRef]
- Hsu, N.C.; Tsay, S.C.; King, M.D.; Herman, J.R. Aerosol properties over bright-reflecting source regions. IEEE Trans. Geosci. Remote Sens. 2004, 42, 557–569. [Google Scholar] [CrossRef]
- Wei, J.; Sun, L. Comparison and evaluation of different modis aerosol optical depth products over the Beijing-Tianjin-Hebei region in china. IEEE J. Sel. Top. Appl. Earth Obs. Remote Sens. 2017, 10, 835–844. [Google Scholar] [CrossRef]
- Bilal, M.; Nichol, J.E. Evaluation of modis aerosol retrieval algorithms over the Beijing-Tianjin-Hebei region during low to very high pollution events. J. Geophys. Res. Atmos. 2015, 120, 7941–7957. [Google Scholar] [CrossRef]
- Tao, M.H.; Wang, Z.F.; Tao, J.H.; Chen, L.; Wang, J.; Hou, C.; Wang, L.C.; Xu, X.G.; Zhu, H. How do aerosol properties affect the temporal variation of MODIS AOD bias in Eastern China? Remote Sens. (Basel) 2017, 9, 800. [Google Scholar] [CrossRef]
- Koelemeijer, R.B.A.; de Haan, J.F.; Stammes, P. A database of spectral surface reflectivity in the range 335-772 nm derived from 5.5 years of GOME observations. J. Geophys. Res. Atmos. 2003, 108. [Google Scholar] [CrossRef]
- Herman, J.R.; Celarier, E.A. Earth surface reflectivity climatology at 340–380 nm from toms data. J. Geophys. Res. Atmos. 1997, 102, 28003–28011. [Google Scholar] [CrossRef]
- Holben, B.N.; Eck, T.F.; Slutsker, I.; Tanre, D.; Buis, J.P.; Setzer, A.; Vermote, E.; Reagan, J.A.; Kaufman, Y.J.; Nakajima, T.; et al. Aeronet—A federated instrument network and data archive for aerosol characterization. Remote Sens. Environ. 1998, 66, 1–16. [Google Scholar] [CrossRef]
- Eck, T.F.; Holben, B.N.; Reid, J.S.; Dubovik, O.; Smirnov, A.; O’Neill, N.T.; Slutsker, I.; Kinne, S. Wavelength dependence of the optical depth of biomass burning, urban, and desert dust aerosols. J. Geophys. Res. Atmos. 1999, 104, 31333–31349. [Google Scholar] [CrossRef]
- Knobelspiesse, K.D.; Pietras, C.; Fargion, G.S.; Wang, M.H.; Frouin, R.; Miller, M.A.; Subramaniam, A.; Balch, W.M. Maritime aerosol optical thickness measured by handheld sun photometers. Remote Sens. Environ. 2004, 93, 87–106. [Google Scholar] [CrossRef]
- Morys, M.; Mims, F.M.; Hagerup, S.; Anderson, S.E.; Baker, A.; Kia, J.; Walkup, T. Design, calibration, and performance of microtops II handheld ozone monitor and sun photometer. J. Geophys. Res. Atmos. 2001, 106, 14573–14582. [Google Scholar] [CrossRef]
- Sun, L.; Wei, J.; Wang, J.; Mi, X.T.; Guo, Y.M.; Lv, Y.; Yang, Y.K.; Gan, P.; Zhou, X.Y.; Jia, C.; et al. A universal dynamic threshold cloud detection algorithm (UDTCDA) supported by a prior surface reflectance database. J. Geophys. Res. Atmos. 2016, 121, 7172–7196. [Google Scholar] [CrossRef]
- Vermote, E.; Kotchenova, S. Mod09 User’s Guide (J/OL). Available online: http://modis-sr.ltdri.org (accessed on 20 November 2017).
- Sun, L.; Wei, J.; Bilal, M.; Tian, X.P.; Jia, C.; Guo, Y.M.; Mi, X.T. Aerosol optical depth retrieval over bright areas using landsat 8 oli images. Remote Sens. (Basel) 2016, 8, 23. [Google Scholar] [CrossRef]
- Roujean, J.L.; Leroy, M.; Deschamps, P.Y. A bidirectional reflectance model of the earths surface for the correction of remote-sensing data. J. Geophys. Res. Atmos. 1992, 97, 20455–20468. [Google Scholar] [CrossRef]
- Lucht, W.; Schaaf, C.B.; Strahler, A.H. An algorithm for the retrieval of albedo from space using semiempirical brdf models. IEEE Trans. Geosci. Remote Sens. 2000, 38, 977–998. [Google Scholar] [CrossRef]
- Vermote, E.; Justice, C.O.; Breon, F.M. Towards a generalized approach for correction of the BRDF effect in modis directional reflectances. IEEE Trans. Geosci. Remote Sens. 2009, 47, 898–908. [Google Scholar] [CrossRef]
- Vermote, E.F.T.D.; Deuze, J.L.; Herman, M.; Morcrette, J.J. Second Simulation of a Satellite Signal in the Solar Spectrum-Vector (6SV). Available online: http://6s.ltdri.org/files/tutorial/6S_Manual_Part_1.pdf (accessed on 23 November 2017).
- Tanre, D.; Kaufman, Y.J.; Holben, B.N.; Chatenet, B.; Karnieli, A.; Lavenu, F.; Blarel, L.; Dubovik, O.; Remer, L.A.; Smirnov, A. Climatology of dust aerosol size distribution and optical properties derived from remotely sensed data in the solar spectrum. J. Geophys. Res. Atmos. 2001, 106, 18205–18217. [Google Scholar] [CrossRef]
- Watson, D.F.; Philip, G.M. A refinement of inverse distance weighted interpolation. Geoprocessing 1985, 2, 315–327. [Google Scholar]
- Miishchenko, M.I.; Travis, L.D. Light-scattering by polydispersions of randomly oriented spheroids with sizes comparable to wavelengths of observation. Appl. Opt. 1994, 33, 7206–7225. [Google Scholar] [CrossRef] [PubMed]
- Bodhaine, B.A.; Wood, N.B.; Dutton, E.G.; Slusser, J.R. On rayleigh optical depth calculations. J. Atmos. Ocean. Technol. 1999, 16, 1854–1861. [Google Scholar] [CrossRef]
- Bucholtz, A. Rayleigh-scattering calculations for the terrestrial atmosphere. Appl. Opt. 1995, 34, 2765–2773. [Google Scholar] [CrossRef] [PubMed]
- Angstrom, A. The parameters of atmospheric turbidity. Tellus 1964, 16, 64–75. [Google Scholar] [CrossRef]
- Adames, A.F.; Reynolds, M.; Smirnov, A.; Covert, D.S.; Ackerman, T.P. Comparison of moderate resolution imaging spectroradiometer ocean aerosol retrievals with ship-based sun photometer measurements from the around the americas expedition. J. Geophys. Res. Atmos. 2011, 116. [Google Scholar] [CrossRef]
- Tian, X.P.; Sun, L. Retrieval of aerosol optical depth over arid areas from modis data. Atmosphere (Basel) 2016, 7, 134. [Google Scholar] [CrossRef]
- Ichoku, C.; Chu, D.A.; Mattoo, S.; Kaufman, Y.J.; Remer, L.A.; Tanre, D.; Slutsker, I.; Holben, B.N. A spatio-temporal approach for global validation and analysis of modis aerosol products. Geophys. Res. Lett. 2002, 29. [Google Scholar] [CrossRef]
- Chu, D.A.; Kaufman, Y.J.; Zibordi, G.; Chern, J.D.; Mao, J.; Li, C.C.; Holben, B.N. Global monitoring of air pollution over land from the earth observing system-terra moderate resolution imaging spectroradiometer (MODIS). J. Geophys. Res. Atmos. 2003, 108, 4661. [Google Scholar] [CrossRef]
- Kaufman, Y.J.; Wald, A.E.; Remer, L.A.; Gao, B.C.; Li, R.R.; Flynn, L. The modis 2.1-mu m channel—Correlation with visible reflectance for use in remote sensing of aerosol. IEEE Trans. Geosci. Remote Sens. 1997, 35, 1286–1298. [Google Scholar] [CrossRef]
- Wang, X.W.; Xie, H.J.; Liang, T.G. Evaluation of modis snow cover and cloud mask and its application in northern Xinjiang, China. Remote Sens. Environ. 2008, 112, 1497–1513. [Google Scholar] [CrossRef]
Figure 1.
Map of the study area and the two ground-observed sites.

Figure 2.
Flowchart of the aerosol retrieval algorithm in the study.

Figure 3.
Example of a pre-calculated minimum land surface reflectance (MLSR) database using 5 years of MOD09A1 at 500 m resolution for July. (a): the surface reflectance at blue band; (b): the solar zenith angle; (c): the viewing zenith angle; (d): the relative azimuth angle.
Figure 3.
Example of a pre-calculated minimum land surface reflectance (MLSR) database using 5 years of MOD09A1 at 500 m resolution for July. (a): the surface reflectance at blue band; (b): the solar zenith angle; (c): the viewing zenith angle; (d): the relative azimuth angle.

Figure 4.
Time series of aerosol parameters of single scattering albedo (SSA) and g retrieved from sky radiance almucantar measurements and direct sun measurements. 15 July, 3 August, 4 August, and 21 August are the start date, the stable weather data, the maximum AOD date, and the end date, respectively.
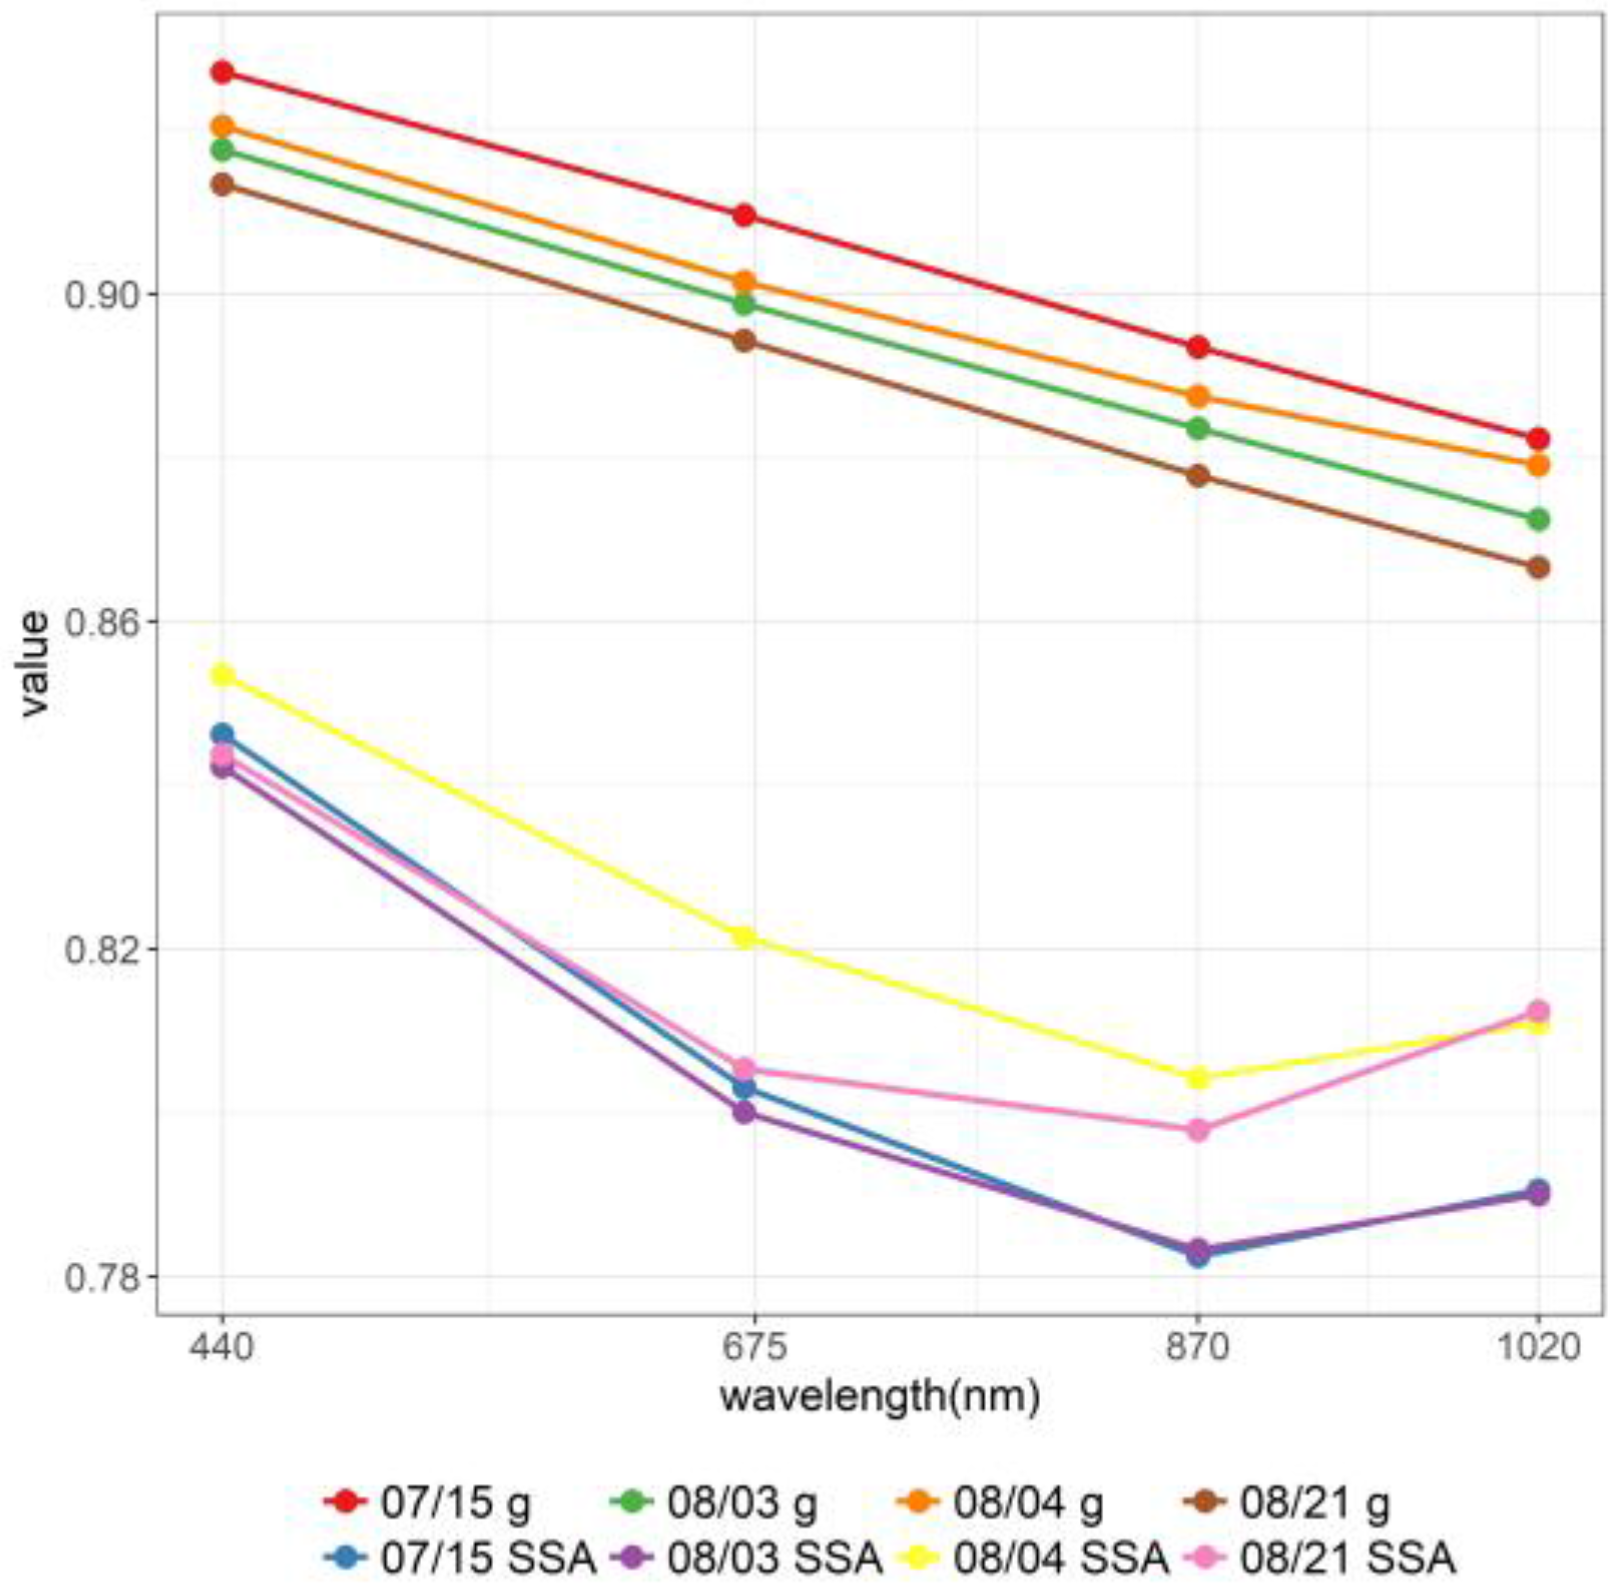
Figure 5.
MODIS false-color images for the northern Xinjiang area (R, G, B = 2, 1, 4). (a): 11 July 2014; (b): 15 July 2014; (c): 12 August 2014; (d): 21 August 2014.
Figure 5.
MODIS false-color images for the northern Xinjiang area (R, G, B = 2, 1, 4). (a): 11 July 2014; (b): 15 July 2014; (c): 12 August 2014; (d): 21 August 2014.

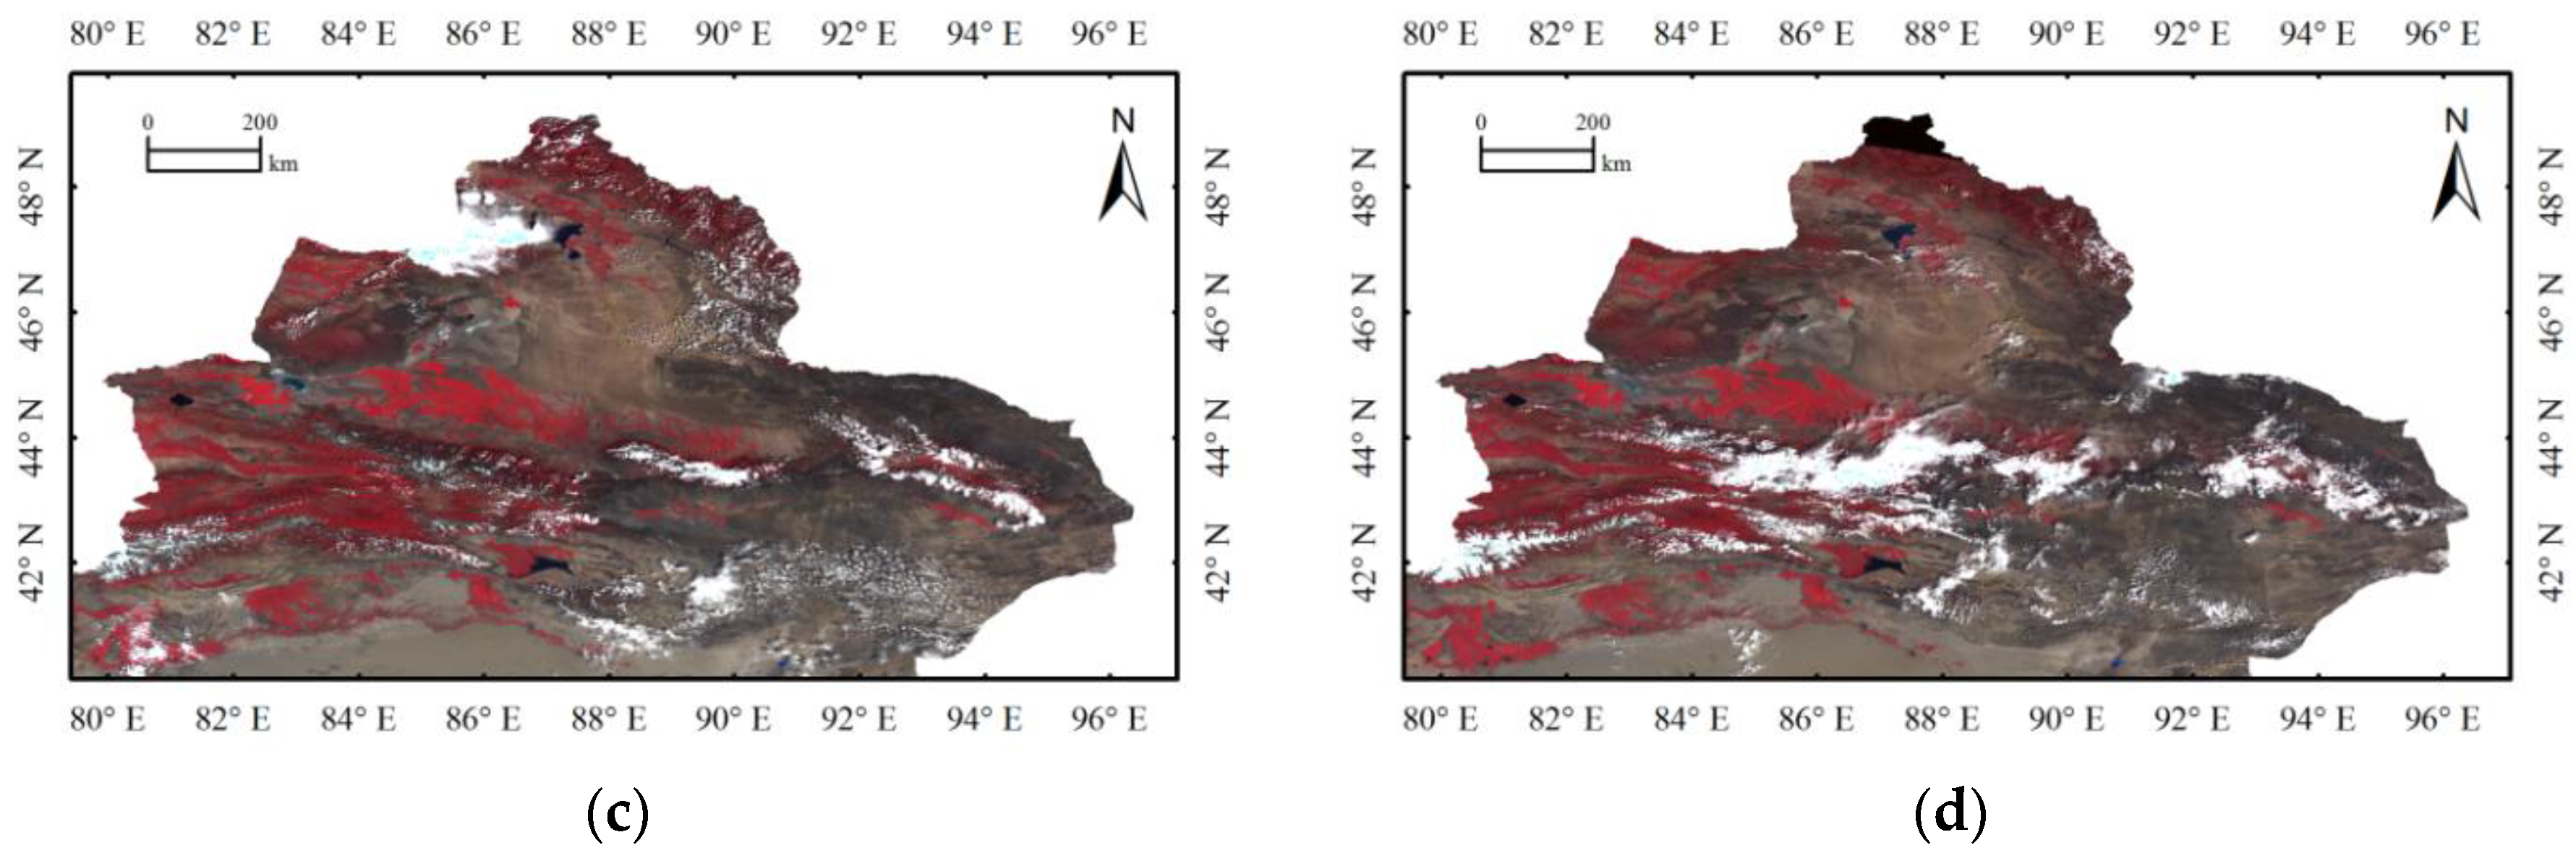
Figure 6.
Retrieved AOD for the northern Xinjiang area. (a): 11 July 2014; (b): 15 July 2014; (c): 12 August 2014; (d): 21 August 2014.
Figure 6.
Retrieved AOD for the northern Xinjiang area. (a): 11 July 2014; (b): 15 July 2014; (c): 12 August 2014; (d): 21 August 2014.

Figure 7.
Distribution of MODIS 10-km deep blue (DB) AOD products for the northern Xinjiang area. (a): 11 July 2014; (b): 15 July 2014; (c): 12 August 2014; (d): 21 August 2014.
Figure 7.
Distribution of MODIS 10-km deep blue (DB) AOD products for the northern Xinjiang area. (a): 11 July 2014; (b): 15 July 2014; (c): 12 August 2014; (d): 21 August 2014.

Figure 8.
Validation of retrieved AOD from the (a) new algorithm (500 m), (b) MOD04 C6 DB algorithm (10 km), and (c) the new algorithm without angle normalization (500 m) against the ground-based sunphotometer AOD measurements. The black dashed lines are the EE lines, the black solid lines are the 1:1 line and red solid lines are the regression lines.

Figure 9.
The variation of surface reflectance during the same month in different years near the ground sites. (a) Dahuangshan; (b) Wucaiwan. The error bars represent the maximum absolute error compared with the average value for 5 years.
Figure 9.
The variation of surface reflectance during the same month in different years near the ground sites. (a) Dahuangshan; (b) Wucaiwan. The error bars represent the maximum absolute error compared with the average value for 5 years.

Table 1.
The detailed information of sites and instruments.
| Site | Instrument | Lon. (°E) | Lat. (°N) | Elevation (m) | Start Date | End Date |
|---|---|---|---|---|---|---|
| Dahuangshan | Microtops II | 88.645 | 44.041 | 1018 | 2014/7/10 | 2014/8/24 |
| Wucaiwan | CE-318 | 88.099 | 44.776 | 450 | 2014/7/15 | 2014/8/21 |
Table 2.
Moderate-resolution imaging spectroradiometer (MODIS) images used for aerosol optical depth (AOD) retrieval in this study.
Table 2.
Moderate-resolution imaging spectroradiometer (MODIS) images used for aerosol optical depth (AOD) retrieval in this study.
| Data Name | Date | Tile | N | Application |
|---|---|---|---|---|
| MOD09A1 | 2010–2014 | H23-H25, V04-V05 | 240 | Build surface reflectance and angle information database |
| MCD43A1 | 2014/07/10–2014/08/24 | H23-H25, V04-V05 | 276 | Build BRDF correction model |
| MOD02HKM | 2014/07/10–2014/08/24 | 55 | Calculate the top of the atmosphere reflectance | |
| MOD03 | 2014/07/10–2014/08/24 | 55 | Obtain geolocation data | |
| MOD04 | 2014/07/10–2014/08/24 | 55 | Validation |
Note: N is the number of images.
Table 3.
The statistical mean values of A1 and A2 for three vegetation statuses.
| Category | EVI | A1 | A2 |
|---|---|---|---|
| Sparse vegetation | EVI < 0.15 | 0.203 | 0.037 |
| Median vegetation | 0.15 < EVI < 0.60 | 0.438 | 0.173 |
| Dense vegetation | EVI > 0.60 | 0.762 | 0.143 |
Table 4.
The parameters used in the look-up table construction.
| Parameter | Number | Values |
|---|---|---|
| Band | 1 | Band 3 (Blue band) |
| AOD at 550 nm | 15 | 0.0, 0.01, 0.05, 0.1, 0.2, 0.3, 0.4, 0.5, 0.6, 0.7, 0.8, 0.9, 1.0, 1.2, 1.5 |
| Surface reflectance | 18 | 0.0, 0.01, 0.02, 0.03, 0.04, 0.05, 0.06, 0.07, 0.08, 0.09, 0.10, 0.11, 0.12, 0.13, 0.14, 0.15, 0.18, 0.20 |
| Solar zeniths (°) | 14 | 0, 6, 12, 18, 24, 30, 36, 42, 48, 54, 60, 66, 72, 78 |
| Satellite zeniths (°) | 14 | 0, 6, 12, 18, 24, 30, 36, 42, 48, 54, 60, 66, 72, 78 |
| Relative azimuths (°) | 19 | 0, 10, 20, 30, 40, 50, 60, 70, 80, 90, 100, 110, 120, 130, 140, 150, 160, 170, 180 |
Table 5.
Calculation results of aerosol parameters of the Ångström exponent and complex refractive index.
Table 5.
Calculation results of aerosol parameters of the Ångström exponent and complex refractive index.
| Aerosol Optical Properties | Date/Value | |||
|---|---|---|---|---|
| 15 July | 3 August | 4 August | 21 August | |
| Ångström exponent (440–870 nm) | 0.467 | 0.409 | 0.441 | 0.443 |
| Real part of RI | 1.597 | 1.541 | 1.548 | 1.592 |
| Imaginary part of RI | 0.009 | 0.008 | 0.011 | 0.010 |
Table 6.
Comparisons of retrieval accuracy between the new algorithm (New) and Terra-MODIS C6 DB product (DB).
Table 6.
Comparisons of retrieval accuracy between the new algorithm (New) and Terra-MODIS C6 DB product (DB).
| Site | Count | R | Absolute Error | Relative Error (%) | r (%) | |||||
|---|---|---|---|---|---|---|---|---|---|---|
| New | DB | New | DB | New | DB | New | DB | New | DB | |
| Dahuangshan | 32 | 29 | 0.928 | 0.774 | 0.037 | 0.047 | 13.9 | 17.4 | 96.9 | 90.6 |
| Wucaiwan | 26 | 24 | 0.918 | 0.931 | 0.025 | 0.023 | 16.7 | 15.7 | 96.2 | 96.2 |
| Total | 58 | 53 | 0.928 | 0.871 | 0.032 | 0.036 | 15.1 | 16.6 | 96.6 | 92.5 |
r is the percentage falling within the expected error (EE) of the collocations.
© 2018 by the authors. Licensee MDPI, Basel, Switzerland. This article is an open access article distributed under the terms and conditions of the Creative Commons Attribution (CC BY) license (http://creativecommons.org/licenses/by/4.0/).
Share and Cite
MDPI and ACS Style
Tian, X.; Liu, S.; Sun, L.; Liu, Q. Retrieval of Aerosol Optical Depth in the Arid or Semiarid Region of Northern Xinjiang, China. Remote Sens. 2018, 10, 197. https://doi.org/10.3390/rs10020197
AMA Style
Tian X, Liu S, Sun L, Liu Q. Retrieval of Aerosol Optical Depth in the Arid or Semiarid Region of Northern Xinjiang, China. Remote Sensing. 2018; 10(2):197. https://doi.org/10.3390/rs10020197
Chicago/Turabian StyleTian, Xinpeng, Sihai Liu, Lin Sun, and Qiang Liu. 2018. "Retrieval of Aerosol Optical Depth in the Arid or Semiarid Region of Northern Xinjiang, China" Remote Sensing 10, no. 2: 197. https://doi.org/10.3390/rs10020197
Note that from the first issue of 2016, this journal uses article numbers instead of page numbers. See further details here.