Impacts of Climate Change on Tibetan Lakes: Patterns and Processes
by
 , , ,
, , ,
Dehua Mao
1 ,
,
Zongming Wang
1,* ,
,
Hong Yang
2,*,
Huiying Li
3,
Julian R. Thompson
4,
Lin Li
5, 
Kaishan Song
1,
Bin Chen
6, 
Hongkai Gao
7,8 and
Jianguo Wu
7,8,9 
1
Key Laboratory of Wetland Ecology and Environment, Northeast Institute of Geography and Agroecology, Chinese Academy of Sciences, Changchun 130102, China
2
Department of Geography and Environmental Science, University of Reading, Whiteknights, Reading RG6 6AB, UK
3
College of Earth Sciences, Jilin University, Changchun 130021, China
4
UCL Department of Geography, University College London, London WC1E 6BT, UK
5
Department of Earth Sciences, Indiana University—Purdue University at Indianapolis, Indianapolis, IN 46202, USA
6
School of Environment, Beijing Normal University, Beijing 100875, China
7
School of Life Sciences, Arizona State University, Tempe, AZ 85287, USA
8
Global School of Sustainability, Arizona State University, Tempe, AZ 85287, USA
9
Center for Human-Environment System Sustainability (CHESS), State Key Laboratory of Earth Surface Processes and Resource Ecology (ESPRE), Faculty of Geographical Science, Beijing Normal University, Beijing 100875, China
*
Authors to whom correspondence should be addressed.
Remote Sens. 2018, 10(3), 358; https://doi.org/10.3390/rs10030358
Submission received: 16 December 2017
/
Revised: 14 February 2018
/
Accepted: 21 February 2018
/
Published: 26 February 2018
(This article belongs to the Special Issue Application of Remote Sensing in Hydrological Modeling and Watershed Management)
Abstract
:High-altitude inland-drainage lakes on the Tibetan Plateau (TP), the earth’s third pole, are very sensitive to climate change. Tibetan lakes are important natural resources with important religious, historical, and cultural significance. However, the spatial patterns and processes controlling the impacts of climate and associated changes on Tibetan lakes are largely unknown. This study used long time series and multi-temporal Landsat imagery to map the patterns of Tibetan lakes and glaciers in 1977, 1990, 2000, and 2014, and further to assess the spatiotemporal changes of lakes and glaciers in 17 TP watersheds between 1977 and 2014. Spatially variable changes in lake and glacier area as well as climatic factors were analyzed. We identified four modes of lake change in response to climate and associated changes. Lake expansion was predominantly attributed to increased precipitation and glacier melting, whereas lake shrinkage was a main consequence of a drier climate or permafrost degradation. These findings shed new light on the impacts of recent environmental changes on Tibetan lakes. They suggest that protecting these high-altitude lakes in the face of further environmental change will require spatially variable policies and management measures.
1. Introduction
Lakes act as sentinels to environmental change, providing signals that reflect the influence of changes in climate [1,2]. The Tibetan Plateau (TP), which covers an area of 2.6 × 10⁶ km2, has been referred to as the world’s “third pole” [3] and the “Asian water tower” [4]. High altitude inland-drainage lakes on the TP are relatively un-impacted by direct human activities compared to lakes in most parts of the world. Thus, they are uniquely suited for identifying the environmental effects of climate and associated change.
Remarkable climate changes have been observed across the TP over the past three decades. The large area of the plateau at altitudes above 4000 m has warmed by approximately 0.3 °C per decade, a rate that is twice the global average [5]. Since 2000, this warming trend has accelerated. Precipitation has increased over the southern part of the plateau, but has decreased in the north [6]. Potential evapotranspiration (PET) decreased across the whole TP before 2000 [7], but has since increased. This most recent change is mostly correlated to large increases in temperature. Warming of the TP has accelerated glacier melting [8] and permafrost degradation [9]. Tibetan glaciers have been melting at an alarming rate with an average annual reduction in thickness of 200 mm [10], while their volume declined by 113–147 km3 per decade between the 1970s and 2000s [11]. As glaciers have retreated, glacial runoff has increased so that the number and area of glacial lakes has changed in recent decades [12,13,14]. With warming of the TP, the low altitude limit of permafrost moved up by 50 m during the period 1990–2010. Between 1996 and 2001 permafrost active-layer thickness increased by 0.15–0.50 m [15]. Permafrost degradation increases the infiltration of rainfall and snowmelt to the root zone for later transpiration. This eventually reduces runoff, further affecting the number and surface area of lakes on the TP [9,16,17].
Lakes respond directly to climate change and also incorporate the effects of climate-driven changes occurring within their watersheds [18]. Within the extensive TP, there are large spatial differences in the degree of climate change, glacier dynamics, and permafrost degradation [19,20,21]. Although some studies have investigated the effects of climate change on Tibetan lakes [16,17,22], accurate and spatially distributed information on the patterns of change and the processes responsible for them is lacking. This is due to the region’s remoteness, high altitude, thin atmosphere, and harsh weather conditions [23]. Due to variability in lake morphology, watershed characteristics, and geographic locations, it is not appropriate to generalize the effects of the TP’s rapidly changing climate on the region’s lakes [1]. Whilst previous studies have reported both the expansion and shrinkage of lakes in some parts of the TP, these investigations were local in nature [13,14,24,25]. A comprehensive and coherent picture of climate change impacts on the number and extent of lakes across the whole plateau is still needed. Interactions between changes in climate, glacier retreat, and degrading permafrost, suggest that these impacts are likely to be complicated. Thus, here we investigated the patterns and processes of climate change impacts on lakes across the entire TP by dividing the region into 17 major watersheds. Specifically, we quantified the spatiotemporal heterogeneity of lake area changes across the TP, and the relative contributions of climate change, glacier melting, and permafrost degradation. Four response modes were used to disentangle the effects of these three factors upon changes in the TP’s lakes.
2. Materials and Methods
2.1. Environmental Conditions on the Tibetan Plateau
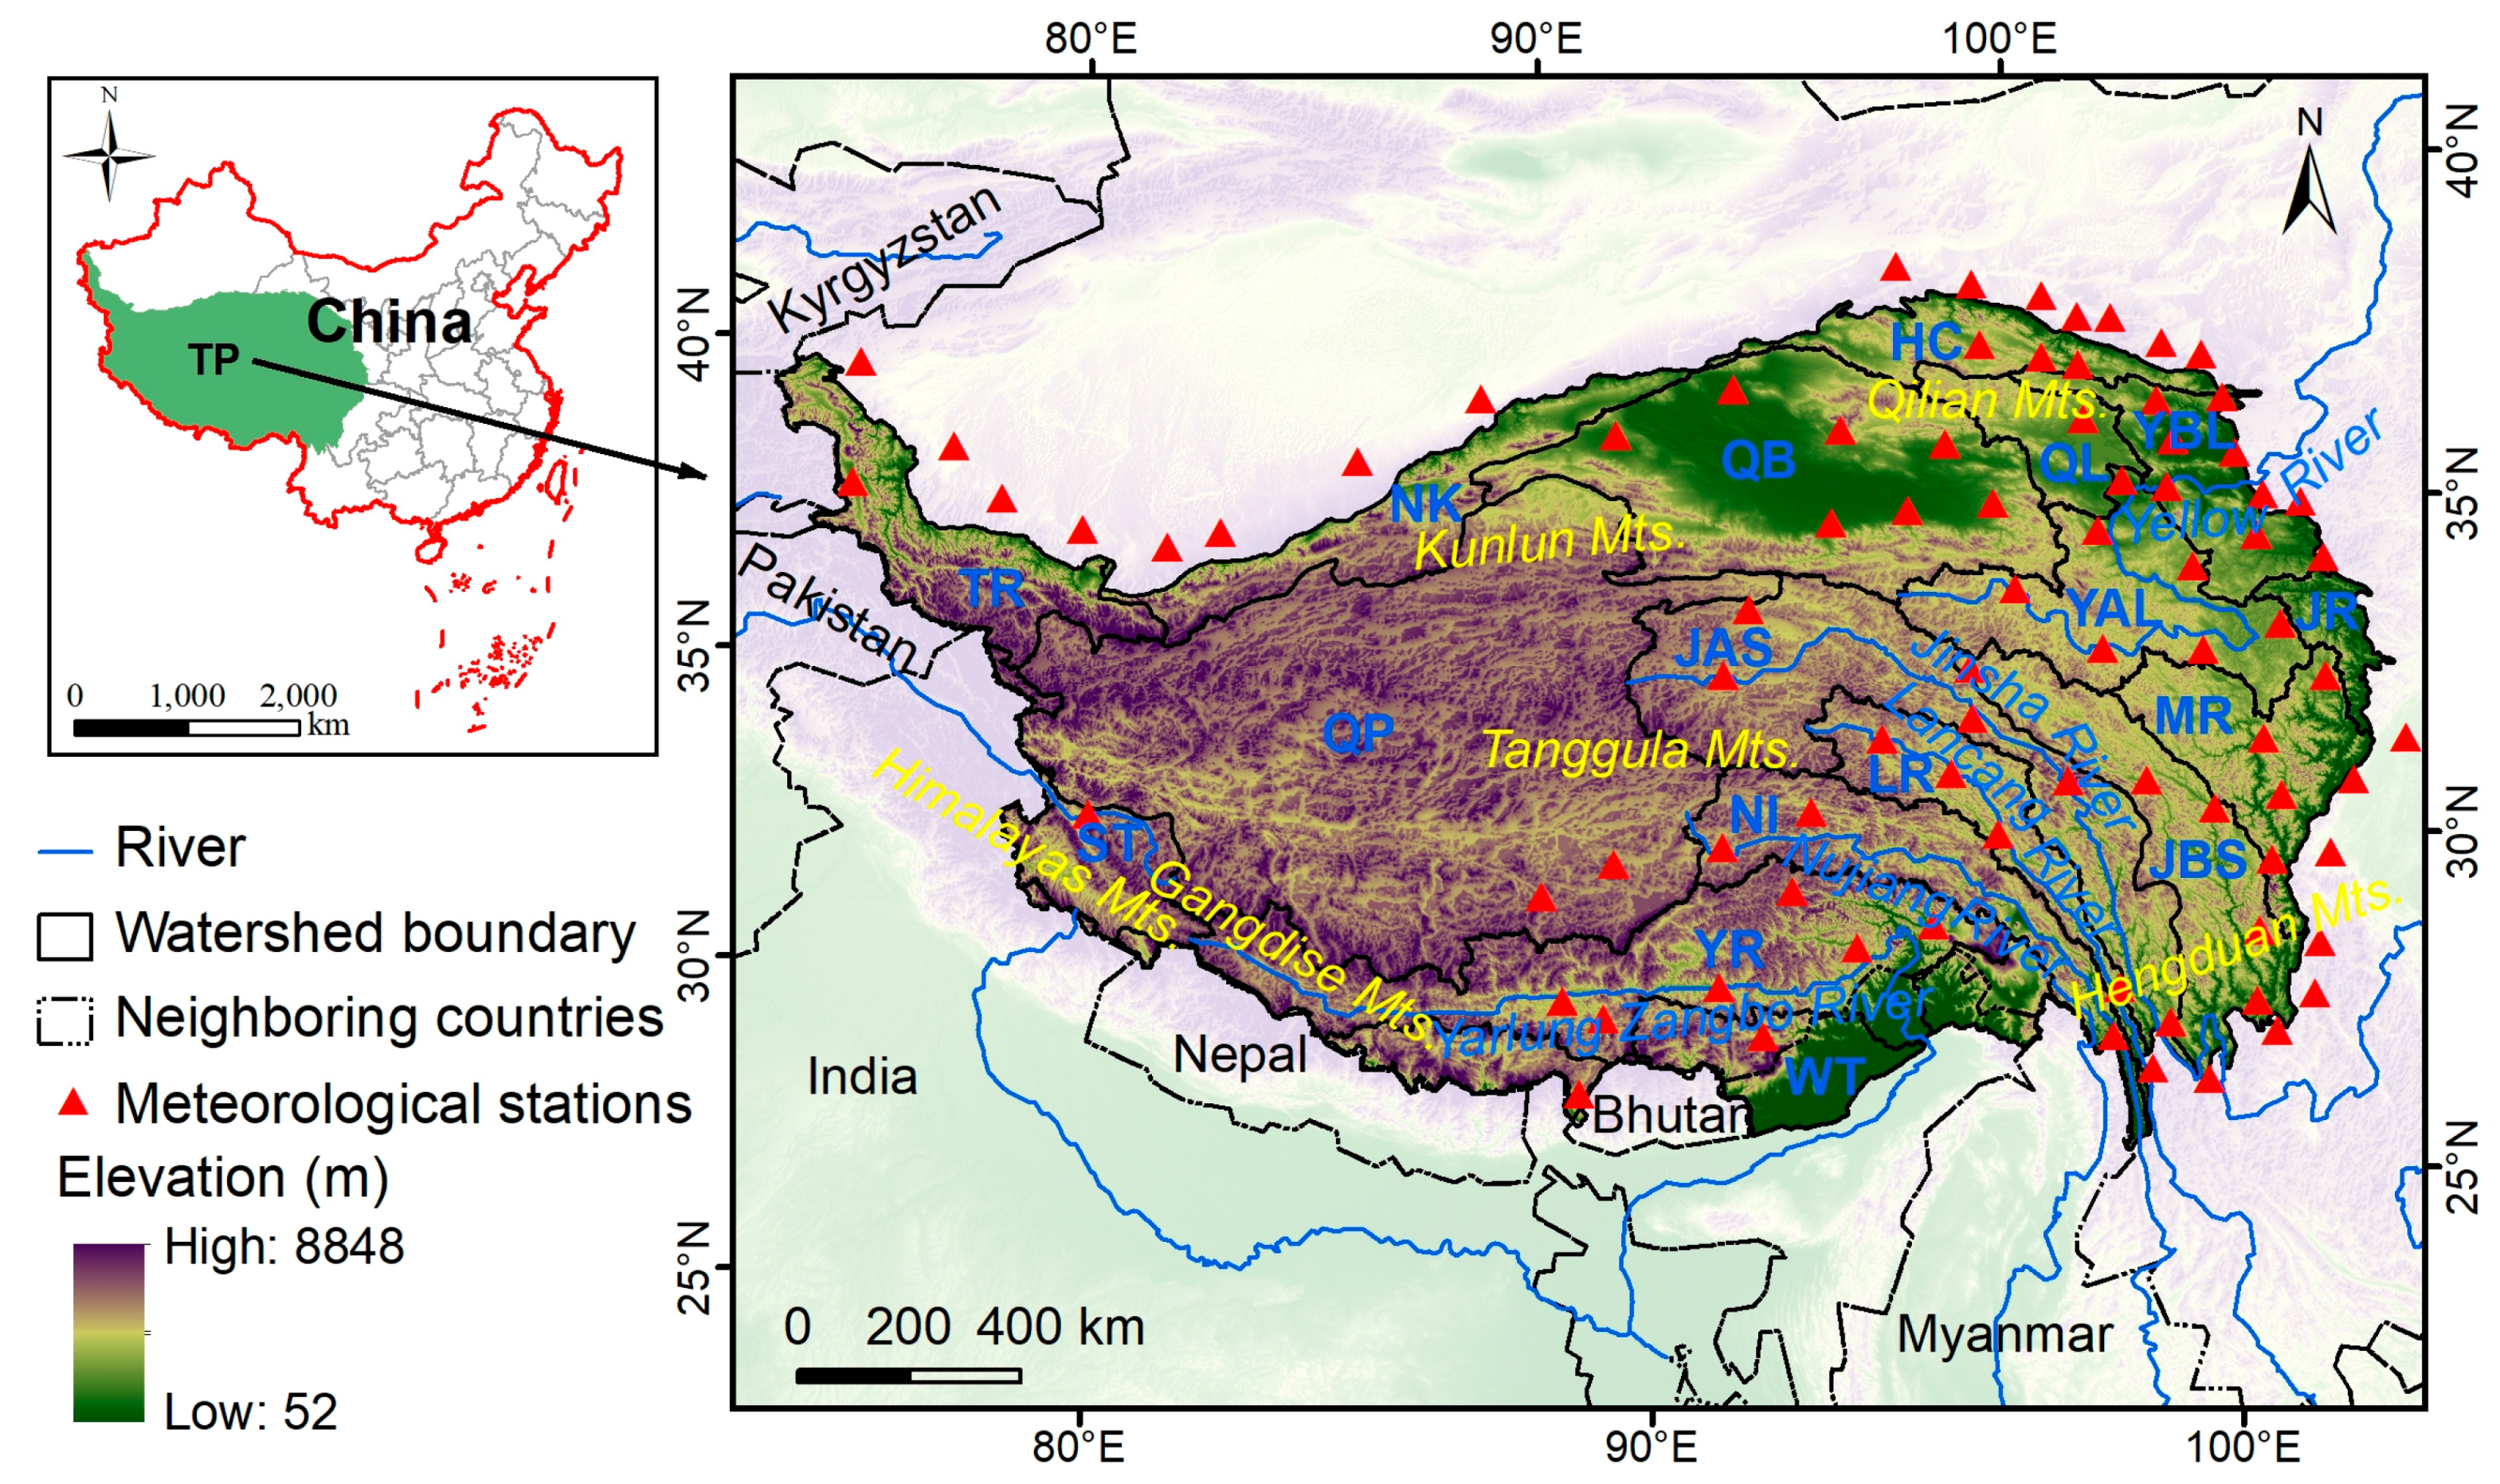
The Tibetan Plateau (TP) occupies 2.6 × 10⁶ km2 in southwest China and borders Burma, India, Bhutan, Myanmar, Pakistan, Afghanistan, Tajikistan and Kyrgyzstan. It extends between longitudes 73°23′E and 104°49′E and between latitudes 25°56′N and 39°47′N (Figure 1). The TP is a large mountainous area with an average altitude of 4369 m and includes the highest mountain (8848 m, Mount Everest) on Earth. The region plays a significant role in the Earth’s climate system with its unique and complex interactions of climate and water cycles [26]. It has a unique climate due to the complex topography and the influence of the Asian and Indian monsoon. Mean annual air temperature (MAAT) across the TP is relatively low (3.9 °C, based on the period 1975–2014) with obvious spatial gradients from the middle of the plateau (−5 °C) to the surrounding area (16 °C). Mean annual precipitation (MAP) across the TP is 346 mm, with a decreasing trend from southeast (>700 mm) to northwest (<100 mm). Remote sensing observations indicate that grassland is the main land cover type (58.5% of the whole plateau). Land cover across the plateau varies spatially from forest (13.7%) in the southeast to alpine meadow in the middle, and to alpine steppe in the northwest. Anthropogenic land use types (urban and arable lands) account for only 0.9% of the whole TP [27].
2.2. Lake Distribution and Extent
In this study, we focused on lakes with an area greater than 1 km2 since smaller lakes could not be effectively quantified using remote sensing imagery [28]. For lake extent mapping, a total of 556 scenes of terrain corrected level 1T 80 m Landsat MSS and 30 m Landsat TM/ETM/OLI data were acquired from the U.S. Geological Survey (USGS) and China’s Geospatial Data Cloud (http://www.giscloud.cn/) at near decadal intervals. To cover the entire TP, 147 Landsat MSS images and 127, 140, and 142 Landsat TM/ETM+/OLI images were acquired for the years 1977, 1990, 2000, and 2014, respectively. Images were limited to the months of September to December to avoid the influence of seasonal lake area fluctuations. It should be noted that since most Tibetan lakes are salt lakes they are rarely totally frozen in winter so that the selection of imagery towards the end of the year does not impact lake area determination. Only those images with <10% cloud cover and 100% cloud-free cover above lakes were used. As far as possible, images were acquired in the same month for different years. If this was not possible, imagery from the previous or next month in the same year was acquired. When suitable cloud free imagery for specific areas was unavailable in a given year, images from the previous or following year were substituted.
The post-classification comparison (PCC) method (e.g., [29]) is considered an accurate change detection technique for monitoring LULCC from remote sensing data. It is based on the detection of land cover changes by comparing independently produced classifications of images from different dates. The PCC method thus minimizes the problems associated with multi-temporal images under different atmospheric and environmental conditions [30]. The PCC method performs image classifications separately, while the digital change detection method directly identifies the image feature changes [30]. Whereas geometric correction is generally required in digital change detection, PCC does not require that images be radiometrically corrected or normalized before they are used for change detection [31]. The 1977, 1990, and 2000 images were geometrically corrected to the corresponding 2014 image. For each MSS/TM/ETM+ scene, at least 30 evenly distributed sites which are locations with known coordinates that can be easily identified in an image (e.g., road intersections, stone wall boundaries, building corners, and solitary trees) were selected as Ground Control Points (GCPs). The root mean square error of the geometric rectification was less than 1 pixel (or 30 m). To enable precise comparison between the four datasets, TM/ETM+/OLI images were resampled to the 80 × 80 m resolution of the earlier MSS imagery. Clouds and cloud shadows were masked manually within all images prior to image analyses.
The object-oriented image segmentation method, which can delineate satellite images into homogeneous objects, can more easily delineate lake boundaries than traditional pixel-based methods [32]. After this image segmentation, the visible and near-infrared (NIR) bands are often used for the identification of water surfaces [33]. Unlike other land cover types, water absorbs much more light in the NIR band than in the visible band. The normalized difference water index (NDWI; defined in Equation (1)) is based on these differences and has been successfully employed for extracting water features from remotely sensed data (e.g., [33,34,35,36]).
In this study, the NDWI was used to reconstruct time series of lake number and lake surface area using the green and NIR bands. MSS band 1 (0.50–0.60 μm), TM band 2 (0.52–0.60 μm), ETM+ band 2 (0.52–0.60 μm), and OLI band 3 (0.53–0.59 μm) are green bands whilst NIR is provided in MSS band 3 (0.70–0.80 μm), TM band 4 (0.76–0.90 μm), ETM+ band 4 (0.77–0.90 μm), and OLI band 5 (0.85–0.88 μm). A NDWI histogram was first generated for each image. An optimal threshold value was determined in order to delineate water surfaces from each histogram using the larger lake objects. Water bodies and other land covers were distinguished based on threshold values using eCognition software version 8.64 (Definiens Imaging, Munich, Germany). The validity of extracted water surfaces was confirmed through visual inspection and checked against Google Earth images. Reservoirs, artificial ponds, and rivers were excluded from the resulting water surfaces using the database from the National Land Cover Dataset (NLCD; [37]) and information on the distribution of these features available in the literature (e.g., [38,39]).
2.3. Climate Datasets
MAAT and MAP data from 83 meteorological stations located within and around the TP (Figure 1) were acquired from the China Meteorological Data Sharing Service System (http://cdc.cma.gov.cn/index.jsp). These stations were predominantly distributed in the eastern part and around the northern border of the TP. Of these stations, 56 are located on the TP whilst an additional 27 stations in the surrounding area were included for a better regional understanding of climate change trends. MAAT and MAP data from Nepal and India were not included as they were difficult to obtain. Spatial variations of MAAT and MAP were established by interpolation of climatic records through Aunsplin software [40] that takes elevation changes into consideration [41].
Daily climatic records (including mean wind speed, maximum and minimum air temperature, and sunshine hours) from all 83 meteorological stations were also collected from the China Meteorological Data Sharing Service System. PET was estimated using these daily data and the FAO Penman–Monteith method [42]. An aridity index (AI) defined as the ratio between annual total PET and MAP (PET/MAP) was calculated for each station. AI was interpolated across the TP using Aunsplin software. The spatial resolution and projection of the interpolated AI data were consistent with those for MAAT.
2.4. Glacier Cover
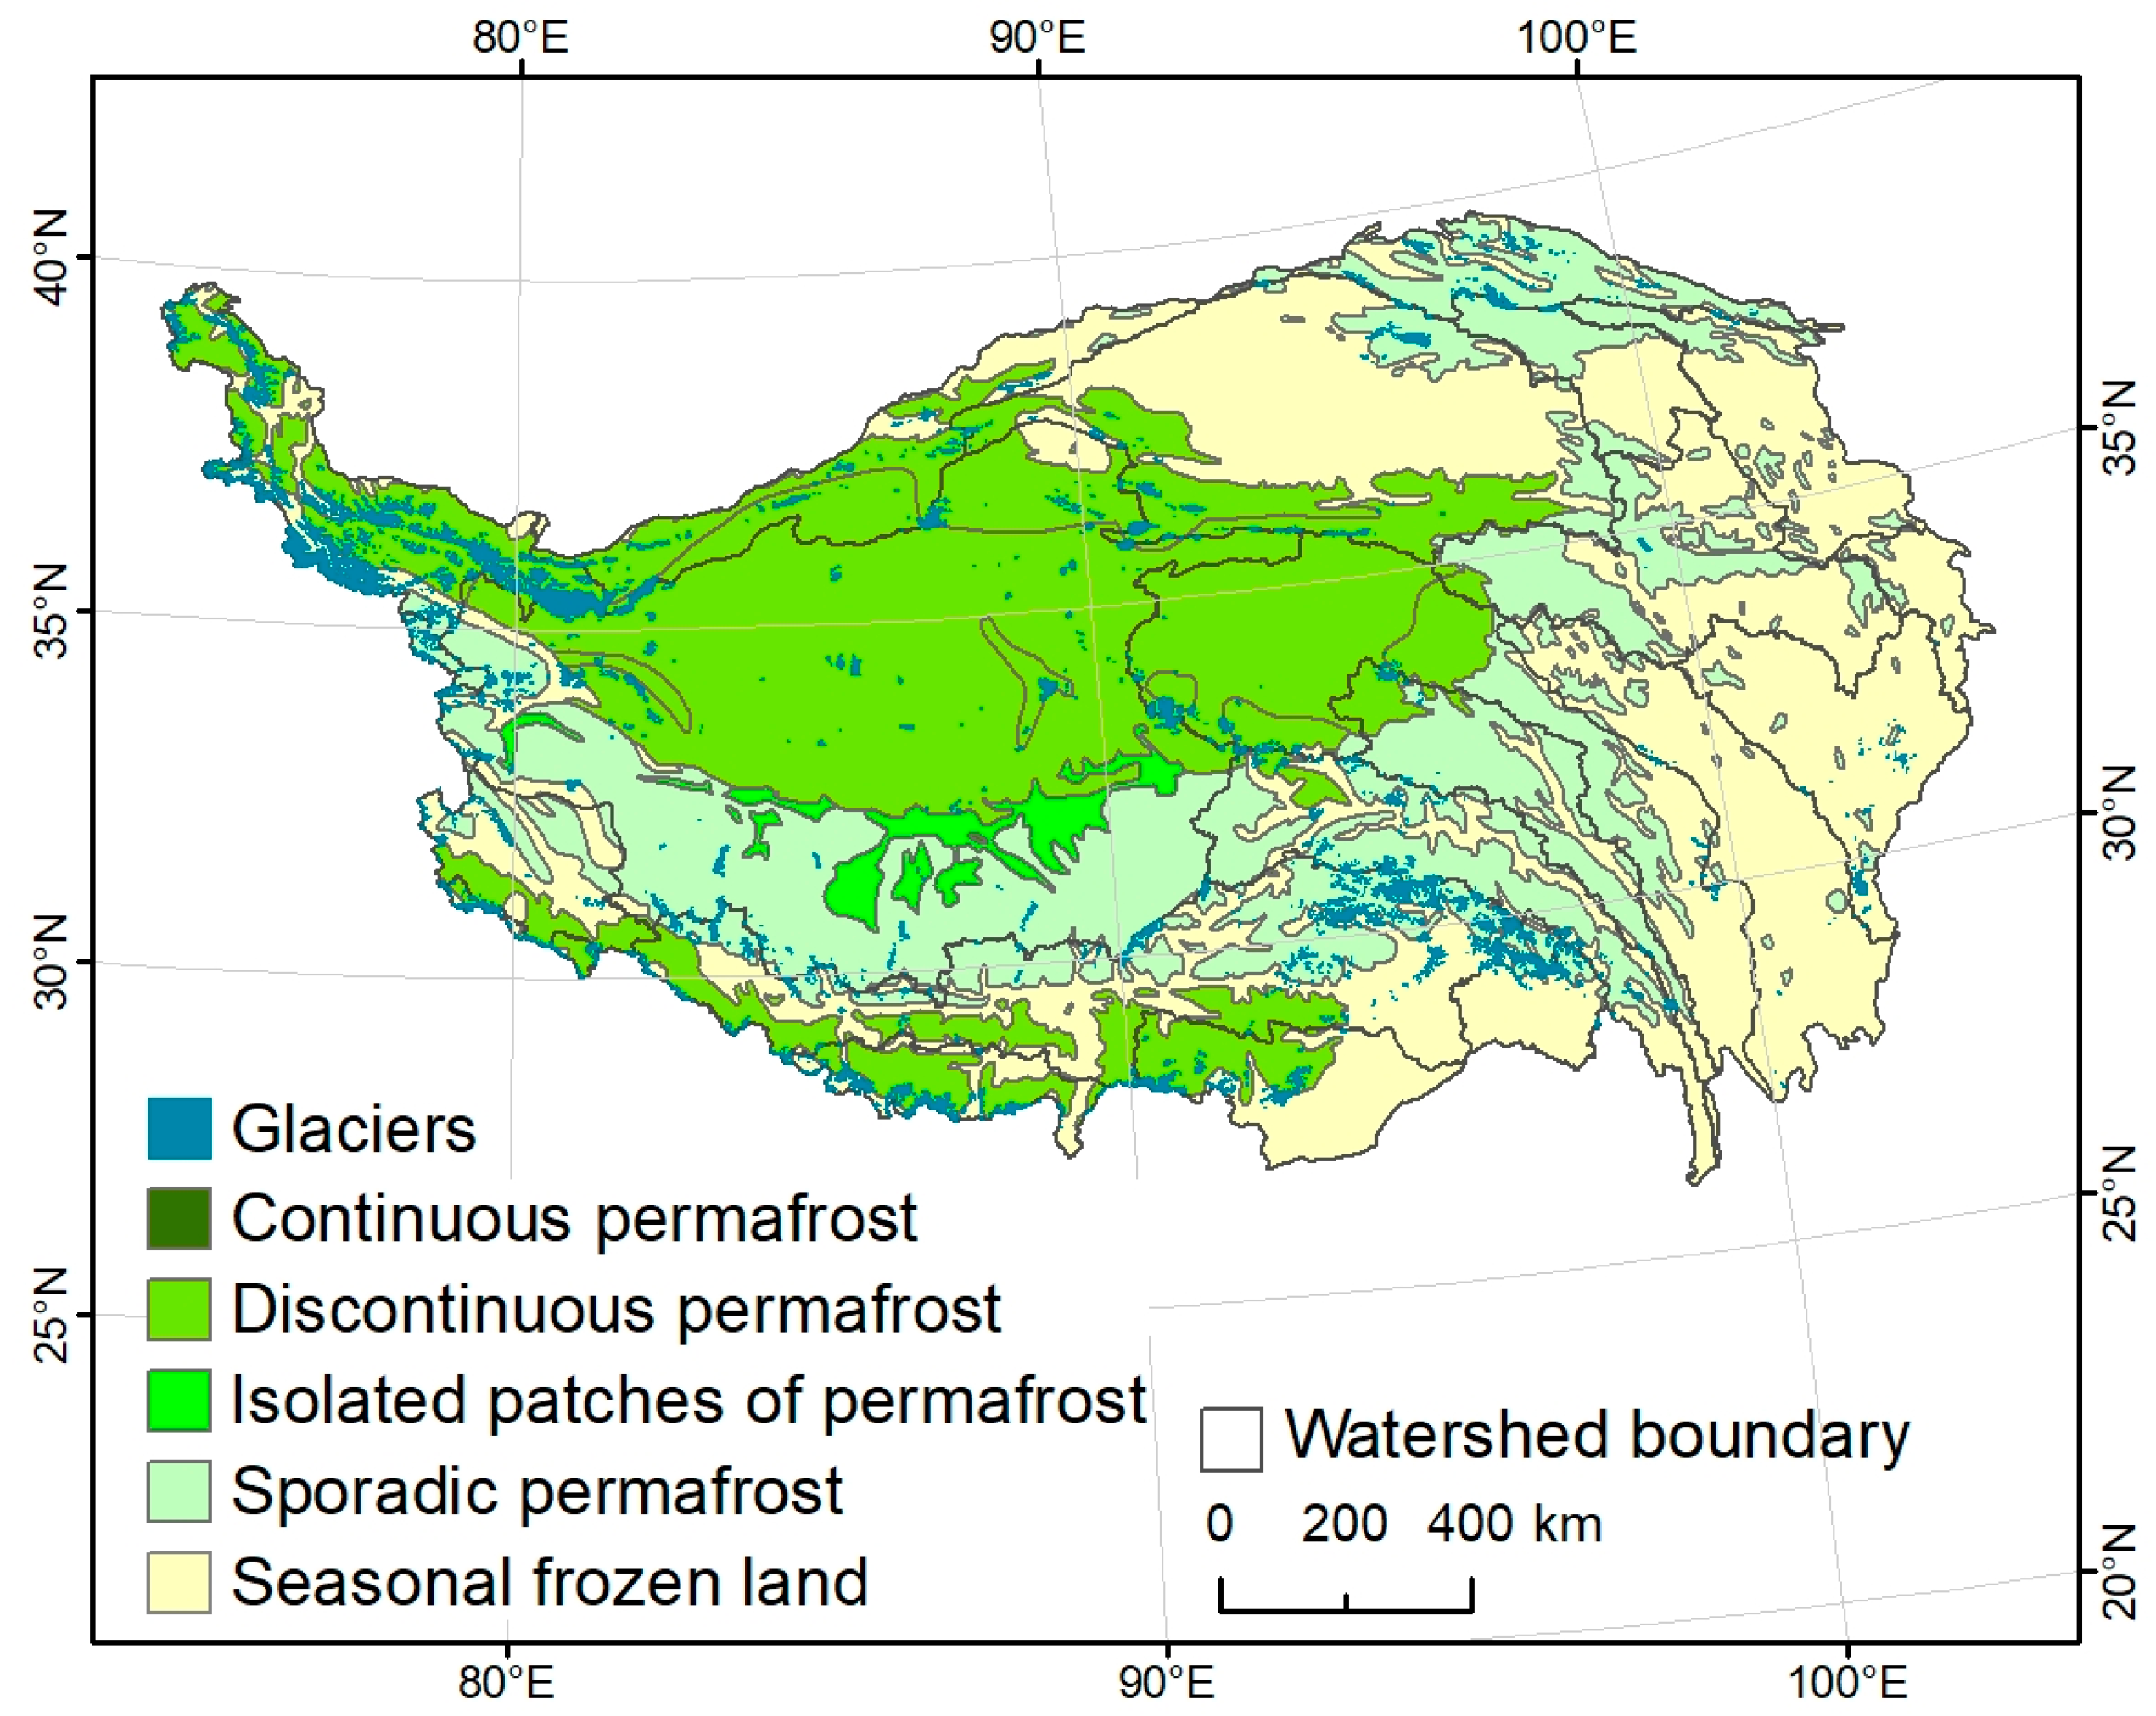
Seasonal glacier melt is an important water source for lakes within the TP. Notable glacier retreat has been reported by previous studies [8,10,20,43]. In order to investigate the responses of Tibetan lakes to glacier change, we mapped the glacier distribution on the TP, as shown in Figure 2. This glacier cover dataset was obtained from the Circum-arctic map of permafrost and ground ice conditions from the World Data Center for Glaciology (WDCG, http://nsidc.org/). Ye et al. [43] investigated the spatial variation of glacier loss and identified declines in glacier area in each of watersheds on the TP. The total area of glaciers on the TP declined by 7% between the 1970s and 2013 [43].
2.5. Permafrost Distribution
Permafrost is defined as ground material that remains below 0 °C for at least two years [44]. On the basis of the percentage of land area underlain by permafrost [45], permafrost is divided into four categories (Figure 2): continuous permafrost (90–100%), discontinuous permafrost (50–90%), sporadic permafrost (10–50%), and isolated patches of permafrost (0–10%). The distribution of permafrost on the TP was also extracted from the Circum-arctic map of permafrost and ground ice conditions from the WDCG. Spatial and temporal variations in permafrost degradation are largely affected by changes in temperature [46].
2.6. Watershed Delineation
The boundaries of the main watersheds on the TP were obtained from the Lake-Watershed Science Data Center of the Chinese Academy of Sciences (http://lake.geodata.cn). In total, 17 distinct watersheds were identified as shown in Figure 1 and summarized in Table 1.
3. Results
3.1. Spatiotemporal Heterogeneity of Changes in Tibetan Lakes
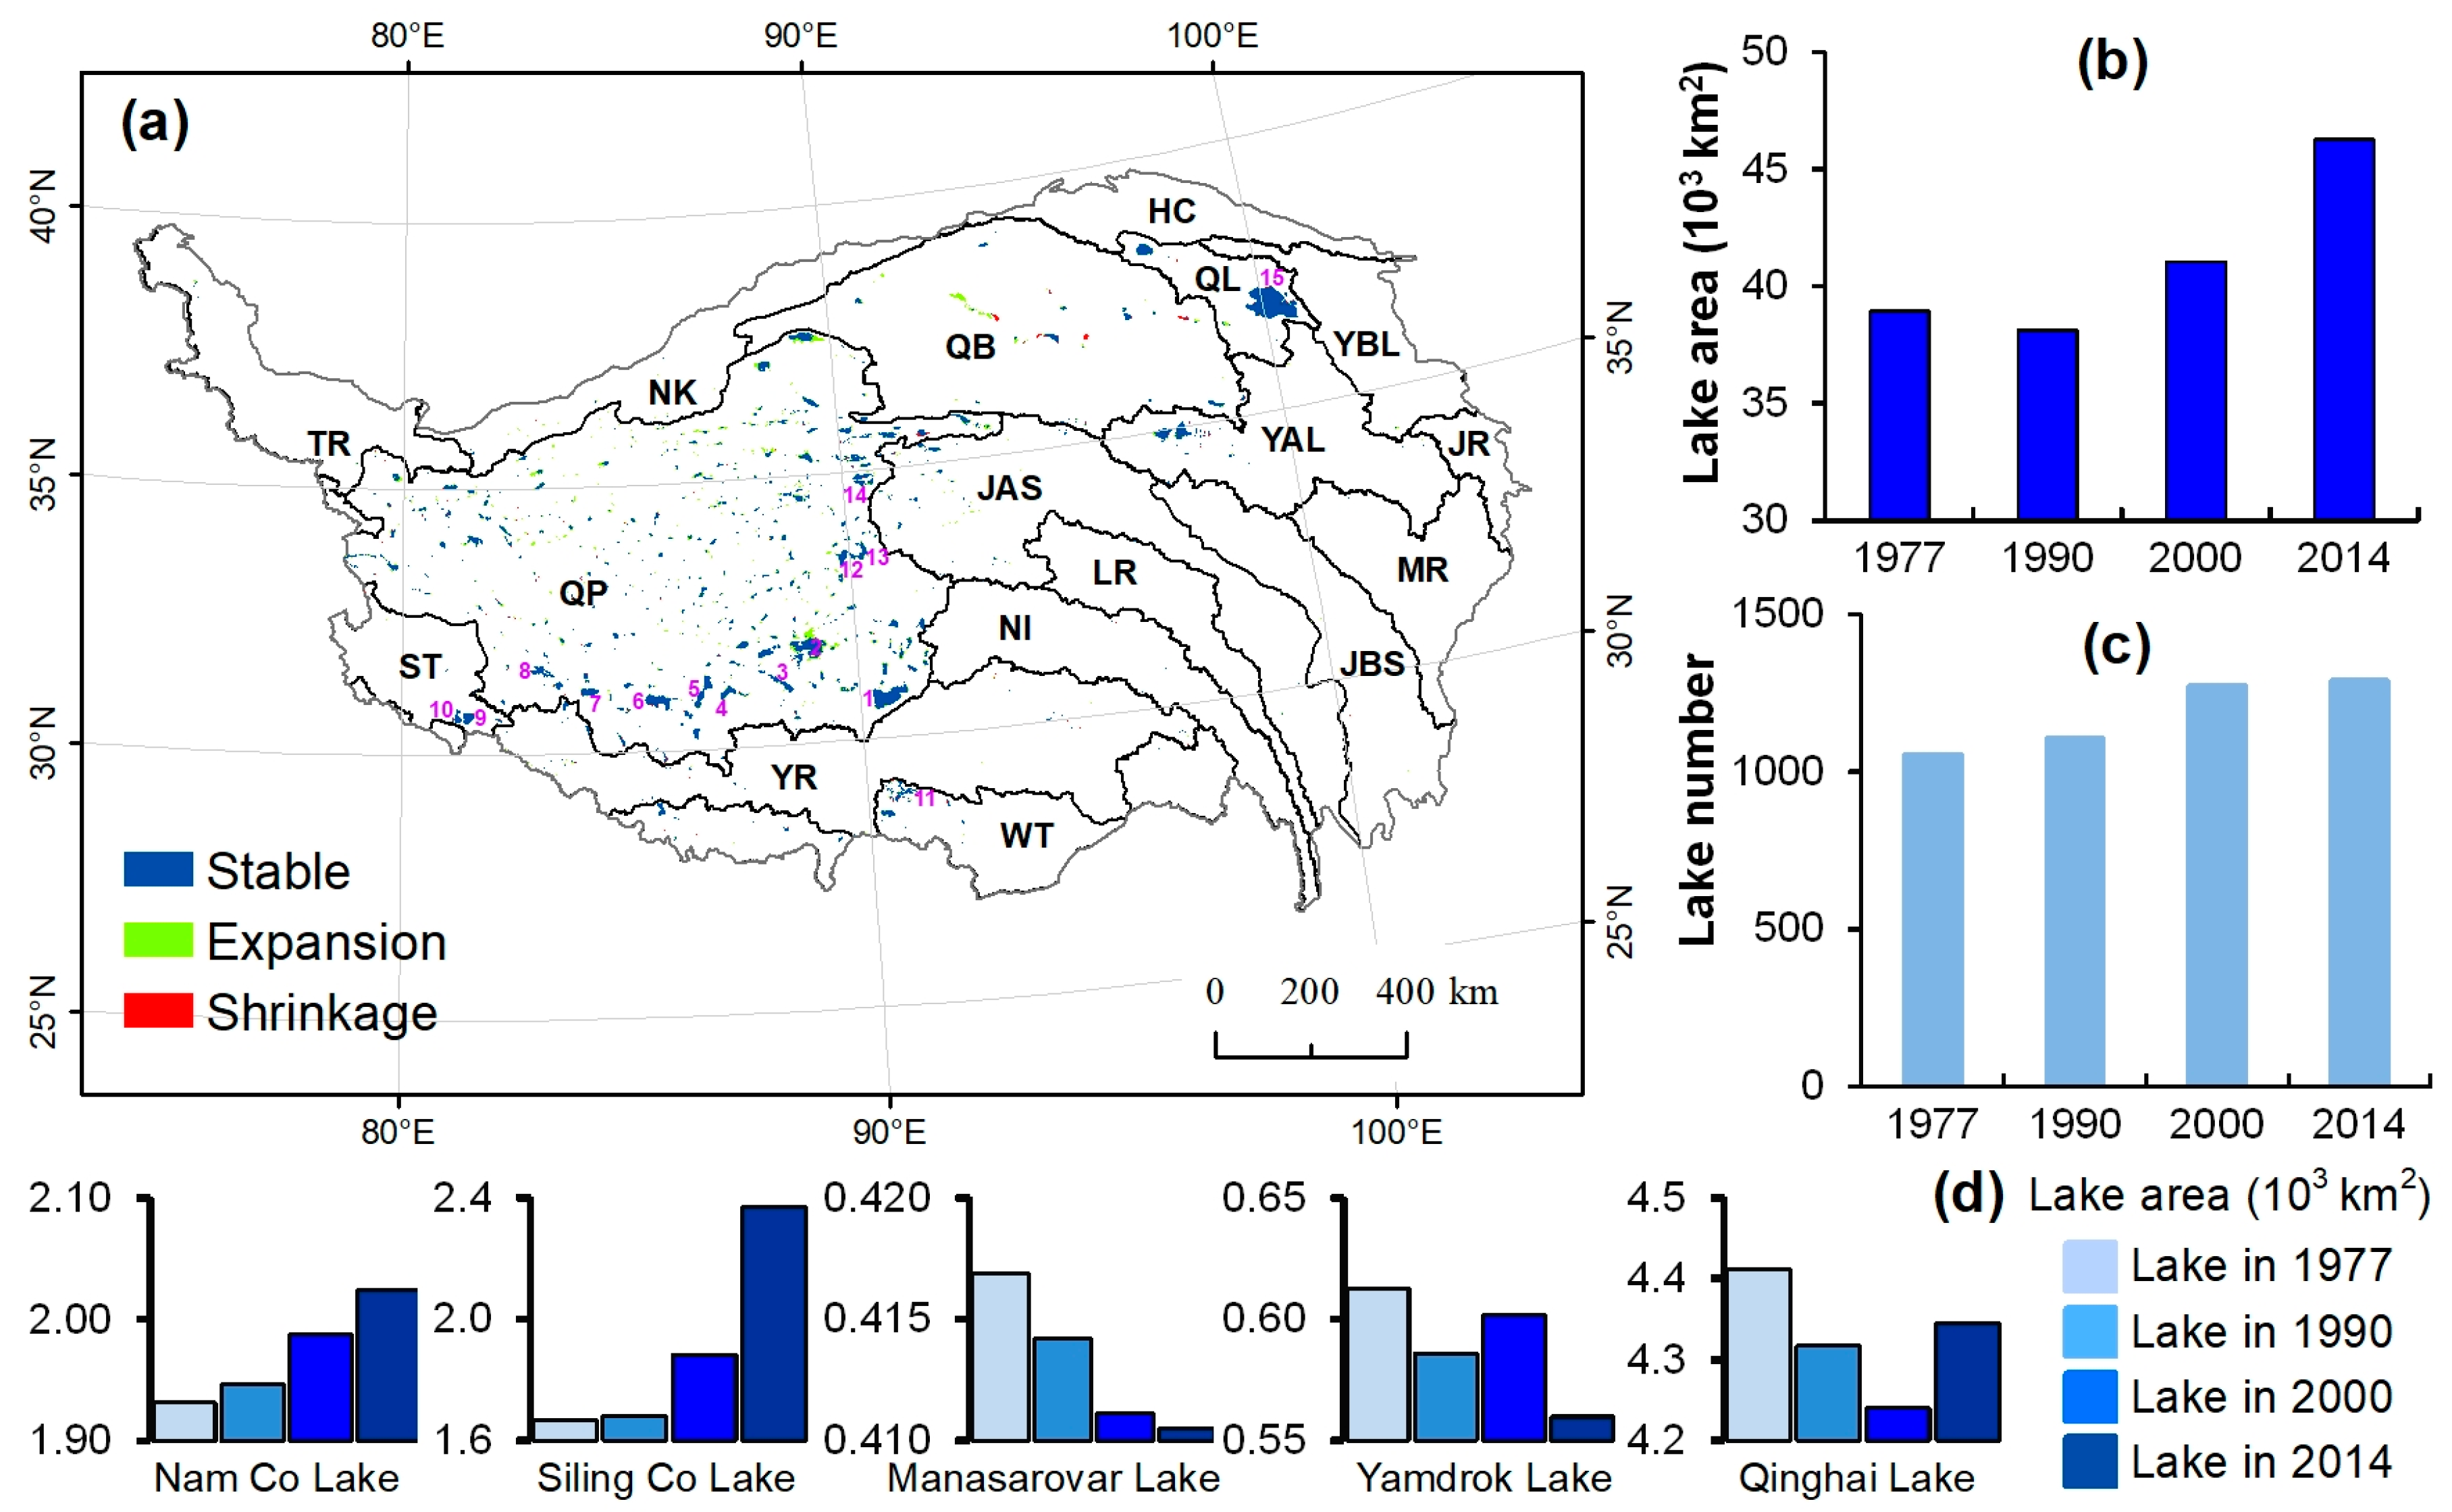
A large number of lakes are identified on the TP, especially in the QP watershed (Figure 3a). Across the TP as a whole, large increases in both the number of lakes and the total lake area between 1977 and 2014 are indicated (Figure 3b). Over this period, the total number of lakes (area > 1 km2) increased by 235 from the original 1056 whilst their total area increased by 19% from 38,952 km2 to 46,265 km2 (Table 1).
During the period 1977–1990, however, the total area of all lakes within the TP declined slightly (2%) from 38,952 km2 to 38,126 km2 although the direction and magnitude of changes varied between watersheds. For example, as the watershed with the largest total lake area, QP experienced a decline in the number (2.6%) and area (3.6%) of lakes during this period. In contrast, larger increases (61.1% and 5.6%, respectively) were experienced in the QB watershed. During the second period, 1990–2000, the total number of Tibetan lakes increased from 1109 to 1275 with the total area expanding by 7.7%, from 38,126 km2 to 41,055 km2. However, in the northeastern and southwestern parts of the TP, different trends were experienced. For example, both the number and area of lakes in the QB, YAL, and HC watersheds, which lie in the northeastern TP, experienced declines (mean declines in the number and area equating to 15.2% and 4.0%, respectively). Between 2000 and 2014, the total number of lakes in the TP increased from 1275 to 1291 whilst their area expanded by 12.7% (from 41,055 km2 to 46,265 km2). These overall lake area increases mask spatial differences with nine watersheds showing increases and another six watersheds, mainly in southern TP, showing decreases.
To further analyze these changes, all lakes were categorized into six classes based on their area: >1000, 500–1000, 100–500, 50–100, 10–50, and 1–10 km2. Detailed lake changes for these different classes are shown in Table 2.
During the period 1977–1990, both the total area and number of lakes in the size classes 1–10 and 100–500 km2 increased, while both the total area and number of lakes in the 10–50 and 500–1000 km2 size classes decreased. The tenth largest lake in 1977, Ulan Ul Lake, split into two separate lakes, resulting in a decrease in the number of lakes in the 500–1000 km2 class from 9 to 8.
During the 1990–2000 period, the total area of lakes increased for all the size classes. The largest number of increases in lake number was for the 1–10 km2 size class which accounted for 123 of the net total of 166 new lakes. During this period, Ngangla Ringco Lake shrunk from size class 500–1000 km2 (520 km2) in 1990 to size class 100–500 km2 (495 km2) in 2000. Two separate lakes, Dorsoidong Co and Chibzhang Co, became connected between 1990 and 2000 to form a larger lake, covering a total area of 882 km2.
During the period 2000–2014, the area of the fourth largest lake, Zhari Namco Lake increased from 967 km2 (size class 500–1000 km2) to 1003 km2 (size class > 1000 km2). The previously connected lakes Dorsoidong Co and Chibzhang Co together expanded to 1012 km2 (size class > 1000 km2). Ulan Ul Lake, which was shown to comprise two separate lakes during the 1977–1990 period, merged during the 2000–2014 period forming a larger lake covering a total area of 603 km2 by 2014.
Further investigation of lake changes is possible using an east-west transect of ten selected lakes (numbers 1–10 in Figure 3a) along the Gangdise Mountains (Table 3). There is marked variation in the changes along this transect. Between 1977 and 2014 the seven easternmost lakes experienced obvious expansions in area, while the areas of the three westernmost lakes (Ngangla Ringco, Mapam Yumco, and La’nga Co) declined.
3.2. Spatially Variable Changes in Climate Factors, Glacier Extent, and Permafrost on the TP
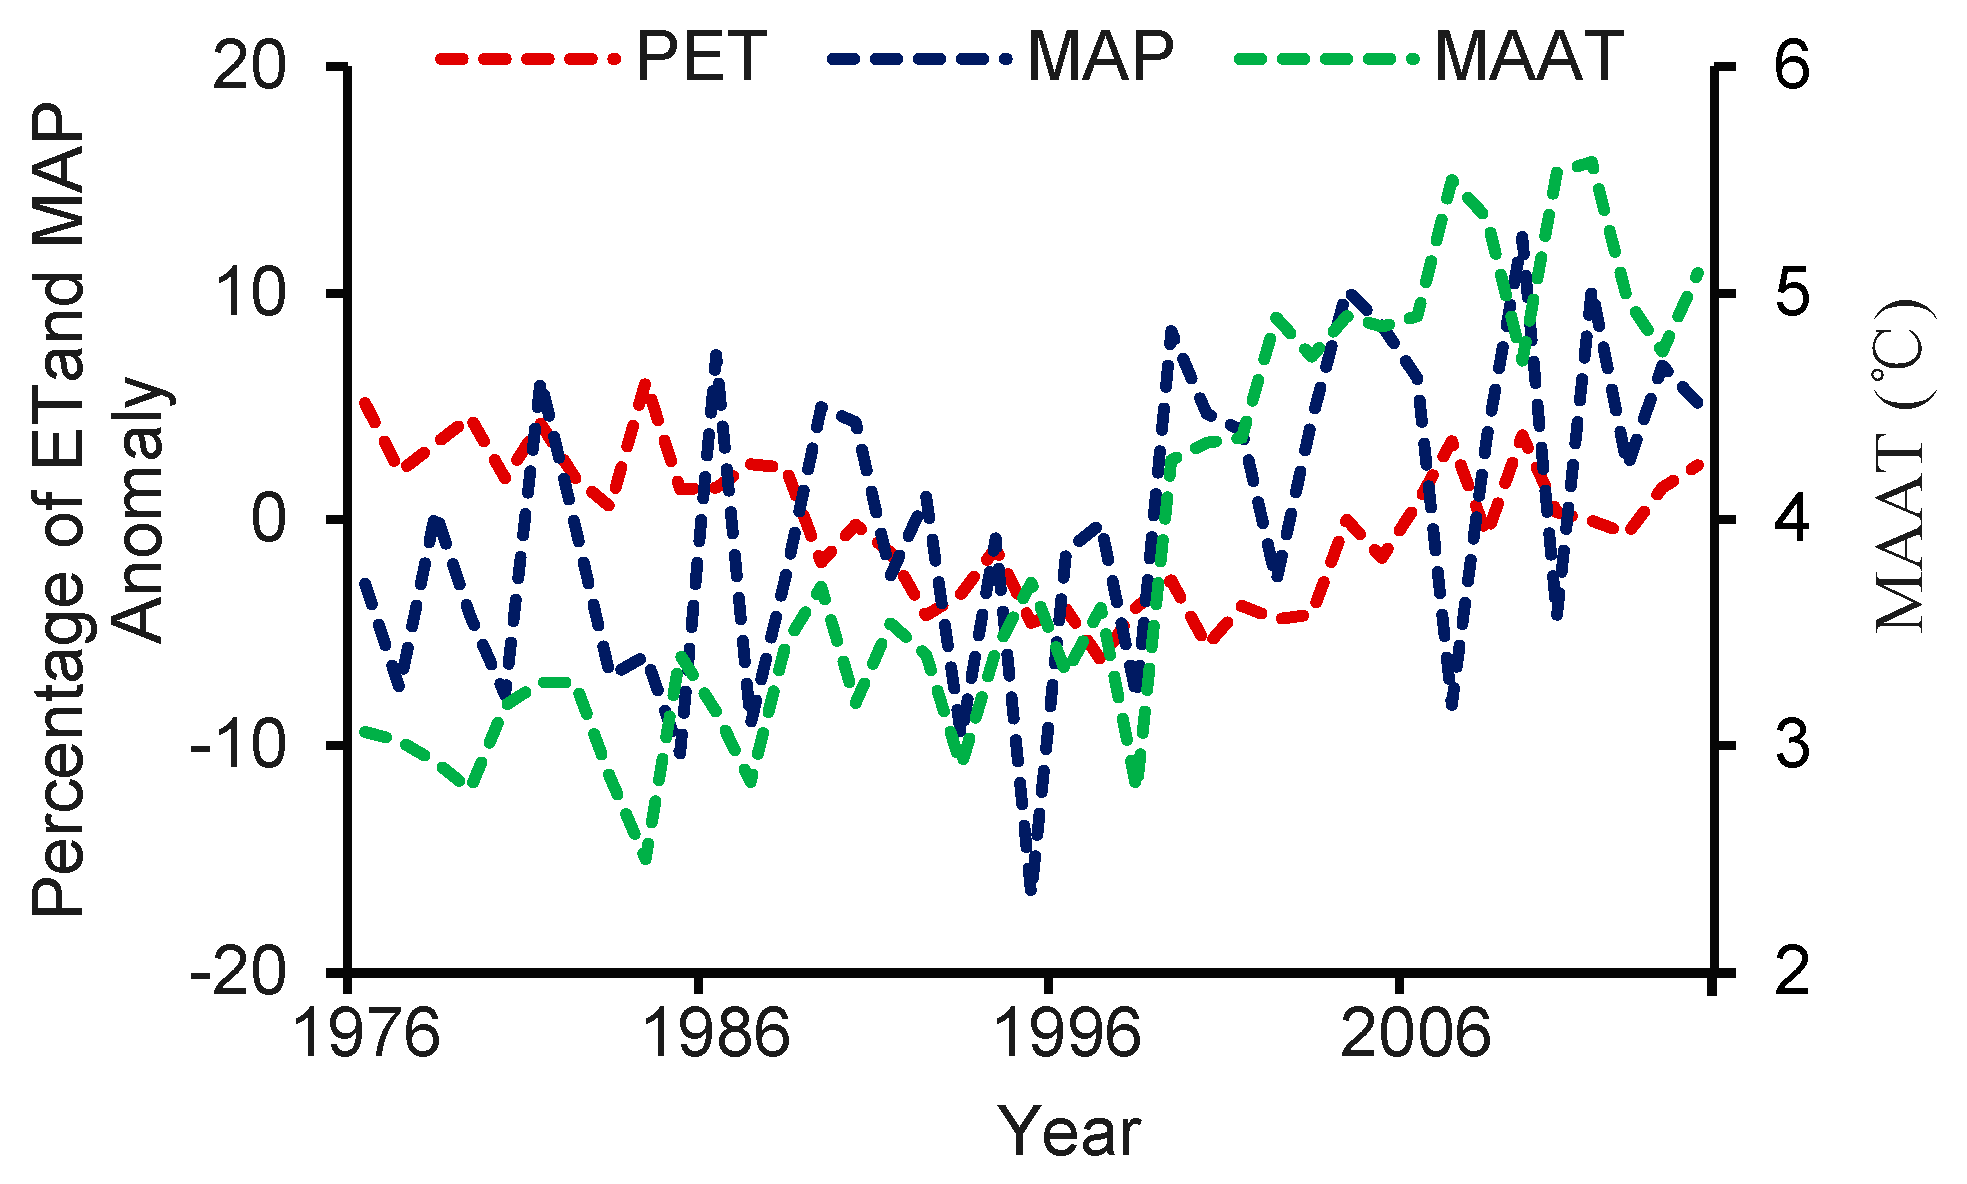
During the past four decades, changes in MAAT and MAP demonstrate a progressively warmer and wetter climate over the TP (Figure 4). Particularly large changes took place between 2000 and 2014. Over this period MAAT increased by 1.6 °C and MAP increased by 20 mm compared to the corresponding mean for the earlier 1977–2000 period of 3.3 °C and 340 mm, respectively. On average, annual PET decreased by 4.5 mm per year from 1977 to 2000, and then increased by 5.0 mm per year between 2000 and 2014 (Figure 4). Given this apparent difference in the nature of climate changes, we therefore focus analysis of changes in MAAT, MAP, and PET on either side of the year 2000.
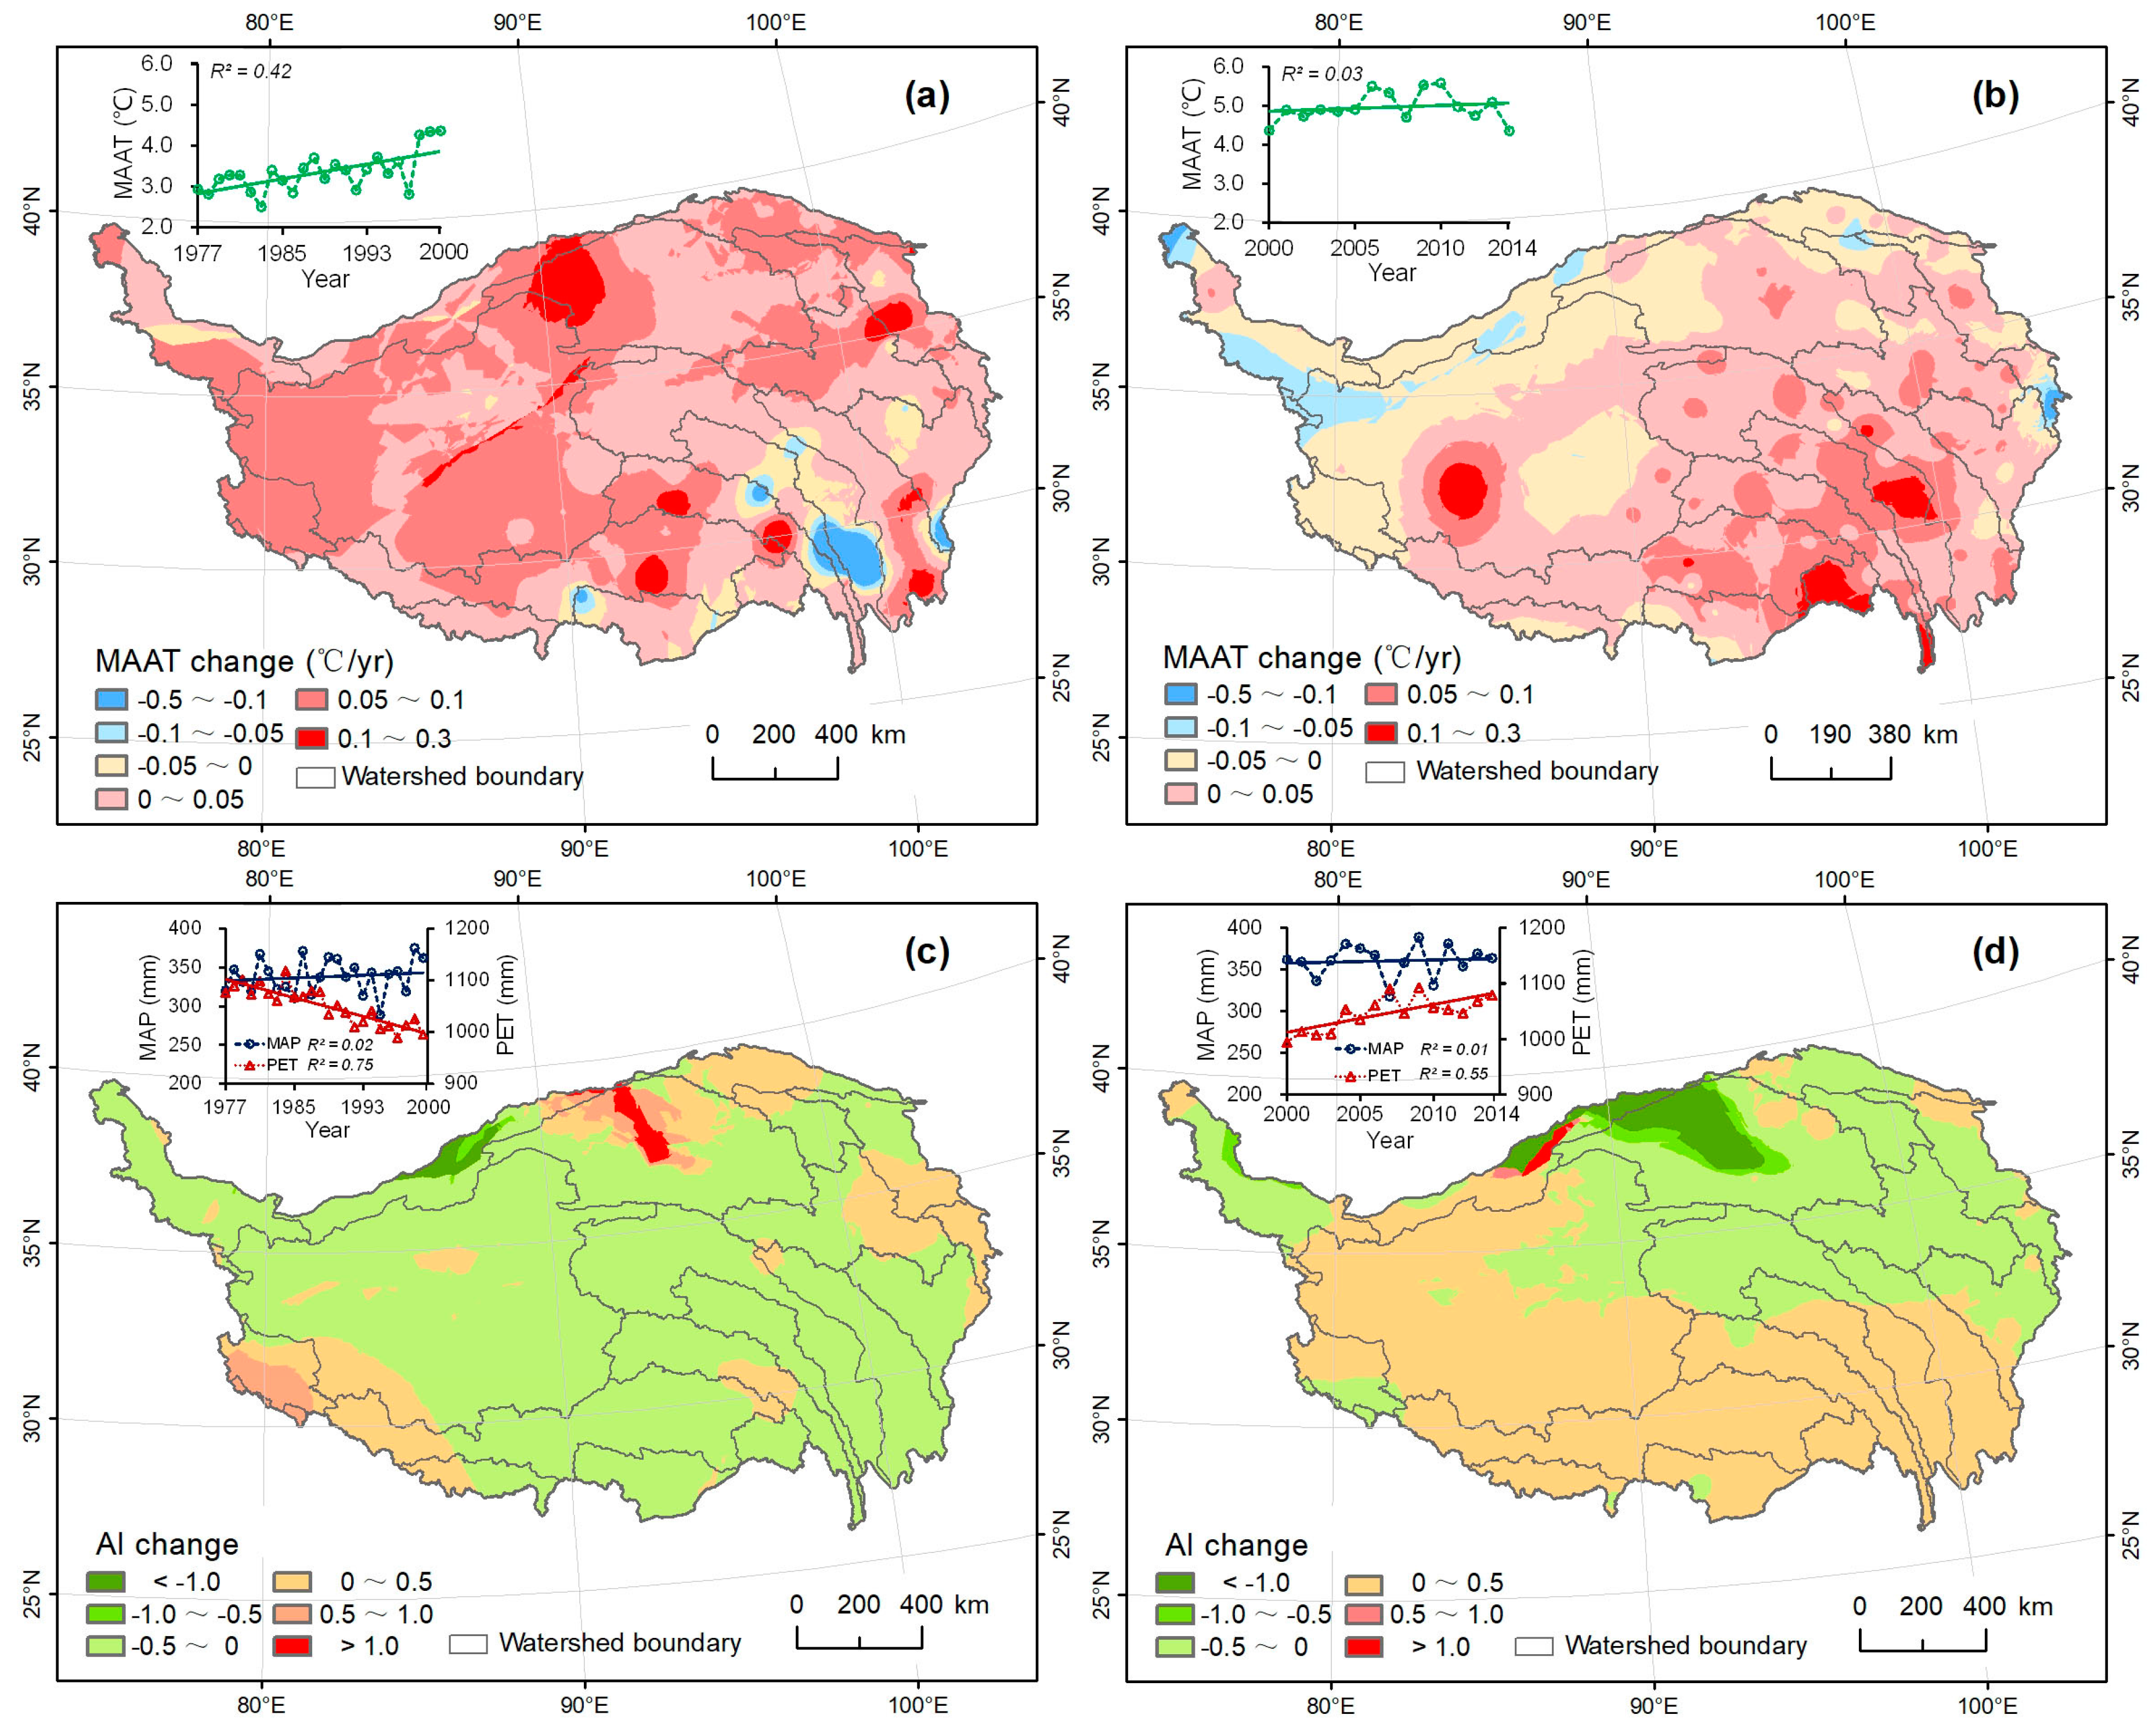
During the period 1977–2000, MAAT exhibited increases of up to 0.1 °C yr−1 across most of the TP. Declines were only recorded in the southern JAS and LR watersheds (Figure 5a). Unlike 1977–2000, MAAT in the northwestern part of the TP (TR, NK, WT, HC, and northwestern QP and QB watersheds) declined slightly (by up to 0.1 °C yr-−1) between 2000 and 2014 (Figure 5b). During the period 1977–2000, most of the TP experienced declines in the AI with changes in the range −0.5–0 being dominant. Exceptions were WT, the north of QB, and JR where small increases in AI were recorded (Figure 5c). Declines in AI were in response to decreasing PET during the earlier period (Figure 5c). Changes in AI were more spatially variable in the later 2000–2014 period with a drier climate dominating in the southwestern TP (positive AI changes with increases in the range 0–0.5 dominating) while wetter climatic conditions in the northeast resulted in negative AI changes (Figure 5d). The drier climate was linked to increases in PET during this period (Figure 5d). Although most of this area falls within the −0.5–0 range of change in AI, larger changes (≤1.0) were experienced over the central-northern part of the TP.
Large areas of mountains on the TP were covered by glaciers (Figure 2), especially in the TR, YR, ST, NK, and QP watersheds. Previous reports have documented that glacier area on the TP has decreased substantially over the past several decades. As summarized by Ye et al. [43], all of the 17 watersheds exhibited continuous glacier shrinkage from 1970s to 2013. The larger decline in glacier area occurred in the Kunlun Mountains (TR and NK watersheds) and Gangdise Mountains (WT, YR, and QP watersheds).
Extensive permafrost is distributed across the central and western TP (Figure 2), which accounts for 63% of the total plateau area. The QP watershed has the largest proportion of its area covered in permafrost (96%), while MR has the smallest (4%). Based on the spatial distribution of permafrost categories and MAAT changes, permafrost degradation was most pronounced between the Himalayas and Tanggula Mountains (watersheds WT and YR) and in north of the Hengduan Mountains (watersheds LR, NI, and JAS).
3.3. Patterns and Processes in Impacts of Climate and Associated Changes on Tibetan Lakes
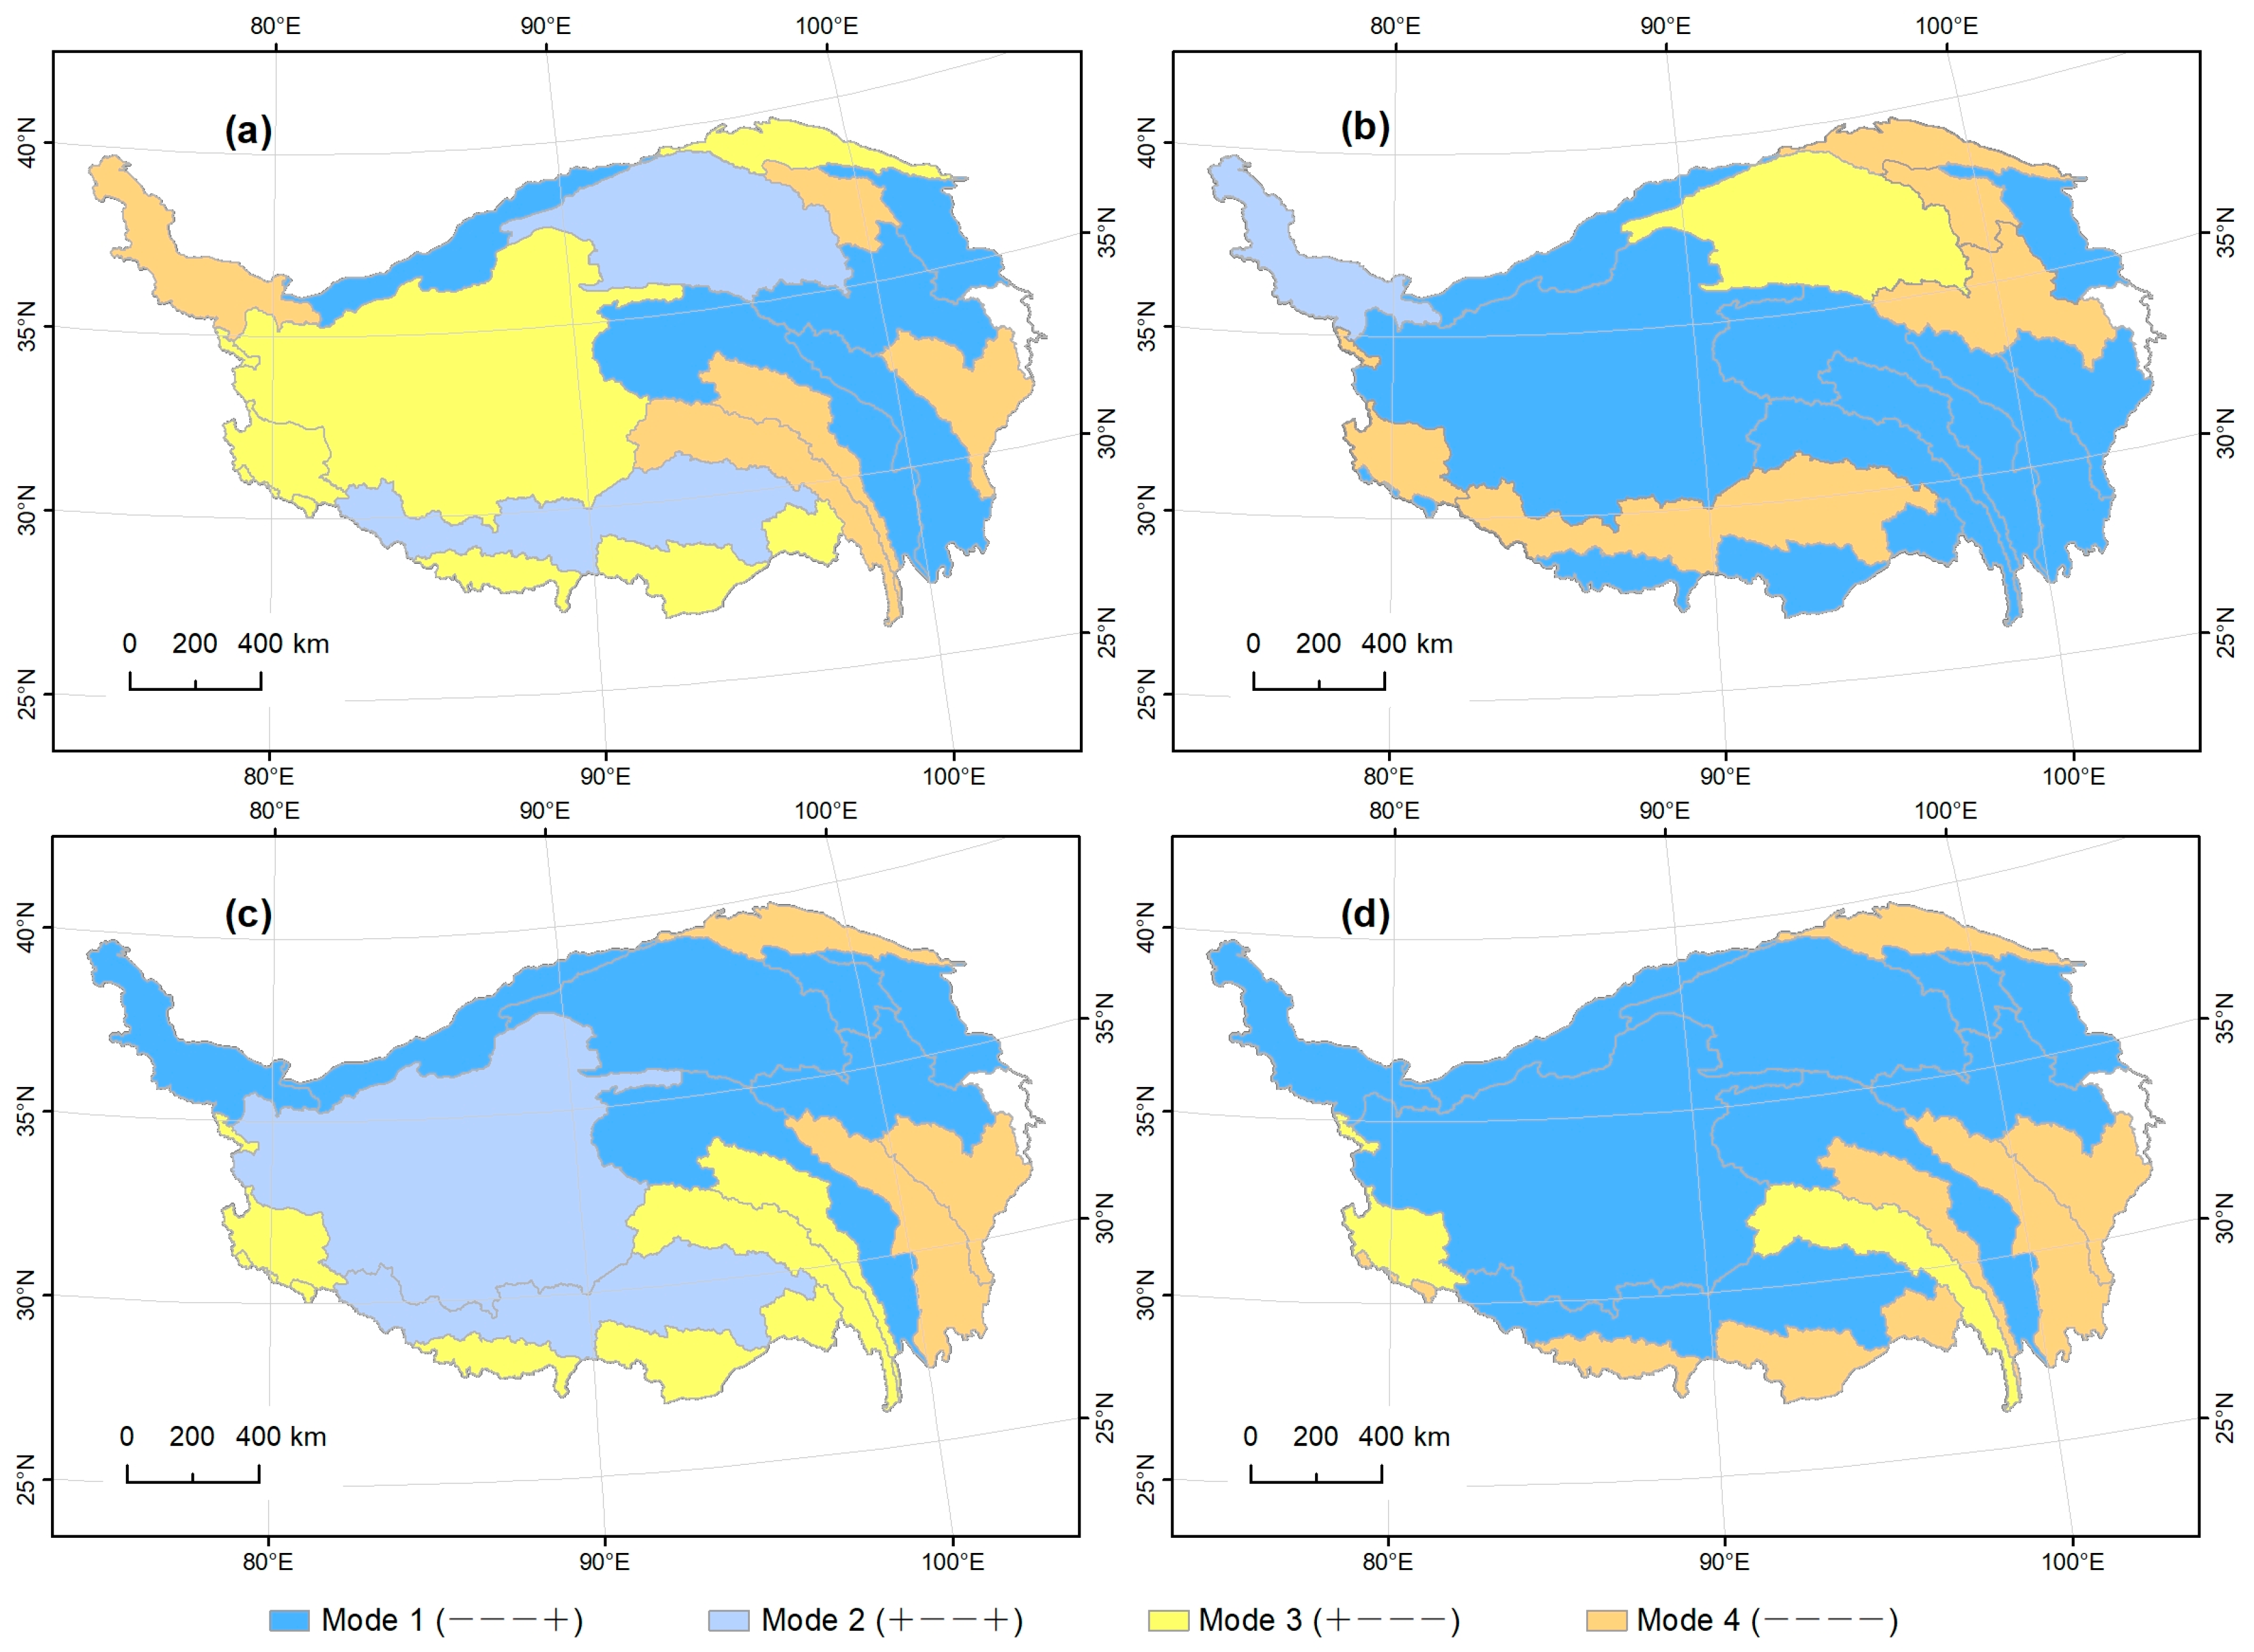
In order to disentangle the heterogeneity of lake changes across the TP, change trends in AI, glacier area, permafrost degradation, and lake area at the watershed scale were categorized into four response modes for each of the observed periods between 1977 and 2014. Glacier melt and permafrost degradation were the common features in the 17 watersheds. Modes 1 and 2 are commonly characterized by increases in the area of lakes, but they have decreased and increased AI, respectively. The other two modes are associated with reduced lake area. Mode 3 is characterized by increases in AI, while Mode 4 is characterized by declining AI. The modes assigned to the 16 watersheds (JR watershed was excluded because it had no lake larger than 1 km2) for each of the near decade long periods as well as the complete 1977–2014 period are summarized in Table 4 and illustrated in Figure 6 in order to identify the different responses of lakes to climate and associated changes across the TP.
The categorized response modes at the watershed scale were geospatially varied across the plateau. During the period 1977–1990, modes 1 and 4 were dominant with both occurring in five watersheds (Mode 1: YAS, YBS, YAL, YBL, and NK; Mode 4: TR, LR, NI, MR, and QL, see Figure 6a). Four watersheds (QP, WT, ST, and HC) were characterized by Mode 3. Mode 2 was observed in QB and YR. In the following period (1990–2000), Mode 1 was again dominant (nine watersheds: QP, NK, ST, WT, JAS, JBS, NI, MR, and YBL—Table 4 and Figure 6b). Five watersheds (ST, YR, YAL, QL, and HC) were characterized by Mode 4. Modes 2 and 3 both occurred in only one watershed (TR and QB, respectively). During the third period (2000–2014), Mode 1 was dominant in seven watersheds including TR, NK, QB, YAL, YBL, JAS, and QL (Figure 6c). Mode 3 occurred in four southern watersheds (ST, WT, NI, and LR), whilst Mode 4 dominated in the JBS, MR, and HC watersheds. Mode 2 was identified in two watersheds (QP and YR).
Over the whole period of 1977–2014, Mode 1 was dominant, occurring in central nine watersheds (TR, NK, QP, QB, QL, YR, JAS, YAL, and YBL) and accounting for the largest area of the TP (Figure 6d). Five watersheds (WT, LR, JBS, MR, and HC) exhibited Mode 4, whilst Mode 3 occurred in two watersheds (ST and NI). Mode 2 was not identified in this period.
4. Discussion
The climate of the TP has become warmer and wetter over the last few decades (Figure 4). Glaciers have evidently reduced in area and thinned across much of the plateau although there are some regional anomalies [47], mainly within the Kunlun and Qilian Mountains (QL and HC watersheds) likely as a result of glacier surging. Although detailed, plateau-wide glacier mass balance analyses are lacking, increasing glacier melting [43,48] and, as a result, increased water supplies to Tibetan lakes have been widely reported. At the same time, permafrost has degraded [9]. These changes have markedly affected the number and area of lakes, in particular those in smallest size class (1–10 km2) [14]. Changes in lakes established for the TP in the current study differ from those identified for Arctic lakes where a declining trend is dominant [49]. Although warming, increased precipitation, and permafrost degradation were observed in both the Arctic and the TP, increases in lake number and area on the TP demonstrated by this study are assumed to have a different origin to the changes in the Arctic where spatial patterns of lake reduction were predominantly associated with thawing permafrost [49].
Distinct differences in the changes in MAAT, MAP, and PET on the TP before and after 2000 were identified in this study. The declines in PET in the early part of this period were predominantly due to lower wind speed and increased relative humidity [7], in turn driven by warmer temperature with a correlation coefficient of 0.516. Additionally, spatial variance in the rates of change in MAAT and AI were observed in different watersheds. Therefore, the responses of lakes to climate change were examined in different periods at the watershed scale. In our study, spatial differences in the changes in lake number and area and their influencing factors were evident among the 17 major watersheds that were investigated. Therefore, the distribution of the four response modes varied spatially at the watershed scale across the plateau. The four response modes documented that increases in lake water supply can largely be attributed to enhanced precipitation and glacier melt water (modes 1 and 2), while declines in lake area are mainly attributed to increasing evapotranspiration and permafrost degradation (modes 3 and 4).
Wetter climate and glacier melt contribute to increases in lake area, whereas drier periods reduce water supplies and consequentially lake extent (modes 1 and 2). Some of the changes exhibited by lakes on the TP can be illustrated using specific cases. For example, Nam Co Lake (Figure 3d), located in the south-central part of the TP within the QP watershed (Figure 3a), is a typical example of a lake which exhibited continuous increases in area (92.2 km2 or 4.7% over the period 1977–2014) that were primarily due to increases in MAP combined with glacier melt [24,50]. As reported by Ye et al. [43], the decline in glacier area within the Namco Lake’s watershed was the largest of any watershed on the TP. The Siling Co Lake (Figure 3d), located within the same watershed and subject to the same changes, was originally smaller than Nam Co but by 2014 had grown to become the second largest lake on the TP. The continuous expansion of the lake (704 km2 or 42.3%) during the period 1977–2014 inundated a large area of surrounding pastureland, although increases in the area of aquatic plants improved habitat condition for waterfowl and other aquatic species [51]. However, in those watersheds with particularly large increases in lake extent, for example NK and YBL, the impacts of further extensive inundation of lakeside grasslands and, in turn, the implications for animal husbandry [3] will need to be assessed. The QP watershed has about 70% of the total lake area on the TP, and was characterized by Mode 1 from 1977 to 2014. The area of lakes with wetter climate and filled with melt glaciers increased over the whole TP.
Declines in lake area during the period 1980–2000 have been observed in parts of Central Asia. These were attributed to reductions in precipitation and warmer temperatures [51]. The same driving forces responsible for reductions in lake area on the TP feature in one of the response modes (Mode 3) identified in the current study. Increased water supply from the melting of glaciers triggered by warming climate does not completely compensate for the declines due to a drier climate leading to lake area decline [36,52]. The dominant influence of drier climate in explaining the declines in lake extent on the TP is in agreement with the reduction in lakes within arid or semiarid zones, such as those reported for the Outer Mongolian Plateau [23,53] and Northern China [54]. Lakes within the WT watershed, which comprises the headwaters of a number of large international rivers (the Indus, Ganges, Sutlej, and Brahmaputra), declined (by 37.3 km2 or 4.7%) during the period 1977–2014. Manasarovar Lake, which is located within this watershed (Figure 3a) and is one of the three largest sacred lakes of Buddhism, Hinduism, and Bon [55], has continually shrunk (by 6 km2 or 1.5%) over the past four decades. Such lake shrinkage induced by climate changes therefore has important cultural and religious significance. Qinghai Lake, a sacred lake in the northeast TP which is also listed as an internationally important Ramsar wetland, also experienced reductions in its area (171 km2 or 3.9%) during the period 1977–2000. In addition to the possible effects on local religious life, this decline has degraded habitat quality for a large migratory bird population as well as grassland productivity [56]. Although the shrinkage of the lake was reversed during the period 2000–2014 (Figure 3d), scientifically-sound planning of water resources in this part of the TP will be essential. Collaboration between governments, scientists, and local communities will be indispensable in order to minimize the impacts of continued changes in lake extent. For example, sustainable tourism development will be vital to conserve lakes, particularly sacred lakes and those with nature conservation designations. Furthermore, water resources planning will need to include assessments of the feasibility of proposed hydropower plants on rivers in this region such as on the Buha River [57,58]. In watersheds characterized by modes 4 and 5, declines in the volume of runoff may limit future electricity generation from existing hydropower whilst plans for new hydropower plants should be carefully evaluated considering the possible challenges associated with declining water resources.
Although in some watersheds (e.g., MR) water supplies have apparently been enhanced due to a wetter climate and melting glaciers, total lake area has not increased (i.e., Mode 4). These changes may be linked to permafrost degradation, whereby a warming climate reduces the extent of frozen impervious layers and thus increases infiltration and reduces surface runoff [9,59]. The thicker active layer increases root zone storage capacity that enables more rainfall/snowmelt to infiltrate and then be stored in the root zone from where it is then evaporated and transpired. Runoff and so surface water flows, to lakes are consequentially reduced. Meanwhile, warmer temperatures can lead to thinning and eventual “breaching” of permafrost near lakes, facilitating topsoil erosion and drainage from the water body [60]. In this way, permafrost degradation resulting from a warming climate can induce lake shrinkage [60,61] and is probably the reason for the notable reduction in the size of Yamdrok Lake (53.1 km2 or 8.7% over the period 1977–2014), another sacred lake in Tibet (Figure 3d). In Alaska, a considerable range of changes in the number and area of lakes has been observed for different categories of permafrost [47]. This was repeated on the TP, where lake changes varied among watersheds characterized by different permafrost categories [17]. Permafrost degradation in the Three-River Headwater Region, which is largely confined within the YAL and northern JAS and LR watersheds employed in the current study, has been identified during the past decades [59,60]. It is a likely major contributory factor in the decrease in lake area reported for this part of the TP in the current study. We observed that some lakes close to roads, especially those with small areas, experienced obvious shrinkage under the background of wetter climate and glacier retreat. We hypothesize that this area decline may be mostly related to permafrost degradation. The potential effects of permafrost degradation induced by warmer temperatures would clearly merit further detailed investigation. In watersheds that currently have extensive permafrost, measures will be required to mitigate climate change-related degradation, particularly impacts on infrastructure. The existing road and railway networks as well as future developments, such as the recently planned Sichuan-Tibet and Sichuan-Qinghai railways may further exacerbate permafrost degradation and in turn may be impacted by it [15]. Careful line selection and low-impact designs and development will be required to mitigate damage to permafrost which will in turn address potential impacts on lakes.
In this study, multiple datasets were employed to examine the patterns and processes of climate and associated changes at the watershed scale. Spatiotemporal changes in the climatic factors obtained from long-term meteorological observations and remote sensing were assessed. Although the majority of meteorological stations are located on the eastern TP, spatial interpolation of climatic factors using Aunsplin software at least enables altitude to be incorporated within the interpolated datasets used to determine the variable climatic changes within the different watersheds. The expansion of meteorological monitoring networks into those areas that are currently underrepresented would, however, be a priority for establishing more comprehensive assessments of changes in the climate of the TP into the future. Additionally, this study used the AI index to identify impacts of climate change on lakes instead of directly employing MAP and PET in order to avoid potential confusion of simultaneously discussing precipitation and evapotranspiration whilst addressing some potential errors in interpolated datasets.
In common with other studies [17,23], detailed spatial distributions of different permafrost categories and their degradation over time were unavailable and this represents an important data deficiency. Although permafrost degradation is irrefutable on the TP [9,26], updated spatial data describing the distribution of permafrost is clearly desirable for future studies of the impacts of climate change on the TP. The analysis of an east-west transect of ten selected lakes across the Gangdise Mountains reveals variable lake area changes as a result of multiple factors. In addition to climate and associated changes, topographic features largely affect the change in lake area. As shown by the transect analysis, changes in six of the lakes for each period were in accordance with the modes for the watersheds in which they are located (Table 3). With the exception of Ngangla Ringco Lake, which is located towards the border of the watershed, changes for all of the selected lakes were consistent with the modes in the corresponding watersheds during the period 1977–2014. Long-term monitoring of lake levels at more local scales would further contribute to understanding the complicated responses of lakes to climate change. Lakes on the TP not only represent important natural resources that are utilized directly by humans [11], but they have important religious, historical, and cultural significance [62]. Continued scientific research coupled with long-term monitoring will be critical for assessing the future responses of the lakes of the TP to further climatic changes.
5. Conclusions
The integration of meteorological records and remote sensing data has enabled the investigation of the impacts of spatially variable patterns of climate and associated environmental changes on Tibetan lakes. We analyzed the spatially variable changes in lake number and area, an aridity index (which integrates precipitation and potential evapotranspiration), and mean annual air temperature in 17 watersheds on the TP between 1977 and 2014. Our study reveals that the number and area of lakes on the Tibetan Plateau are sensitive to climate change, and its impacts on meteorological conditions and in turn glacier and permafrost changes. Over the nearly four-decade period, the total number and area of lakes (area > 1 km2) increased from 1056 to 1291 (22%) and from 38,951 km2 to 46,264 km2 (19%), respectively. Four modes were identified to characterize the different responses of Tibetan lakes to climate change, glacier retreat, and permafrost degradation. In the majority of the 17 watersheds, a wetter climate and the melting of glaciers increased inflows to lakes, thereby contributing to gains in lake area. However, a drier climate and probable permafrost degradation in some watersheds resulted in losses in lake area. Lakes on the TP are not only critically important natural resources, but also have religious, historical, and cultural significance. Our findings shed new light on the impacts of climate and associated changes on Tibetan lakes. Geospatially variable response modes suggest that a range of policies and measures will be required to manage the lakes on the world’s third pole.
Acknowledgments
This research was jointly supported by the National Key R&D Program of China (2016YFC0500201), the Strategic Priority Research Program of the Chinese Academy of Sciences (XDA19040503), funding from the Youth Innovation Promotion Association of the Chinese Academy of Sciences (2017277) and the China Scholarship Council (201604910407). We thank the three anonymous reviewers for their constructive comments on our manuscript.
Author Contributions
Dehua Mao and Zongming Wang initially conceived the study and Hong Yang refined the idea. Dehua Mao and Huiying Li generated and collated the datasets. Dehua Mao, Hong Yang, and Zongming Wang performed the data analysis and prepared the manuscript. Julian R. Thompson, Lin Li, Kaishan Song, Bin Chen, Hongkai Gao, and Jianguo Wu provided critical feedback and edited the manuscript.
Conflicts of Interest
The authors declare no conflict of interest.
References
- Adrian, R.; O’Reilly, C.M.; Zagarese, H.; Baines, S.B.; Hessen, D.O.; Keller, W.; Livingstone, D.M.; Sommaruga, R.; Straile, D.; Donk, E.V.; et al. Lakes as sentinels of climate change. Limnol. Oceanogr. 2009, 54, 2283–2297. [Google Scholar] [CrossRef] [PubMed] [Green Version]
- Williamson, C.E.; Saros, J.E.; Schindler, D.W. Sentinels of change. Science 2009, 323, 887–888. [Google Scholar] [CrossRef] [PubMed]
- Qiu, J. China: The third pole. Nature 2008, 454, 393–396. [Google Scholar] [CrossRef] [PubMed]
- Immerzeel, W.W.; van Beek, L.P.H.; Bierkens, M.F.P. Climate change will affect the Asian water towers. Science 2010, 328, 1382–1385. [Google Scholar] [CrossRef] [PubMed]
- Xu, B.; Cao, J.; Hansen, J.; Yao, T.; Joswia, D.R.; Wang, N.; Wu, G.; Wang, M.; Zhao, H.; Yang, W.; et al. Black soot and the survival of Tibetan glaciers. Proc. Natl. Acad. Sci. USA 2010, 106, 22114–22118. [Google Scholar] [CrossRef] [PubMed]
- Wu, S.; Yin, Y.; Zheng, D.; Yang, Q. Climatic trends over the Tibetan Plateau during 1971–2000. J. Geogr. Sci. 2007, 17, 141–151. [Google Scholar] [CrossRef]
- Chen, S.; Liu, Y.; Axel, T. Climatic change on the Tibetan Plateau: Potential evapotranspiration trends from 1961-2000. Clim. Chang. 2006, 76, 291–319. [Google Scholar]
- Yao, T.; Thompson, L.; Yang, W.; Yu, W.; Gao, Y.; Guo, X.; Yang, X.; Duan, K.; Zhao, H.; Xu, B.; et al. Different glacier status with atmospheric circulations in Tibetan Plateau and surroundings. Nat. Clim. Chang. 2012, 2, 663–667. [Google Scholar] [CrossRef]
- Cheng, G.; Wu, T. Responses of permafrost to climate change and their environmental significance, Qinghai-Tibet Plateau. J. Geophys. Res. 2007, 112, F02S03. [Google Scholar] [CrossRef]
- Piao, S.; Ciais, P.; Huang, Y.; Shen, Z.; Peng, S.; Li, J.; Zhou, L.; Liu, H.; Ma, Y.; Ding, Y.; Friedlingstein, P.; et al. The impacts of climate change on water resources and agriculture in China. Nature 2010, 467, 43–51. [Google Scholar] [CrossRef] [PubMed]
- Yao, T.; Wang, Y.; Liu, S.; Pu, J.; Shen, Y.; Lu, A. Recent glacial retreat in High Asia and its impact on water resource in Northwest China. Sci. China Earth Sci. 2004, 147, 1065–1075. [Google Scholar] [CrossRef]
- Liu, J.; Wang, S.; Yu, S.; Yang, D.; Zhang, L. Climate warming and growth of high-elevation inland lakes on the Tibetan Plateau. Glob. Planet. Chang. 2009, 67, 209–217. [Google Scholar] [CrossRef]
- Zhang, G.; Xie, H.; Kang, S.; Yi, D.; Ackley, S.F. Monitoring lake level changes on the Tibetan Plateau using ICESat altimetry data (2003–2009). Remote Sens. Environ. 2011, 115, 1733–1742. [Google Scholar] [CrossRef]
- Nie, Y.; Sheng, Y.; Liu, Q.; Liu, L.; Liu, S.; Zhang, Y.; Song, C. A regional-scale assessment of Himalayan glacial lake changes using satellite observations from 1990 to 2015. Remote Sens. Environ. 2017, 189, 1–13. [Google Scholar] [CrossRef]
- Yang, M.; Nelson, F.E.; Shiklomanov, N.I.; Guo, D.; Wan, G. Permafrost degradation and its environmental effects on the Tibetan Plateau: A review of recent research. Earth Sci. Rev. 2010, 103, 31–44. [Google Scholar] [CrossRef]
- Liao, J.; Shen, G.; Li, Y. Lake variations in response to climate change in the Tibetan Plateau in the past 40 years. Int. J. Digit. Earth 2013, 6, 534–549. [Google Scholar] [CrossRef]
- Li, Y.; Liao, J.; Guo, H.; Liu, Z.; Shen, G. Patterns and potential drivers of dramatic changes in Tibetan lakes, 1972-2010. PLoS ONE 2014, 9, 0111890. [Google Scholar] [CrossRef] [PubMed]
- Gibson, J.J.; Prowse, T.D.; Peters, D.L. Hydroclimatic controls on water balance and water level variability in Great Slave Lake. Hydrol. Process. 2006, 20, 4155–4172. [Google Scholar] [CrossRef]
- Kang, S.; Xu, Y.; You, Q.; Flügel, W.; Pepin, N.; Yao, T.D. Review of climate and cryosphere change in the Tibetan Plateau. Environ. Res. Lett. 2010, 5, 015101. [Google Scholar] [CrossRef] [Green Version]
- Scherler, D.; Bookhagen, B.; Strecker, R. Spatially variable response of Himalayan glaciers to climate change affected by debris cover. Nat. Geosci. 2011, 4, 156–159. [Google Scholar] [CrossRef]
- Yang, R.; Zhu, L.; Wang, J.; Ju, J.; Ma, Q.; Turner, F.; Guo, Q. Spatiotemporal variations in volume of closed lakes on the Tibetan Plateau and their climatic responses from 1976 to 2013. Clim. Chang. 2017, 140, 621–633. [Google Scholar] [CrossRef]
- Lei, Y.; Yang, K.; Wang, B.; Sheng, Y.; Bird, B.W.; Zhang, G.; Tian, L. Response of inland lake dynamics over the Tibetan Plateau to climate change. Clim. Chang. 2014, 125, 281–290. [Google Scholar] [CrossRef]
- Zhang, G.; Yao, T.; Piao, S.; Bolch, T.; Xie, H.; Chen, D.; Gao, Y.; O’Reilly, C.M.; Shum, C.K.; Yang, K.; Yi, S.; et al. Extensive and drastically different alpine lake changes on Asia’s high plateaus during the past four decades. Geophys. Res. Lett. 2017, 44, 252–260. [Google Scholar] [CrossRef]
- Liu, J.; Kang, S.; Gong, T.; Lu, A. Growth of a high-elevation large inland lake, associated with climate change and permafrost degradation in Tibet. Hydrol. Earth Syst. Sci. 2010, 14, 481–489. [Google Scholar] [CrossRef]
- Lei, Y.; Yao, T.; Yang, K.; Sheng, Y.; Kleinherenbrink, M.; Yi, S.; Bird, B.W.; Zhang, X.; Zhu, L.; Zhang, G. Lake seasonality across the Tibetan Plateau and their varying relationship with regional mass changes and local hydrology. Geophys. Res. Lett. 2017, 44, 892–900. [Google Scholar] [CrossRef]
- Yao, T.; Thompson, L.G.; Mosbrugger, V.; Zhang, F.; Ma, Y.; Luo, T.; Xu, B.; Yang, X.; Joswiak, D.; Wang, W.; et al. Third pole Environment (TPE). Environ. Dev. 2012, 3, 52–64. [Google Scholar] [CrossRef]
- Cui, X.; Graf, H. Recent land cover changes on the Tibetan Plateau: A review. Clim. Chang. 2009, 94, 47–61. [Google Scholar] [CrossRef]
- Fang, J.; Rao, S.; Zhao, S. Human-induced long-term changes in the lakes of the Jianghan Plain, Central Yangtze. Front. Ecol. Environ. 2005, 3, 186–192. [Google Scholar] [CrossRef]
- Young, N.E.; Anderson, R.S.; Chignell, S.M.; Vorster, A.G.; Lawrence, R.; Evangelista, P.H. A survival guide to Landsat preprocessing. Ecology 2017, 98, 920–932. [Google Scholar] [CrossRef] [PubMed]
- Serra, P.; Pons, X.; Sauri, D. Post-classification change detection with data from different sensors: Some accuracy considerations. Int. J. Remote Sens. 2003, 24, 3311–3340. [Google Scholar] [CrossRef]
- Warner, T.A.; Campagna, D.J. Remote Sensing with IDRISI (R) Taiga: A Beginner’s Guide; Geocarto International Centre: Hong Kong, 2009. [Google Scholar]
- Dronova, I.; Gong, P.; Wang, L. Object-based analysis and change detection of major wetland cover types and their classification uncertainty during the low water period at Poyang Lake, China. Remote Sens. Environ. 2011, 115, 3220–3236. [Google Scholar] [CrossRef]
- McFeeters, S.K. The use of the normalized difference water index (NDWI) in the delineation of open water features. Int. J. Remote Sens. 1996, 17, 1425–1432. [Google Scholar] [CrossRef]
- Rogers, A.S.; Kearney, M.S. Reducing signature variability in unmixing coastal marsh thematic mapper scenes using spectral indices. Int. J. Remote Sens. 2004, 25, 2317–2335. [Google Scholar] [CrossRef]
- Davranche, A.; Lefebvre, G.; Poulin, B. Wetland monitoring using classification trees and SPOT-5 seasonal time series. Remote Sens. Environ. 2010, 114, 552–562. [Google Scholar] [CrossRef] [Green Version]
- Yang, X.; Lu, X. Drastic change in China’s lakes and reservoirs over the past decades. Sci. Rep. 2014, 4, 6041. [Google Scholar] [CrossRef] [PubMed]
- Liu, J.; Tian, H.; Liu, M.; Zhuang, D.; Melillo, J.M.; Zhang, Z. China’s changing landscape during the 1990s: Large-scale land transformations estimated with satellite data. Geophys. Res. Lett. 2005, 32, L02405. [Google Scholar] [CrossRef]
- Ma, R.; Yang, G.; Duan, H.; Jiang, J.; Wang, S.; Feng, X.; Li, A.; Kong, F.; Xue, B.; Wu, J.; et al. China’s lakes at present: Number, area, and spatial distribution. Sci. China Earth Sci. 2011, 54, 283–289. [Google Scholar] [CrossRef]
- Wan, W.; Long, D.; Hong, Y.; Ma, Y.; Yuan, Y.; Xiao, P.; Duan, H.; Han, Z.; Gu, X. A lake data set for the Tibetan Plateau from the 1960s, 2005, and 2014. Sci. Data 2016, 3, 160039. [Google Scholar] [CrossRef] [PubMed]
- Hutchinson, M.F. Anusplin Version 4.2 User Guide; Centre for Resource and Environmental Studies (CRES), The Australian National University: Canberra, Australia, 2002. [Google Scholar]
- Huang, K.; Zhang, Y.; Zhu, J.; Liu, Y.; Zu, J.; Zhang, J. The influences of climate change and human activities on vegetation dynamics in the Qinghai-Tibet Plateau. Remote Sens. 2016, 8, 876. [Google Scholar] [CrossRef]
- Allen, R.G.; Pereira, L.S.; Raes, D.; Smith, M. Crop Evapotranspiration—Guidelines for Computing Crop Water Requirements—FAO Irrigation and Drainage Paper 56; FAO: Rome, Italy, 1998. [Google Scholar]
- Ye, Q.; Zong, J.; Tian, L.; Cogley, G.; Song, C.; Guo, W. Glacier changes on the Tibetan plateau derived from Landsat imagery: Mid-1970s-2000-13. J. Glaciol. 2017, 63, 273–287. [Google Scholar] [CrossRef]
- Gough, W.A.; Leung, A. Nature and fate of Hudson Bay permafrost. Reg. Environ. Chang. 2002, 2, 177–184. [Google Scholar] [CrossRef]
- Tarnocai, C.; Canadell, J.G.; Schuur, E.A.G.; Kuhry, P.; Mazhitova, G.; Zimov, S. Soil organic carbon pools in the northern circumpolar permafrost region. Glob. Biogeochem. Cycles 2009, 23, GB2023. [Google Scholar] [CrossRef]
- Jorgenson, M.T.; Racine, C.H.; Walters, J.C.; Osterkap, T.E. Permafrost degradation and ecological changes associated with a warming climate in central Alaska. Clim. Chang. 2011, 48, 551–579. [Google Scholar] [CrossRef]
- Kapnick, S.B.; Delworth, T.L.; Ashfaq, M.; Malyshev, S.; Milly, P.C.D. Snowfall less sensitive to warming in Karakoram than in Himalayas due to a unique seasonal cycle. Nat. Geosci. 2014, 7, 834–840. [Google Scholar] [CrossRef]
- Wei, J.; Liu, S.; Guo, W.; Yao, X.; Xu, J.; Bao, W.; Jiang, Z. Surface-area changes of glaciers in the Tibetan plateau interior area since the 1970s using recent Landsat images and historical maps. Ann. Glaciol. 2014, 55, 213–222. [Google Scholar]
- Smith, L.C.; Sheng, Y.; MacDonald, G.M.; Hinzman, L.D. Disappearing arctic lakes. Science 2005, 308, 1429. [Google Scholar] [CrossRef] [PubMed]
- Huang, L.; Wang, J.; Zhu, L.; Ju, J.; Daut, G. The warming of large lakes on the Tibetan Plateau: Evidence from a lake model simulation of Nam Co, China, during 1979–2012. J. Geophys. Res. Atmos. 2017, 122, 13095–13107. [Google Scholar] [CrossRef]
- Donchyts, G.; Baart, F.; Winsemius, H.; Gerelick, N.; Kwadijk, J.; Giesen, N. Earth’s surface water change over the past 30 years. Nat. Clim. Chang. 2016, 6, 810–813. [Google Scholar] [CrossRef]
- Bai, J.; Chen, X.; Li, J.; Yang, L.; Fang, H. Changes in the area of inland lakes in arid regions of central Asia during the past 30 years. Environ. Monit. Assess. 2011, 178, 247–256. [Google Scholar] [CrossRef] [PubMed]
- Tao, S.; Fang, J.; Zhao, X.; Zhao, S.; Shen, H.; Hu, H.; Tang, Z.; Wang, Z.; Guo, Q. Rapid loss of lakes on the Mongolian Plateau. Proc. Natl. Acad. Sci. USA 2014, 112, 2281–2286. [Google Scholar] [CrossRef] [PubMed]
- Liu, H.; Yin, Y.; Piao, S.; Zhao, F.; Engels, M.; Ciais, P. Disappearing lakes in semiarid northern China: Drivers and environmental impact. Environ. Sci. Technol. 2013, 47, 12107–12114. [Google Scholar] [CrossRef] [PubMed]
- Li, H.; Li, J.; Yao, X.; Luo, J.; Huang, Y.; Feng, Y. Changes of the three holy lakes in recent years and quantitative analysis of the influencing factors. Quat. Int. 2014, 349, 339–345. [Google Scholar] [CrossRef]
- Li, X.; Ma, Y.; Xu, H.; Wang, J.; Zhang, D. Impact of land use and land cover change on environmental degradation in Lake Qinghai watershed, Northeast Qinghai-Tibet Plateau. Land Degrad. Dev. 2009, 20, 69–83. [Google Scholar] [CrossRef]
- Yang, H.; Flower, R.J.; Thompson, J.R. China’s new leaders offer green hope. Nature 2013, 493, 163. [Google Scholar] [CrossRef] [PubMed]
- Yang, H. China must continue the momentum of green law. Nature 2014, 509, 535. [Google Scholar] [CrossRef] [PubMed]
- Jin, H.; He, R.; Cheng, G.; Wu, Q.; Wang, S.; Lv, L.; Chang, X. Changes in frozen ground in the source area of the Yellow River on the Qinhai-Tibet Plateau, China, and their eco-environmental impacts. Environ. Res. Lett. 2009, 4, 045206. [Google Scholar] [CrossRef]
- Huang, L.; Liu, J.; Shao, Q.; Liu, R. Changing inland lakes responding to climate warming in Northeastern Tibetan Plateau. Clim. Chang. 2011, 109, 479–502. [Google Scholar] [CrossRef]
- Roach, J.K.; Griffith, B.; Verbyla, D. Landscape influences on climate-related lake shrinkage at high latitudes. Glob. Chang. Biol. 2013, 19, 2276–2284. [Google Scholar] [CrossRef] [PubMed]
- Yang, H.; Flower, R.J.; Thompson, J.R. Sustaining China’s water resources. Science 2013, 339, 141. [Google Scholar] [CrossRef] [PubMed]
Figure 1.
Geographical situation of the Tibetan Plateau.

Figure 2.
Spatial pattern of glacier cover and different permafrost categorizes on the Tibetan Plateau.
Figure 2.
Spatial pattern of glacier cover and different permafrost categorizes on the Tibetan Plateau.

Figure 3.
Spatial distribution and temporal changes of lakes. (a) Spatial pattern of Tibetan lake changes from 1977 to 2014; the numbers 1–15 denote specific lakes: 1, Nam Co; 2, Siling Co; 3, Gyaing Co; 4, Ngangze Co; 5, Tangra Yumco; 6, Zhari Namco; 7, Taro Co; 8, Ngangla Ringco; 9, Mapam Yumco; 10, La’nga Co; 11, Yamdrok Lake; 12, Dorsoidong Co; 13, Chibzhang Co; 14, Ulan UI Lake; 15, Qinghai Lake; (b) changes in total area of lakes (>1 km2); (c) changes in total number of lakes (>1 km2); and (d) changes in area of selected lakes (km2).

Figure 4.
Annual changes in PET, MAP, and MAAT on the Tibetan Plateau between 1977 and 2014.

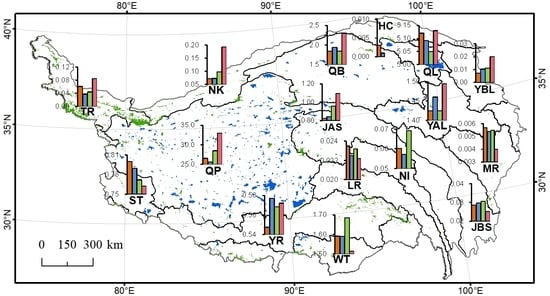
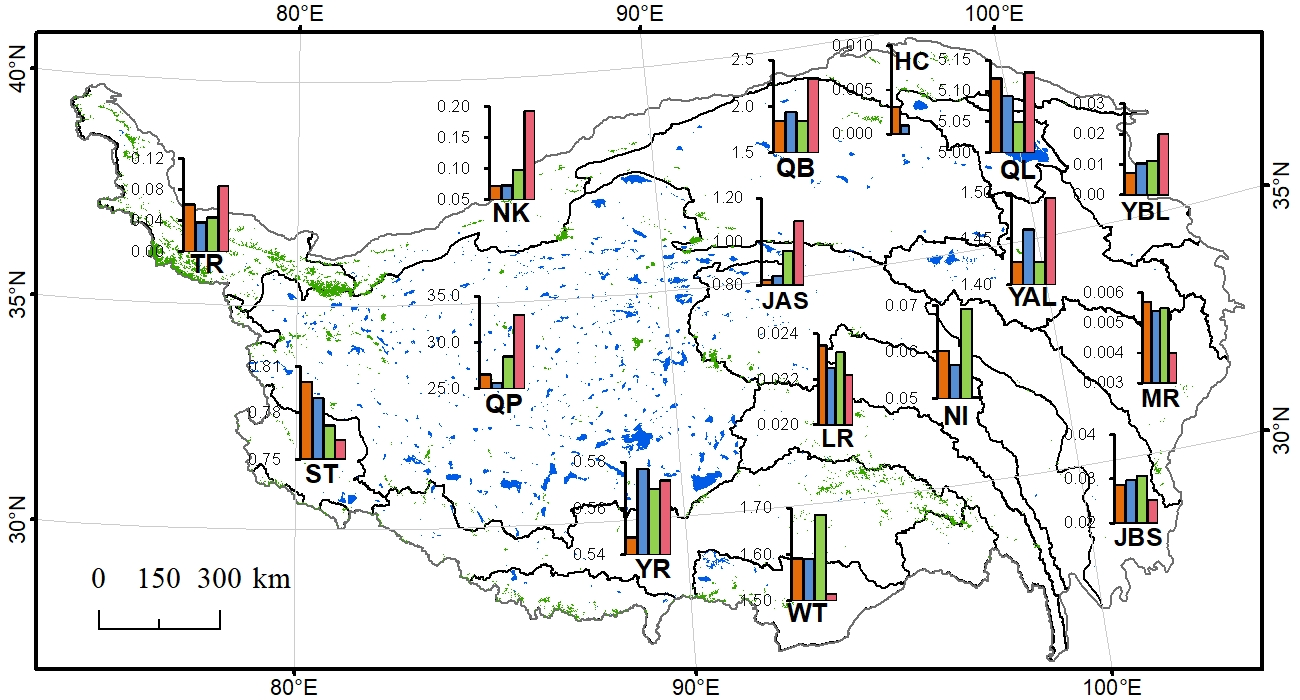
Figure 5.
Variable changes in climatic factors. (a,b) represent annual change in MAAT and spatial patterns of annual change rate in MAAT over the TP during the periods 1977–2000 and 2000–2014, respectively; (c,d) represent annual changes in MAP and PET and spatial patterns of annual change rate of AI over the TP during the periods 1977–2000 and 2000–2014, respectively.

Figure 6.
Spatial pattern of response modes of lakes during different periods. (a–d) represent the periods 1977–1990, 1990–2000, 2000–2014, and 1977–2014, respectively. “+” denotes increase and “−” denotes decline. These directions of change are provided for AI, glacier area, permafrost, and lake area. For example, Mode 1 is characterized by declines in both AI and glacier area, permafrost degradation, and an increase in lake area.


Table 1.
Lake number, area (km2), and their changes in different watersheds of the Tibetan Plateau between 1977 and 2014.
Table 1.
Lake number, area (km2), and their changes in different watersheds of the Tibetan Plateau between 1977 and 2014.
| Watersheds | Number | Change | Area (km2) | Change | ||||||
|---|---|---|---|---|---|---|---|---|---|---|
| 1977 | 1990 | 2000 | 2014 | 1977–2014 | 1977 | 1990 | 2000 | 2014 | 1977–2014 | |
| QP (Inland Rivers on Qiangtang Plateau) | 695 | 677 | 846 | 824 | 18.6% | 26,539.7 | 25,595.1 | 28,472.8 | 32,994.9 | 24.3% |
| QL (Qinghai Lake) | 12 | 13 | 17 | 13 | 8.3% | 5120.5 | 5091.4 | 5049.7 | 5129.6 | 0.2% |
| QB (Qaidam Basin) | 36 | 58 | 49 | 59 | 63.9% | 1842.0 | 1940.8 | 1841.0 | 2304.0 | 25.1% |
| ST (South Tibet Rivers) | 46 | 52 | 47 | 47 | 2.2% | 1591.6 | 1590.2 | 1685.4 | 1514.1 | −4.9% |
| YAL (Yellow River above Longyangxia) | 45 | 46 | 40 | 47 | 4.4% | 1425.2 | 1460.4 | 1425.1 | 1494.3 | 4.8% |
| JAS (Jinsha River above stone drum) | 75 | 100 | 100 | 120 | 60.0% | 824.5 | 844.4 | 959.4 | 1095.0 | 32.8% |
| WT (West Tibet Rivers) | 15 | 16 | 16 | 16 | 6.7% | 799.9 | 789.7 | 771.9 | 762.6 | −4.7% |
| YR (Yarlung Zangbo River) | 70 | 84 | 87 | 78 | 11.4% | 547.5 | 577.1 | 568.4 | 572.0 | 4.5% |
| NK (Rivers on the North Foot of Mt. Kunlun) | 16 | 16 | 21 | 42 | 162.5% | 71.6 | 72.7 | 97.5 | 192.1 | 168.3% |
| TR (Tarim River) | 10 | 9 | 10 | 8 | −20.0% | 60.8 | 37.7 | 44 | 84.1 | 38.3% |
| NI (Nu and Irrawaddy Rivers) | 15 | 15 | 17 | 16 | 6.7% | 60.2 | 57.2 | 69.2 | 50.3 | −16.4% |
| JBS (Jinsha River below stone drum) | 12 | 14 | 15 | 13 | 8.3% | 28.6 | 29.7 | 30.6 | 25.2 | −11.9% |
| LR (Lantsang River) | 2 | 2 | 3 | 2 | 0.0% | 23.5 | 22.5 | 23.2 | 22.2 | −5.5% |
| YBL (Yellow River from Longyangxia to Lanzhou) | 2 | 3 | 3 | 3 | 50% | 7.3 | 10.4 | 11.3 | 20.1 | 175.3% |
| MR (Mintuo River) | 4 | 3 | 4 | 3 | −25% | 5.7 | 5.4 | 5.5 | 4 | −29.8% |
| HC (Inland Rivers on Hexi Corridor) | 1 | 1 | 0 | 0 | −100% | 3.1 | 1 | 0 | 0 | −100.0% |
| JR (Jialing River) | 0 | 0 | 0 | 0 | 0.0% | 0 | 0 | 0 | 0 | 0.0 |
| Total | 1056 | 1109 | 1275 | 1291 | 22.3% | 38,951.7 | 38,125.7 | 41,055.0 | 46,264.5 | 18.8% |
Table 2.
Lake number, area, and its changes in different classes between 1977 and 2014.
| Year or Period | Area Category (km2) | Total | ||||||
|---|---|---|---|---|---|---|---|---|
| 1–10 | 10–50 | 50–100 | 100–500 | 500–1000 | >1000 | |||
| Number of lakes | 1977 | 700 | 219 | 64 | 61 | 9 | 3 | 1056 |
| 1990 | 766 | 205 | 66 | 61 | 8 | 3 | 1109 | |
| 2000 | 889 | 234 | 71 | 70 | 8 | 3 | 1275 | |
| 2014 | 884 | 241 | 74 | 78 | 9 | 5 | 1291 | |
| Change in number (%) | 1977–1990 | 9.4 | −6.4 | 3.1 | 0 | −11.1 | 0.0 | 5.0 |
| 1990–2000 | 16.1 | 14.1 | 7.6 | 14.8 | 0.0 | 0.0 | 15.0 | |
| 2000–2014 | −0.6 | 3.0 | 4.2 | 11.4 | 12.5 | 66.7 | 1.3 | |
| 1977–2014 | 26.3 | 10.0 | 15.6 | 27.9 | 0 | 66.7 | 22.3 | |
| Lake area (km2) | 1977 | 2136.7 | 5292.9 | 4572.3 | 13,118.3 | 5822.6 | 8008.6 | 38,951.7 |
| 1990 | 2305.0 | 4818.6 | 4543.7 | 13,313.0 | 5200.6 | 7944.7 | 38,125.7 | |
| 2000 | 2617.6 | 5440.8 | 4877.8 | 14,342.4 | 5664.8 | 8111.6 | 41,055.0 | |
| 2014 | 2648.7 | 5459.6 | 5159.3 | 16,365.3 | 5877.9 | 10,753.8 | 46,264.5 | |
| Change in area (%) | 1977–1990 | 7.9 | −9.0 | −0.6 | 1.5 | −10.7 | −0.8 | −2.1 |
| 1990–2000 | 13.6 | 12.9 | 7.4 | 7.7 | 8.9 | 2.1 | 7.7 | |
| 2000–2014 | 1.2 | 0.3 | 5.8 | 14.1 | 3.8 | 32.6 | 12.7 | |
| 1977–2014 | 24.0 | 3.1 | 12.8 | 24.8 | 0.9 | 34.3 | 18.8 | |
Table 3.
Area changes of selected lakes along an east-west transect across the Gangdise Mountains.
| Lake Name from East to West | Area (km2) | Area Changes (km2) | ||||||
|---|---|---|---|---|---|---|---|---|
| 1977 | 1990 | 2000 | 2014 | 1977–1990 | 1990–2000 | 2000–2014 | 1977–2014 | |
| Nam Co | 1932 | 1947 | 1988 | 2024 | 15 | 41 | 36 | 92 |
| Siling Co | 1665 | 1681 | 1883 | 2369 | 16 | 202 | 486 | 704 |
| Gyaring Co | 475 | 468 | 480 | 478 | −7 | 12 | −2 | 3 |
| Ngangze Co | 421 | 393 | 421 | 462 | −28 | 28 | 41 | 41 |
| Tangra Yumco | 833 | 829 | 833 | 845 | −4 | 4 | 12 | 12 |
| Zhari Namco | 994 | 980 | 967 | 1003 | −14 | −13 | 36 | 9 |
| Taro Co | 483 | 486 | 481 | 486 | 3 | −5 | 5 | 3 |
| Ngangla Ringco | 511 | 520 | 495 | 496 | 9 | −25 | 1 | −15 |
| Mapam Yumco | 417 | 415 | 411 | 410 | −2 | −4 | −1 | −7 |
| La’nga Co | 272 | 270 | 260 | 255 | −2 | −10 | −5 | −17 |
Table 4.
Summary of watersheds exhibiting different response modes for different periods.
| Modes | Definition | Number of Watershed Exhibiting Each Mode | |||
|---|---|---|---|---|---|
| 1977–1990 | 1990–2000 | 2000–2014 | 1977–2014 | ||
| 1 | −−−+ | 5 | 9 | 7 | 9 |
| 2 | +−−+ | 2 | 1 | 2 | 0 |
| 3 | +−−− | 4 | 1 | 4 | 2 |
| 4 | −−−− | 5 | 5 | 3 | 5 |
Note: + denotes increase and − denotes decline. These directions of change are provided for AI, glacier area, permafrost, and lake area. For example, Mode 1 is characterized by declines in both AI and glacier area, permafrost degradation, and an increase in lake area.
© 2018 by the authors. Licensee MDPI, Basel, Switzerland. This article is an open access article distributed under the terms and conditions of the Creative Commons Attribution (CC BY) license (http://creativecommons.org/licenses/by/4.0/).
Share and Cite
MDPI and ACS Style
Mao, D.; Wang, Z.; Yang, H.; Li, H.; Thompson, J.R.; Li, L.; Song, K.; Chen, B.; Gao, H.; Wu, J. Impacts of Climate Change on Tibetan Lakes: Patterns and Processes. Remote Sens. 2018, 10, 358. https://doi.org/10.3390/rs10030358
AMA Style
Mao D, Wang Z, Yang H, Li H, Thompson JR, Li L, Song K, Chen B, Gao H, Wu J. Impacts of Climate Change on Tibetan Lakes: Patterns and Processes. Remote Sensing. 2018; 10(3):358. https://doi.org/10.3390/rs10030358
Chicago/Turabian StyleMao, Dehua, Zongming Wang, Hong Yang, Huiying Li, Julian R. Thompson, Lin Li, Kaishan Song, Bin Chen, Hongkai Gao, and Jianguo Wu. 2018. "Impacts of Climate Change on Tibetan Lakes: Patterns and Processes" Remote Sensing 10, no. 3: 358. https://doi.org/10.3390/rs10030358
Note that from the first issue of 2016, this journal uses article numbers instead of page numbers. See further details here.