Article

Understanding Temporal and Spatial Distribution of Crop Residue Burning in China from 2003 to 2017 Using MODIS Data

1
State Key Laboratory of Earth Surface Processes and Resource Ecology, College of Global Change and Earth System Science, Beijing Normal University, 19 Xinjiekouwai Street, Haidian, Beijing 100875, China
2
Joint Center for Global Change Studies, Beijing 100875, China
3
National Engineering Research Center for Information Technology in Agriculture, 11 Shuguang Huayuan Middle Road, Beijing 100097, China
*
Author to whom correspondence should be addressed.
There authors contributed equally to this work.
Remote Sens. 2018, 10(3), 390; https://doi.org/10.3390/rs10030390
Submission received: 31 December 2017 / Revised: 15 February 2018 / Accepted: 2 March 2018 / Published: 2 March 2018
(This article belongs to the Special Issue Earth Observations for Precision Farming in China (EO4PFiC))

Abstract

:
Crop residue burning, which is a convenient approach to process excessive crop straws, has a negative impact on local and regional air quality and soil structures. China, as a major agricultural country with a large population, should take more effective measures to control crop residue burning. In this case, a better understanding of long-term spatio-temporal variations of crop residue burning in China is required. The MODIS products MOD14A1/MYD14A1 were employed in this research. Meanwhile, due to the vast territory of China, we divided the study area into seven regions based on the national administrative divisions to examine crop residue burning in each region, respectively. The temporal analysis of crop residue burning in different regions demonstrates a fluctuated, but generally upward, trend from 2003 to 2017. For monthly variations of crop residue burning in different regions, detected fire spots in June mainly concentrated in Central China (CC), East China (EC), and North China (NC). A majority of detected fire spots in Northeast China (NEC) and Northwest China (NWC) appeared in April and October. For other months, a small number of fire spots were distributed in all regions in a scattered manner. Furthermore, from a spatio-temporal perspective, this research revealed that crop residue burning in NEC was the most active among all regions both in spring and autumn. For summer, EC holds a larger proportion of burning spots than other regions. For winter, the number of burning spots in most regions was close. This research conducts a comprehensive analysis of crop residue burning in China at both a national and regional scale. The methodology and results from this research provide useful reference for better monitoring and controlling crop residue burning in China.

Graphical Abstract

1. Introduction

Crop residue, also known as crop straw, is defined as stems of such crops as wheat, rice, maize, etc., which have been reaped and dried after maturing [1,2]. Before the prevalence of industrialization, there was a diversity of utilization approaches toward crop residue in rural areas within China. For example, in Southern China, the straws of rice were usually used to make hats, mats, or building roofs. Meanwhile, it could also be used as a type of forage to feed livestock. With the rapid development of industrialization and modernization in China, the demand for crop residues in rural areas has decreased. Hence, the treatment of large amounts of crop residues has become a major social and ecological issue [3].
Crop residue burning, as a direct and convenient way to process the residues of dried crops in arable lands, will induce serious air pollution or conflagration [2,4,5,6]. Furthermore, the social and economic damage caused by the incineration of crop residues is immeasurable. For instance, in 2016, the Ministry of Environmental Protection (MEP) reported that the massive burning of crop straw in Heilongjiang Province led to a large-scale haze episode [7]. Previous studies pointed out that strong correlations existed between crop residue burning and the formation and concentrations of major airborne pollutants, such as fine particles (PM2.5), NOX, CO, black carbon, and so forth [8,9,10]. In addition, in-depth studies have confirmed the negative impacts of airborne pollutants, especially particulate matter, on human cardiovascular and respiratory diseases [11,12]. China, as a major agricultural country with a large population, should take more effective measures to control the burning of crop residues. Therefore, there is a growing emphasis on methods of monitoring and controlling the burning of crop residues.
Generally, it is difficult to monitor crop residue burning using traditional measures. Remote sensing, as a technique capable of long-term and large-scale observations, has been extensively applied in numerous fields, such as geology remote sensing, hydrology remote sensing, vegetation remote sensing, and agricultural remote sensing. Meanwhile, remote sensing is a key technology for field-information acquisition in precision agriculture, including crop growth environment, growth status, and spatial variability information. Nowadays, the use of satellite remote sensing to monitor wildfires has become an emerging hotspot. This is because remote sensing technology can be applied to near real-time observation of surface features at a large scale. In addition, the brightness temperature of the thermal infrared band obtained from remote sensing satellites can be used to monitor regional thermal anomalies. Therefore, remote sensing is an effective way to monitor wildfires [13,14]. Furthermore, it is a valid approach to assess fire regimes, especially agricultural residue burning, using satellite sensor data and products [15,16]. For policy-makers, remote sensing is also a promising tool to understand real-time fire events and predict the movement of fire lines [17,18]. Chen et al. [15] employed MODIS burned area product, as well as the MODIS active fire data, to identify different fire regime variables, and their inter-annual variability, seasonality, and fire intensity in China through long-term analysis [15]. This research suggested that inter-annual variations and fire intensity of cropland burning were both lower than the other fire regime variables. However, it is becoming imperative to monitor crop residue burning, a type of wildfire occurring in cultivated lands, through remote sensing, given its strong negative impacts on air quality, agricultural production, and economic development. If not controlled properly, harmful pollutants emitted from crop residue burning will further aggravate the current situation of air pollution, and induce large-scale haze episodes in China. Therefore, it is necessary to take more reasonable measures to control the burning of crop residue. Targeting this aim, temporal and spatial distributions of crop residue burning in China should be examined in-depth.
Due to the vast territory of China, crops planted in different regions varied significantly, which means the harvesting time, as well as the burning time of crop residue, may be notably different. However, few studies have been conducted to analyze long-term variations of crop residue burning at multiple spatial and temporal scales. To fill this gap, this research took the following steps: firstly, the overall trend of crop residue burning in China during 2003 to 2017 was discussed at both national and regional scales. Secondly, from the perspective of monthly and seasonal variations, we analyzed the temporal distribution of crop residue burning in China. Finally, to compare burning patterns among different regions in China, the spatial distribution of crop residue burning was analyzed for each region respectively.

2. Materials and Methods
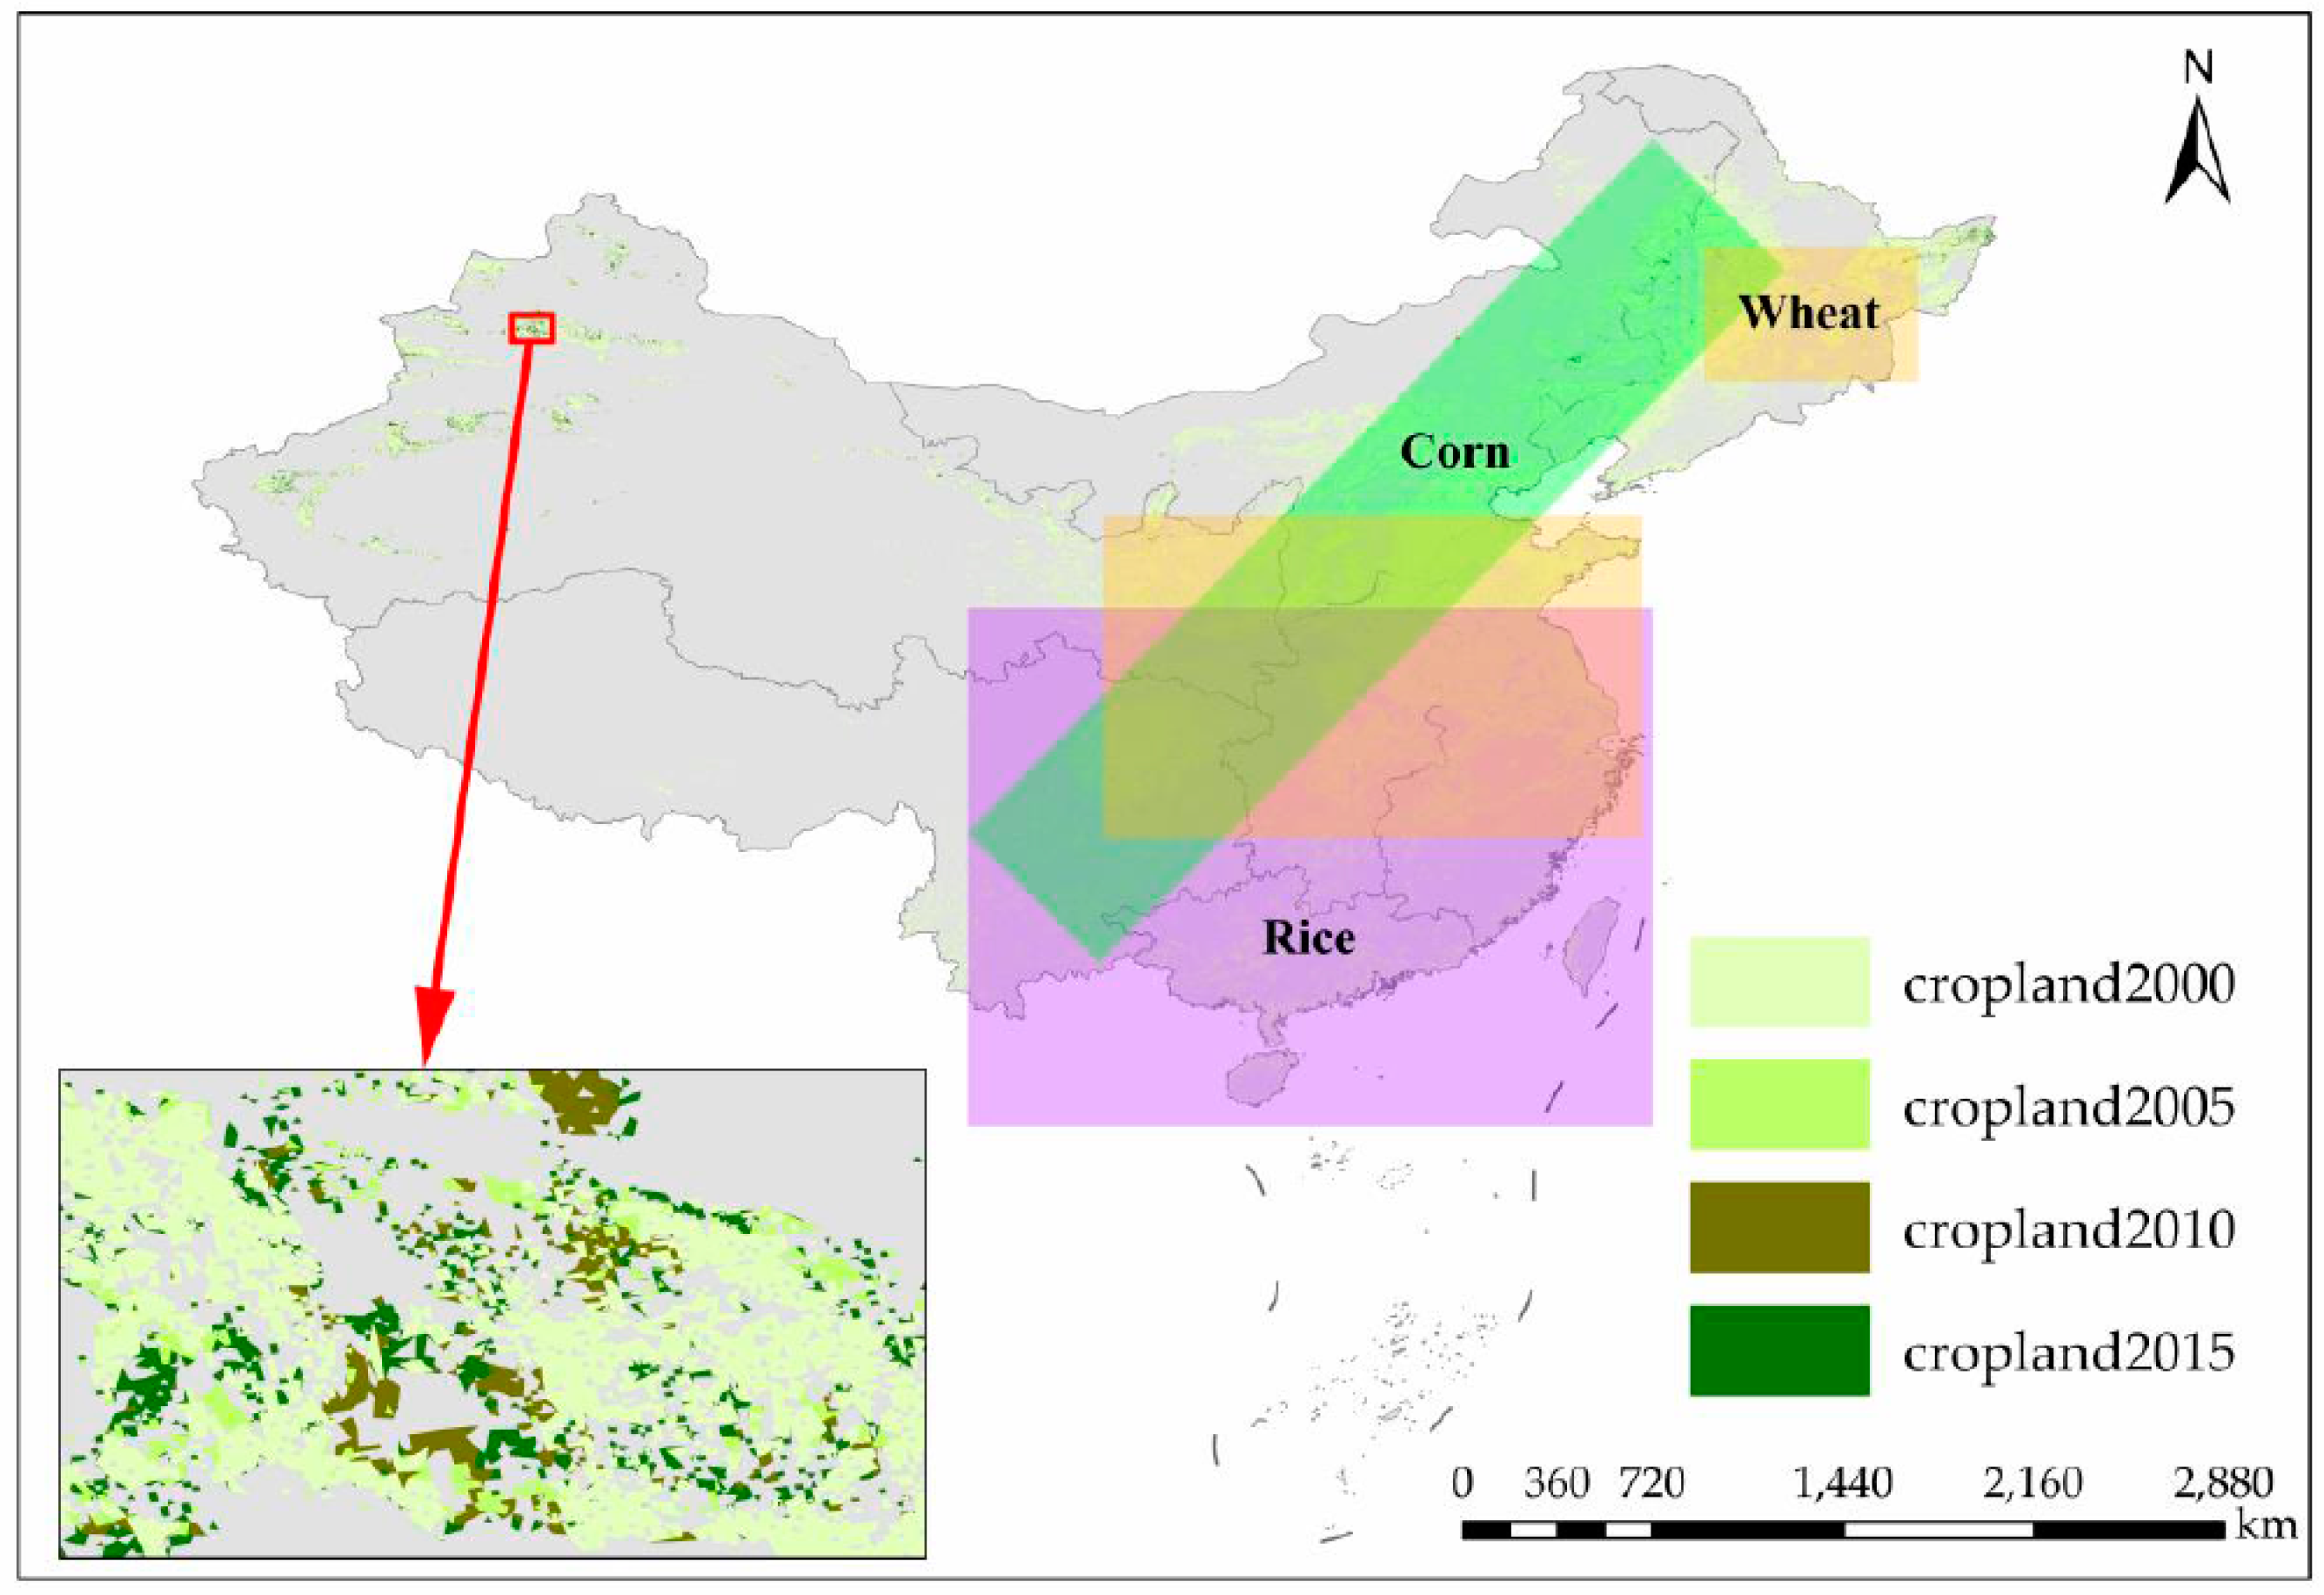
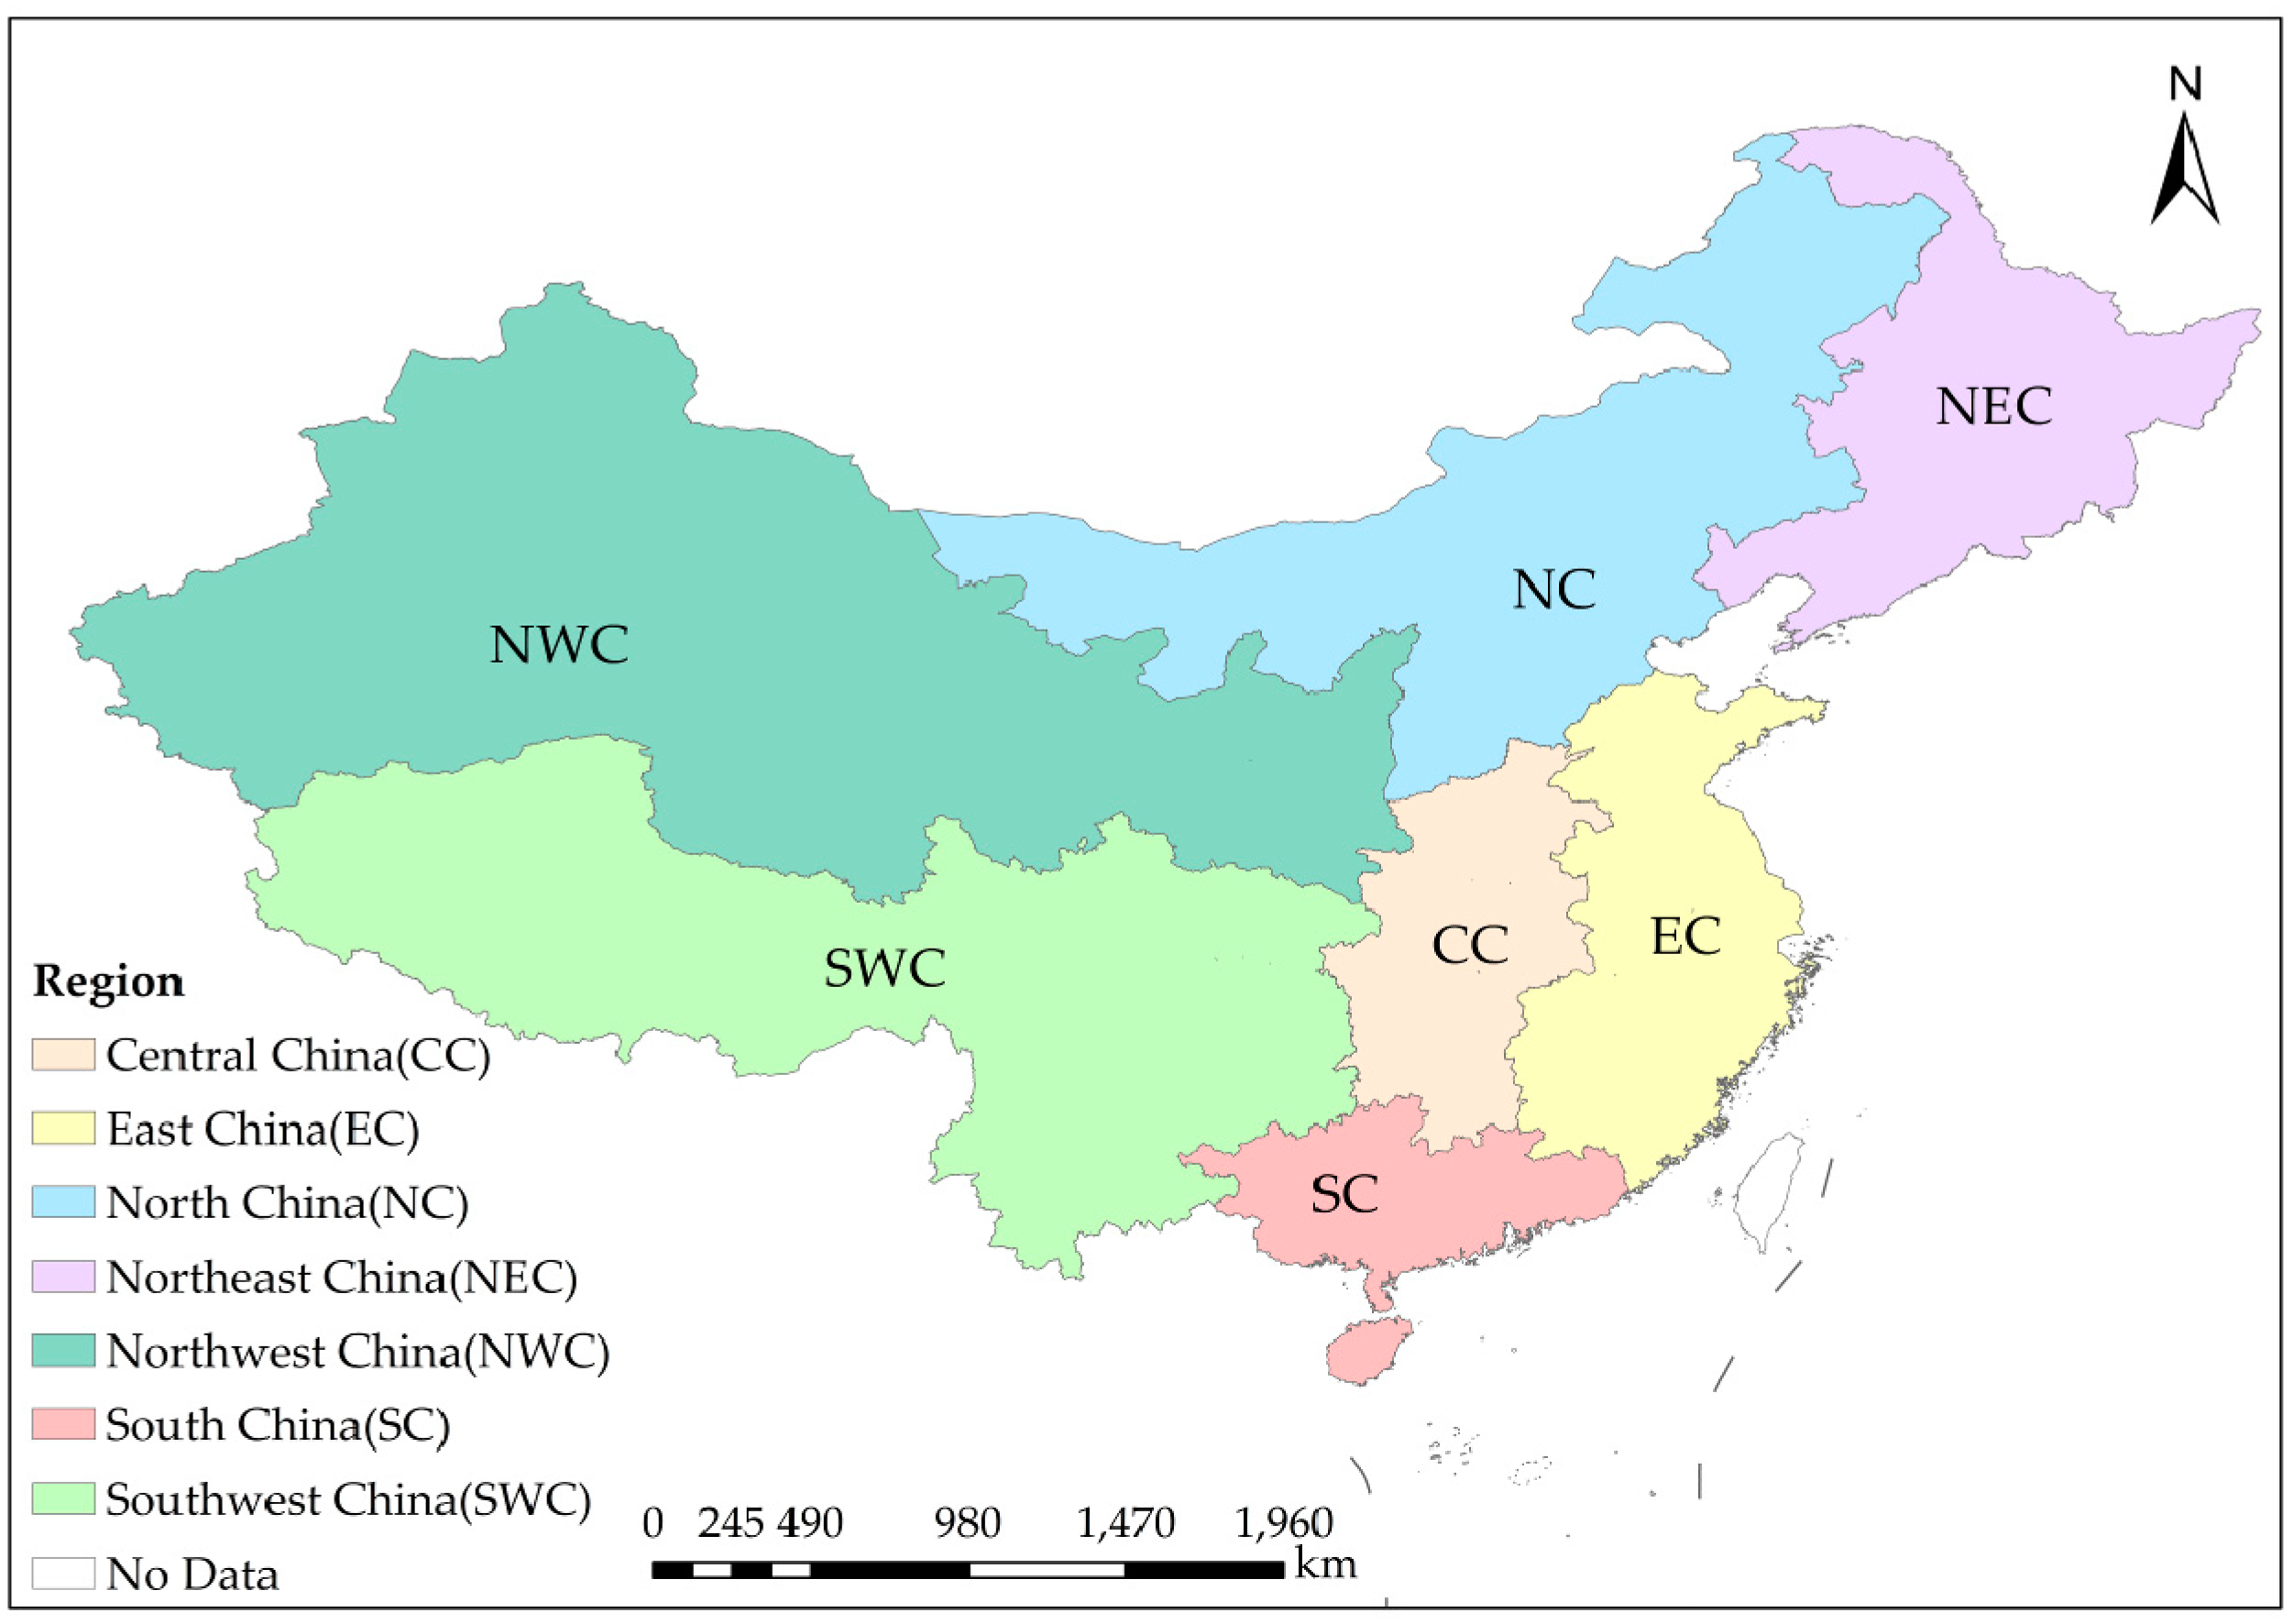
2.1. Study Area

This study aims to analyze crop residue burning from a regional perspective and, thus, the entire country is divided into seven regions (Figure 1) according to the national administrative divisions of China [19], including Central China (Hubei Province, Hunan Province, Henan Province), Eastern China (Jiangsu Province, Zhejiang Province, Anhui Province, Fujian Province, Jiangxi Province, Shandong Province, Shanghai), Northern China (Hebei Province, Shanxi Province, Beijing, Tianjin, The Inner Mongolia Autonomous Region), Northeast China (Jilin Province, Liaoning Province, Heilongjiang Province), Northwest China (The Ningxia Hui Autonomous Region, The Xinjiang Uygur Autonomous Region, Qinghai Province, Gansu Province, Shaanxi Province), Southern China (Guangdong Province, The Guangxi Zhuang Autonomous Region, Hainan Province), and Southwest China (Sichuan Province, Yunnan Province, Guizhou Province, Chongqing, Tibet Autonomous Region).

2.2. Data

2.2.1. MODIS Active Fire

In this study, we employed MODIS fire products, available at LAADS DACC ftp server [20], to acquire the information of burning spots in China from 2003 to 2017. In terms of the detected precision, MODIS is able to detect both smoldering and flaming fires over 1000 m2 in size. With favorable observing conditions (near nadir, little or no smoke, relatively homogeneous land surface, etc.), one tenth of flaming fires could be detected. In addition, small fires, covering 50 m2 can also be detected under extremely ideal observing conditions [21]. Active fires are monitored four times per day, including day-time and night-time observations. Specifically, the transit time of MODIS over China is 01:30, 13:30, 10:30, 22:30, respectively [22]. The 3.9 μm and 11 μm channels are used for MODIS fire products. A contextual algorithm is used for MODIS fire detection [23], the key point of which is to exploit the strong emission of mid-infrared radiation from fires [24,25]. This study employed MOD14A1/MYD14A1 daily level 3 fire products, with a spatial resolution of 1 km [21]. “MOD14/MYD14” refers to the MODIS active fire products. “MOD” stands for Terra/MODIS, and “MYD” stands for Aqua/MODIS; “14” indicates that the product is a type of thermal anomaly or fires. “A” represents a level 3 product and “1” represents a daily product. A Science Dataset (SDS), named “fire mask”, from this product is employed for data processing, and three fire classes (low-confidence fire, nominal-confidence fire, high-confidence fire) are extracted for a better understanding of the daily situation of crop residue burning. Meanwhile, the study implemented a maximum value composite strategy for processing the MOD/MYD product. There were approximately 21,900 images (generally four images per day, whilst usable images were fewer for some days due to missing data) for this research, and the total size of the dataset was about 393.8 GB. It took us more than one month for data processing (including algorithm designing, data downloading, coding, and statistics).

2.2.2. The Dataset of Land-Use and Land-Cover Change

The dataset of land-use and land-cover change (LUCC) is provided by the Data Center for Resources and Environmental Sciences, Chinese Academy of Sciences (RESDC) [26]. This dataset was produced based on Landsat images using a man-machine interactive method for better classification accuracy. The data provider employed an approach integrated remote sensing images with geo-physical datasets (temperature, precipitation, and elevation) to enhance the accuracy of land-cover classification. Based on this LUCC dataset, the classification accuracy for individual regions varied from 73% to 89%, and the overall classification accuracy for the entire country was 81% [27]. The spatial resolution of the dataset is similar to that of MODIS fire products (1 km). During 2000 to 2017, this dataset only has four images, which were produced in 2000, 2005, 2010, and 2015. Each image has six classes (cropland, woodland, grassland, waters, etc.), and 25 sub-classes (paddy field, dry land, forest land, etc.). In this study, we only used the type of cropland shown in Figure 2, including dry land and paddy field, for extracting crop residue burning spots. Therefore, other land cover types irrelevant to this research are not explained in detail here.

2.3. Methods

2.3.1. Extraction and Mosaic of Fire Pixels from MODIS Fire Products

The original MODIS fire products contain more than one SDS, and we simply employed one SDS named “fire mask”. For the following statistical analysis, it is necessary to extract the SDS (fire mask). In addition, due to the large number of pixels contained in the entirety of the MODIS grids, it is important to divide those grids into fixed tiles [21]. Since the study area in this research (seven regions within China) is covered by 22 tiles, we performed a mosaic processing using those tiles to obtain a complete image of China. The MODIS Reprojection Tool (MRT) provided by the Land Processes Distributed Active Archive Center (Land Processes DACC) was employed to finish the batch process of extraction and mosaicking. Meanwhile, parameter files were required for running the tool. The Interactive Data Language (IDL) (Department of Astronomy, University of Maryland, College Park, MD, USA) product is suitable for generating parameter files, as it is capable of reading metadata and the dimensions of the original dataset, which is necessary for producing parameter files. However, some MODIS products contain the information of less than eight standard daily-data layers [21]. Therefore, to avoid potential errors during the batch process, it is necessary to write parameter files for each MODIS product.

2.3.2. Maximum Value Composite of Fire Pixels

To have a comprehensive daily statistics of crop residue burning, this research employed a maximum value composite strategy for fire pixels extracted from MOD14A1/MYD14A1 fire products (an example of Heilongjiang Province has been showed in Figure 3). The major aim of the maximum value composite strategy is to extract the daily active fire product that could fully reflect the situation of crop residue burning for each day. It is possible that fire spots were detected in the same pixel several times. To avoid repeat counting, if fire spots at the same pixel were detected in multiple images for the same day, only one spot was counted. Meanwhile, the extraction of fire spots could be affected significantly by the existence of thick clouds and hazes. Since it is a rare situation that the same location is covered by clouds at four observation times in a day, the maximum value composite strategy effectively reduced the occlusion influences and improved the efficiency of fire spots extraction.
The key point of this processing is to set a certain pixel’s attribute value (7 means low-confidence fire, 8 means nominal-confidence fire, and 9 means high confidence fire) based on the maximum value composite of fire pixels in four observation times during one day. By conducting composite analysis, the statistics of crop residue burning in China is more likely to reflect actual values. Furthermore, during the composite process, water pixels were extracted as well, which had a limited influence on the composite of fire pixels. However, it is worth mentioning that if the attribute value of a certain pixel is classified as 3 (water), then we directly set this pixel as water. This is because the detection of water is more reliable than the detection of fire spots, and the pre-elimination of non-fire pixels can effectively improve the fire extraction accuracy [22,28].

2.3.3. Extraction of Fire Spots from Crop Residue Burning

The dataset of land-use and land-cover change (LUCC) was used for extracting burning spots from croplands. Firstly, we extracted shapes of cropland based on the LUCC dataset to serve as masks for the following extraction. Then these masks were applied to the preprocessed (maximum value composite) fire products for obtaining fire pixels of crop residue burning. In addition, the cropland-masks extracted from LUCC dataset of 2000, 2005, 2010, and 2015 corresponded to the extracted fire pixels of the 2003–2004 period, the 2005–2009 period, the 2010–2014 period, and the 2015–2017 period, respectively. An example of burning spots extraction from cropland is shown in Figure 3d. It is noted that crop residue burning spots appeared in the cropland of this area have been extracted from the maximum-value-composited fire product in Figure 3c.

3. Results

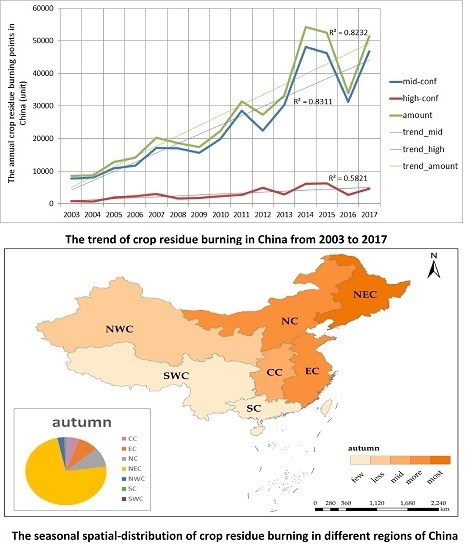
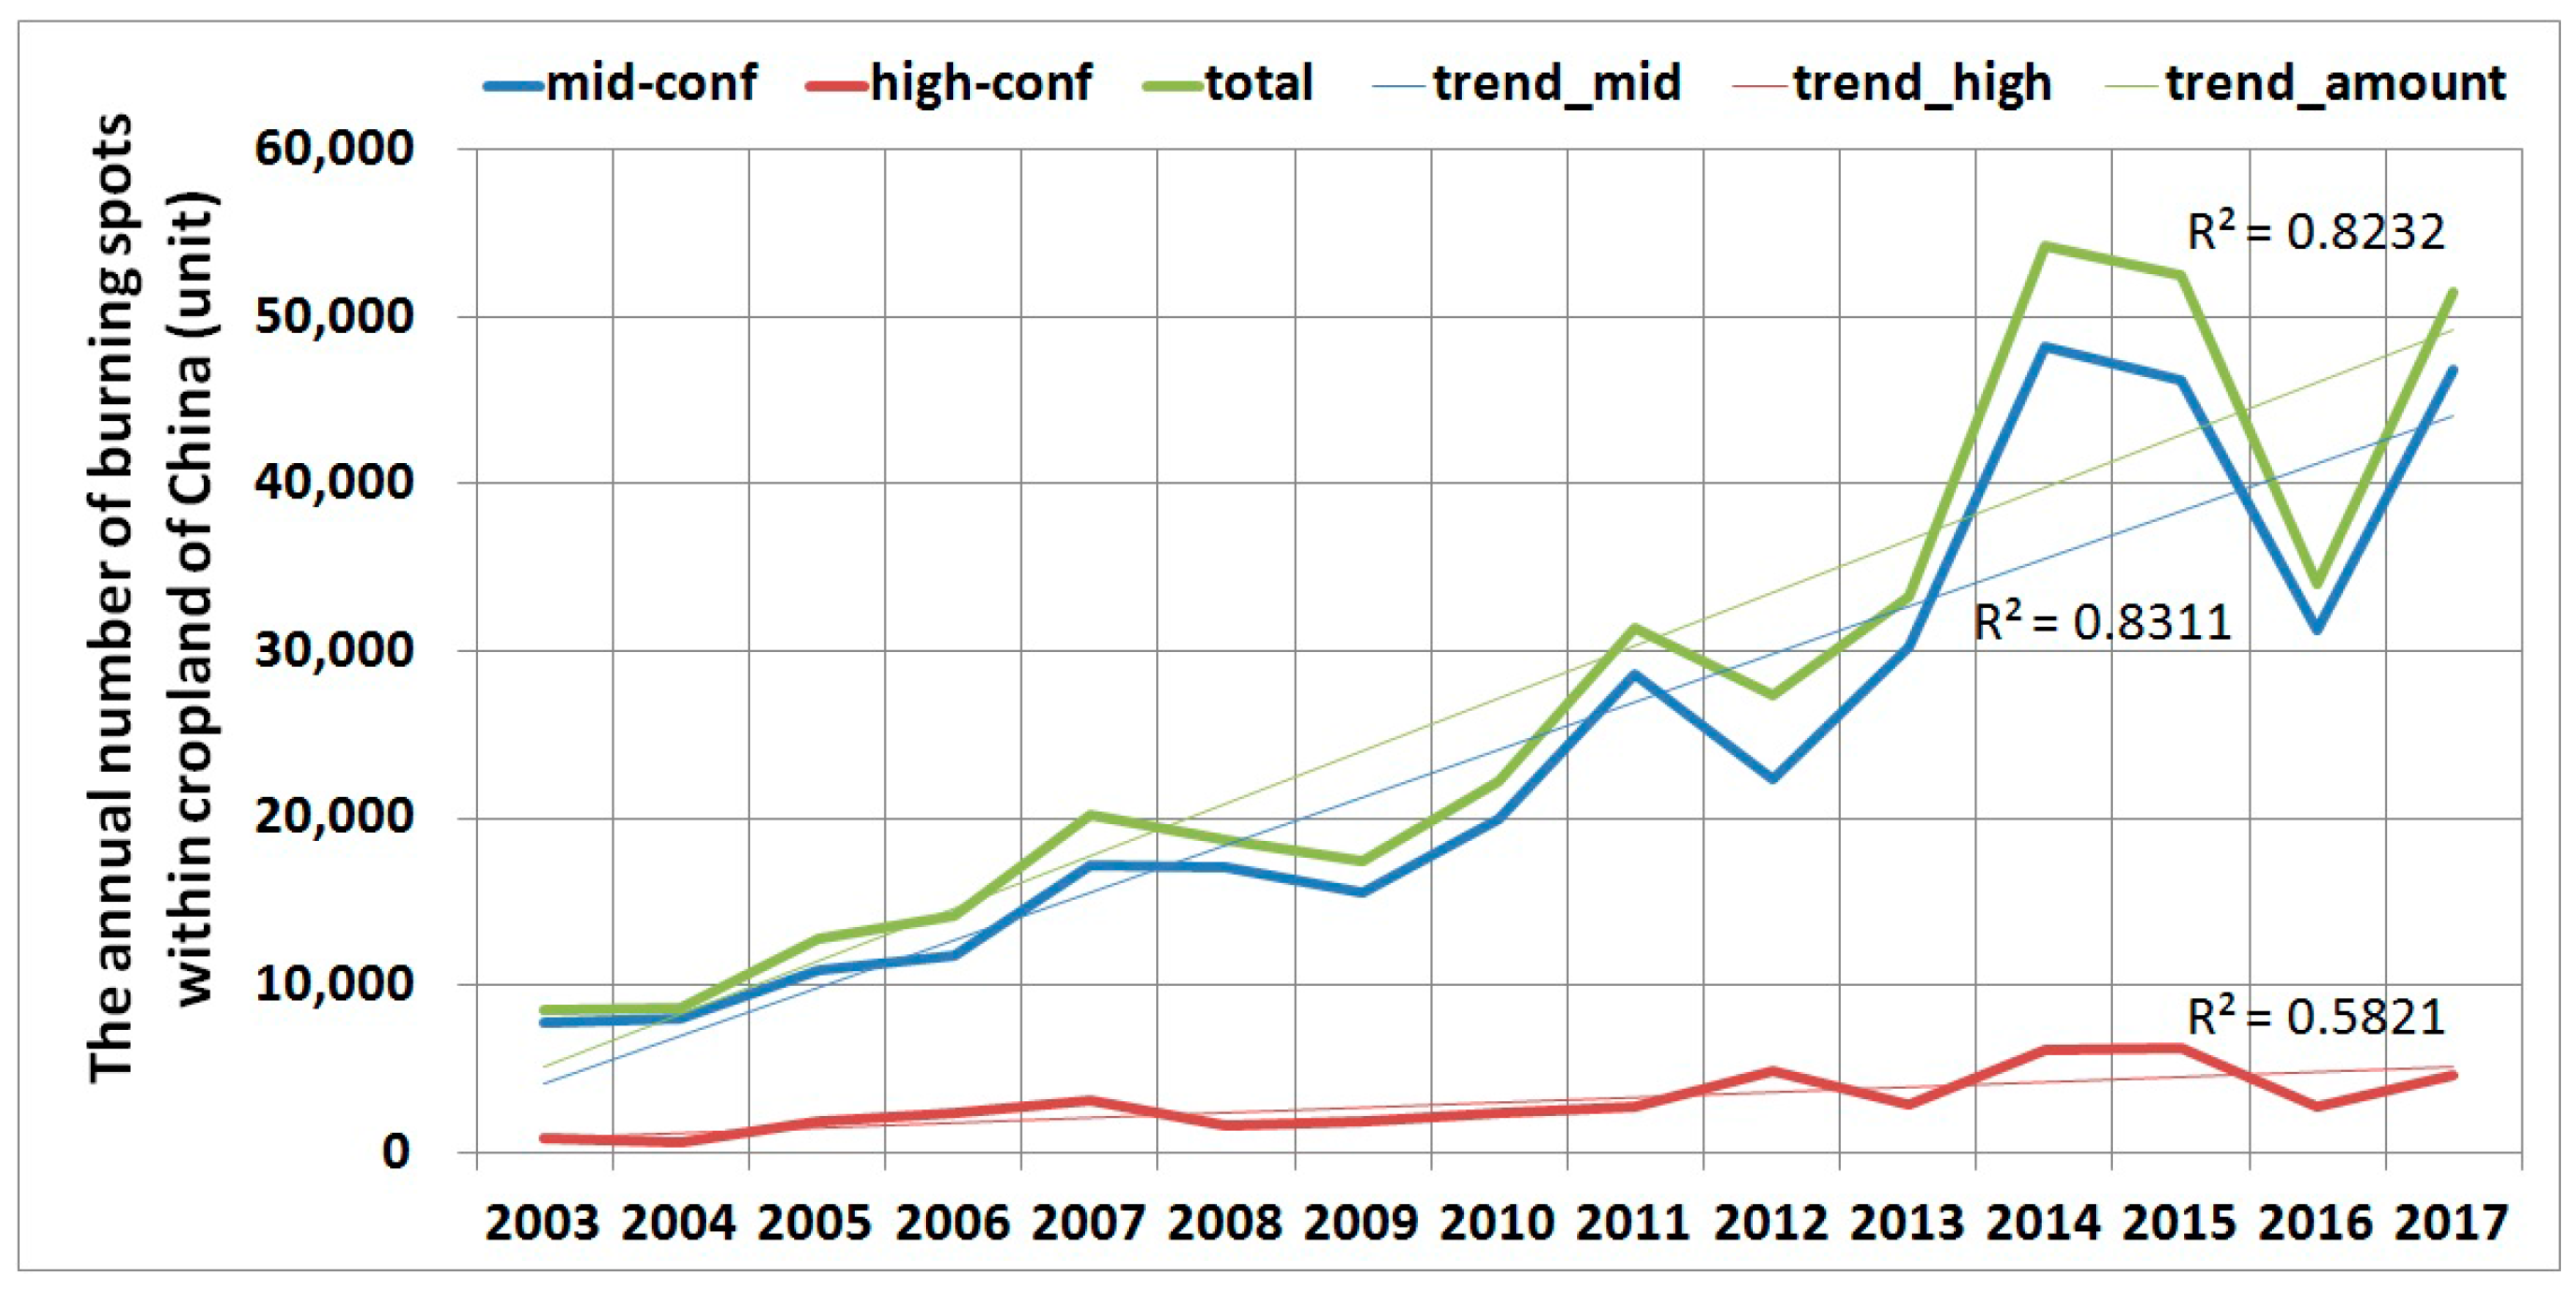
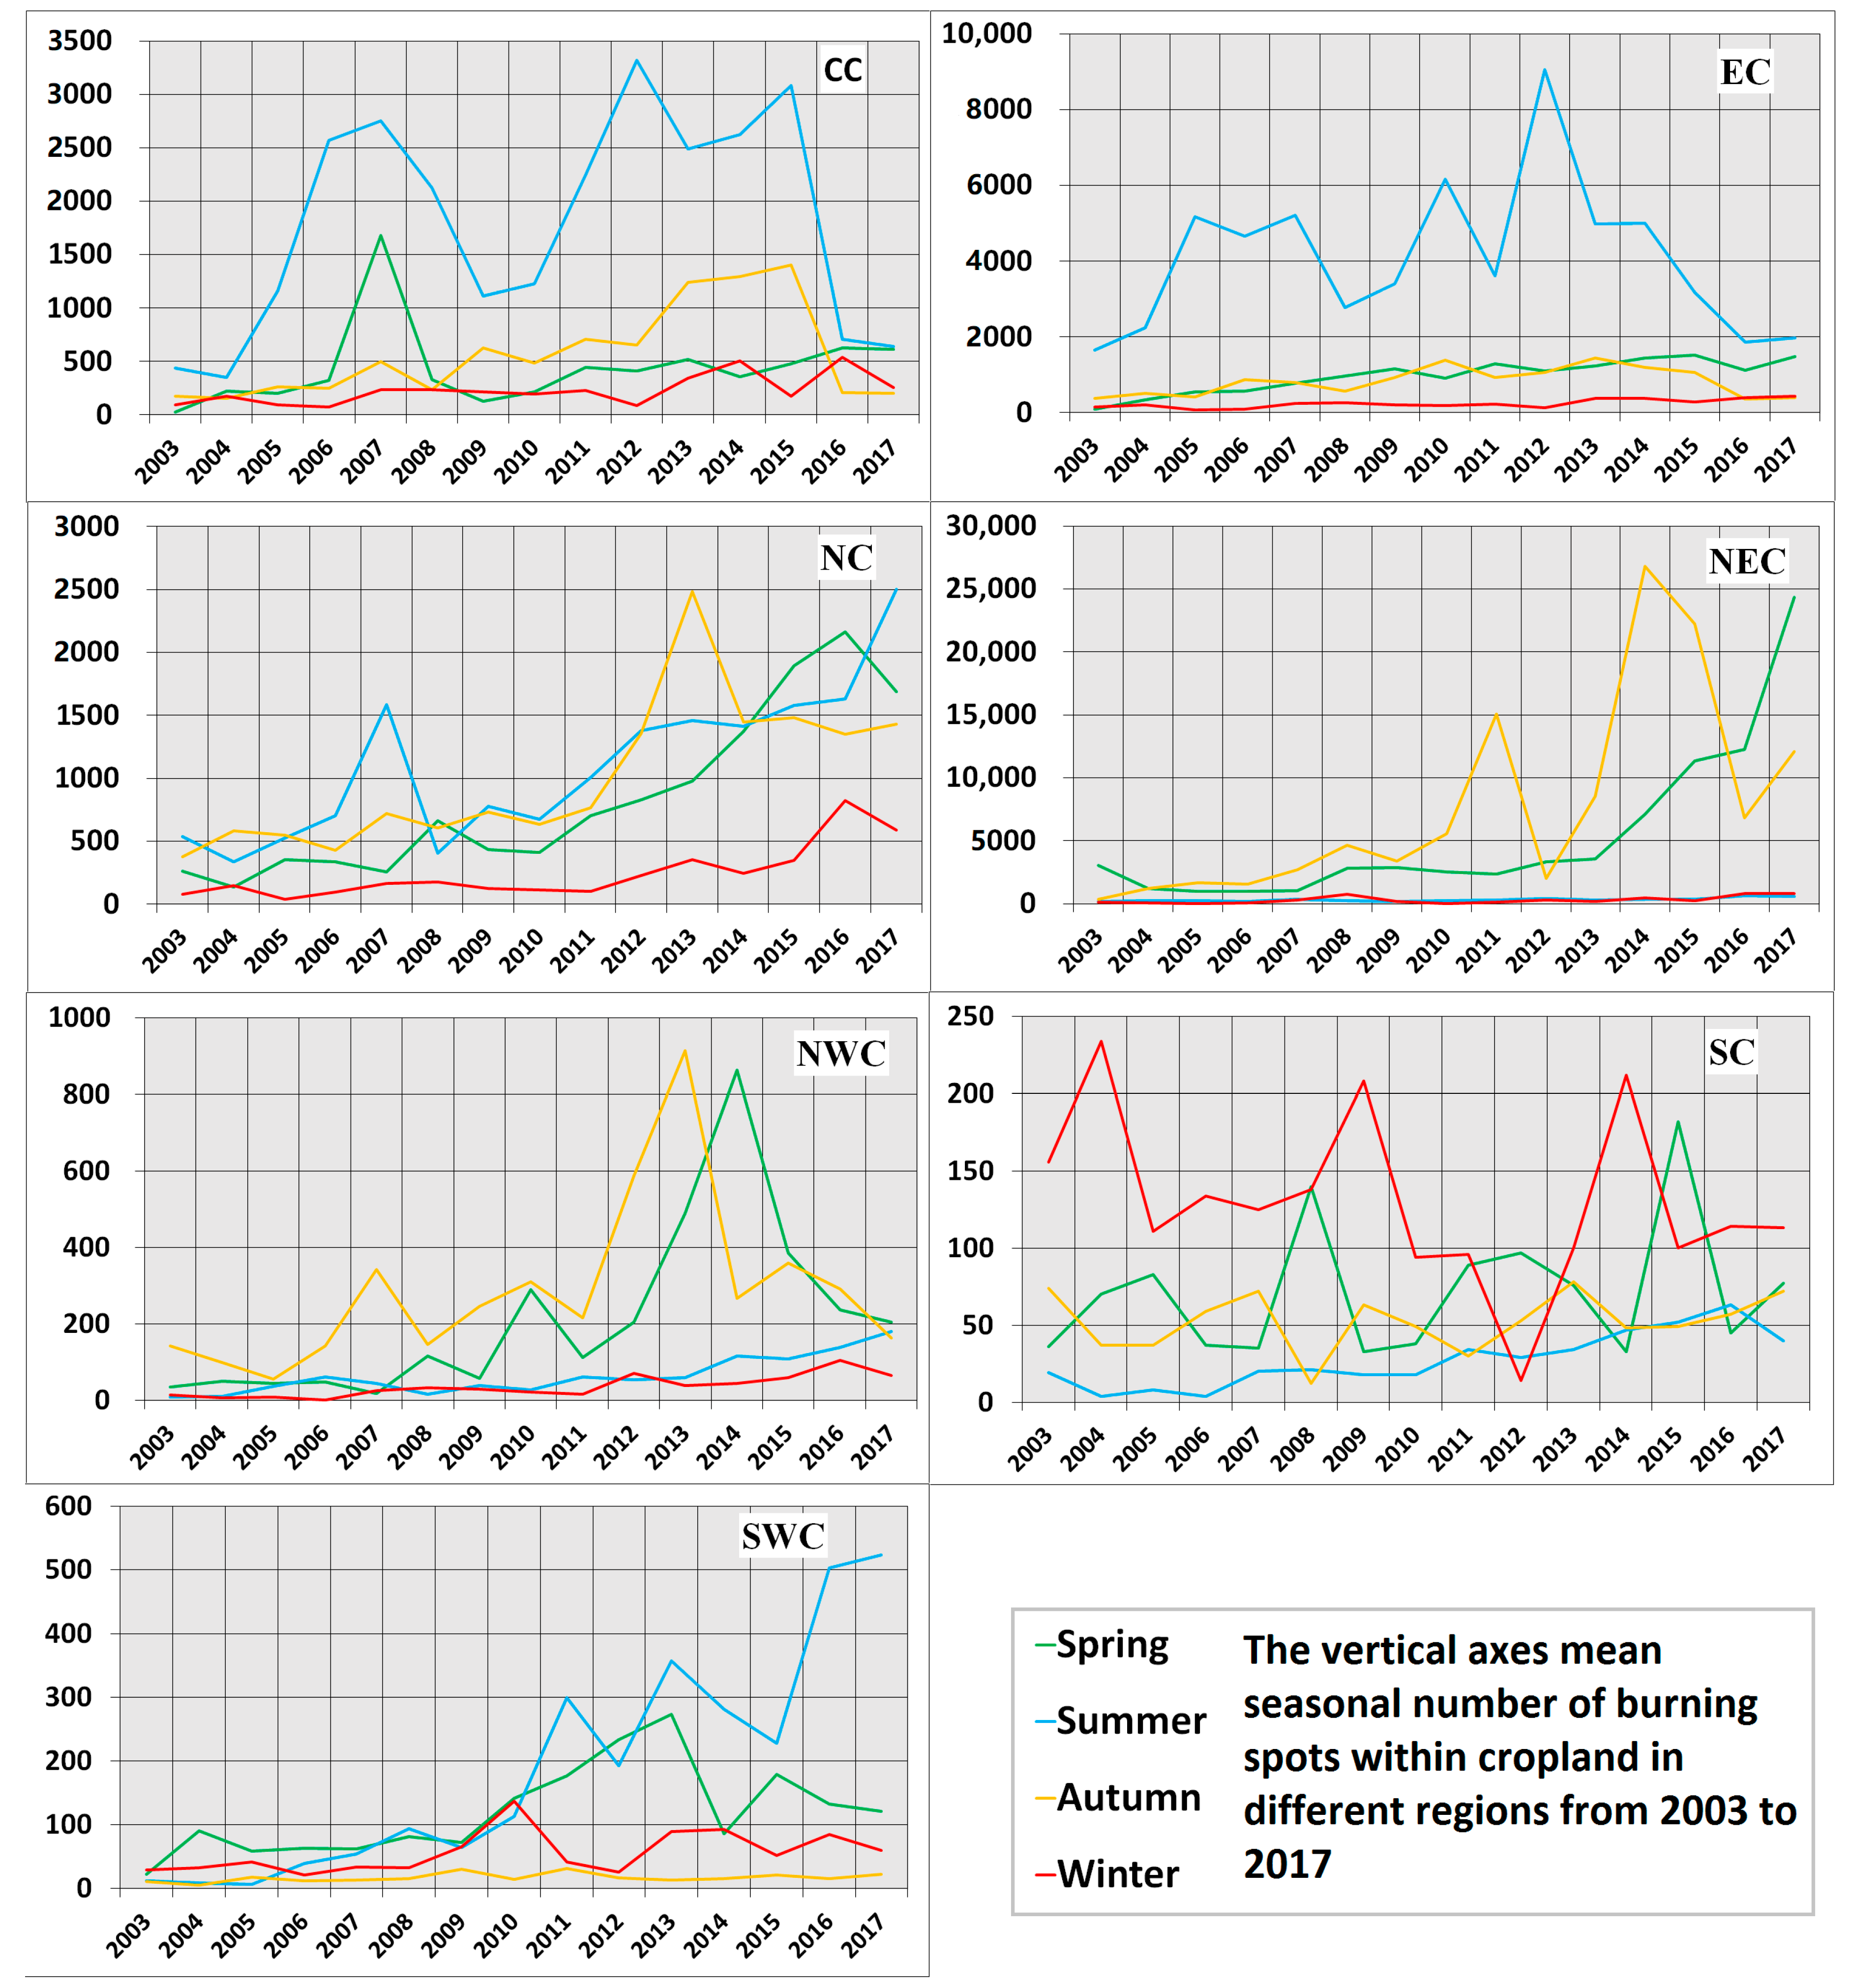
3.1. The Trend of Crop Residue Burning in China

According to Figure 4, crop residue burning in China has remained at a generally rising trend since 2003. For a more reliable analysis result, we discarded the low-confidence burning spots and simply counted the total number of nominal-confidence and high-confidence burning spots in the past 15 years. In addition, we also calculated the sum of each type of confidence burning spots, respectively. The result shows that the dominant proportion of burning spots is burning spots with nominal-confidence, whilst the proportion of high-confidence burning spots is relatively low. However, the trend of nominal-confidence burning spots is generally consistent with that of high-confidence burning spots. In general, there are three waves during the study period. The small peak firstly appeared in 2007 with a following decline in 2008. Then, during 2011 to 2012, there was a second peak that also experienced a sharp decline afterward. Compared with the first small peak, the value of the second peak was much higher. In the following three years, crop residue burning spots remained in a straight upward trend until 2015, when a slight decline appeared. Following the slight decline in 2015, the amount of burning spots has bounced back to a higher level in 2017.
From a regional perspective, the trend of crop residue burning varied notably across regions. According to Figure 5, the amount of crop residue burning spots in Central China (CC) changed significantly. Two peaks appeared respectively in 2007 and 2015 with a large number around 5000. For East China (EC), the trend of crop residue burning was generally upward since 2003, until a decline appeared in 2013. In the north, crop residue burning in North China (NC) presented a straightly-rising trend with two peaks in 2007 and 2013. Meanwhile, crop residue burning in Northeast China (NEC) demonstrated the strongest inter-annul variation and took up a major proportion in the total number of crop residue burning spots in China. For Northwest China (NWC), although the amount of crop residue burning spots was smaller than that in other regions, the trend also demonstrated an upward trend from 2003 to 2013. Following this, the number of burning spots decreased notably from 2014 to 2017. For Southern China, the number of crop residue burning spots in Southwest China (SWC) showed an increasing trend with a smaller inter-annual variation, compared with that in other regions in Northern China. Meanwhile, the amount of burning spots in South China (SC) was the smallest and no clear pattern existed.

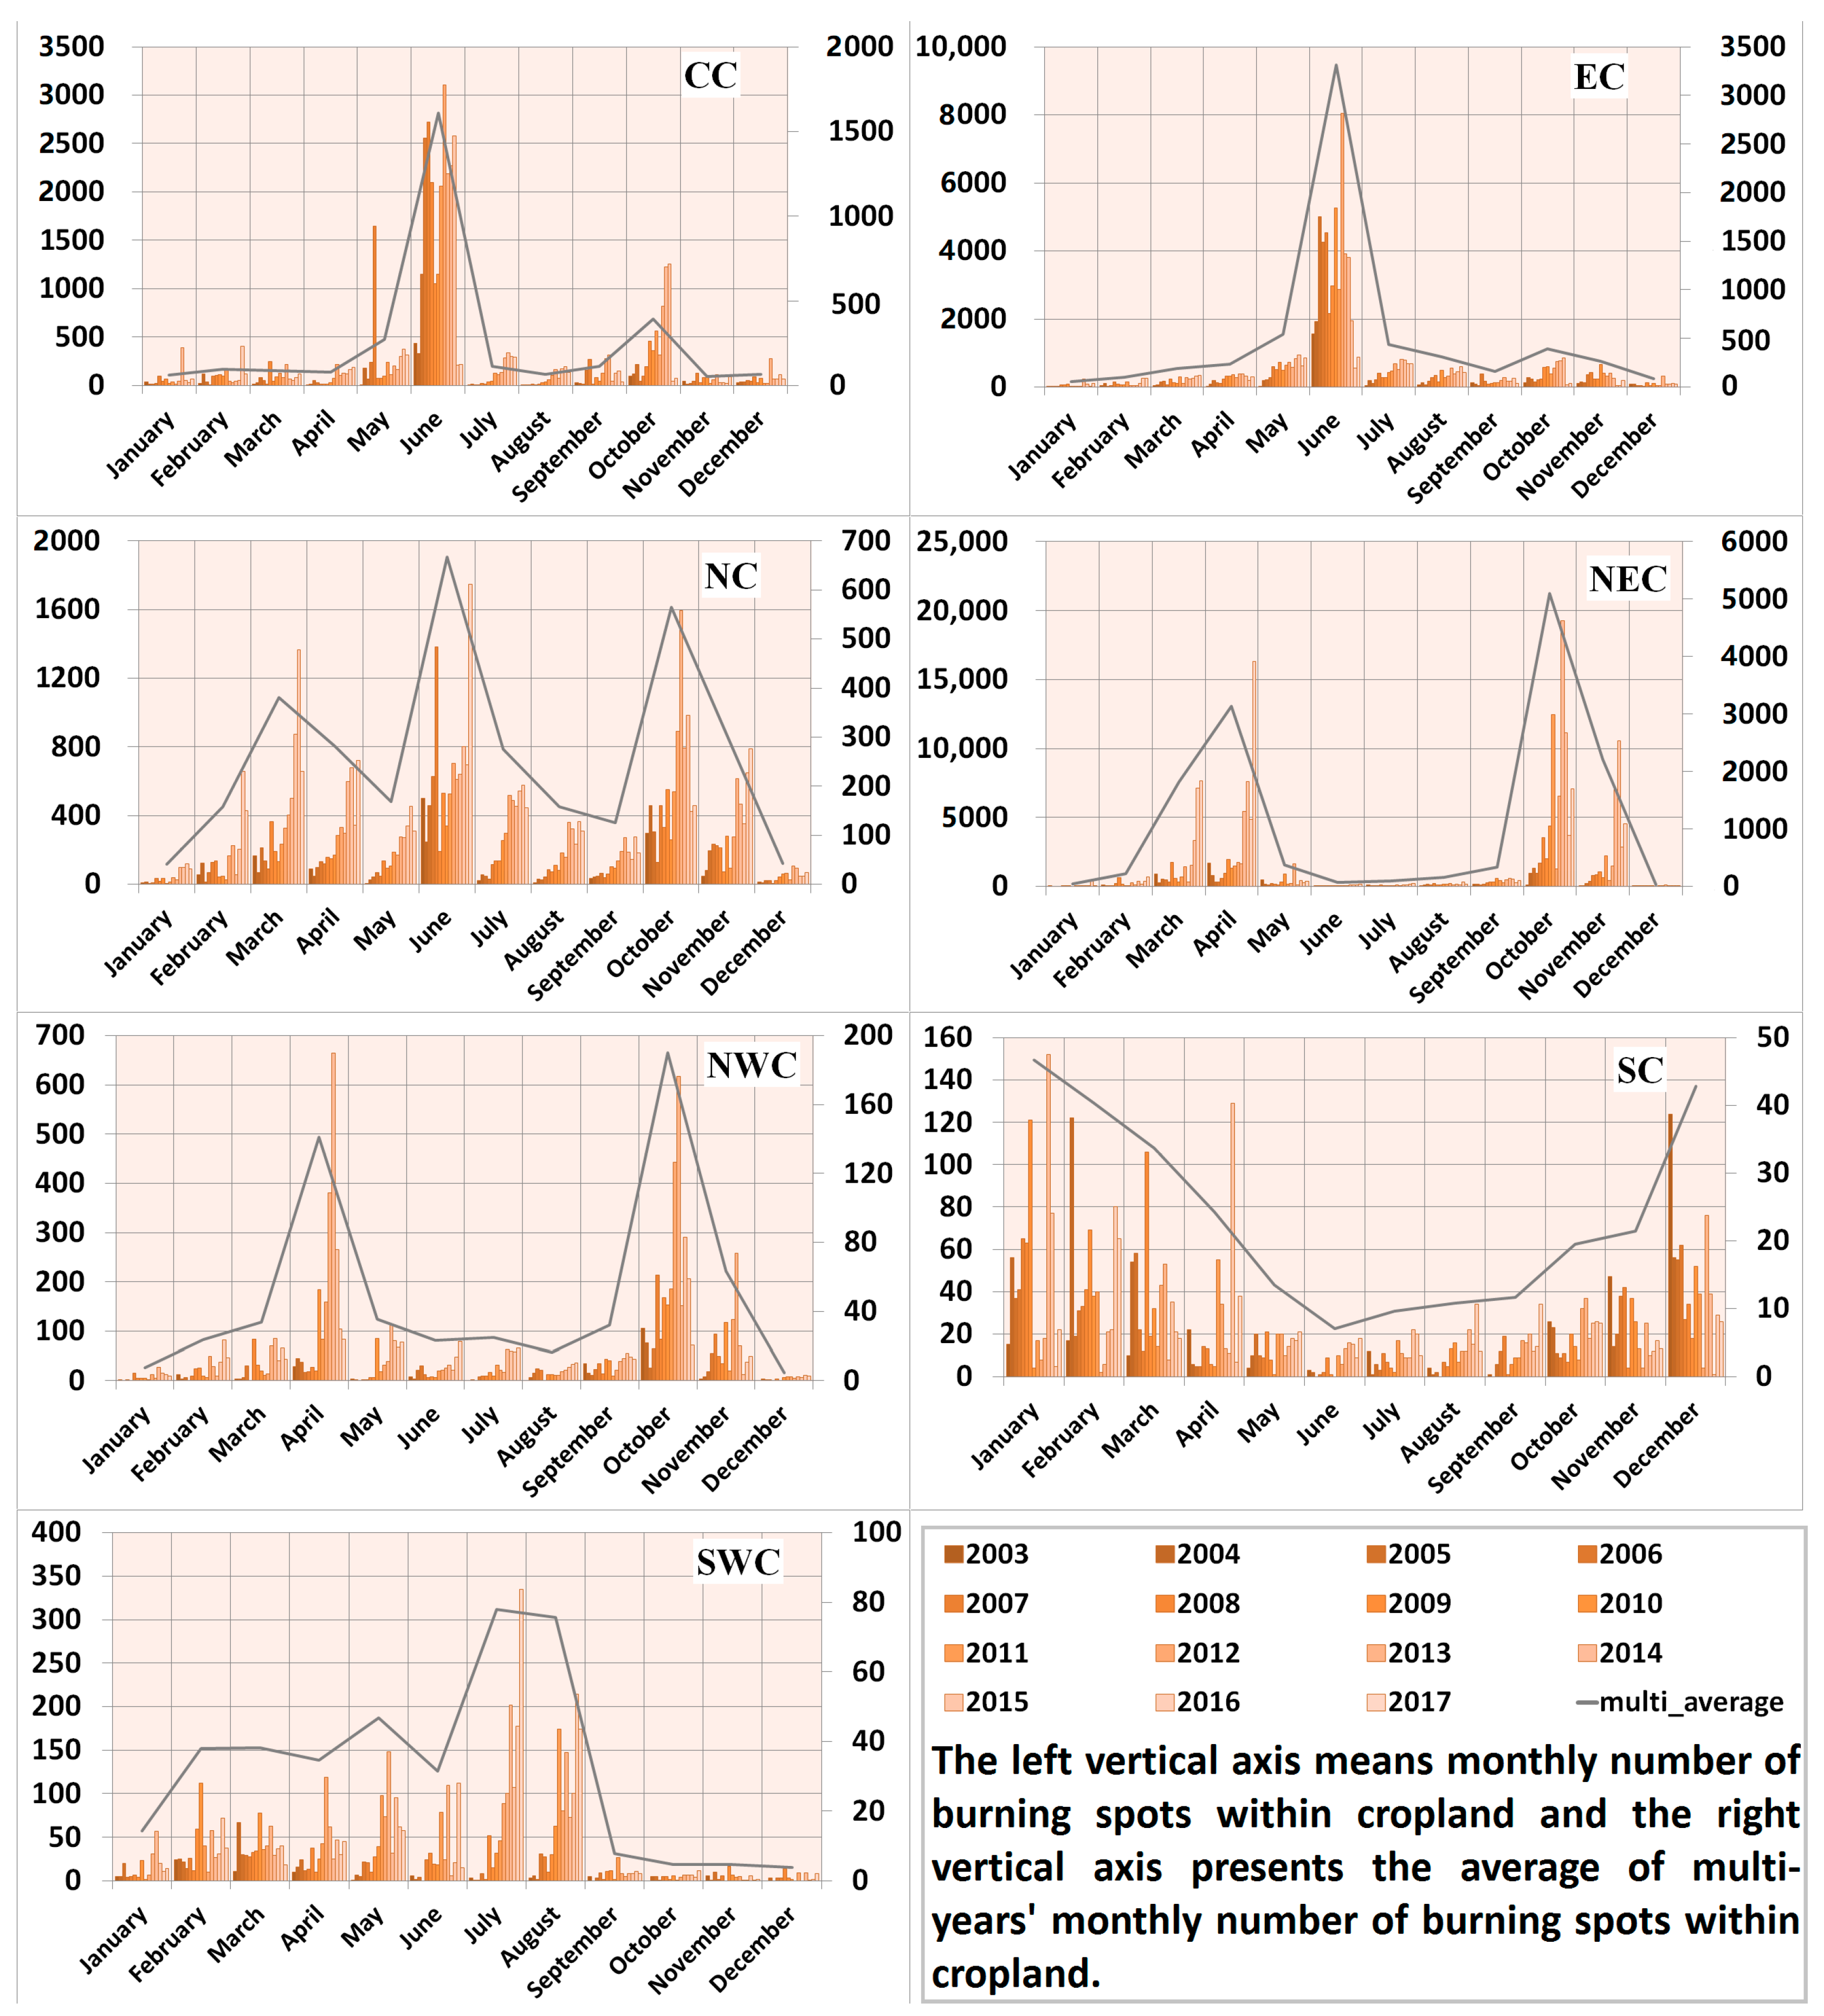
3.2. The Temporal Distribution of Crop Residue Burning in China

In addition to the inter-annual analysis, temporal variations of crop residue burning in different regions have been comprehensively understood at monthly and seasonal scales.

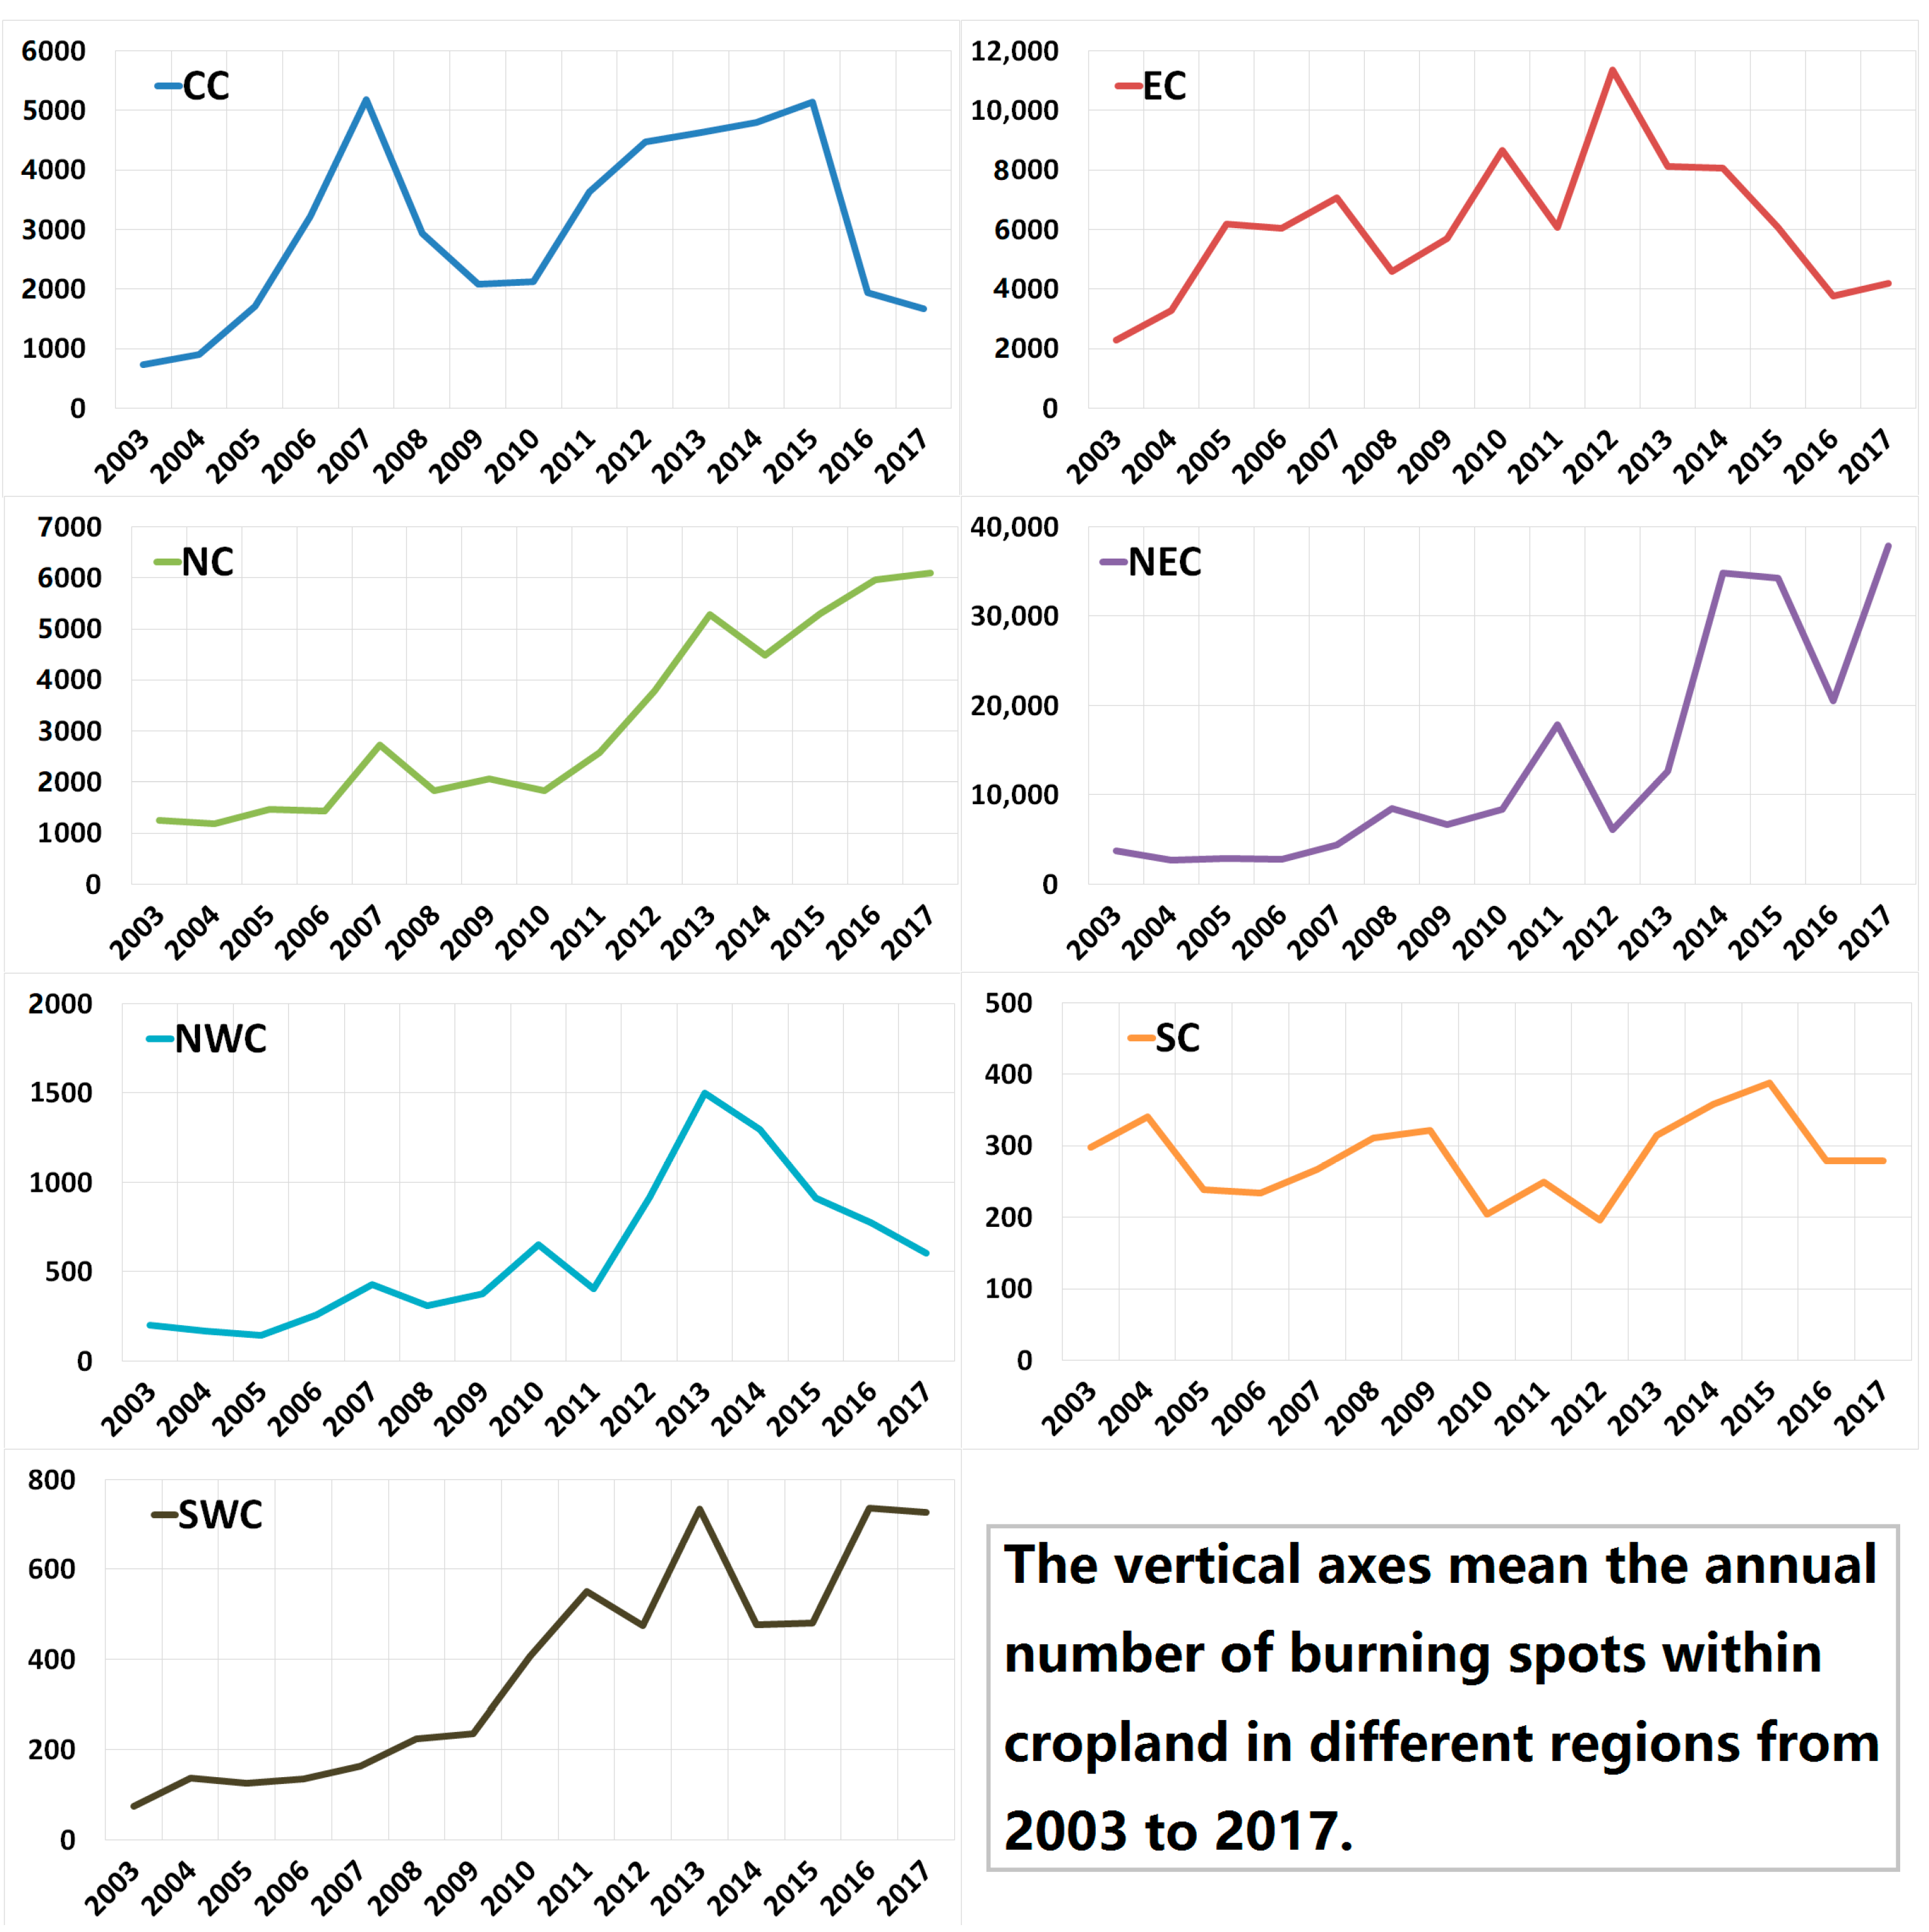
3.2.1. The Temporal Distribution of Crop Residue Burning in Central China (CC)

According to Figure 6, detected burning spots were concentrated in June and a small peak appeared in October in recent years. For monthly variations, the burning of crop residues was in an upward trend in most months except for an anomaly high value in May 2007. Although the increase was accompanied with a slight fluctuation, the amount of burning spots remained at a high level. From the perspective of seasonal variations during these years, it can be summarized as follows: Crop residue burning in CC mainly concentrated in summer and the fluctuation was large. The first peak appeared in 2007, followed by a decline for two consecutive years. Since then, the amount of crop residue burning spots remained at a low level, until 2011, when the amount of burning spots rebounded to a relatively high value and reached the second peak in 2012. However, this trend did not last for long. During the period from 2012 to 2015, the number of crop residue burning spots declined slightly, until a considerable plunge appeared in 2016. In the past summer of 2017, the number of burning spots remained in a moderate decreasing trend. For the inter-annual variation in other seasons, it was generally smooth in spring except for an abrupt climb in 2007, which was caused by the abnormal high value in May 2007. Before 2016, the amount of crop residue burning spots in autumn increased gradually, until a decline appeared in the most-recent two years. In addition, the intensity of burning events occurring in winter was limited and demonstrated no significant inter-annual variation.

3.2.2. The Temporal Distribution of Crop Residue Burning in East China (EC)

For EC, the peak of crop residue burning mainly concentrated in June with a fluctuated variation and crop residue burning occurred in other months generally remained at an increasing trend. Meanwhile, similar to the trend in CC, the most dramatic seasonal-variation of crop residue burning was in summer and the inter-annual variation was much smaller for other seasons. The peak of summer burning appeared in 2012, when a similar peak appeared in CC.

3.2.3. The Temporal Distribution of Crop Residue Burning in North China (NC)

The total number of crop residue burning spots in NC was small and crop residue burning spots mostly concentrated in March, June, and October. In recent years, crop residue burning experienced a significant increase in March, April, July, and November. Meanwhile, the number of crop residue burning also increased in other months. For the inter-annual seasonal variations, the burning of crop residue demonstrated a considerable upward trend in all seasons. In the early eight years of the study period, crop residue burning in NC remained at a stable status except for a small peak that appeared in summer of 2007. From 2010, crop residue burning in most seasons maintained a fleetly upward trend, except in winter. Meanwhile, an abrupt peak appeared in the autumn of 2013 with a following decline in the following four years.

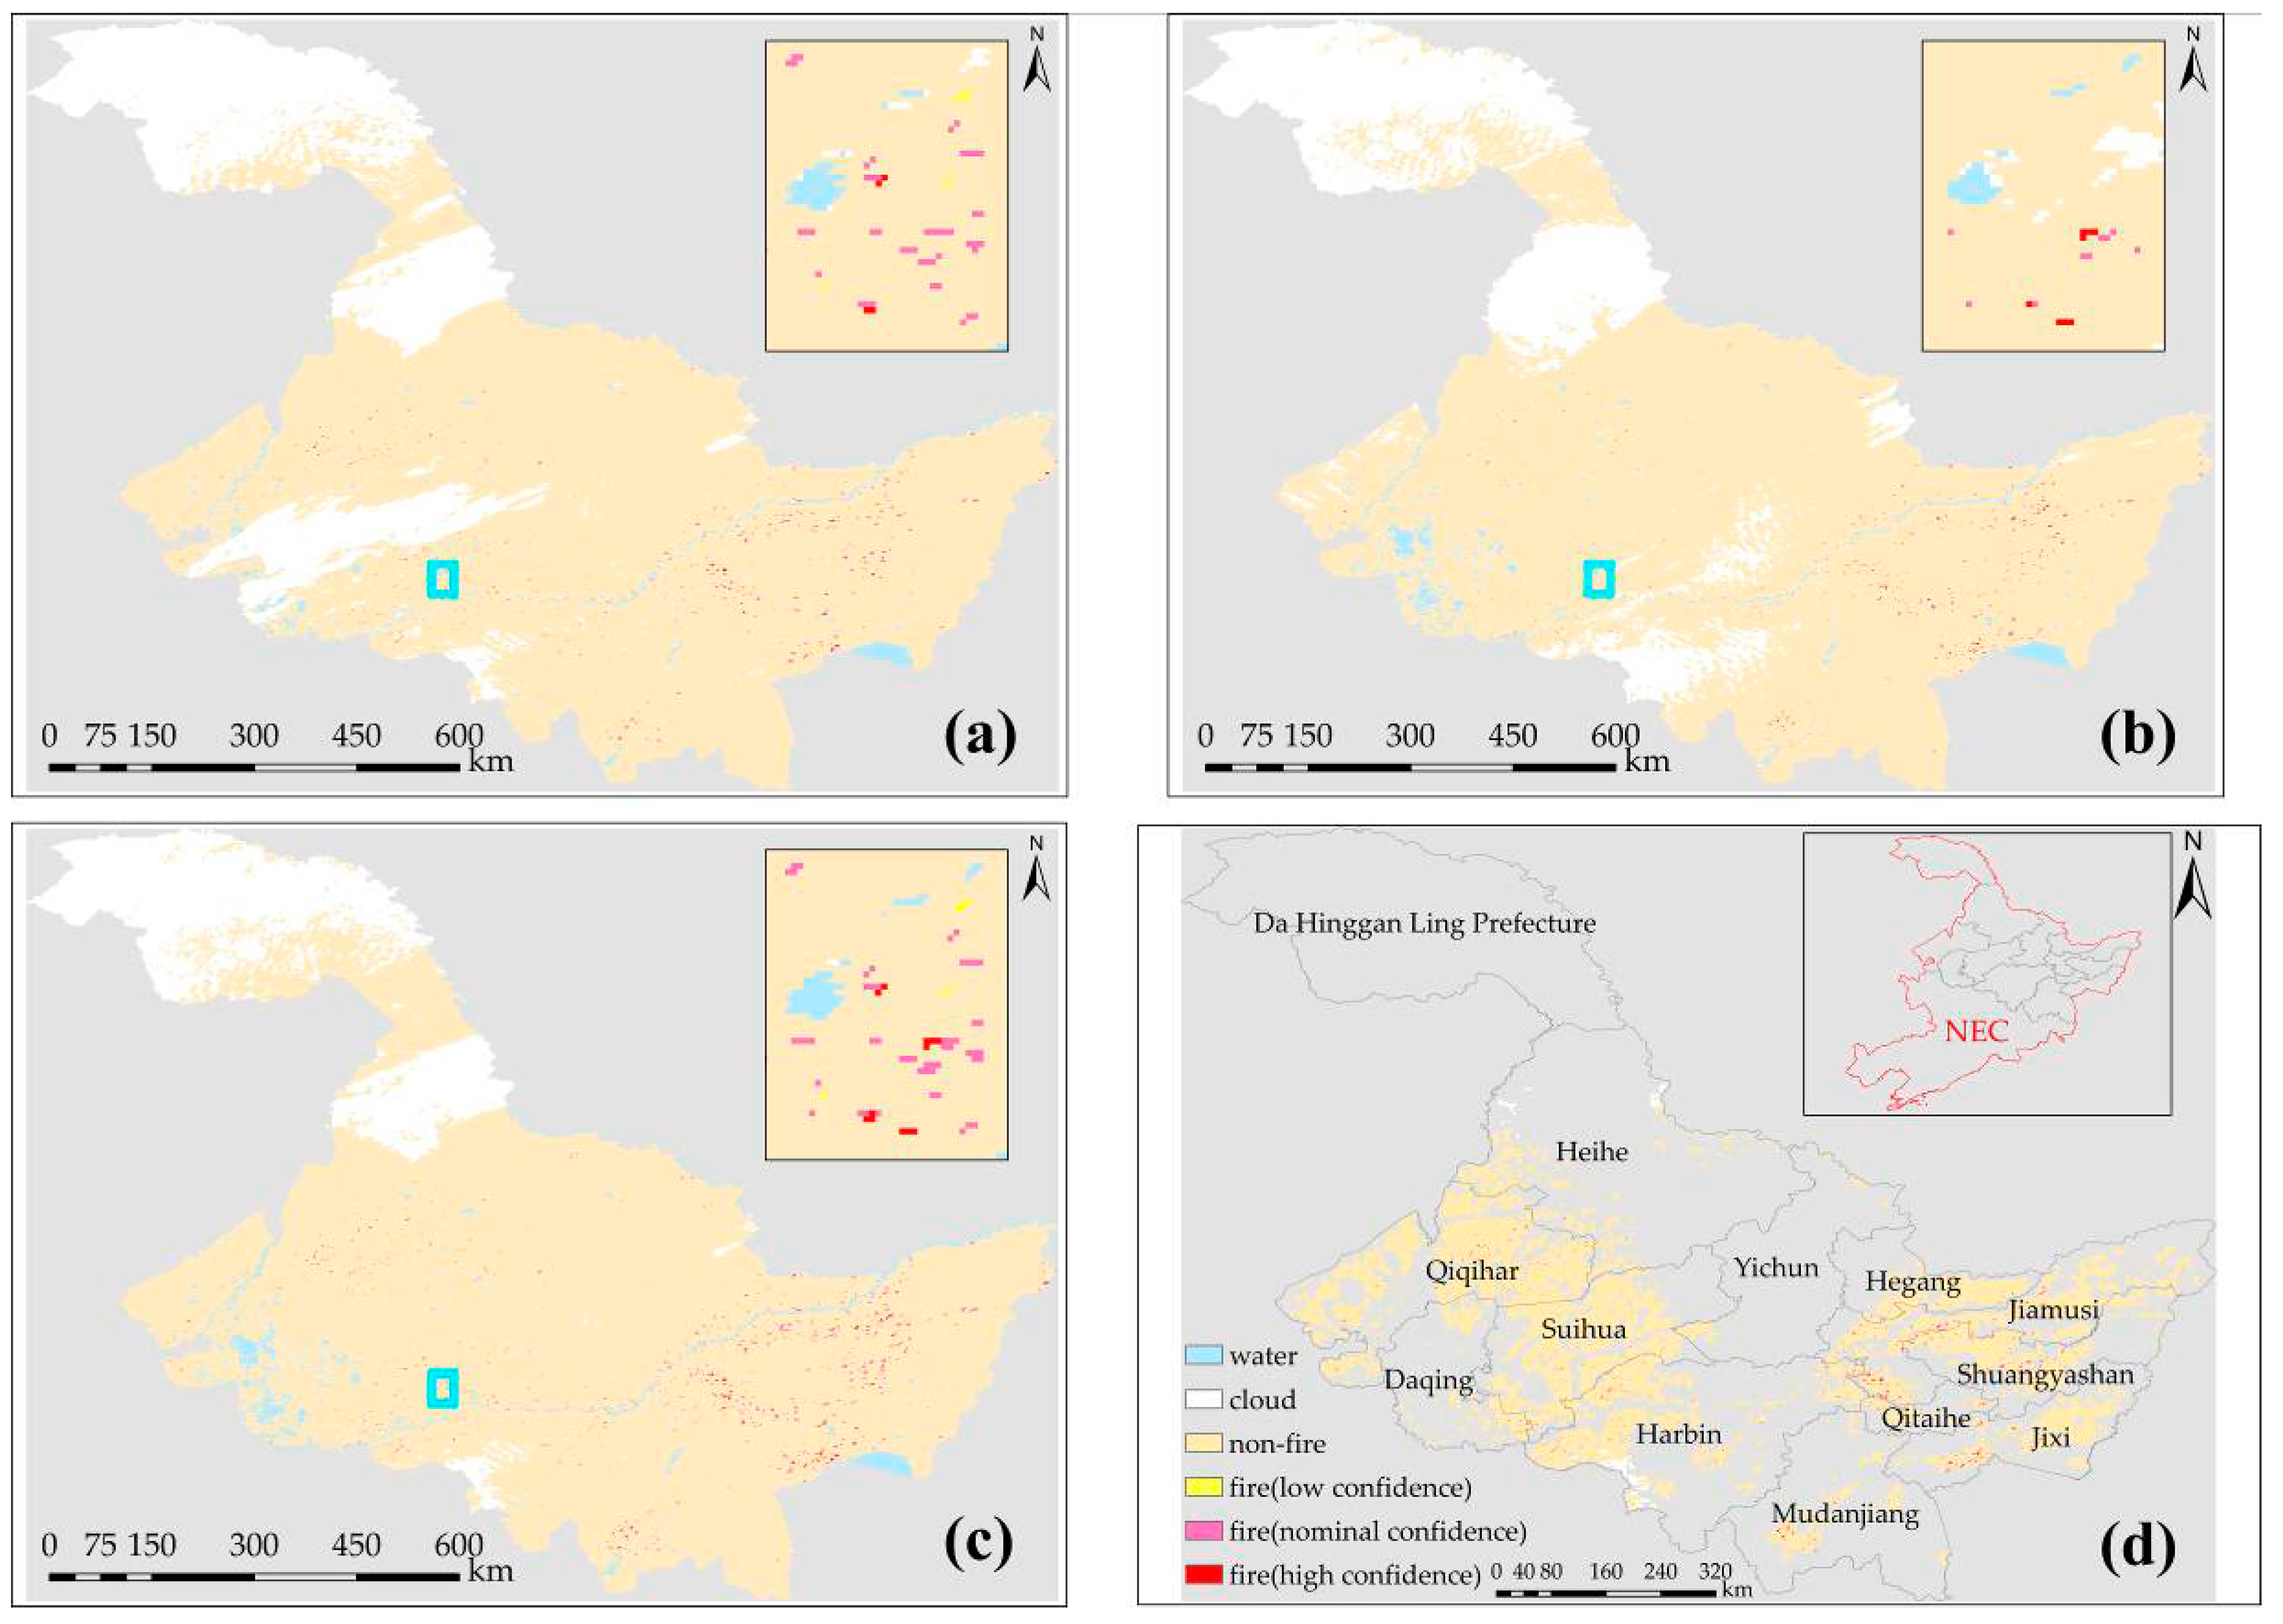
3.2.4. The Temporal Distribution of Crop Residue Burning in Northeast China (NEC)

The temporal variation of crop residue burning in NEC was different from other regions, and the concentrated crop residue burning mainly appeared in March, April, October, and November. The amount of burning spots in these four months sharply increased in recent years. For seasonal variations of crop residue burning in NEC, there was no significant variation in summer and winter, which remained at a low level, whilst the variation of crop residue burning in spring was notable, with a climb to a considerable level since 2013. In addition, crop residue burning occurring in autumn presented an undulating increase and experienced two peaks during the ascent. The first small peak appeared in 2011 and, after a sharp decline, the crop residue burning boomed to a higher level in 2014.

3.2.5. The Temporal Distribution of Crop Residue Burning in Northwest China (NWC)

Compared with other regions in northern parts of China, the overall crop residue burning in NWC remained at a relatively low level, and mainly concentrated in April and October. Similar to crop residue burning in NEC, the inter-annual variations of summer and winter in NWC were not notable except for a slight increase of summer burning that appeared in recent years. For the variations of burning spots in spring and autumn, two peaks appeared in 2013 and 2014, respectively. However, the decrease of detected burning spots followed by the two peaks kept the total number of crop residue burning spots in NWC at a low level.

3.2.6. The Temporal Distribution of Crop Residue Burning in South China (SC)

The amount of crop residue burning spots in SC was so small that even small monthly and seasonal variations were obvious in Figure 6. Specifically, crop residue burning mostly concentrated in the beginning and the end of each year, demonstrating a funnel shape. For the inter-annual seasonal variation, Figure 7 demonstrates an irregular trend, yet an interesting phenomenon of the relationship between crop residue burning in spring, summer, and winter. This phenomenon can be described as if more burning spots appeared in two of the three seasons, fewer burning spots would appear in the other season. Furthermore, crop residue burning spots in summer generally remained at a low level, although the number of burning spots increased in recent years.

3.2.7. The Temporal Distribution of Crop Residue Burning in Southwest China (SWC)

Although crop residue burning in SWC appeared in many months of the first half year, it mainly concentrated in July and August. According to Figure 7, one can see that there was no significant variations in the four seasons, until 2010, when a slight increase appeared in autumn. The growth in winter returned to the original low level in a short time. Meanwhile, the increase in summer was considerable, with some occasional decreases. For the variation in spring, it reached its peak in 2013, followed by a small wave in the following four years. Meanwhile, an interesting phenomenon was detected in the last three years: the less crop residue burning in spring, the more crop residue burning spots would appear in summer. In contrast, if crop residue burning in spring was intensified, then less crop residue burning spots would appear in summer.

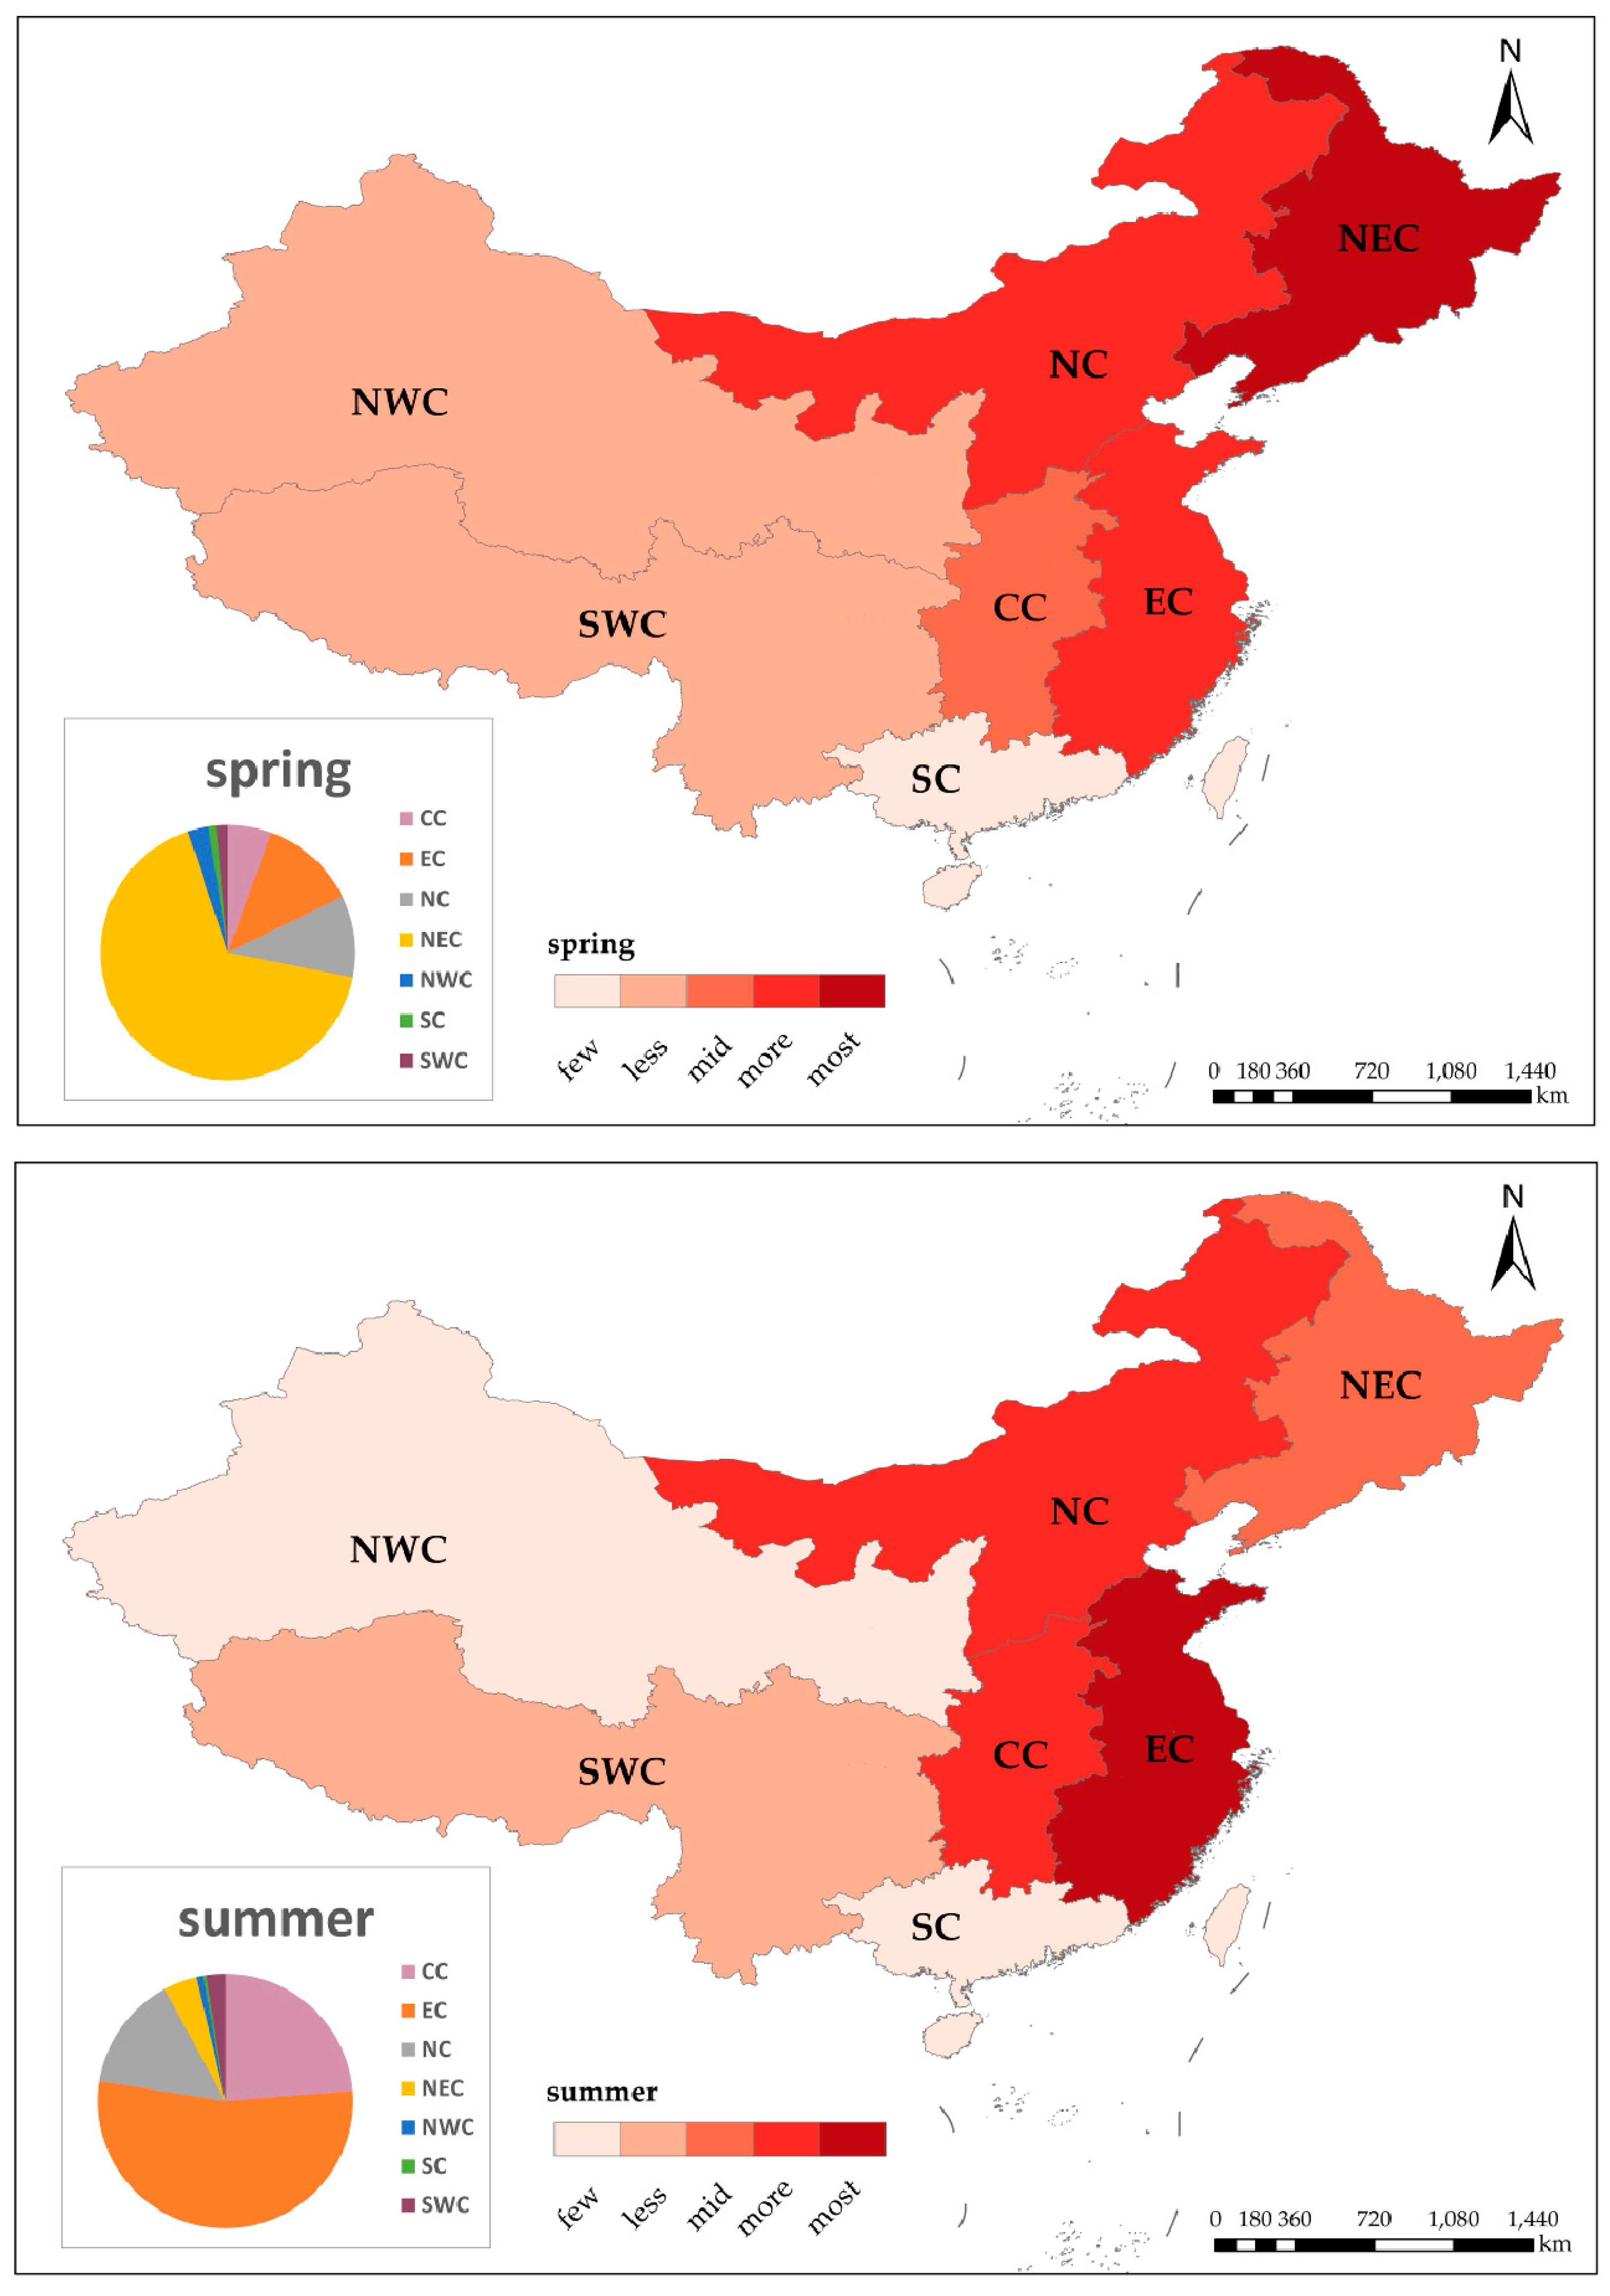
3.3. The Spatial Distribution of Crop Residue Burning in China

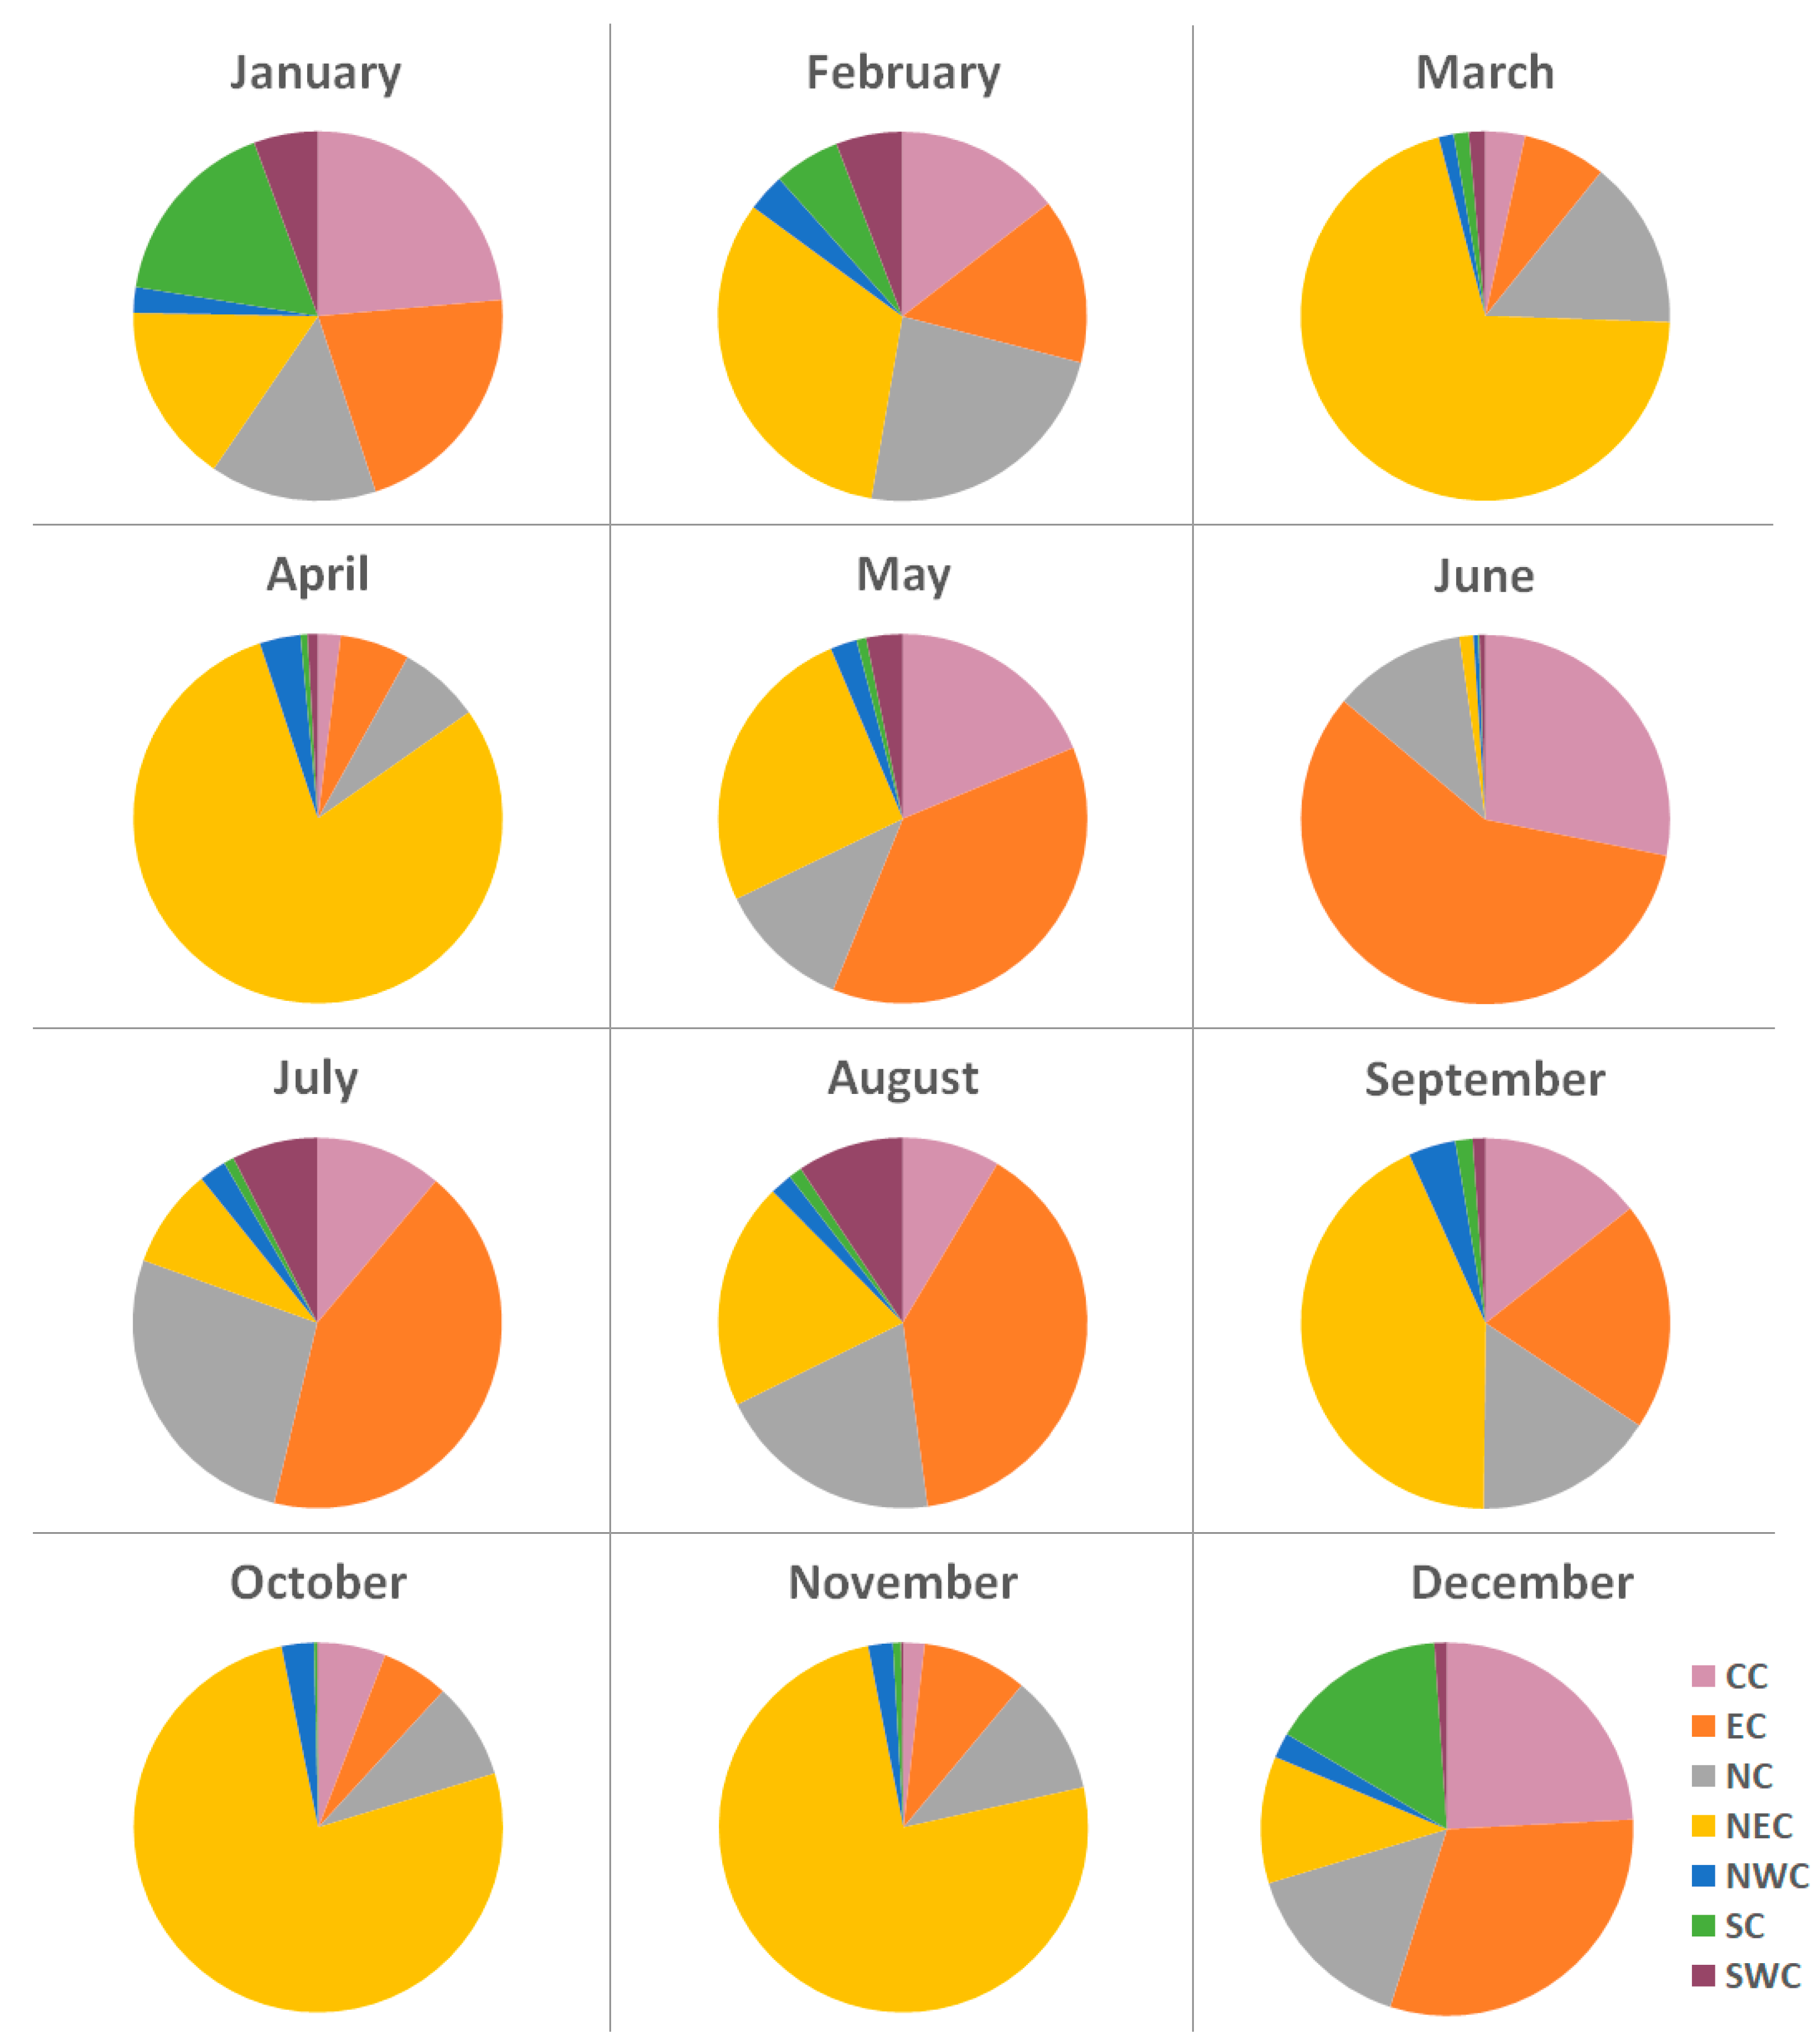
3.3.1. Monthly Variation

At the monthly scale, it can be seen from Figure 8 that the spatial distribution pattern of crop residue burning in China was distinct. Crop residue burning mainly concentrated in NEC and the second largest contribution was from EC. Meanwhile, the proportion of crop residue burning in NC and CC was close, although much less than that in NEC. The proportion of crop residue burning in SC, NWC, and SWC remained at a relatively low level in most months, except for intensive crop residue burning in SC in January and December. At the national scale, the majority of crop residue burning generally shifted from NEC to EC in May, and then returned to NEC in September. Finally, the major proportion of crop residue burning spots appeared in EC again in December. The proportion of crop residue burning spots in different regions in January and December was close, except for two regions in Western China.

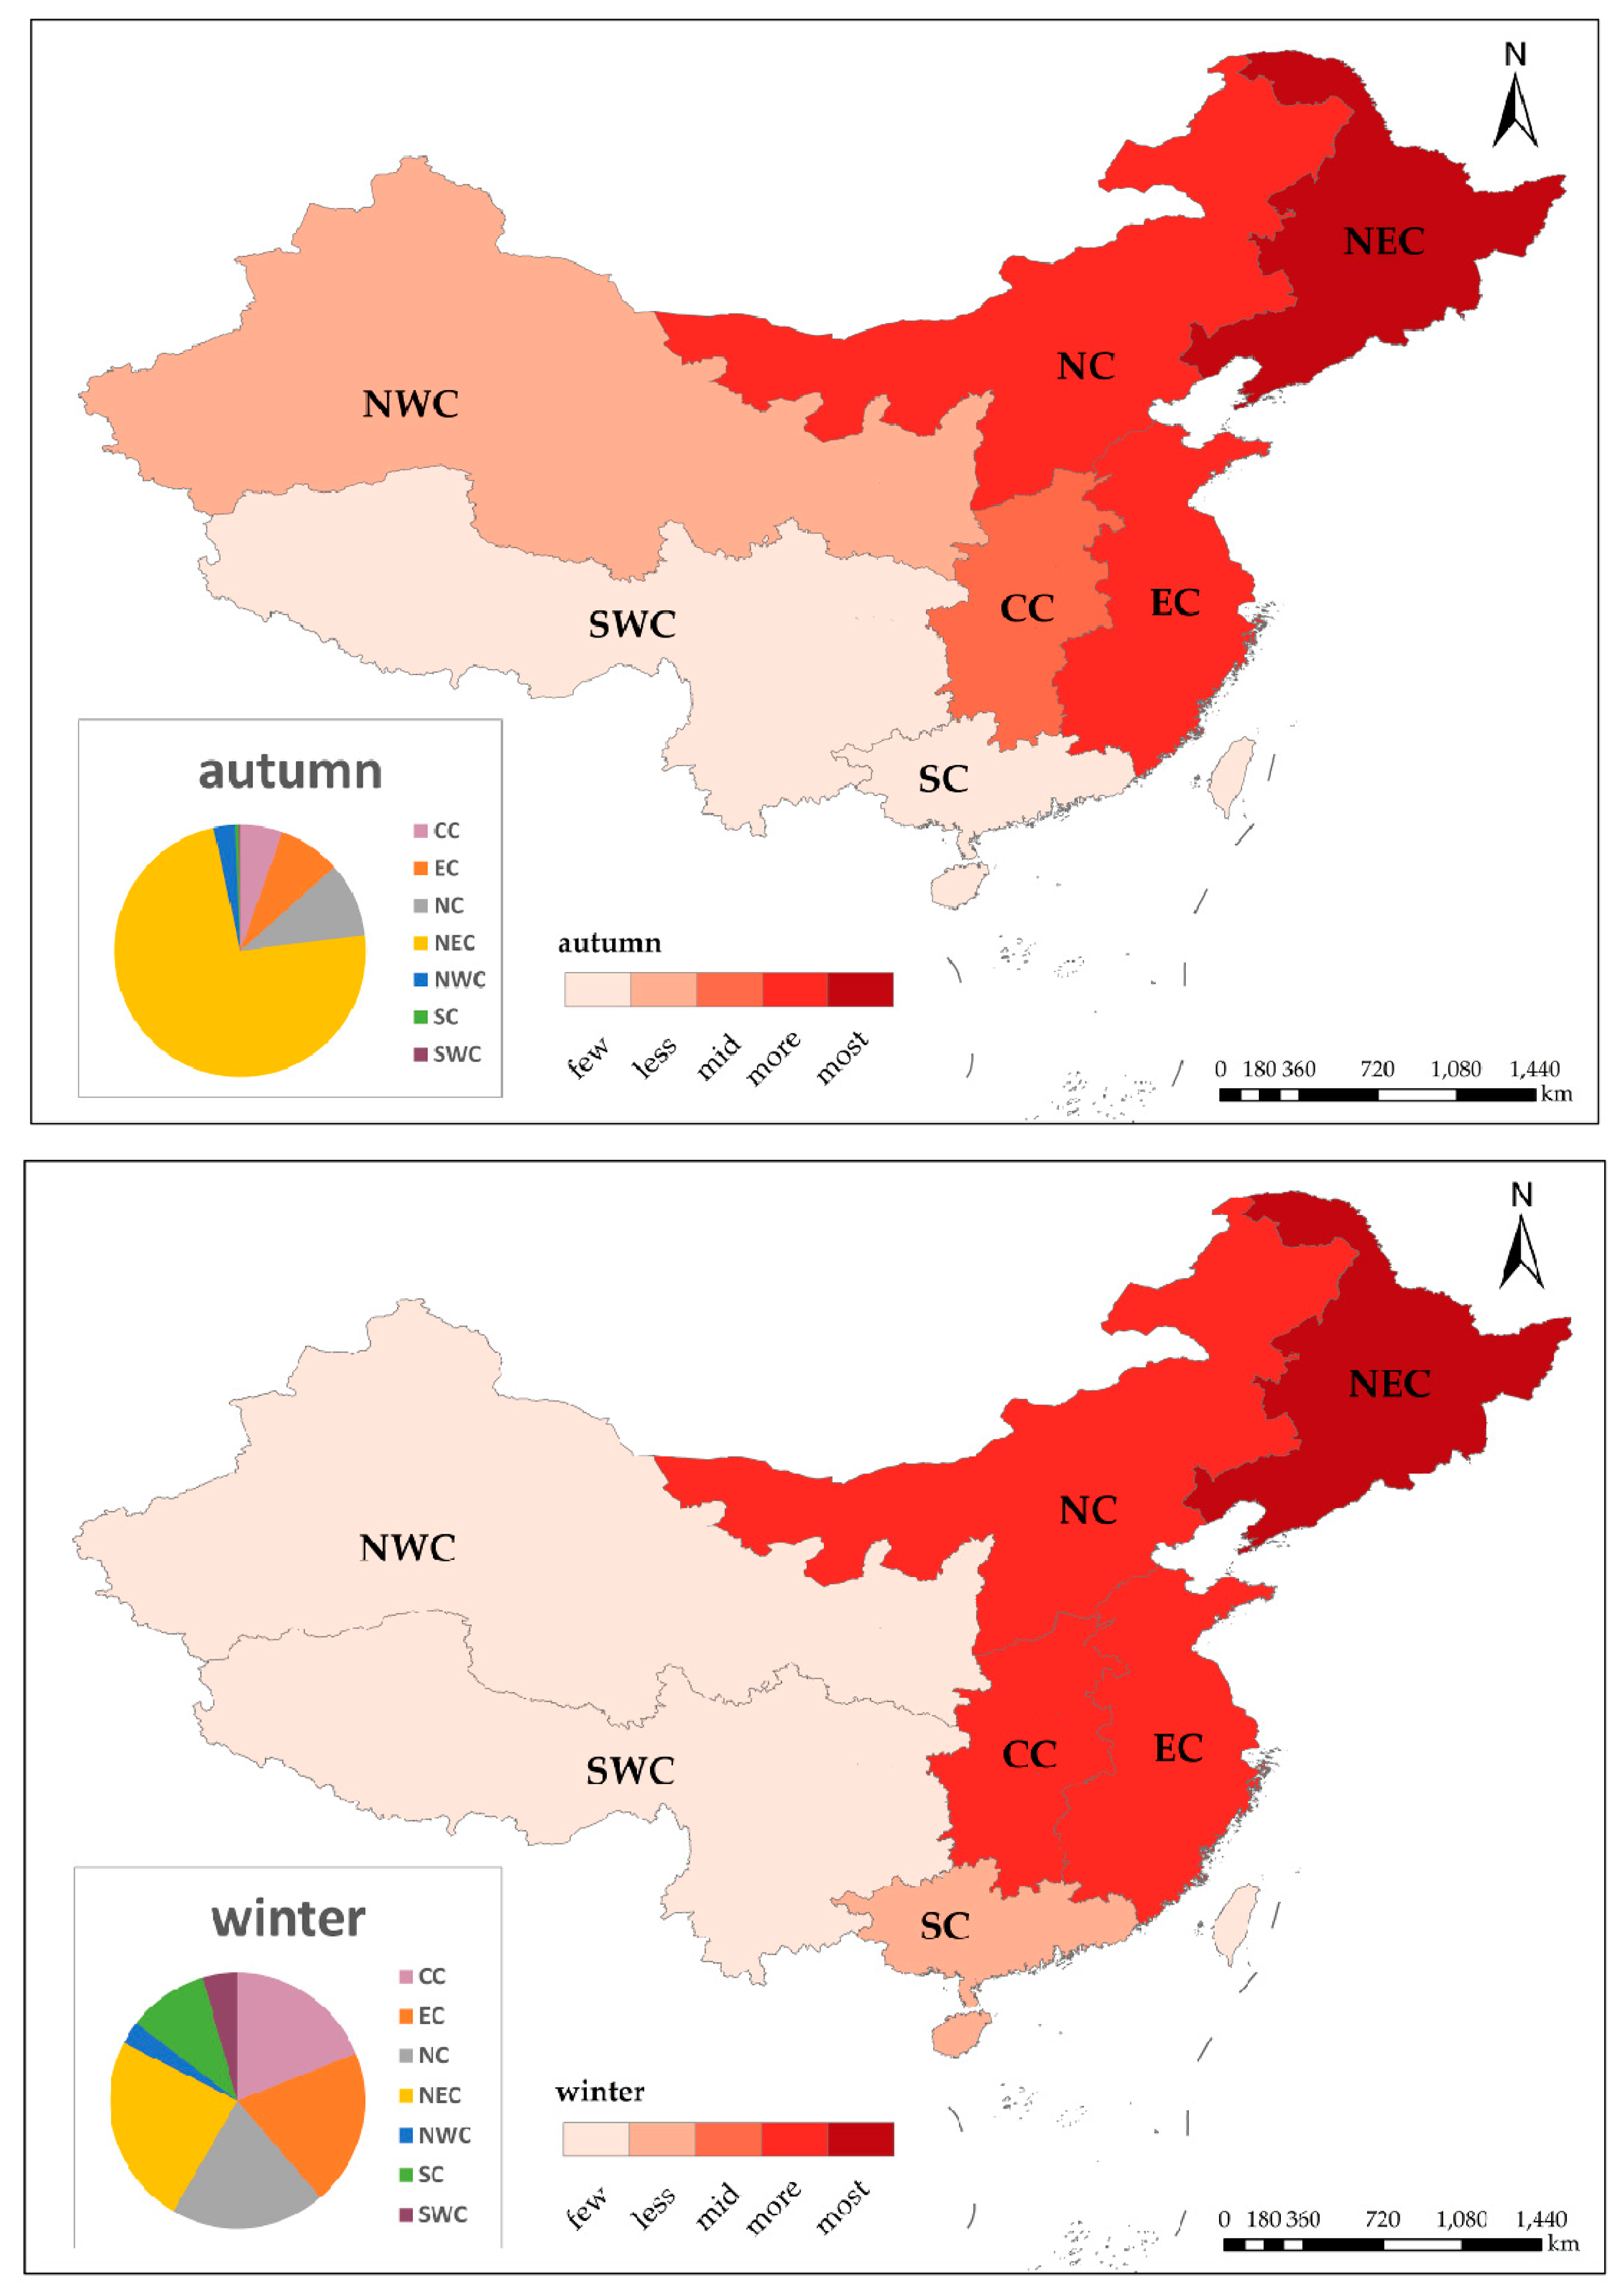
3.3.2. Seasonal Variations

From the perspective of seasonal variations, regional differences were notable (Figure 9). Crop residue burning in spring and autumn was very close and mostly concentrated in NEC, whilst crop residue burning in summer was mainly concentrated in EC. For winter, the proportion of crop residue burning spots was close in NEC, EC, CC, and NC, and the proportion in SC, NWC, and SWC was much smaller than the other four regions. Furthermore, the number of crop residue burning spots in SC in winter held a much larger proportion compared to that in the other three seasons. In general, crop residue burning was mainly distributed in Northern and Eastern China across four seasons.

4. Discussion

4.1. The Attribution of the Temporal Distribution of Crop Residue Burning in Different Regions of China

In this study, we analyzed the temporal distribution of crop residue burning in different regions of China. The results showed different trends in different regions. In general, the slight decline of crop residue burning in 2008 may be attributed to the Beijing Olympic Games hosted in 2008. During 2011 to 2012, there existed a second peak of crop residue burning in most regions, except for NC, which had a sharp decline after the small peak in 2011 and contributed significantly to the overall decrease of crop residue burning spots in China. In the following two years, the number of crop residue burning spots in different regions mostly remained in a straight upward trend until 2015, when a slight decline appeared. This glide could be attributed to the appearance of large-scale haze episodes in China, leading to a series of control policies. Due to the serious impact of air pollution, the government began to pay more attention to the crop residue burning, which could emit large amounts of CO2 and other air pollutants [29,30,31]. Meanwhile, national environmental supervision, including the control of crop residue burning, has been conducted since January, 2015. Although the reduction in crop residue burning continued until 2016, the total number of burning spots in 2017 still demonstrated a slight increase. due to the extreme cold weather in NEC in winter, as well as the cold weather-induced frozen soil structure, crop residues left in the cropland can hardly decompose naturally before the following April [32]. Therefore, for this phenomenon, it could be attributed to that the sharp decline of crop residue burning in the second half of 2016 postponed field burning of left crop residues to the first half of the following year. Hence, more strict policies should be taken to control the upward trend of crop residue burning in recent years.

4.2. The Attribution of the Spatial Distribution of Crop Residue Burning in Different Months or Seasons

In addition to the temporal distribution, we also analyzed the spatial distribution of crop residue burning in China from the perspective of monthly and seasonal variations. The result was consistent with the previous study [2], pointing out that the monthly burning events mainly concentrated in three stages: from March to April, in July, and from October to November. During March to April, burning spots were mainly distributed in NC and NEC, due to the crop residue burning before spring ploughing. In this period, crop residues were usually used as fertilizers on croplands to make the soil loamier for plants. Burning spots in June mainly concentrated in EC, which is the major planting region for wheat. The residues of harvested wheat were usually burnt on croplands directly. In October, when the corn and rice were harvested in northern China, crop residue burning appeared in NEC again. By November, the amount of burning spots in NEC remained high, which may be attributed to the high latitude in this region and a postponed harvest time. The result of this research is also consistent with findings of previous studies. Firstly, crop residues were mainly burnt in lowlands of EC and NEC, and crop residue burning in Western and Southern China was limited [15]. The difference in spatial variations of crop residue burning may be attributed to a diversity of crop types planted in different regions. Field burning of corn, wheat, and rice residues mainly concentrated in NC, NEC, and SC, respectively [9], which was consistent with our results on the spatial distribution of crop residue burning in different months. Compared with previous studies conducted at the local and regional scale, this research provides scholars and decision-makers with a more comprehensive and long-term analysis of spatio-temporal patterns of crop residue burning in China.

4.3. Limitations and Prospect

Although this study has analyzed the spatial and temporal distribution of crop residue burning in China from both national scale and regional scales, some limitations remain. Firstly, the data analysis is limited to the total number and average number of crop residue burning spots, which may lead to the neglect of small variations. Therefore, crop residue burning should be analyzed from a more comprehensive perspective. Secondly, this research did not combine crop residue burning with its potential impacts on such fields as air quality and public health. Further studies, especially quantitative analysis, should be conducted to quantify the negative influence of crop residue burning on different social, ecological, and economic issues. Furthermore, the spatial resolution of MODIS fire products is 1 km, whilst crop residue burning in China is scattered and the scale of crop residue burning is much smaller than that of the MODIS data. Thus, the MODIS fire products cannot detect smaller burning spots in China and, thus, finer-scale remote sensing data are required for better monitoring crop residue burning. Since the temporal resolution of the dataset of land use and land cover change (four images in 15 years) is far coarser than that of MODIS fire products (daily), the extraction of crop residue burning pixels may be biased. However, based on the comparison of these four images, the change of croplands in China was not significant during the last 15 years, so these types of biases were limited. In general, it is unlikely to correctly record all crop residue burning events that occurred in the last 15 years. In future studies, more accurate methodologies and data sources for detecting fine-scale crop residue burning spots should be investigated thoroughly.

5. Conclusions

By extracting crop residue burning spots using a remote sensing dataset of MODIS and a spatial distribution dataset of land-use and land-cover change, this research attempted to explore the spatial and temporal distribution of crop residue burning in China from 2003 to 2017 from both a national and regional scale. The results revealed an upward trend of crop residue burning at a national scale since 2003. In addition, the results demonstrated the temporal and spatial variations of crop residue burning in seven geographical divisions from the perspective of monthly and seasonal variations. Specifically, crop residue burning in Northeast China is dominant in China both in spring and autumn. For crop residue burning in summer, East China holds the largest proportion of burning spots amongst the seven regions. For crop residue burning in winter, the proportion is close in most regions. In terms of monthly variations, detected crop residue burning spots in June mainly concentrate in Central China, East China, and North China. Meanwhile, detected crop residue burning spots in April and October mainly concentrate in Northeast China and Northwest China. This phenomenon is generally consistent with the harvesting time of crops planted in these croplands of China. For other months, a scattered presence of crop residue burning spots is detected in all regions. The methodology and findings from this research provide policy-makers with useful reference for better understanding of the characteristics and variations of crop residue burning in China. More effective measures for monitoring and controlling crop residue burning in these regions can be proposed and implemented accordingly to improve local air quality and protect public health.

Acknowledgments

This research is supported by the National Natural Science Foundation of China (grant no. 210100066), State Key Laboratory of Earth Surface Processes and Resource Ecology (2017-KF-22), the National Key Research and Development Program of China (no. 2016YFA0600104), the Fundamental Research Funds for the Central Universities, Ministry of Environmental Protection (201409005), and the Beijing Training Support Project for Excellent Scholars (2015000020124G059).

Author Contributions

Yan Zhuang analyzed the data and wrote the manuscript. Ruiyuan Li collected the MODIS fire products data and extracted the fire spots. Danlu Chen contributed figures. Hao Yang, Bingbo Gao, and Bin He provided comments and suggestions for the manuscript and checked the writing. Ziyue Chen designed the research and revised this manuscript.

Conflicts of Interest

The authors declare no conflict of interest.

References

  1. Lal, R. World crop residues production and implication of its use as a biofuel. Environ. Int. 2005, 31, 575–584. [Google Scholar] [CrossRef] [PubMed]
  2. Yin, S.; Wang, X.F.; Xiao, Y.; Tani, H.; Zhong, G.S.; Sun, Z.Y. Study on spatial distribution of crop residue burning and PM2.5 change in China. Environ. Pollut. 2017, 220, 204–221. [Google Scholar] [CrossRef] [PubMed]
  3. Zhang, Y.; Zang, G.Q.; Tang, Z.H.; Chen, X.H.; Yu, Y.S. Burning straw, air pollution, and respiratory infections in China. Am. J. Infect. Control 2014, 42, 815–818. [Google Scholar] [CrossRef] [PubMed]
  4. Mehmood, K.; Chang, S.; Yu, S.C.; Wang, L.Q.; Li, P.F.; Li, Z.; Liu, W.P.; Rosenfeld, D.; Seinfeld, H.J. Spatial and temporal distributions of air pollutant emissions from open crop straw and biomass burnings in China from 2002 to 2016. Environ. Chem. Lett. 2017, 16, 301–309. [Google Scholar] [CrossRef]
  5. Chen, J.M.; Li, C.L.; Ristovski, Z.; Milic, A.; Gu, Y.; Islam, M.S.; Wang, S.; Hao, J.; Zhang, H.; He, C.; et al. A review of biomass burning: Emissions and impacts on air quality, health and climate in China. Sci. Total Environ. 2017, 579, 1000–1034. [Google Scholar] [CrossRef] [PubMed]
  6. Gadde, B.; Bonnet, S.; Menke, C.; Garivait, S. Air pollutant emissions from rice straw open field burning in India, Thailand and the Philippines. Environ. Pollut. 2009, 157, 1554–1558. [Google Scholar] [CrossRef] [PubMed]
  7. THE PAPER. Available online: http://www.thepaper.cn/newsDetail_forward_1557556 (accessed on 8 November 2016).
  8. Chen, Z.Y.; Chen, D.L.; Zhuang, Y.; Cai, J.; Zhao, N.; He, B.; Gao, B.B.; Xu, B. Examining the influence of crop residue burning on local PM2.5 concentrations in Heilongjiang Province using ground observation and remote sensing data. Remote Sens. 2017, 9, 971–984. [Google Scholar] [CrossRef]
  9. Li, J.; Bo, Y.; Xie, S.D. Estimating emissions from crop residue open burning in China based on statistics and MODIS fire products. J. Environ. Sci. 2016, 44, 158–170. [Google Scholar] [CrossRef] [PubMed]
  10. Zhang, T.R.; Wooster, J.M.; Green, C.D.; Main, B. New field-based agricultural biomass burning trace gas, PM2.5, and black carbon emission ratios and factors measured in situ at crop residue fires in Eastern China. Atmos. Environ. 2015, 121, 22–34. [Google Scholar] [CrossRef]
  11. Enkhjargal, A.; Burmaajav, B. Impact of the ambient air PM2.5 on cardiovascular diseases of Ulaanbaatar residents. Geogr. Environ. Sustain. 2015, 4, 35–41. [Google Scholar] [CrossRef]
  12. Yeatts, K.; Svendsen, E.; Creason, J.; Alexis, N.; Herbst, M.; Scott, J.; Kupper, L.; Williams, R.; Neas, L.; Cascio, W.; et al. Coarse Particulate Matter (PM2.5–10) Affects Heart Rate Variability, Blood Lipids, and Circulating Eosinophils in Adults with Asthma. Environ. Health Perspect. 2007, 115, 709–714. [Google Scholar] [CrossRef] [PubMed]
  13. Singh, C.P.; Panigrahy, S. Characterisation of Residue Burning from Agricultural System in India using Space Based Observations. J. Indian Soc. Remote Sens. 2011, 39, 423–429. [Google Scholar] [CrossRef]
  14. Lassman, W.; Ford, B.; Gan, W.R.; Pfister, G.; Magzamen, S.; Fischer, V.E.; Pierce, R.J. Spatial and temporal estimates of population exposure to wildfire smoke during the Washington state 2012 wildfire season using blended model, satellite, and in situ data. GeoHealth 2017, 1, 106–121. [Google Scholar] [CrossRef]
  15. Chen, D.M.; Pereira, M.C.J.; Masiero, A.; Pirotti, F. Mapping fire regimes in China using MODIS active fire and burned area data. Appl. Geogr. 2017, 85, 14–26. [Google Scholar] [CrossRef]
  16. Zhang, T.R.; Wooster, J.M.; Xu, W.D. Approaches for synergistically exploiting VIIRS I- and M-Band data in regional active fire detection and FRP assessment: A demonstration with respect to agricultural residue burning in Eastern China. Remote Sens. Environ. 2017, 198, 407–424. [Google Scholar] [CrossRef]
  17. Huang, S.; Siegert, F.; Goldammer, J.G.; Sukhinin, A.I. Satellite-derived 2003 wildfires in southern Siberia and their potential influence on carbon sequestration. Int. J. Remote Sens. 2009, 30, 1479–1492. [Google Scholar] [CrossRef]
  18. Wickramasinghe, H.C.; Jones, S.; Reinke, K.; Wallace, L. Development of a Multi-Spatial Resolution Approach to the Surveillance of Active Fire Lines Using Himawari-8. Remote Sens. 2016, 8, 932–944. [Google Scholar] [CrossRef]
  19. Qiu, X.H.; Duan, L.; Chai, F.; Wang, S.X.; Yu, Q.; Wang, S.L. Deriving High-Resolution Emission Inventory of Open Biomass Burning in China based on Satellite Observations. Environ. Sci. Technol. 2016, 50, 11779–11786. [Google Scholar] [CrossRef] [PubMed]
  20. LAADS DACC ftp Server. Available online: ftp://ladsweb.nascom.nasa.gov (accessed on 10 October 2017).
  21. Giglio, L. MODIS Collection 6 Active Fire Product User’s Guide. Revision, A; Department of Geographical Sciences, University of Maryland: College Park, MD, USA, 2015. [Google Scholar]
  22. Justice, C.; Giglio, L.; Boschetti, L.; Roy, D.; Csiszar, I.; Morisette, J.; Kaufman, Y. Algorithm Technical Background Document MODIS FIRE PRODUCTS. MODIS Science Team: Washington, DC, USA. Available online: ftp://ladsweb.nascom.nasa.gov (accessed on 10 October 2017).
  23. Giglio, L.; Descloitresa, J.; Justicec, O.C.; Kaufman, J.Y. An Enhanced Contextual Fire Detection Algorithm for MODIS. Remote Sens. Environ. 2003, 87, 273–282. [Google Scholar] [CrossRef]
  24. Dozier, J. A Method for Satellite Identification of Surface Temperature Fields of Subpixel Resolution. Remote Sens. Environ. 1981, 11, 221–229. [Google Scholar] [CrossRef]
  25. Matson, M.; Dozier, J. Identification of Subresolution High Temperature Sources Using a Thermal IR Sensor. Photogramm. Eng. Remote Sens. 1981, 47, 1311–1318. [Google Scholar]
  26. Resources and Environmental Sciences, Chinese Academy of Sciences. Data Center. Available online: http://www.resdc.cn (accessed on 10 October 2017).
  27. Liu, J.Y.; Liu, M.L.; Deng, X.Z.; Zhuang, D.F.; Zhang, Z.X.; Luo, D. The land use and land cover change database and its relative studies in China. J. Geogr. Sci. 2002, 12, 275–282. [Google Scholar]
  28. Carroll, M.L.; Townshend, J.R.; DiMiceli, C.M.; Noojipady, P.; Sohlberg, R.A. A new global raster water mask at 250 m resolution. Int. J. Digit. Earth 2009, 2, 291–308. [Google Scholar] [CrossRef]
  29. Romasanta, R.R.; Sandera, O.B.; Gaihrea, K.Y.; Alberto, C.M. How does burning of rice straw affect CH4 and N2O emissions? A comparative experiment of different on-field straw management practices. Agric. Ecosyst. Environ. 2017, 239, 143–153. [Google Scholar] [CrossRef]
  30. Zhang, L.B.; Liu, Y.Q.; Hao, L. Contributions of open crop straw burning emissions to PM2.5 concentrations in China. Environ. Res. Lett. 2016, 11, 014014. [Google Scholar] [CrossRef]
  31. Guan, Y.N.; Chen, G.Y.; Cheng, Z.J.; Yan, B.B.; Hou, L.A. Air pollutant emissions from straw open burning: A case study in Tianjin. Atmos. Environ. 2017, 171, 155–164. [Google Scholar] [CrossRef]
  32. Department of Environmental Protection of Heilongjiang Province. Available online: http://www.hljdep.gov.cn/xwzx/hjyw/2016/04/12292.html (accessed on 1 April 2016).
Figure 1. The study area of seven regions in China (‘No data’ means there is no data of crop residue burning in this area to be used in the following study).
Remotesensing 10 00390 g001
Figure 2. The extraction of cropland from LUCC2000, 2005, 2010, 2015 (the inset map shows the variation of cropland during this period) and the distribution of different cropland types across China.
Remotesensing 10 00390 g002
Figure 3. Maximum value composite of fire pixels in Heilongjiang Province. (a) Fire pixels of MOD14A1 fire products; (b) fire pixels of MYD14A1 fire products; (c) the results of maximum value composite of fire pixels; and (d) the extraction of crop residue burning spots from croplands in Heilongjiang Province, NEC.
Remotesensing 10 00390 g003
Figure 4. The overall trend of crop residue burning in China from 2003 to 2017.
Remotesensing 10 00390 g004
Figure 5. The trend of crop residue burning in different regions within China from 2003 to 2017.
Remotesensing 10 00390 g005
Figure 6. The monthly variations of crop residue burning in different regions of China (the left vertical axis represents the monthly number of burning spots within cropland and the right vertical axis represents the average of multi-years’ monthly number of burning spots within cropland).
Remotesensing 10 00390 g006
Figure 7. The seasonal variations of crop residue burning in different regions of China (the vertical axes represent the seasonal number of burning spots within cropland in different regions).
Remotesensing 10 00390 g007
Figure 8. Monthly variations of the spatial distribution of crop residue burning in different regions.
Remotesensing 10 00390 g008
Figure 9. Seasonal variations of the spatial distribution of crop residue burning in different regions.
Remotesensing 10 00390 g009aRemotesensing 10 00390 g009b

