Radiometric Evaluation of SNPP VIIRS Band M11 via Sub-Kilometer Intercomparison with Aqua MODIS Band 7 over Snowy Scenes


1
NOAA/NESDIS Center for Satellite Applications and Research, E/RA3, 5830 University Research Ct., College Park, MD 20740, USA
2
Cooperative Institute for Research in the Atmosphere, Colorado State University, Fort Collins, CO 80523, USA
3
Global Science and Technology, 7855 Walker Drive, Suite 200, Greenbelt, MD 20770, USA
*
Author to whom correspondence should be addressed.
Remote Sens. 2018, 10(3), 413; https://doi.org/10.3390/rs10030413
Submission received: 6 January 2018
/
Revised: 23 February 2018
/
Accepted: 28 February 2018
/
Published: 8 March 2018
Abstract
:A refined intersensor comparison study is carried out to evaluate the radiometric stability of the 2257 nm channel (M11) of the first Visible Infrared Imaging Radiometer Suite (VIIRS) aboard the Suomi National Polar-orbiting Partnership (SNPP) satellite. This study is initiated as part of the examination into the performance of key shortwave infrared (SWIR) bands for SNPP VIIRS ocean color data processing and applications, with Band M11 playing key role over turbid and inland waters. The evaluation utilizes simultaneous nadir overpasses (SNOs) to compare SNPP VIIRS Band M11 against Band 7 of the MODerate-resolution Imaging Spectroradiometer (MODIS) in the Aqua satellite over concurrently observed scenes. The standard result of the radiance comparison is a seemingly uncontrolled and inconsistent time series unsuitable for further analyses, in great contrast to other matching band-pairs whose radiometric comparisons are typically stable around 1.0 within 1% variation. The mismatching relative spectral response (RSR) between the two respective bands, with SNPP VIIRS M11 at 2225 to 2275 nm and Aqua MODIS B7 at 2125 to 2175 nm, is demonstrated to be the cause of the large variation because of the different dependence of the spectral responses of the two bands over identical scenes. A consistent radiometric comparison time series, however, can be extracted from SNO events that occur over snowy surfaces. A customized selection and analysis procedure successfully identifies the snowy scenes within the SNO events and builds a stable comparison time series. Particularly instrumental for the success of the comparison is the use of the half-kilometer spatial resolution data of Aqua MODIS B7 that significantly enhances the statistics. The final refined time series of Aqua MODIS B7 radiance over the SNPP VIIRS M11 radiance is stable at around 0.39 within 2.5% showing no evidence of drift. The radiometric ratio near 0.39 suggests the strong presence of medium-grained snow of a mixed-snow condition in those SNO scenes leading to successful comparison. The multi-year stability indicates the correctness of the on-orbit RSB calibration of SNPP VIIRS M11 whose result does not suffer from long-term drift.
Keywords:
VIIRS; SNPP; RSB; reflective solar bands; intersensor comparison; intercalibration; SNO; MODIS; band M11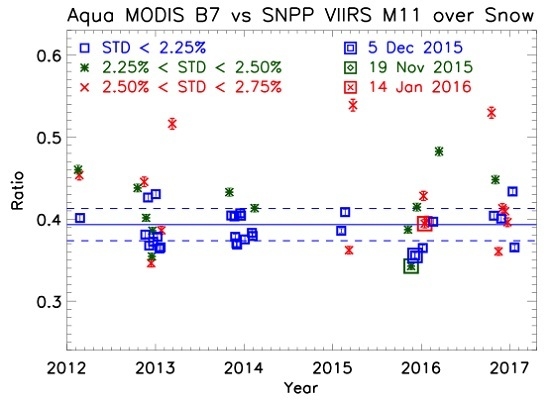
1. Introduction
Ever since the launch of the first Visible Infrared Imaging Radiometer Suite (VIIRS) aboard the Suomi National Polar-orbiting Partnership (SNPP) satellite on 28 October 2011, many efforts to evaluate the radiometric performance of its reflective solar bands (RSBs) have been carried out [1,2,3,4,5,6,7,8,9]. The evaluation is often conducted via an intersensor comparison with the well-calibrated MODerate-resolution Imaging Spectroradiometer (MODIS) instrument aboard the Aqua satellite [4,5,6,7,8,9] using the MODIS Collection 6 (C6) data release [10,11]. The similar sun-synchronous polar orbits of SNPP and Aqua satellites permit regular occurrences of simultaneous nadir overpasses (SNOs) [12,13] for a straightforward radiometric comparison. Results from earlier comparison studies have largely pointed to a long-term drift in the radiometric data of the short wavelength RSBs. However, Chu et al. [8,9], using a version of the sensor data records (SDRs) independently calibrated by Sun and Wang [14,15,16,17,18] for the NOAA Ocean Color (OC) Team, have demonstrated the radiometric stability of SNPP VIIRS RSBs M1 through M5, M7 and M8 with 1% precision or better, thus showing the on-orbit calibration to be the main issue. The comparisons for following Aqua MODIS and SNPP VIIRS RSBs—B15 versus M6, B26 versus M9, and B6 versus M10—remain unsuccessful because of the limiting performance in Aqua MODIS bands, including bad detectors and response saturation over the common SNO scenes due to smaller dynamic ranges. For these RSBs, a different approach or improved analysis will be required.
The comparison of Aqua MODIS B7 (2130 nm) versus SNPP VIIRS M11 (2257 nm), however, is especially peculiar. The examination by Chu et al. [9] has determined that bad detectors and saturation are not the limiting issues, and the comparison analysis actually generates a time series. But different from the results of other pairs, the intercomparison ratio of Aqua MODIS B7 versus SNPP VIIRS M11 instead unexpectedly varies from 0.4 to 1.4. The initial examination of the large variation points to the mismatch of the relative spectral responses (RSRs), or the spectral responses functions (SRFs), for which Aqua MODIS B7 is at 2125 to 2175 nm and SNPP VIIRS M11 is at 2225 to 2275 nm. The two respective bands, with non-overlapping RSRs, are sensing different parts of the spectrum and thus generate highly varying radiometric comparison depending on scene types. While the standard SNO analyses work for most other bands in general, the case of Aqua MODIS B7 versus SNPP VIIRS M11 eludes success. The unique and peculiar nature of the intersensor comparison of this particular band pair thus calls for a dedicated study. It is important to first point out that the Chu et al. [9] study uses the one-km spatial resolution data for all Aqua MODIS bands in a “nadir-only” approach to SNO analysis.
A refined and targeted analysis into the working of the intersensor comparison of Aqua MODIS B7 with SNPP VIIRS M11 is carried out here. While the mismatching RSRs of these two bands lead to the radiometric comparison time series with large variation, it is also found that the snowy scenes in the two Polar Regions provide some robust comparison outcomes. A procedure based on geolocation and statistics, constructed to extract within the overall time series a subset of the snowy scene-based events, successfully builds a multi-year time series that demonstrates the radiometric performance of SNPP VIIRS M11. A critical enhancement to the analysis is the use of the half-kilometer spatial resolution data for Aqua MODIS B7 to significantly improve the comparison statistics. This study thus additionally illustrates the sub-km intersensor comparison to allow more powerful statistical analyses and higher precision. Given the 750-m spatial resolution of SNPP VIIRS M11 and the 500 m spatial resolution of Aqua MODIS B7, this intersensor comparison thus operates on the 750-m spatial resolution scale as limited by the 750-m resolution of SNPP VIIRS M11, whereas the earlier Chu et al. [9] study operates on the one-km spatial resolution scale. Other methodologies to evaluate the performance of SNPP VIIRS M11 certainly can be viable, but an intersensor comparison, especially with Aqua MODIS as a reliable reference in particular for Aqua MODIS B7, remains capable of achieving good precision.
This investigation continues on the effort of the preceding study of Chu et al. [9] to evaluate the radiometric performance of SNPP VIIRS RSBs as part of the examination of the key bands for VIIRS OC applications [19,20,21,22,23], specifically about the correctness of the on-orbit calibration and the eventual stability of the radiometric data. SNPP VIIRS M11 is among the shortwave infrared (SWIR) bands [24,25] important for applications over turbid coastal and inland waters. Other examples of the use of SNPP VIIRS M11 include its application in aerosol retrievals [26,27,28]. It is worth to clarify that the examination is carried out at the level of the instrument performance, calibration and sensor data, and is not reliant on any science products or retrievals. In addition, it is worthy to emphasize that an intersensor comparison analysis evaluates the performance of the on-orbit calibration of the sensor data post-launch, particularly their stability. Thus, this work evaluates the performance of the on-orbit calibration of SNPP VIIRS M11 relative to Aqua MODIS B7.
The rest of the paper is organized as follows. In Section 2, the general methodology and the targeted analysis procedure including numerous intermediate results for Aqua MODIS B7 versus SNPP VIIRS M11 are presented. In Section 3, comparison time series are shown, and the result shows the stable performance of SNPP VIIRS M11 over the entire mission up to date. In Section 4, discussions are provided to make explicit some subtle but impactful issues, in particular, concerning the mismatching RSR. In Section 5, summary and conclusions are provided.
2. Procedures and Data Analysis
The procedure for determining precise nadir-matching SNO events follows identically that of Chu et al. [9]. Only those precise SNO events within a single pixel of matching nadir with a very short time difference are permitted. The daily SNO information for SNPP and Aqua satellites, based on the Simplified General Perturbation (SGP) models algorithm [29], is directly taken from the National Calibration Center [30]. In each qualified SNO event, the “nadir-only” condition is realized via a small sized area centered on the nadir crossing. Within the area, the pixel-by-pixel match of collocated pairs is made for comparison analysis. The “nadir-only” restriction is designed to eliminate effects associated with larger areas and angles such as the response-versus-angle (RVS) effect of the scan mirror and the bidirectional reflectance distribution factor (BRDF) of the SNO scenes. Although these effects such as RVS are important issues for the overall calibration of sensor data, they are not part of the on-orbit operation that calibrates the band performance. They are instead characterized separately and in addition, if needed, to the standard on-orbit calibration of the bands for the sensor data as a whole.
For each Aqua MODIS B7 pixel, at 500-m spatial resolution, the unique corresponding 750-m spatial resolution SNPP VIIRS M11 pixel is determined via geolocation matching. The radiometric comparison ratio corresponding to the pair of matching pixels is computed as the radiance of the Aqua MODIS B7 pixel over that of the SNPP VIIRS M11 pixel. The average and the standard deviation (STD) are computed from the collection of all qualified pixel-based comparison ratios to represent the comparison ratio and the precision of the event.
Due to the difficulty as previously mentioned, numerous adjustments and non-standard tailor-made intermediate analyses for this intersensor comparison are necessary. The key enhancements for this work include the use of the half-km spatial-resolution data of Aqua MODIS, a different use of the homogeneity information, and the targeted procedure to extract the snowy scene-based events. The key procedural details and intermediate results leading to the final comparison time series are shown step by step.
2.1. The Use of the NOAA IDPS and Ocean Color Team-Generated SDRs
The official operational release of SDRs for SNPP VIIRS comes form the Interface Data Processing Segment (IDPS). However, an independent SDR version generated by the NOAA OC team has achieved significantly superior calibration for the RSBs [14,15,16,17,18,31] having corrected for an inherent worsening calibration bias within the standard on-orbit calibration methodology. The worsening error in the IDPS SDRs is particularly pronounced for bands M1 through M4. The “nadir-only” intersensor comparison study referencing to Aqua MODIS carried out by Chu et al. [8,9] clearly shows the superior on-orbit calibration performance of the OC SDR version for SNPP VIIRS M1 through M8—overall agreement with Aqua MODIS, smooth and stable time series and stable trends devoid of long-term drift. The improvements are most dramatic in the shortest wavelengths, but lessen toward longer wavelengths. In fact, SNPP VIIRS Bands M7 and M8 demonstrate only minute differences between the two SDR versions [8,9]. For SNPP VIIRS M11 in this study, the radiometric performance of these two different versions is expected to be effectively identical. That is, the systematic and worsening calibration bias mentioned above is expected to be very small near 2257 nm, where SNPP VIIRS M11 operates. Thus the primary emphasis here is to show that the on-orbit RSB calibration works well for SNPP VIIRS M11 and that both the IDPS and the OC version well agree. The performance of the SWIR bands, in general, are expected to be very stable for both Aqua MODIS and SNPP VIIRS without further need for mitigation, for as long as standard on-orbit calibration operations are properly carried out.
2.2. General SNO Procedure, Half-km Resolution Data and Comparison Scene Size
An illustration of a precise SNO event is shown in Figure 1 [9]. The 5-minute Aqua MODIS granule is shown in dashed boundaries and the matching SNPP VIIRS granules, each with 86-second coverage, are shown in solid boundaries. The dashed lines running along the granule center trace the two flight tracks, and the small red square near the middle shows a 36-km square region centered at the nadir crossing. If the moderate spatial resolution data of SNPP VIIRS at 750 m and Aqua MODIS at 1 km are used, a single qualified SNO event over a 36-km square area will have 1296 collocated pixel pairs available for sampling analysis.
As the intersensor comparison of Aqua MODIS B7 with SNPP VIIRS M11 is inherently highly variable and much noisier than other pairs, two options to improve the statistics can be exercised. The first option is to increase the size of the comparison area. For example, extending to a 48-km spatial scale will increase the maximum number of matching pairs of pixels to 2304, about two-fold increase. The second option, given that Aqua MODIS B7 is an imagery band with half-km native spatial resolution, is to use the half-km data instead of the aggregated 1-km data. In the second option, the number of possible matching pixel pairs is instead set by VIIRS, due to its lower spatial resolution at 750 m, to be 2304 as well. Although the two options appear equivalent in terms of statistical enhancement, the use of the half-km data is the correct way of the two to enhance statistics, as will be demonstrated later. Indeed, the earlier study by Chu et al. [9], which uses the 1-km data of Aqua MODIS RSBs, can find only about 10 sufficiently robust events for Aqua MODIS B7 versus SNPP VIIRS M11 over five years of SNPP mission, falling far short of hundreds of events as for other band pairs. Thus, any enhancements to improve statistics are much needed. With the 750-m resolution of SNPP VIIRS M11 and 500-m resolution of Aqua MODIS B7, this study thus operates in the 750-m spatial resolution regime. Although the pixel sizes slightly differ, the homogeneity criteria to be described below ensures the immediate surrounding area around the scene of the pixels are of similar radiance within the criteria. For completeness and comparisons, SNO analyses are carried out using the 36-km, 54-km, 80-km and160-km square comparison areas.
2.3. Homogeneity and Population Size
The homogeneity criterion is a primary selection filter first intended to be applied to each pixel of the radiance data to select only well-behaved pixels in each SNO event. These well-behaved pixels correspond to sub-areas of the SNO scene with spatially homogenous radiometric property. The homogeneity of each pixel is represented by its percentage STD calculated using the pixel itself and its eight neighbors. A 4.5% homogeneity cutoff can be imposed for selection, but turns out to be unnecessary for this analysis. In contrast to Chu et al. [9], the use of the half-km data of Aqua MODIS Band 7 in this study significantly expands the number of pixels that are homogeneous, and subsequently almost all events with more than 1000 pixels end up containing more than 1000 clean pixels under 4.5% homogeneity. This fortuitous finding simplifies the application of the homogeneity and the population sample size criteria to be uniformly imposed to each SNO event. It is sufficient to select 1000 of the most homogeneous pixel pairs to compute the population average and the STD representing the radiometric comparison ratio and its error bar, or precision, of the event. The use of the half-km resolution data of Aqua MODIS thus enables a smarter selection process that entirely eliminates a hard cut of homogeneity and simplifies the population size requirement to be set at 1000 for all cases. It is worth noting that including more pixel pairs beyond 1000 will not necessarily improve statistics because the additional pairs are of worse homogeneity quality. The choice of 1000 is made as a balance between sample size and the eventual precision.
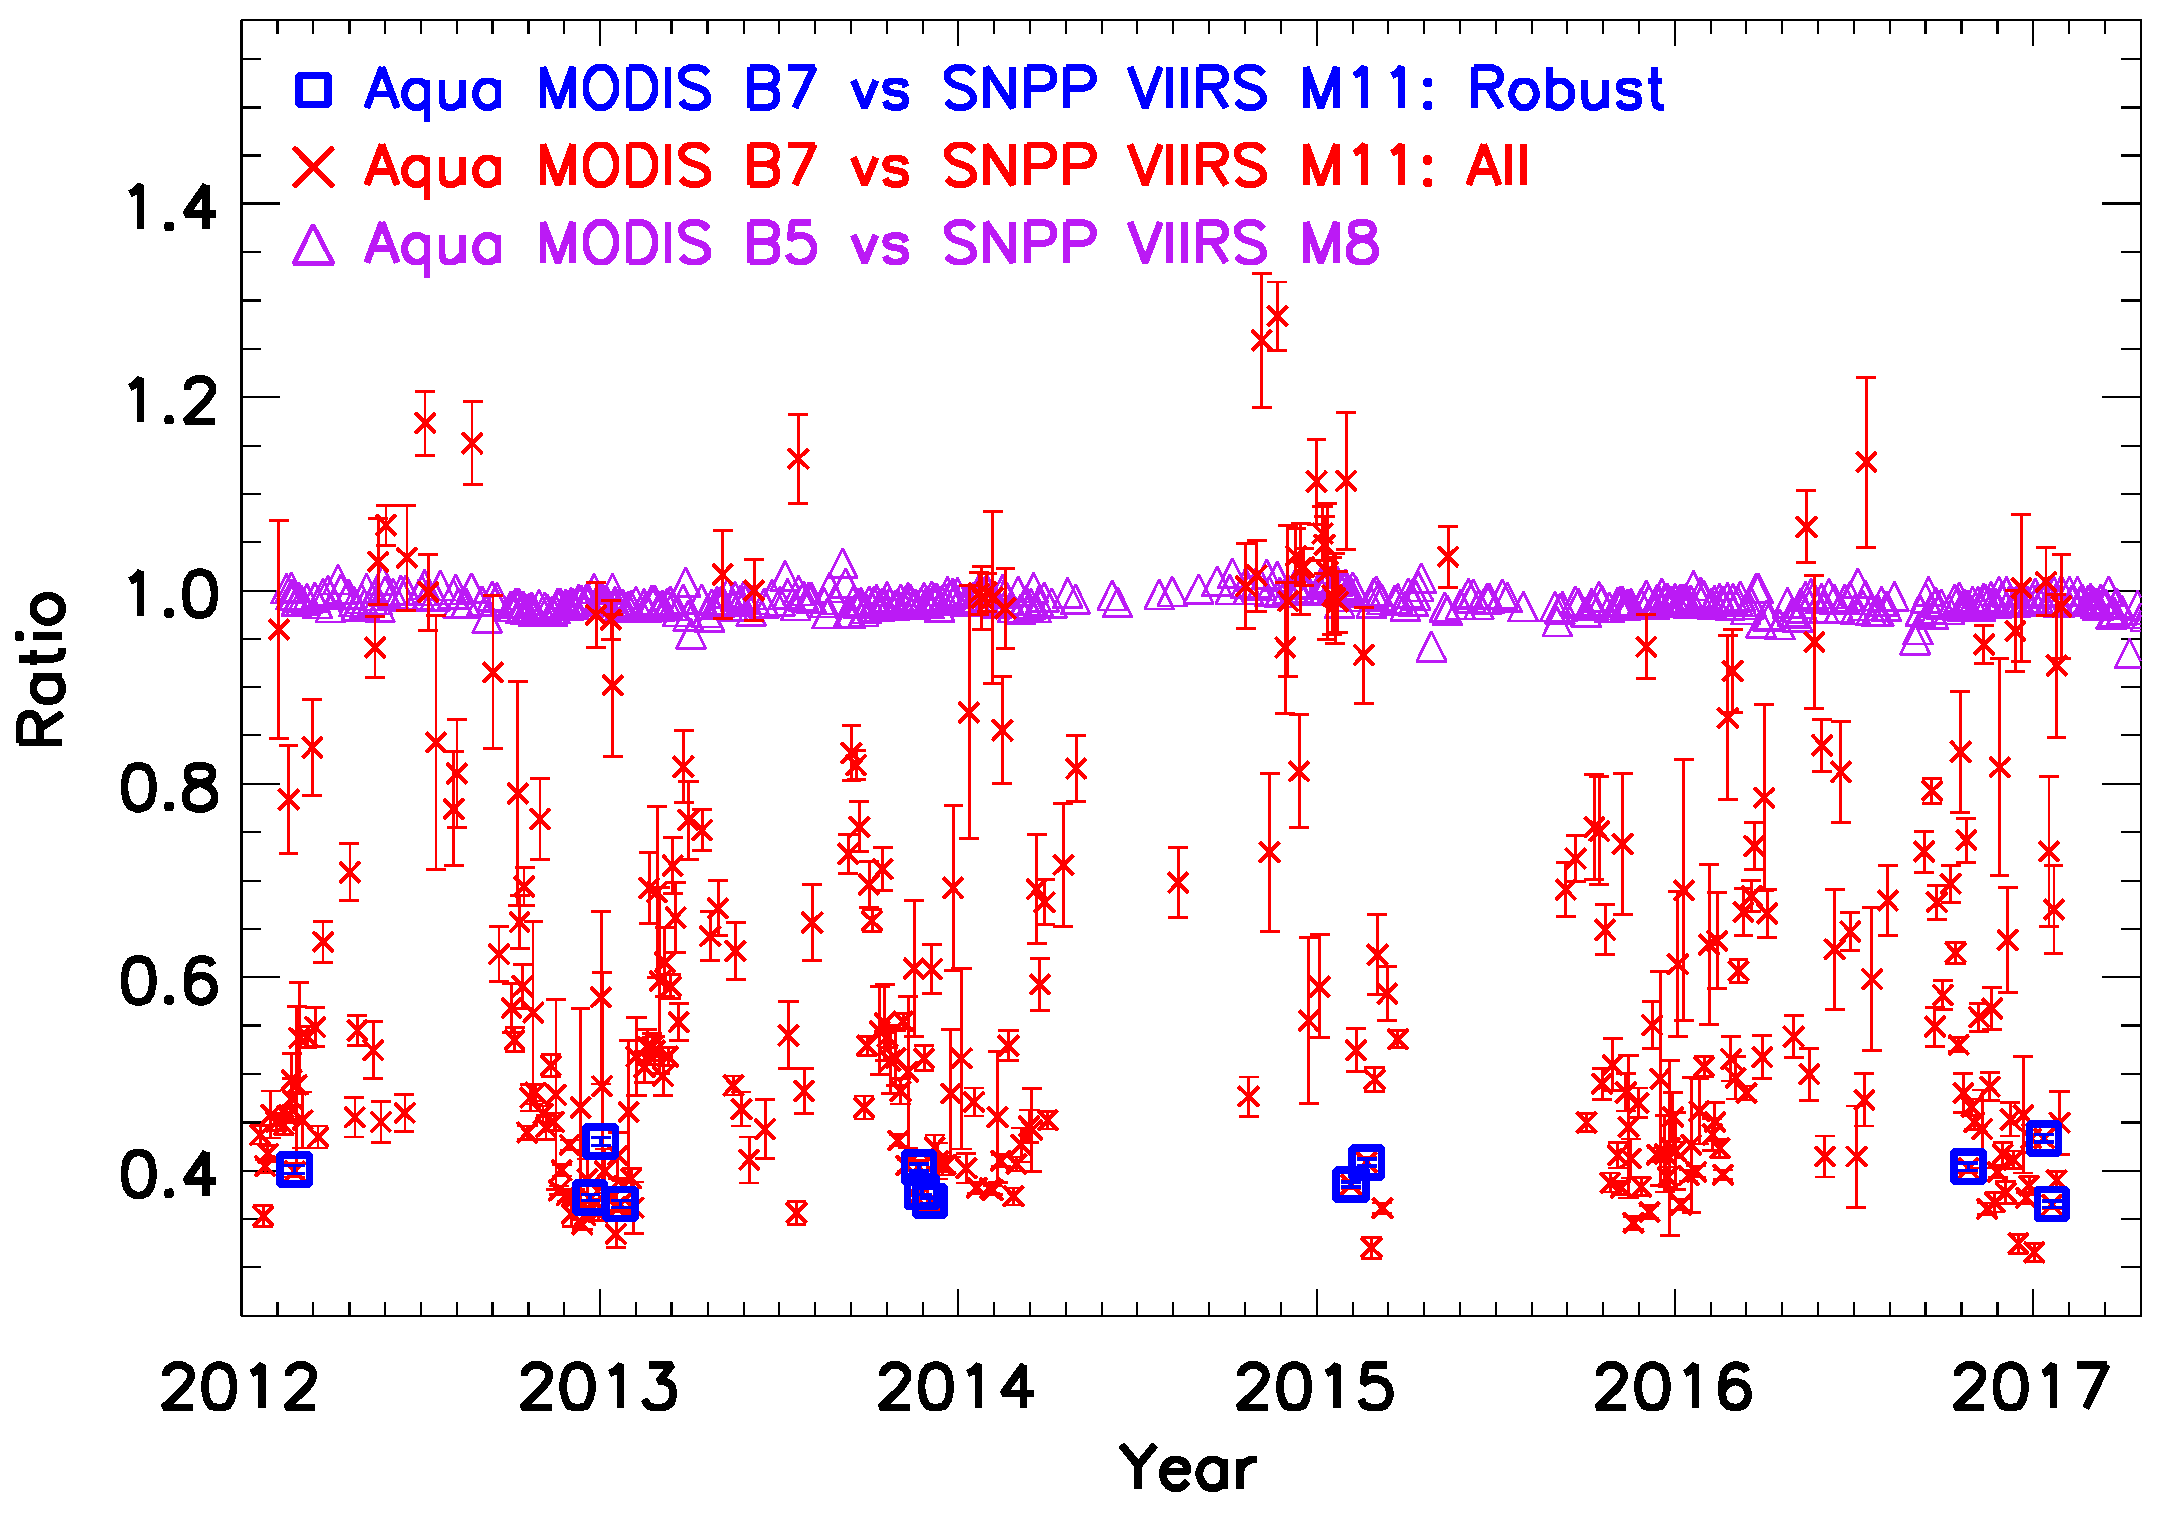
An unrefined comparison time series of Aqua MODIS B7 versus SNPP VIIRS M11 is shown in Figure 2 in red cross symbols. All events with sample size greater than 50 are included to illustrate the large variation from 0.3 to 1.4 that signifies an underlying cause not explainable by statistical variation alone. However, amid the randomness and the large scatter, some seasonal patterns as well as clustering around 0.4 and 1.0 can be seen. Those rare events of the most robust statistics, with sample size greater than 1000 and precision under 2.0%, are shown in blue square symbols. The remarkable fact that they consistently straddle near the bottom of the ratio range at near 0.4 strongly suggests a commonality, such as scene conditions, underpinning these robust outcomes. For contrast, the very tight time series of Aqua MODIS B5 (1240 nm) versus SNPP VIIRS M8 (1238 nm) comparison is displayed in purple triangle symbols, demonstrating its very stable and precise result at around unity.
2.4. Geolocation Constraint for Snowy Scenes
An examination of SNO event geolocation reveals a connection to the pattern of the time series displayed in Figure 2. The SNOs for SNPP VIIRS versus Aqua MODIS occur over Polar Regions, as shown in Figure 3, and a significant portion of these events occurs over snowy surfaces of Greenland or Antarctica. The distribution of the radiometric comparison ratios by geolocation, shown in Figure 3, makes explicitly clear that those rare robust events in Figure 2 with ratio around 0.4, represented by blue square symbols in both figures, occur over icy surfaces. This establishes a strong case for snowy scenes as viable agents of robust radiometric comparison. Specifically, the snow scenes over lands are seen to be the most conducive for radiometric comparison.
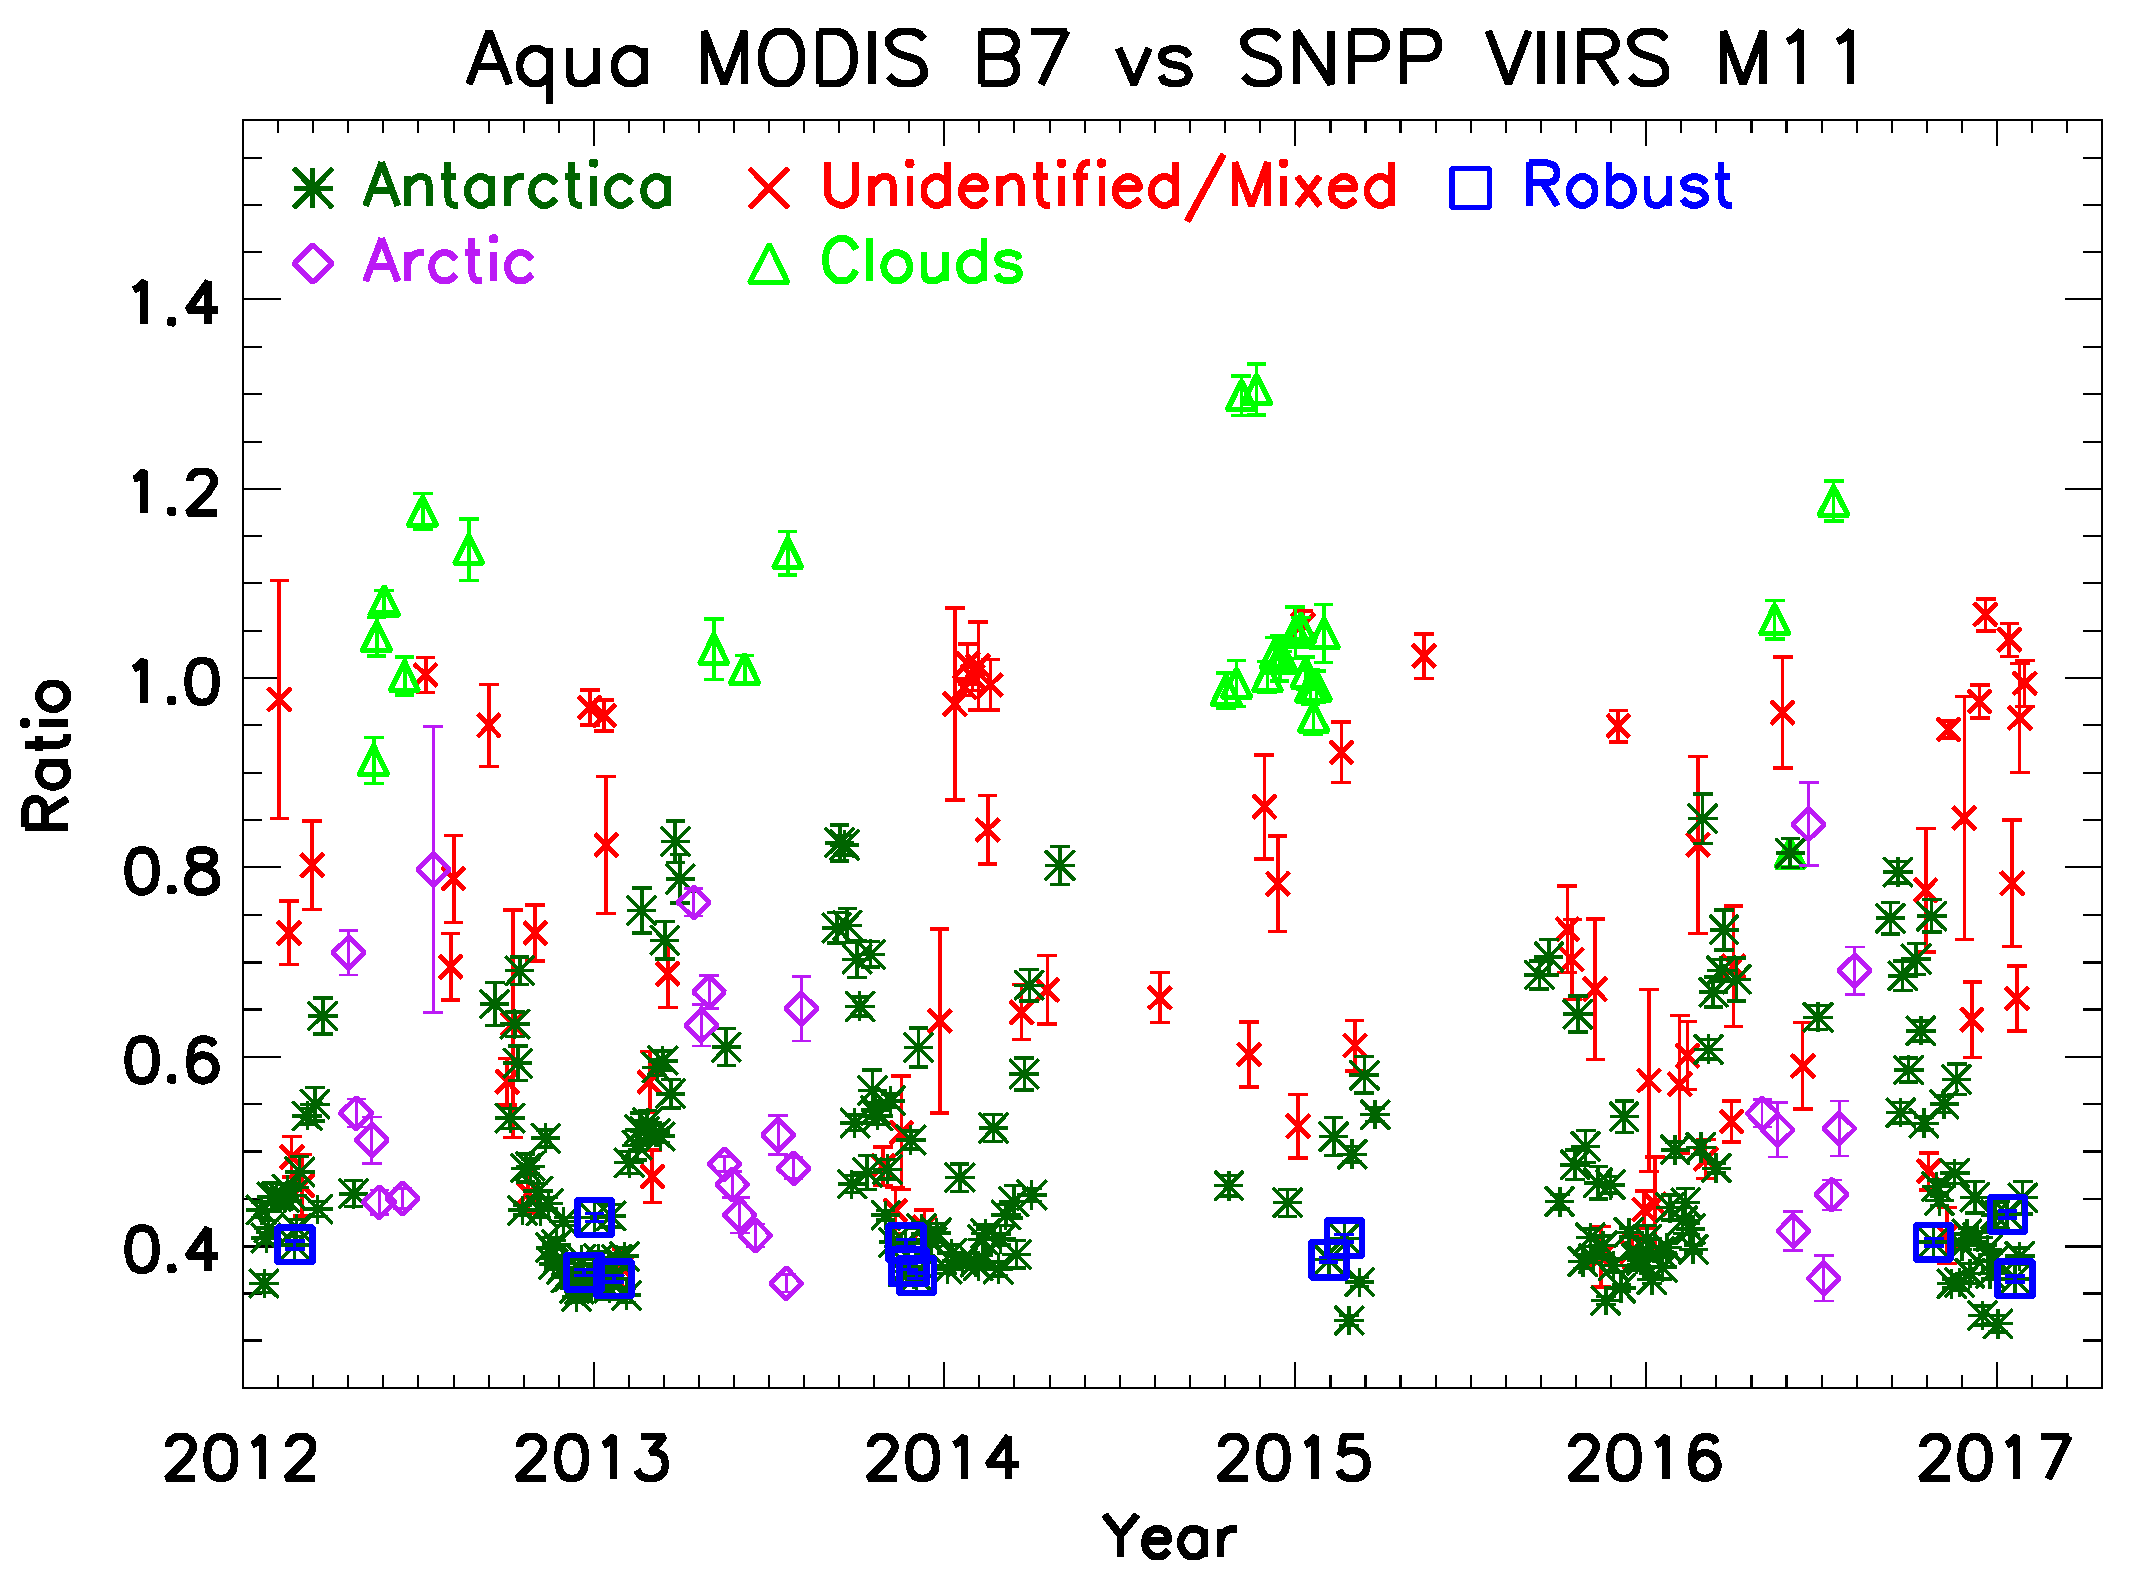
The distribution of those low-valued radiometric comparison ratios can be seen to fall into four distinctive geolocation groups: One group over Greenland in the northern polar region, and three separate groups over Antarctica. A straightforward geolocation constraint can be applied as the first step in the selection and filtering procedure for SNO events over snowy or icy surfaces:
- Group 1—‘Antarctica 1’: Latitude < −62°, −10° < Longitude < 63°
- Group 2—‘Antarctica 2’: Latitude < −71°, 90° < Longitude < 180°
- Group 3—‘Antarctica 3’: Latitude < −63°, −155° < Longitude < −40°
- Group 4—‘Greenland’: −50° < Latitude, −80° < Longitude < −20°
While this geolocation constraint does not guarantee snowy scenes given the possible presence of clouds or other contaminating conditions, an additional selection procedure directly examining the radiometric comparison ratio, to be described later, will help to make a more definitive identification. The success of the analysis critically relies on a reliable isolation of those SNO events over snowy land scenes that can be used for comparison analysis.
Figure 4 is a representation of the unrefined comparison time series by various groupings. Most notably those events with lower comparison ratio values below 0.8 are seen to occur primarily over the two Polar Regions, Antarctica in green star symbols or the Arctic in purple diamond symbols. Those events of the strongest statistics (blue squares) are clearly seen to be among those events over the Artic or Antarctica. Furthermore, the most robust events are seen to occur near the beginning or the end of the year, putting an additional seasonal connection in the mix.
2.5. Bi-Group Ratio Analysis
A frequency distribution of ratio shown in Figure 5 further illuminates the phenomenon underlying the intersensor comparison of Aqua MODI B7 and SNPP VIIRS M11. Bimodality can be seen near 0.4 and 1.0 in the plot, with the major mode around 0.4 to be the dominant of the two. The two modes show clear qualitative difference, with the major mode being closer to a Poisson distribution, i.e., with a tail to the right, and the minor mode being closer to a normal distribution.
The observed bimodality is indicative of two dominant scene types being observed by the sensors. This comes from the different spectral coverage of the two bands, in this case actually completely non-overlapping, picking up relatively different radiometric responses depending on the scenes. Figure 3 above has already illustrated a clear connection between low-valued radiometric comparison ratios and icy or snowy surfaces of Greenland or Antarctica. The clustering around 1.0 has been examined to come primarily from cloudy conditions by a combination of facts and checks. Figure 3 shows many of these events occur outside the snowy land regions, and a quick examination of a few events confirms higher radiances and cloudy conditions that are certainly not views of the ocean surface. This is also expected since these channels at around 2200 nm are designed for cloud detection. Nevertheless, because cloudy scenes are not sufficiently homogeneous to generate robust results, they are regarded as contaminations for removal.
Since cloudy or other obstructing atmospheric conditions can still occur over Antarctica or Greenland, the geolocation constraint alone is not sufficient. Furthermore, Figure 5 also exhibits a continuous gradation of radiometric comparison ratio in the interval from 0.4 to 0.9, as already pointed out previously to be a characteristic of a Poisson-like distribution, pointing to the possible existence of a finer variety of snow types giving rise to similar yet modestly different radiometric comparison results. A direct examination of the individual pixel-based ratios, based on the bimodal distribution behavior, within each SNO scene can help to identify those pixels of the most dominant snow type. The most straightforward approach is to impose a hard ratio cutoff to separate off the contaminated pixels. The distribution of the ratio in Figure 5 shows 0.6 to be a good separation point to isolate the major mode centering at 0.4. In each SNO event, applying an additional cut to eliminate all pixels that give rise to a pixel-based comparison ratio higher than 0.6 would leave the remaining population of pixel-based ratios under 0.6 for analysis. Numerous SNO events that otherwise would fail under the standard analysis due to partial contamination by clouds or mixed snow types are instead salvaged and made successful by this clean up process.
2.6. The Precision Analysis and the Scaling Phenomenon
The earlier study of Chu et al. [9] has uncovered an interesting “scaling phenomenon” that prevents the use of larger areas to improve comparison statistics, contrary to common expectation. The same phenomenon exists in Aqua MODIS B7 versus SNPP VIIRS M11 result. Figure 6 displays the four unrefined scatter plots of precision, or error bar of radiometric comparison ratio, versus sample size for all SNO results of 36-km, 54-km, 80-km and 160-km square comparison areas. The four plots have different horizontal scales, but their near identical scatter pattern in relative scales is evident, thus proving the empirical fact that larger comparison areas do not generate better statistics. For example, the sample size of 6000 in the 80-km square area generate a similar precision result as those of sample size of 1200 in the 36-km square area. The precision versus sample size result alone can warrant much discussion, but the central point is that enlarging comparison area size to generate more matching pixel-pairs actually does not improve statistics as one might expect. Has this not been the case, the evaluation of Aqua MODIS B7 versus SNPP VIIRS M11 at the 1-km spatial resolution could have succeeded by simply resorting to a larger area. The existence of “scaling phenomenon”, in simple terms, means that going to larger area cannot tighten the precision of any comparison events or increase the number of robust outcomes, and subsequently cannot improve the time series. All RSB comparisons of SNPP VIIRS and Aqua MODIS suffer this effect, but Aqua MODIS B7 versus SNPP VIIRS M11 uniquely suffers from extreme high variability and noise that thoroughly fail the analysis at the 1-km spatial resolution. This scaling phenomenon may be a worthy topic for more in-depth examinations.
The use of the half-km spatial resolution Aqua MODIS B7 data, together with a more intelligently constructed selection procedure based on homogeneity, turns out to be the key ingredient to a successful evaluation, by measuring in smaller spatial size to find more homogeneous sub-scenes of the size 0.75 × 0.75 km-square without expanding to greater area. In the examination of each SNO scene, to be specific, the important statistical threshold to achieve is a sample size of 1000 matching pairs of clean pixels in order to achieve robust statistics. The use of the higher resolution data pushes numerous SNO events over this threshold to enable valid comparison time series to be built up. Still, the results are of much lower statistical quality in comparison to other band pairs. For example, it is seen in Figure 5 that the precision ranges from 0.01 to about 0.25, about an order of magnitude worse than the RSBs M1−M8 results [9]. The variability, or precision, presumably is also significantly worsened by the mismatching RSRs, but it is in any case clear that a more intelligent and a targeted analysis is required due to the more challenging situation.
2.7. The General SNO-Based Comparison and the Issue of the Matching RSRs
The above preliminary data analysis expands the current understanding of the working of intersensor comparison by exposing additional possibilities. In general, the SNO approach works by matching spectrally similar bands in radiometric comparison such that the two bands in comparison observe same earth scenes within a similar spectral range. In the ideal case where the two bands have identically matching RSRs, and provided that they are correctly calibrated, the resulting comparison ratios should be close to 1.0. In reality, most spectrally matching band pairs have sufficient overlap of spectral coverage for their observations of SNO scenes to register sufficiently similar radiometric readings, but small differences on the order of a few percent still can exist due to their slight spectral mismatch of RSRs. The deviation in the radiometric comparison is greater for cases where the two RSRs show greater differences. Nevertheless, as exemplified by various previous intersensor comparison studies for SNPP VIIRS versus Aqua MODIS [4,5,6,7,8,9], although many band pairs are known to have non-trivial RSR differences, they still achieve clear and usable comparison results, presumably since their RSRs still overlap and the resulting differences are not overly significant.
The case of non-overlapping RSRs in the direct intersensor comparison of radiometric data is a novelty. While comparison of two bands operating in entirely different spectral ranges appears not sensible due to strong scene dependency, the case for two bands operating in proximity of each other’s spectral range, such as Aqua MODIS B7 versus SNPP VIIRS M11, may still be practicable. Under favorable and some restrictive scene conditions, the two bands may be able to register responses that are consistent with each other to generate a time series with sufficient precision. It is worth to note that Aqua MODIS B7 versus SNPP VIIRS M11 is considered a spectral match, such as pointed out by Bhatt et al. [1], precisely because of the closeness of their spectral coverage even if non-overlapping. Results shown in Figure 2, Figure 3, Figure 4 and Figure 5 have already revealed a possible single snowy-scene type in which the radiometric comparison of these two bands can generate consistent ratios at around 0.4, and this study is to explicitly demonstrate a refined intersensor comparison is possible. A stable comparison time series, regardless of the absolute value, ultimately supports the long-term correctness of the standard on-orbit calibration operating post-launch.
3. Results
Comparison Time Series Results
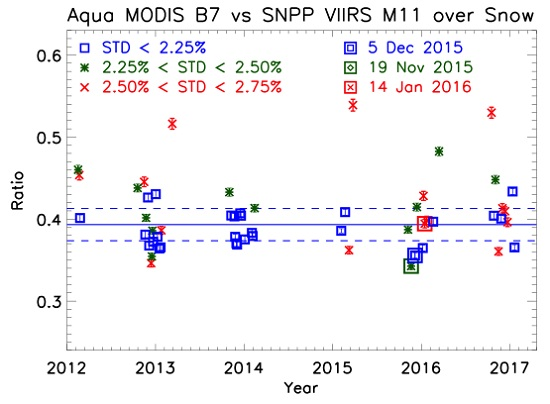
Time series are constructed based on the precision, or the error bar, of the individual SNO events. It has been studied and determined that the set of those SNO events with precision of radiometric comparison ratio, using radiance data as described above, under 2.25% generates the best time series. The comparison ratio, to state again, is computed as Aqua MODIS B7 radiance over SNPP VIIRS M11 radiance. The refined radiometric comparison time series of the 54-km spatial scale is shown in Figure 7 as the representative result due to its most consistent statistics. The error bars are shown by the tick marks above and below each symbol. The results of the IDPS-based and OC-based time series, with differences of only about 0.1% between corresponding events, are virtually indistinguishable for this scale. Thus only the OC-based time series are shown. The blue squares, in particulars, show the 27 events of the most robust statistics, with each SNO event having precision under 2.25% and sample size greater than 1000, clearly anchoring a stable and flat multi-year time series around 0.39. The two subsets of successive precision stratification in the interval of 0.25%, from 2.25% to 2.5% and 2.5% to 2.75%, are shown, respectively, in green diamond and red cross symbols. The 0.25% stratification is used for clarity of illustration only, but the summary statistics will instead use simple upper precision cuts to be shown later. The blue solid line shows the time series mean of all ratios with precision under 2.25%, and the two dashed lines mark the 5% range above and below the time series mean. It is shown that the 2.25%-precision set demonstrates the best time series, as expected, with successive sets of more relaxed precisions showing more scatter. Although the number of successful outcomes is still not high, it is nevertheless sufficient and balanced enough to demonstrate a stable and flat time series with clear statistics.
Time series are constructed based on the precision, or the error bar, of the individual SNO events. It has been studied and determined that the set of those SNO events with precision of radiometric comparison ratio, using radiance data as described above, under 2.25% generates the best time series. The comparison ratio, to state again, is computed as Aqua MODIS B7 radiance over SNPP VIIRS M11 radiance. The refined radiometric comparison time series of the 54-km spatial scale is shown in Figure 7 as the representative result due to its most consistent statistics. The error bars are shown by the tick marks above and below each symbol. The results of the IDPS-based and OC-based time series, with differences of only about 0.1% between corresponding events, are virtually indistinguishable for this scale. Thus only the OC-based time series are shown. The blue squares, in particulars, show the 27 events of the most robust statistics, with each SNO event having precision under 2.25% and sample size greater than 1000, clearly anchoring a stable and flat multi-year time series around 0.39. The two subsets of successive precision stratification in the interval of 0.25%, from 2.25% to 2.5% and 2.5% to 2.75%, are shown, respectively, in green diamond and red cross symbols. The 0.25% stratification is used for clarity of illustration only, but the summary statistics will instead use simple upper precision cuts to be shown later. The blue solid line shows the time series mean of all ratios with precision under 2.25%, and the two dashed lines mark the 5% range above and below the time series mean. It is shown that the 2.25%-precision set demonstrates the best time series, as expected, with successive sets of more relaxed precisions showing more scatter. Although the number of successful outcomes is still not high, it is nevertheless sufficient and balanced enough to demonstrate a stable and flat time series with clear statistics.
Table 1 summarizes the statistics of the comparison time series for the five-year period from January 2012 to February 2017 for the three levels of precision. The result from the 36-km, 54-km and 80-km spatial scales is shown for each precision level. Slightly different from standard comparison analyses, the inferences and the conclusions here made are not from any single time series but an examination of all. The “spread” or scatter in the fourth column is a measure of the variation of the time series as a whole, typically measuring the magnitude of the change or the variation in the time series over time, and is represented by the STD computed using all ratios within each time series. The term “spread” is here used, however, instead of “scatter” because of the peculiarity in Aqua MODIS B7 versus SNPP VIIRS M11, showing not how the trend changes temporally or demonstrating large random variation, but that the time series, even when precise, show inherently distinct comparison ratios, as can be seen in Figure 7. The spread thus is not of true random variation but of a physical effect of varying scene reflectance. The overall statistical quality of the time series, or the time series precision, is represented by the average of all error bars in the time series, or the precision values of all events in the time series. The slope of the linear fit represents the five-year drift.
The 2.25%-precision set shows a consistent series ratio mean at around 0.39, and its time series spread and precision are also consistent with each other at around 2%. It can be seen as in Figure 7 that the under-2.5% and under-2.75% sets include higher-valued ratios in the time series. In fact, each successive and more relaxed precision threshold from 2.25% to 2.75% includes more and more higher-valued ratios. The spread of the time series therefore increases from close to 2% to up to 5% when the event precision selection criterion is increased from 2.25% to 2.75%. This strongly suggests that snowy scene conditions of different reflectance are further stratified by statistics. For example, one may create a model describing how one particular snow type can generate the best measurement statistics due to its physical properties. The standard expectation of statistical variation, i.e., with precision ~2%, generating random outcomes cannot provide an adequate explanation for the behavior of the time-series spread. The summary statistics for all spatial scales point to a consistent best outcome, with ratios at around 0.39 and times series precision at around 2%. Nevertheless, all time series maintain multi-year stability with no obvious drift. The five-year drift varies from about −2% to +2% but is overall consistent with 0% drift, as is the case for the under 2.25% precision time series. Since the number of successful ratios in the time series remains small, from 23 to 56, the statistical variation in the five-year drift due to a single sample is consistent with ~2%.
It can be argued that the 2.25%-precision result from the 54-km scale, the blue square symbols in Figure 7, best represents the Aqua MODIS B7 and SNPP VIIRS M11 radiometric comparison. Its statistics are the most consistent and, most importantly, its spread and precision are well matched at close to 2.0%. This notable statistical consistency supports the inference that the spread of the ratios in this case indeed comes from statistics, meaning the natural random variation quantified by its precision. For the 2.25%-precision set, results from all three spatial scales tell a similar and consistent story at near 2% for both time-series spread and precision. This overall consistency between the time-series spread and precision indicates the isolation of a single snow or ice type that provides the highest quality scene response in the spectral range of 2125 to 2275 nm, where Aqua MODIS B7 and SNPP VIIRS M11 operate. The procedure employed here likely has picked out a single sample type; the resultant statistics are consistent with such. Beyond the 2.25% precision threshold, the radiometric comparison picks up more higher-valued ratios leading to larger spread, and the time series as a whole becomes less consistent, showing that additional snow types with distinctively different reflectance at the different spectral ranges of the two instruments are being mixed in.
The “scaling phenomenon” seen in Figure 6 is captured and quantified in the summary statistics. Within each precision selection level (first column), the time-series spread (fourth column) and the time-series precision (fifth column) can be seen to show no obvious improvement with larger comparison area. For example, for the 2.25% precision level, all three spatial scales generate similar statistical quality at ~2% for time-series spread as well as time-series precision. This makes clear that enlarging the comparison area does not improve statistics, and instead the success of this analysis comes directly from using higher spatial resolution, the half-km data of Aqua MODIS.
Although there are a total of 27 points in Figure 7 with precision under 2.25% (blue square symbols), it can be seen from Figure 2 and Figure 4 that many more SNO events over snowy scenes exist. Potentially, many of these events can still be made successful via further improvement. Stronger analyses certainly can be explored in future studies.
The result justifies the imposition of the 0.6 ratio threshold that is applied within each SNO event as described in Section 2. The final time series stay significantly below 0.6, proving the procedure to be effective in removing contamination but not interfering with those events of the most robust results assumed to be of snowy scenes. Interestingly, no SNO events over Greenland are sufficiently robust and thus none appears in the plot. Nevertheless, all Greenland results are at about 5% precision on the whole and still are of higher quality than those of cloudy scenes.
4. Discussion
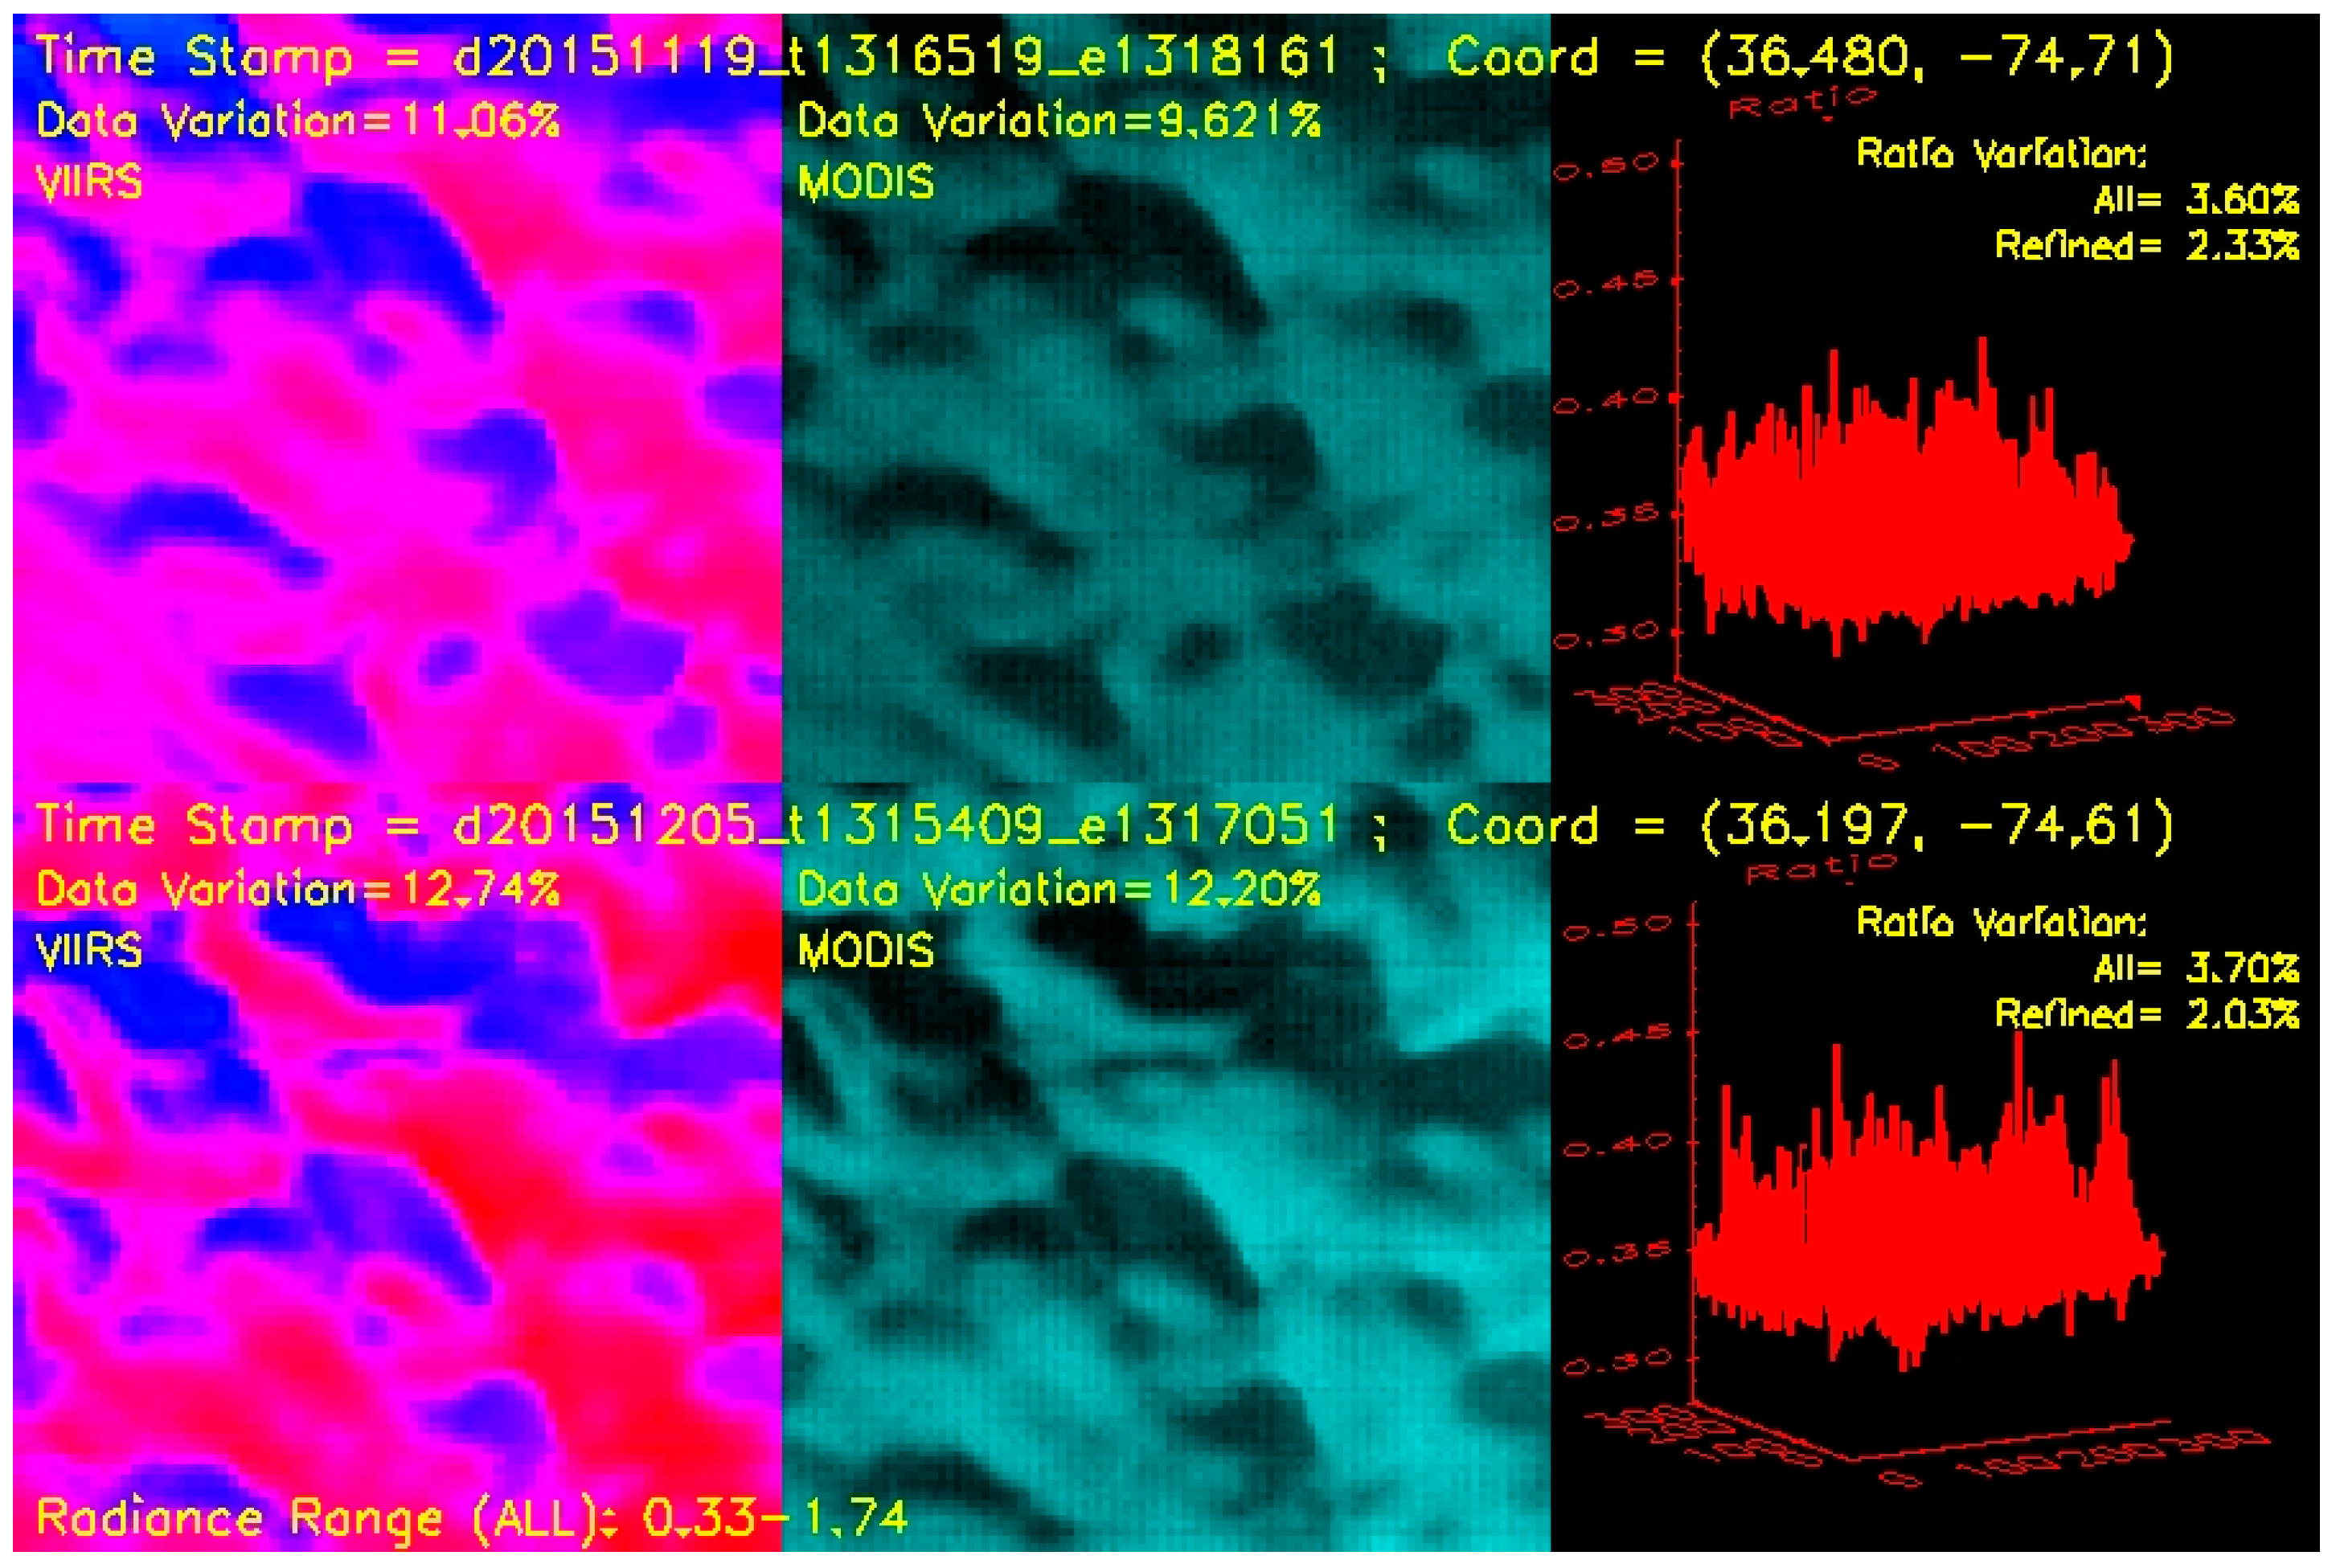
In the preceding study by Chu et al. [9], the 14 January 2016 SNO event was shown to occur over Antarctica with a clear-sky condition, consistent with the high statistical quality found for SNPP VIIRS M1−M8 for that event. The same event also appears in the Aqua MODIS B7 versus SNPP VIIRS M11 comparison, showing in Figure 7 as the red cross-in-square symbol near the year 2016 tick mark. This clear-scene condition means that both Aqua MODIS B7 and SNPP VIIRS M11 are observing some ground feature for the same event. Its precision of the radiometric comparison ratio is 2.57%, hence a member of the red-cross time series in Figure 7. In general, robust statistics are typical of clear-day condition and therefore the associated observations are expected to be of ground surface features. Figure 8 illustrates the imageries of two successful SNO comparison events, on 19 November 2015 (top row) and the 5 December 2015 (bottom row) nearly exactly 16 days apart, at a scene around 36.2° longitude and −74.6° latitude. It can be seen from the images that both Aqua MODIS B7 and SNPP VIIRS M11 observed identical ground features during these two SNO events, indicative of clear sky conditions. It is both interesting and worthwhile to point out that these two polar-orbiting sun-synchronous satellites follow a 16-day repeat cycle with very close equator crossing time, and these two SNO matching results illustrate the very high flight precision under which they operate. The MODIS image is 108 × 108 pixels while VIIRS image is 72 × 72 pixels for the 54 × 54 km-square region of comparison. The color scale of the images is intended for illustration and not as true color. The images from both sensors being of identical ground scene prove also that the SNO scene-matching procedure conducted by this analysis works correctly. The precision of the 19 November 2015 event is 2.33% while for the 5 December 2015 event is 2.03%, showing in Figure 7 as the dark green diamond-in-square symbol and the blue square-in-square symbol, respectively.
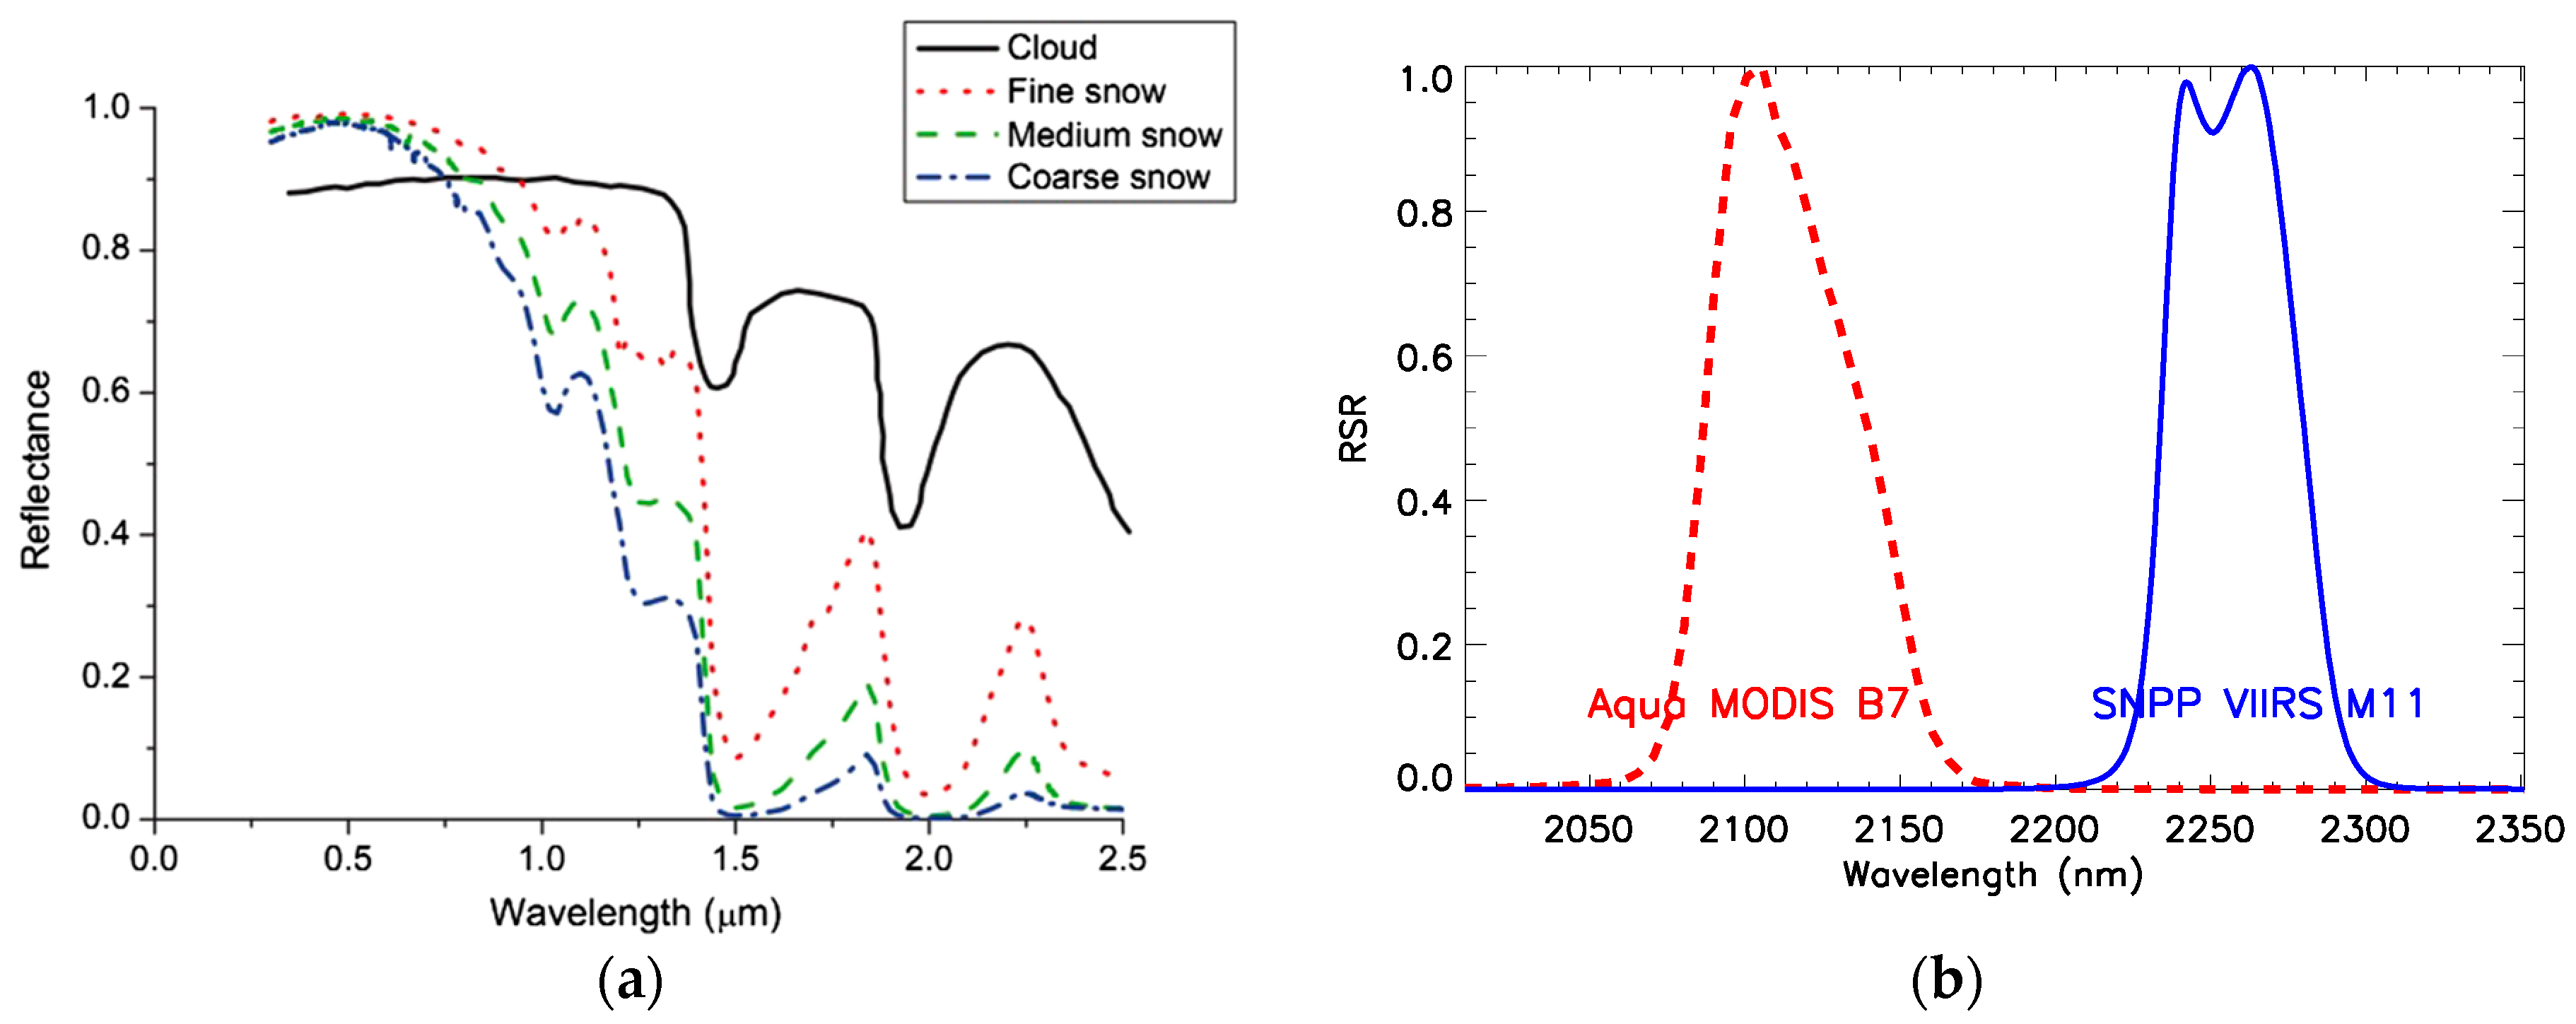
In comparison to precise SNPP VIIRS M1−M8 results that achieve ~1% variation [9], the refined time series for SNPP VIIRS M11 still spreads by as much as up to ~5%, which is inconsistent with the averaged precision of the SNO events at ~2%. It is noted again that the analysis has been carried out using radiance, but a quick examination into the snow reflectance can clarify some findings, and for this purpose a spectral reflectance chart in Figure 9a from Shahabi et al. [32] and the RSRs for the two bands in Figure 9b are provided. Certainly authoritative treatments of the grain size of snow exist—such as Wiscombe and Warren [33], Nolin and Dozier [34] and Nakamura et al. [35]—but reflectance results are highly similar and the figure from Shahabi et al. [32] is selected simply for clarity. Due to the existence of different snow types, with each having a different reflectance curve, the relative radiometric responses of Aqua MODIS B7 and SNPP VIIRS M11 with different spectral coverage, at 2.13 μm and 2.25 μm, respectively, then also vary accordingly. This is the reason for the original seemingly uncontrolled time series outcomes varying from 0.4 to 1.4, except that the scene types after refinement have been narrowed down to snowy conditions that generate a smaller spread. For example, as seen in Figure 9a, the reflectance of the fine-grained snow at 2.13 μm is about 0.15, while at 2.26 μm is about 0.28, given a comparison ratio of about 54%. However, for medium-grained snow the reflectance at 2.13 μm and 2.25 μm would be about 0.03 and 0.09, respectively, which is a bit lower at about 30% to 40% in ratio. The reflectance of coarse-grained snow is too low-valued to be evaluated accurately, but it is already clear that the radiometric ratio at 2.13 μm and 2.25 μm varies according to snow grain size. The overall pattern of all time series is well spread out from about 0.35 to 0.45 showing that RSR difference remains an active effect over snowy scenes, evidently picking up different snow types. The comparison time series is in reality a composite of different sub-time series for a variety of snow grain size. The consistent spread in the time series over many years, i.e., which does not appear fully random, is consistent with the existence of different snow types to cause the spread. If the RSRs of the two bands had been nearly identical instead, then their radiometric comparison ratio time series would have a tight range around unity since the two bands will pick up effectively the same responses.
The direct examination of reflectance suggests a more likely connection to medium-grained snow. The time series for the actual reflectance of both Aqua MODIS B7 and SNPP VIIRS M11 are shown in Figure 10, and the two plots are adjusted for the vertical scale for ease of comparison. The series mean (solid line) and 5% lines above and below the mean (dashed lines) are shown. These reflectance time series correspond to the time series in Figure 7 of the under the 2.5% precision subset (the combined blue square and green star symbols). The reflectance time series are shown only for illustration and qualitatively examination in conjunction with Figure 9. They demonstrate large variation as expected since reflectance is a measure of the physical conditions and not of comparison. In Figure 9a, the reflectance curves for snow point to, at around 2.13 μm, where Aqua MODIS B7 is centered, a 15% reflectance for fine-grained snow, about 1 to 2% for medium-grained snow, and a very low reflectance much below 2% for coarse-grained snow. Thus the Aqua MODIS B7 reflectance time series in Figure 10a, trending around 0.02 or 2%, with most between 1% and 2%, strongly suggests the dominant presence of medium-grained snow. Nevertheless the presence of fine- and coarse-grained snow in some small portion remains highly possible to enhance or reduce the reflectance in numerous cases.
The SNPP VIIRS M11 reflectance time series in Figure 10b, at ~15%, also suggests the connection to medium-grained snow. Figure 9a shows the medium-grained snow reflectance at 2.25 μm, the central spectral coverage of SNPP VIIRS M11, to be close to 10% but that of the fine-grained snow to be close to 30%. The actual reflectance ranging from 10% to 20% is not fully consistent with either snow type but indeed is closer to the medium-grained snow at ~10%. A consistent explanation is that the snow condition of these SNO scenes is primarily medium-grained, as suggested above by the Aqua MODIS B7 reflectance result, but mixing in a small fraction of fine-grained snow to slightly enhance the reflectance to about 15% on the average. The SNPP VIIRS M11 operating at the 2.25 μm range where the reflectance of fine-grained snow reflectance is strongly enhanced thus has likely detected fine-grained snow. The presence of fine-grained snow, however, cannot be in large portion or else the reflectance would rise closer to 30%. It is here noted with care that the refined SNO methodology may preferentially select a specific snow type not reflective of the general condition of Antarctica surface. In addition, other physical complexities impacting reflectance have not been examined, but in any case the purpose of this qualitative discussion is to demonstrate a connection to snowy or icy scenes. Nevertheless, the general finding is consistent with the retrieval results by Lyapustin et al. over Antarctica [36] and by Scambos et al. over Greenland [37], both of which find dominant presence of larger snow grain size, from 100 μm up to millimeter scale.
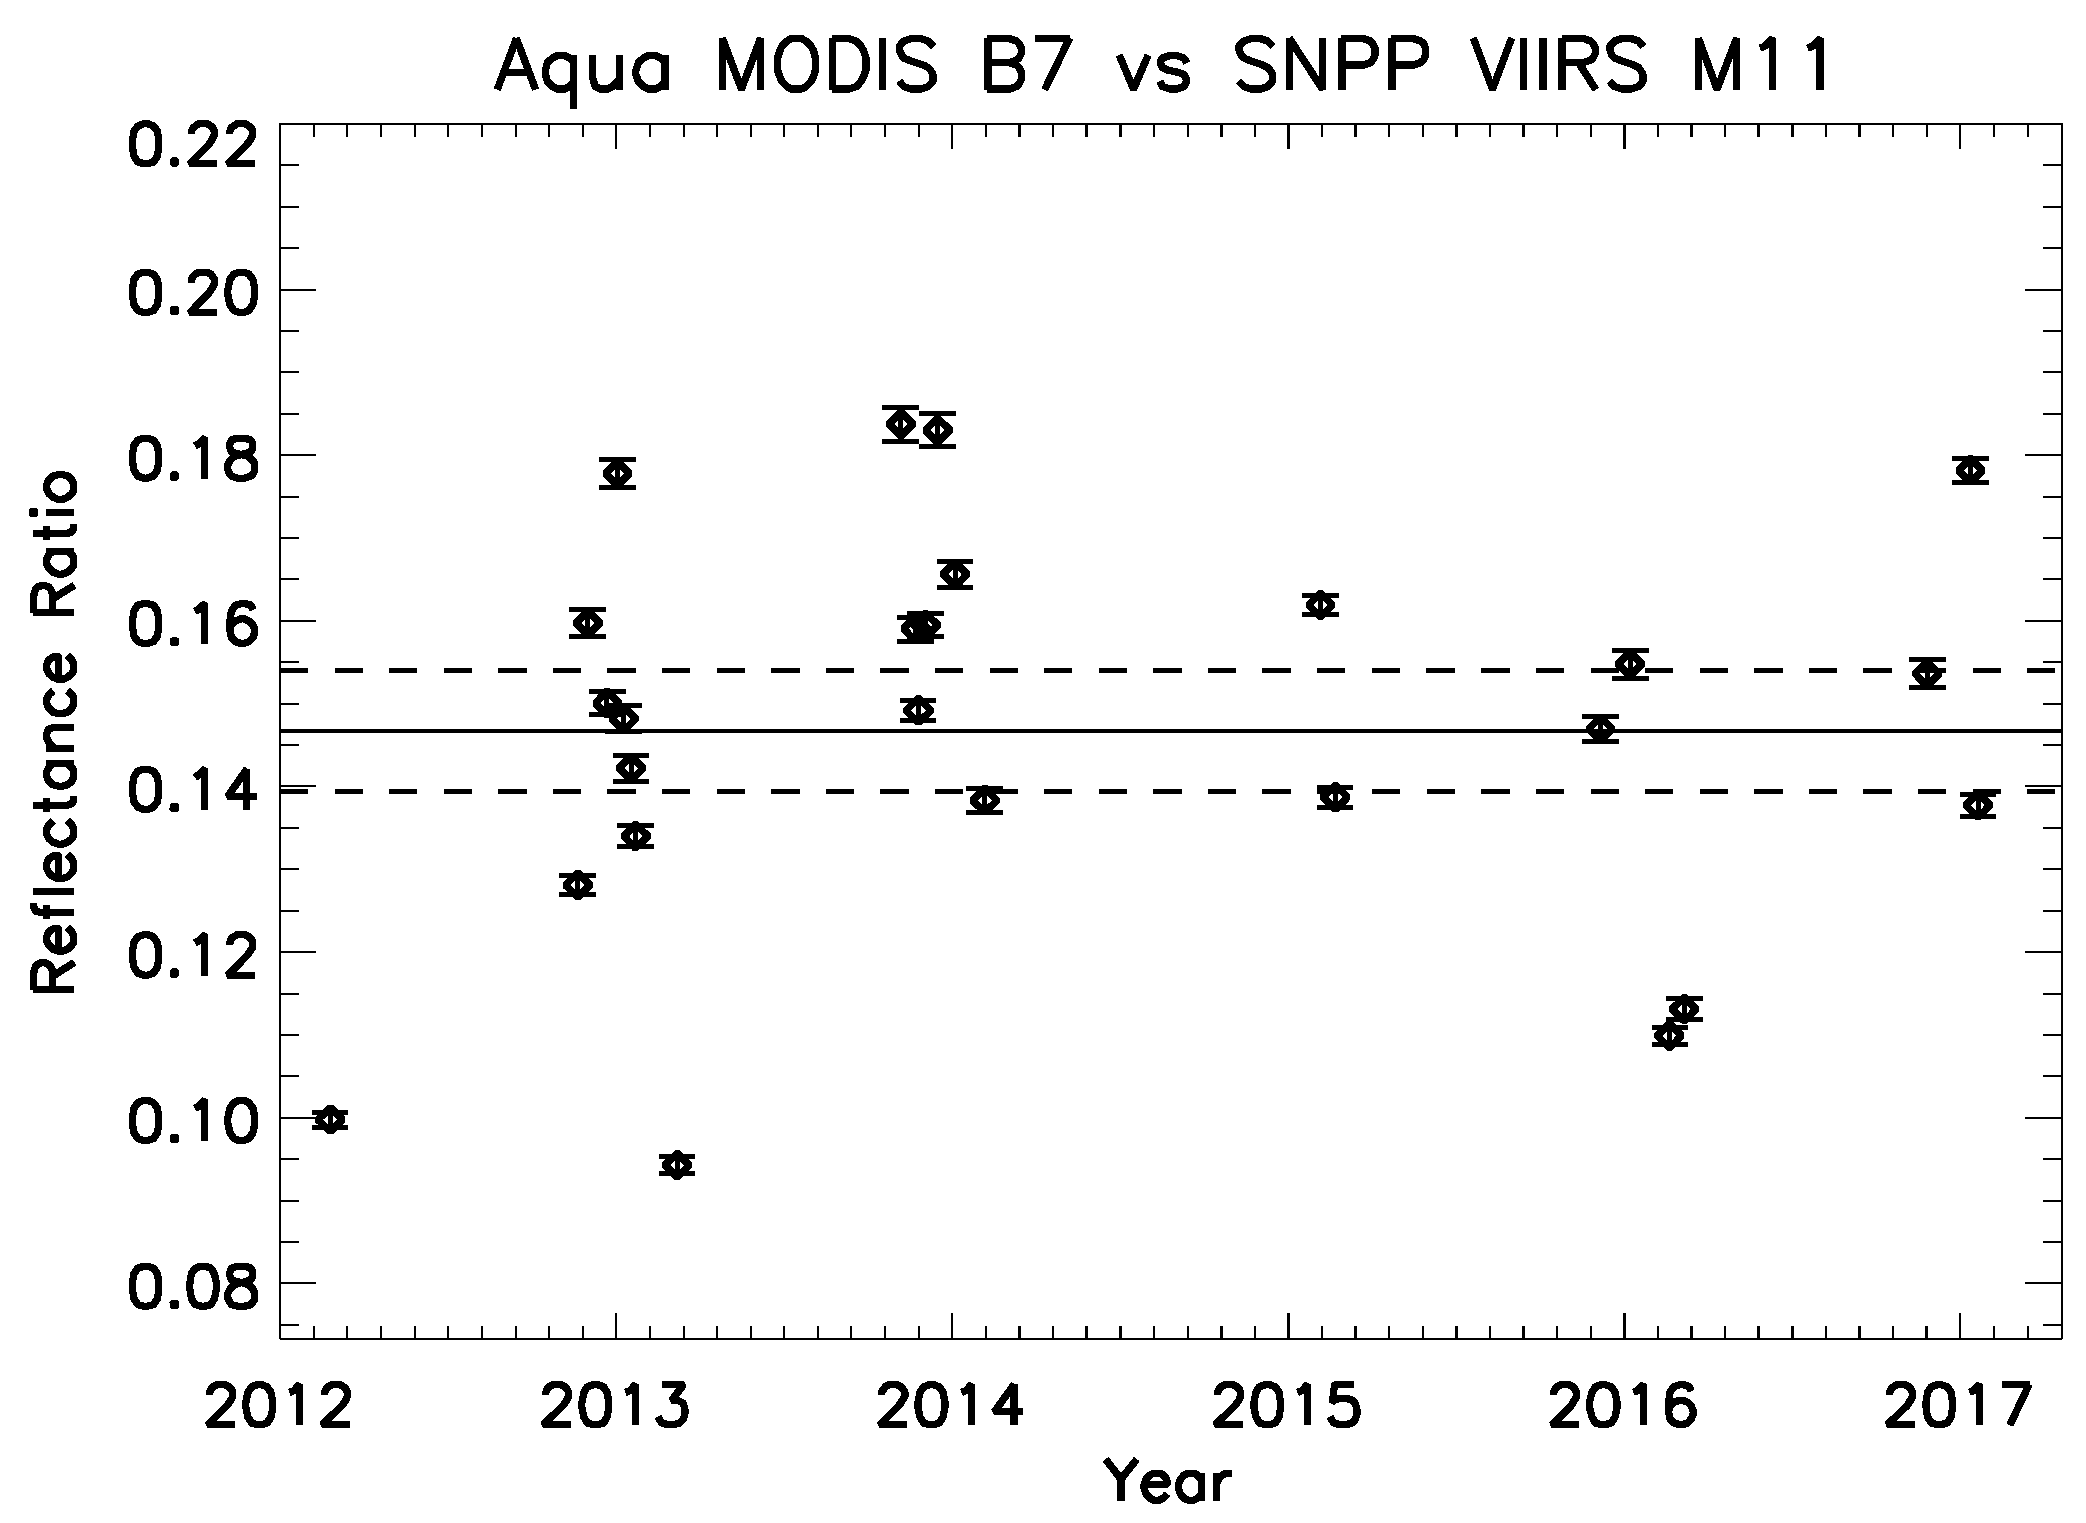
The radiometric comparison time series ratio using reflectance is shown in Figure 11 for those events with precision under 2.25%, and is to be compared with the radiance-based time series in Figure 7 with precision under 2.25% (blue square symbols). The series mean (solid line) and the 5% lines above and below the mean (dashed line) are also shown. This refined reflectance-based comparison time series is extracted following an identical procedure as that for the radiance-based result shown in Figure 7. It is seen that the reflectance-based radiometric comparison time series has a much greater spread and thus is not as useful for radiometric performance evaluation. Radiance and reflectance are fundamentally different physical quantities and therefore the difference is not surprising although the large differences in statistical quality are somewhat unexpected.
A consistent picture now emerges. As SNPP and Aqua satellites follow their sun-synchronous orbits, they regularly make near-concurrent path-crossing over the Polar Regions. For these SNO events, the nadir scenes predictably occur within the well-defined locations as shown in Figure 3. A significant subset of these SNO scenes, when under clear day conditions, occurs over land surface where a variety of snow types is observed. The two bands, having different spectral coverage as shown in Figure 9b, register different radiances for these scenes according to snow conditions. The conditions range from coarse-grained to mixed snow, but clear from Figure 3 that a significant portion of land-based snowy scenes can generate meaningful comparison result.
Although the two bands do not overlap spectrally, their radiometric comparison is made possible by observing over SNO scenes that are sufficiently homogeneous, presumably those of medium-grained snow, possibly of 500 μm radius on the average. The reflectance curves in Figure 9a indicate that Aqua MODIS B7 at 2.13 μm will register lower radiometric signals than SNPP VIIRS M11 at 2.25 μm, where reflectance curves for all snow types are more enhanced. As SNPP VIIRS M11 at 2.25 μm registers its radiometric reading over snowy SNO scene that is concurrently seen by both instruments, so too will Aqua MODIS observe the same scene simultaneously and register its own radiometric reading at 2.13 μm. The two different radiometric readings reflect the difference of the responses of the scene condition at 2.13 and 2.25 μm, but for those very homogeneous and stable snowy scenes these readings will accurately reflect the radiometric property of the snow at these two wavelengths. From one homogeneous snowy SNO scene to the next, both Aqua MODIS B7 and SNPP VIIRS M11 then consistently register snow-based radiometric signals, resulting in a consistent comparison time series.
Lastly, as a comparison study evaluates only the relative performance, the inference of the SNPP VIIRS M11 stability is drawn base on the combined results from numerous studies on calibration and intercomparison. The Chu et al. [9] study has provided a detailed discussion of the stability of Aqua MODIS and SNPP VIIRS RSBs in the context of their on-orbit calibration [10,11,14,15,16,17,18], and demonstrated the general good agreement between Aqua MODIS C6 data and the OC SDRs of SNPP VIIRS. In addition, the two SWIR band comparisons, Aqua MODIS B2 versus SNPP VIIRS M7 and Aqua MODIS B5 versus SNPP VIIRS M8, are further demonstrated to be the most stable, fully consistent with the understanding that the known RSB calibration error diminishes toward longer wavelength. The overall good RSB calibration performance for Aqua MODIS and SNPP VIIRS along with the demonstrated stability of the SWIR bands lays the basis for this study to infer that SNPP VIIRS M11, the longest wavelength band of the SWIR bands, is also stable. In this analysis, the near indistinguishable results between the IDPS-based and the OC-based time series for SNPP VIIRS M11 confirms the absence of the worsening calibration bias into the 2.2 μm spectral region. The Aqua MODIS B7 versus SNPP VIIRS M11 time series as shown in Figure 7 thus demonstrates the stability, within statistics, that is entirely expected.
5. Conclusions
An examination into the radiometric stability of SNPP VIIRS M11 is initiated as a continuing effort to examine key bands of SNPP VIIRS ocean color data processing. The study is carried out at the level of the sensor data via a refined “nadir-only” intersensor comparison with Aqua MODIS B7 over snowy scenes, with the result showing the radiometry of SNPP VIIRS M11 to be stable. The radiometric comparison time series result at around 0.39 is consistent with the known reflectance property of snow in the spectral range of Aqua MODIS B7, from 2125 to 2175 nm, and SNPP VIIRS M11, from 2225 to 2275 nm. This particular case illustrates the arising complications when RSRs of the two supposedly corresponding bands from different instruments do not match. A remedy is also demonstrated in this study through the isolation of concurrently observed scenes to those of stable ground targets, which further demonstrates a novel approach that can expand the capability of intersensor comparison methodology pending more studies. The analysis further makes clear the benefits from the use of the higher spatial resolution data in intersensor comparison, and showcases the precision intersensor comparison in the 750-m regime. In addition, in the context of this refined analysis, the IDPS-generated radiance data expectedly agree with the OC-generated radiance data that follows a different calibration baseline, thus showing that the standard on-orbit calibration of SNPP VIIRS M11 does not suffer the inherent worsening error known to exist for shorter wavelength RSBs. This is an important finding supporting the long-term stability of the sensor data and the correctness of the on-orbit calibration for SNPP VIIRS M11.
Acknowledgments
This work was supported by the Joint Polar Satellite System (JPSS) funding. The views, opinions, and findings contained in this paper are those of the authors and should not be construed as an official NOAA or U.S. Government position, policy, or decision.
Author Contributions
Mike Chu is responsible for the conception of the approach using snowy scenes and formulation of the refined analysis for SNPP VIIRS Band M11. Junqiang Sun has worked on the calibration of SNPP VIIRS and is responsible for the calibrated sensor data for the NOAA Ocean Color Team the hybrid-method. Menghua Wang has suggested the topic and provided vital support for this work.
Conflicts of Interest
The authors declare no conflict of interest.
References
- Bhatt, R.; Doelling, D.R.; Wu, A.; Xiong, X.; Scarino, B.R.; Haney, C.O.; Gopalan, A. Initial stability assessment of S-NPP VIIRS reflective solar band calibration using invariant desert and deep convective cloud targets. Remote Sens. 2014, 6, 2809–2826. [Google Scholar] [CrossRef]
- Cao, C.; Xiong, J.; Blonski, S.; Liu, Q.; Uprety, S.; Shao, X.; Bai, Y.; Weng, F. Suomi NPP VIIRS sensor data record verification, validation, and long-term performance monitoring. J. Geophys. Res. Atmos. 2013, 118, 11664–11678. [Google Scholar] [CrossRef]
- Cao, C.; Deluccia, F.; Xiong, X.; Wolfe, R.; Weng, F. Early on-orbit performance of the Visible Infrared Imaging Radiometer Suite onboard the Suomi National Polar-orbiting Partnership (S-NPP) satellite. IEEE Trans. Geosci. Remote Sens. 2014, 52, 1142–1156. [Google Scholar] [CrossRef]
- Uprety, S.; Cao, C.; Xiong, X.; Blonski, S.; Wu, A.; Shao, X. Radiometric intercomparison between Suomi-NPP VIIRS and Aqua MODIS reflective solar bands using simultaneous nadir overpass in the low latitudes. J. Atmos. Ocean. Technol. 2013, 30, 2720–2736. [Google Scholar] [CrossRef]
- Uprety, S.; Cao, C. Suomi NPP VIIRS reflective solar band on-orbit radiometric stability and accuracy assessment using desert and Antarctica Dome C sites. Remote Sens. Environ. 2015, 166, 106–115. [Google Scholar] [CrossRef]
- Uprety, S.; Blonski, S.; Cao, C. On-orbit radiometric performance characterization of S-NPP VIIRS reflective solar bands. In Proceedings of the Earth Observing Missions and Sensors: Development, Implementation, and Characterization IV, New Delhi, India, 4–7 April 2016; Volume 9881. 98811H. [Google Scholar]
- Wu, A.; Xiong, X.; Cao, C.; Chiang, K. Assessment of SNPP VIIRS VIS/NIR radiometric calibration stability using Aqua MODIS and invariant surface targets. IEEE Trans. Geosci. Remote Sens. 2016, 54, 2918–2924. [Google Scholar] [CrossRef]
- Chu, M.; Sun, J.; Wang, M. Radiometric evaluation of the SNPP VIIRS reflective solar band sensor data records via inter-sensor comparison with Aqua MODIS. In Proceedings of the Earth Observing Systems XXI, San Diego, CA, USA, 28 August–1 September 2016; Volume 9972. 99721R. [Google Scholar]
- Chu, M.; Sun, J.; Wang, M. Performance evaluation of on-orbit calibration of SNPP reflective solar bands via intersensor comparison with Aqua MODIS. J. Atmos. Ocean. Technol. 2018, 35, 385–403. [Google Scholar] [CrossRef]
- Sun, J.; Angal, A.; Xiong, X.; Chen, H.; Geng, X.; Wu, A.; Choi, T.; Chu, M. MODIS reflective solar bands calibration improvements in Collection 6. In Proceedings of the Earth Observing Missions and Sensors: Development, Implementation, and Characterization II, Kyoto, Japan, 29 October–1 November 2012; Volume 8528. 85280N. [Google Scholar]
- Sun, J.; Xiong, X.; Angal, A.; Chen, H.; Wu, A.; Geng, X. Time-dependent response versus scan angle for MODIS reflective solar bands. IEEE Trans. Geosci. Remote Sens. 2014, 52, 3159–3174. [Google Scholar] [CrossRef]
- Heidinger, A.K.; Cao, C.; Sullivan, J.T. Using Moderate Resolution Imaging Spectroradiometer (MODIS) to calibrate Advanced Very High Resolution Radiometer reflectance channels. J. Geophys. Res. 2002, 107, 4702. [Google Scholar] [CrossRef]
- Cao, C.; Weinreb, M.; Xu, H. Predicting simultaneous nadir overpasses among polar-orbiting meteorological satellites for the intersatellite calibration of radiometers. J. Atmos. Ocean. Technol. 2004, 21, 21537–21542. [Google Scholar] [CrossRef]
- Sun, J.; Wang, M. Visible Infrared Imaging Radiometer Suite solar diffuser calibration and its challenges using solar diffuser stability monitor. Appl. Opt. 2014, 53, 8571–8584. [Google Scholar] [CrossRef] [PubMed]
- Sun, J.; Wang, M. On-orbit characterization of the VIIRS solar diffuser and solar diffuser screen. Appl. Opt. 2015, 54, 236–252. [Google Scholar] [CrossRef] [PubMed]
- Sun, J.; Wang, M. On-orbit calibration of the Visible Infrared Imaging Radiometer Suite reflective solar bands and its challenges using a solar diffuser. Appl. Opt. 2015, 54, 7210–7223. [Google Scholar] [CrossRef] [PubMed]
- Sun, J.; Wang, M. Radiometric calibration of the Visible Infrared Imaging Radiometer Suite reflective solar bands with robust characterizations and hybrid calibration coefficients. Appl. Opt. 2015, 54, 9331–9342. [Google Scholar] [CrossRef] [PubMed]
- Sun, J.; Wang, M. VIIRS reflective solar bands calibration progress and its impact on ocean color products. Remote. Sens. 2016, 8, 194. [Google Scholar] [CrossRef]
- Baker, N. Joint Polar Satellite System (JPSS) VIIRS Ocean Color/Chlorophyll Algorithm Theoretical Basis Document (ATBD); NASA-GSFC: Greenbelt, MD, USA, 2013.
- Gordon, H.R.; Wang, M. Retrieval of water-leaving radiance and aerosol optical thickness over the oceans with SeaWiFS: A preliminary algorithm. Appl. Opt. 1994, 33, 443–452. [Google Scholar] [CrossRef] [PubMed]
- Wang, M. Remote sensing of the ocean contributions from ultraviolet to near-infrared using the shortwave infrared bands: simulations. Appl. Opt. 2007, 46, 1535–1547. [Google Scholar] [CrossRef] [PubMed]
- Wang, M.; Shi, W. The NIR-SWIR combined atmospheric correction approach for MODIS ocean color data processing. Opt. Express 2007, 15, 15722–15733. [Google Scholar] [CrossRef] [PubMed]
- Wang, M.; Son, S.; Shi, W. Evaluation of MODIS SWIR and NIR-SWIR atmospheric correction algorithms using SeaBASS data. Remote Sens. Environ. 2009, 113, 635–644. [Google Scholar] [CrossRef]
- Wang, M.; Liu, X.; Tan, L.; Jiang, L.; Son, S.; Shi, W.; Rausch, K.; Voss, K. Impacts of VIIRS SDR performance on ocean color products. J. Geophys. Res. Atmos. 2013, 118, 10347–10360. [Google Scholar] [CrossRef]
- Wang, M.; Liu, X.; Jiang, L.; Son, S.; Sun, J.; Shi, W.; Tan, L.; Naik, P.; Mikelsons, K.; Wang, X.; et al. VIIRS ocean color research and applications. In Proceedings of the IEEE International Geoscience and Remote Sensing Symposium (IGARSS), Milan, Italy, 26–31 July 2015; pp. 2911–2914. [Google Scholar]
- Godin, R. Joint Polar Satellite System (JPSS) VIIRS Cloud Mask (VCM) Algorithm Theoretical Basis Document (ATBD), Revision E; NASA-GSFC: Greenbelt, MD, USA, 2014.
- Levy, R.C.; Munchak, L.A.; Mattoo, S.; Patadia, F.; Remer, L.A.; Holz, R.E. Toward a long-term global aerosol optical depth record: Applying a consistent aerosol retrieval algorithm to MODIS and VIIRS-observed reflectance. Atmos. Meas. Tech. Discuss. 2015, 8, 6877–6947. [Google Scholar] [CrossRef]
- Liu, H.; Remer, L.A.; Huang, J.; Huang, H.-C.; Kondragunta, S.; Laszlo, I.; Oo, M.; Jackson, J.M. Preliminary evaluation of S-NPP VIIRS aerosol optical thickness. J. Geophys. Res. Atmos. 2014, 119, 3942–3962. [Google Scholar] [CrossRef]
- Vallado, D.A.; Crawford, P.; Hujsak, R.; Kelso, T.S. Revisiting Spacetrack Report #3. In Proceedings of the AIAA/AAS Astrodynamics Specialist Conference, Keystone, CO, USA, 21–24 August 2006. [Google Scholar]
- NOAA National Calibration Center. SNPP SNOs with Other Satellites. Available online: http://ncc.nesdis.noaa.gov/VIIRS/SNOPredictions/index.php (accessed on 27 February 2017).
- Sun, J.; Chu, M.; Wang, M. Degradation nonuniformity in the solar diffuser bidirectional reflectance distribution function. Appl. Opt. 2016, 55, 6001–6016. [Google Scholar] [CrossRef] [PubMed]
- Shahabi, H.; Khezri, S.; Ahmad, B.B.; Musa, T.A. Application of moderate resolution spectroradiometer snow cover maps in modeling snowmelt runoff process in the central Zab basin, Iran. J. Appl. Remote Sens. 2014, 8, 084699. [Google Scholar] [CrossRef]
- Wiscombe, W.; Warren, S.G. A model for the spectral albedo of snow. I: Pure Snow. J. Atmos. Sci. 1980, 37, 2712–2733. [Google Scholar] [CrossRef]
- Nolin, A.W.; Dozier, J. A hyperspectral method for remotely sensing the grain size of snow. Remote Sens. Environ. 2000, 74, 207–216. [Google Scholar] [CrossRef]
- Nakamura, T.; Abe, O.; Hasegawa, T.; Tamura, R.; Ohta, T. Spectral reflectance of snow with a known grain-size distribution in successive metamorphism. Remote Sens. Environ. 2001, 32, 13–16. [Google Scholar] [CrossRef]
- Scambos, T.A.; Haran, T.M.; Fahnestock, M.A.; Painter, T.H.; Bohlander, J. MODIS-based mosaic of Antarctica (MOA) data sets: continent-wide surface morphology and snow grain size. Remote Sens. Environ. 2007, 111, 242–257. [Google Scholar] [CrossRef]
- Lyapustin, A.; Tedesco, M.; Wang, Y.; Aoki, T.; Hori, M.; Kokhanovsky, A. Retrieval of snow grain size over Greenland from MODIS. Remote Sens. Environ. 2009, 113, 1976–1987. [Google Scholar] [CrossRef]
Figure 1.
The matching Suomi National Polar-orbiting Partnership (SNPP) Visible Infrared Imaging Radiometer Suite (VIIRS) and Aqua MODerate-resolution Imaging Spectroradiometer (MODIS) granules in a simultaneous nadir overpass (SNO) over Antarctica on 21 March 2016 [9].
Figure 1.
The matching Suomi National Polar-orbiting Partnership (SNPP) Visible Infrared Imaging Radiometer Suite (VIIRS) and Aqua MODerate-resolution Imaging Spectroradiometer (MODIS) granules in a simultaneous nadir overpass (SNO) over Antarctica on 21 March 2016 [9].
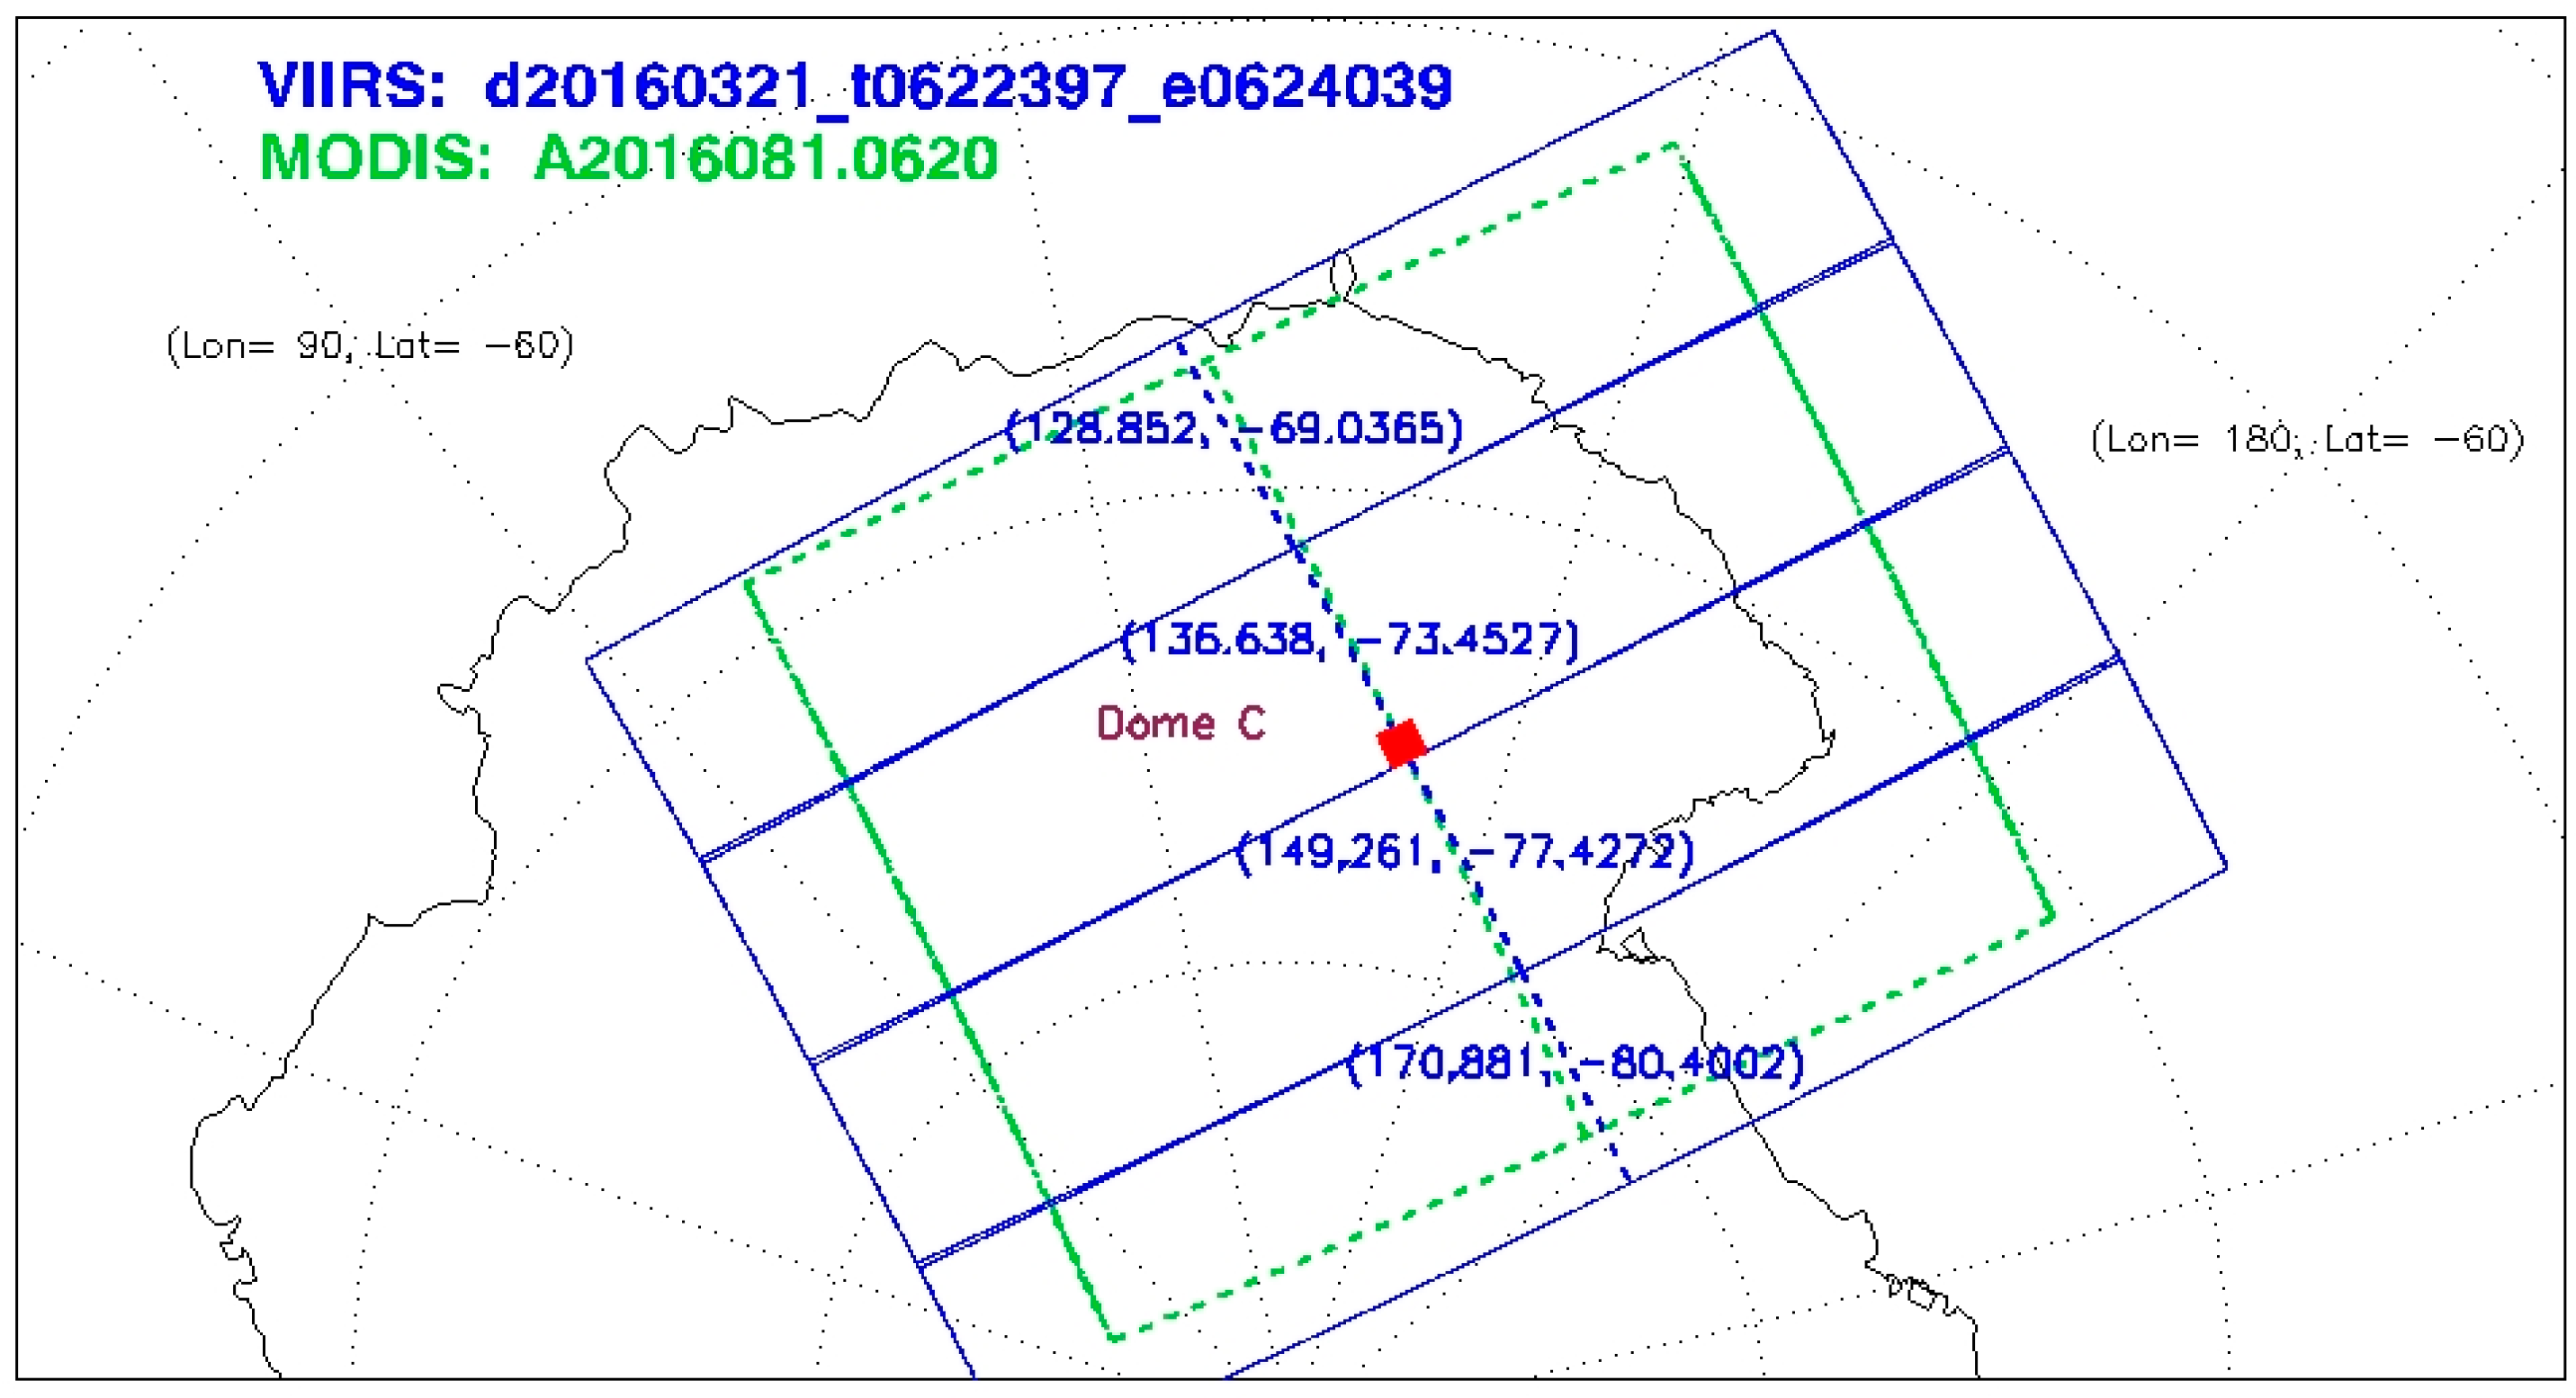
Figure 2.
An unrefined radiometric comparison time series of Aqua MODIS B7 versus SNPP VIIRS M11 is shown in red cross symbols demonstrating large variation. The statistically most robust events are shown in blue square symbols. The comparison time series of Aqua MODIS B5 versus SNPP VIIRS M8 in purple triangle symbols is also plotted for contrast.

Figure 3.
Distribution of radiometric comparison ratios of Aqua MODIS B7 versus SNPP VIIRS M11 by geolocation, shown for (a) Antarctica and (b) the Artic.
Figure 3.
Distribution of radiometric comparison ratios of Aqua MODIS B7 versus SNPP VIIRS M11 by geolocation, shown for (a) Antarctica and (b) the Artic.
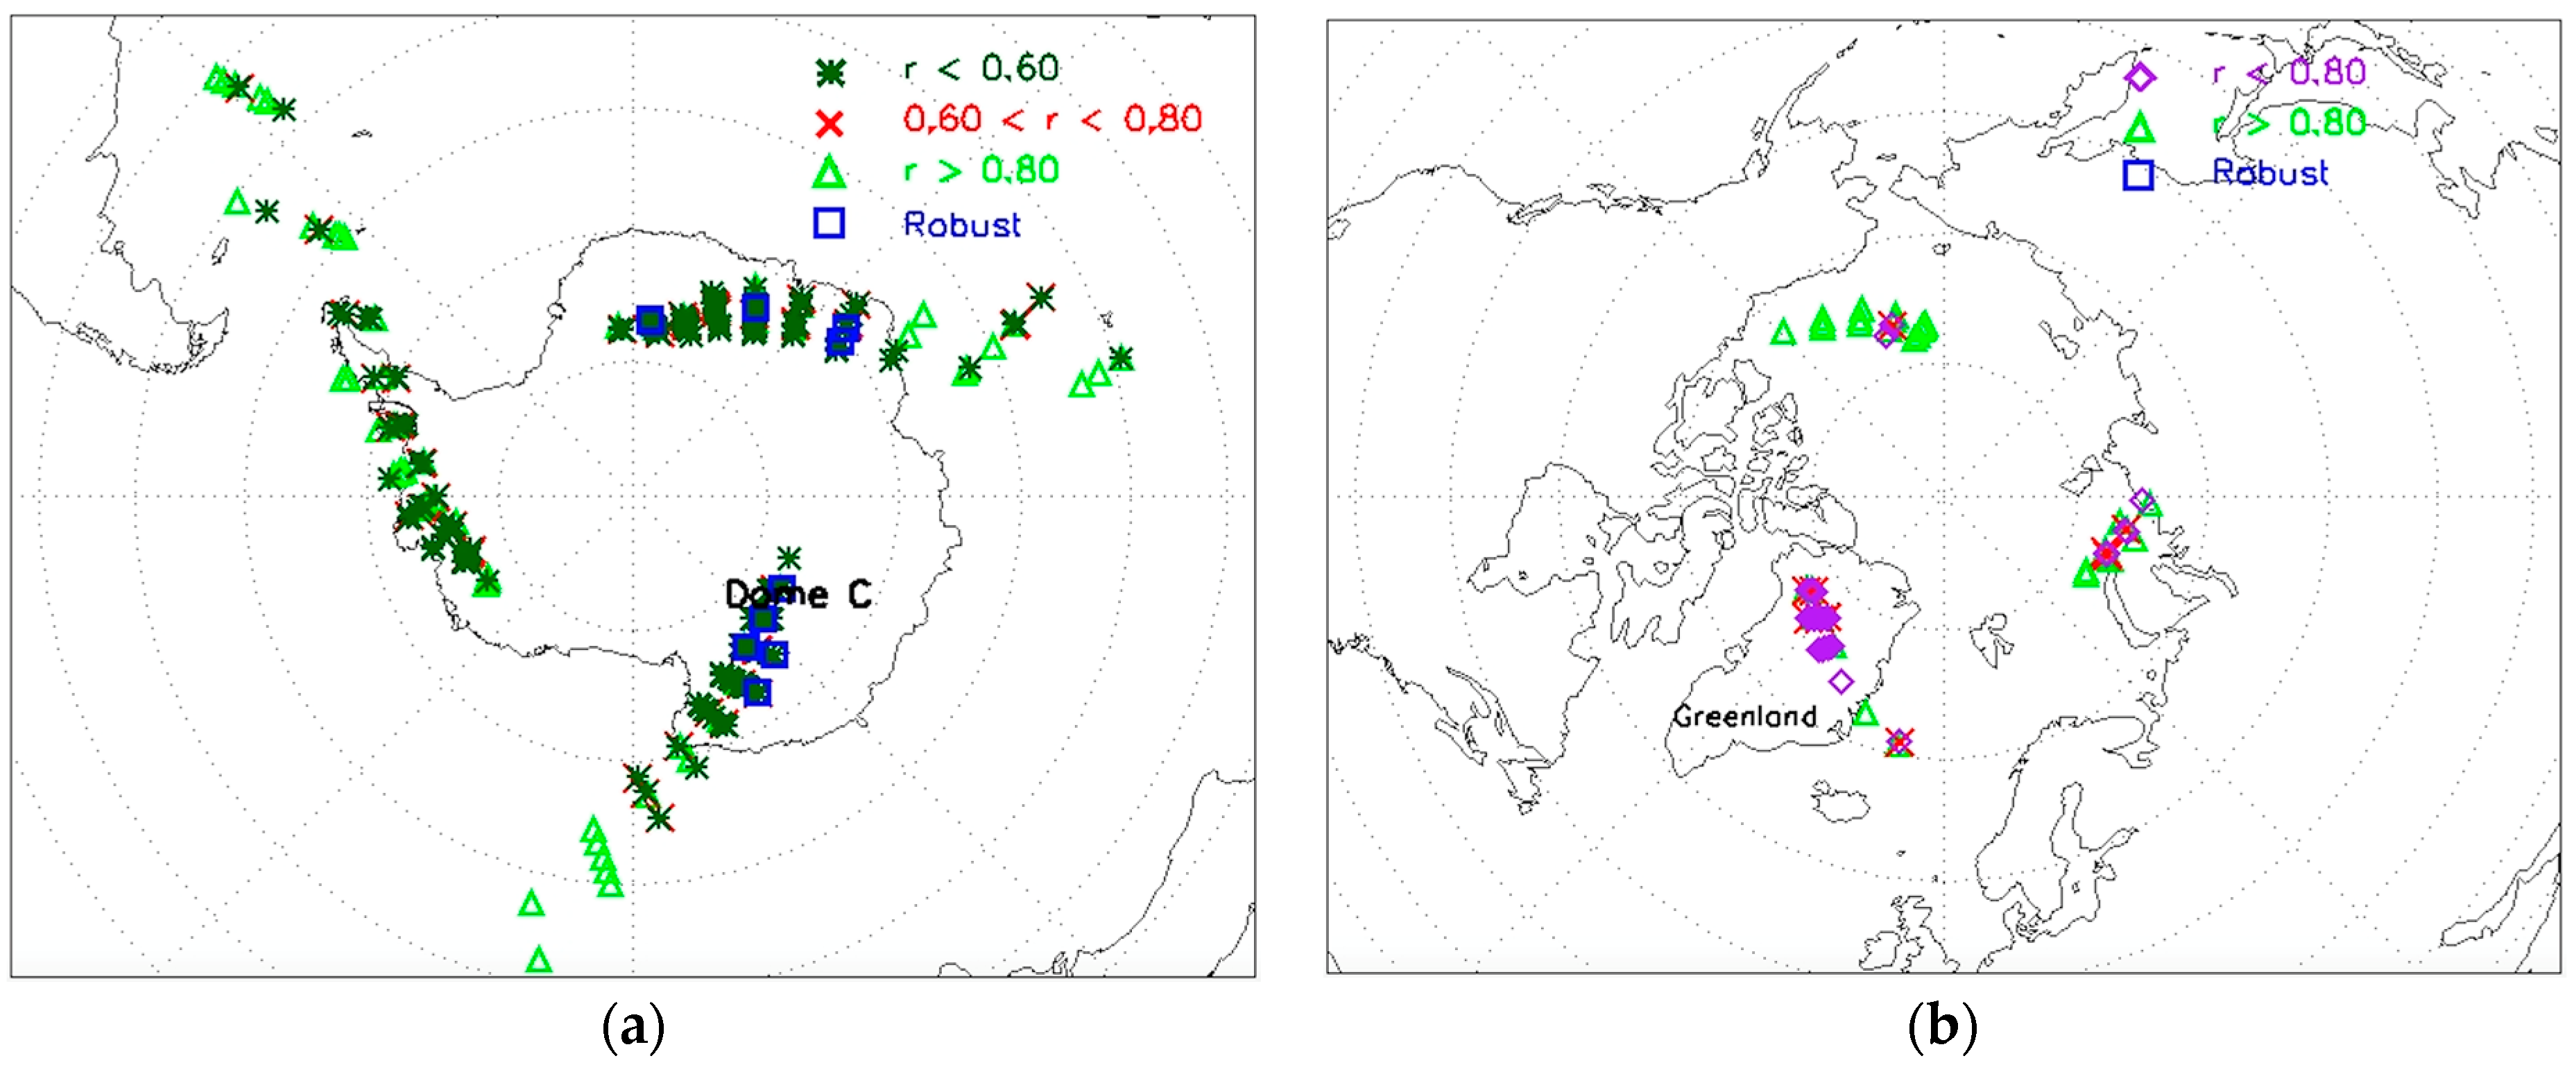
Figure 4.
A representation of the Aqua MODIS B7 versus SNPP VIIRS M11 comparison by subgroups.

Figure 5.
Distribution of radiometric comparison ratio of Aqua MODIS B7 versus SNPP VIIRS M11 showing bimodality at 0.4 and 1.0.
Figure 5.
Distribution of radiometric comparison ratio of Aqua MODIS B7 versus SNPP VIIRS M11 showing bimodality at 0.4 and 1.0.
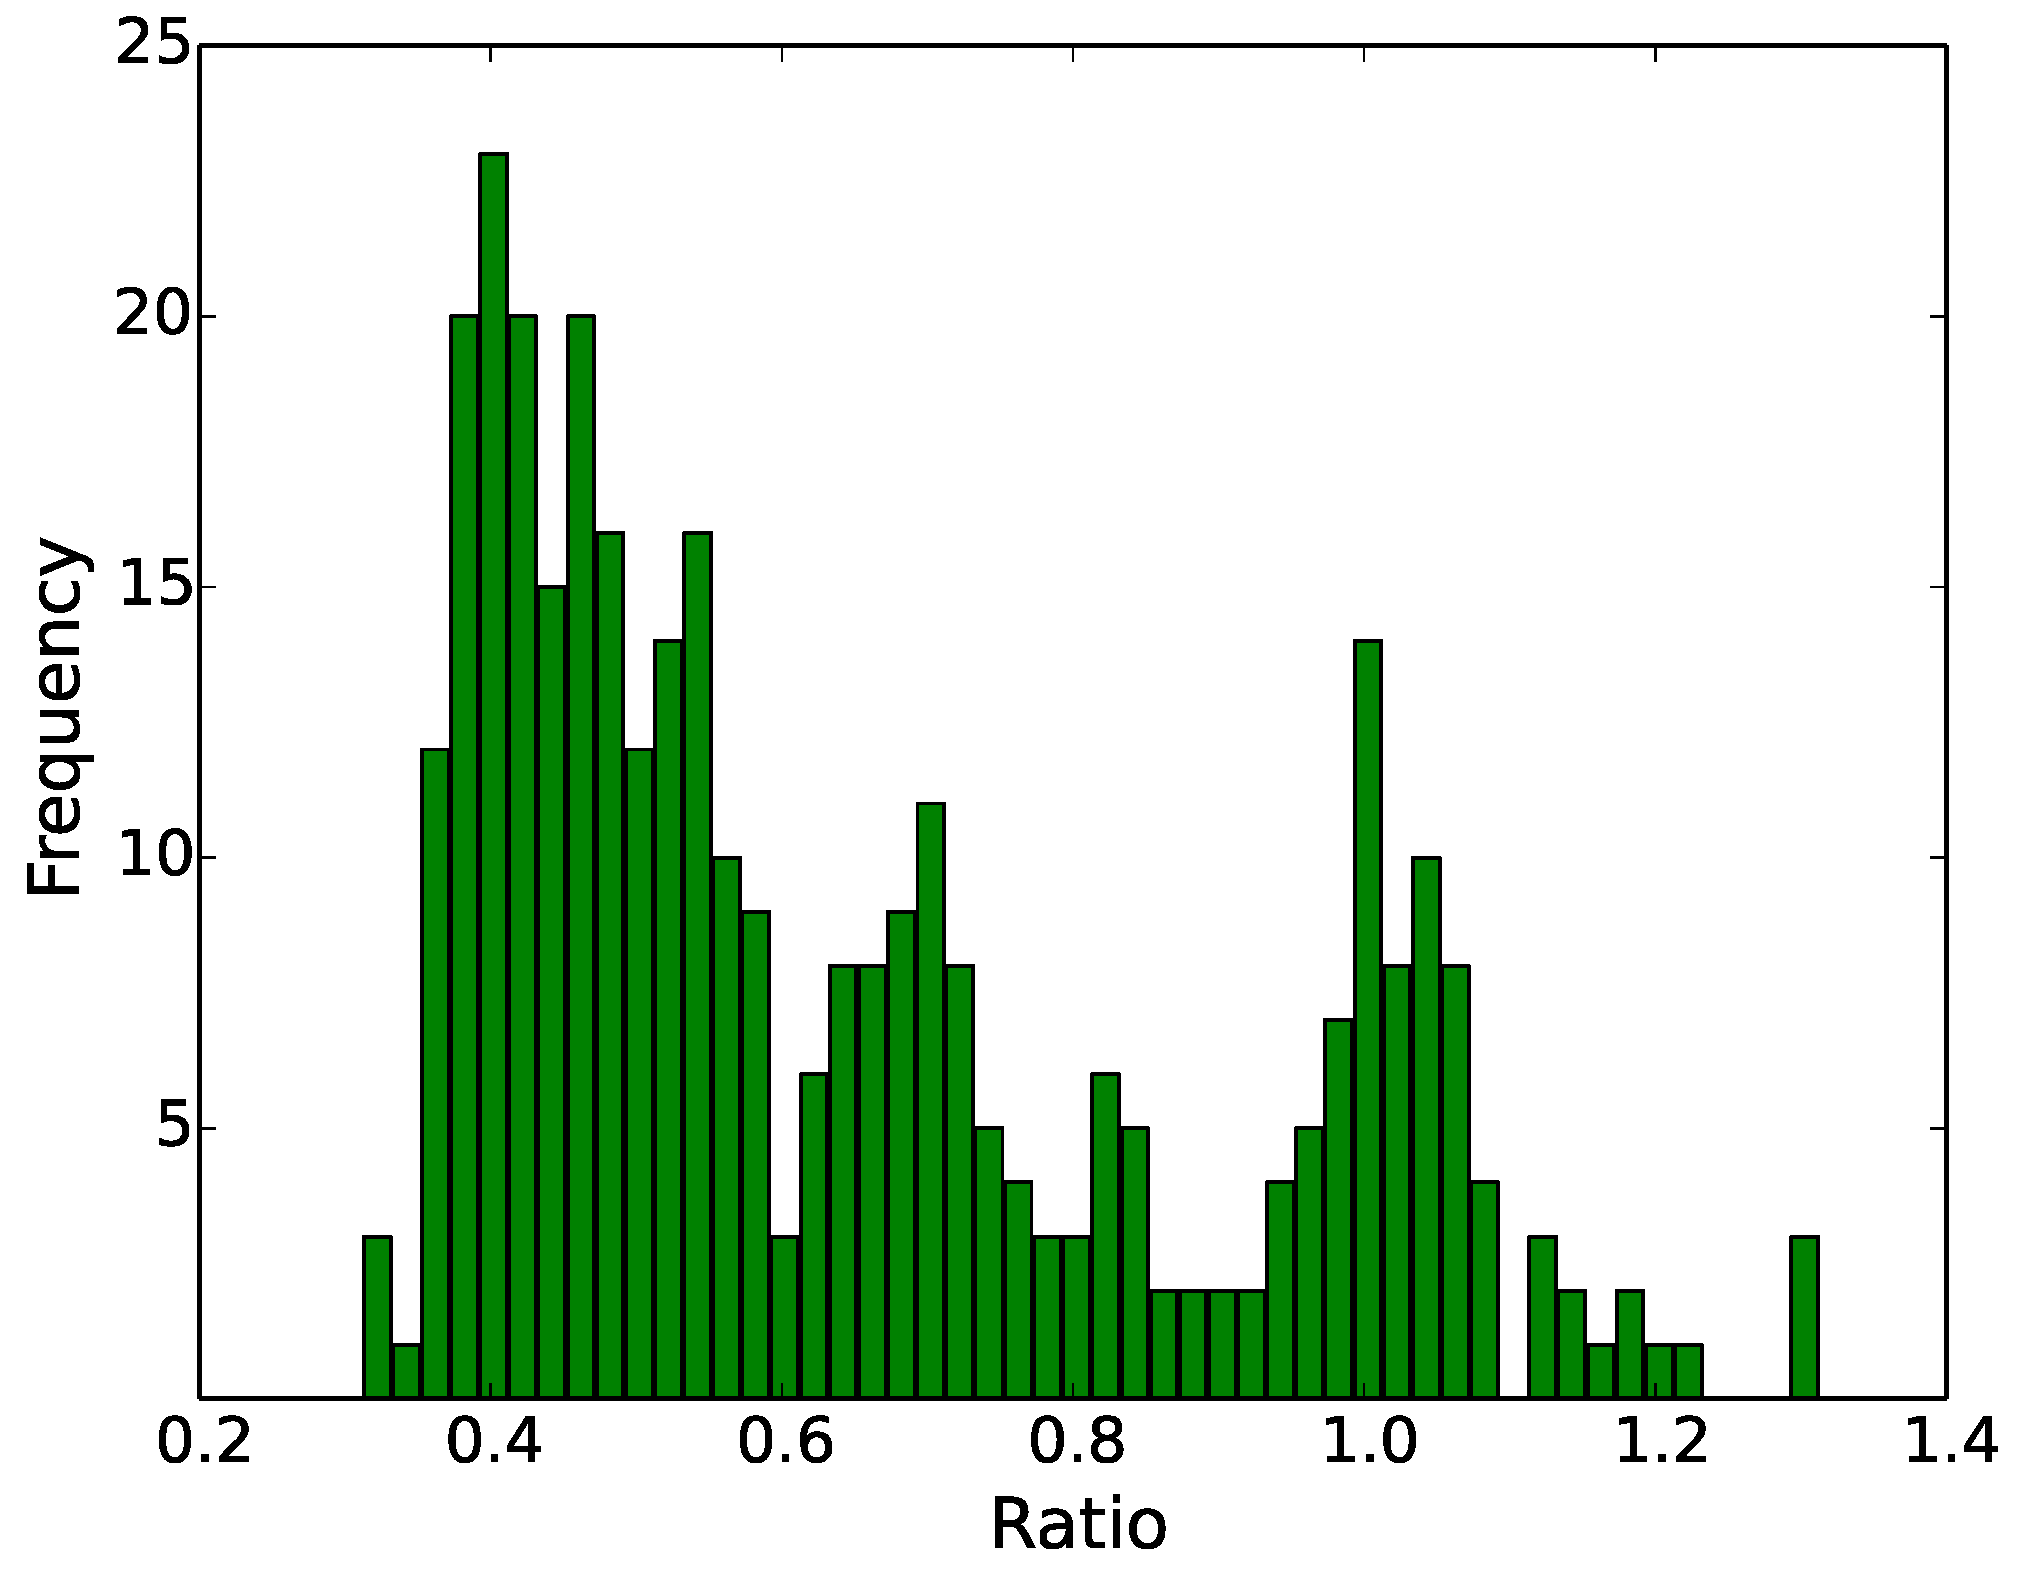
Figure 6.
The precision versus sample size for the 36-km, 54-km, 80-km, and 160-km comparison area sizes, illustrating the “scaling phenomenon” previously uncovered by Chu et al. [9].
Figure 6.
The precision versus sample size for the 36-km, 54-km, 80-km, and 160-km comparison area sizes, illustrating the “scaling phenomenon” previously uncovered by Chu et al. [9].

Figure 7.
The refined radiometric comparison time series of Aqua MODIS B7 versus SNPP VIIRS M11 over snowy scenes for selected precision levels. The most robust result (blue squares), those of precision under 2.25%, shows multi-year stability at around 0.39.
Figure 7.
The refined radiometric comparison time series of Aqua MODIS B7 versus SNPP VIIRS M11 over snowy scenes for selected precision levels. The most robust result (blue squares), those of precision under 2.25%, shows multi-year stability at around 0.39.
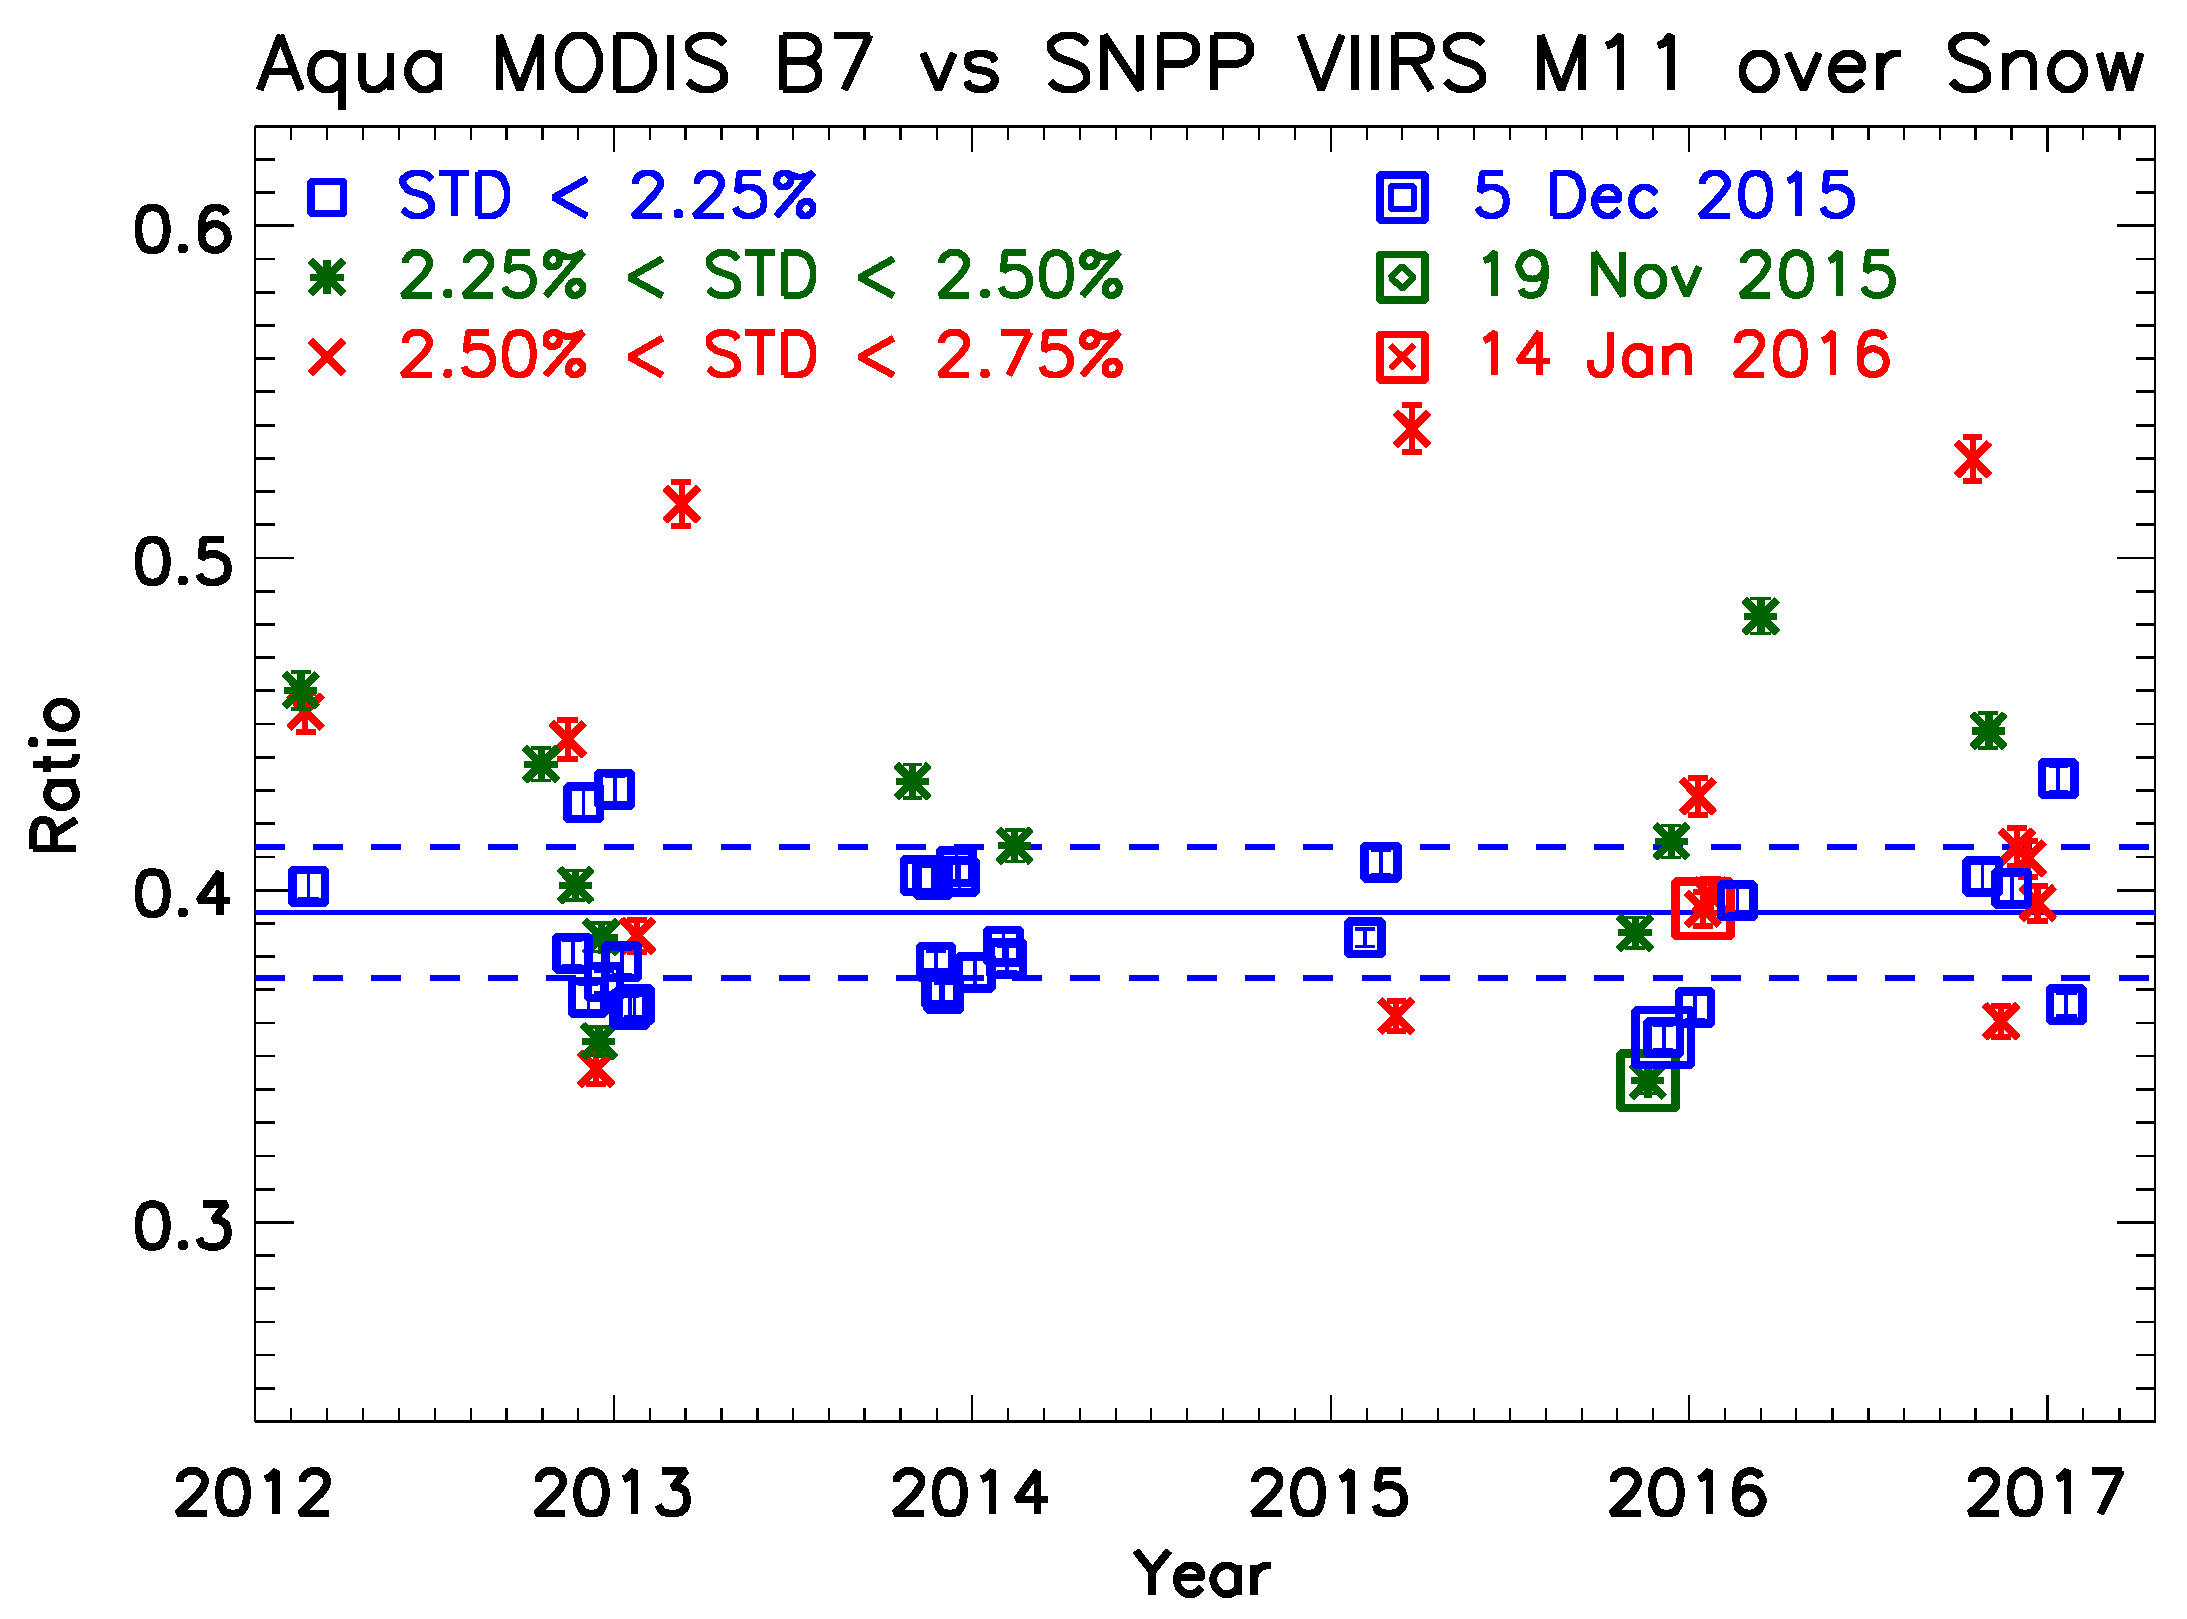
Figure 8.
An illustration of the imageries for the two SNO events in 2015, on 19 November (top row) and 5 December (bottom row). The same ground features are seen by Aqua MODIS B7 (middle column) and SNPP VIIRS M11 (left column) in both SNO events.
Figure 8.
An illustration of the imageries for the two SNO events in 2015, on 19 November (top row) and 5 December (bottom row). The same ground features are seen by Aqua MODIS B7 (middle column) and SNPP VIIRS M11 (left column) in both SNO events.

Figure 9.
(a) A spectral reflectance chart for fine-grained, medium-grained and coarse-grain snow from Shahabi et al. [32] and (b) the relative spectral response (RSR) for Aqua MODIS B7 and SNPP VIIRS M11.
Figure 9.
(a) A spectral reflectance chart for fine-grained, medium-grained and coarse-grain snow from Shahabi et al. [32] and (b) the relative spectral response (RSR) for Aqua MODIS B7 and SNPP VIIRS M11.

Figure 10.
Reflectance time series for (a) Aqua MODIS B7 and (b) SNPP VIIRS M11.
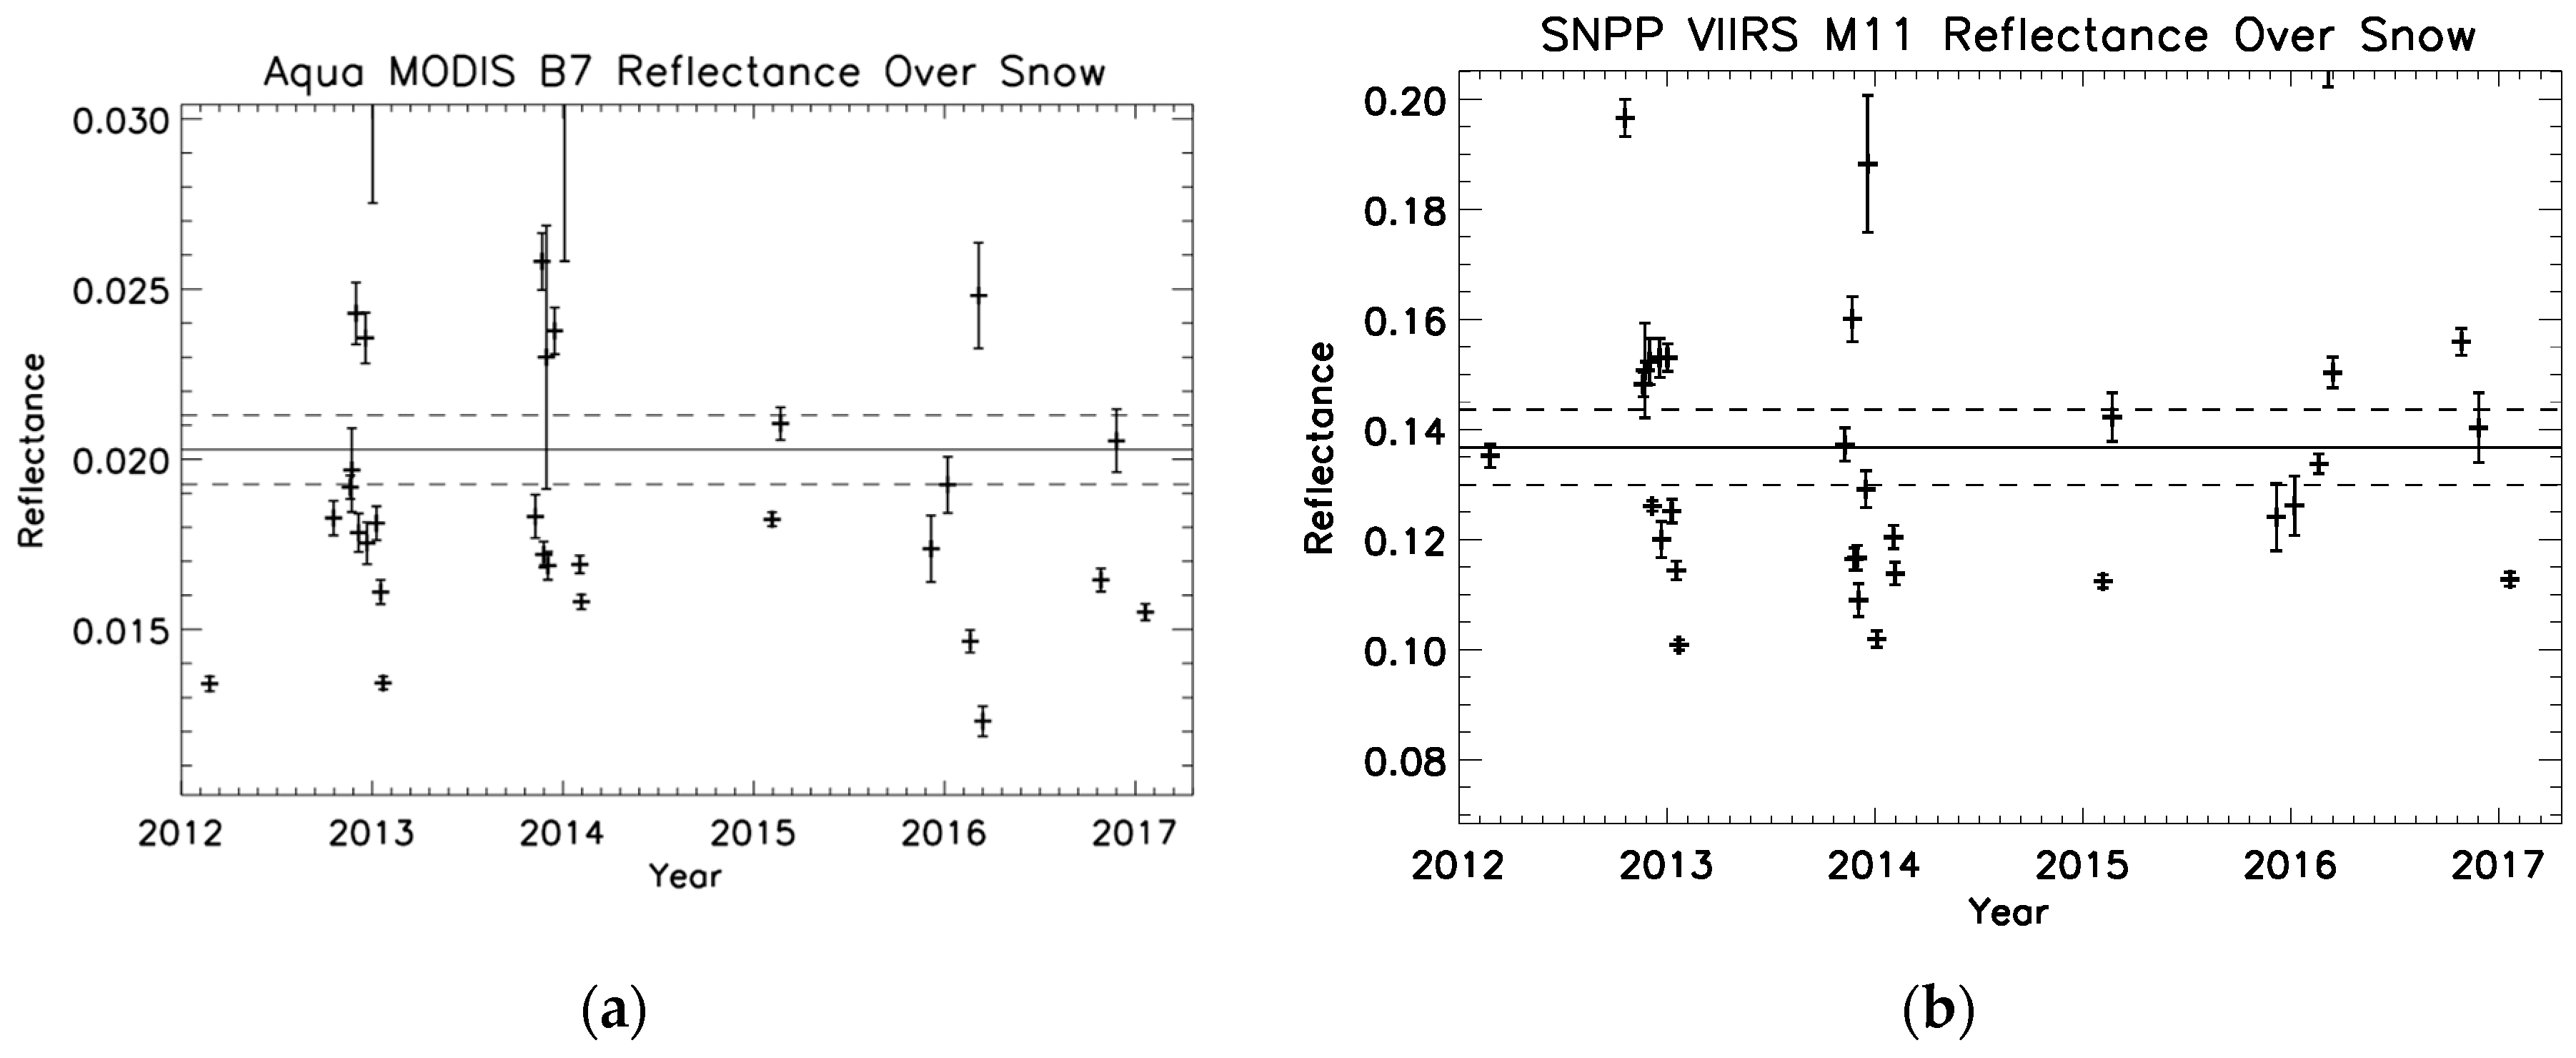
Figure 11.
The reflectance-based comparison ratio time series for Aqua MODIS B7 versus SNPP VIIRS M11.
Figure 11.
The reflectance-based comparison ratio time series for Aqua MODIS B7 versus SNPP VIIRS M11.


Table 1.
Summary statistics for the three levels of selection based on the precision of the individual SNO events, along with the three spatial scales of the comparison area.
Table 1.
Summary statistics for the three levels of selection based on the precision of the individual SNO events, along with the three spatial scales of the comparison area.
| Stratification | Time Series Statistics (5-Year) | |||||
|---|---|---|---|---|---|---|
| STD (%) | Comparison Size (km) | Series (Ratio) Mean | Series Spread (%) | Average Precision (%) | 5-Year Drift (%) | Number of Ratios |
| <2.25 | 36 | 0.386 | 2.02 | 1.92 | <−0.01 | 23 |
| 54 | 0.387 | 2.00 | 1.98 | −0.32 | 27 | |
| 80 | 0.389 | 2.35 | 1.96 | −2.09 | 23 | |
| <2.50 | 36 | 0.407 | 4.68 | 2.14 | 2.15 | 45 |
| 54 | 0.395 | 3.06 | 2.08 | 0.44 | 39 | |
| 80 | 0.396 | 3.50 | 2.12 | 2.06 | 40 | |
| <2.75 | 36 | 0.409 | 5.12 | 2.23 | −2.36 | 56 |
| 54 | 0.403 | 4.30 | 2.22 | −0.77 | 54 | |
| 80 | 0.399 | 3.78 | 2.20 | −1.19 | 46 | |
© 2018 by the authors. Licensee MDPI, Basel, Switzerland. This article is an open access article distributed under the terms and conditions of the Creative Commons Attribution (CC BY) license (http://creativecommons.org/licenses/by/4.0/).
Share and Cite
MDPI and ACS Style
Chu, M.; Sun, J.; Wang, M. Radiometric Evaluation of SNPP VIIRS Band M11 via Sub-Kilometer Intercomparison with Aqua MODIS Band 7 over Snowy Scenes. Remote Sens. 2018, 10, 413. https://doi.org/10.3390/rs10030413
AMA Style
Chu M, Sun J, Wang M. Radiometric Evaluation of SNPP VIIRS Band M11 via Sub-Kilometer Intercomparison with Aqua MODIS Band 7 over Snowy Scenes. Remote Sensing. 2018; 10(3):413. https://doi.org/10.3390/rs10030413
Chicago/Turabian StyleChu, Mike, Junqiang Sun, and Menghua Wang. 2018. "Radiometric Evaluation of SNPP VIIRS Band M11 via Sub-Kilometer Intercomparison with Aqua MODIS Band 7 over Snowy Scenes" Remote Sensing 10, no. 3: 413. https://doi.org/10.3390/rs10030413
Note that from the first issue of 2016, this journal uses article numbers instead of page numbers. See further details here.