Article

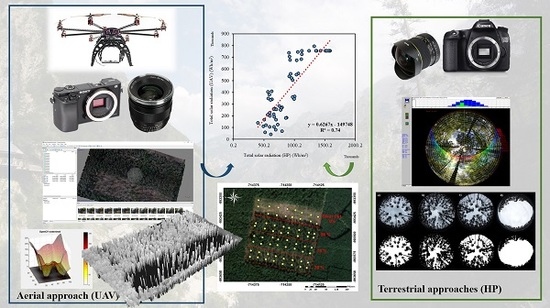
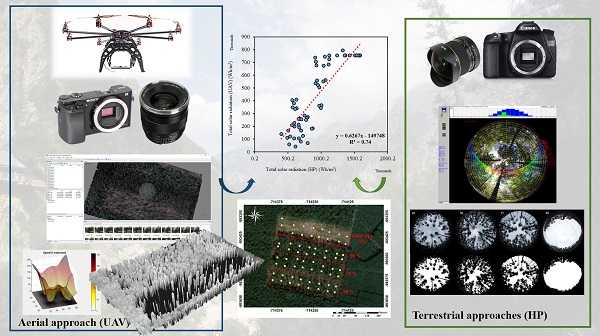
UAV Capability to Detect and Interpret Solar Radiation as a Potential Replacement Method to Hemispherical Photography

by
Azadeh Abdollahnejad
1,*,
Dimitrios Panagiotidis
1,
Peter Surový
1 and
Iva Ulbrichová
2
1
Department of Forest management, Faculty of Forestry and Wood Sciences, Czech University of Life Sciences (CULS), Kamýcká 129, Prague 165 21, Czech Republic
2
Department of Silviculture, Faculty of Forestry and Wood Sciences, Czech University of Life Sciences (CULS), Kamýcká 129, Prague 165 21, Czech Republic
*
Author to whom correspondence should be addressed.
Remote Sens. 2018, 10(3), 423; https://doi.org/10.3390/rs10030423
Submission received: 30 January 2018 / Revised: 28 February 2018 / Accepted: 6 March 2018 / Published: 9 March 2018

Abstract

:
Solar radiation is one of the most significant environmental factors that regulates the rate of photosynthesis, and consequently, growth. Light intensity in the forest can vary both spatially and temporally, so precise assessment of canopy and potential solar radiation can significantly influence the success of forest management actions, for example, the establishment of natural regeneration. In this case study, we investigated the possibilities and perspectives of close-range photogrammetric approaches for modeling the amount of potential direct and diffuse solar radiation during the growing seasons (spring–summer), by comparing the performance of low-cost Unmanned Aerial Vehicle (UAV) RGB imagery vs. Hemispherical Photography (HP). Characterization of the solar environment based on hemispherical photography has already been widely used in botany and ecology for a few decades, while the UAV method is relatively new. Also, we compared the importance of several components of potential solar irradiation and their impact on the regeneration of Pinus sylvestris L. For this purpose, a circular fisheye objective was used to obtain hemispherical images to assess sky openness and direct/diffuse photosynthetically active flux density under canopy average for the growing season. Concerning the UAV, a Canopy Height Model (CHM) was constructed based on Structure from Motion (SfM) algorithms using Photoscan professional. Different layers such as potential direct and diffuse radiation, direct duration, etc., were extracted from CHM using ArcGIS 10.3.1 (Esri: California, CA, USA). A zonal statistics tool was used in order to extract the digital data in tree positions and, subsequently, the correlation between potential solar radiation layers and the number of seedlings was evaluated. The results of this study showed that there is a high relation between the two used approaches (HP and UAV) with R2 = 0.74. Finally, potential diffuse solar radiation derived from both methods had the highest significant relation (−8.06% bias) and highest impact in the modeling of pine regeneration.

Graphical Abstract

1. Introduction

Incoming global solar radiation is a key factor which influences energy and water balance and thus is fundamental to most biophysical and physical processes [1,2]. Identifying factors that influence variation in light availability within forested ecosystems represents an important component in our understanding of the complex determinants of tree seedling regeneration, growth, and increment. Also, solar radiation is one of the most influential independent variables in predicting the spatial distribution of species groups [3,4]. Within forest stands, variation in vegetation composition, structure, crown dimensions, and foliage distribution create spatial variation in light transmittance, affecting growth dynamics. Characterization of the solar radiation regime and forest canopy structural architecture has undergone considerable evolution since [5,6] first reported using Hemispherical Photography (HP).
Hemispherical or fisheye photography is a field-based Remote Sensing (RS) technique to characterize tree canopies from analysis of wide angle (usually between 100 to 180°) photographs [6]. HP photographs are typically acquired looking upward from beneath the forest canopy, where geometric analysis of images is used to characterize the potential light irradiation conditions below the canopy [7]. Taking advantage of fisheye lens polar projection, Coombe and Evans [8], who pioneered the method to characterize light conditions, super-imposed sun path diagrams on HP to predict periods of direct sunlight and the fraction of light that was transmitted to the ground using manual analysis of the photographs. Soon, other studies followed by introducing more specific applications to forestry [9,10,11]. Since then, a number of studies have been used to estimate particular attributes from HP based on a computerized analysis of HP [7,11,12]. For instance, Chazdon and Field [13] were the first to describe a computerized method to estimate canopy openings, diffuse and direct sunlight, as well as Photosynthetic Photon Flux Density (PPFD), which could be used as key descriptors of the light environment.
Nowadays, with the technological advances in both hardware and software, digital photographs can be analyzed in an optimal manner, using a variety of options and innovative algorithms, to determine more accurately the geometry and position of canopy openings, the path of the sun at different time periods, and subsequently, to indirectly estimate light parameters under forest canopies. Therefore, HP can be used to assess local light environments beneath forest canopies and infer the properties of those canopies.
However, it must be understood that there are limitations associated with the acquisition of HP for further analysis. First, a number of assumptions must be made. One of the most significant is the assumption of foliage effect, meaning that the total amount of Leaf Area Index (LAI) is responsible for the incoming penetration of light through openings, which will eventually determine the conditions for tree regeneration [14]. In digital photographs, canopy areas are assigned to either white (clear sky) or black (referring to the blocked solar radiation by leaves). This may introduce significant errors in darker areas where a significant proportion of the total solar radiation arrives via partial transmission or reflection through a complete canopy layer. Another problem is associated with the acquisition of HP over large areas (i.e., our case study) in regard to exposure time [15]. This may introduce substantial errors during the image analysis, due to the differences of the recorded amount of solar radiation between plots. In general, measuring the light intensity by ground methods is very demanding and labor-costly for practical purposes.
On the other hand, primary platforms such as satellites and piloted aircrafts are used to obtain remote images of the Earth’s surface, but these instruments frequently do not deliver adequate spatial and temporal resolutions [16]. The use of Unmanned Aerial Vehicles (UAVs) as a remote sensing platform has recently gained increasing attention, but their applications in forestry are still at an experimental stage. The opportunity to observe the world from the sky using modern approaches (i.e., UAVs) offers the possibility to study forest canopy architecture from an unusual point of view, allowing for observation of some peculiarities of field coverage hardly visible from the ground. One of the main advantages of UAV compared to HP is that it allows data acquisition in shorter time periods (10–15 min) over large areas, resulting in homogeneous data.
Remotely-sensed information offers a unique way to obtain large-scale mapping of forest attributes from Canopy Height Models (CHMs) based on different types of sensors such as Aerial Laser Scanning (ALS) and aerial photogrammetry. Recently, several studies indicated that UAVs deployed with RGB cameras can be used for accurate construction and computation of several forest attributes from CHMs, using Structure from Motion (SfM) algorithms [17,18,19]. UAV platforms coupled with imaging, ranging and positioning sensors can offer centimeter-level resolution, improving the resolution of photogrammetric point clouds and the acquisition of three-dimensional (3D) structural data from the forest [20] and therefore offering great possibilities in the precision of forest management applications [21] and the geosciences [22]. Indeed, UAV surveys allow us to work with remote images at very small pixel sizes (Ground Sample Distance-GSD), often in the order of centimeters, a value that greatly improves the normal resolution of an aerial platform.
Regarding the possibility of modelling the amount of solar radiation from UAV-based sensors, several studies that have been found in the literature are mainly focused on either traditional meteorological datasets [23,24,25,26,27] or combined works (point cloud analysis derived from UAV images and meteorological solar radiation datasets) [28]. The results of this study [28] verified the potential of indirect methods for estimating the amount of solar radiation, providing input to ecosystems that are dependent on solar radiation.
Other studies have tested the use of UAV-derived vegetation indices to monitor photosynthetic radiation of canopy attributes [29,30]. The majority of the adopted indices involve the use of Near-Infrared (NIR) bands, because the near-infrared portion of the electromagnetic spectrum provides strong information on both the physiological status and the geometric properties of vegetation [31,32]. On the contrary, no work has been found on the evaluation of the amount of solar irradiance transmitted during the growing seasons that is solely based on UAV RGB imagery.
A limiting factor in passive imaging has been the dependence on sunlight and the high impact of the changing and different illumination conditions on the radiometry of the data [33]. Shadowing and brightening of individual tree crowns cause the pixels of a single tree crown to scale from very dark pixels to very bright pixels. However, only a few methods have been developed to reduce the effect of the changing illumination in the forest canopy [34].
In general, we may say that all information produced from UAV surveys provides a unique method of obtaining estimates over spatially extensive areas. It can help in reliable decision making and planning processes, in improving forest production and in optimizing the resource utilization with quick and cheap regular flights based on inexpensive RGB camera sensors.
In this study, we developed a novel method for data acquisition based on close-range photogrammetric techniques, to determine the correlation between different environmental variables (potential solar radiation, soil and crown openness) and regeneration of Pinus sylvestris L., in temperate forest conditions. We compared the UAV-based data with fisheye imagery as the standard method for potential solar radiation characterization for botany and forestry purposes. Our objectives were to answer the following: (i) how the proposed methods for measurement of solar radiation (HP and UAV) are related to each other in terms of overall performance (i.e., data acquisition and analysis); and (ii) to what extent can the methodology be used as an efficient and accurate source for forest management plans and strategies?

2. Materials and Methods

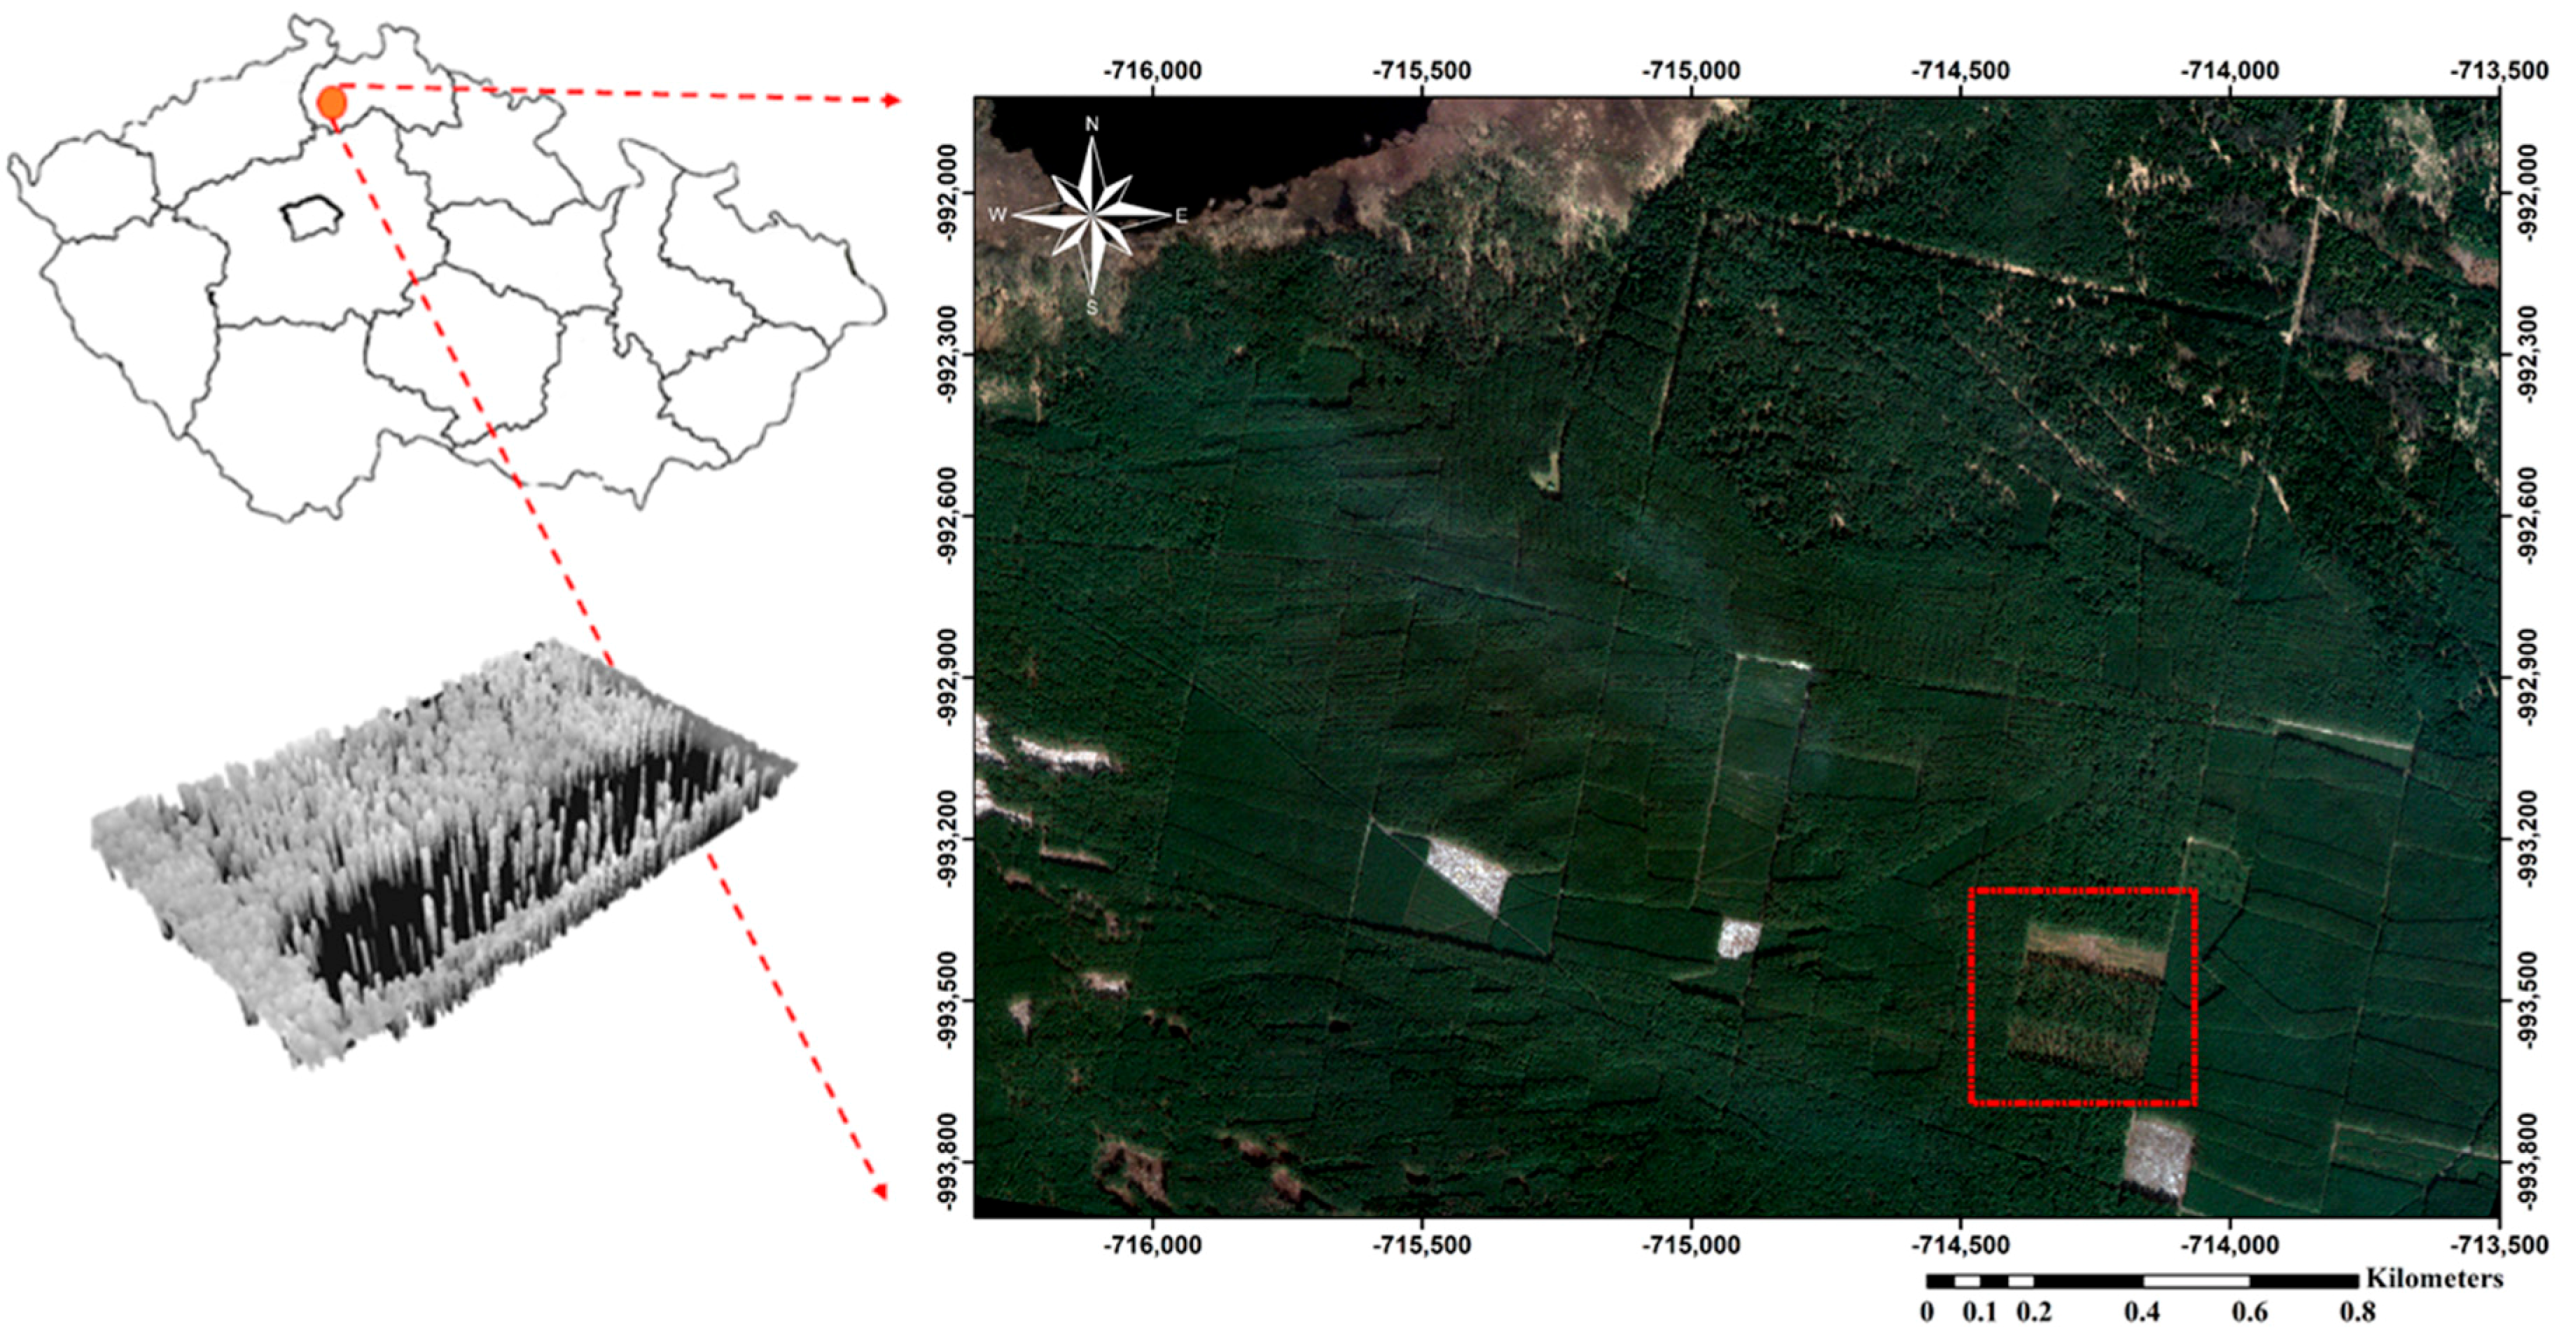
2.1. Characterization of the Study Area

The Doksy territory lies on the shores of Lake Mácha in northern Bohemia in the Czech Republic (Figure 1). It is mainly surrounded by dense forest area, covering 300 km2. The area is sandstone pseudokarst in the last stage of development, while the soils are either sandy or peaty, with shallow peaty basins prevailing over rocky sandstone hummocks and sporadic volcanic hills [35]. The whole study area is six hectares and it extends geographically from 50°33′49.48″N; 14°43′36.27″E to 50°33′42.40″N; 14°43′21.75″E, while the Coordinate Reference System (CRS) is WGS84. The study area is located at the northeast part of the city of Doksy as can be seen in Figure 1. The research was carried out in a monoculture stand of Pinus sylvestris L., with an age of approximately 140 years. The vegetative period is rather warm and dry. Mean annual air temperature is 7.3 °C and average maximum temperature is 31.5 °C. Mean annual precipitation is 635 mm, with only 354 mm during the growing season. Mean annual number of cloudy days is 120–150, of which 50–60 occur in the growing season (1 April to 30 October).

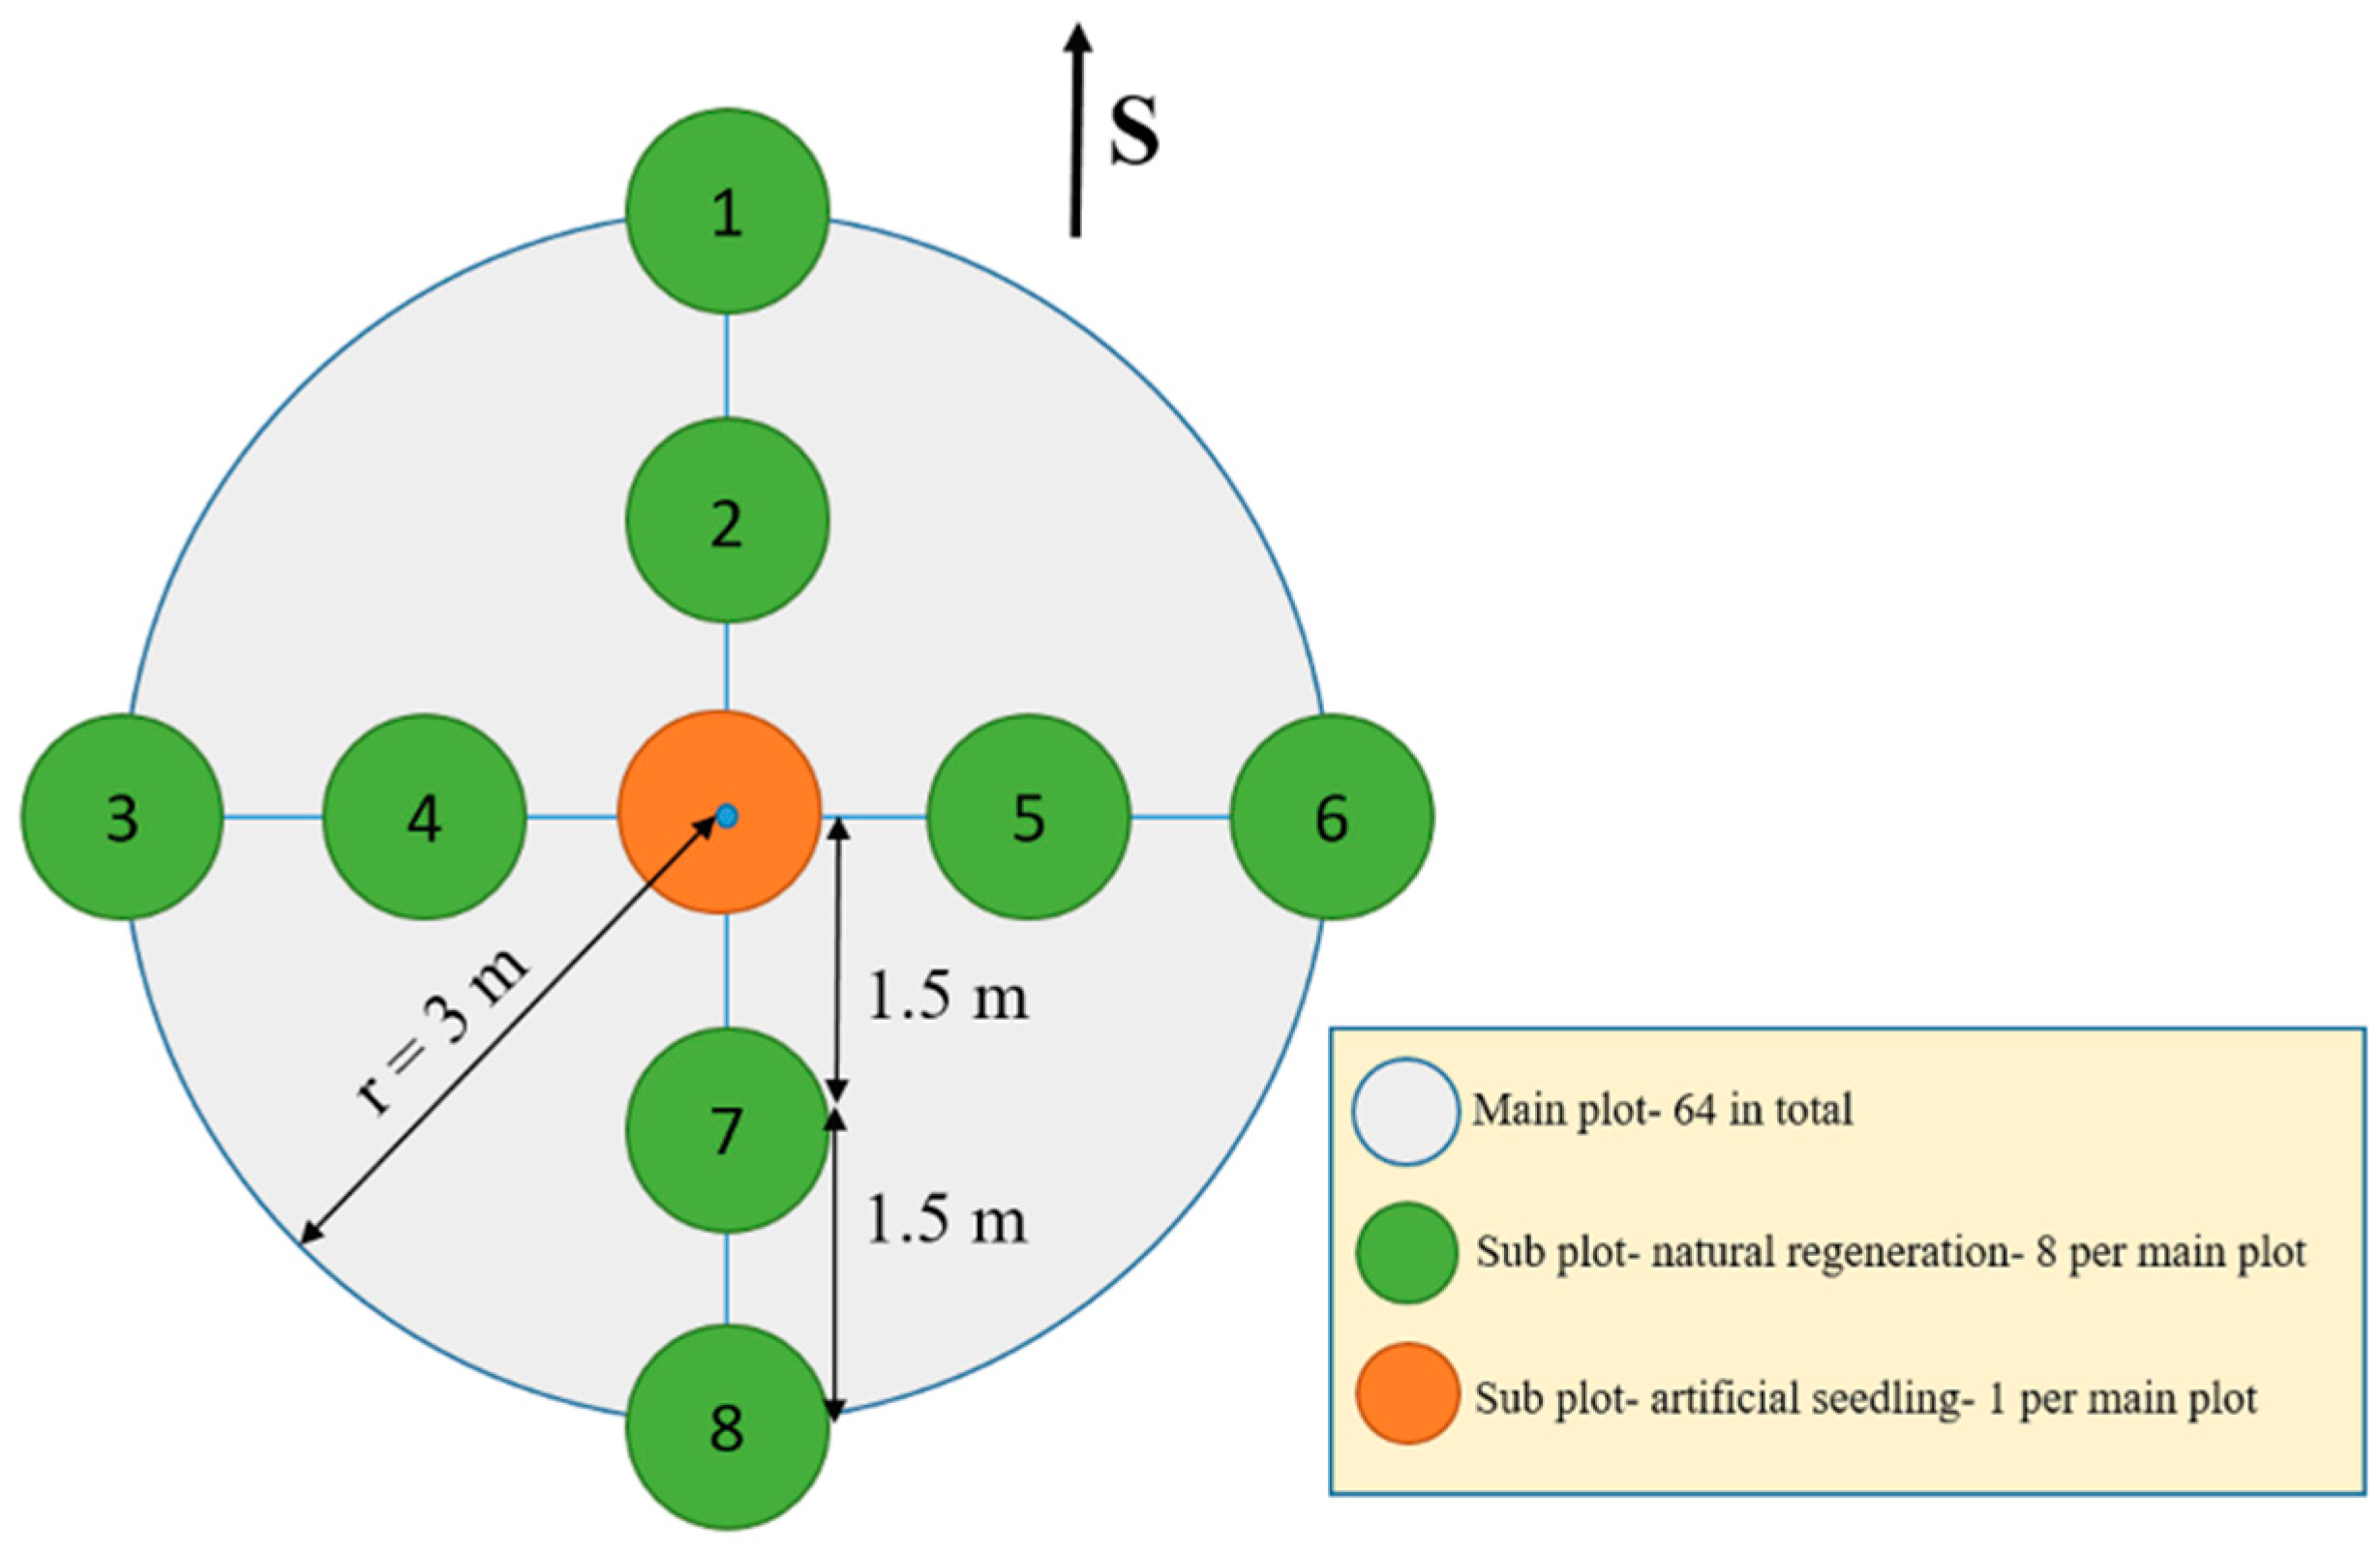
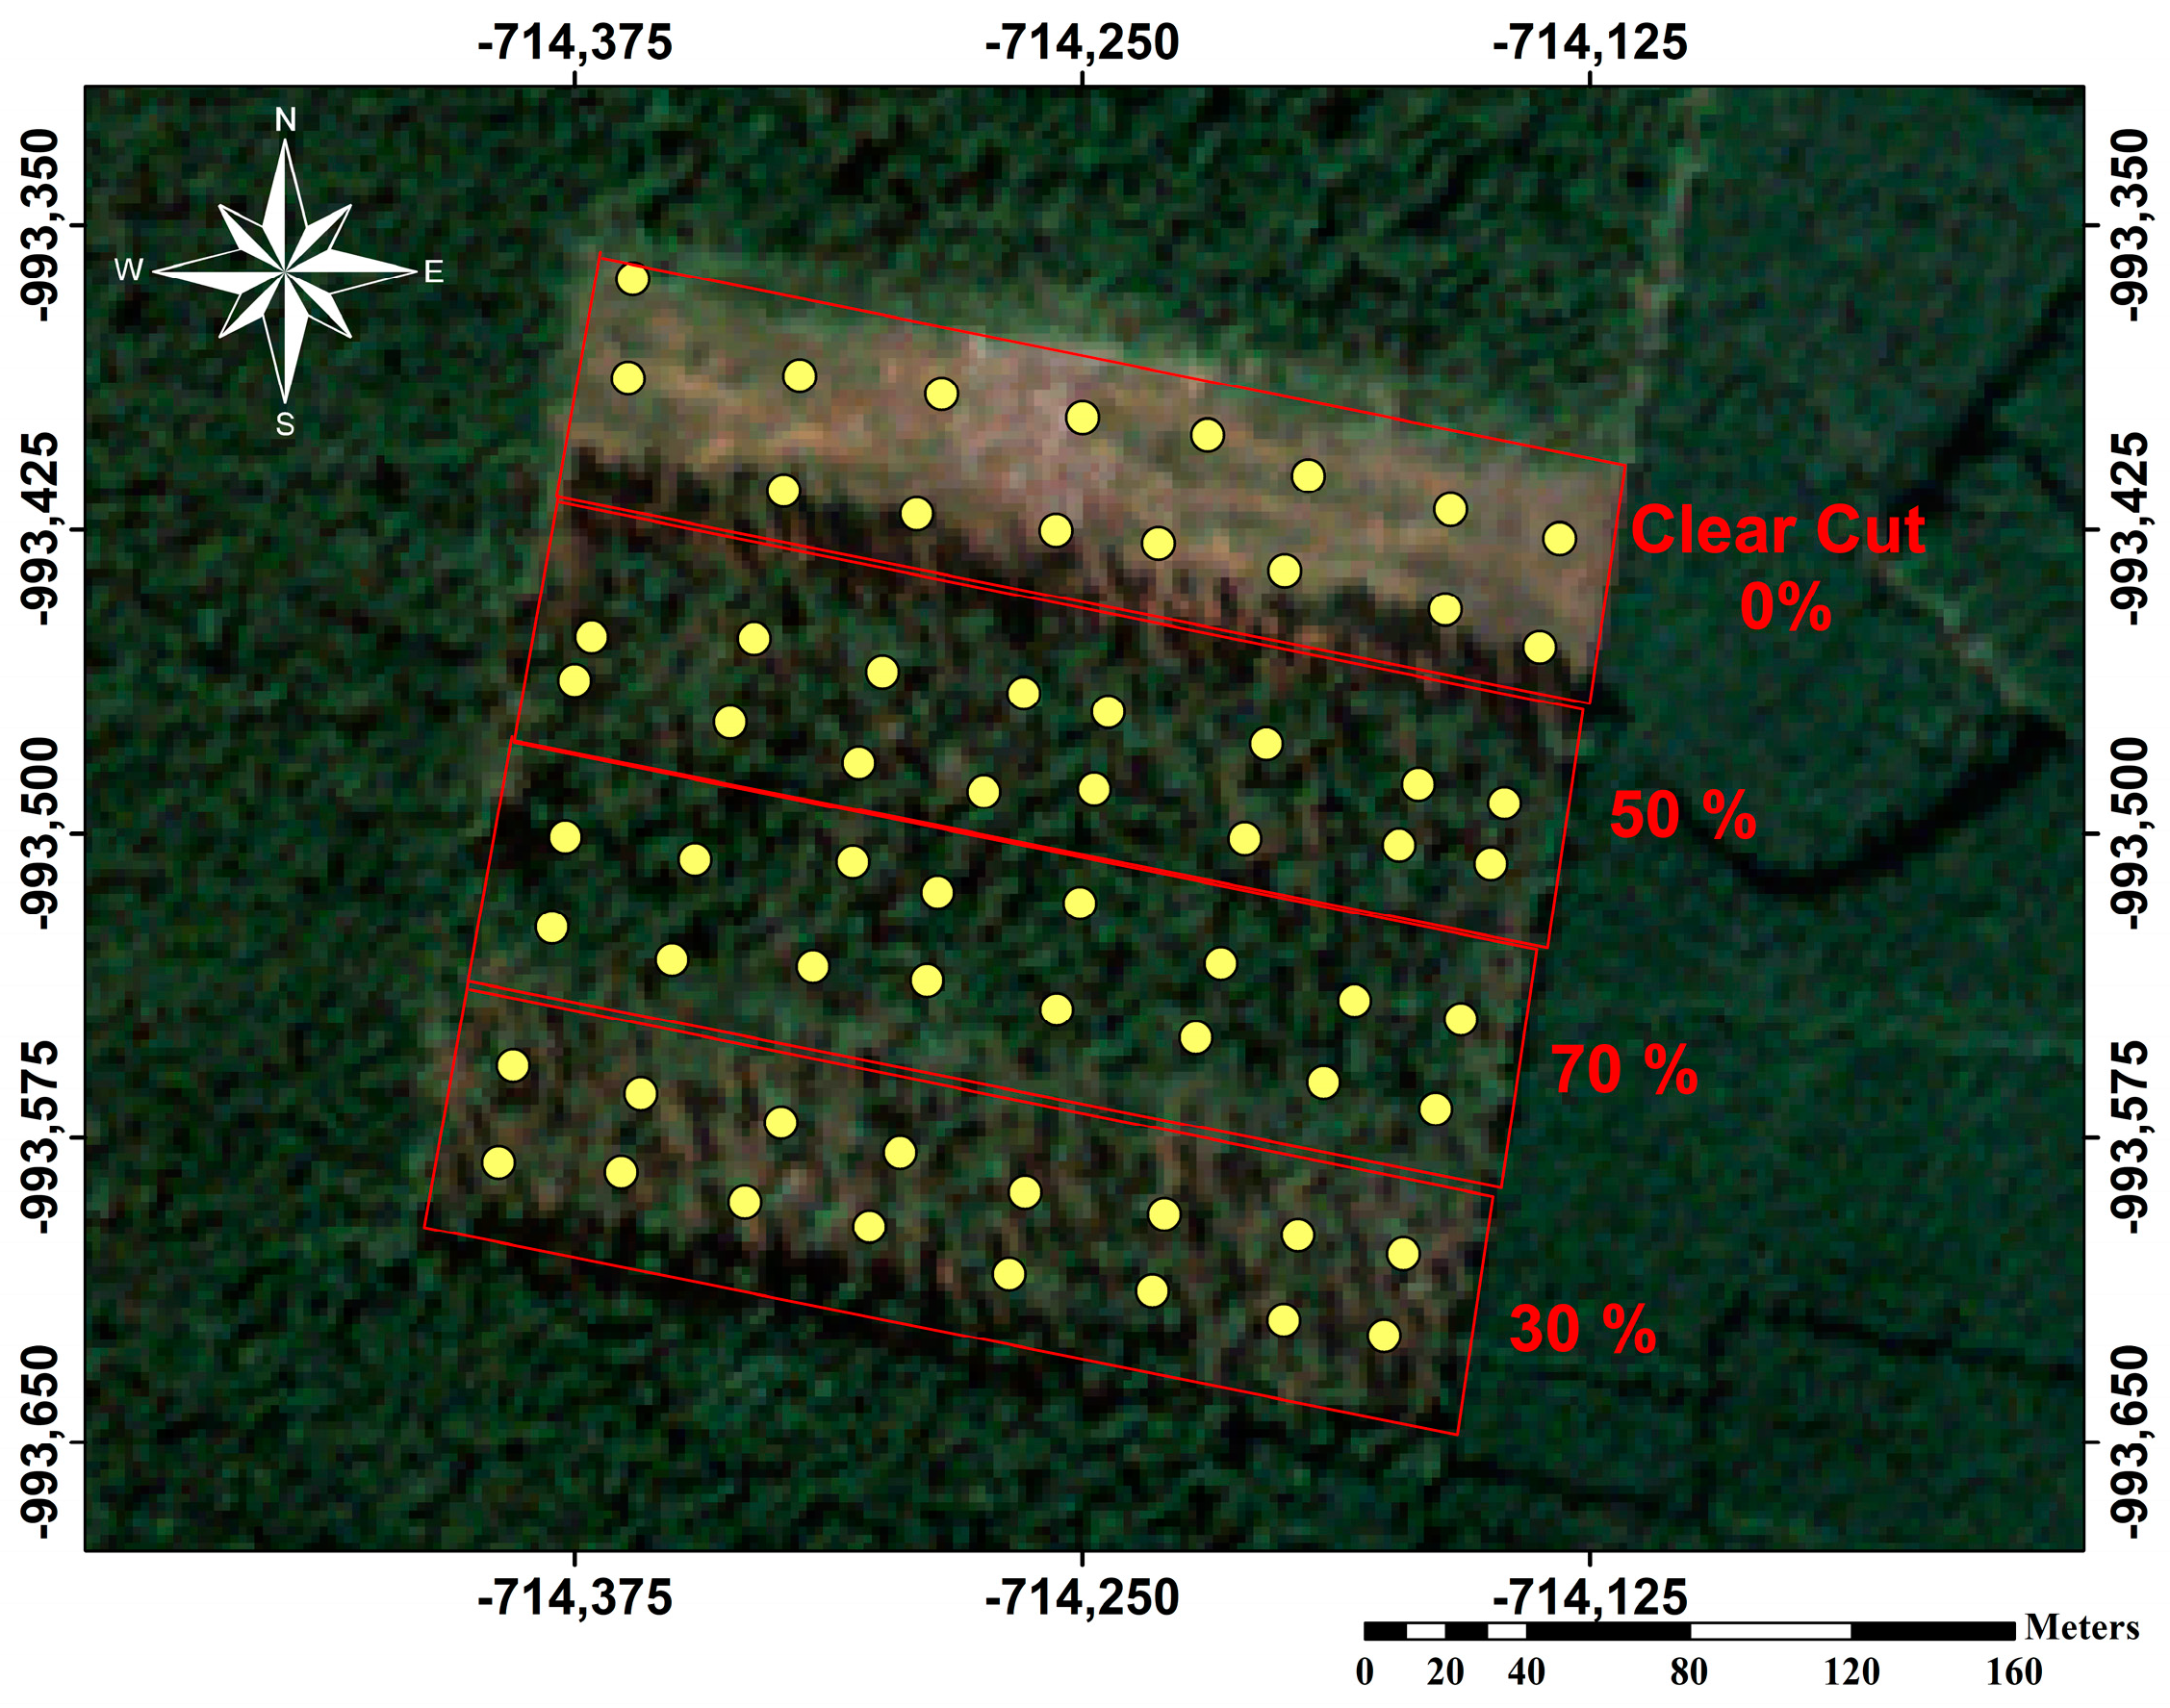
2.1.1. Experimental Plot Design

Different thinning intensities were applied to differentiate the whole area into four different compartments. Each compartment contains rectangular strips with an area of 1.5 ha (rectangle of dimensions 60 × 250 m2). Using a thinning control, the stocking percentage was reduced to 0%, 50%, 70% and 30% of crown canopy cover, as can be seen in Figure 2.
A total station Real Time Kinematic (RTK) TS LEICA TCRP1201 and a portable GNSS LEICA system VIVA with centimeter accuracy were used to measure the position of 10 reference points on the perimeter of the study area.
Additionally, for georeferencing the position of each plot (center), Postex technology was used with 0.1° vertical angle accuracy and distance accuracy of one centimeter, respectively (Figure 3). The positions of sub-sample plots were measured using the azimuth-distance approach based on the central position of each plot. Overall, 512 subplots were measured for natural regeneration, whereas 64 subplots were measured for artificial regeneration.

2.1.2. Pine Regeneration Measurement

The circular areas presented in Figure 2 and Figure 4 had a radius r = 12.6 m (500 m2) in the total number of plots N = 64. In the center of each circular plot, a homocentric circle with a radius of 3 m was made in order to measure the number of regenerations of Pinus sylvestris L. (Figure 4). Smaller circles with a diameter of d = 0.625 m, namely 1 to 8, represent sub-sample plots for natural regeneration, whereas the central part of each plot was used for artificial regeneration evaluation and 200 seeds were sown there. The number of seedlings in each plot was counted every month during the vegetation season and at the end of vegetation season in October.

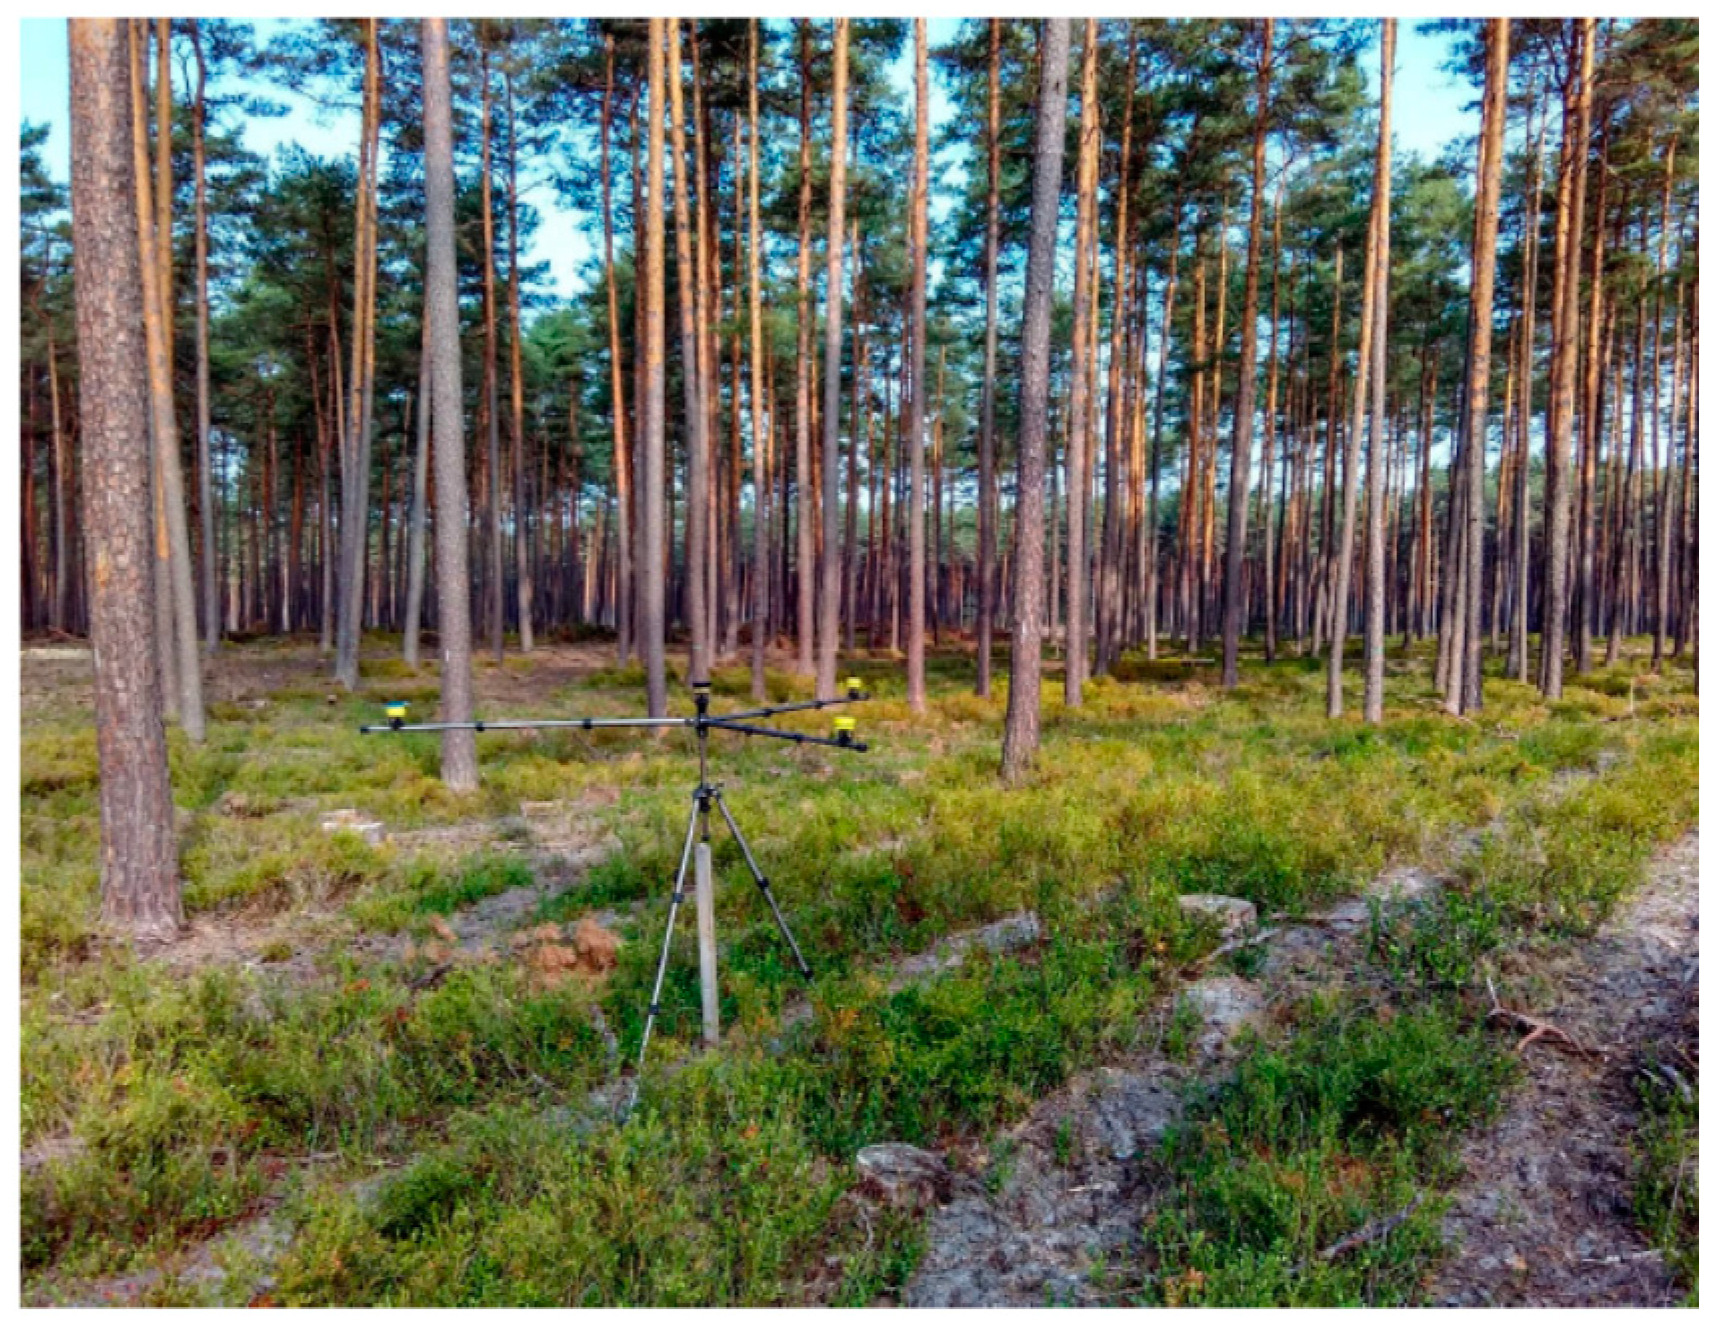
2.2. Acquisition of Data

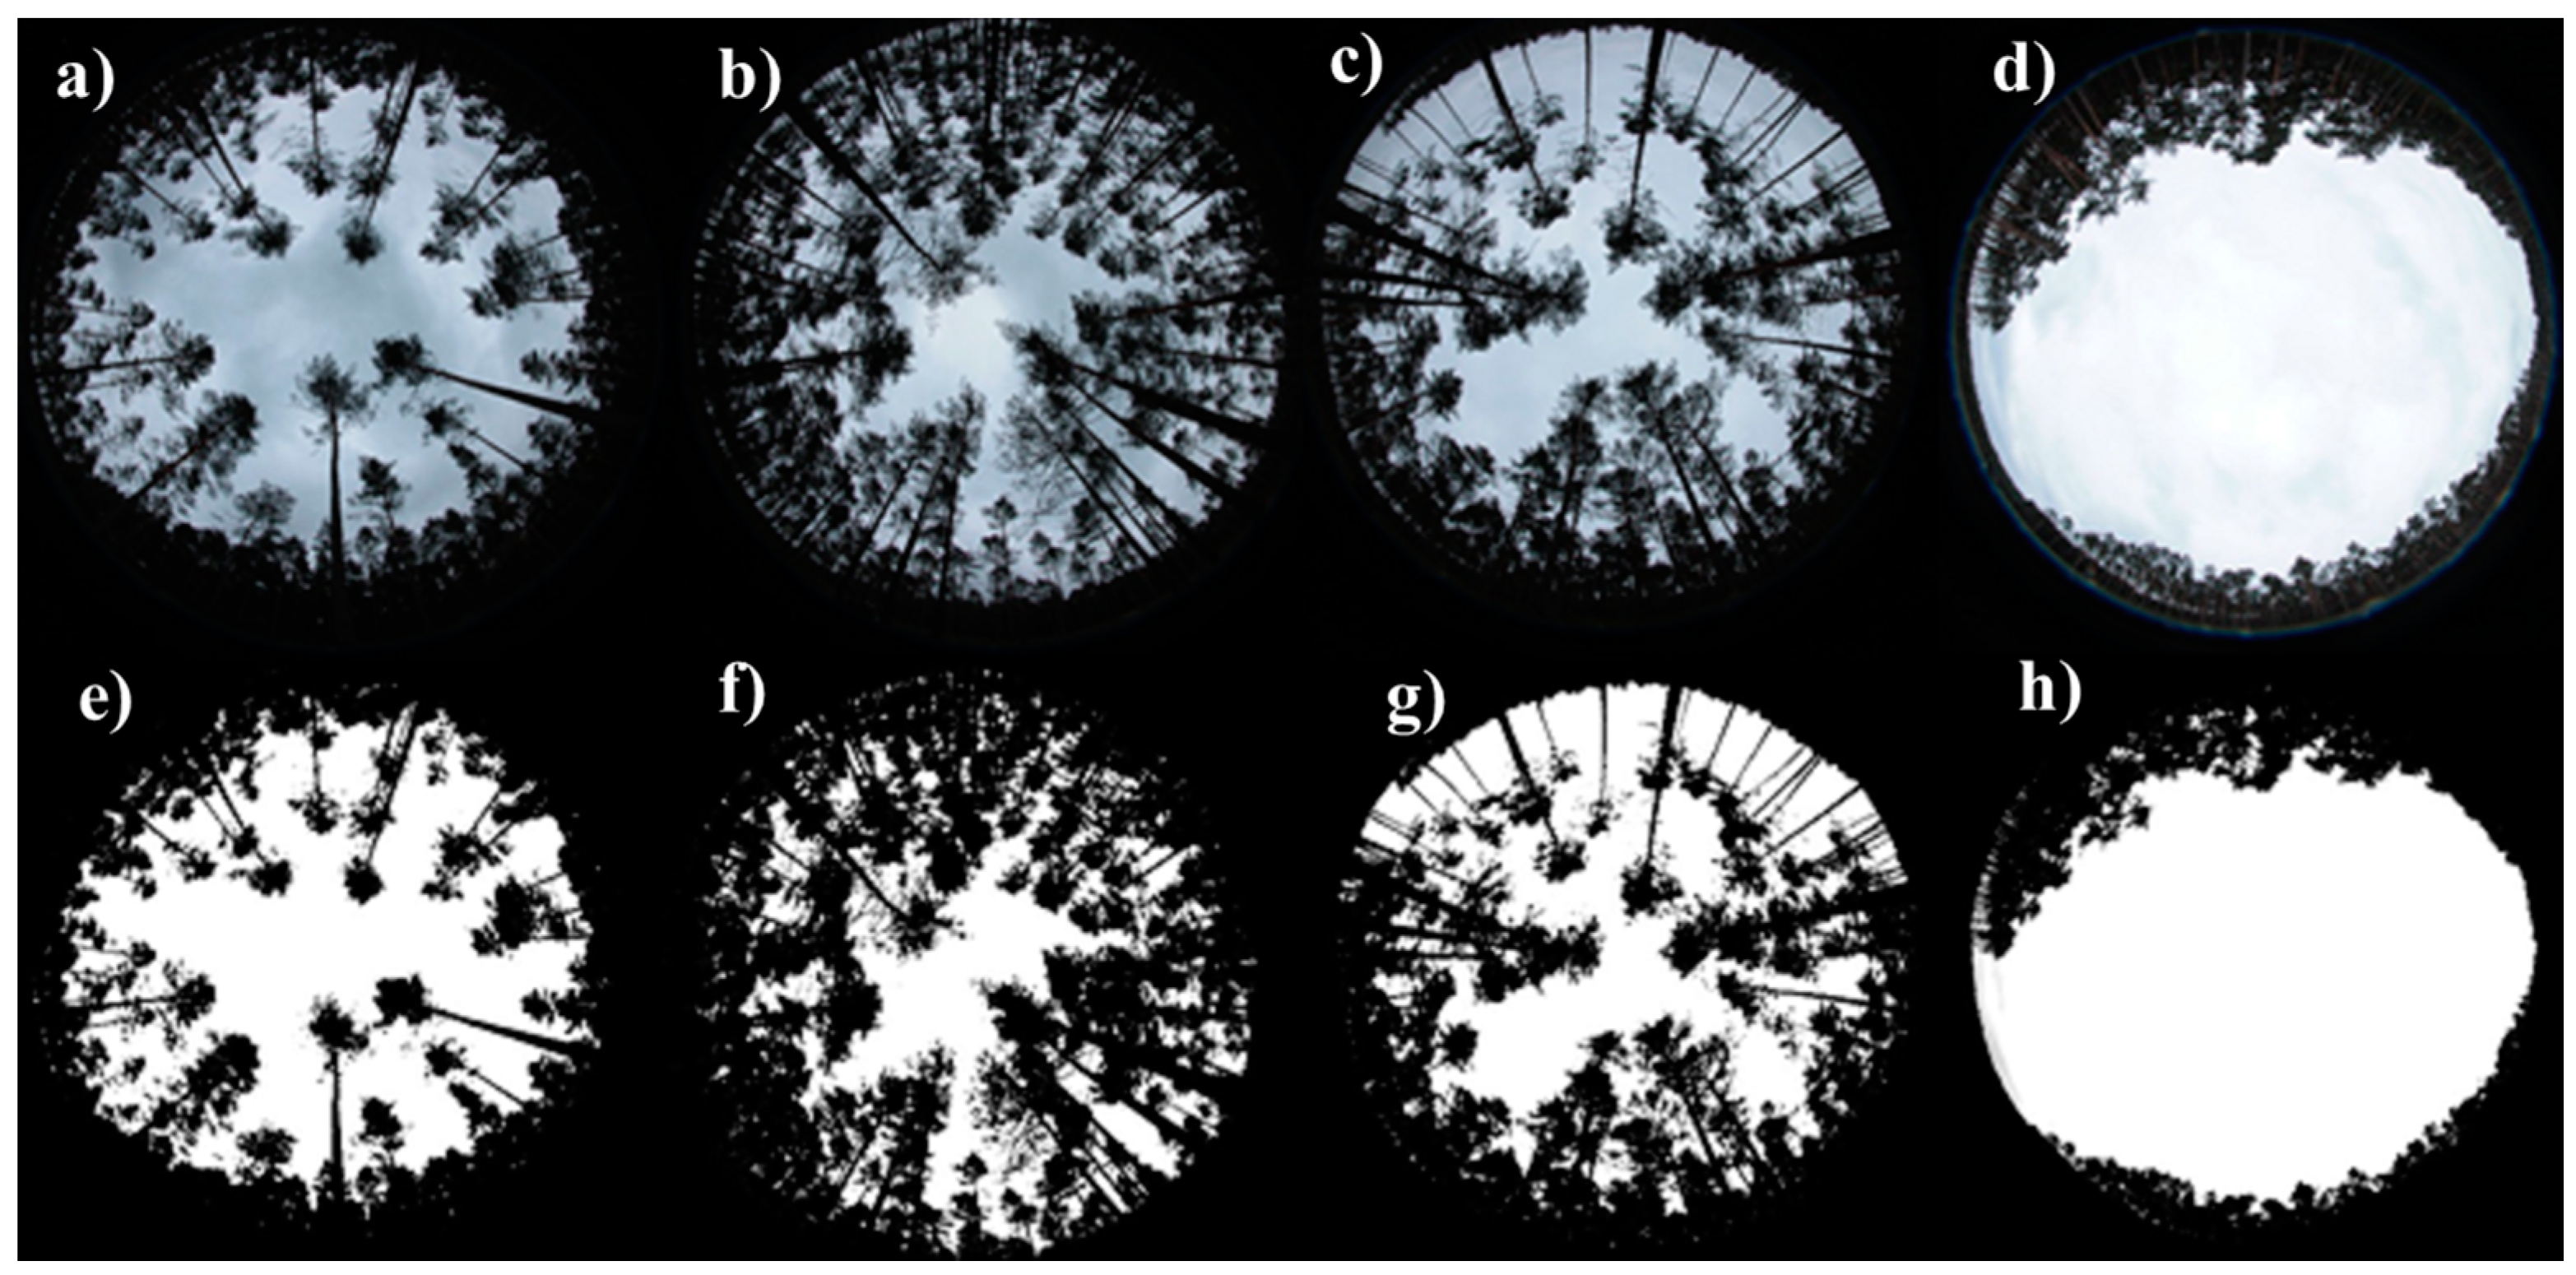
2.2.1. Hemispheric Photography

Potential light conditions within canopies were assessed by obtaining hemispherical images (Figure 5) on a cloudy day, 12 November 2016, in the morning (8:00–10:00 a.m.). A Sigma circular fisheye lens (180° diagonal angle of view), focal length 4.5 (Equivalent 35 mm) f/2.8 and a Canon EOS 1100D digital camera, ISO 100; aperture priority were used. Three images (4272 × 2848 pixel) with shifted exposition were taken using the so-called bracketing function (underexposed −2, −1, 0) to ensure higher contrast between canopy and sky, at 1.3 m height in the center of each sampling plot (Figure 4). Geographical orientation was ascertained prior to taking the photo (with the upper part of the camera pointing to the north), which is necessary to correct the computation of light parameters by WinSCANOPY 2012a Pro version (Regent Instruments Inc., Ville de Québec, QC, Canada).
The calculation employs slope (in this case none), slope aspect (to the north), sky conditions (cloudy) and altitude, latitude and longitude (50°33′43.20′′N; 14°43′34.35′′E) as entry parameters of the site and three levels of sharpening intensity as parameters for photos' preliminary processing.
Afterwards, the best (the most contrasting) images from the series were adjusted in Photoshop 8 image editor to a black and white version (Figure 5). To calibrate the process of the photos' conversion from colored to black and white, we used a random sample of 10 photo triads (one with automatic exposure and two underexposed). The standard deviation of crown openness detection was 4.7% for the different light aspects calculated from triads of photos.
The selected light parameters were computed using standard procedures in WinSCANOPY pro 2012a software for canopy analysis, by estimating the following: (i) sky openness (fraction of open sky unobstructed by vegetation above the lens in three-dimensional space); (ii) relative direct and diffuse photosynthetically active flux density under canopy average for the growing season (in MJ/m2·day); and (iii) its total (direct + diffuse flux density).
The calculation employs slope (in this case none), aspect (to the north) and given altitude, latitude and longitude (PPFD direct 3.88 MJ/m2·day, PPFD diffuse 5.08 MJ/m2·day, PPFD total 38.96 MJ/m2·day). The growing season period was defined from 1 April to 30 October.

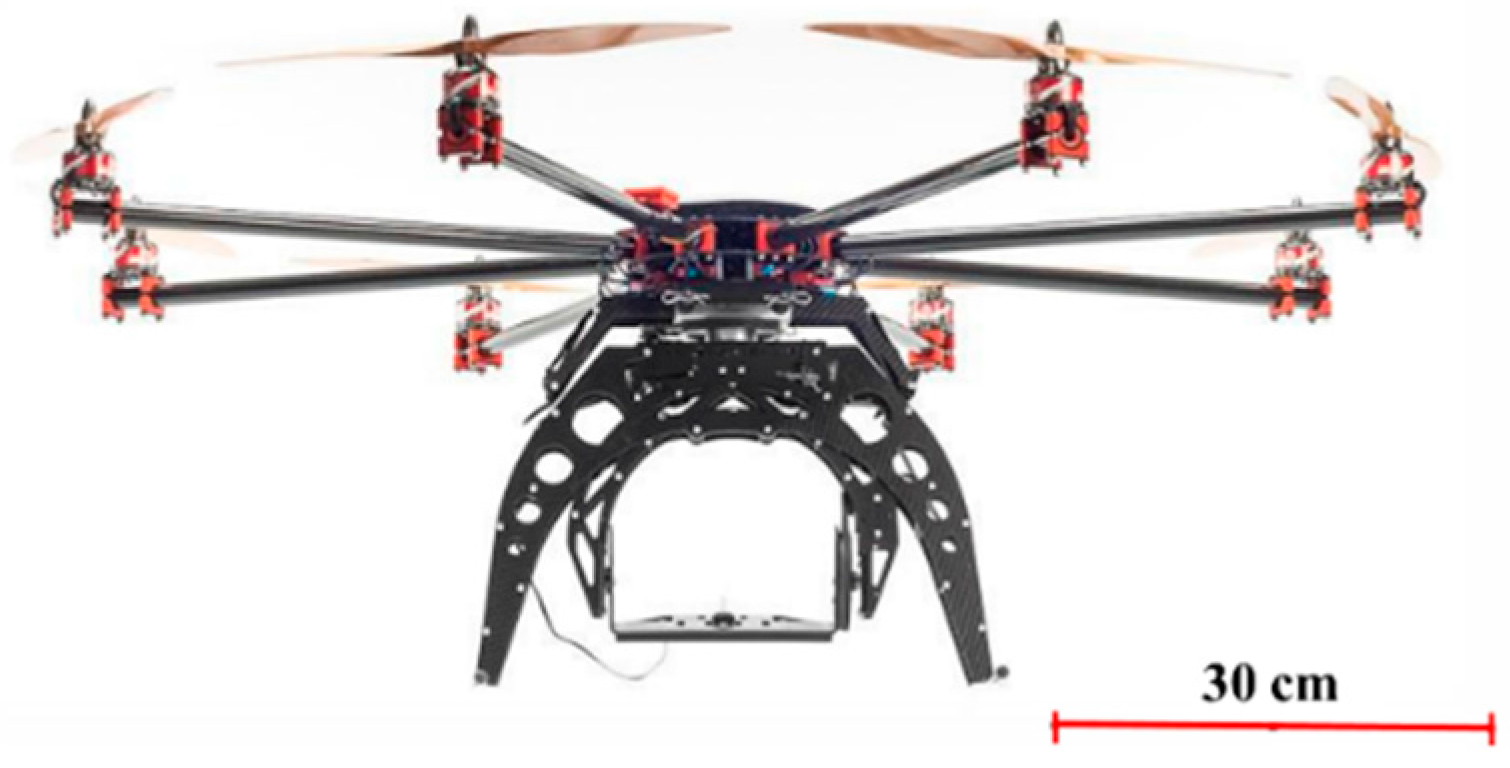
2.2.2. Acquisition of UAV Imagery

The UAV platform which was used was octocopter SteadiDrone EI8HT RTF (ROBOTS IN SEARCH INC.: Aurora, Canada). As can be seen in Figure 6, it was embedded with an uncalibrated camera, Sony Alpha 6000 high resolution 24.3 megapixels APS-C CMOS sensor and had an adjusted focal length of 25 mm. For better performance during the data acquisition, the copter was guided by a Dà-Jiāng Innovations Science and Technology Co., Ltd (DJI) ground station to ensure autonomous stabilization and way-point based navigation. The route was planned for a height of 60 m with 85% frontal overlapping and 70% side overlapping, while it needed approximately 8 min to complete a flight, based on the predefined parameters (i.e., number of waypoints). The route was uploaded to the driving unit of the copter (Naza V2), though for security reasons the take-off and landing of the copter were guided by manual radio control. The camera was in automatic mode and a point cloud of images comprising the flight path lines covered the entire study area.
In total, 2341 images were acquired for the SfM image reconstruction process. Due to the low image quality, one of the original 2341 images was excluded from the alignment process using Agisoft Photoscan© V. 1.2.7 (Agisoft LLC: St. Petersburg, Russia). For optimization of the 3D model and before the alignment process, we set the accuracy to high. This step is important because it is the process where the algorithm (SfM) is trying to find and match points between overlapping images and refine the image positions for each photograph separately (Figure 7). The georeferencing of the point cloud was done using a combination of direct-georeferencing and Ground Control Points (GCPs). Even though an on-board GPS module can offer significant accuracy for short base-lines, we additionally used four GCPs randomly distributed within the plot. The GCPs were marked and measured with geodetic RTK GPS (the same one used for the terrestrial measurements) with centimeter accuracy in the field, to further enhance the accuracy of the output model.

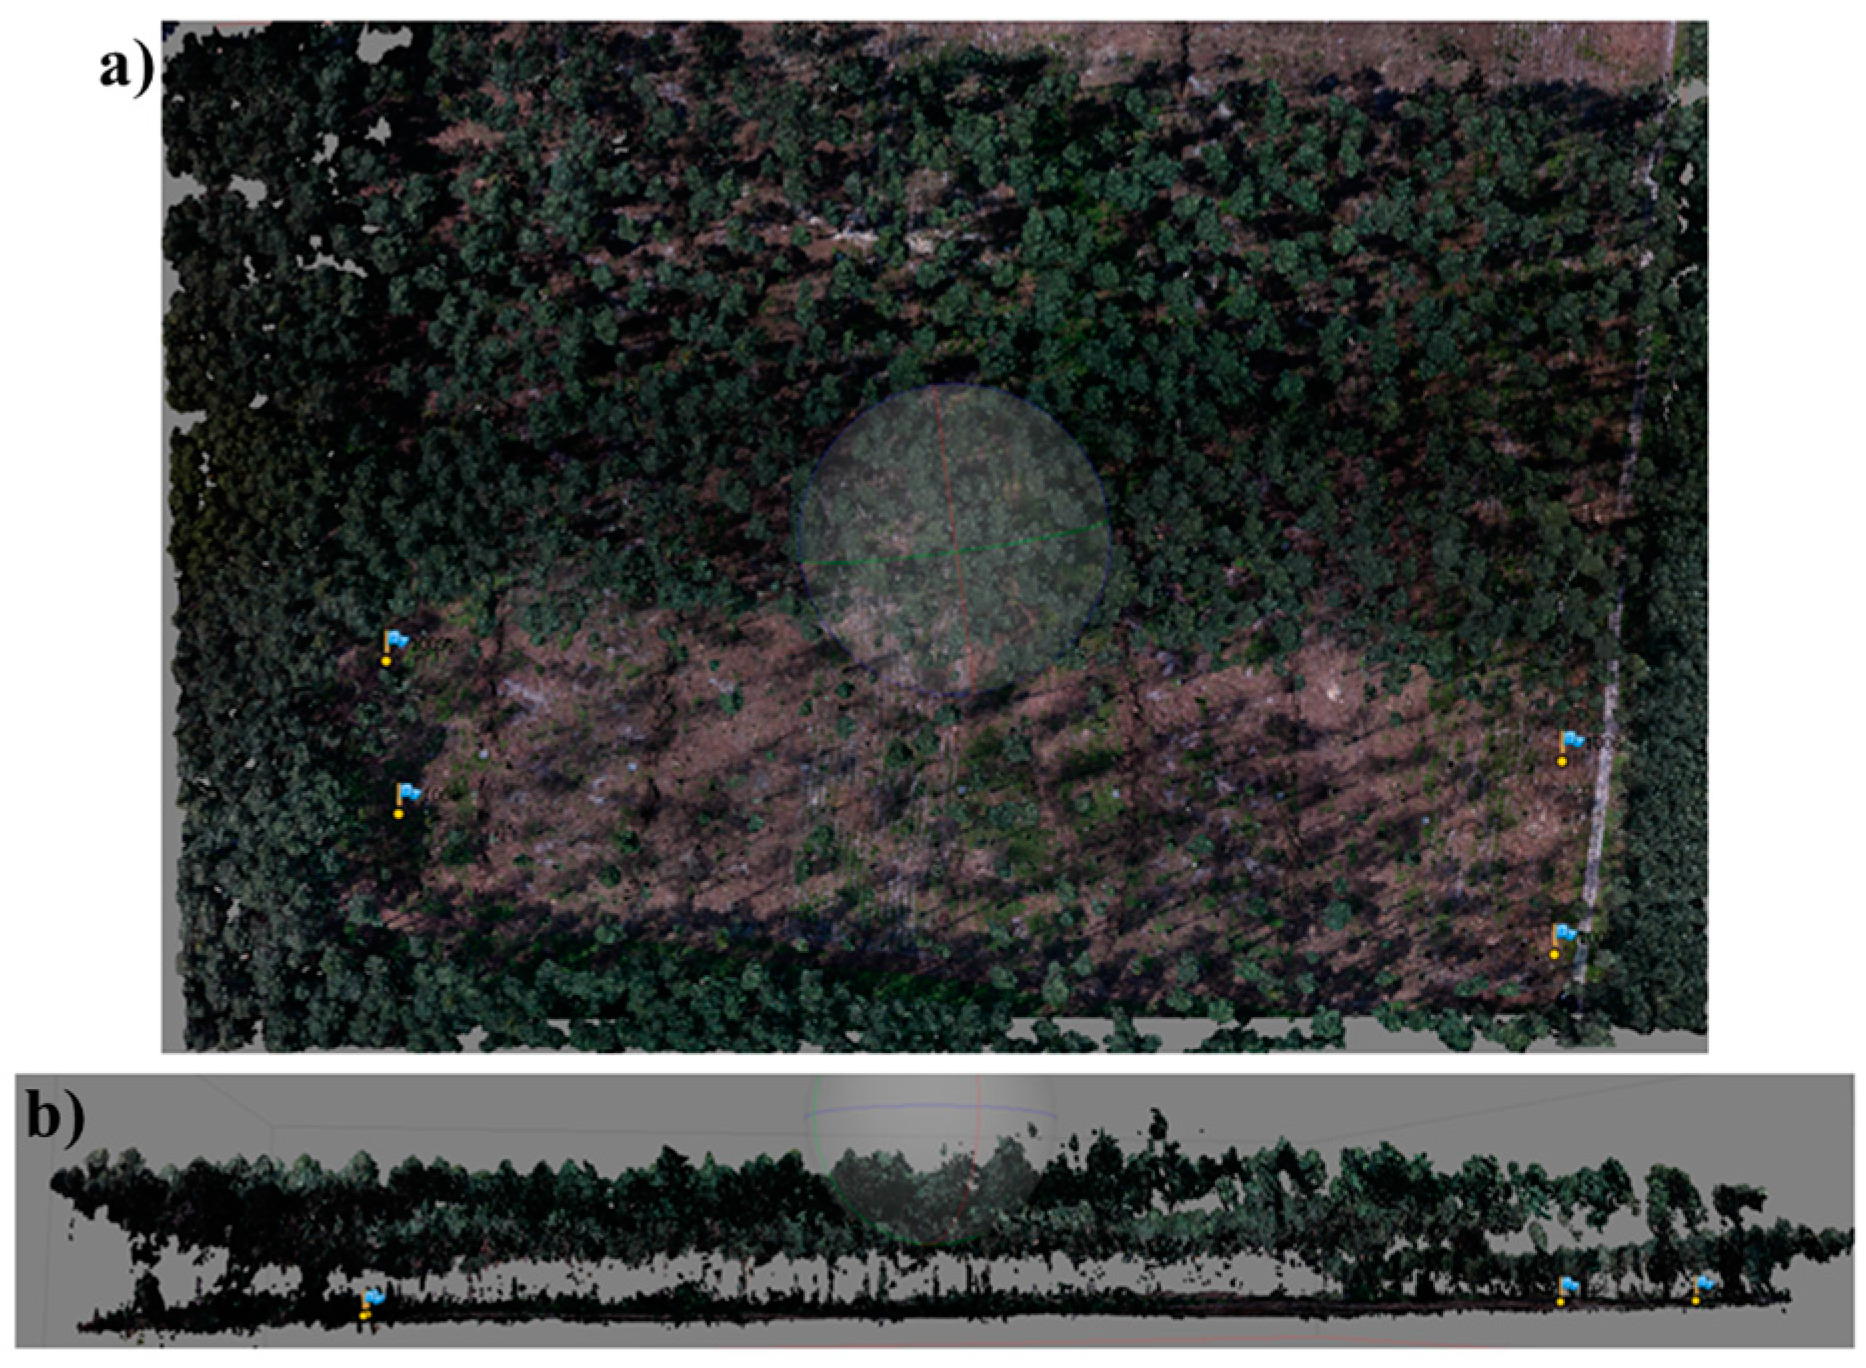
2.3. Study Area Model Reconstruction

We also used the same software to construct the Digital Terrain Model (DTM) and Digital Surface Model (DSM) from the dense 3D point cloud model with a 5-cm cell size (0.05 × 0.05 m2). In order to classify the dense point cloud, we used the automatic division tool in Agisoft Photoscan© V. 1.2.7 for classifying all the points into two classes—ground points and the rest—through the Triangulated Irregular Network (TIN) method. For this case study, the parameters that we used for the automatic ground classification was based on the following: (i) maximum angle set to 14 degrees; (ii) max distance 2.5 m; and (iii) cell size in meters remained the same. After this process, each class was colored with a unique color.

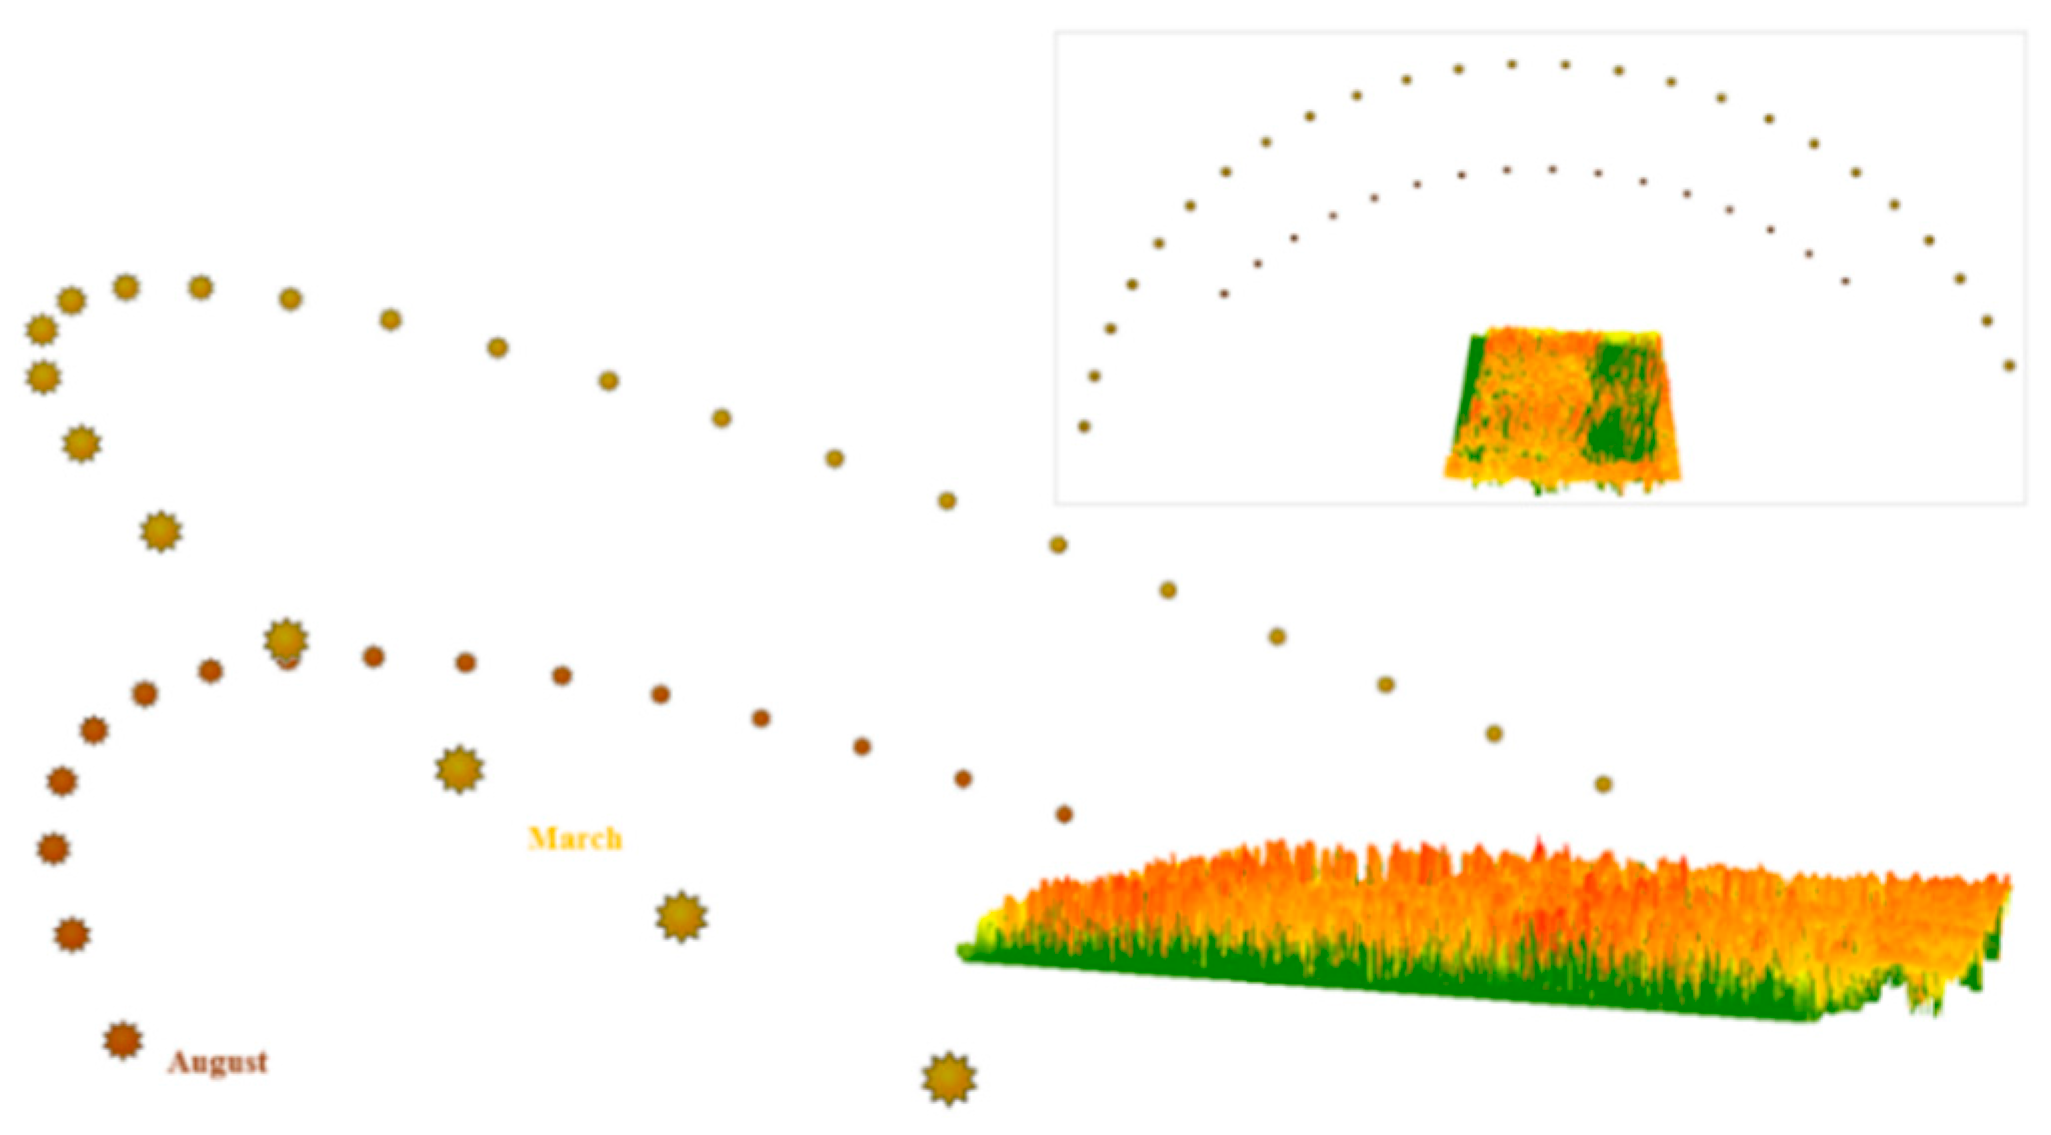
2.4. Solar Radiation Analysis

Before any process, we calculated the CHM by subtracting the DSM from the DTM using ArcGIS 10.3.1 by ESRI©. For the sake of process simplicity, we resized the CHM from 5 cm to 1 m, so each single pixel covers a 1 m2 area. Afterwards, we constructed the sun skymap (Figure 8), during the growing season between 1 April to 30 October, using spatial analyst toolbox in ArcGIS ≥ solar radiation toolset ≥ area solar radiation tool. We used the CHM (1 × 1 m2) as the input layer by using the default options of the area solar radiation tool except the time configuration option, which was set to multiple days in a year (growing season).
In addition, we constructed different types of potential solar radiation layers: (a) direct radiation (b) diffuse radiation (c) direct duration (d) total solar radiation, in units of W·h/m2 as can be better seen in Figure 9, using spatial analyst toolbox. Diffuse radiation examination is important; because of its characteristic of being reflected in almost all kinds of surfaces, diffuse light reaches deeper and penetrates well into the lower strata of a forest canopy.

2.5. Statistical Analysis

In order to be able to compare the results of different sources of RS data, initially we converted the different units in an equivalent measurement result. We used Equation (1) to convert the unit of HP data from MJ/m2·day to W·h/m2.
1 W/m2 = 1 J/m2/s
where W refers to watt and J to joule.
After the conversion, linear regression was used in order to model the relationship between light intensity and regeneration. Box plots, bias and bias% indicators were used to better illustrate the differences between measured data from HP and the UAV.
B i a s = i = 1 n ( y i y j ^ ) n
where n presents number of plots; y i represents measured solar radiation data by HP for plot number i; y j ^ reperesents the sum of the measured solar radiation data by the UAV for whole plots.
B i a s % = B i a s y j ¯ × 100
where y j ¯ is the mean of measured solar radiation data by the UAV. All statistical analyses were conducted in IBM SPSS V.24 (IBM Corporation, Armonk, NY, USA) and Excel (Microsoft Corporation, Albuquerque, NM, USA).

3. Results

As we already mentioned in the methodology, first we constructed a map that shows sun positions in different months of the growing season in order to help us to understand the concept of different amounts of solar radiation (Figure 8).
For further analyses, potential solar radiation maps, such as direct duration, potential direct, diffuse and total radiation were prepared using the produced CHM in ArcGIS, as can be seen in Figure 9.
We evaluated the correlation between the crown openness as a structural parameter of our study area and potential solar radiation components (Figure 10). The results showed a significant correlation of 0.96 at a significance level of α = 0.05 (Table 1). The same table and Figure 10 show a strong uphill coefficient of determination for the amount of total potential solar radiation and openness (0.93), as expected.

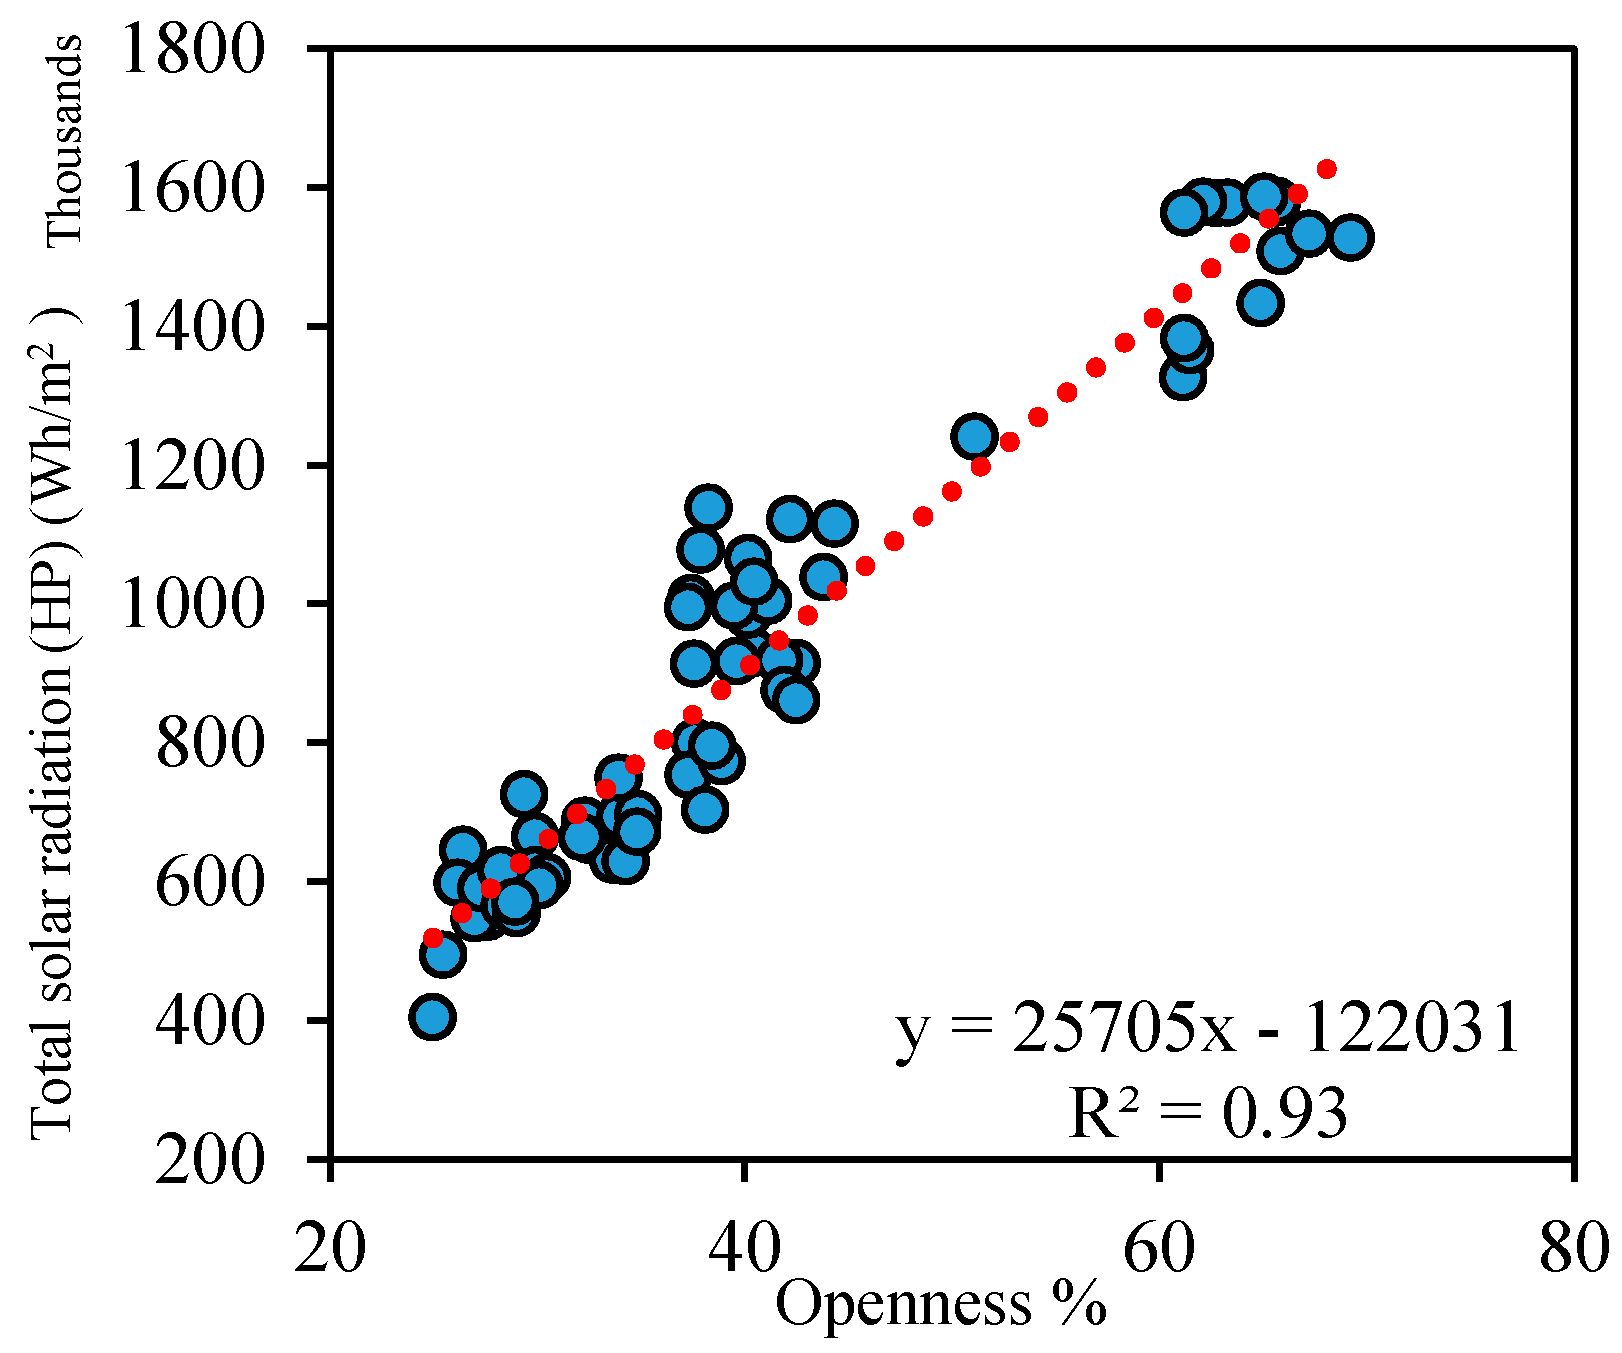
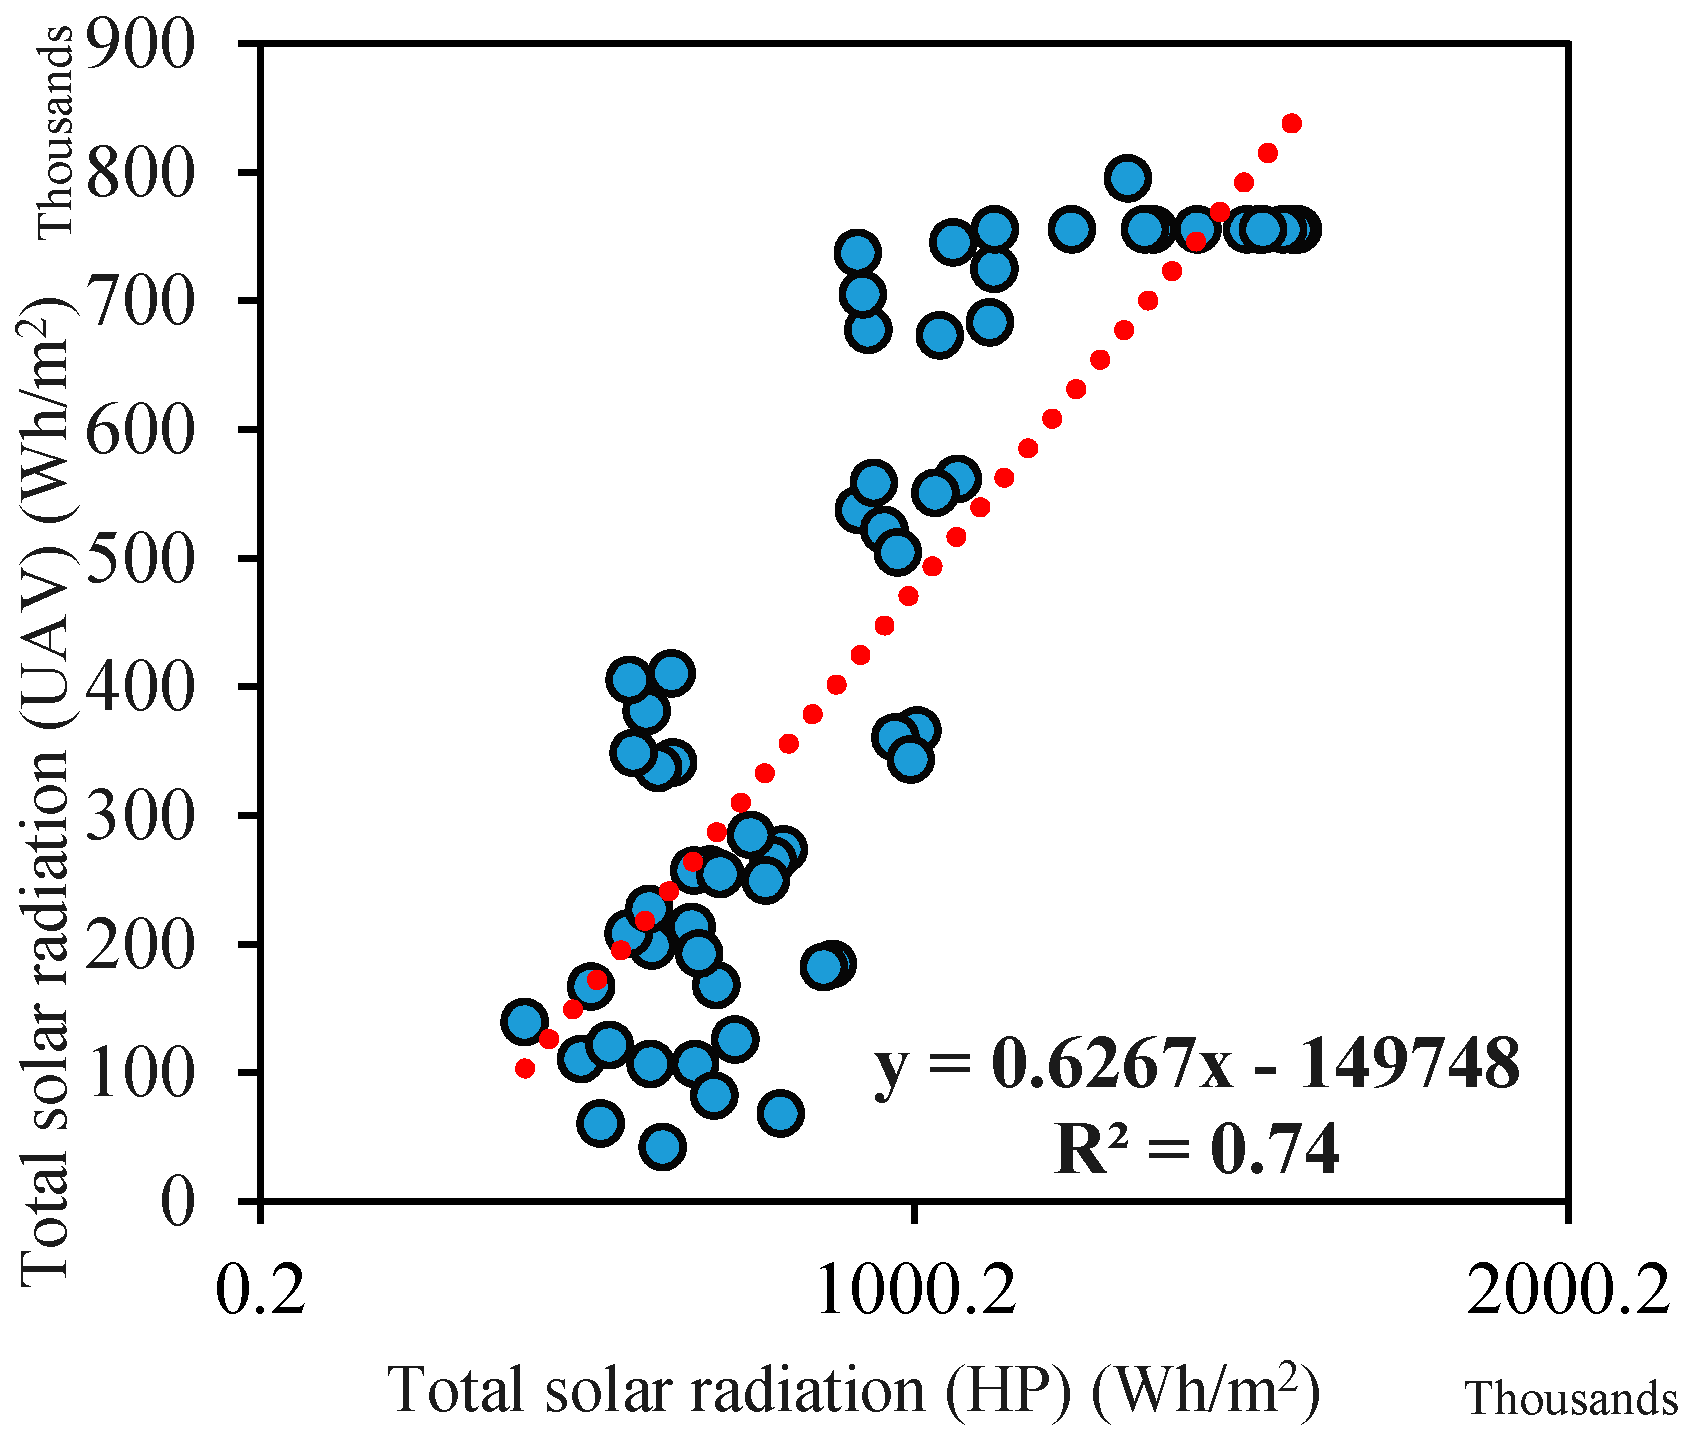
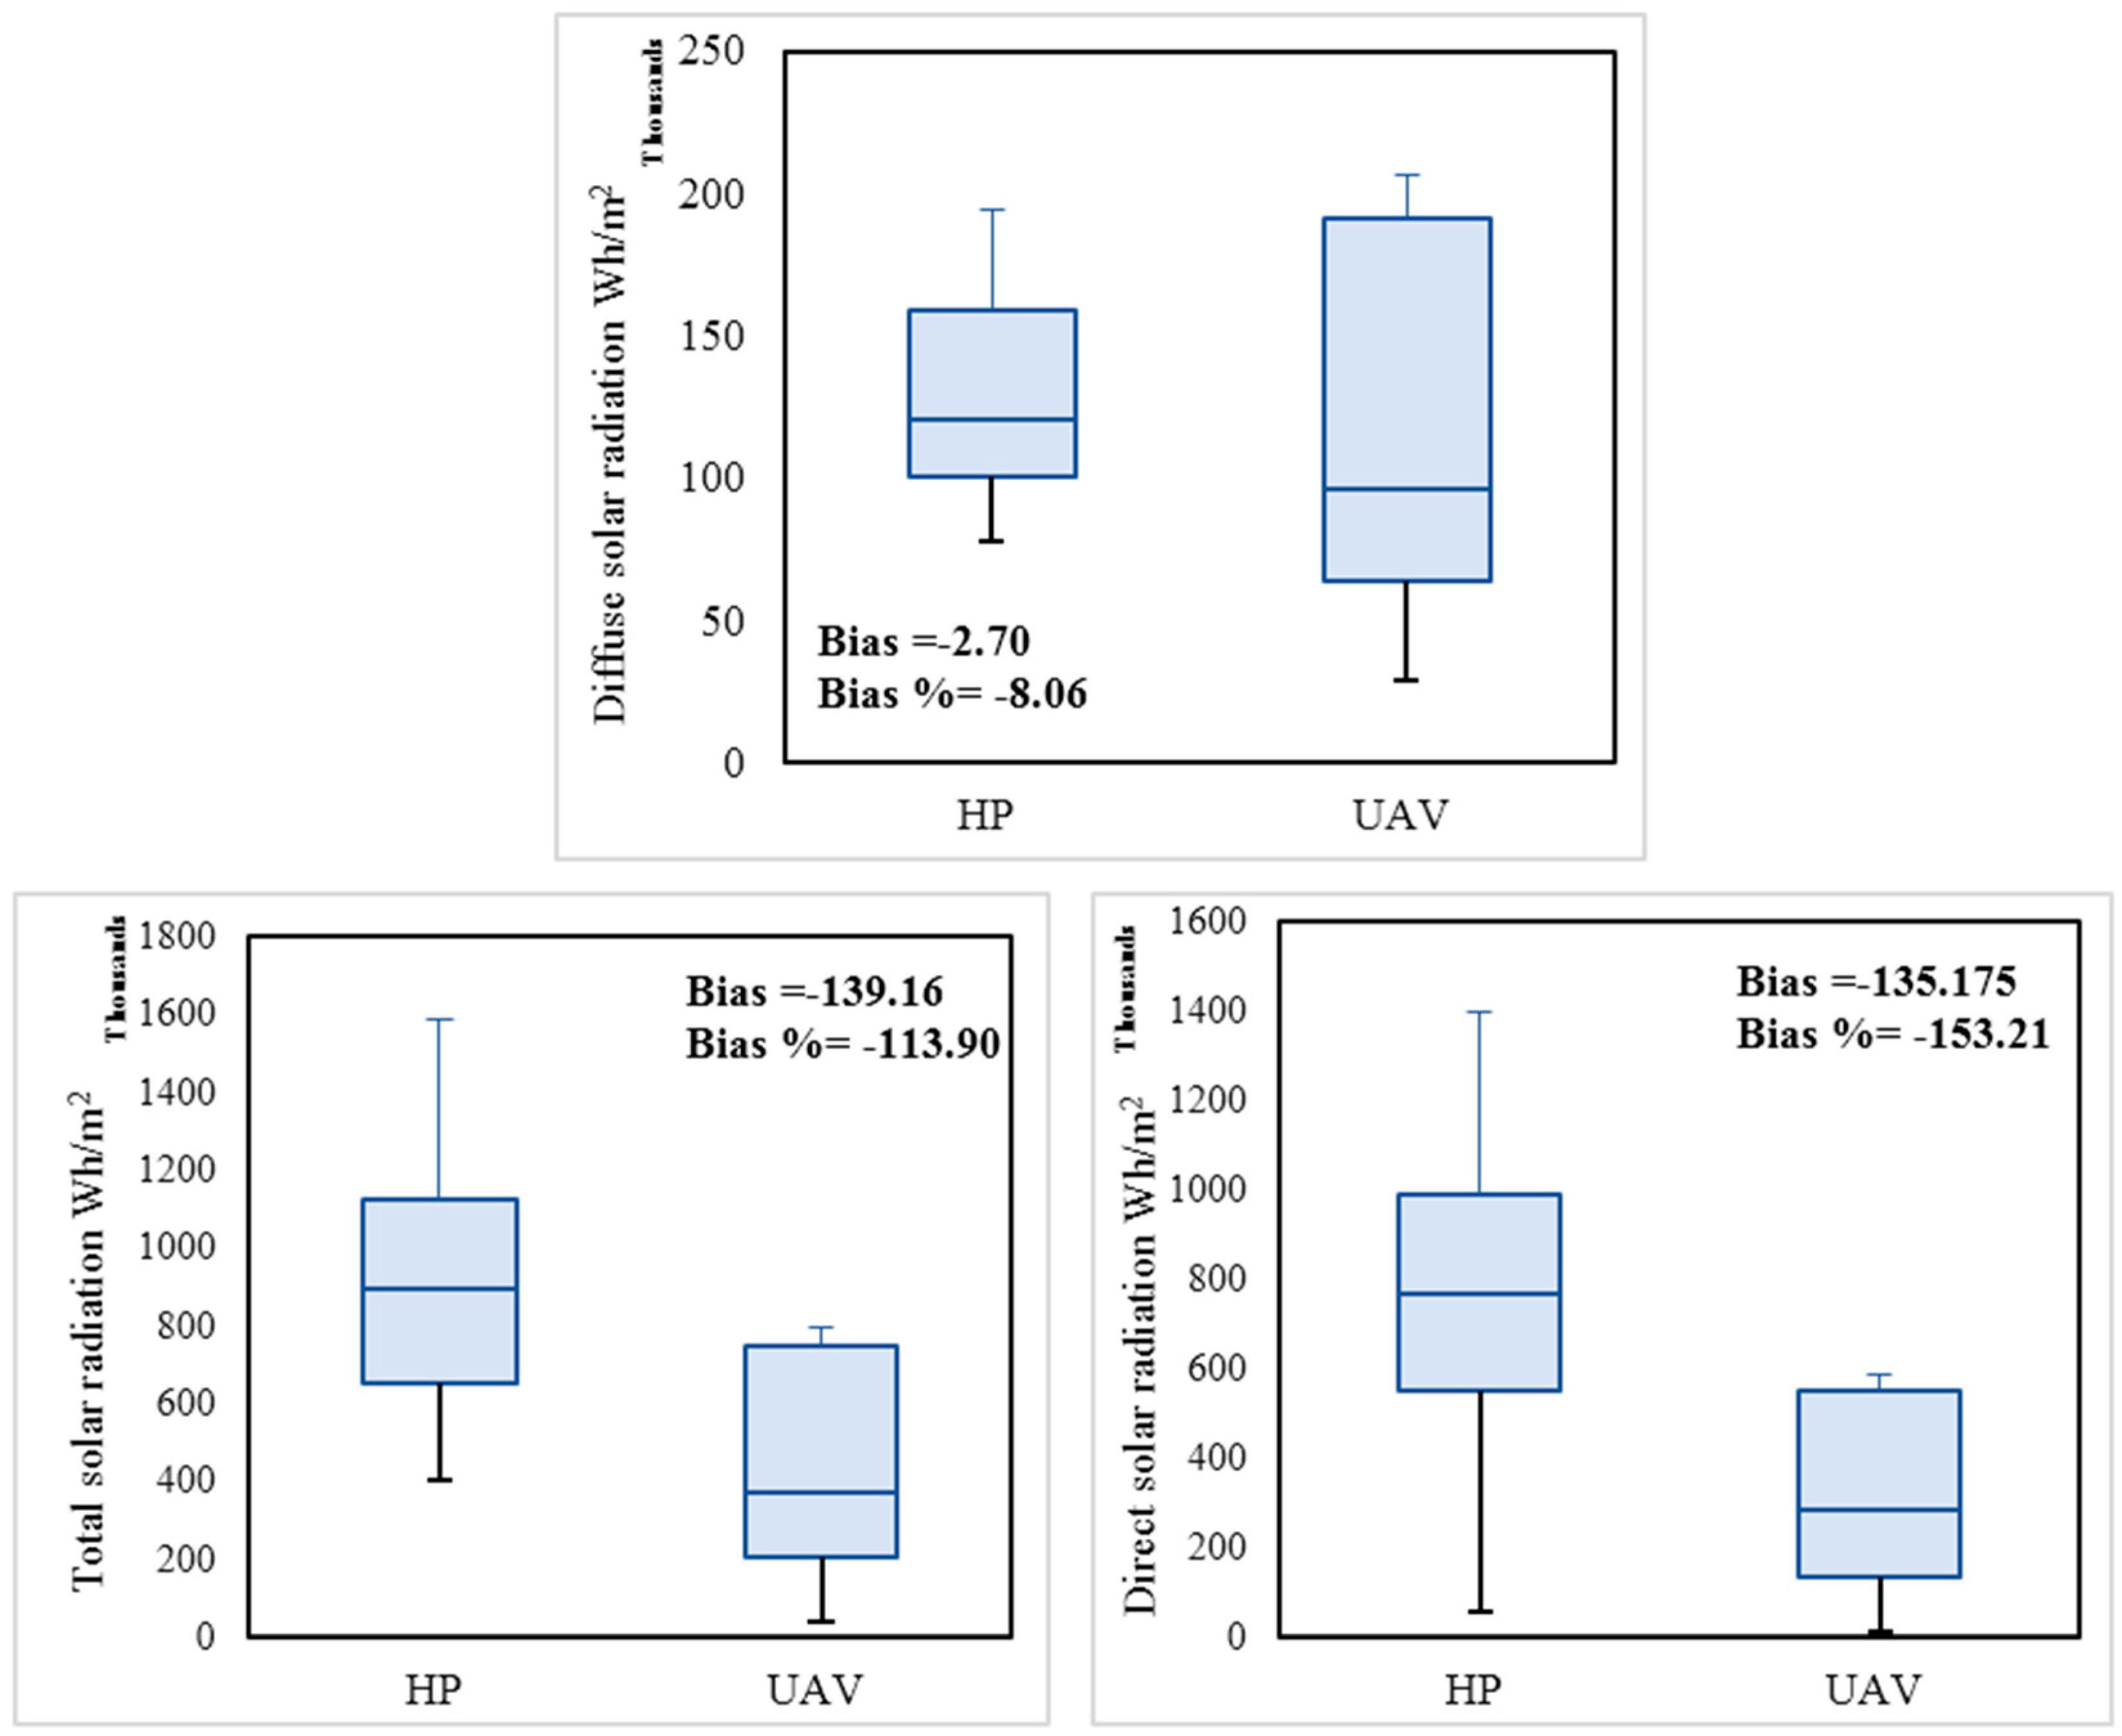
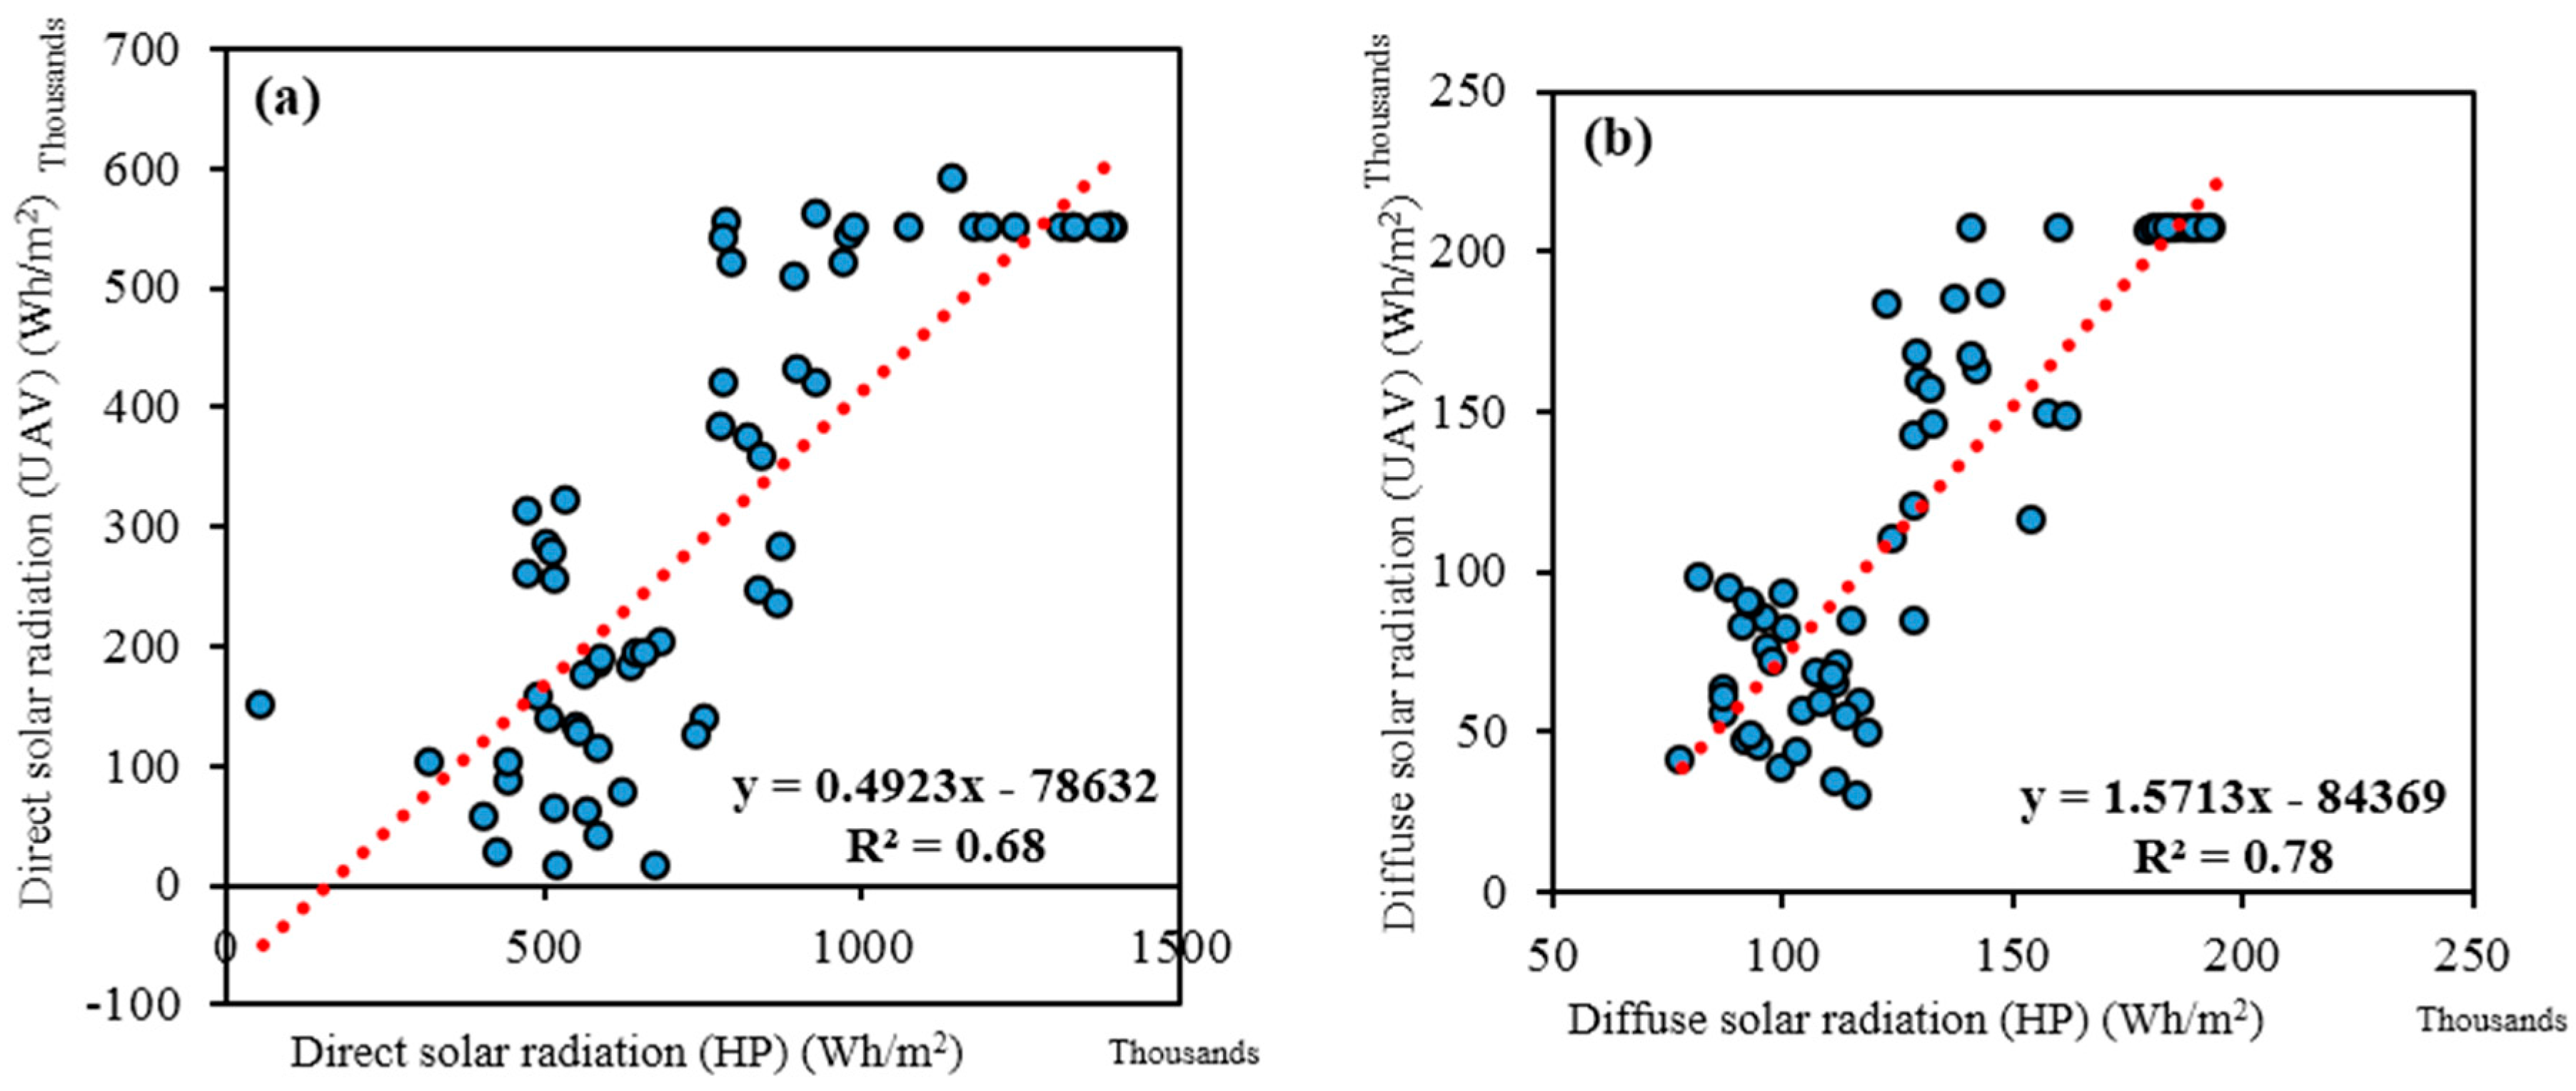
3.1. Investigation of a Correlation between HP and the UAV

The main aim of our work was the examination of the correlation between the two imagery techniques, in order to be able to assess the precision of mapping potential solar radiation factors. The correlation between the ascertained potential total (direct + diffuse) solar radiation parameter using HP and the UAV was statistically high resulting in R2 = 0.74, as can be seen in Figure 11 and Table 2. This correlation was calculated for 64 main plots using the average estimated amount of total solar radiation per square meter. Concerning the investigation of correlation between the potential direct and diffuse radiation derived from the UAV and HP, the results showed a significant correlation of 0.83, with higher relation (R2 = 0.78) for the diffuse solar radiation and lower for the direct (R2 = 0.68), as can be seen in Table 2 and Figure 12. The same table and figure also show that there is a significant difference between potential diffuse and direct radiation in terms of standard error, indicating better a model fit in the case of diffuse radiation.
In general, as shown in Figure 13, and in accordance with the above results, based on median and mean of values, UAV data underestimated potential solar radiation parameters compared to HP. The underestimation of values in the case of potential direct solar radiation was significant and had a direct influence on the underestimation of the total amount of potential solar radiation. The performance of HP and the UAV in estimation of potential diffuse solar radiation was not significantly different due to the small amount of bias (–2.70) and bias% (–8.06).

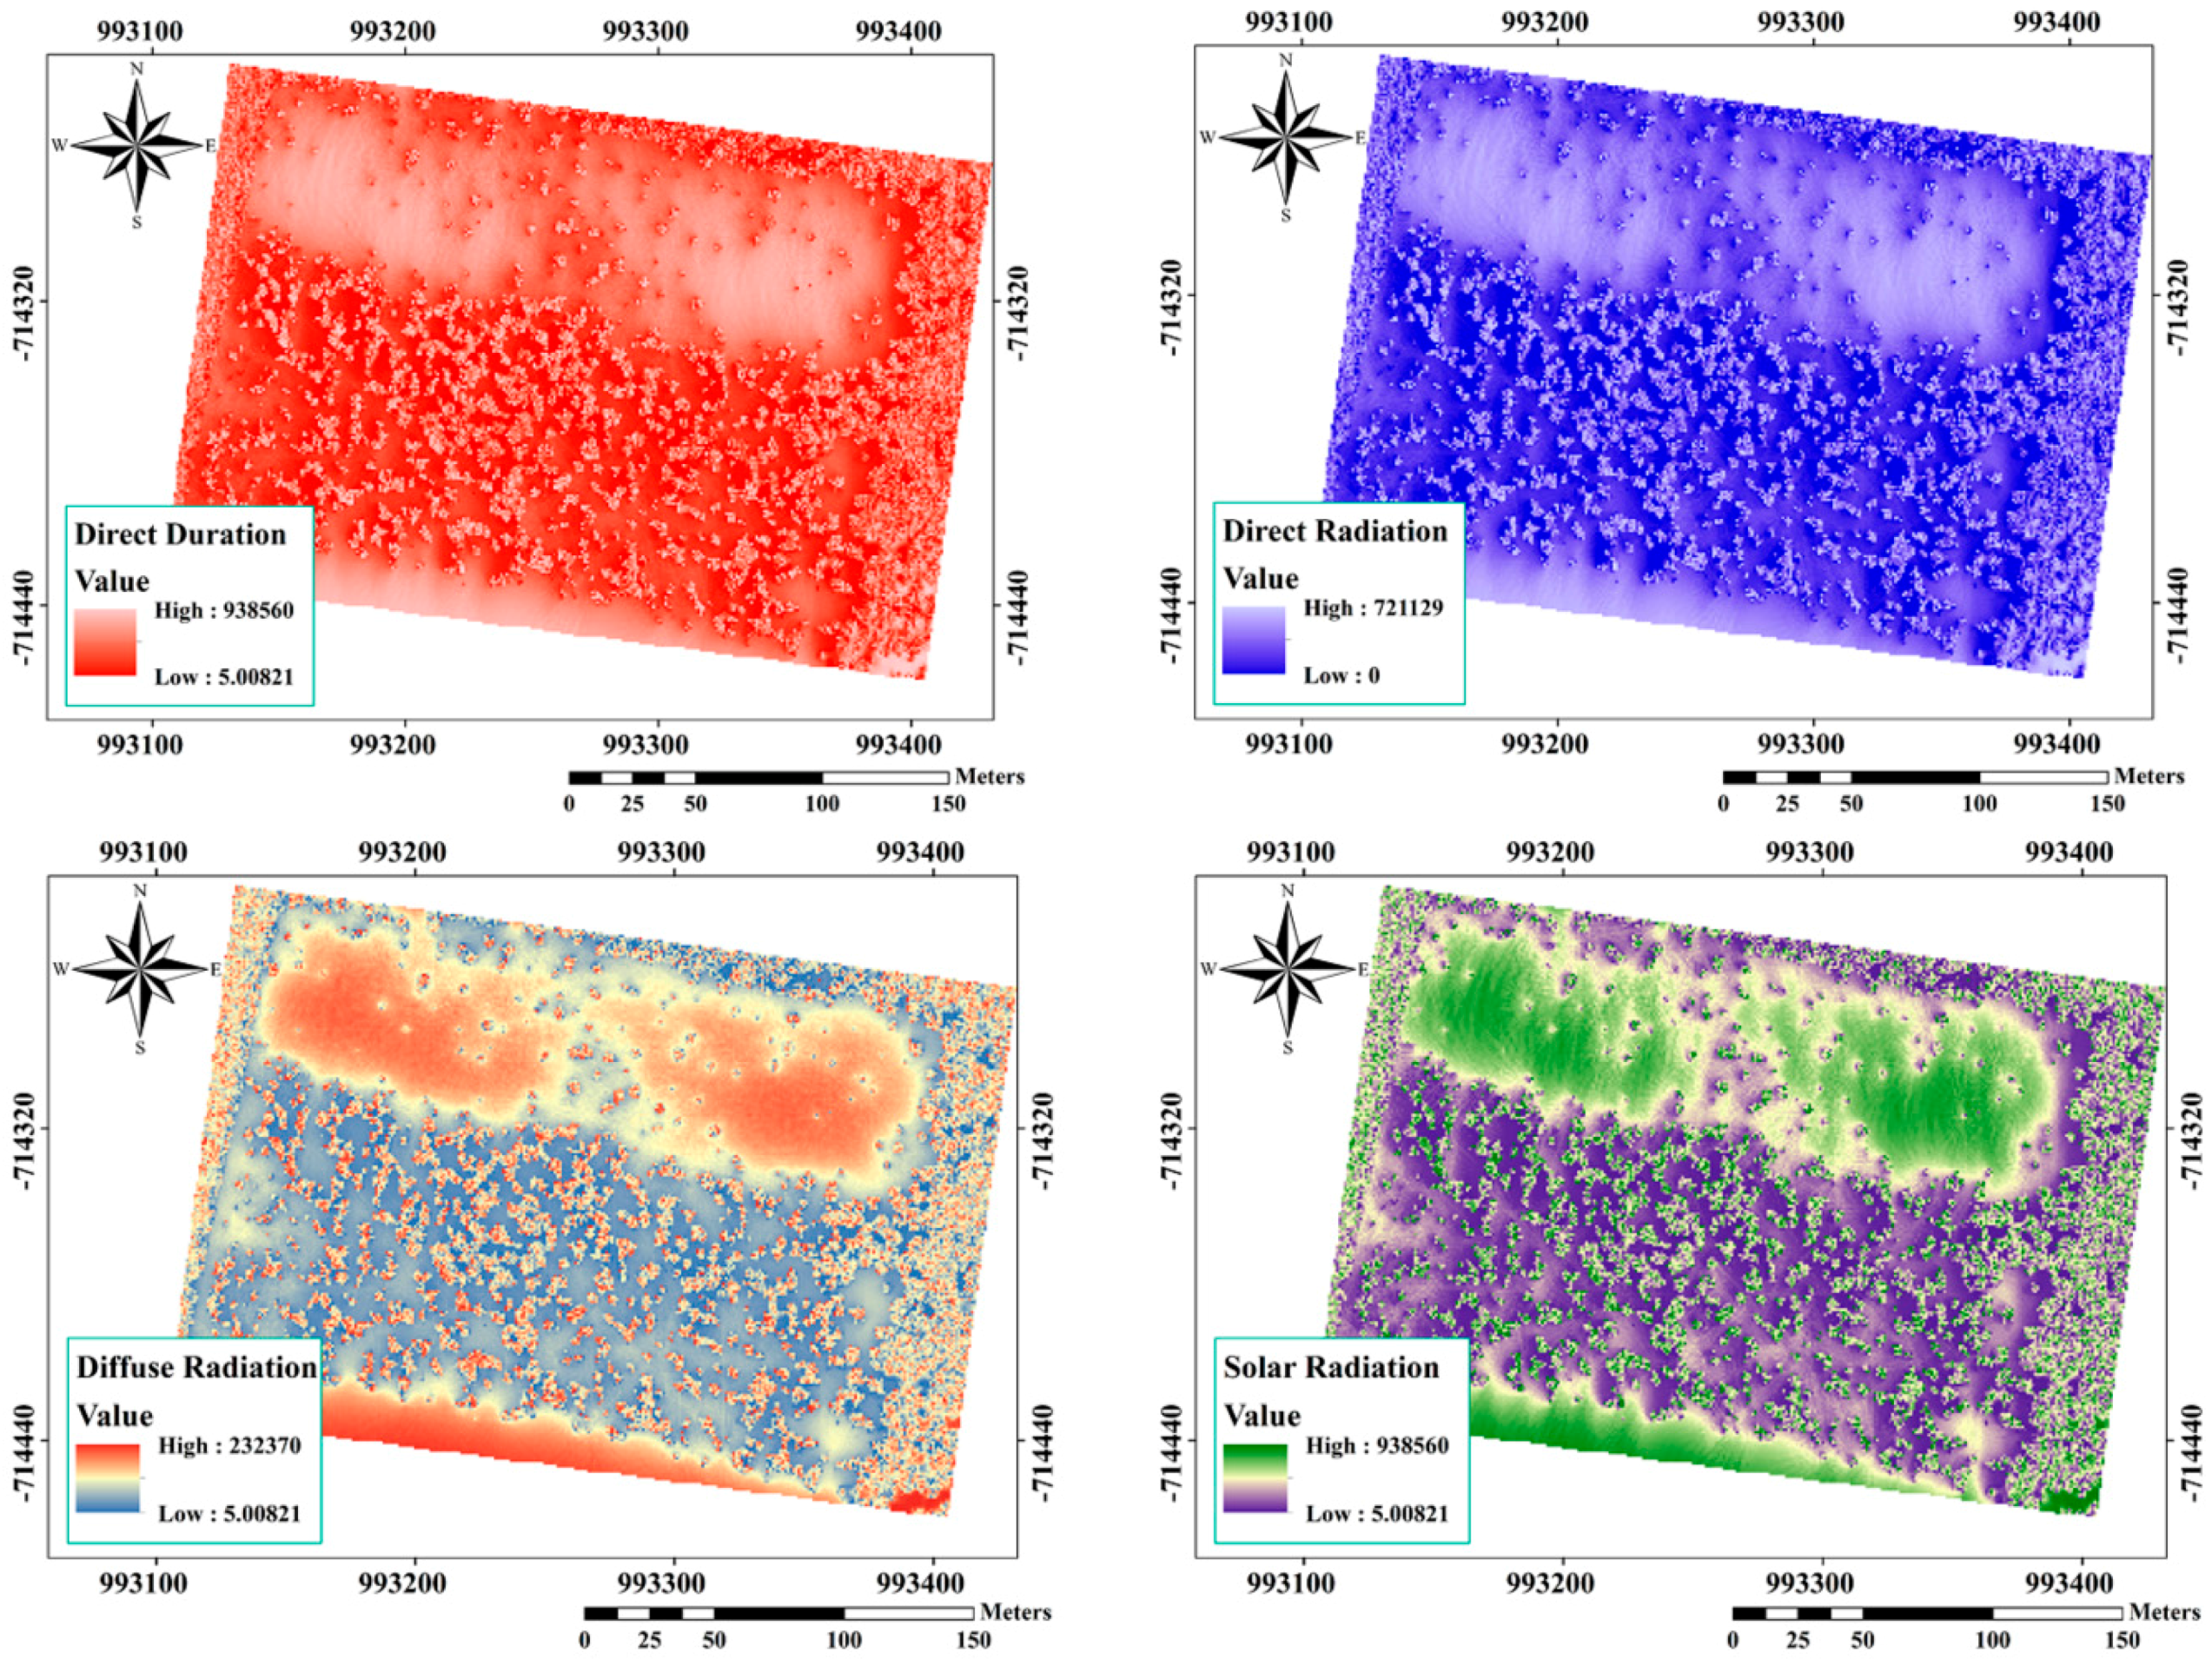
3.2. Solar Radiation and Its Components Derived from HP

The investigation of the correlation between the potential solar radiation parameters and regeneration showed that there is an inverse correlation between natural regeneration (−0.35~−0.37) and artificial regeneration (−0.28~−0.30) and the potential amount of light that can reach the young seedling (Table 3). The results of regression analysis showed that the measured crown openness and potential diffuse solar radiation had the highest relation with natural regeneration (Table 3). In addition, there was a significant relation between the number of artificial regeneration and potential solar radiation parameters at a significance level of α = 0.05 (Table 3).

3.3. Solar Radiation and Its Components Derived from the UAV

The assessment of the correlation between the potential solar radiation parameters derived from the UAV and regeneration showed that there is a negative correlation between natural regeneration (−0.31~−0.34) and the amount of light that reaches the young seedling. The results of regression analysis showed a significant relation between the solar radiation layers and natural regeneration (Table 4 and Table 5). Conversely, there was no significant relation between artificial regeneration and potential solar radiation parameters at a significant level of α = 0.05 (Table 4 and Table 5). According to the results in Table 5, we can clearly see that the amount of artificial regeneration is mostly affected by potential direct duration (0.71) and natural regeneration by potential diffuse radiation (0.74).

4. Discussion

The main aim of forest management is to provide sustainable forest production and secure the non-productive function of the forests. For this purpose, forest ecosystems need to be regularly monitored and inventoried for different characteristics.
In this work, we investigated two alternative methods for potential light conditions assessment in forests, which are available today—the ground-based (terrestrial imagery using fisheye lens, HP) and the aerial-based (UAV) approaches—and we compared the accuracy and precision of both, and with the ground-based inventory of artificial and natural regeneration. Based on our results (Table 1), estimated potential solar radiation had a significant correlation with the amount of openness (0.96), which is statistically strong evidence of the efficiency of the applied method, where the amount of potential direct and diffuse radiation was estimated based on canopy gap fractions (black (canopy) and white (sky) pixels on photography) and site position on the globe.
The main result of this study shows that the UAV-based “potential light inventory” is comparable with the ground-based inventory using a fisheye camera, according to the high correlation coefficient between the potential direct and diffuse solar radiation derived from the UAV and HP (>0.83). The uphill R-square between the potential direct (0.68) and potential diffuse (0.78) solar radiation indicates that there was a strong relationship between the solar data derived from HP and the UAV.
In general, the generation of intercepted radiation maps is demonstrated to be a feasible solution using low-cost UAVs deployed with spectral cameras, which is in accordance with the results of Guillen-Climent et al. [27].
The amount of natural and artificial regeneration was evaluated in relation to the light conditions (amount of potential diffuse and direct radiation). In the results, there was a higher correlation between potential diffuse radiation and natural regeneration than potential direct radiation; this was probably because of the symmetrical distribution of diffuse radiation around the trees. That indicates that potential diffuse radiation correlates more strongly with other parameters, affecting seedling appearance and survival. This result is in accordance with the results of Strand et al. [36], and Pukkala et al. [37].
In addition, we found an inverse relationship between the amount of natural regeneration and potential solar radiation variables. Essentially, this means that regeneration is lower under a high light regime because, in open crown canopy conditions and especially in clear-cut areas, there are usually less seeds and thus less regeneration potential. We assume that an equal amount of seeds (200 per plot) used in all 64 plots is the main reason for the smaller connection between the crown openness and its components (i.e., potential solar radiation) and artificial seedlings. Regarding the relation between potential solar radiation and its components and the methods of regeneration, natural regeneration is affected more by potential diffuse radiation (0.74). The explanation for such a result could be related to the fact that the majority of seeds that fall directly below the parent plant are more eligible to obtain this type of radiation which is necessary for their growth.
Comparing the performance of HP and the UAV for the estimation of potential solar radiation as can be seen in Figure 13, the amount of potential direct solar radiation was significantly underestimated by the UAV. We assume that the nature of the used method has the highest impact on the underestimation of values in a UAV. In the UAV approach, the gap area within and between canopy is specified by an image-based 3D point cloud which has a close relation with the point cloud density, while in the HP method, the contrast between the sky and leaf values is the main parameter for identifying the amount of crown openness. We also assume that the down-sampling process on CHM from 5 cm to 1 m could be one of the reasons for this underestimation. Since estimation of potential solar radiation, using CHM with 5 × 5 cm2 accuracy, was a time-consuming and labor-intensive process for ArcGIS 10.3.1 by ESRI ©, down-sampling was a necessary step to decrease the processing time.
As a result, the correlation coefficient between potential solar radiation computed by HP and the UAV is rather small in the areas with high crown canopy density, where UAV cannot penetrate the canopy and reach the ground surface (Tables S1 and S2).
Regarding the potential diffuse solar radiation, the performance of used methods was not significantly differentiated based on the small amount of bias (−2.70) and bias% (−8.06).
Overall, potential diffuse solar radiation was the most valuable parameter based on (i) higher correlation between the tested methods; and (ii) modeling of pine regeneration. Since the nature of diffuse solar radiation is quite erratic depending on the geographical characteristics of local area and environmental parameters and, due to its importance in developing the empirical methods, estimation techniques have been widely adopted to quantify solar radiation maps, especially diffuse solar radiation [38,39].

5. Conclusions

This paper has demonstrated the ability of a low-cost image-based UAV for the assessment of potential solar radiation as a potential replacement method for HP. At this point, it is worth mentioning that our case study was located on a flat terrain, thus, the use of CHM instead of DSM had no significant effect during the solar radiation analysis. However, in any other case (i.e., inclined topographical terrain), the use of CHM implies the removal of all terrain information (i.e., altitudes, slopes, slope orientation etc.) which are necessary for the validity of such case studies.
The main result of this study showed that there was a reasonable correlation between the UAV images and the hemispherical photos with R2 = 0.74, especially in the case of estimation of potential diffuse solar radiation (Table S2). This represents statistically strong evidence that UAVs can be a reliable and ergonomic approach, which will allow forest managers to make decisions in an optimal manner. The suggested methodology for modelling the solar radiation can be used for providing auxiliary data from UAV technology. The potential diffuse solar radiation was the most significant UAV output among other potential solar radiation parameters, which can be used as an environmental map for modeling the forest attributes. Remote sensing approaches are already having a substantial impact on forest management practices and with the advent of precision forestry, these works are focusing on deploying high resolution data to support site-specific tactical and operational decision-making.
The presented method can bring new insight into the management and especially into inventorying of forests with high spatial and temporal resolution, such as the construction of continuous maps of potential solar radiation. In the meantime, UAVs and their onboard sensors can combine the advantage of high resolution imagery with quick turnaround series, being therefore suitable for routine forest stand monitoring and real-time applications.

Supplementary Materials

The following are available online at https://www.mdpi.com/2072-4292/10/3/423/s1. Table S1. Shows the different correlation coefficients between direct and diffuse solar radiation derived from the HP and UAV methods for different crown canopy density. Table S2. Statistical summary table for the two applied methods HP and UAV in units of W/m2/S.

Acknowledgments

This research was supported by (a) the project of the Internal Grant Agency (IGA) of the Faculty of Forestry and Wood Sciences, Czech University of Life Sciences (CULS) in Prague [No. A01/17]; (b) the Ministry of Agriculture of the Czech Republic, Project [No. QJ1520187]; (c) the Czech University of Life Sciences (CULS) in Prague [NAZV QJ1520037].

Author Contributions

Azadeh Abdollahnejad and Dimitrios Panagiotidis designed and wrote the manuscript. Azadeh Abdollahnejad processed the UAV data and analyzed the statistics and data. Peter Surový and Dimitrios Panagiotidis acquired the UAV data; terrestrial data acquisition and plot establishment were conducted by Iva Ulbrichova. Peter Surový supervised the manuscript.

Conflicts of Interest

The authors declare no conflict of interest.

References

  1. Fu, P.; Richm, P.M. A geometric solar radiation model with applications in agriculture and forestry. Comput. Electron. Agric. 2002, 37, 25–35. [Google Scholar] [CrossRef]
  2. Fournier, R.A.; Mailly, D.; Walter, J.M.N.; Soudani, K. Indirect measurement of forest canopy structure from in situoptical sensors. In Remote Sensing of Forest Environments; Springer: New York, NY, USA, 2003; pp. 77–113. [Google Scholar]
  3. Peffer, K.; Pebesma, E.J.; Burrough, P.A. Mapping alpine vegetation using vegetation observation and topographic Attributes. Landsc. Ecol. 2003, 18, 759–776. [Google Scholar] [CrossRef]
  4. Abdollahnejad, A.; Panagiotidis, D.; Shataee Joybari, S.; Surový, P. Prediction of Dominant Forest Tree Species Using QuickBird and Environmental Data. Forests 2017, 8, 42. [Google Scholar] [CrossRef]
  5. Evans, G.C.; Coombe, D.E. Hemispherical and woodland canopy photography and the light climate. J. Ecol. 1959, 47, 103–113. [Google Scholar] [CrossRef]
  6. Anderson, M.C. Light relations of terrestrial plant communities and their measurement. Biol. Rev. 1964, 39, 425–486. [Google Scholar] [CrossRef]
  7. Rich, P.M. Characterizing plant canopies with hemispherical photographs. Remote Sens. Rev. 1990, 5, 13–29. [Google Scholar] [CrossRef]
  8. Coombe, D.E.; Evans, G.C. Hemispherical photography in studies of plants. Med. Biol. Illus. 1960, 10, 68–75. [Google Scholar] [PubMed]
  9. Brown, H.E.; Wordley, D.P. Some applications of the canopy camera in forestry. J. For. 1965, 63, 674–680. [Google Scholar]
  10. Madgwick, H.A.I.; Brumfield, G.L. The use of hemispherical photographs to assess light climate in the forest. J. Ecol. 1969, 57, 537–542. [Google Scholar] [CrossRef]
  11. Becker, P.; Erhart, D.W.; Smith, A.P. Analysis of forest light environments. I. Computerized estimation of solar radiation from hemispherical canopy photographs. Agric. For. Meteorol. 1989, 44, 3–4. [Google Scholar] [CrossRef]
  12. Chan, S.S.; McCreight, R.W.; Walstad, J.D.; Spies, T.A. Evaluating forest vegetative cover with computerized analysis of fisheye photographs. For. Sci. 1986, 32, 1085–1091. [Google Scholar]
  13. Chazdon, R.L.; Field, C.B. Determinants of photosynthetic capacity in six rainforest Piper species. Oecologia 1987, 73, 222–230. [Google Scholar] [CrossRef] [PubMed]
  14. Roxburgh, J.R.; Kelly, D. Uses and limitations of hemispherical photography for estimating forest light environments. N. Z. J. Ecol. 1995, 19, 213–217. [Google Scholar]
  15. Jonckheere, I.; Fleck, S.; Nackaerts, K.; Muys, B.; Coppin, P.; Weiss, M.; Baret, F. Review of methods for in situ leaf area index determination. Part I. theories, sensors and hemispherical photography. Agric. For. Meteorol. 2004, 121, 19–35. [Google Scholar] [CrossRef]
  16. Nebiker, S.; Annena, A.; Scherrerb, M.; Oeschc, D. A light-weight multispectral sensor for micro UAV—Opportunities for very high resolution airborne remote sensing. Int. Arch. Photogramm. Remote Sens. Spat. Inf. Sci. 2008, 37 Pt 1, 1193–1198. [Google Scholar]
  17. Surový, P.; Yoshimoto, A.; Panagiotidis, D. Accuracy of Reconstruction of the Tree Stem Surface Using Terrestrial Close-Range Photogrammetry. Remote Sens. 2016, 8, 123. [Google Scholar] [CrossRef]
  18. Mikita, T.; Janata, P.; Surový, P. Forest Stand Inventory Based on Combined Aerial and Terrestrial Close-Range Photogrammetry. Forests 2016, 7, 165. [Google Scholar] [CrossRef]
  19. Panagiotidis, D.; Abdollahnejad, A.; Surový, P.; Chiteculo, V. Determining tree height and crown diameter from high-resolution UAV imagery. Int. J. Remote Sens. 2017, 38, 2392–2410. [Google Scholar] [CrossRef]
  20. Lisein, J.; Pierrot-Deseilligny, M.; Bonnet, S.; Lejeune, P. A photogrammetric workflow for the creation of a forest canopy height model from small unmanned aerial system imagery. Forests 2013, 4, 922–944. [Google Scholar] [CrossRef]
  21. Grenzdörffer, G.J.; Engel, A.; Teichert, B. The photogrammetric potential of low-cost UAVs in forestry and agriculture. Int. Arch. Photogramm. Remote Sens. Spat. Inf. Sci. 2008, 37, 1207–1214. [Google Scholar]
  22. Westoby, M.; Brasington, J.; Glasser, N.F.; Hambrey, M.J.; Reyonds, M.J. Structure from Motion photogrammetry: A low-cost, effective tool for geoscience applications. Geomorphology 2012, 179, 300–314. [Google Scholar] [CrossRef] [Green Version]
  23. Mohammadi, K.; Shamshirband, S.; Tong, C.W.; Arif, M.; Petković, D.; Ch, S. A new hybrid support vector machine-wavelet transform approach for estimation of horizontal global solar radiation. Energy Convers. Manag. 2015, 92, 162–171. [Google Scholar] [CrossRef]
  24. Olatomiwa, L.; Mekhilef, S.; Shamshirband, S.; Petkovic, D. Adaptive neuro-fuzzy approach for solar radiation prediction in Nigeria. Renew. Sustain. Energy Rev. 2015, 51, 1784–1791. [Google Scholar] [CrossRef]
  25. Moghaddamnia, A.; Remesan, R.; Kashani, M.H.; Mohammadi, M.; Han, D.; Piri, J. Comparison of LLR, MLP, Elman, NNARX and ANFIS Models-with a case study in solar radiation estimation. J. Atmos. Sol. Terr. Phys. 2009, 71, 975–982. [Google Scholar] [CrossRef]
  26. Feng, Y.; Cui, N.; Zhang, Q.; Zhao, L.; Gong, D. Comparison of artificial intelligence and empirical models for estimation of daily diffuse solar radiation in North China Plain. Int. J. Hydrogen Energy 2017, 24, 14418–14428. [Google Scholar] [CrossRef]
  27. Huaiwei, S.; Gui, D.; Yan, B.; Liu, Y.; Liao, W.; Zhu, Y.; Lu, C.; Zhao, N. Assessing the potential of random forest method for estimating solar radiation using air pollution index. Energy Convers. Manag. 2016, 119, 121–129. [Google Scholar]
  28. Park, J.K.; Das, A.; Park, J.H. Estimating distribution of precision solar radiation using unmanned aerial vehicle. In Proceedings of the 2016 IEEE International Geoscience and Remote Sensing Symposium (IGARSS), Beijing, China, 10–15 July 2016; pp. 6718–6721. [Google Scholar]
  29. Hunt, E.R.; Cavigelli, M.; Daughtry, C.S.T.; McMurtrey, J.E.; Walthall, C.L. Evaluation of digital photography from model aircraft for remote sensing of crop biomass and nitrogen status. Precis. Agric. 2005, 6, 359–378. [Google Scholar] [CrossRef]
  30. Guillen-Climent, M.L.; Zarco-Tejada, P.J.; Berni, J.A.J.; North, P.R.J.; Villalobos, F.J. Mapping radiation interception in row-structured orchards using 3D simulation and high resolution airborne imagery acquired from a UAV. Precis. Agric. 2012, 13, 473–500. [Google Scholar] [CrossRef]
  31. Houborg, R.; Boegh, E. Mapping leaf chlorophyll and leaf area index using inverse and forward canopy reflectance modeling and SPOT reflectance data. Remote Sens. Environ. 2008, 112, 186–202. [Google Scholar] [CrossRef]
  32. Breunig, F.M.; Galvao, L.S.; Formaggio, A.R.; Epiphanio, J.C.N. Influence of dataacquisition geometry on soybean spectral response simulated by the prosail model. Eng. Agrícola 2013, 33, 176–187. [Google Scholar] [CrossRef]
  33. Korpela, I.; Mehtätalo, L.; Seppänen, A.; Kangas, A. Tree species identification in aerial image data using directional reflectance signatures. Silva Fenn. 2014, 48, 1080. [Google Scholar] [CrossRef]
  34. Kane, V.R.; Gillespie, A.R.; McGaughey, R.; Lutz, J.A.; Ceder, K.; Franklin, J.F. Interpretation and topographic compensation of conifer canopy self-shadowing. Remote Sens. Environ. 2008, 112, 3820–3832. [Google Scholar] [CrossRef]
  35. Demek, J. Hory a Nížiny. Zeměpisný lexikon ČSR; Academia: Praha, Czech Republic, 1987; p. 584. (In Czech) [Google Scholar]
  36. Strand, M.; Löfvenius, M.O.; Bergsten, U.; Lundmark, T.; Rosvall, O. Height growth of planted conifer seedlings in relation to solar radiation and position in Scots pine shelterwood. For. Ecol. Manag. 2006, 224, 258–265. [Google Scholar] [CrossRef]
  37. Pukkala, T.; Kuuluvainen, T.; Stenberg, P. Below-Canopy distribution of photosynthetically active radiation and its relation to seedling growth in a boreal Pinus sylvestris L., stand. Scand. J. For. Res. 1993, 1, 313–325. [Google Scholar] [CrossRef]
  38. El-Sebaii, A.A.; Al-Hazmi, F.S.; Al-Ghamdi, A.A.; Yaghmour, S.J. Global direct and diffuse solar radiation on horizontal and tilted surfaces in Jeddah, Saudi Arabia. Appl. Energy 2010, 87, 568–576. [Google Scholar] [CrossRef]
  39. Khorasanizadeh, H.; Mohammadi, K. Diffuse solar radiation on a horizontal surface: Reviewing and categorizing the empirical models. Renew. Sustain. Energy Rev. 2016, 53, 338–362. [Google Scholar] [CrossRef]
Figure 1. Location of the study area in Doksy, Czech Republic in a local coordinate system (S-JTSK/Krovak East North) source: Pléiades-1A satellite image taken in 2017.
Remotesensing 10 00423 g001
Figure 2. Scheme of the study area showing the locations of the plots in different percentages of canopy cover. Within the whole plot, 64 measuring points was ascertained.
Remotesensing 10 00423 g002
Figure 3. Illustration of Postex technology for georeferencing the position of each plot.
Remotesensing 10 00423 g003
Figure 4. The plots’ and sub-plots’ position and size.
Remotesensing 10 00423 g004
Figure 5. Fisheye images before (ad) and after processing (eh) in four different variants of (a,e) 30%, (b,f) 70%, (c,g) 50% and (d,h) 0% (clear-cut).
Remotesensing 10 00423 g005
Figure 6. Scaled image that illustrates the actual size of the octocopter Steadi Drone EI8HT RTF that was used for the acquisition of aerial images.
Remotesensing 10 00423 g006
Figure 7. Illustration of different perspectives of the 3D model reconstruction of the study area in Photoscan: nadir (down-looking) camera (a) and side view (b).
Remotesensing 10 00423 g007
Figure 8. Illustration of the azimuth and sun elevation in two different seasons at the beginning and at the end of the growing season.
Remotesensing 10 00423 g008
Figure 9. Produced layers of different types of potential solar radiation from the Unmanned Aerial Vehicle (UAV) RGB imagery in units of W·h/m2 (average of growing season).
Remotesensing 10 00423 g009
Figure 10. The correlation between the openness and potential total (direct + diffuse) solar radiation derived from HP in W·h/m2 for an entire growing season (64 plots).
Remotesensing 10 00423 g010
Figure 11. The correlation between the potential total solar radiation derived from HP and the UAV (64 plots) in W·h/m2 for an entire growing season.
Remotesensing 10 00423 g011
Figure 12. The correlation between the direct (a) and diffuse (b) potential solar radiation as derived from HP and the UAV (64 main plots) in W·h/m2 for an entire growing season.
Remotesensing 10 00423 g012
Figure 13. The differences between the mean of potential solar radiation parameters in W·h/m2 for an entire growing season estimated by HP and the UAV. The median of measured values is marked by a horizontal line inside the boxes. The end of the boxes is the interquartile range (the upper: Q3 and lower: Q1). The whiskers show the highest and lowest observations.
Remotesensing 10 00423 g013
Table 1. Correlation between crown openness and solar radiation derived from Hemispherical Photography (HP).
Regression StatisticsDirectDiffuseTotal
R0.960.950.96
R Square0.920.890.93
Adjusted R Square0.920.890.92
Standard Error3.74.313.6
sig.0.000.000.00
df.636363
Pearson Correlation0.960.950.96
The adjusted R-squared is a modified version of R-squared that has been adjusted for the number of inputs in the model and compares the explanatory power of regression models that contain different numbers of predictors.
Table 2. Summary table of regression statistics using HP and the UAV.
Regression StatisticsTotal Solar RadiationDirect Solar RadiationDiffuse Solar Radiation
Multiple R0.860.830.88
R Square0.740.680.78
Adjusted R Square0.730.680.77
Standard Error182.41186.4016.98
Pearson Correlation0.860.830.83
Number of plots646464
Multiple R is the square root of R-squared and this correlation coefficient shows how strong the linear relationship is. The adjusted R-squared is a modified version of R-squared that has been adjusted for the number of inputs in the model and compares the explanatory power of regression models that contain different numbers of predictors.
Table 3. Statistical summary table for the number/amount of natural and artificial regeneration as dependent variables.
NaturalArtificial
Regression StatisticsDirectDiffuseTotalOpennessDirectDiffuseTotalOpenness
R0.350.370.350.380.280.300.280.30
R Square0.120.140.130.140.080.090.080.09
Adjusted R Square0.110.120.110.130.060.080.060.08
Std error of the estimate8.868.808.858.807.347.287.337.28
sig.0.000.000.000.000.020.010.020.01
Pearson Correlation−0.35−0.37−0.35−0.38−0.28−0.30−0.28−0.30
df = 63. The adjusted R-squared is a modified version of R-squared that has been adjusted for the number of inputs in the model and compares the explanatory power of regression models that contain different numbers of predictors. Estimated Solar radiation in W·h/m2 for an entire growing season.
Table 4. Model summary, which describes the relation between the two different regeneration methods as dependent variables and potential solar radiation parameters as independent variables derived from the UAV.
Regeneration Type RR2Adjusted R SquareStd. Error of the EstimateChange Statistics
R2 ChangeF Changedf1df2Sig. F Change
Artificial0.292 a0.0850.0407.4270.0851.8693600.144
Natural0.349 a0.1220.0789.0160.1222.7763600.049
a: Predictors such as (Constant), mean solar radiation, mean direct duration, mean diffuse radiation; Excluded Variables: Mean direct radiation. The adjusted R-squared is a modified version of R-squared that has been adjusted for the number of inputs in the model and compares the explanatory power of regression models that contain different numbers of predictors. df1: the degree of freedom for predictors. df2: degree of freedom for dependent variables. F change: F-test, which evaluates the changes in R-square while adding the new predictor. Sig. F Change: p-value at α level of 0.05.
Table 5. Illustration of the Pearson correlation between the regeneration and potential solar parameters derived from the UAV.
VariableArtificialNatural
Sig.CoefficientSig.Coefficient
Diffuse radiation0.06–0.1880.74–0.319
Direct duration0.71–0.1650.24–0.341
Solar radiation0.08–0.1440.04–0.310
Excluded variable: Direct radiation. Estimated Solar radiation in W·h/m2 for an entire growing season.

