Post-Processing Approach for Refining Raw Land Cover Change Detection of Very High-Resolution Remote Sensing Images


1
School of Computer Science and Engineering, Xi’An University of Technology, Xi’an 710048, China
2
College of Resources and Environmental Science, Hunan Normal University, Changsha 410081, China
3
Key Laboratory of Geospatial Big Data Mining and Application, Hunan Province, Changsha 410081, China
4
Faculty of Electrical and Computer Engineering, University of Iceland, Reykjavik IS 107, Iceland
5
School of remote sensing and Information Engineering, Wuhan University, Wuhan 430079, China
*
Author to whom correspondence should be addressed.
Remote Sens. 2018, 10(3), 472; https://doi.org/10.3390/rs10030472
Submission received: 20 December 2017
/
Revised: 21 February 2018
/
Accepted: 14 March 2018
/
Published: 17 March 2018
(This article belongs to the Special Issue Analysis of Multi-temporal Remote Sensing Images)
Abstract
:In recent decades, land cover change detection (LCCD) using very high-spatial resolution (VHR) remote sensing images has been a major research topic. However, VHR remote sensing images usually lead to a large amount of noises in spectra, thereby reducing the reliability of the detected results. To solve this problem, this study proposes an object-based expectation maximization (OBEM) post-processing approach for enhancing raw LCCD results. OBEM defines a refinement of the labeling in a detected map to enhance its raw detection accuracies. Current mainstream change detection (preprocessing) techniques concentrate on proposing a change magnitude measurement or considering image spatial features to obtain a change detection map. The proposed OBEM approach is a new solution to enhance change detection accuracy by refining the raw result. Post-processing approaches can achieve competitive accuracies to the preprocessing methods, but in a direct and succinct manner. The proposed OBEM post-processing method synthetically considers multi-scale segmentation and expectation maximum algorithms to refine the raw change detection result. Then, the influence of the scale of segmentation on the LCCD accuracy of the proposed OBEM is investigated. Four pairs of remote sensing images, one of two pairs (aerial image with 0.5 m/pixel resolution) which depict two landslide sites on Landtau Island, Hong Kong, China, are used in the experiments to evaluate the effectiveness of the proposed approach. In addition, the proposed approach is applied, and validated by two case studies, LCCD in Tianjin City China (SPOT-5 satellite image with 2.5 m/pixel resolution) and Mexico forest fire case (Landsat TM images with 30 m/pixel resolution), respectively. Quantitative evaluations show that the proposed OBEM post-processing approach can achieve better performance and higher accuracies than several commonly used preprocessing methods. To the best of the authors’ knowledge, this type of post-processing framework is first proposed here for the field of LCCD using VHR remote sensing images.
1. Introduction
Land cover change detection (LCCD), which is a classical problem in many remote sensing disciplines, has been extensively studied [1,2,3]. The development of remote sensing techniques has made multi-temporal images conveniently available, and made LCCD an increasingly popular research topic because of its practical applications [4], such as in forest defoliation [5], land cover database updating [6,7], and urban expansion [8,9].
In the past decades, many change detection techniques have been developed and applied in LCCD [10,11,12,13]. These approaches usually involve two main steps: calculating the change magnitude image and determining a binary threshold. The change magnitude image between bi-temporal images can be obtained mainly by image differencing [14], image ratio [15,16], change vector analysis (CVA) [17,18,19,20], and spectral gradient difference [21]. Then, a binary threshold is needed to divide the change magnitude image into a binary change detection map; the popular threshold determining methods for change detection are mainly expectation maximization (EM) [22,23], fuzzy c-means [24,25,26], and Otsu’s method [27,28,29]. In general, these methods measure the distance between the bi-temporal images and use a threshold to determine whether each pixel in the change magnitude image is changed or unchanged. Although these methods can provide a binary change detection map, much noise still exists in the produced map. Therefore, the performance in producing a raw change detection map can still be improved.
VHR remote sensing images can provide much detailed ground information. The contextual feature of VHR images is usually adopted to complement the spectra, for enhancing the performance of the detection result and fully utilizing spatial information [30]. The most commonly used contextual features for LCCD purposes include Gabor-wavelet-based difference (GWDM) [31,32,33], Markov random field (MRF) [14,34,35,36,37], and gray level co-occurrence matrix textures [38]. Several advanced hybrid change detection methods have been developed. For example, T. Celik proposed a change detection approach based on principal component analysis and k-means clustering (PCA_Kmeans) [39], Zhang et al. proposed an unsupervised LCCD method from remote sensing images by using level set evolution with local uncertainty constraints (LSELUC) [40], and Zhang et al. proposed an LCCD method by considering local spectrum-trend similarity between bi-temporal images [41]. In addition, LCCD also plays an important role in remote sensing applications, such as global environmental change problem [42], urban growth detection [43,44], and sustainable urbanization [45]. Therefore, proposing a novel approach for generating an LCCD map product with high accuracy and good performance is important.
The aforementioned methods are preprocessing LCCD approaches that generate binary change detection by measuring the change magnitude and use a selected binary threshold. Spatial features can be obtained from the original spectral space to enhance the detecting accuracy of LCCD using VHR remote sensing images. However, post-processing LCCD (P_LCCD) has not received sufficient attention. We define P_LCCD as a refinement of the labeling of raw change detection results to improve its original performance and accuracies.
In this study, a P_LCCD method called object-based expectation maximum (OBEM) is proposed to improve raw change detection results. To the best of our knowledge, the P_LCCD method has not been applied for LCCD with remote sensing images. Furthermore, a comprehensive P_LCCD framework is currently lacking. Thus, we propose an OBEM post-processing approach to refine raw change detection results and obtain an improved detection performance.
2. OBEM Post-Processing LCCD Approach for VHR Images
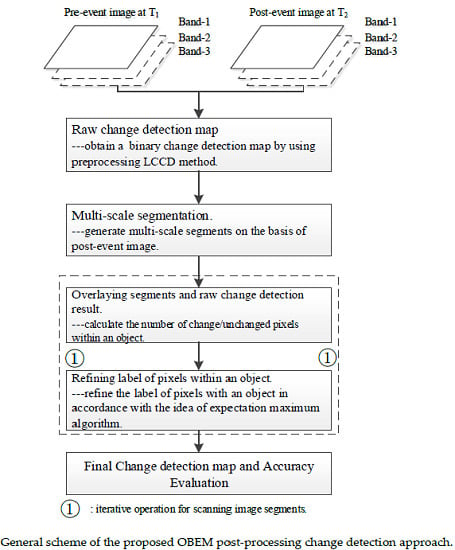
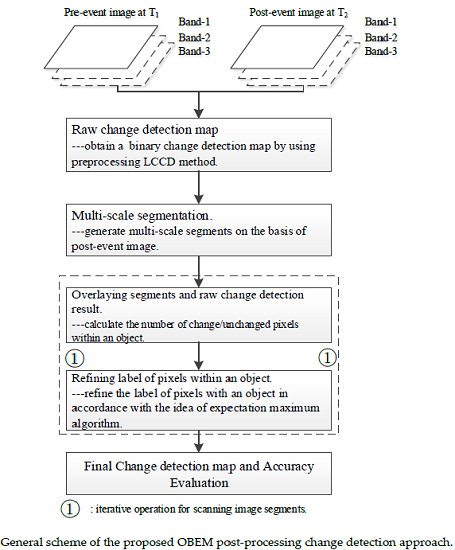
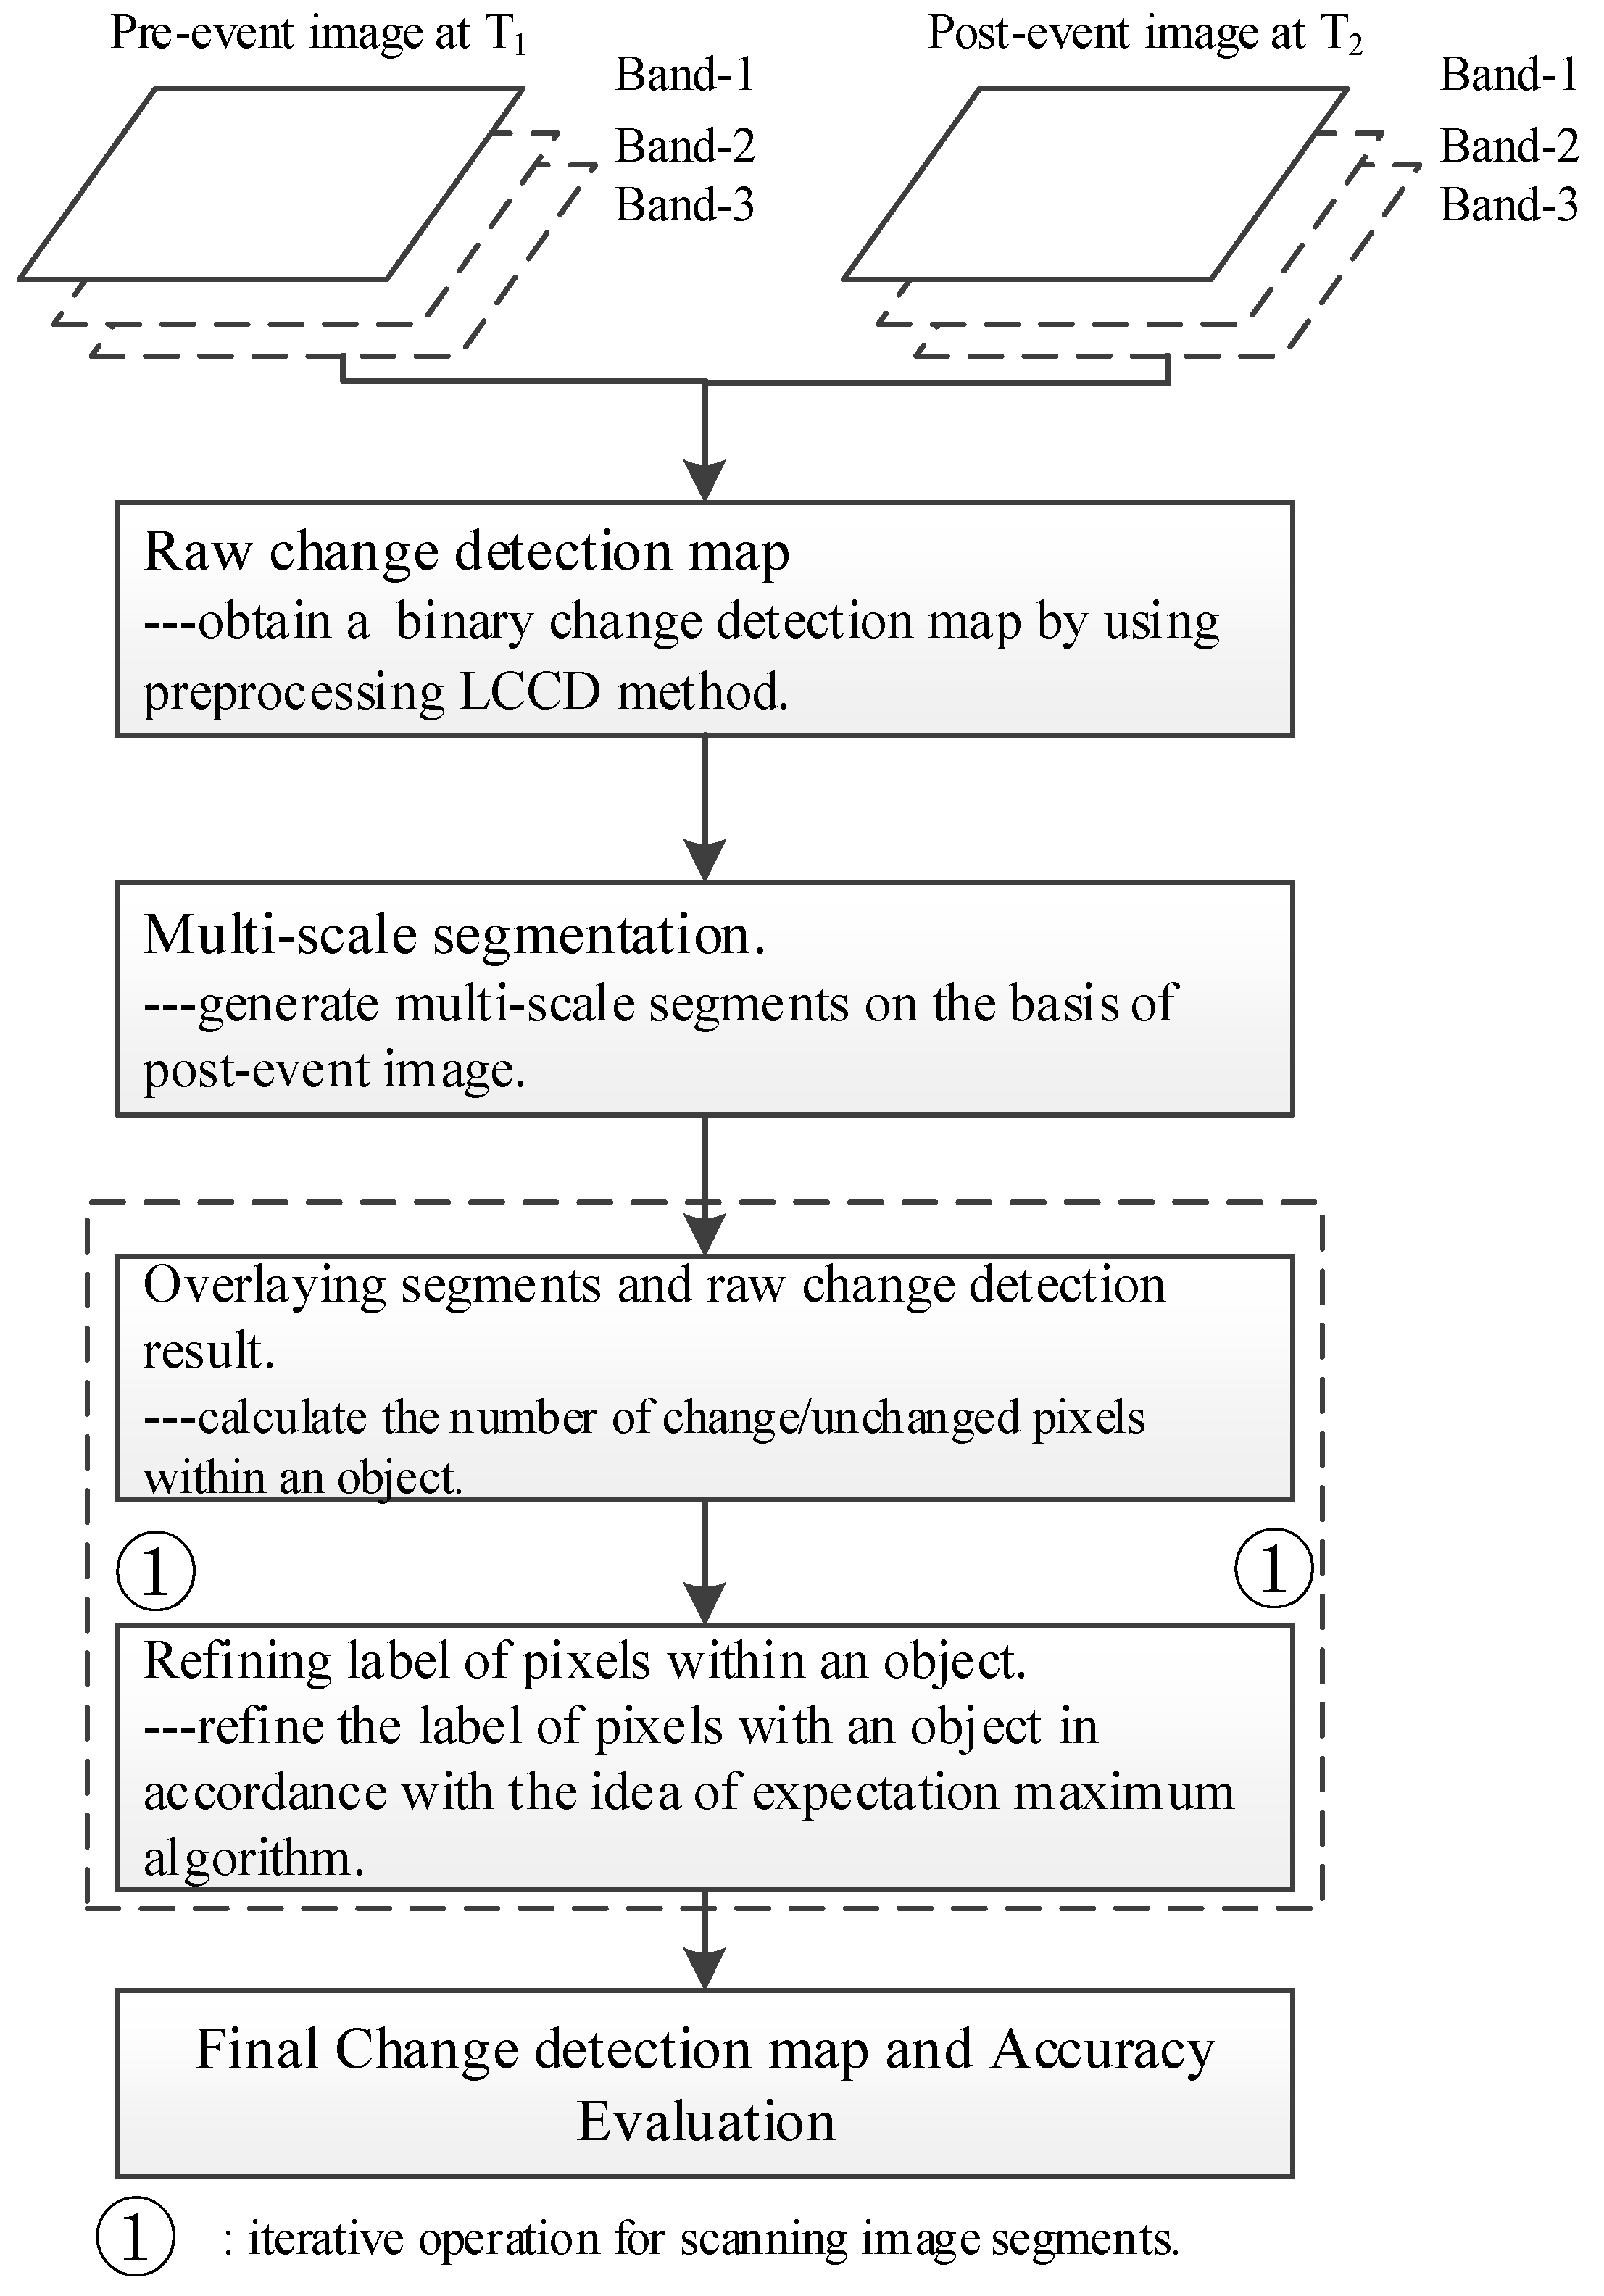
Previous studies [1,7,15,16] have focused on preprocessing change detection in the past decades; however, P_LCCD has not received much attention. Therefore, a P_LCCD framework can be proposed to improve the performance of raw change detection result. In this section, a P_LCCD method called OBEM is proposed. The flowchart of the proposed OBEM is shown in Figure 1.
As shown in Figure 1, the proposed OBEM consists of the following steps:
- (1)
- A raw binary change detection map (R_BCDM) is obtained by a traditional LCCD method (preprocessing change detection method).
- (2)
- Multi-scale segmentation based on the post-event image must be conducted to utilize the spatial information of the detecting target. A most commonly used multi-scale segmentation fractal net evolution algorithm (FNEA) [46] is employed in the proposed OBEM approach, and additional details on FNEA are reviewed in the following section.
- (3)
- The multi-scale segmentation result based on the post-event image is overlaid spatially on the R_BCDM. The number of changed and unchanged pixels within an object is calculated.
- (4)
- The label of the pixels within the object is refined in accordance with the labeling of the maximum pixels’ label. Steps 3 and 4 are an iterative progress, and the R_BCMD is scanned and refined by object. This refinement assumes that the internal pixels of an object are homogeneous and are belonging to one class. This assumption accords with that in several existing object-based image processing methods [5,47,48,49].
When the scanning progress is terminated, the pixels’ label of R_BCDM is refined thoroughly, and the refined result is defined as the final binary change detection map (F_BCDM). Then, F_BCDM is evaluated by comparing it with the ground reference map.
2.1. Brief Review of Multi-Scale Segmentation and Expectation Maximum
Here, we briefly review the most commonly used multi-scale segmentation algorithm, that is, the fractional net evaluation approach (FNEA) [50]. The main goal of multi-scale segmentation is to integrate an image into disjoint compartments [47,48]. Image segmentation is important owing to its fast expanding field of applications, such as image processing [51], image classification [49], and object recognition [52]. Multi-scale segmentation also plays an important role in our proposed OBEM approach and in other existing applications. The FNEA algorithm, which is adopted as the key technique of the proposed OBEM method, is reviewed to fully understand the proposed OBEM [46,53]. FNEA can be described as a region-merging technique, which starts with each pixel forming one image object or region; this optimization procedure minimizes the average heterogeneity and maximizes the respective homogeneity for a number of image objects. In the merging procedure, three related parameters (scale, shape, and compactness) are used; scale determines the maximum allowed heterogeneity for the resulting image segments, shape defines the contribution to the entire homogeneity criterion compared with the spectral (color) criteria, and compactness optimizes image objects. Additional details on FNEA multi-scale segmentation can be found in [46,54]. In the proposed OBEM post-processing LCCD approach, we use the FNEA multi-scale segmentation algorithm that is implemented in eCognition business software. Shape and compactness should be set with high values in practical application to obtain segments with high homogeneity.
Apart from multi-scale segmentation, the expectation–maximization (EM) algorithm also plays a pivotal role in our proposed OBEM algorithm. Here, EM is reviewed briefly to enhance understanding of the proposed OBEM. The EM algorithm is explained and given its name in the research by Dempster et al [55]; it is a method of finding the maximum likelihood or maximum a posteriori estimate. Since its introduction, EM has been applied in many image processing fields, such as LCCD based on remote sensing images [22,56,57], image classification [58,59], image segmentation [60], and target recognition [61]. Inspired by these applications based on EM, EM in the proposed OBEM is employed as the rule to refine the labeling of the pixels within an object. Additional details on this refinement are presented in the following section.
2.2. Proposed OBEM Post-Processing LCCD Approach
In accordance with multi-scale segmentation and EM algorithms, the proposed OBEM considers the detecting target’s spatial information through multi-scale segmentation and refines the R_BCDM by object. Here, the multi-scale segmental results based on the post-event image are defined as O, and O is defined as , where n is the total number of objects. The R_BCDM is obtained by a preprocessing LCCD method.
On the basis of the above-mentioned definitions, a refined criterion of OBEM is presented as
where is the label for refining the pixels that are within an object . and represent the number of unchanged and changed pixels within an object for the R_BCDM, respectively. Each pixel label within an object is refined by comparing the total number of changed and unchanged pixels within an object. The refined label of each pixel is assigned as the label of the maximum number pixels. This refining strategy is an effective approach for smoothing and denoising. Prior to this current work, this strategy has not been used for optimizing LCCD results.
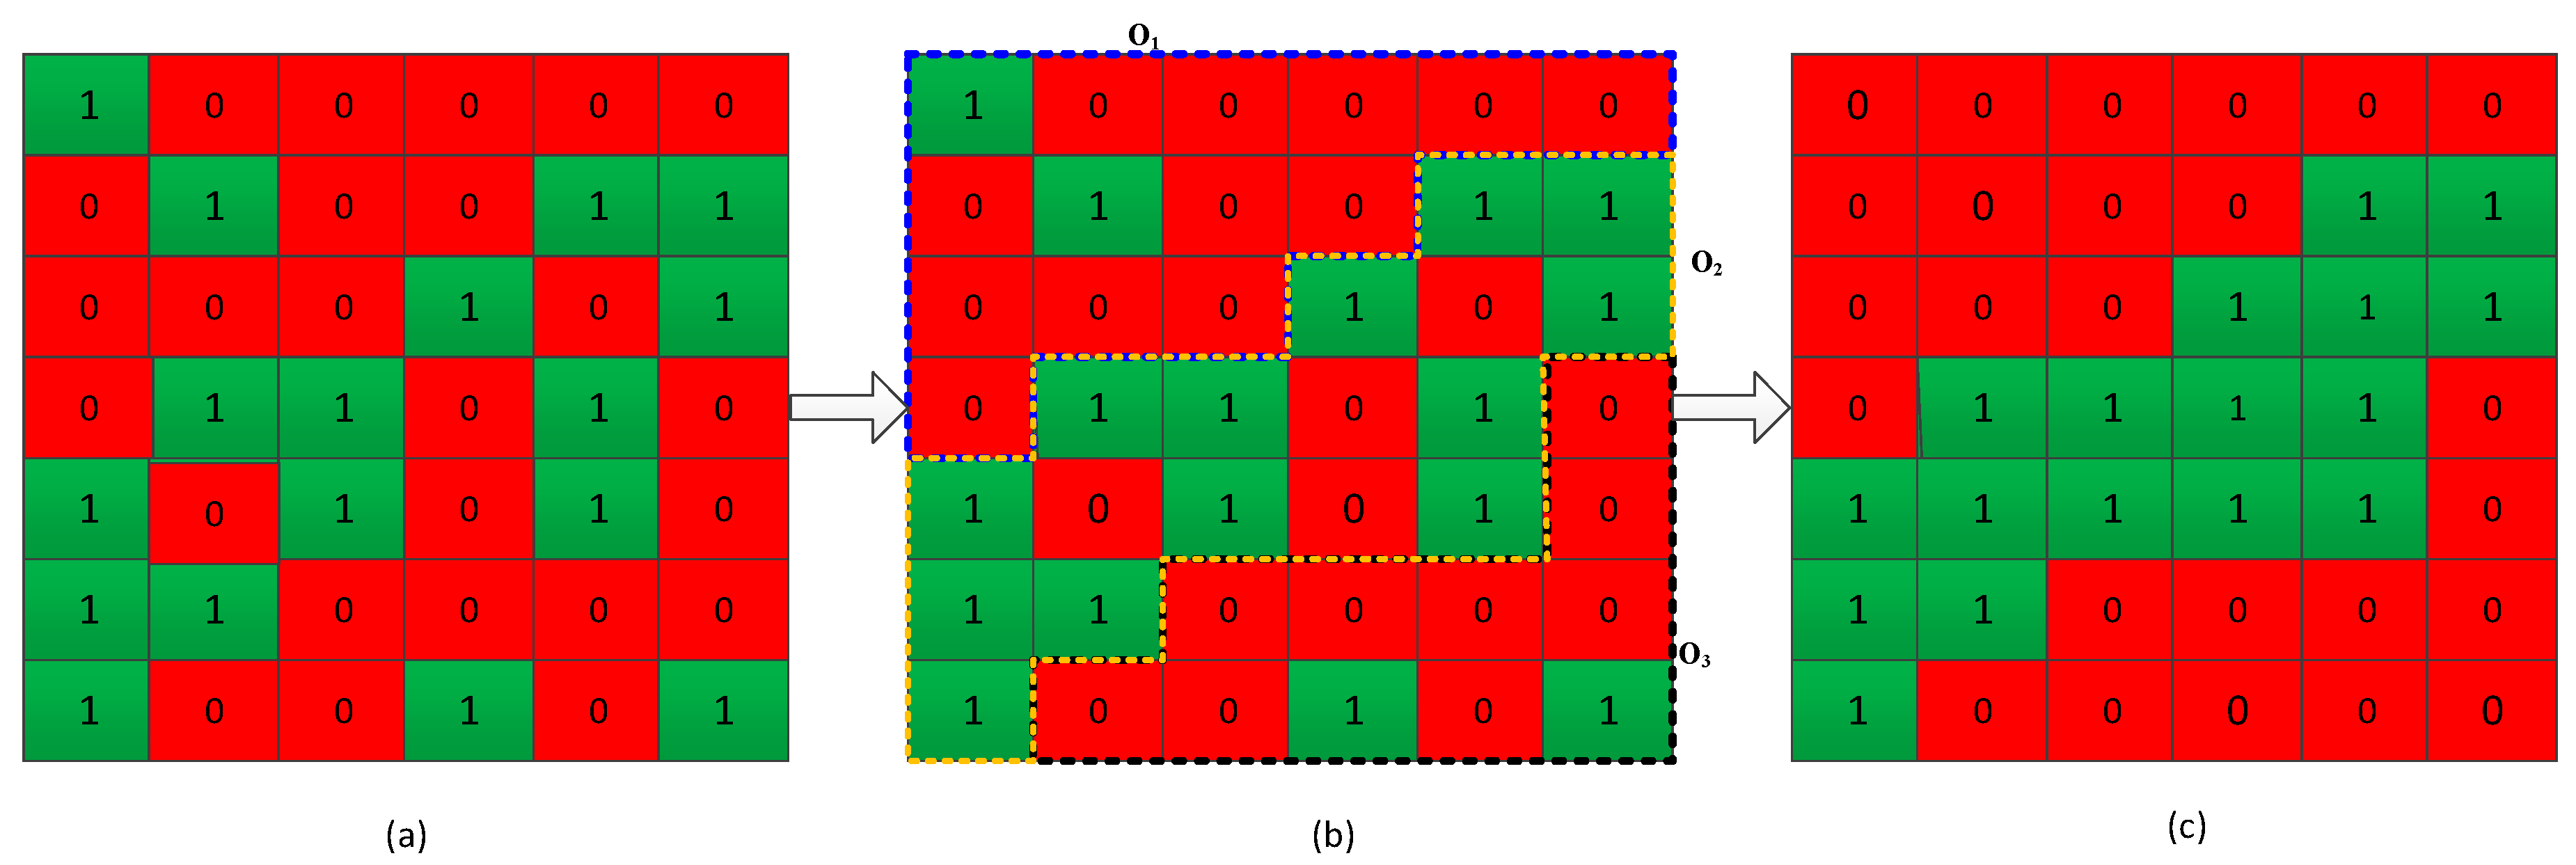
The proposed OBEM post-processing LCCD presents two advantages. (1) Given the spatial information inherited by the detecting target from post-event images, the details of the detecting target, such as edge, shape, and size, can be preserved in the smoothing procedure; (2) In theory, an object is deemed as being of a pure material, and the pixels within an object can potentially possess the same value. When refining the pixel labels of an object in accordance with the expected maximum number pixels’ label of that object, the homogeneity of the object can be improved. Therefore, the noise pixels in the R_BCDM can be further removed by the proposed OBEM post-processing LCCD approach.
A schematic example for demonstrating the effectiveness of the proposed OBEM approach is presented in Figure 2. The blue, yellow, and black dotted line regions in the figure are the objects O1, O2, and O3, respectively. In addition, “0” and “1” present the “unchanged” and “changed” pixels, respectively. Comparing Figure 2a,c shows that OBEM smoothens noise effectively for each object. Furthermore, the edge between different objects is clearly preserved.
3. Experiment
In this section, four experiments are performed to test the effectiveness of the proposed methodology. The first experiment compares the effectiveness of several preprocessing change detection methods with the proposed OBEM post-processing approach. The second experiment investigates the relationship between the parameters and the detection accuracy of the proposed OBEM approach. To further investigate the generality, in the third and fourth experiment, the proposed OBEM post-processing approach is validated using SPOT-5 images with a 2.5 m/pixel resolution and a Landsat TM image with 30 m/pixel resolution, respectively.
3.1. Data Set Description
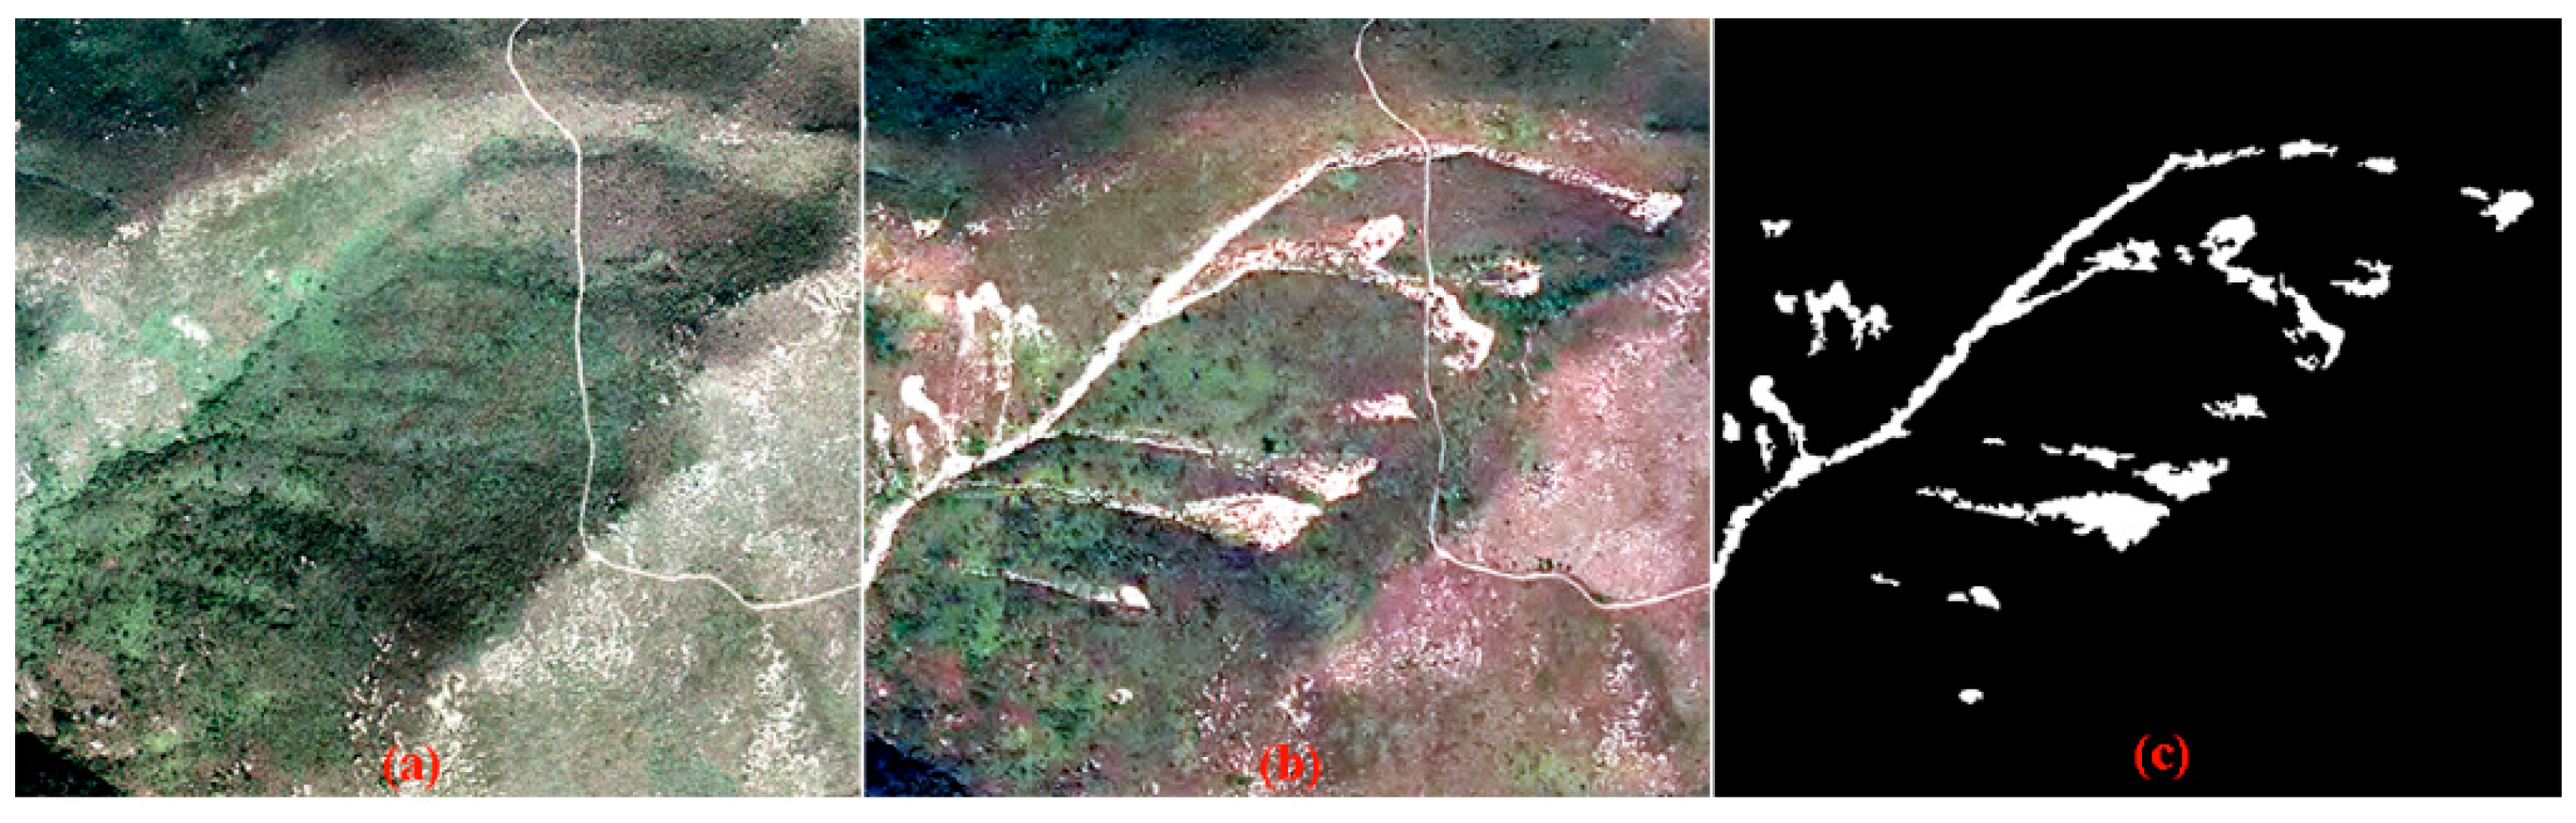
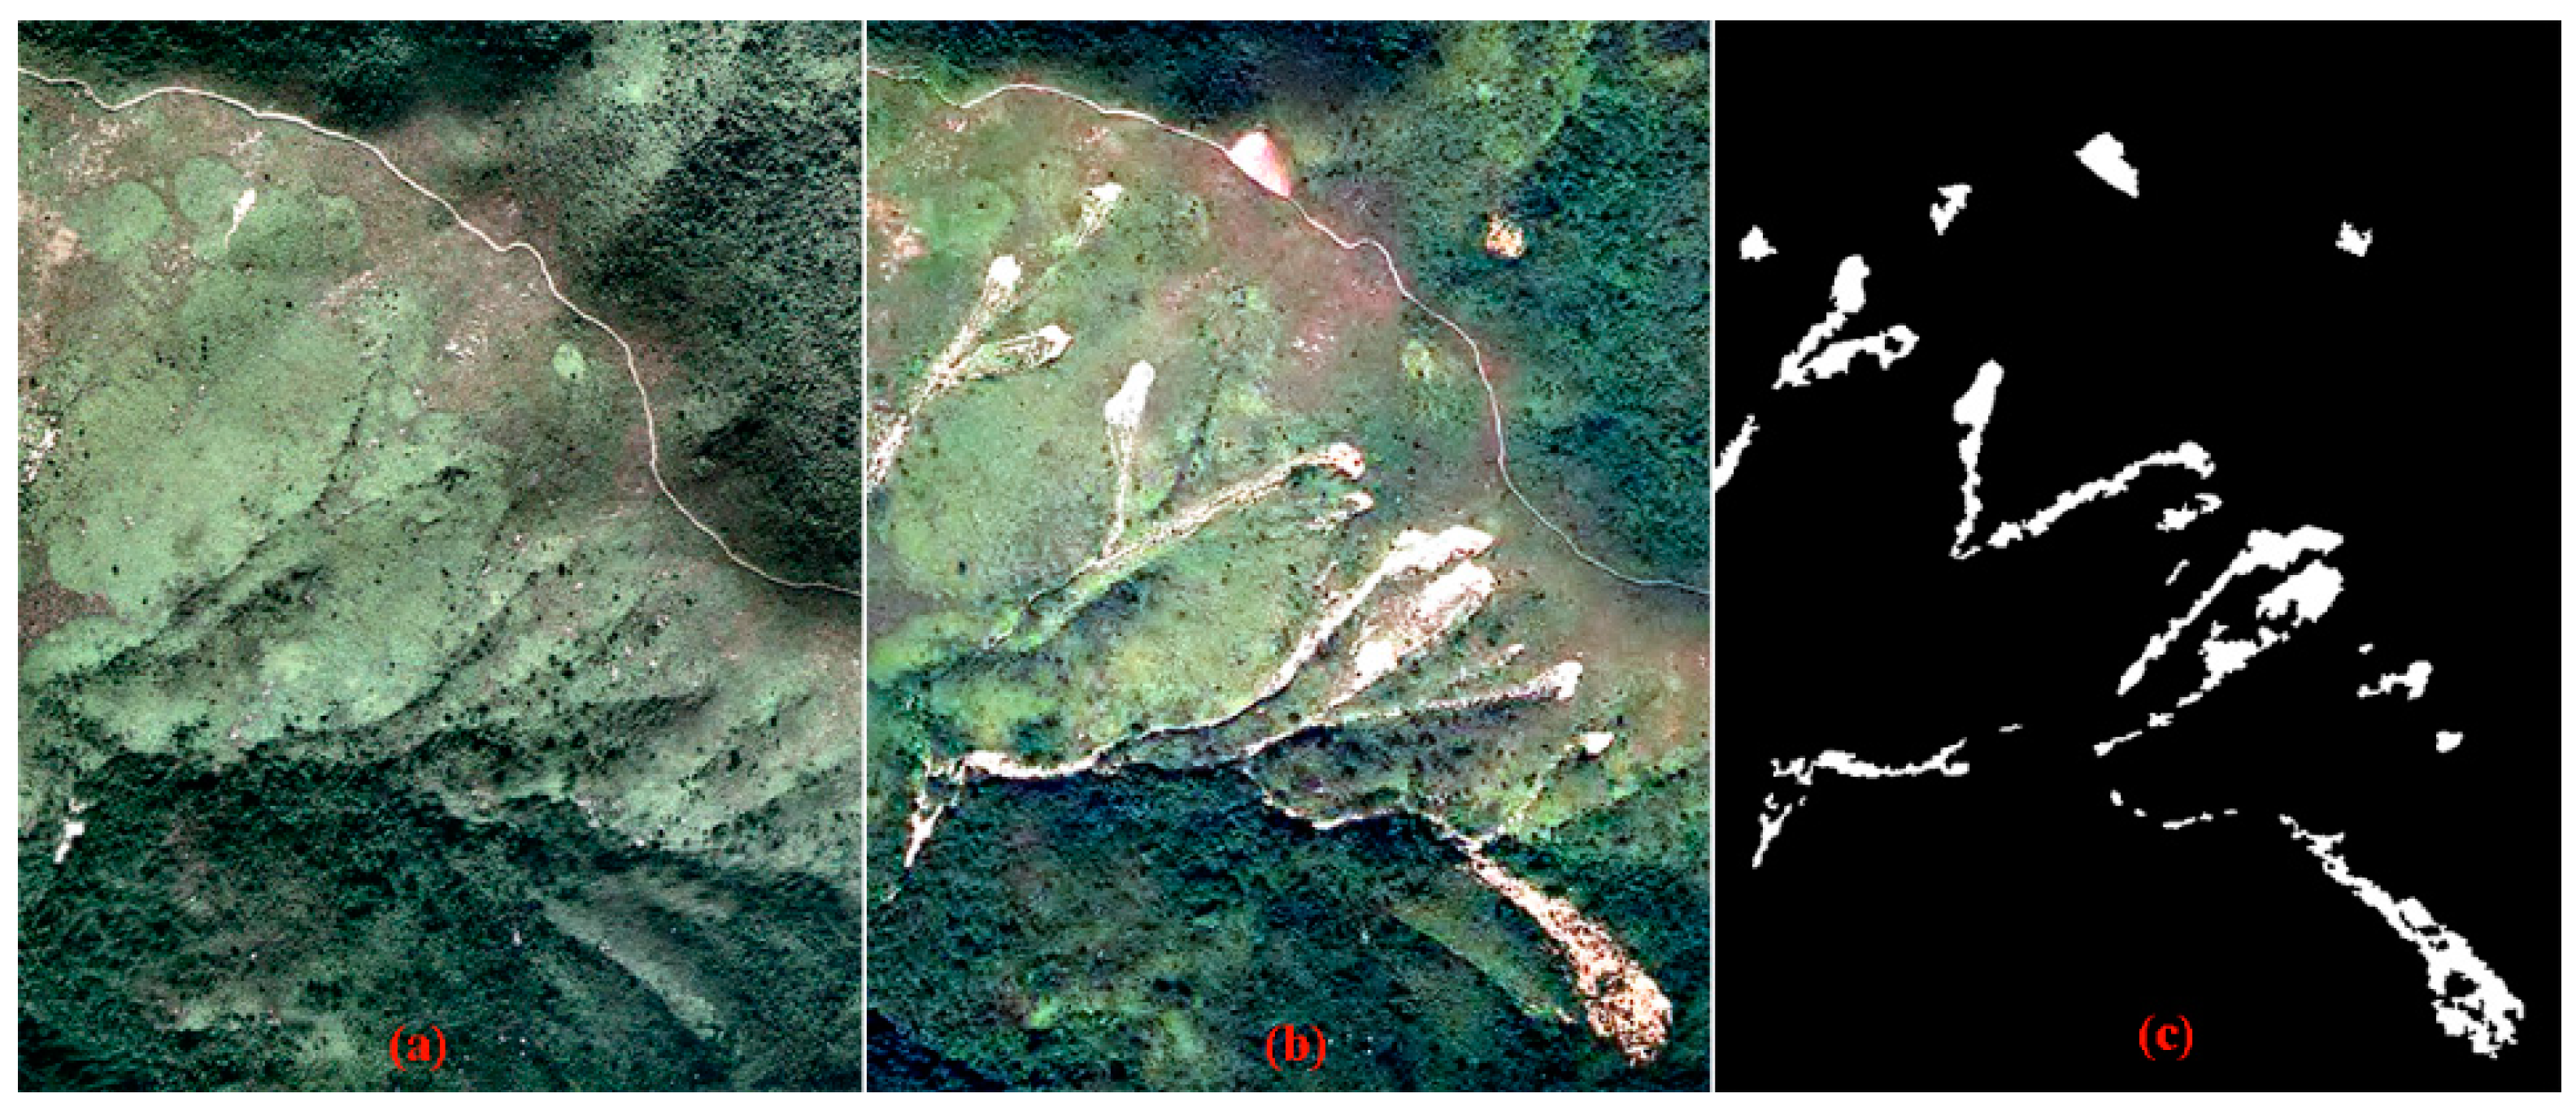
Two pairs of bi-temporal images with very high-spatial resolution of 0.5 m per pixel are used in our experiments. These images are acquired using Zeiss RMK TOP-15 Aerial Survey Camera at a flying height of approximately 2400 m in April 2007 and July 2014. The two pairs of images in Figure 3 and Figure 4 depict two different landslide sites in Lantau Island of Hong Kong, China. The first image scene is 564 × 694 pixels. This area is covered with different land use types, including trees, shrubs, gravel, and naked soil. The difference in land cover types brings difficulty in detecting the landslide inventory map. The second image scene in Figure 4 is 750 × 950 pixels. From the pair of image scenes, this area is found to be covered by various types of forest and grasslands. Although the bi-temporal images are similar in false color, the bi-temporal images are captured at different times with different sun heights, thereby resulting in a relatively high spectral heterogeneity, especially for the shadow of trees.
The third data set: This data set was captured by the SPOT-5 satellite in June 2009 and July 2010, respectively, and has a spatial resolution of 2.5 m/pixel. The size of the study area is 481 × 451 pixels. This area depicts a land use change case in Tianjin City, China, which can be considered typical for urban areas in China. The pre- and post-event images are presented in Figure 5a,b. The ground reference map was interpreted manually, and is illustrated in Figure 5c. This area is covered by many kinds of crops, but also a region with buildings. The spectral heterogeneity of the bi-temporal images is relatively high.
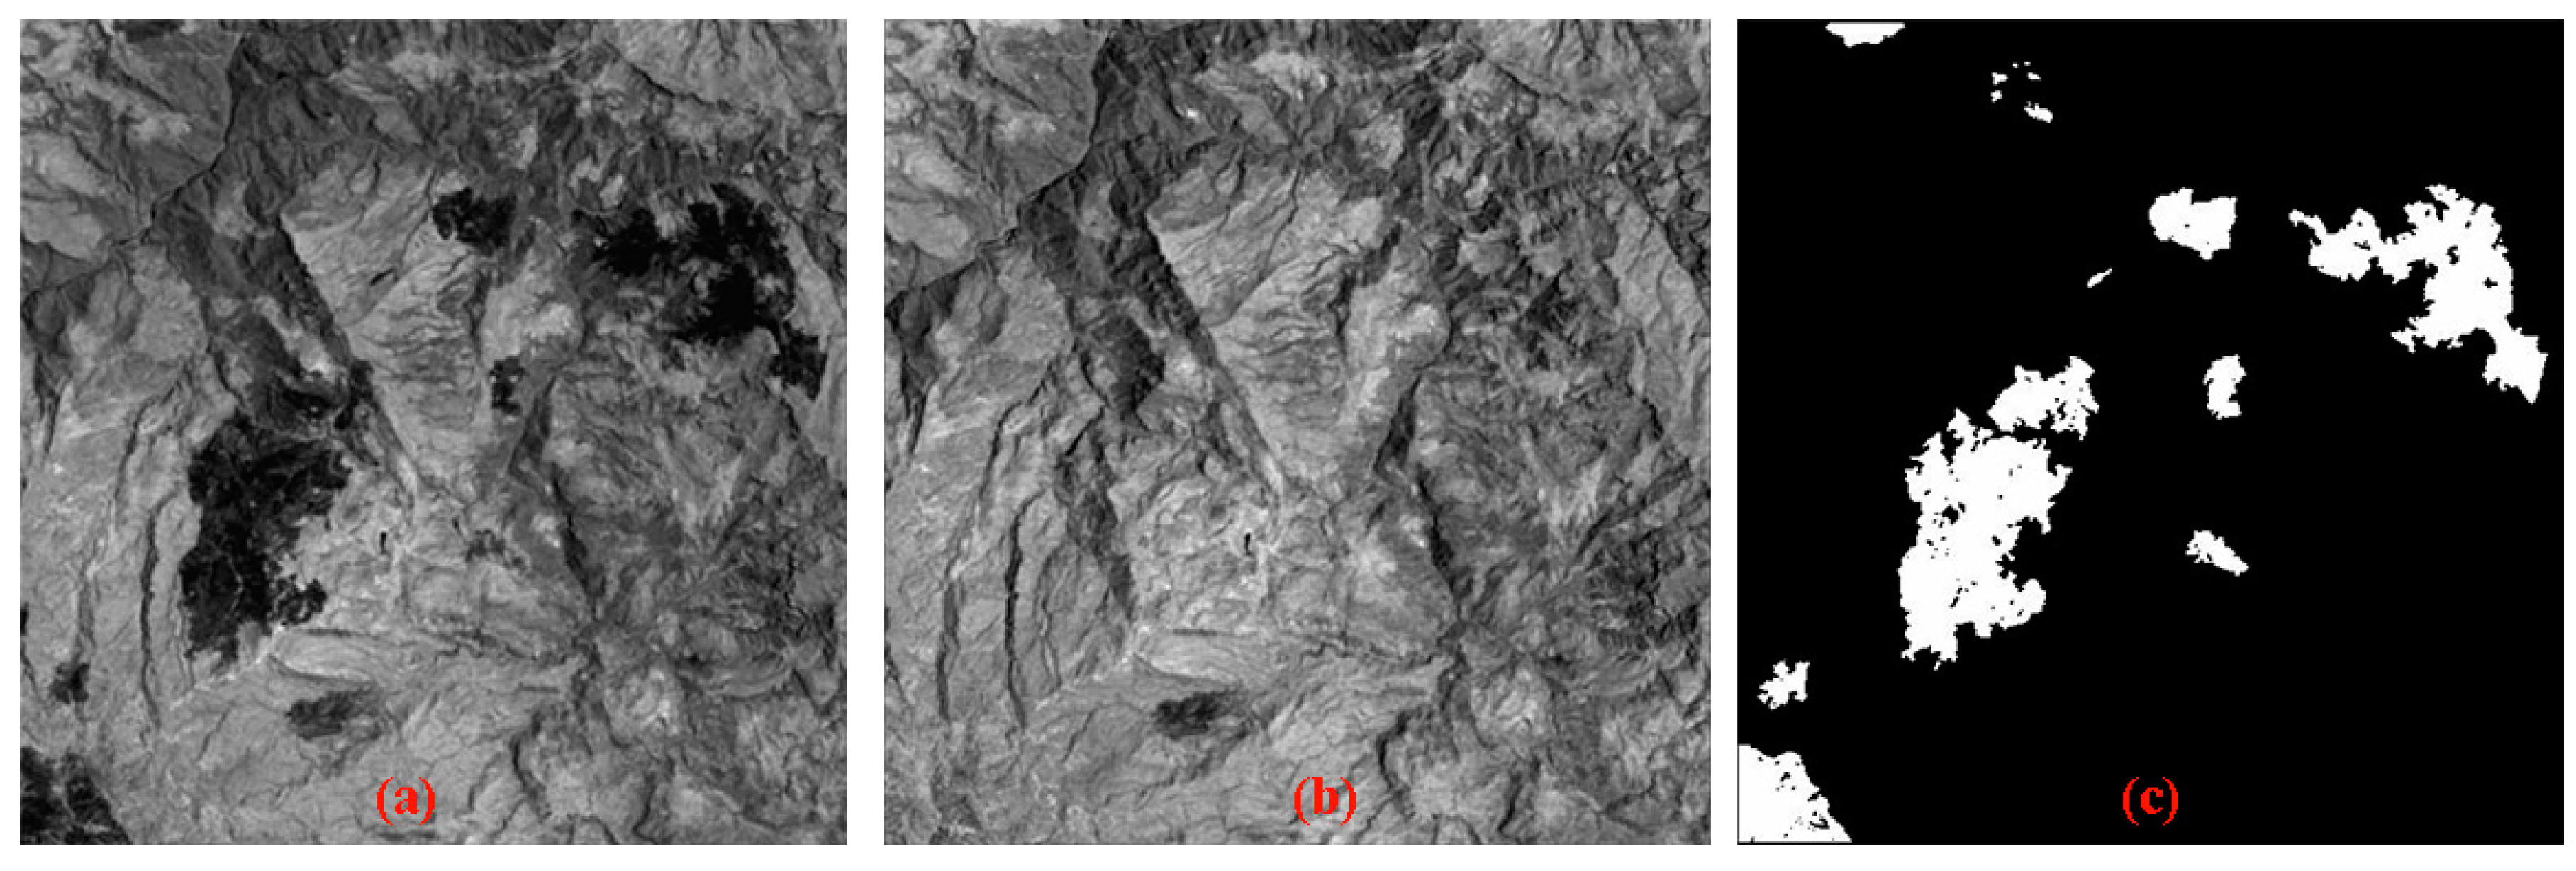
The fourth data set: These data consist of a data set which is freely available for change detection evaluation. The data set is composed of two 8-bit images acquired by the Landsat thematic mapper sensor of the Landsat-7 satellite of an area in Mexico in April 2000 and May 2002. From the entire scene, a section of 512 × 512 pixels was selected as the test site. Figure 6a,b depict the channel 4 images of the Landsat TM sensor from 2000 and 2002, respectively. Comparing the two images, it can be observed that fire destroyed a large portion of vegetation in the considered changed region. A reference change map was obtained manually to obtain a quantitative evaluation, as presented in Figure 6c.
3.2. Experimental Setup and Parameter Setting
To test the effectiveness of the proposed OBEM post-processing LCCD method, six classical preprocessing LCCD approaches are adopted for comparisons, namely, GWDM coupled with EM and fuzzy c-means clustering algorithm (FCM) (named GWDM_EM and GWDM_FCM, respectively) [33], CVA coupled with EM (CVA_EM) [62], LSELUC [40], MRF coupled with EM (MRF_EM) [14], and PCA_Kmeans clustering [39]. For the first and second data sets, the optimal parameters of each method are obtained by trial-and-error method. Details of the parameter settings for each method are presented in Table 1. The parameters used for the third and fourth data sets are presented in Table 2.
3.3. Results and Quantitative Evaluation
On the basis of the above-mentioned parameter settings, three commonly used measures, namely, false alarm (FA), missed alarm (MA), and total error (TE), are extracted from the confusion matrix for quantitative assessment. FA indicates the ratio between the number of changed pixels that are incorrectly discriminated in the change detection maps compared with the ground reference map, and MA demonstrates the ratio between the missed changed pixels in the change detection map compared with the ground reference map. TE is the rate of the sum of the FA and the missed detections and the total pixels of the ground reference map. Notably, the accuracy of each preprocessing algorithm is presented with its optimal parameters, and the proposed post-processing OBEM method is given with parameters of segmentation that are selected on the basis of prior experiments. To guarantee fairness in comparison, the details of the ground reference for each of the data sets in the experiments are given in Table 3.
The first noteworthy observations are shown in Table 4. The proposed OBEM methods achieve the highest accuracies for the first data set compared with each preprocessing method. Furthermore, the accuracy improvements are striking. For example, compared with the raw change detection results of CVA_EM, the improvements achieved by the proposed OBEM are 8.79% (FA), 4.27% (MA), and 8.57% (TE). The same conclusion is obtained from observing the result in Table 5 for the second data set.
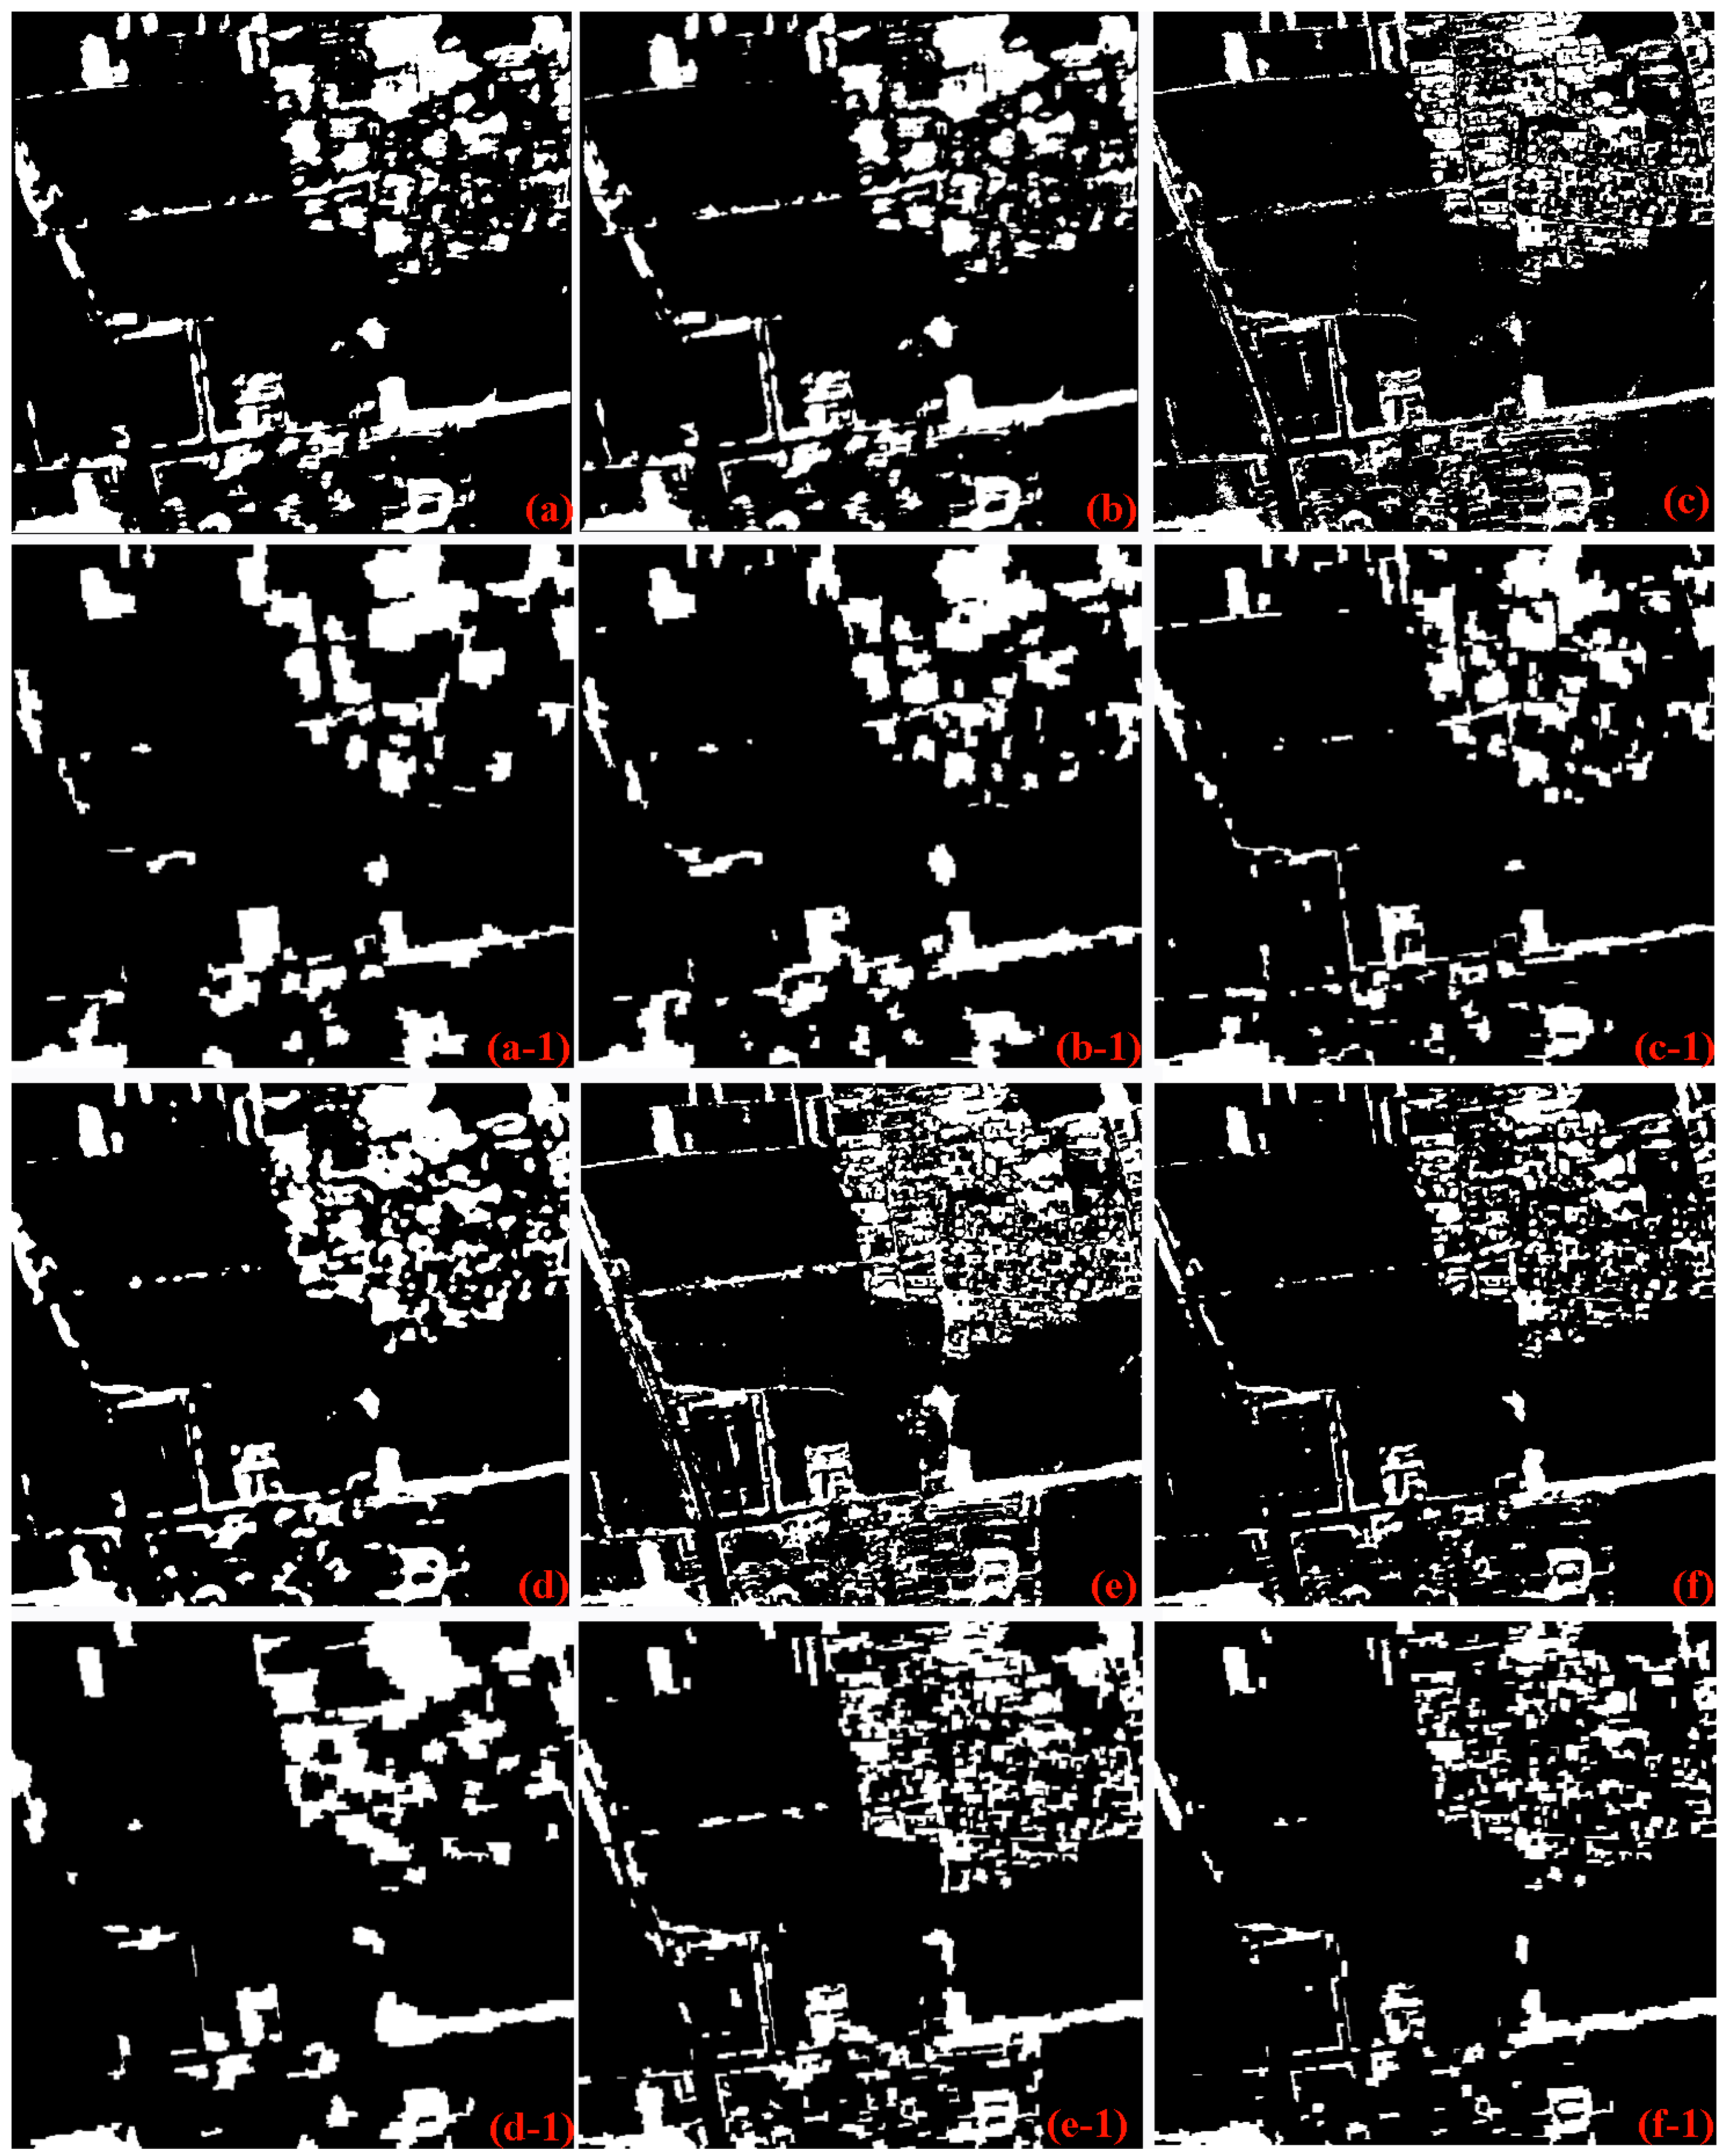
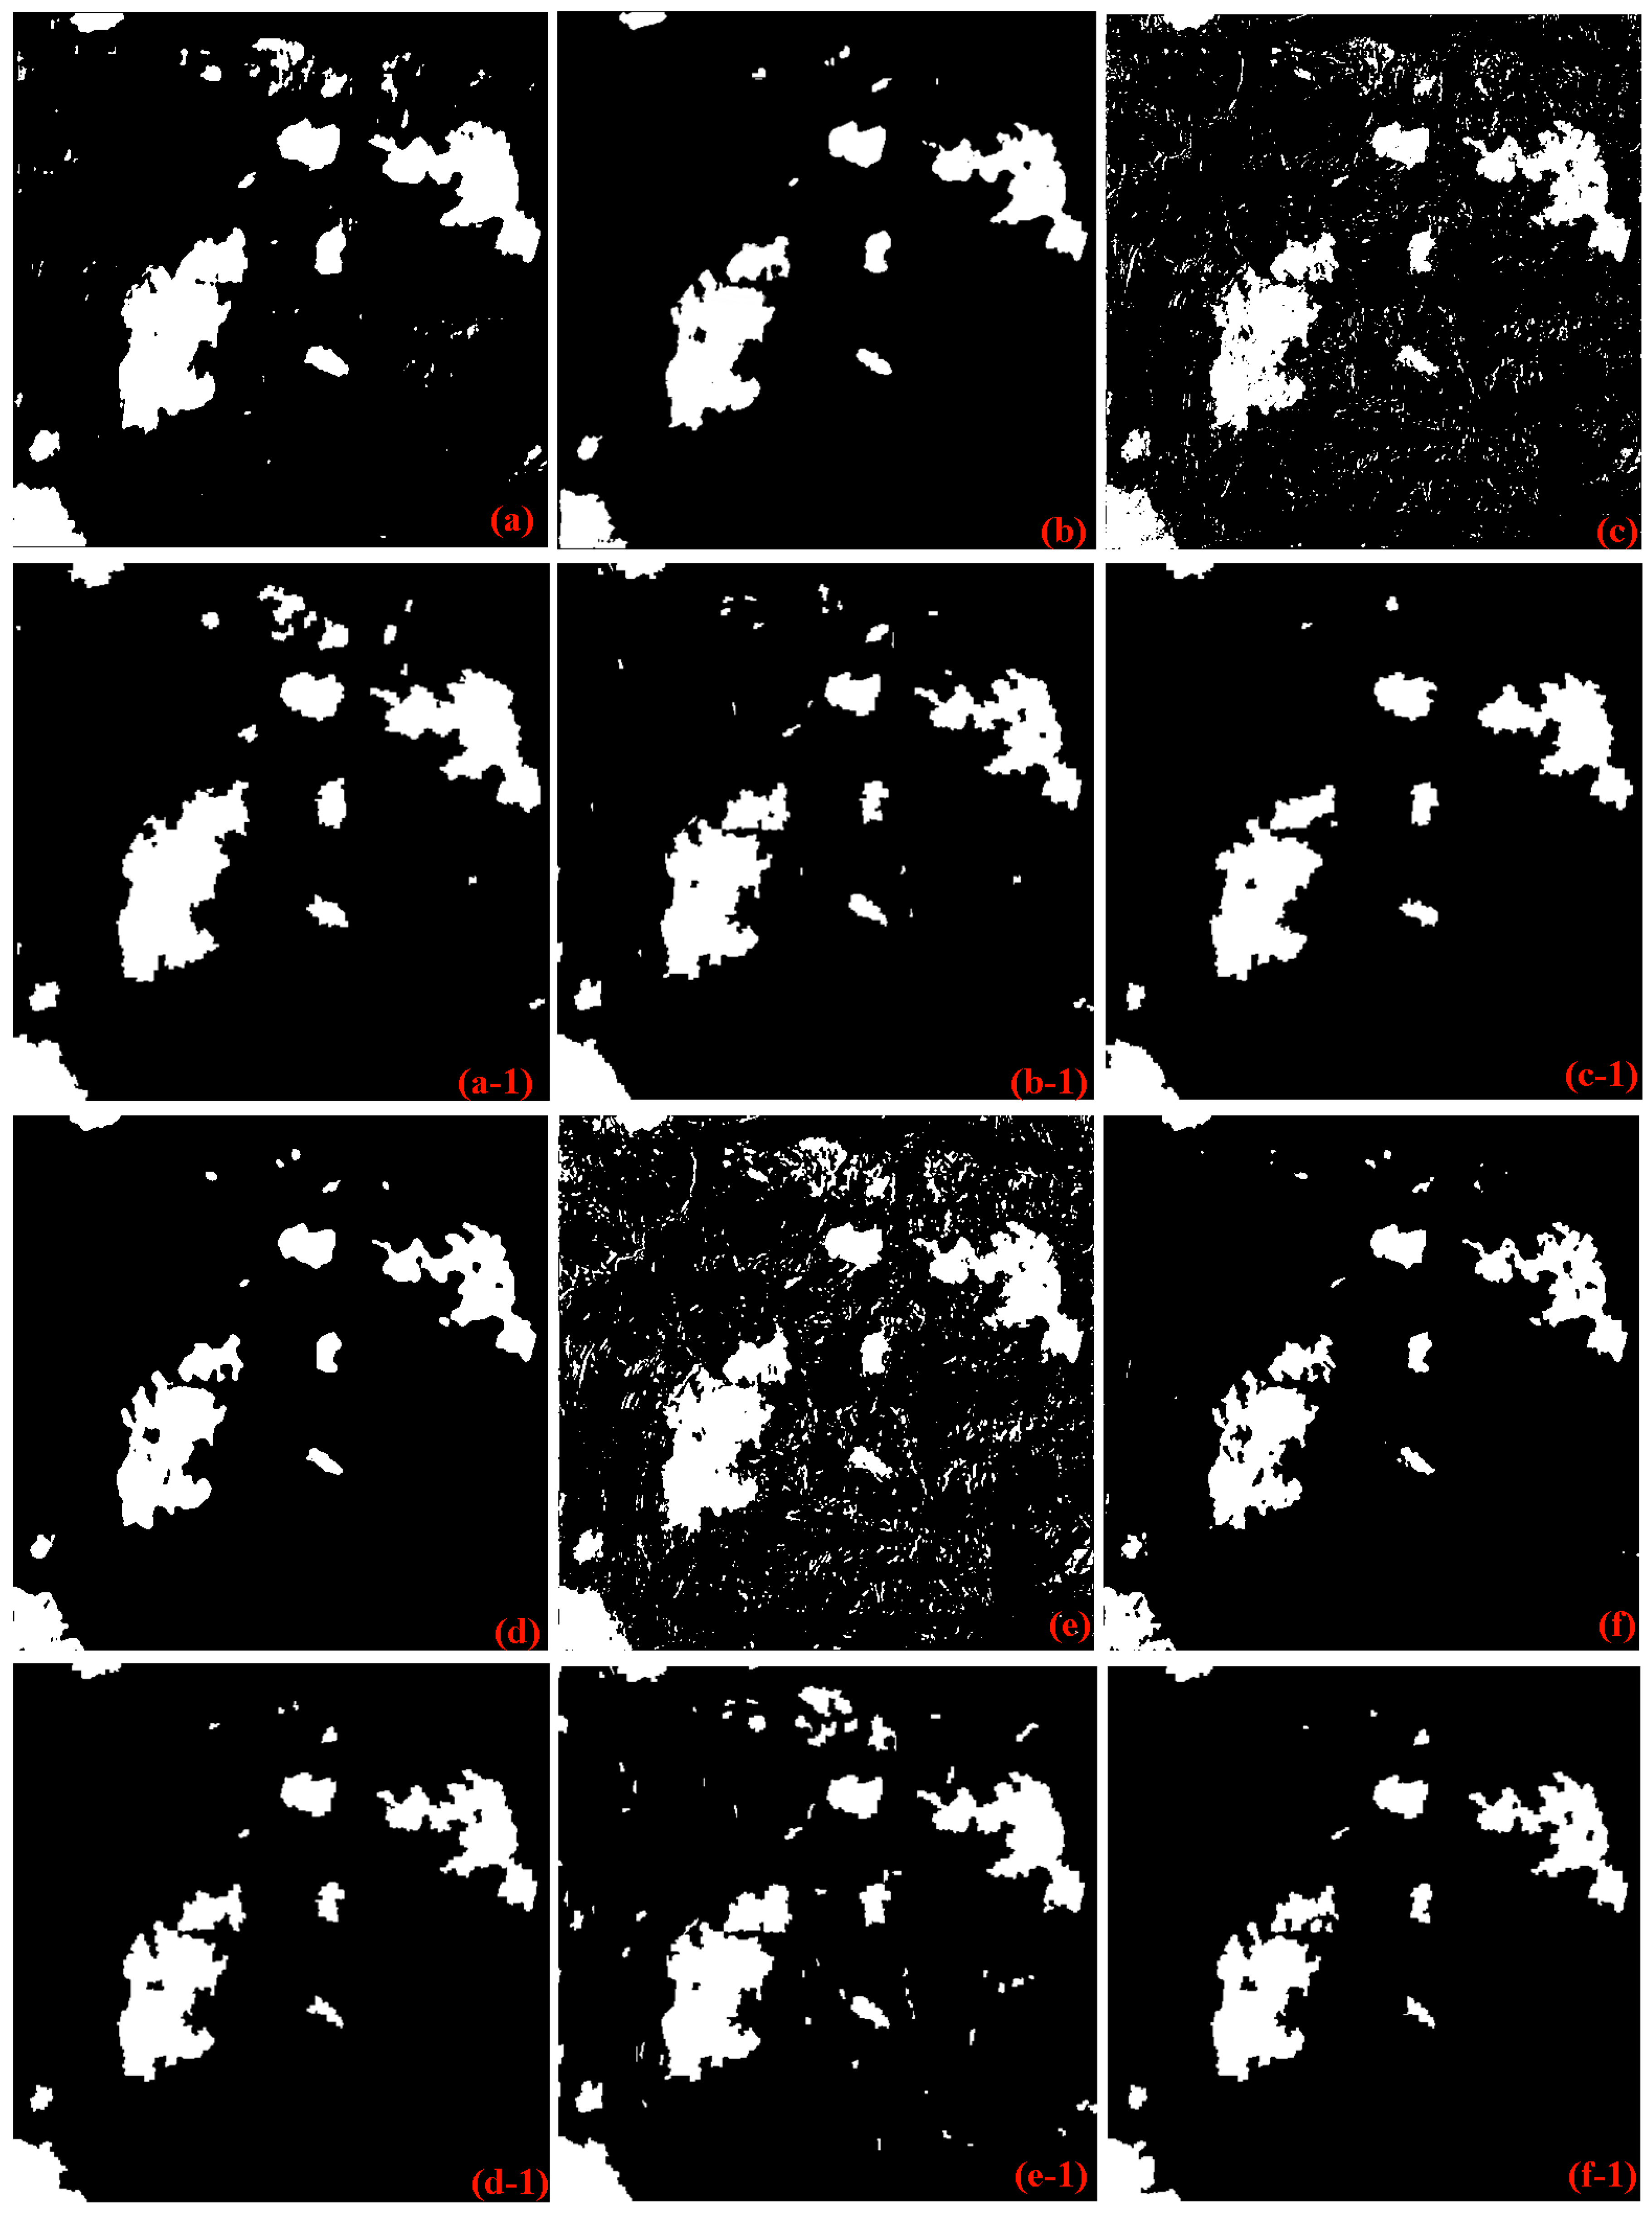
In addition to the above-mentioned quantitative accuracy comparison, visual comparisons are presented as follows. The results of the preprocessing methods and the proposed OBEM for the first data set are shown in Figure 7. The raw change detection result and its corresponding post-processing result of each approach are assigned as “(*)” and “(*-1)”; for example, “(a)” is the raw change detection result of GWDM_EM and “(a-1)” is the refined result obtained by the proposed OBEM approach. From the compared observation, the salt-and-pepper effect noise is clearly observed for the raw change detection results, such as those of GWDM_EM, GWDM_FCM, and CVA_EM (Figure 7a–c). Comparing the post-processing result of the proposed OBEM in Figure 7a-1,b-1,c-1 shows that noise is removed effectively by the proposed OBEM, thereby resulting in clear change detection maps. At the same time, the proposed OBEM performs better than the other methods in preserving spatial details of the area being considered. The improvements are attributed to that the spatial feature of the detecting target (landslide area) is inherited from the post-event image through multi-scale segmentation, and the pixels within a segment are deemed as one material in the image domain. The second data set is also taken as an example for visual comparison, as shown in Figure 8. The figure shows that the proposed OBEM approach removes noise effectively for the second data set.
In the third experiment, the effectiveness of the proposed post-processing OBEM approach was evaluated by comparing the different pre-processing change detection methods on the SPOT-5 satellite images. The comparison results are given in Table 6. From the comparisons, it can be seen that the proposed OBEM obtained superior accuracies in terms of FA and TE, but recorded insufficient MA. However, the proposed OBEM approach can achieve a balance between the three measurements (FA, MA, and OE) and a relatively satisfactory change detection map with less noise than the compared approaches, as shown in Figure 9.
The fourth experiment was designed to test the adaptability of the proposed OBEM approach when using remote sensing images with median-low spatial resolution. The Mexico data sets with a pixel size of 30 m were adopted in this experiment. The comparison results are presented in Table 7 and Figure 10. From the visual comparisons in Figure 10, the noise of the raw change detection map can mostly be removed by using the proposed OBEM post-processing approach. From Table 7, it can be observed that the proposed approach can improve most raw change detection results of the pre-processing methods, such as GWDM_FCM and MRF_EM. However, compared with the first and second experiment, the improvement of the fourth experiment is inconspicuous. Therefore, it can be concluded that the proposed post-processing OBEM approach is more suitable for refining the raw change detection results of VHR remote sensing images than that of median-low remote sensing images.
Overall, the comparisons shown in Table 4, Table 5, Table 6 and Table 7 and Figure 7, Figure 8, Figure 9 and Figure 10 are very promising, as the proposed OBEM approach significantly outperforms the traditional preprocessing methods. Even when the post-processing accuracy relies on the raw change detection result and regardless of the level of the raw change detection accuracy, the proposed OBEM improves the detection accuracy on the basis of the raw detection accuracy of each preprocessing method. This investigation verifies that enhancing the raw change detection performance in practical applications is helpful, and the proposed OBEM is an effective approach to refine raw change detection results and thus achieve an improved change detection performance.
4. Discussion
Compared with the six existing commonly used methods, the proposed OBEM approach can achieve the best accuracies and performance in terms of the FA, MA, and TE. The results Table 4, Table 5, Table 6 and Table 7 confirm that the proposed OBEM can improve the raw detection accuracy of each of the preprocessing methods.
To facilitate the widespread practical application of the proposed OBEM approach, this section discusses the influence of the parameters of the FNEA multi-segmentation algorithm on the change detection accuracies of the proposed OBEM approach. As discussed in the previous section, the shape and compactness of the adopted FNEA multi-scale algorithm are fixed at relatively high values of 0.8 and 0.9, respectively. Therefore, the refining accuracies of the proposed OBEM approach only rely on the scale parameter of segmentation. The relationship between the segmentation scale of FNEA and the detection accuracies of the proposed OBEM is investigated in this section to promote the practical application of the proposed OBEM approach.
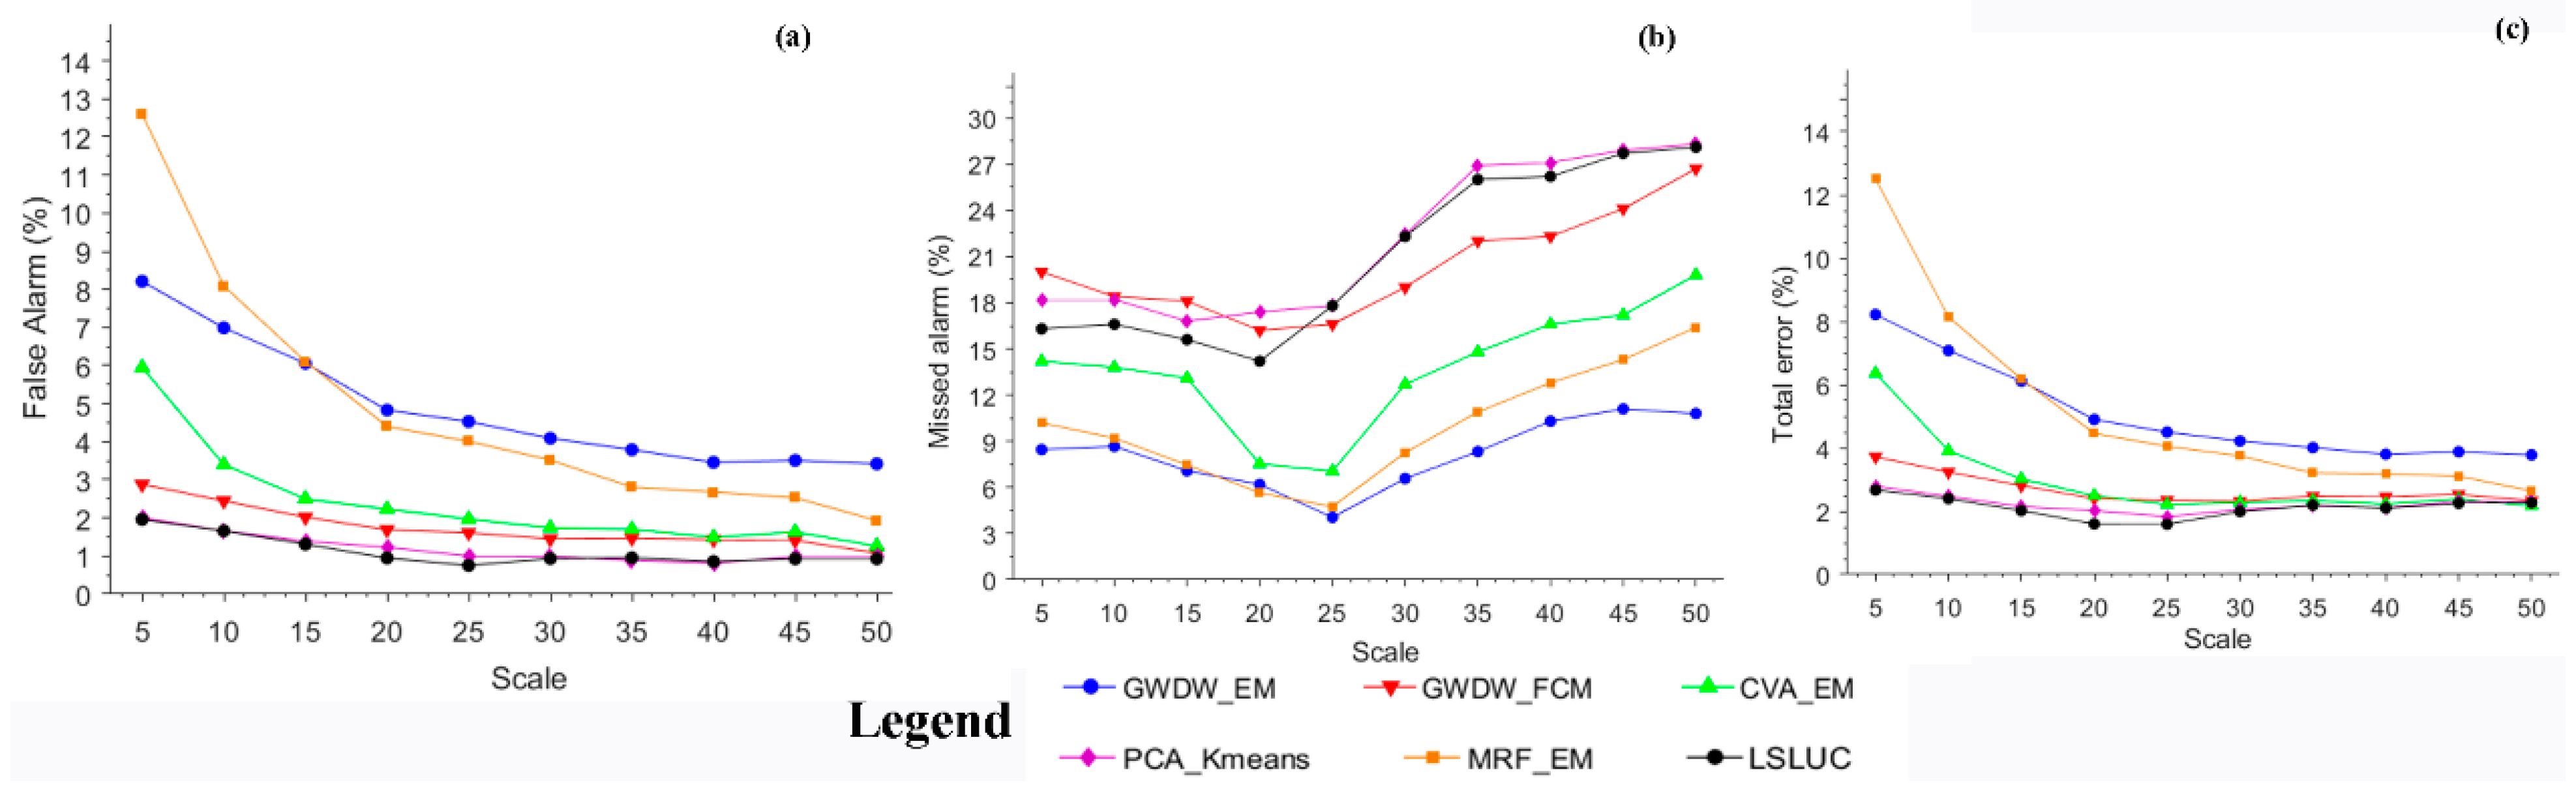
Figure 11 shows the influence of the segmentation scale on the FA, MA, and TE of the proposed OBEM method for the first data set. From Figure 11, three observations can be made on the general performance of the proposed OBEM approach. (1) As shown in Figure 11a, the FA gradually moves to a horizontal line as the scale increases from 5 to 50; (2) Figure 11b indicates that, when the scale ranges from 5 to 50 for the refining result based on the corresponding raw change detection map, the accuracy of MA decreases first, and then increases. When the scale is approximately 20, the optimized MA is obtained for the first data sets. This result is attributed to that when the segmental scale is extremely small, noise in a raw change detection map cannot be removed sufficiently. With the increase in the scale, large amounts of salt-and-pepper noises can be removed correctly from the raw change detection map. However, if the scale is extremely large, then a large number of details of the change areas will be oversmoothed, and a large number of changed pixels will be missed or incorrectly removed in the refining process. Therefore, selecting a suitable segmentation scale is the key to obtaining an improved LCCD result for the proposed OBEM approach; (3) Figure 11c shows that TE gradually moves to a horizontal level with the increase in the parameter scale.
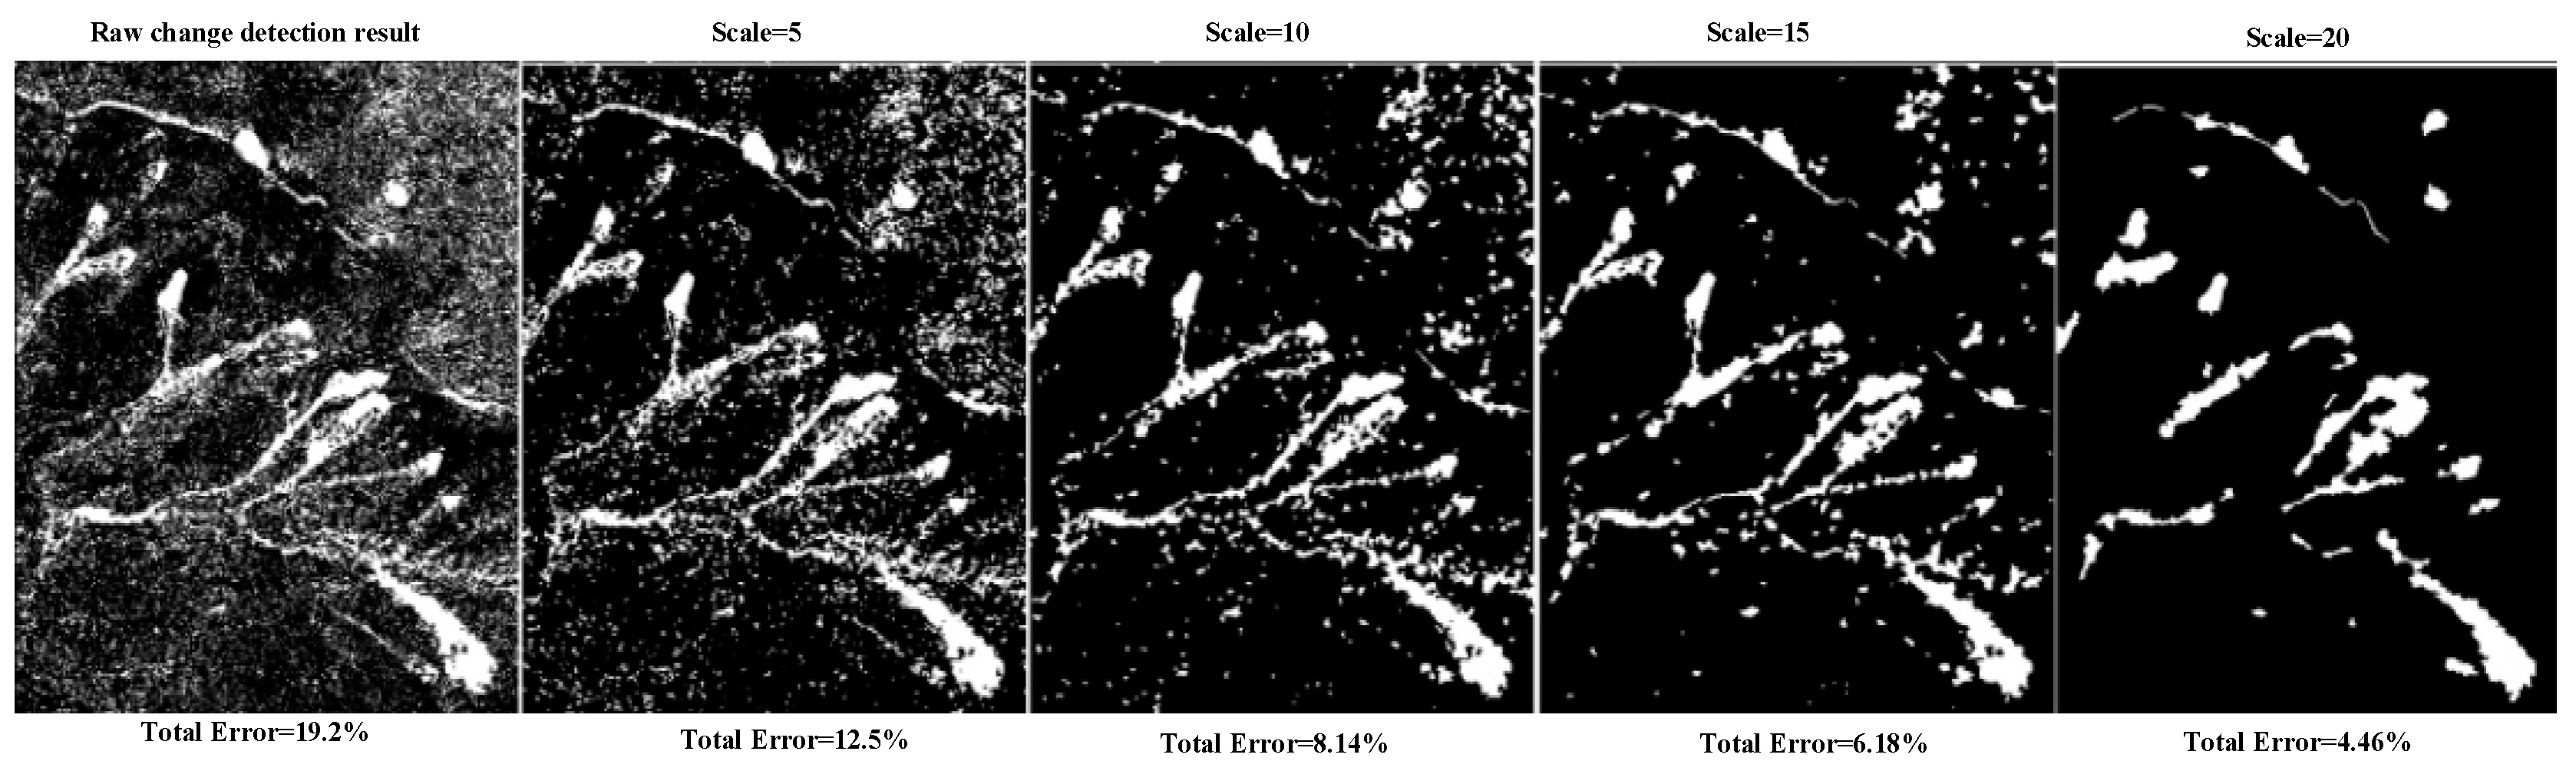
The relationship between FA, MA, and TE and the segmentation scale of the proposed OBEM is also investigated with the second data set, and the results are shown in Figure 12. The conclusion here is similar to the conclusion obtained for the first data set. To demonstrate the conclusion here intuitively, a visual investigation on the influence of scale parameter on the refining performance of the proposed OBEM approach is also conducted, and the results are shown in Figure 13. The figure shows that noise is increasingly removed with the increase in the scale parameter compared with the raw change detection map. In addition, the TE decreases from 19.2% to 4.46% with the increase in the scale parameter from 0 to 20. This conclusion supports previous quantitative investigations.
5. Conclusions
Most of the current change detection methods based on VHR remote sensing image focus on preprocessing techniques, such as texture feature extraction and difference measurement [33], contextual feature extraction [40], and MRF-based methods [35,36] for LCCD. In general, the basic principle of preprocessing change detection techniques is to utilize spatial information to complement the insufficient spectra for VHR remote sensing images, and thus improve the LCCD accuracy and performance. These methods have achieved great success in recent years, and are gradually becoming the standard methods for LCCD of VHR remote sensing images. Under this background, we propose OBEM for post-processing LCCD. Comparatively, this method has not received as much attention as preprocessing methods. The proposed OBEM aims at refining the raw change detection result, and obtains improved change detection accuracy.
Four experiments are conducted on two pairs of VHR aerial images, one pair of SPOT-5 satellite images and one pair of Landsat TM remote sensing images with medial-low spatial resolution. Compared with widely used methods, such as GWDM_EM and GWDM_FCM [33], CVA_EM [62], LSELUC [40], MRF_EM [14], and PCA_Kmeans [39], the proposed OBEM can more effectively refine the raw change detection results of the preprocessing change detection methods and obtain higher detection accuracies. In addition, the proposed OBEM approach can investigate the relationship between multi-scale segmentation parameter and refining change detection accuracy. FA and TE gradually move to a stable trend with the increase in the segmentation scale, and this completion is helpful for the practical application of the proposed OBEM approach.
The contribution of the proposed OBEM approach is three-fold: (1) To the best of our knowledge, this study is the first to propose the P_LCCD method for VHR bi-temporal remote sensing images; (2) The proposed OBEM clearly demonstrates that raw change detection results can be enhanced in an object manner, and the experimental results prove that it is an effective and succinct way to refine raw change detection result aiming at improved change detection accuracies; (3) Investigating the relationship between the segmentation parameters and refined change detection accuracies is important to promote or inspire the design of related methods.
For future studies, additional remote sensing images with various land cover scenes, such as forest deformation, water level change of lakes, and building change detection in urban areas, will be collected and applied to verify the adaptability and robustness of the proposed OBEM. Furthermore, additional P_LCCD methods will be developed to improve the accuracy of raw change detection.
Acknowledgment
The authors thank the editor-in-chief, associate editor, and reviewers for their insightful comments and suggestions. This work was supported by the National Science Foundation China (61701396 and D010701), the Science Foundation of Hunan Province (Grant No. 2016JJ6100), the Natural Science Foundation of Shaan Xi Province (2017JQ4006), and the project from the China Postdoctoral Science Foundation (2015M572658XB).
Author Contributions
ZhiYong Lv was primarily responsible for the original idea and experimental design. TongFei Liu did the experiments and provided several helpful suggestions. YiLiang Wan provided contributions to improve the quality of the paper in the writing procedure. Jón Atli Benediktsson provided ideas to improve the quality of the paper. XiaoKang Zhang provided his code of the method LSELUC for experimental comparisons.
Conflicts of Interest
The authors declare no conflict of interest.
References
- Lu, D.; Mausel, P.; Brondizio, E.; Moran, E. Change detection techniques. Int. J. Remote Sens. 2004, 25, 2365–2401. [Google Scholar] [CrossRef]
- Tewkesbury, A.P.; Comber, A.J.; Tate, N.J.; Lamb, A.; Fisher, P.F. A critical synthesis of remotely sensed optical image change detection techniques. Remote Sens. Environ. 2015, 160, 1–14. [Google Scholar] [CrossRef]
- Falco, N.; Dalla Mura, M.; Bovolo, F.; Benediktsson, J.A.; Bruzzone, L. Change detection in VHR images based on morphological attribute profiles. IEEE Geosci. Remote Sens. Lett. 2013, 10, 636–640. [Google Scholar] [CrossRef]
- Lu, D.; Li, G.; Moran, E. Current situation and needs of change detection techniques. Int. J. Image Data Fusion 2014, 5, 13–38. [Google Scholar] [CrossRef]
- Desclée, B.; Bogaert, P.; Defourny, P. Forest change detection by statistical object-based method. Remote Sens. Environ. 2006, 102, 1–11. [Google Scholar] [CrossRef]
- Jin, S.; Yang, L.; Danielson, P.; Homer, C.; Fry, J.; Xian, G. A comprehensive change detection method for updating the National Land Cover Database to circa 2011. Remote Sens. Environ. 2013, 132, 159–175. [Google Scholar] [CrossRef]
- Zhu, Z.; Woodcock, C.E. Continuous change detection and classification of land cover using all available Landsat data. Remote Sens. Environ. 2014, 144, 152–171. [Google Scholar] [CrossRef]
- Mertes, C.M.; Schneider, A.; Sulla-Menashe, D.; Tatem, A.; Tan, B. Detecting change in urban areas at continental scales with MODIS data. Remote Sens. Environ. 2015, 158, 331–347. [Google Scholar] [CrossRef]
- Xiao, P.; Wang, X.; Feng, X.; Zhang, X.; Yang, Y. Detecting China’s urban expansion over the past three decades using nighttime light data. IEEE J. Sel. Top. Appl. Earth Obs. Remote Sens. 2014, 7, 4095–4106. [Google Scholar] [CrossRef]
- Berberoglu, S.; Akin, A. Assessing different remote sensing techniques to detect land use/cover changes in the Eastern Mediterranean. Int. J. Appl. Earth Obs. Geoinf. 2009, 11, 46–53. [Google Scholar] [CrossRef]
- Fichera, C.R.; Modica, G.; Pollino, M. Land cover classification and change-detection analysis using multi-temporal remote sensed imagery and landscape metrics. Eur. J. Remote Sens. 2012, 45, 1–18. [Google Scholar] [CrossRef]
- He, Y.; Ai, B.; Yao, Y.; Zhong, F. Deriving urban dynamic evolution rules from self-adaptive cellular automata with multi-temporal remote sensing images. Int. J. Appl. Earth Obs. Geoinf. 2015, 38, 164–174. [Google Scholar] [CrossRef]
- Kibret, K.S.; Marohn, C.; Cadisch, G. Assessment of land use and land cover change in South Central Ethiopia during four decades based on integrated analysis of multi-temporal images and geospatial vector data. Remote Sens. Appl. Soc. Environ. 2016, 3, 1–19. [Google Scholar] [CrossRef]
- Bruzzone, L.; Prieto, D.F. Automatic analysis of the difference image for unsupervised change detection. IEEE Trans. Geosci. Remote Sens. 2000, 38, 1171–1182. [Google Scholar] [CrossRef]
- Singh, A. Review article digital change detection techniques using remotely-sensed data. Int. J. Remote Sens. 1989, 10, 989–1003. [Google Scholar] [CrossRef]
- Radke, R.J.; Andra, S.; Al-Kofahi, O.; Roysam, B. Image change detection algorithms: A systematic survey. IEEE Trans. Image Process. 2005, 14, 294–307. [Google Scholar] [CrossRef] [PubMed]
- Chen, J.; Gong, P.; He, C.; Pu, R.; Shi, P. Land-use/land-cover change detection using improved change-vector analysis. Photogramm. Eng. Remote Sens. 2003, 69, 369–379. [Google Scholar] [CrossRef]
- Bovolo, F.; Bruzzone, L. A theoretical framework for unsupervised change detection based on change vector analysis in the polar domain. IEEE Trans. Geosci. Remote Sens. 2007, 45, 218–236. [Google Scholar] [CrossRef]
- He, C.; Wei, A.; Shi, P.; Zhang, Q.; Zhao, Y. Detecting land-use/land-cover change in rural–urban fringe areas using extended change-vector analysis. Int. J. Appl. Earth Obs. Geoinf. 2011, 13, 572–585. [Google Scholar] [CrossRef]
- Liu, S.; Du, Q.; Tong, X.; Samat, A.; Bruzzone, L.; Bovolo, F. Multiscale morphological compressed change vector analysis for unsupervised multiple change detection. IEEE J. Sel. Top. Appl. Earth Obs. Remote Sens. 2017, 10, 4124–4137. [Google Scholar] [CrossRef]
- Chen, J.; Lu, M.; Chen, X.; Chen, J.; Chen, L. A spectral gradient difference based approach for land cover change detection. ISPRS J. Photogramm. Remote Sens. 2013, 85, 1–12. [Google Scholar] [CrossRef]
- Hao, M.; Shi, W.; Zhang, H.; Li, C. Unsupervised change detection with expectation-maximization-based level set. IEEE Geosci. Remote Sens. Lett. 2014, 11, 210–214. [Google Scholar] [CrossRef]
- Redner, R.A.; Walker, H.F. Mixture densities, maximum likelihood and the EM algorithm. SIAM Rev. 1984, 26, 195–239. [Google Scholar] [CrossRef]
- Gong, M.; Zhou, Z.; Ma, J. Change detection in synthetic aperture radar images based on image fusion and fuzzy clustering. IEEE Trans. Image Process. 2012, 21, 2141–2151. [Google Scholar] [CrossRef] [PubMed]
- Ghosh, A.; Mishra, N.S.; Ghosh, S. Fuzzy clustering algorithms for unsupervised change detection in remote sensing images. Inf. Sci. 2011, 181, 699–715. [Google Scholar] [CrossRef]
- Shao, P.; Shi, W.; He, P.; Hao, M.; Zhang, X. Novel approach to unsupervised change detection based on a robust semi-supervised FCM clustering algorithm. Remote Sens. 2016, 8, 264. [Google Scholar] [CrossRef]
- Otsu, N. A threshold selection method from gray-level histograms. IEEE Trans. Syst. Man Cybern. 1979, 9, 62–66. [Google Scholar] [CrossRef]
- Rosin, P.L.; Ioannidis, E. Evaluation of global image thresholding for change detection. Pattern Recognit. Lett. 2003, 24, 2345–2356. [Google Scholar] [CrossRef]
- Lv, Z.; Shi, W.; Zhou, X.; Benediktsson, J.A. Semi-automatic system for land cover change detection using bi-temporal remote sensing images. Remote Sens. 2017, 9, 1112. [Google Scholar] [CrossRef]
- Luo, F.; Huang, H.; Duan, Y.; Liu, J.; Liao, Y. Local Geometric Structure Feature for Dimensionality Reduction of Hyperspectral Imagery. Remote Sens. 2017, 9, 790. [Google Scholar] [CrossRef]
- Yang, F.; Lishman, R. Land cover change detection using Gabor filter texture. In Proceedings of the 3rd International Workshop on Texture Analysis and Synthesis, Nice, France, 17 October 2003. [Google Scholar]
- Li, H.-C.; Celik, T.; Longbotham, N.; Emery, W.J. Gabor feature based unsupervised change detection of multitemporal SAR images based on two-level clustering. IEEE Geosci. Remote Sens. Lett. 2015, 12, 2458–2462. [Google Scholar]
- Li, Z.; Shi, W.; Zhang, H.; Hao, M. Change detection based on Gabor wavelet features for very high resolution remote sensing images. IEEE Geosci. Remote Sens. Lett. 2017, 14, 783–787. [Google Scholar] [CrossRef]
- Subudhi, B.N.; Bovolo, F.; Ghosh, A.; Bruzzone, L. Spatio-contextual fuzzy clustering with Markov random field model for change detection in remotely sensed images. Opt. Laser Technol. 2014, 57, 284–292. [Google Scholar] [CrossRef]
- Gu, W.; Lv, Z.; Hao, M. Change detection method for remote sensing images based on an improved Markov random field. Multimed. Tools Appl. 2017, 76, 17719–17734. [Google Scholar] [CrossRef]
- Ghosh, A.; Subudhi, B.N.; Bruzzone, L. Integration of Gibbs Markov random field and Hopfield-type neural networks for unsupervised change detection in remotely sensed multitemporal images. IEEE Trans. Image Process. 2013, 22, 3087–3096. [Google Scholar] [CrossRef] [PubMed]
- Benedek, C.; Shadaydeh, M.; Kato, Z.; Szirányi, T.; Zerubia, J. Multilayer Markov Random Field models for change detection in optical remote sensing images. ISPRS J. Photogramm. Remote Sens. 2015, 107, 22–37. [Google Scholar] [CrossRef] [Green Version]
- Smits, P.C.; Annoni, A. Toward specification-driven change detection. IEEE Trans. Geosci. Remote Sens. 2000, 38, 1484–1488. [Google Scholar] [CrossRef]
- Celik, T. Unsupervised change detection in satellite images using principal component analysis and k-means clustering. IEEE Geosci. Remote Sens. Lett. 2009, 6, 772–776. [Google Scholar] [CrossRef]
- Zhang, X.; Shi, W.; Liang, P.; Hao, M. Level set evolution with local uncertainty constraints for unsupervised change detection. Remote Sens. Lett. 2017, 8, 811–820. [Google Scholar] [CrossRef]
- Zhang, P.; Lv, Z.; Shi, W. Local spectrum-trend similarity approach for detecting land-cover change by using SPOT-5 satellite images. IEEE Geosci. Remote Sens. Lett. 2014, 11, 738–742. [Google Scholar] [CrossRef]
- Turner, B.L.; Lambin, E.F.; Reenberg, A. The emergence of land change science for global environmental change and sustainability. Proc. Natl. Acad. Sci. USA 2007, 104, 20666–20671. [Google Scholar] [CrossRef] [PubMed]
- Li, X.; Zhou, W.; Ouyang, Z. Forty years of urban expansion in Beijing: What is the relative importance of physical, socioeconomic, and neighborhood factors? Appl. Geogr. 2013, 38, 1–10. [Google Scholar] [CrossRef]
- Thapa, R.B.; Murayama, Y. Drivers of urban growth in the Kathmandu valley, Nepal: Examining the efficacy of the analytic hierarchy process. Appl. Geogr. 2010, 30, 70–83. [Google Scholar] [CrossRef]
- Dewan, A.M.; Yamaguchi, Y. Land use and land cover change in Greater Dhaka, Bangladesh: Using remote sensing to promote sustainable urbanization. Appl. Geogr. 2009, 29, 390–401. [Google Scholar] [CrossRef]
- Baatz, M. Multiresolution segmentation: An optimization approach for high quality multi-scale image segmentation. Angew. Geogr. Informationsverarbeitung 2000, 12–23. [Google Scholar]
- Blaschke, T. Object based image analysis for remote sensing. ISPRS J. Photogramm. Remote Sens. 2010, 65, 2–16. [Google Scholar] [CrossRef]
- Blaschke, T.; Hay, G.J.; Kelly, M.; Lang, S.; Hofmann, P.; Addink, E.; Feitosa, R.Q.; van der Meer, F.; van der Werff, H.; van Coillie, F. Geographic object-based image analysis–towards a new paradigm. ISPRS J. Photogramm. Remote Sens. 2014, 87, 180–191. [Google Scholar] [CrossRef] [PubMed]
- Lv, Z.; Zhang, P.; Atli Benediktsson, J. Automatic object-oriented, spectral-spatial feature extraction driven by Tobler’s First Law of Geography for very high resolution aerial imagery classification. Remote Sens. 2017, 9, 285. [Google Scholar] [CrossRef]
- Li, H.; Gu, H.; Han, Y.; Yang, J. An efficient multi-scale segmentation for high-resolution remote sensing imagery based on statistical region merging and minimum heterogeneity rule. In Proceedings of the 2008 International Workshop on Earth Observation and Remote Sensing Applications, Beijing, China, 30 June–2 July 2008; pp. 1–6. [Google Scholar]
- Ahmadvand, A.; Daliri, M. Brain MR image segmentation methods and applications. OMICS J. Radiol. 2014, 3, e130. [Google Scholar] [CrossRef]
- Jung, C.R. Unsupervised multiscale segmentation of color images. Pattern Recognit. Lett. 2007, 28, 523–533. [Google Scholar] [CrossRef]
- Benz, U.C.; Hofmann, P.; Willhauck, G.; Lingenfelder, I.; Heynen, M. Multi-resolution, object-oriented fuzzy analysis of remote sensing data for GIS-ready information. ISPRS J. Photogramm. Remote Sens. 2004, 58, 239–258. [Google Scholar] [CrossRef]
- Baatz, M.; Schäpe, A. Object-oriented and multi-scale image analysis in semantic networks. In Proceedings of the 2nd International Symposium on Operationalization of Remote Sensing, Enschede, The Netherlands, 16–20 August 1999; pp. 7–13. [Google Scholar]
- Dempster, A.P.; Laird, N.M.; Rubin, D.B. Maximum likelihood from incomplete data via the EM algorithm. J. R. Stat. Soc. Ser. B 1977, 39, 1–38. [Google Scholar]
- Bazi, Y.; Melgani, F.; Bruzzone, L.; Vernazza, G. A genetic expectation-maximization method for unsupervised change detection in multitemporal SAR imagery. Int. J. Remote Sens. 2009, 30, 6591–6610. [Google Scholar] [CrossRef]
- Ding, K.; Huo, C.; Xu, Y.; Zhong, Z.; Pan, C. Sparse hierarchical clustering for VHR image change detection. IEEE Geosci. Remote Sens. Lett. 2015, 12, 577–581. [Google Scholar] [CrossRef]
- Melgani, F.; Bruzzone, L. Classification of hyperspectral remote sensing images with support vector machines. IEEE Trans. Geosci. Remote Sens. 2004, 42, 1778–1790. [Google Scholar] [CrossRef]
- Lv, Z.; Zhang, X.; Benediktsson, J.A. Developing a general post-classification framework for land-cover mapping improvement using high-spatial-resolution remote sensing imagery. Remote Sens. Lett. 2017, 8, 607–616. [Google Scholar] [CrossRef]
- Carson, C.; Belongie, S.; Greenspan, H.; Malik, J. Blobworld: Image segmentation using expectation-maximization and its application to image querying. IEEE Trans. Pattern Anal. Mach. Intell. 2002, 24, 1026–1038. [Google Scholar] [CrossRef]
- Li, J.; Allinson, N. Building recognition using local oriented features. IEEE Trans. Ind. Inform. 2013, 9, 1697–1704. [Google Scholar] [CrossRef]
- Singh, S.; Talwar, R. A comparative study on change vector analysis based change detection techniques. Sadhana 2014, 39, 1311–1331. [Google Scholar] [CrossRef]
Figure 1.
General scheme of the proposed object-based expectation maximization (OBEM) post-processing change detection approach.
Figure 1.
General scheme of the proposed object-based expectation maximization (OBEM) post-processing change detection approach.

Figure 2.
Schematic example of using OBEM to refine a raw binary change detection map: (a) Raw Binary Change Detection Map (R_BCDM); (b) Overlay multi-scale segmentation over R_BCDM; (c) OBEM postprocessing to generate Final Binary Change Detection Map (F_BCDM).
Figure 2.
Schematic example of using OBEM to refine a raw binary change detection map: (a) Raw Binary Change Detection Map (R_BCDM); (b) Overlay multi-scale segmentation over R_BCDM; (c) OBEM postprocessing to generate Final Binary Change Detection Map (F_BCDM).

Figure 3.
First bi-temporal VHR images: (a) pre-event image; (b) post-event image; and (c) ground reference map.
Figure 3.
First bi-temporal VHR images: (a) pre-event image; (b) post-event image; and (c) ground reference map.

Figure 4.
Second bi-temporal VHR images: (a) pre-event image; (b) post-event image; and (c) ground reference map.
Figure 4.
Second bi-temporal VHR images: (a) pre-event image; (b) post-event image; and (c) ground reference map.

Figure 5.
Third bi-temporal VHR images: (a) pre-event image; (b) post-event image; and (c) ground reference map.
Figure 5.
Third bi-temporal VHR images: (a) pre-event image; (b) post-event image; and (c) ground reference map.

Figure 6.
Fourth data set: Mexico data, band 4 of the Landsat TM image captured in (a) April 2000; (b) May 2002; and (c) reference map for the changed area.
Figure 6.
Fourth data set: Mexico data, band 4 of the Landsat TM image captured in (a) April 2000; (b) May 2002; and (c) reference map for the changed area.

Figure 7.
LCCD maps obtained by the preprocessing methods and the proposed OBEM approach for the first data set: (a) GWDM_EM; (b) GWDM_FCM; (c) CVA_EM; (a-1) GWDM_EM+OBEM; (b-1) GWDM_FCM+OBEM; (c-1) CVA_EM+OBEM; (d) MRF_EM; (e) LSELUC; (f) PCA_Kmeans; (d-1) MRF_EM+OBEM; (e-1) LSELUC+OBEM; and (f-1) PCA_Kmeans+OBEM.

Figure 8.
LCCD maps obtained by the preprocessing methods and the proposed OBEM algorithm for the second data set: (a) GWDM_EM; (b) GWDM_FCM; (c) CVA_EM; (a-1) GWDM_EM+OBEM; (b-1) GWDM_FCM+OBEM; (c-1) CVA_EM+OBEM; (d) MRF_EM; (e) LSELUC; (f) PCA_Kmeans; (d-1) MRF_EM+OBEM; (e-1) LSELUC+OBEM; and (f-1) PCA_Kmeans+OBEM.

Figure 9.
LCCD maps obtained by the preprocessing methods and the proposed OBEM algorithm for the third data set (SPOT-5 images): (a) GWDM_EM; (b) GWDM_FCM; (c) CVA_EM; (a-1) GWDM_EM+OBEM; (b-1) GWDM_FCM+OBEM; (c-1) CVA_EM+OBEM; (d) MRF_EM; (e) LSELUC; (f) PCA_Kmeans; (d-1) MRF_EM+OBEM; (e-1) LSELUC+OBEM; and (f-1) PCA_Kmeans+OBEM.

Figure 10.
LCCD maps obtained by the preprocessing methods and the proposed OBEM algorithm for the second data set (Landsat TM images): (a) GWDM_EM; (b) GWDM_FCM; (c) CVA_EM; (a-1) GWDM_EM+OBEM; (b-1) GWDM_FCM+OBEM; (c-1) CVA_EM+OBEM; (d) MRF_EM; (e) LSELUC; (f) PCA_Kmeans; (d-1) MRF_EM+OBEM; (e-1) LSELUC+OBEM; and (f-1) PCA_Kmeans+OBEM.

Figure 11.
Analysis of the segmentation parameters’ sensitivity for the proposed OBEM post-processing LCCD method with the first data set: (a–c) present the relationship between FA, MA, and TE and the parameter scale of FNEA segmentation algorithm, respectively.
Figure 11.
Analysis of the segmentation parameters’ sensitivity for the proposed OBEM post-processing LCCD method with the first data set: (a–c) present the relationship between FA, MA, and TE and the parameter scale of FNEA segmentation algorithm, respectively.

Figure 12.
Analysis of the segmentation parameters’ sensitivity for the proposed OBEM post-processing LCCD method with the second data set: (a–c) present the relationship between FA, MA, and TE and the parameter scale of FNEA segmentation algorithm, respectively.
Figure 12.
Analysis of the segmentation parameters’ sensitivity for the proposed OBEM post-processing LCCD method with the second data set: (a–c) present the relationship between FA, MA, and TE and the parameter scale of FNEA segmentation algorithm, respectively.

Figure 13.
Different change detection results using the proposed OBEM with different scales but fixed shape and compactness at 0.8 and 0.9, respectively.
Figure 13.
Different change detection results using the proposed OBEM with different scales but fixed shape and compactness at 0.8 and 0.9, respectively.


Table 1.
Parameter settings of different land cover change detection (LCCD) methods for the first and second data sets.
Table 1.
Parameter settings of different land cover change detection (LCCD) methods for the first and second data sets.
| Method | Parameter Setting |
|---|---|
| GWDM_EM | Ul = 0.05, Uh = 0.4, S = 4, and K = 6 |
| GWDM_FCM | Ul = 0.05, Uh = 0.4, S = 4, and K = 6; c = 2, m = 2, ε = 1×10⁻⁵ |
| CVA_EM | --- |
| LSELUC | S = 7 |
| MRF_EM | β = 0.6 |
| PCA_Kmeans | H = 5, s = 3 |
| The proposed OBEM | Scale = 15, shape = 0.8, compactness = 0.9. |
Table 2.
Parameter settings of different LCCD methods for the third and fourth data sets.
| Method | Parameter Setting |
|---|---|
| GWDM_EM | Ul = 0.05, Uh =0.4, S =4, and K = 6 |
| GWDM_FCM | Ul = 0.05, Uh = 0.4, S = 4, and K = 6; c= 2, m = 2, ε = 1×10⁻⁵ |
| CVA_EM | --- |
| LSELUC | S = 7 |
| MRF_EM | β = 0.6 |
| PCA_Kmeans | H = 7, s = 3 |
| The proposed OBEM | Scale = 10, shape = 0.8, compactness = 0.9. |
Table 3.
Details of ground reference for each data set.
| Data Set | Pixel’s Number of Ground Reference for Each Data Set | ||
|---|---|---|---|
| No. of Unchanged Pixel | No. of Change Pixel | ||
| 1 | Aerial image | 496704 | 26572 |
| 2 | Aerial image | 677434 | 35066 |
| 3 | SPOT-5 images | 196987 | 21297 |
| 4 | Landsat TM images | 236555 | 25589 |
Table 4.
Comparison between existing preprocessing methods and the OBEM post-processing approach for the first data set (aerial images with 0.5 m/pixel resolution).
Table 4.
Comparison between existing preprocessing methods and the OBEM post-processing approach for the first data set (aerial images with 0.5 m/pixel resolution).
| Method | R_BCDM’s Accuracy (%) | Proposed OBEM’s Refining Accuracy (%) | ||||
|---|---|---|---|---|---|---|
| FA | MA | TE | FA | MA | TE | |
| GWDM_EM | 8.52 | 11.40 | 8.66 | 5.89 | 6.01 | 5.89 |
| GWDM_FCM | 4.04 | 19.10 | 4.81 | 2.88 | 13.50 | 3.42 |
| CVA_EM | 11.30 | 9.17 | 11.20 | 2.51 | 4.90 | 2.63 |
| PCA_Kmeans | 2.60 | 11.20 | 3.04 | 1.88 | 8.97 | 2.24 |
| MRF_EM | 18.70 | 6.09 | 18.10 | 7.81 | 3.50 | 7.59 |
| LSELUC | 2.28 | 10.50 | 3.21 | 1.54 | 9.33 | 1.93 |
Table 5.
Comparison between existing preprocessing methods and the OBEM post-processing approach for the second data set (aerial images with 0.5 m/pixel resolution).
Table 5.
Comparison between existing preprocessing methods and the OBEM post-processing approach for the second data set (aerial images with 0.5 m/pixel resolution).
| Method | R_BCDM’s Accuracy (%) | Proposed OBEM’s Refining Accuracy (%) | ||||
|---|---|---|---|---|---|---|
| FA | MA | TE | FA | MA | TE | |
| GWDM_EM | 8.88 | 9.85 | 8.93 | 6.06 | 7.08 | 6.11 |
| GWDM_FCM | 3.01 | 22.20 | 3.95 | 2.02 | 18.1 | 2.81 |
| CVA_EM | 12.40 | 15.70 | 12.60 | 2.5 | 13.1 | 3.02 |
| PCA_Kmeans | 2.08 | 18.70 | 2.90 | 1.39 | 16.8 | 2.15 |
| MRF_EM | 19.70 | 10.40 | 19.20 | 6.11 | 7.47 | 6.18 |
| LSELUC | 2.13 | 17.20 | 2.87 | 1.31 | 15.6 | 2.02 |
Table 6.
Comparison between existing preprocessing methods and the OBEM post-processing approach for the third data set (Spot-5 image with 2.5 m/pixel resolution).
Table 6.
Comparison between existing preprocessing methods and the OBEM post-processing approach for the third data set (Spot-5 image with 2.5 m/pixel resolution).
| Method | R_BCDM’s Accuracy (%) | Proposed OBEM’s Refining Accuracy (%) | ||||
|---|---|---|---|---|---|---|
| FA | MA | TE | FA | MA | TE | |
| GWDM_EM | 14.80 | 47.10 | 17.90 | 11.90 | 49.50 | 15.50 |
| GWDM_FCM | 15.00 | 47.80 | 18.20 | 12.60 | 50.30 | 16.30 |
| CVA_EM | 14.70 | 50.10 | 18.10 | 11.20 | 53.60 | 15.30 |
| PCA_Kmeans | 14.80 | 43.10 | 17.60 | 11.80 | 48.00 | 15.40 |
| MRF_EM | 18.50 | 47.30 | 21.40 | 12.80 | 49.70 | 16.40 |
| LSELUC | 11.00 | 58.20 | 15.60 | 9.55 | 61.80 | 14.60 |
Table 7.
Comparison between existing preprocessing methods and the OBEM post-processing approach for the fourth data set (Landsat images with 30 m/pixel resolution).
Table 7.
Comparison between existing preprocessing methods and the OBEM post-processing approach for the fourth data set (Landsat images with 30 m/pixel resolution).
| Method | R_BCDM’s Accuracy (%) | Proposed OBEM’s Refining Accuracy (%) | ||||
|---|---|---|---|---|---|---|
| FA | MA | TE | FA | MA | TE | |
| GWDM_EM | 3.94 | 4.62 | 4.00 | 3.41 | 3.98 | 3.47 |
| GWDM_FCM | 1.23 | 17.10 | 2.78 | 1.23 | 13.20 | 2.41 |
| CVA_EM | 4.14 | 5.19 | 4.24 | 1.32 | 7.24 | 1.90 |
| PCA_Kmeans | 0.64 | 10.80 | 1.63 | 0.80 | 11.20 | 1.81 |
| MRF_EM | 7.30 | 2.43 | 6.82 | 2.83 | 5.53 | 3.09 |
| LSELUC | 0.39 | 13.90 | 1.71 | 0.64 | 14.30 | 1.97 |
© 2018 by the authors. Licensee MDPI, Basel, Switzerland. This article is an open access article distributed under the terms and conditions of the Creative Commons Attribution (CC BY) license (http://creativecommons.org/licenses/by/4.0/).
Share and Cite
MDPI and ACS Style
Lv, Z.; Liu, T.; Wan, Y.; Benediktsson, J.A.; Zhang, X. Post-Processing Approach for Refining Raw Land Cover Change Detection of Very High-Resolution Remote Sensing Images. Remote Sens. 2018, 10, 472. https://doi.org/10.3390/rs10030472
AMA Style
Lv Z, Liu T, Wan Y, Benediktsson JA, Zhang X. Post-Processing Approach for Refining Raw Land Cover Change Detection of Very High-Resolution Remote Sensing Images. Remote Sensing. 2018; 10(3):472. https://doi.org/10.3390/rs10030472
Chicago/Turabian StyleLv, Zhiyong, Tongfei Liu, Yiliang Wan, Jón Atli Benediktsson, and Xiaokang Zhang. 2018. "Post-Processing Approach for Refining Raw Land Cover Change Detection of Very High-Resolution Remote Sensing Images" Remote Sensing 10, no. 3: 472. https://doi.org/10.3390/rs10030472
Note that from the first issue of 2016, this journal uses article numbers instead of page numbers. See further details here.